Investor Presentation February 2013 - Indian Oil Corporation · PDF file ·...
47
Investor Presentation February 2013
Transcript of Investor Presentation February 2013 - Indian Oil Corporation · PDF file ·...
Investor Presentation February 2013
1
IOCL – An Overview
Oil Industry In India
IOCL’s Core Operations
Strategic Initiatives
Financial Performance
Ongoing Projects
Nine Months Snapshot
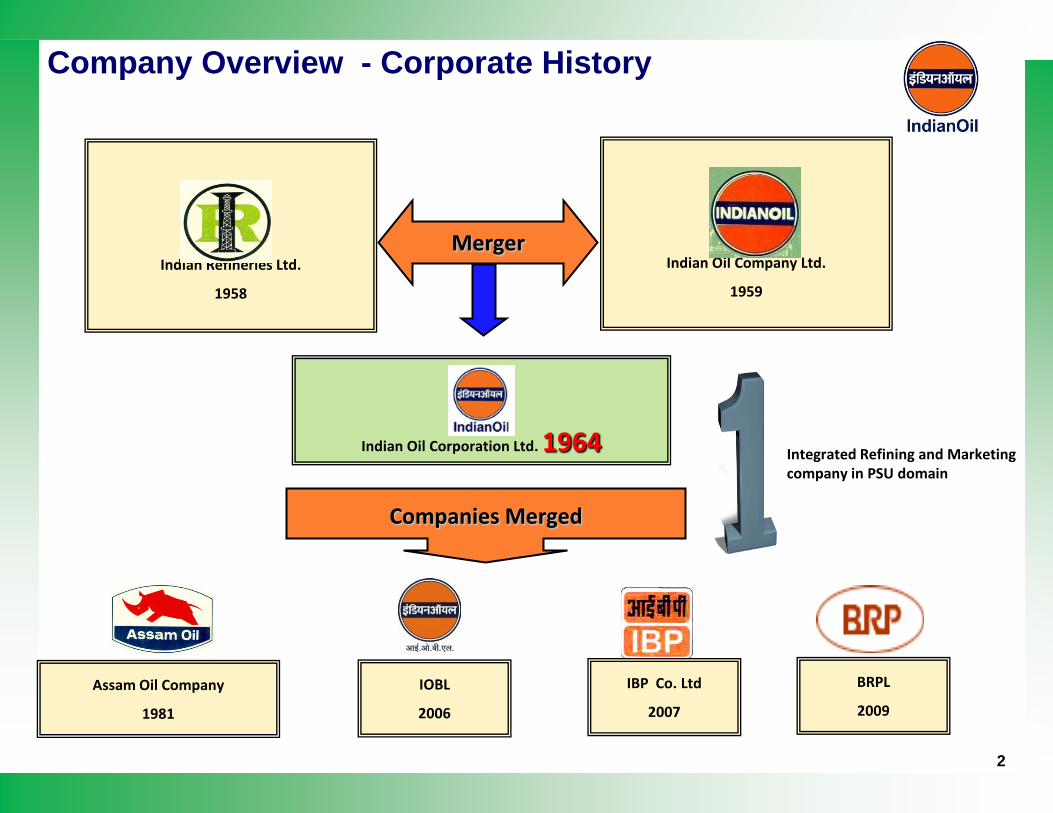
Company Overview - Corporate History
Indian Oil Company Ltd.
1959
Indian Refineries Ltd.
1958
Indian Oil Corporation Ltd. 1964
Merger
Assam Oil Company
1981
IOBL
2006
Companies Merged
IBP Co. Ltd
2007
BRPL
2009
Integrated Refining and Marketing company in PSU domain
2
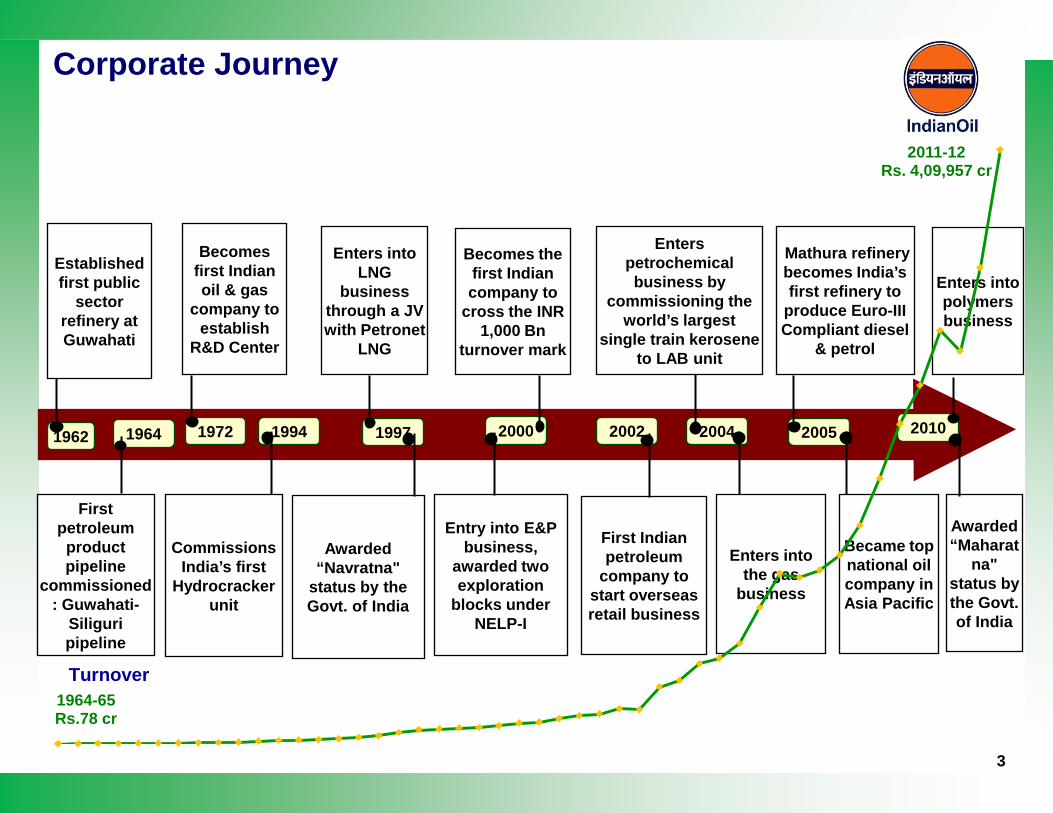
Corporate Journey
1964 20101997 2000 2002 20041972 1994
First petroleum
product pipeline
commissioned: Guwahati-
Siliguripipeline
Enters into LNG
business through a JV with Petronet
LNG
Entry into E&P business,
awarded two exploration
blocks under NELP-I
Enters into polymers business
Awarded “Maharat
na" status by the Govt. of India
Becomes first Indian oil & gas
company to establish
R&D Center
Commissions India’s first
Hydrocracker unit
Becomes the first Indian company to
cross the INR 1,000 Bn
turnover mark
First Indian petroleum
company to start overseas retail business
Enters petrochemical business by
commissioning the world’s largest
single train kerosene to LAB unit
Enters into the gas
business
2005
Mathura refinery becomes India’s first refinery to
produce Euro-III Compliant diesel
& petrol
Became top national oil company in Asia Pacific
1962
Established first public
sector refinery at Guwahati
Awarded “Navratna"
status by the Govt. of India
1964-65Rs.78 cr
2011-12Rs. 4,09,957 cr
Turnover
3
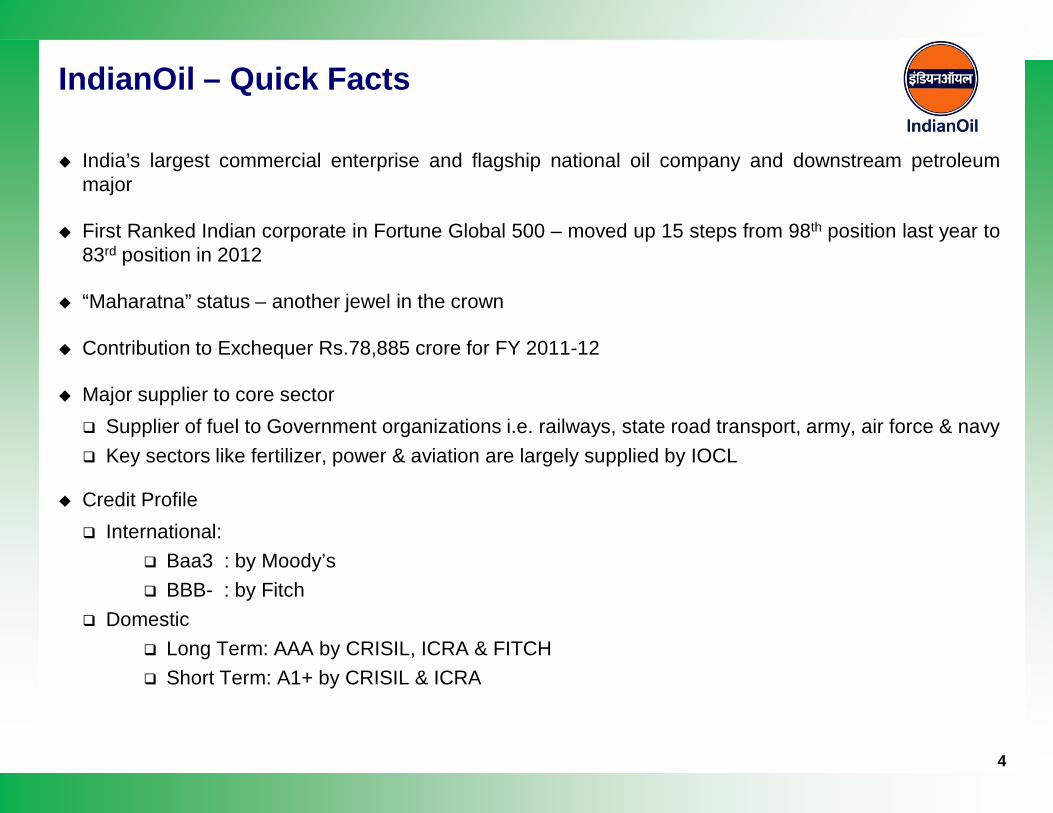
India’s largest commercial enterprise and flagship national oil company and downstream petroleummajor
First Ranked Indian corporate in Fortune Global 500 – moved up 15 steps from 98th position last year to83rd position in 2012
“Maharatna” status – another jewel in the crown
Contribution to Exchequer Rs.78,885 crore for FY 2011-12
Major supplier to core sector Supplier of fuel to Government organizations i.e. railways, state road transport, army, air force & navy Key sectors like fertilizer, power & aviation are largely supplied by IOCL
Credit Profile International:
Baa3 : by Moody’s BBB- : by Fitch
Domestic Long Term: AAA by CRISIL, ICRA & FITCH Short Term: A1+ by CRISIL & ICRA
IndianOil – Quick Facts
4
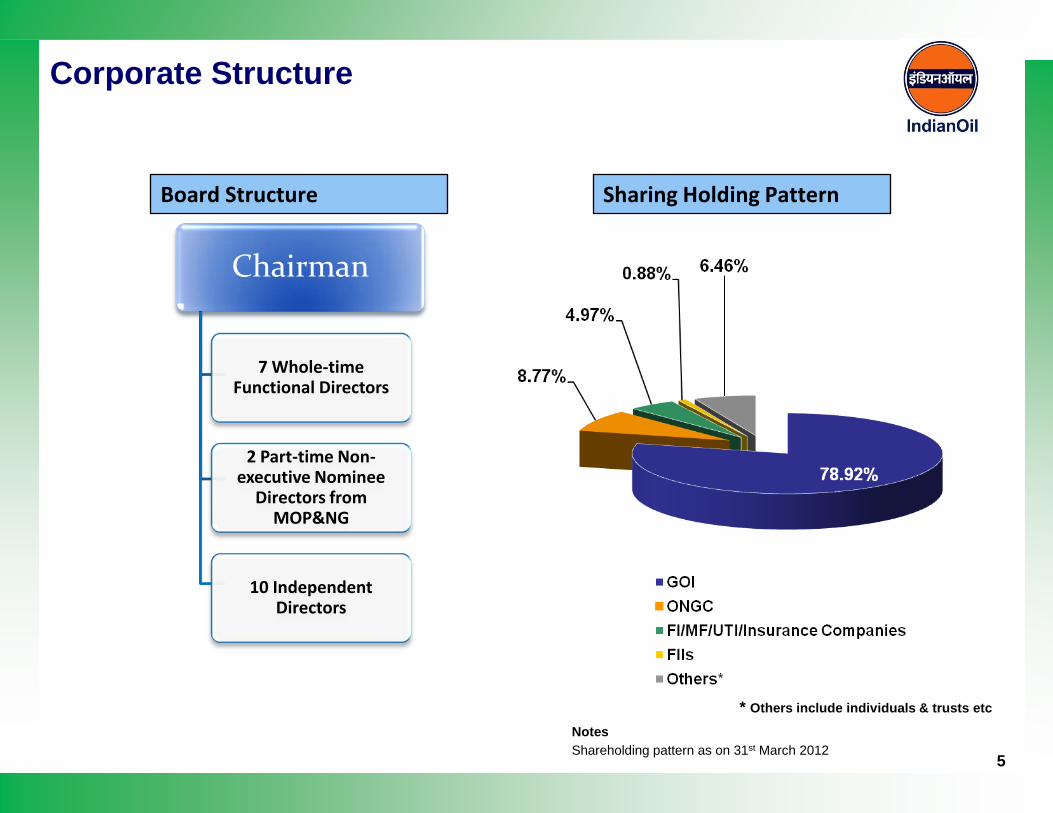
Corporate Structure
Chairman
7 Whole-time Functional Directors
2 Part-time Non-executive Nominee
Directors from MOP&NG
10 Independent Directors
Board Structure
NotesShareholding pattern as on 31st March 2012
Sharing Holding Pattern
* Others include individuals & trusts etc
5
6
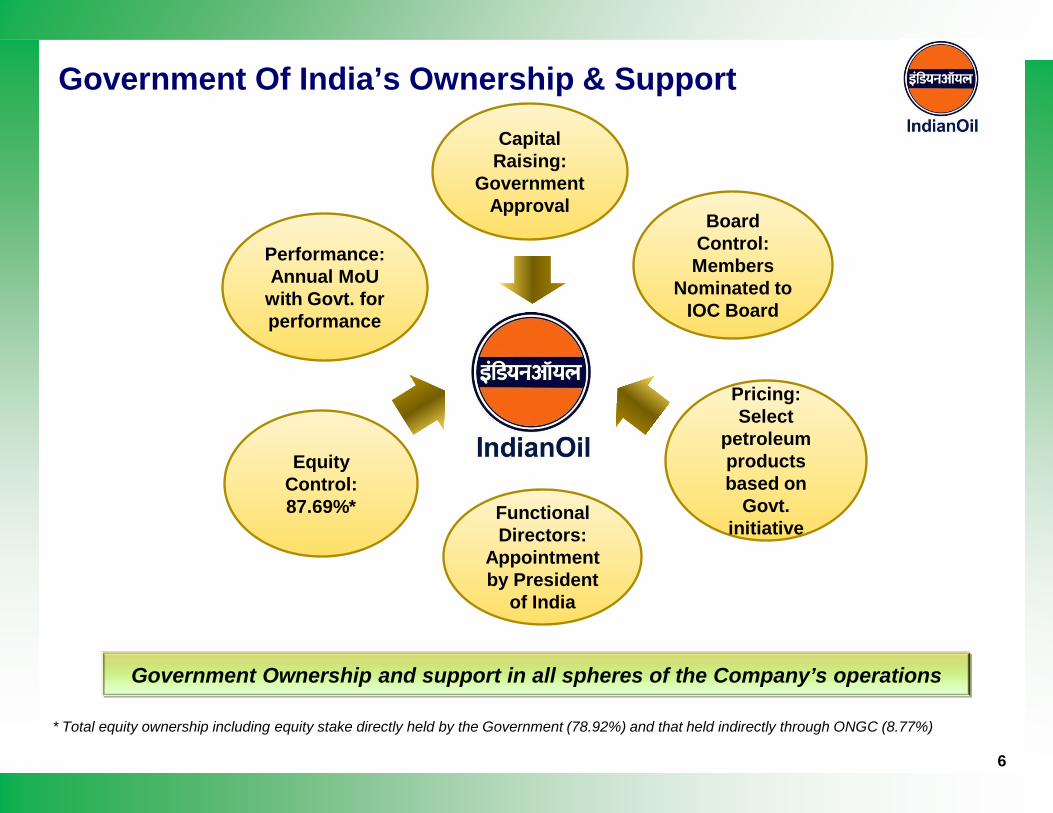
Government Ownership and support in all spheres of the Company’s operations
* Total equity ownership including equity stake directly held by the Government (78.92%) and that held indirectly through ONGC (8.77%)
Performance:Annual MoU
with Govt. for performance
Capital Raising:
Government Approval
Board Control:Members
Nominated to IOC Board
Pricing:Select
petroleum products based on
Govt. initiative
Functional Directors:
Appointment by President
of India
Equity Control:87.69%*
Government Of India’s Ownership & Support
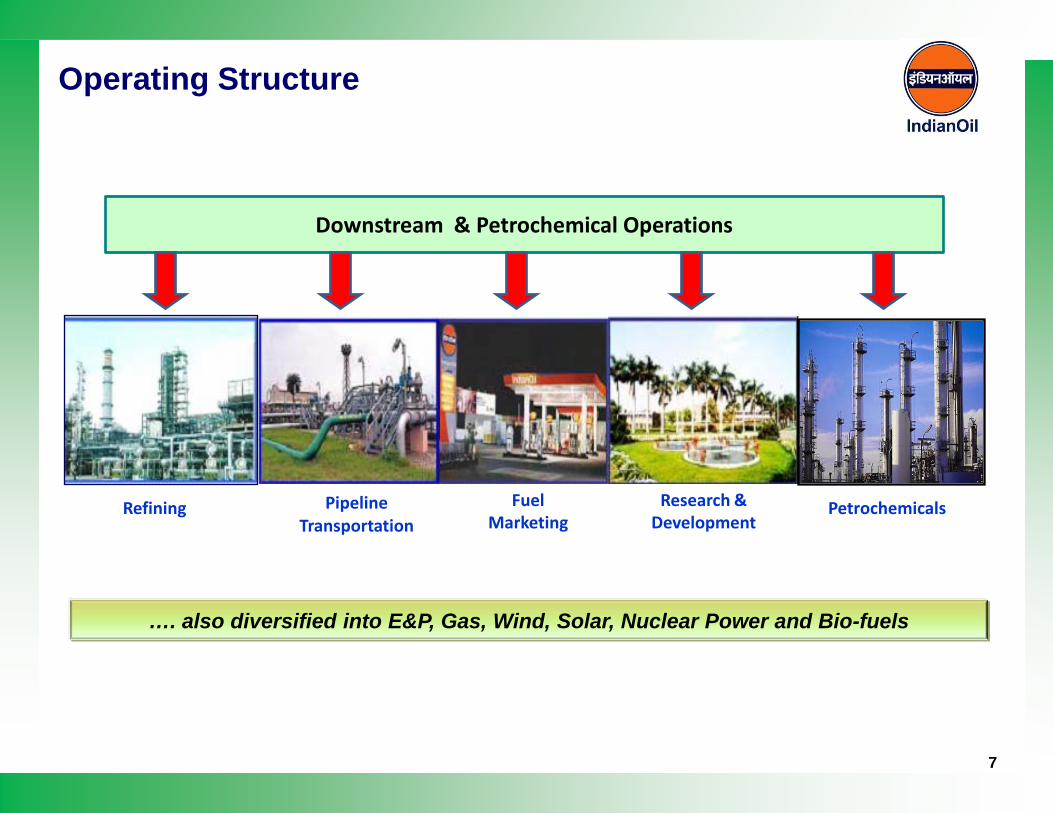
Operating Structure
…. also diversified into E&P, Gas, Wind, Solar, Nuclear Power and Bio-fuels
Downstream & Petrochemical Operations
Refining PipelineTransportation
Fuel Marketing
Research & Development
Petrochemicals
7
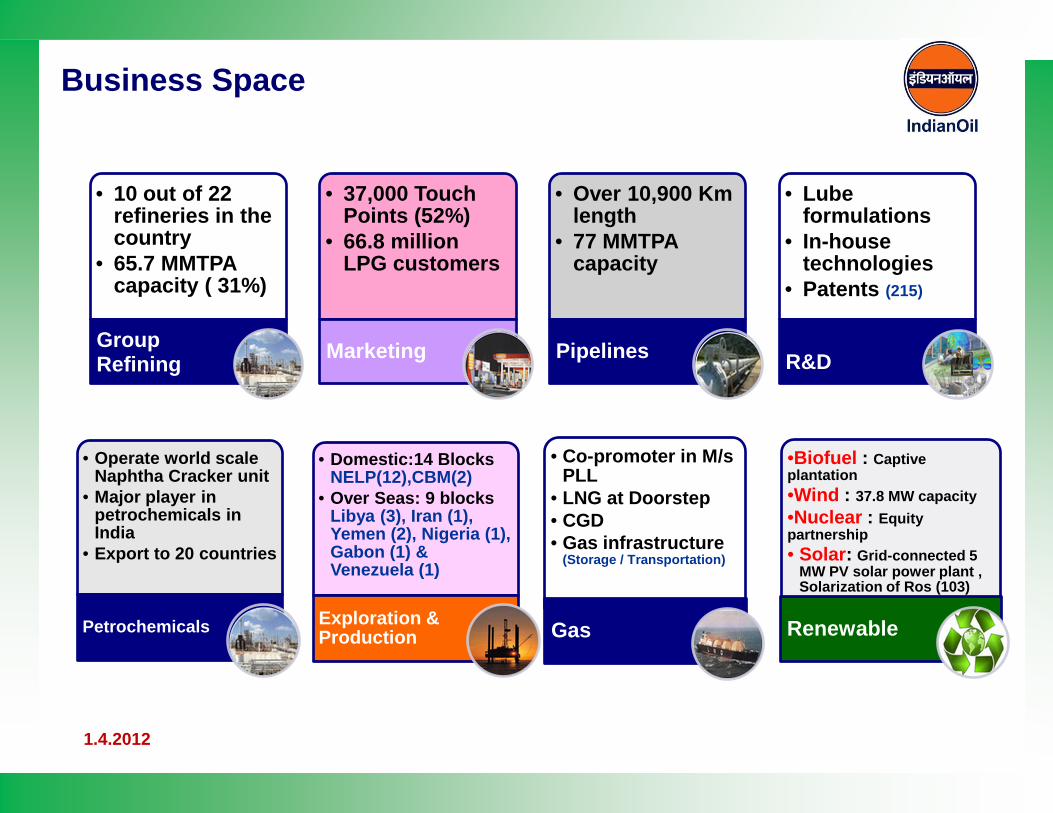
• 10 out of 22 refineries in the country
• 65.7 MMTPA capacity ( 31%)
Group Refining
• 37,000 Touch Points (52%)
• 66.8 million LPG customers
Marketing
• Over 10,900 Km length
• 77 MMTPA capacity
Pipelines
• Lube formulations
• In-house technologies
• Patents (215)
R&D
1.4.2012
• Operate world scale Naphtha Cracker unit
• Major player in petrochemicals in India
• Export to 20 countries
Petrochemicals
• Domestic:14 Blocks NELP(12),CBM(2)
• Over Seas: 9 blocks Libya (3), Iran (1), Yemen (2), Nigeria (1), Gabon (1) & Venezuela (1)
Exploration & Production
• Co-promoter in M/s PLL
• LNG at Doorstep• CGD • Gas infrastructure
(Storage / Transportation)
Gas
•Biofuel : Captive plantation•Wind : 37.8 MW capacity•Nuclear : Equity partnership• Solar: Grid-connected 5
MW PV solar power plant , Solarization of Ros (103)
Renewable
Business Space
9
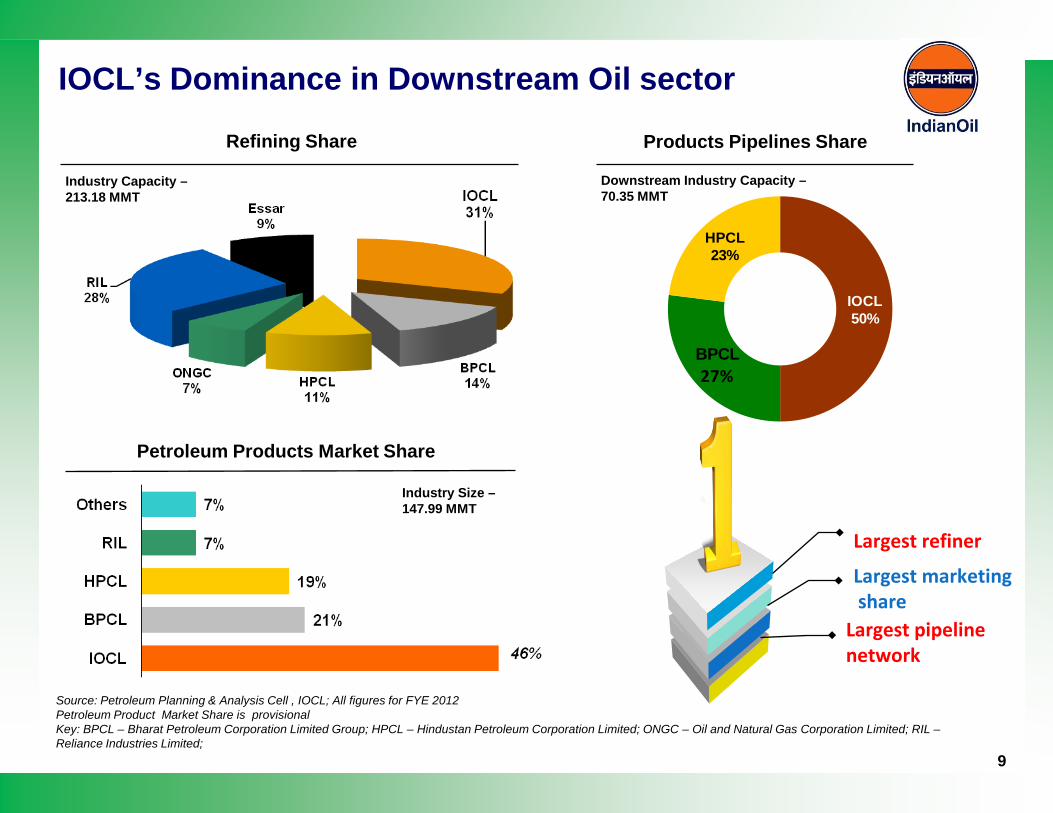
IOCL’s Dominance in Downstream Oil sector
Source: Petroleum Planning & Analysis Cell , IOCL; All figures for FYE 2012Petroleum Product Market Share is provisionalKey: BPCL – Bharat Petroleum Corporation Limited Group; HPCL – Hindustan Petroleum Corporation Limited; ONGC – Oil and Natural Gas Corporation Limited; RIL –Reliance Industries Limited;
IOCL50%
BPCL27%
HPCL23%
Refining Share Products Pipelines Share
Industry Capacity –213.18 MMT
Downstream Industry Capacity –70.35 MMT
Petroleum Products Market Share
Industry Size –147.99 MMT
Largest refiner
Largest pipeline network
Largest marketingshare
10
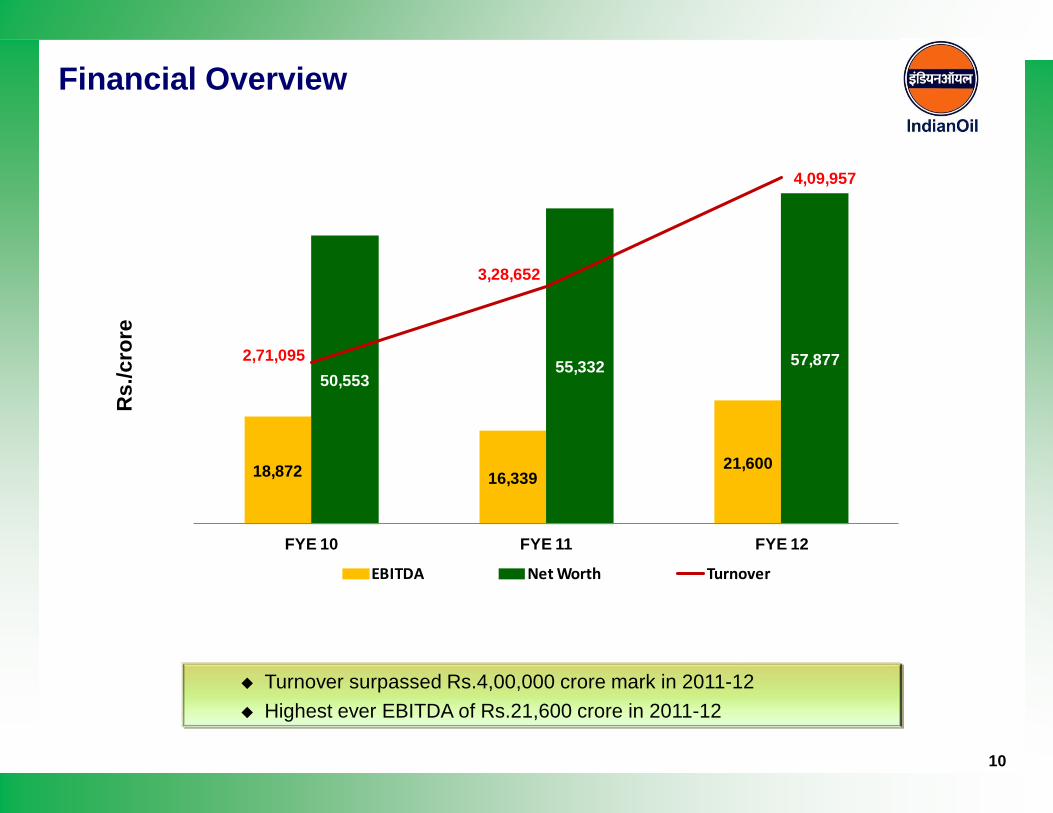
Financial OverviewR
s./c
rore
18,872 16,33921,600
50,55355,332 57,8772,71,095
3,28,652
4,09,957
FYE 10 FYE 11 FYE 12
EBITDA Net Worth Turnover
Turnover surpassed Rs.4,00,000 crore mark in 2011-12 Highest ever EBITDA of Rs.21,600 crore in 2011-12
11
IOCL – An Overview
Oil Industry In India
IOCL’s Core Operations
Strategic Initiatives
Financial Performance
Ongoing Projects
Nine Months Snapshot
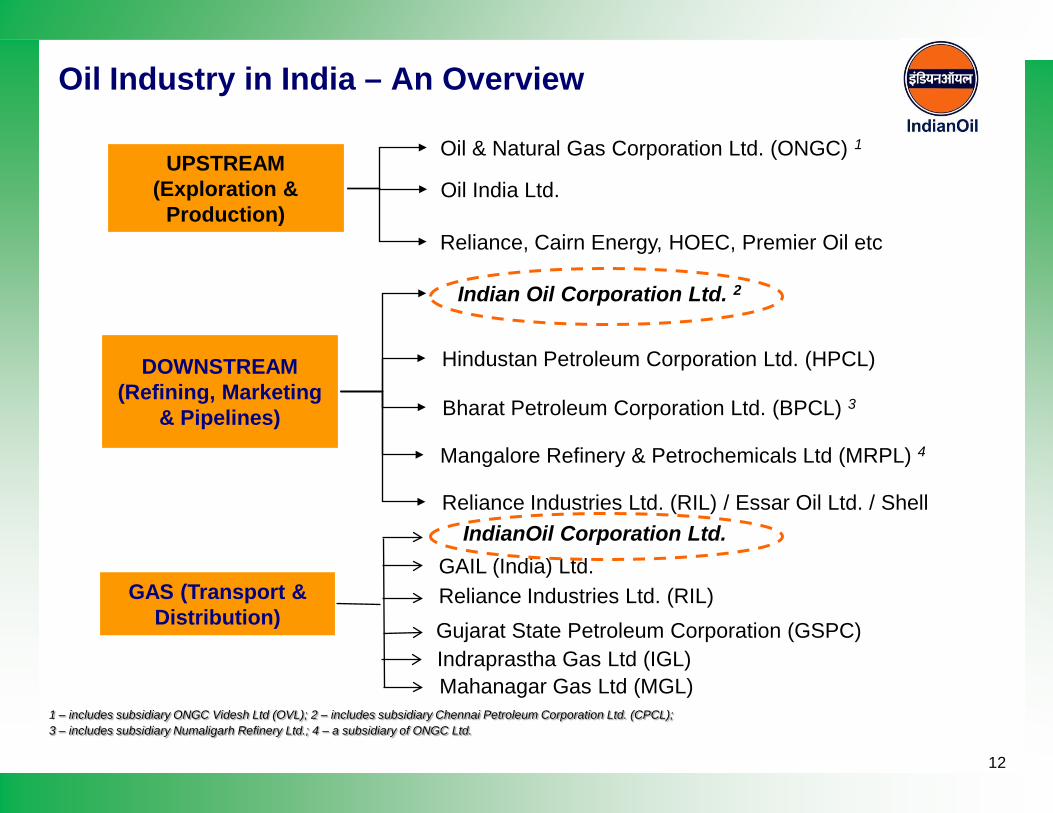
UPSTREAM (Exploration &
Production)
DOWNSTREAM (Refining, Marketing
& Pipelines)
GAS (Transport & Distribution)
Oil Industry in India – An Overview
Oil & Natural Gas Corporation Ltd. (ONGC) 1
Oil India Ltd.
Indian Oil Corporation Ltd. 2
Hindustan Petroleum Corporation Ltd. (HPCL)
Bharat Petroleum Corporation Ltd. (BPCL) 3
GAIL (India) Ltd.
Reliance, Cairn Energy, HOEC, Premier Oil etc
Reliance Industries Ltd. (RIL) / Essar Oil Ltd. / Shell
1 – includes subsidiary ONGC Videsh Ltd (OVL); 2 – includes subsidiary Chennai Petroleum Corporation Ltd. (CPCL); 3 – includes subsidiary Numaligarh Refinery Ltd.; 4 – a subsidiary of ONGC Ltd.
Mangalore Refinery & Petrochemicals Ltd (MRPL) 4
IndianOil Corporation Ltd.
Reliance Industries Ltd. (RIL)Gujarat State Petroleum Corporation (GSPC)Indraprastha Gas Ltd (IGL)Mahanagar Gas Ltd (MGL)
12
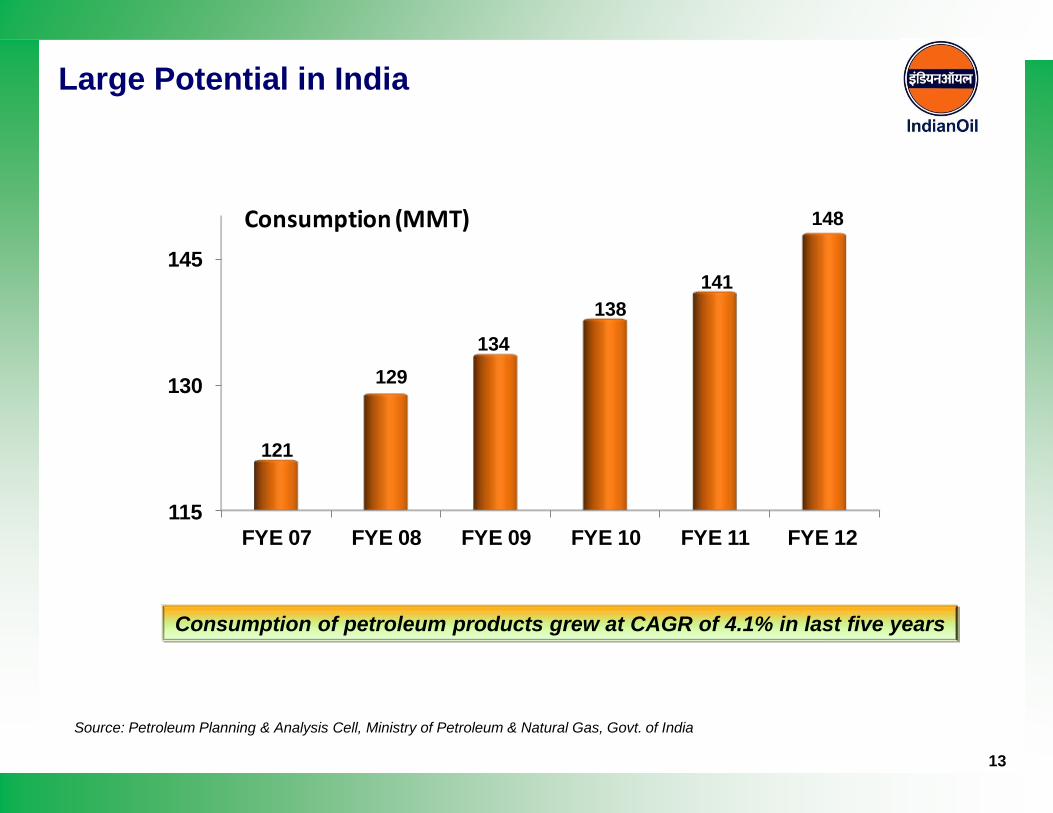
115
130
145
FYE 07 FYE 08 FYE 09 FYE 10 FYE 11 FYE 12
121
129134
138141
148Consumption (MMT)
Source: Petroleum Planning & Analysis Cell, Ministry of Petroleum & Natural Gas, Govt. of India
Consumption of petroleum products grew at CAGR of 4.1% in last five years
Large Potential in India
13
14
IOCL – An Overview
Oil Industry In India
IOCL’s Core Operations
Strategic Initiatives
Financial Performance
Ongoing Projects
Nine Months Snapshot
15
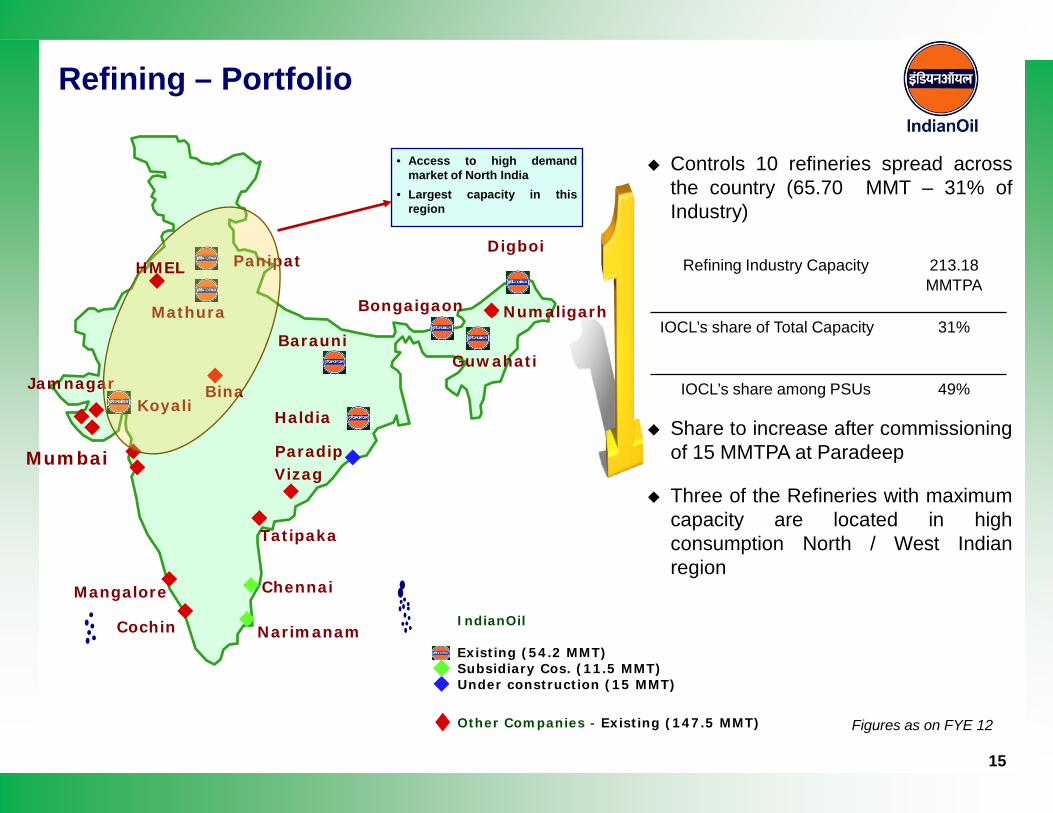
Refining – Portfolio
Controls 10 refineries spread acrossthe country (65.70 MMT – 31% ofIndustry)
Share to increase after commissioningof 15 MMTPA at Paradeep
Three of the Refineries with maximumcapacity are located in highconsumption North / West Indianregion
Figures as on FYE 12
Refining Industry Capacity 213.18 MMTPA
IOCL’s share of Total Capacity 31%
IOCL’s share among PSUs 49%
MumbaiVizag
Chennai
Cochin Narimanam
Bongaigaon
Mangalore
Panipat
Guwahati
Haldia
Barauni
Mathura
Koyali
Digboi
Jamnagar
Tatipaka
Numaligarh
IndianOil
Existing (54.2 MMT) Subsidiary Cos. (11.5 MMT) Under construction (15 MMT)
Other Companies - Existing (147.5 MMT)
Bina
Paradip
• Access to high demandmarket of North India
• Largest capacity in thisregion
HMEL
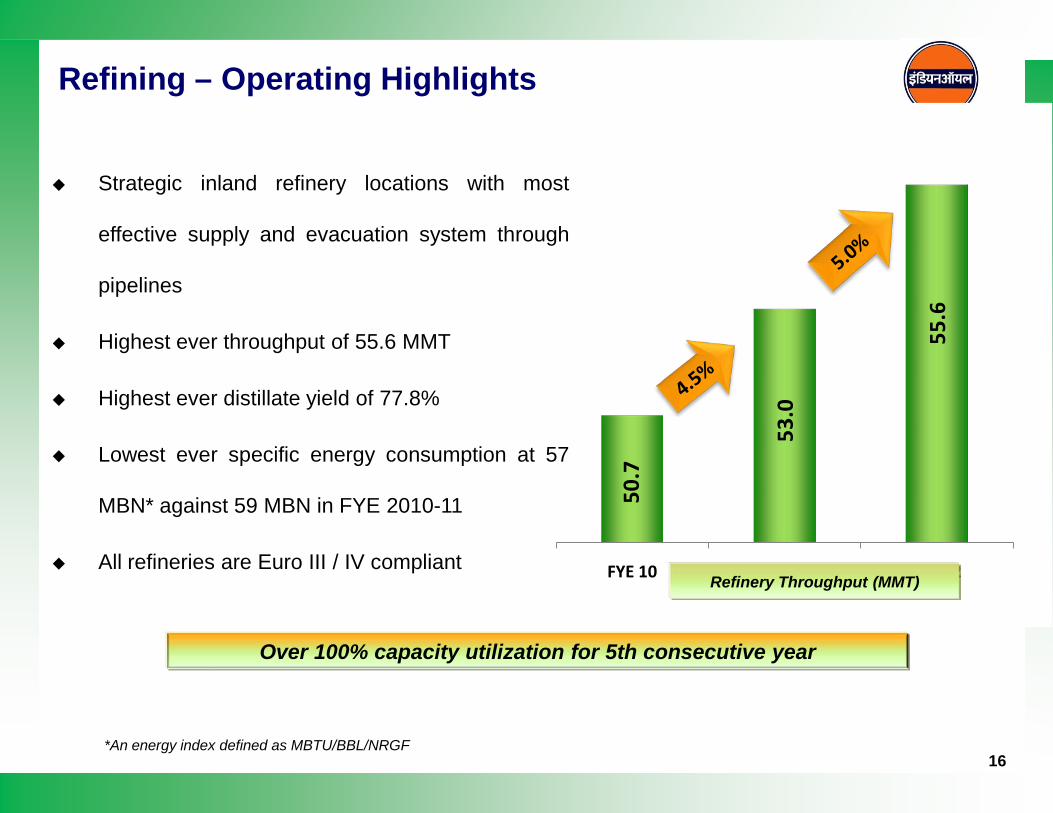
50.7
53.0
55.6
FYE 10 FYE 11 FYE 12
Strategic inland refinery locations with most
effective supply and evacuation system through
pipelines
Highest ever throughput of 55.6 MMT
Highest ever distillate yield of 77.8%
Lowest ever specific energy consumption at 57
MBN* against 59 MBN in FYE 2010-11
All refineries are Euro III / IV compliantRefinery Throughput (MMT)
Refining – Operating Highlights
*An energy index defined as MBTU/BBL/NRGF16
Over 100% capacity utilization for 5th consecutive year
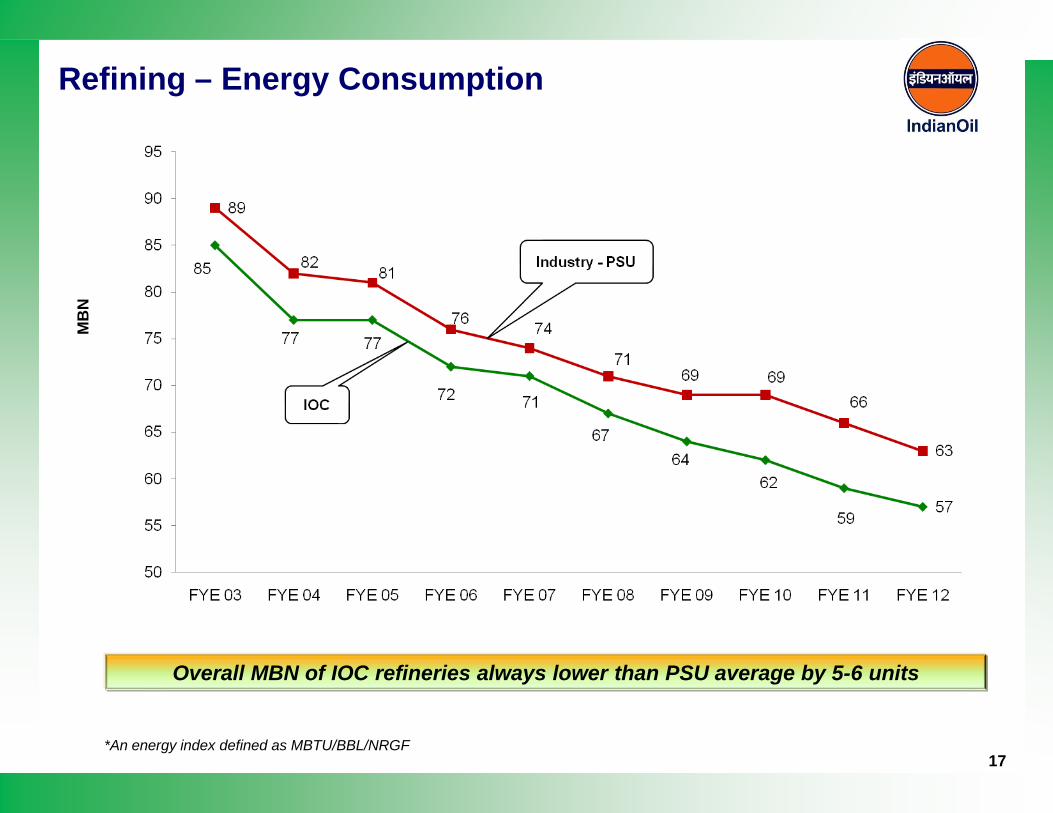
Refining – Energy Consumption
*An energy index defined as MBTU/BBL/NRGF17
Overall MBN of IOC refineries always lower than PSU average by 5-6 units
MB
N
18
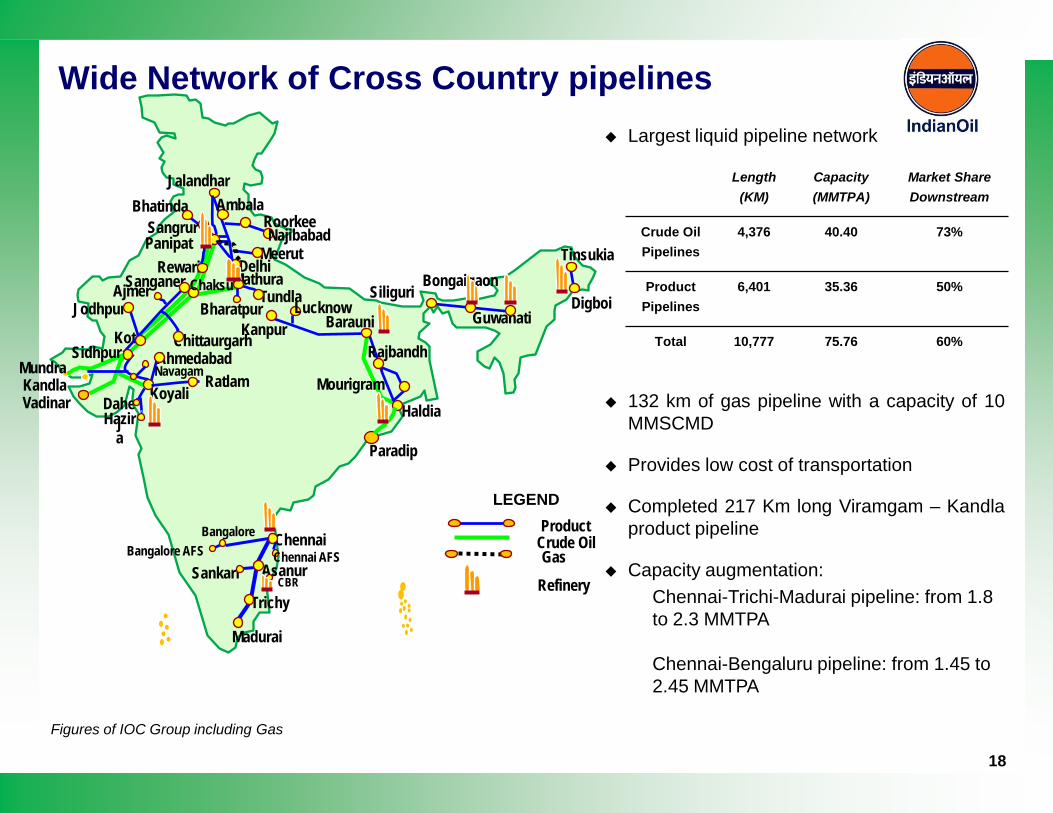
Largest liquid pipeline network
132 km of gas pipeline with a capacity of 10MMSCMD
Provides low cost of transportation
Completed 217 Km long Viramgam – Kandlaproduct pipeline
Capacity augmentation:Chennai-Trichi-Madurai pipeline: from 1.8 to 2.3 MMTPA
Chennai-Bengaluru pipeline: from 1.45 to 2.45 MMTPA
Wide Network of Cross Country pipelines
Figures of IOC Group including Gas
Length (KM)
Capacity (MMTPA)
Market Share Downstream
Crude Oil Pipelines
4,376 40.40 73%
Product Pipelines
6,401 35.36 50%
Total 10,777 75.76 60%
KandlaVadinar
Mundra
Chaksu
Guwahati
BongaigaonSiliguri Digboi
Tinsukia
Jalandhar
DelhiMeerut
Tundla
NajibabadRoorkee
Ambala
Mathura
KotSidhpur Ahmedabad
Jodhpur
Navagam
SanganerAjmer
Dahej
Chittaurgarh
Koyali
BhatindaSangrurPanipat
Rewari
Haldia
BarauniKanpurLucknow
Mourigram
Rajbandh
Chennai
Sankari Asanur
Trichy
Madurai
CBR
BangaloreBangalore AFS
Paradip
Ratlam
Chennai AFS
Bharatpur
Hazira
ProductLEGEND
Crude Oil
Refinery
Gas

FYE 10 FYE 11 FYE 12
23.0 26.0 28.0
42.042.5
47.5Crude
Product
Surpassing performance continues
Highest ever throughput of 75.5 MMT achieved by IOCL’s pipelines in FYE 12
Highest ever capacity utilization of 118% for crude oil pipelines
Pipelines Throughput (MMT)
Pipelines Operating highlights
19
65.068.5
75.5
20
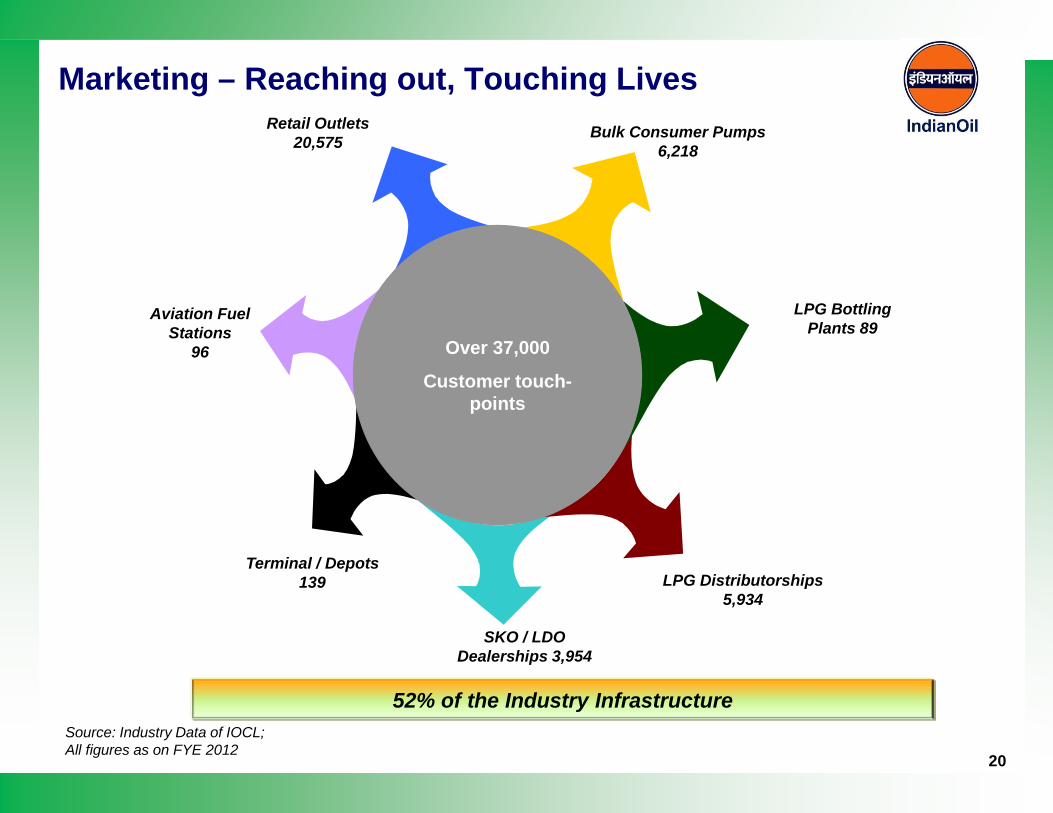
Marketing – Reaching out, Touching Lives
52% of the Industry Infrastructure
Over 37,000
Customer touch-points
LPG Bottling Plants 89
LPG Distributorships 5,934
SKO / LDO Dealerships 3,954
Terminal / Depots 139
Aviation Fuel Stations
96
Retail Outlets20,575 Bulk Consumer Pumps
6,218
Source: Industry Data of IOCL; All figures as on FYE 2012
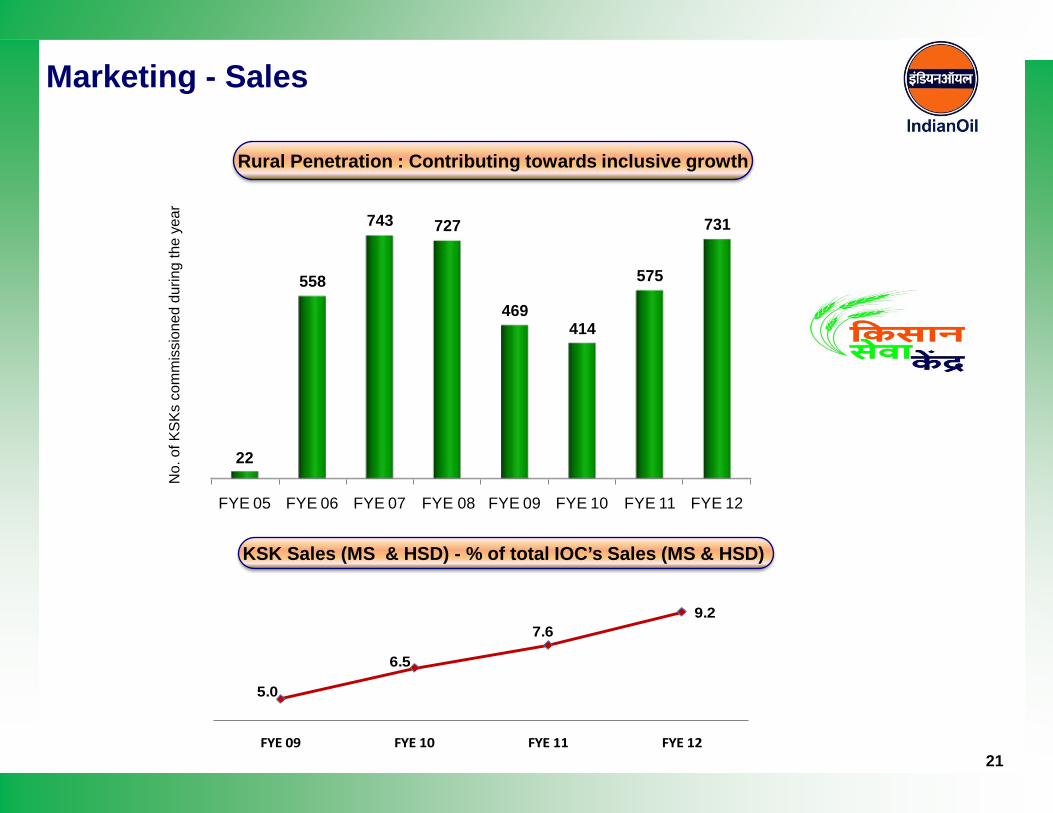
Marketing - Sales
Rural Penetration : Contributing towards inclusive growthN
o. o
f KSK
s co
mm
issi
oned
dur
ing
the
year
KSK Sales (MS & HSD) - % of total IOC’s Sales (MS & HSD)
FYE 05 FYE 06 FYE 07 FYE 08 FYE 09 FYE 10 FYE 11 FYE 12
22
558
743 727
469414
575
731
5.0
6.5
7.69.2
FYE 09 FYE 10 FYE 11 FYE 1221
22
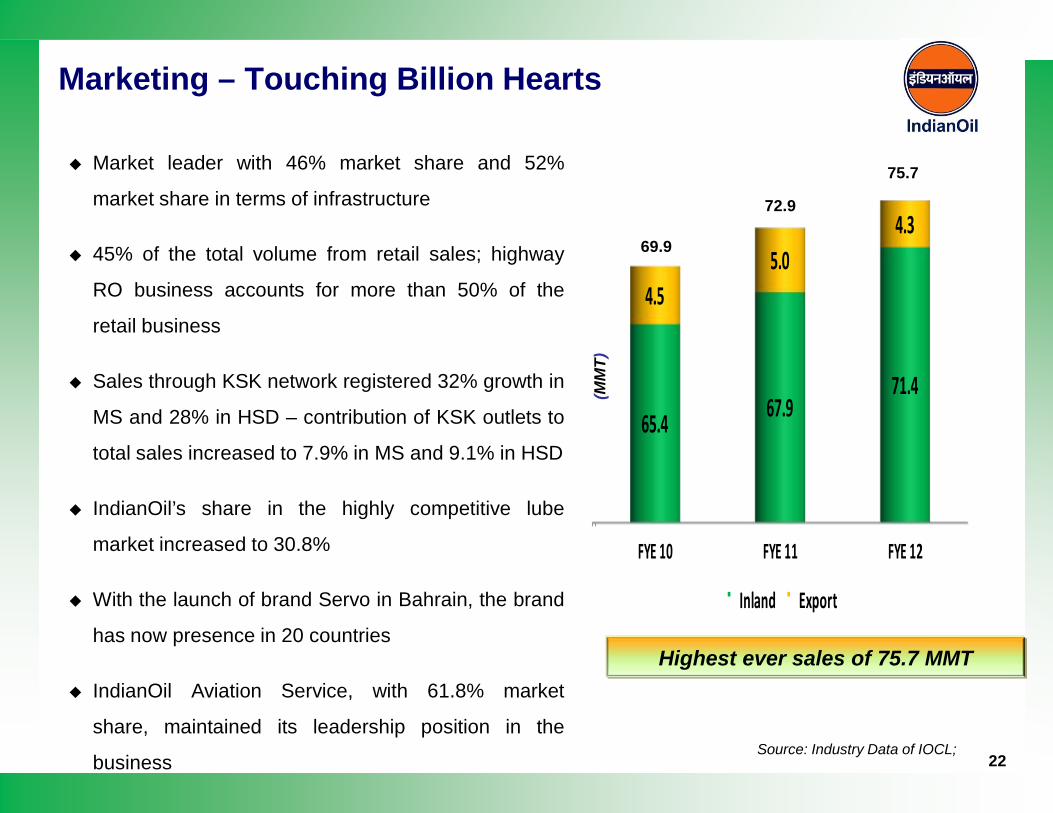
Marketing – Touching Billion Hearts
Market leader with 46% market share and 52%
market share in terms of infrastructure
45% of the total volume from retail sales; highway
RO business accounts for more than 50% of the
retail business
Sales through KSK network registered 32% growth in
MS and 28% in HSD – contribution of KSK outlets to
total sales increased to 7.9% in MS and 9.1% in HSD
IndianOil’s share in the highly competitive lube
market increased to 30.8%
With the launch of brand Servo in Bahrain, the brand
has now presence in 20 countries
IndianOil Aviation Service, with 61.8% market
share, maintained its leadership position in the
businessSource: Industry Data of IOCL;
FYE 10 FYE 11 FYE 12
65.467.9
71.4
4.55.0
4.3
Inland Export
Highest ever sales of 75.7 MMT
69.9
72.9
(MM
T)
75.7
23
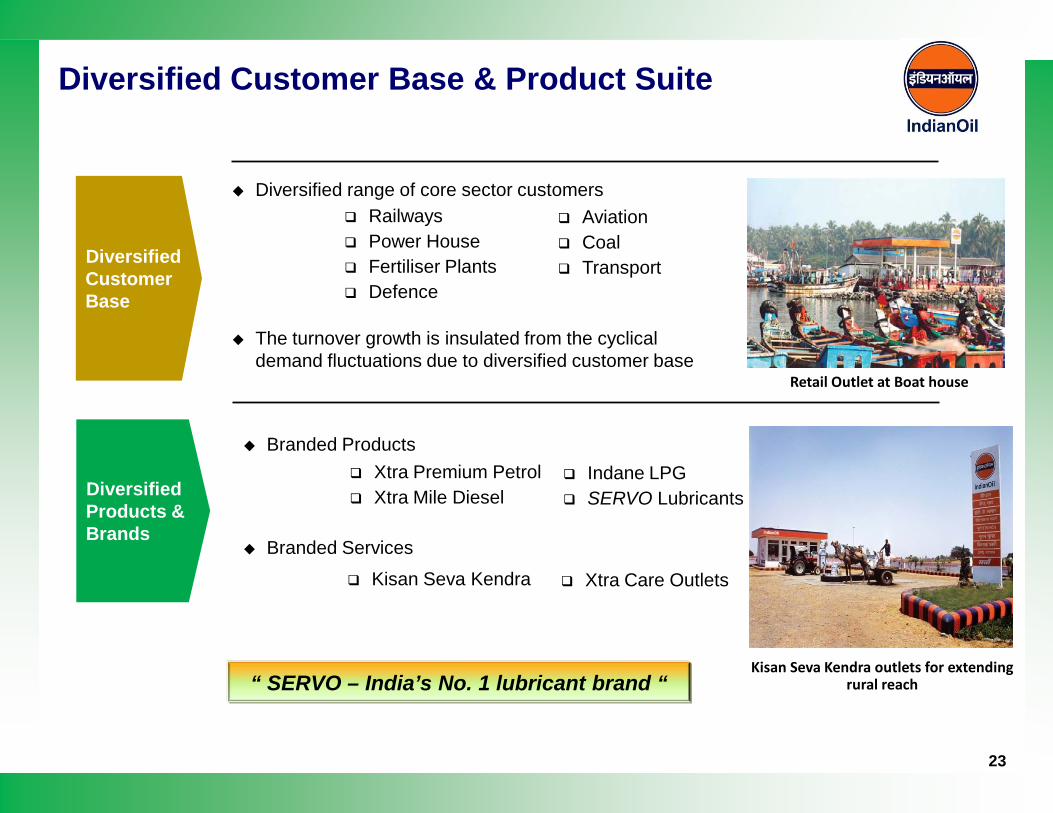
Branded Products
Branded Services
Diversified range of core sector customers
The turnover growth is insulated from the cyclical demand fluctuations due to diversified customer base
Diversified Customer Base
Diversified Products & Brands
Xtra Premium Petrol Xtra Mile Diesel
Indane LPG SERVO Lubricants
Diversified Customer Base & Product Suite
Railways Power House Fertiliser Plants Defence
Aviation Coal Transport
Kisan Seva Kendra Xtra Care Outlets
“ SERVO – India’s No. 1 lubricant brand “Kisan Seva Kendra outlets for extending
rural reach
Retail Outlet at Boat house
24
Commercialization of technologies
INDMAX :For maximisation of LPG & light distillates from Refinery Residue.
Marine Oils : One of six companies to have developed “Original Equipment
Manufacturer Approved Marine Technology Equipment”
Needle Coke :One of three companies in world that possess technology to make high
value needle coke
Diesel Hydrotreating (DHDT) and Light Naphtha Isomerisation units commissioned at
Bongaigaon Refinery to produce Bharat Stage IV complaint Diesel & Euro III/IV MS
Widening horizons
New petrochemical and polymer labs fully functional
MOU with the Department of Bio-Technolodgy to set up “Advanced Bio-energyResearch Centre”
Commissioned fluidized bed gasification pilot
R&D Providing The Cutting Edge
25
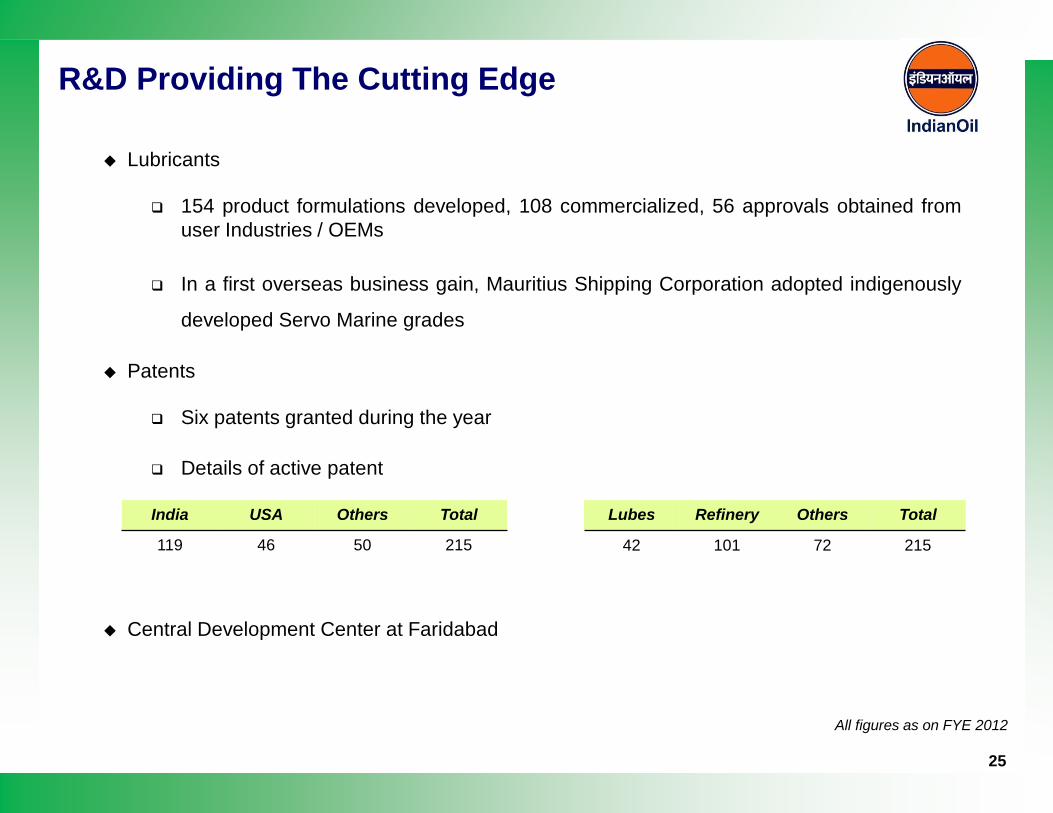
Lubricants
154 product formulations developed, 108 commercialized, 56 approvals obtained fromuser Industries / OEMs
In a first overseas business gain, Mauritius Shipping Corporation adopted indigenously
developed Servo Marine grades
Patents
Six patents granted during the year
Details of active patent
Central Development Center at Faridabad
India USA Others Total
119 46 50 215
Lubes Refinery Others Total
42 101 72 215
R&D Providing The Cutting Edge
All figures as on FYE 2012
26
IOCL – An Overview
Oil Industry In India
IOCL’s Core Operations
Strategic Initiatives
Financial Performance
Ongoing Projects
Nine Months Snapshot
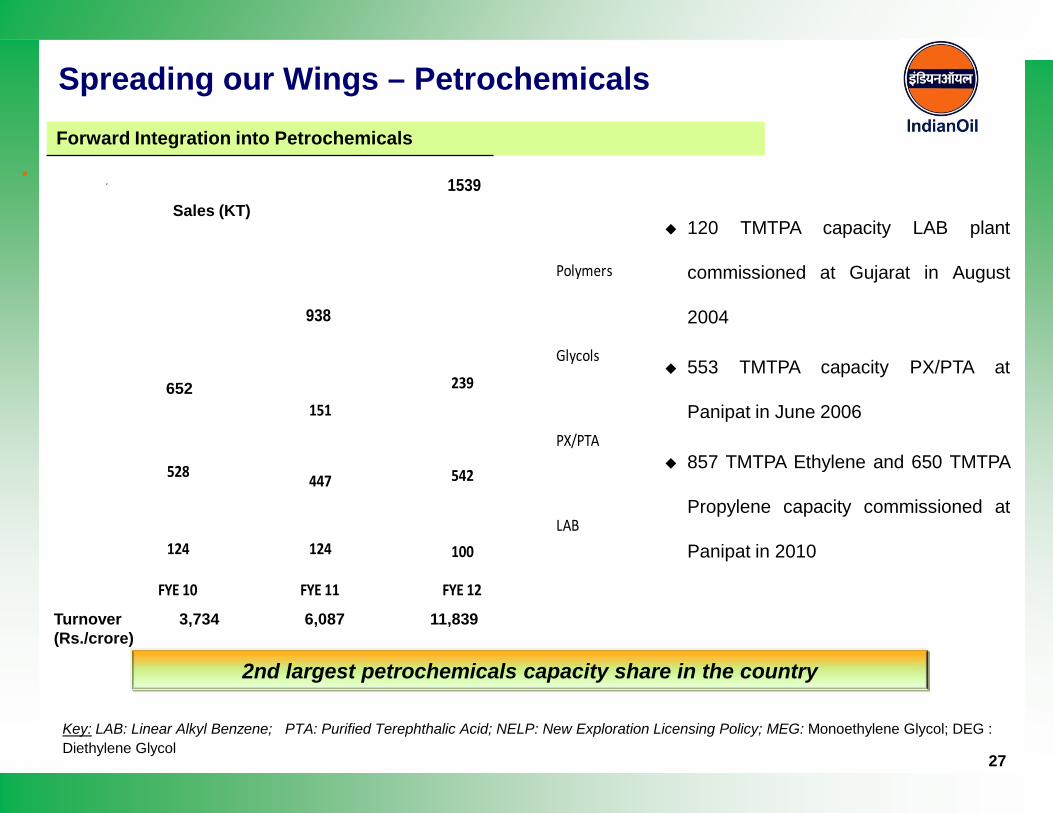
FYE 10 FYE 11 FYE 12
124 124 100
528 447 542
151
239216
658 Polymers
Glycols
PX/PTA
LAB
938
1539
27
Spreading our Wings – PetrochemicalsForward Integration into Petrochemicals
Key: LAB: Linear Alkyl Benzene; PTA: Purified Terephthalic Acid; NELP: New Exploration Licensing Policy; MEG: Monoethylene Glycol; DEG : Diethylene Glycol
120 TMTPA capacity LAB plant
commissioned at Gujarat in August
2004
553 TMTPA capacity PX/PTA at
Panipat in June 2006
857 TMTPA Ethylene and 650 TMTPA
Propylene capacity commissioned at
Panipat in 2010
Turnover (Rs./crore)
3,734 6,087 11,839
2nd largest petrochemicals capacity share in the country
652
Sales (KT)
28
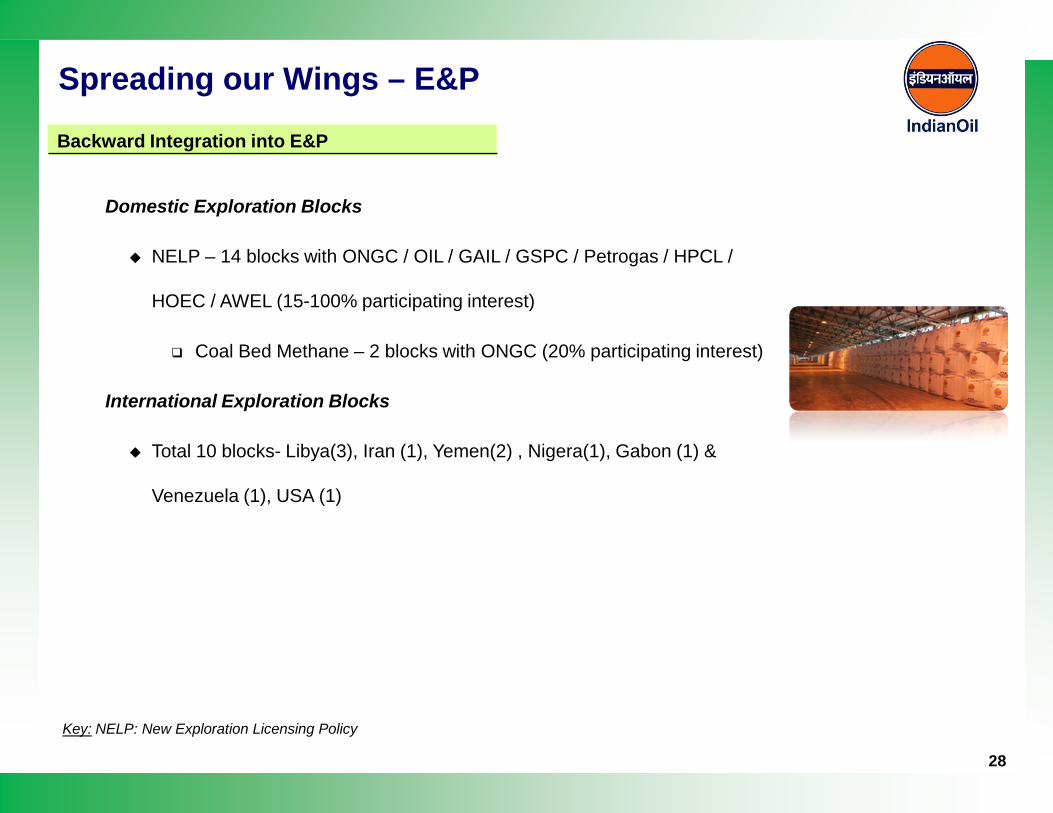
Spreading our Wings – E&P
Domestic Exploration Blocks
NELP – 14 blocks with ONGC / OIL / GAIL / GSPC / Petrogas / HPCL /
HOEC / AWEL (15-100% participating interest)
Coal Bed Methane – 2 blocks with ONGC (20% participating interest)
International Exploration Blocks
Total 10 blocks- Libya(3), Iran (1), Yemen(2) , Nigera(1), Gabon (1) &
Venezuela (1), USA (1)
Backward Integration into E&P
Key: NELP: New Exploration Licensing Policy
29
Diversification to Other Energy Sources
Gas sales of 1.72 MMT in FYE 2012, Turnover grew by 4.9% against previous year
Operating City Gas Distribution (CGD) network with JV company Green Gas Ltd in Agra &
Lucknow
Consortium with Adani Gas Ltd to develop CGD network on pan India basis
Setting up 5 MMTPA LNG regasification and storage terminal at Ennore
Formed a consortium with Gujarat State Petronet Ltd, BPCL & HPCL to build three cross-
country pipeline through a joint venture; IOC’s share at 26%
On 6th April 2011 formed JV with Nuclear Power Corporation of India to establish (700*2)
MW nuclear plant at Rawatbhatta, Rajasthan. IOC’s Share 26% (Rs.961 crore)
NUCLEAR
GAS
30
Diversification to Other Energy Sources
Wind Power, Biofuels & Solar Energy
Commissioned 21MW plant at Kachchh, Gujarat in Jan 09
Second plant of 48.3 MW capacity consisting of 23 windmills under implementation in Andhra
Pradesh; out of 23, 8 windmills commissioned in March’12
Chhattisgarh Project: Subsidiary with Chhattisgarh Renewable Development Authority for
plantation of Jatropha in 30,000 hectare wasteland
Madhya Pradesh Project: IOC alloted 2,000 hectare wasteland for Jatropha plantation
UP Project: Formed LLP with Ruchi Soya Industries Limited with objective of Jatropha
plantation on 50,000 hectare wasteland
Commissioned 5 MW solar plant in Rajasthan
Solar plants at Retail Outlets / PLHO
Solar Lanterns launched in IOC’s state offices
SOLAR
Wind Power
BIOFUELS
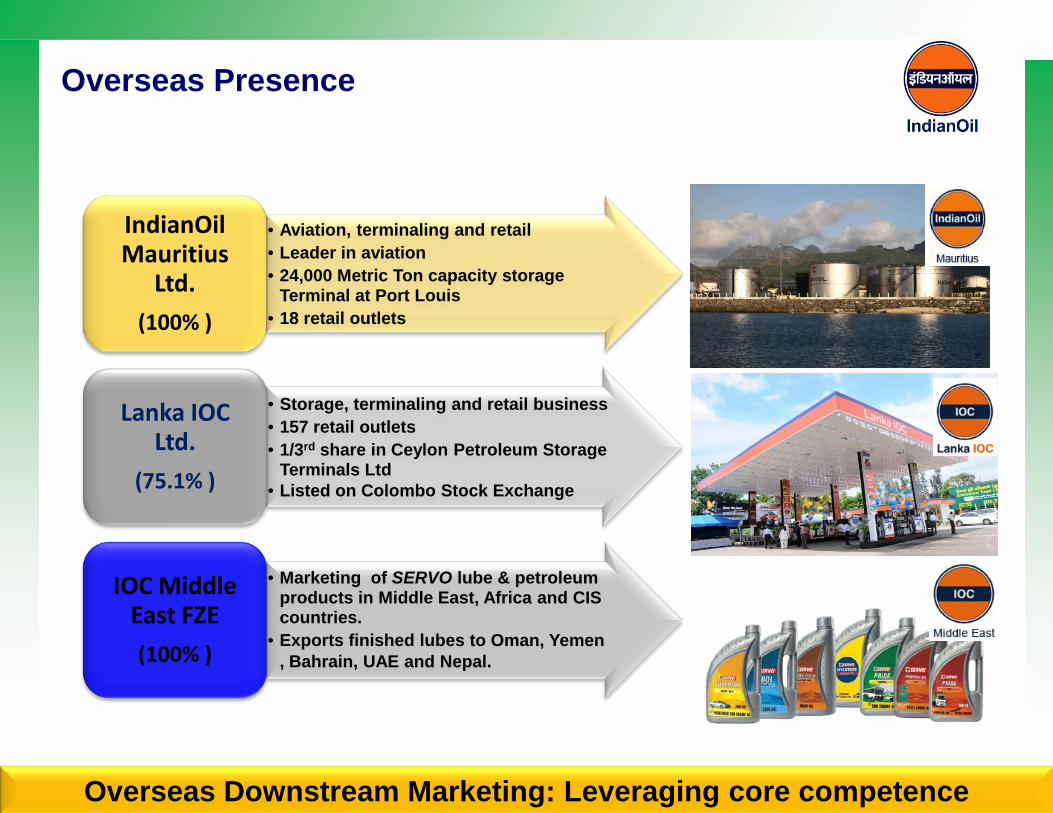
• Aviation, terminaling and retail• Leader in aviation• 24,000 Metric Ton capacity storage
Terminal at Port Louis• 18 retail outlets
IndianOil Mauritius
Ltd.
(100% )
• Storage, terminaling and retail business• 157 retail outlets• 1/3rd share in Ceylon Petroleum Storage
Terminals Ltd• Listed on Colombo Stock Exchange
Lanka IOC Ltd.
(75.1% )
• Marketing of SERVO lube & petroleum products in Middle East, Africa and CIS countries.
• Exports finished lubes to Oman, Yemen , Bahrain, UAE and Nepal.
IOC Middle East FZE
(100% )
Overseas Downstream Marketing: Leveraging core competence
Overseas Presence
32
IOCL – An Overview
Oil Industry In India
IOCL’s Core Operations
Strategic Initiatives
Financial Performance
Ongoing Projects
Nine Months Snapshot
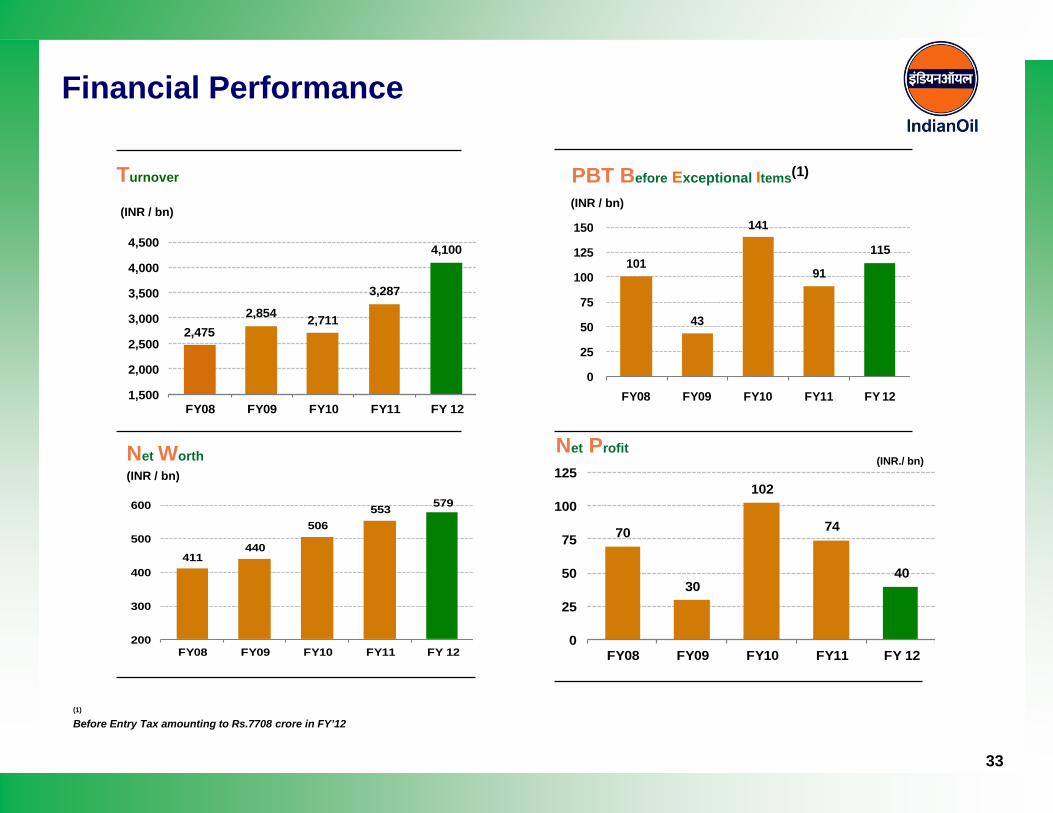
Financial Performance
Net Profit
Turnover
Net Worth
(INR / bn)(INR / bn)
(INR / bn)(INR./ bn)
411440
506553 579
200
300
400
500
600
FY08 FY09 FY10 FY11 FY 12
2,4752,854 2,711
3,287
4,100
1,500
2,000
2,500
3,000
3,500
4,000
4,500
FY08 FY09 FY10 FY11 FY 12
70
30
102
74
40
0
25
50
75
100
125
FY08 FY09 FY10 FY11 FY 12
101
43
141
91
115
0
25
50
75
100
125
150
FY08 FY09 FY10 FY11 FY 12
PBT Before Exceptional Items(1)
(1)
Before Entry Tax amounting to Rs.7708 crore in FY’12
33
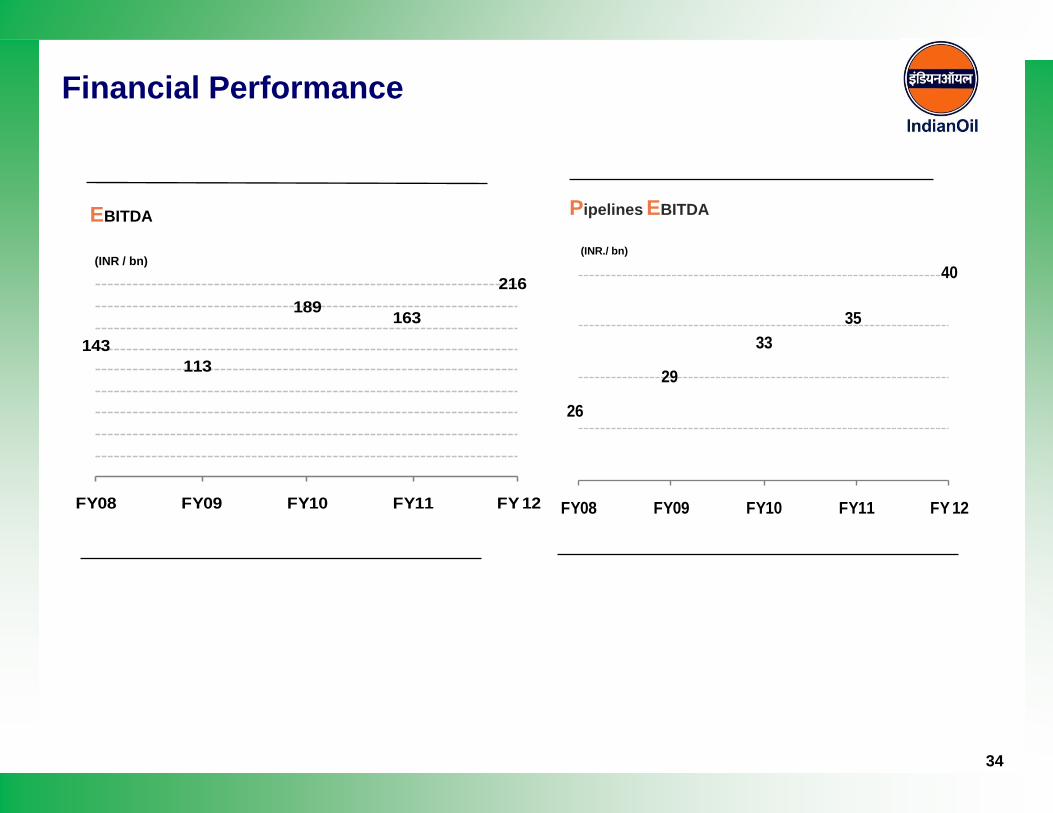
Financial Performance
EBITDA
(INR / bn)
Pipelines EBITDA
26
29
3335
40
FY08 FY09 FY10 FY11 FY 12
(INR./ bn)
143113
189 163
216
FY08 FY09 FY10 FY11 FY 12
34
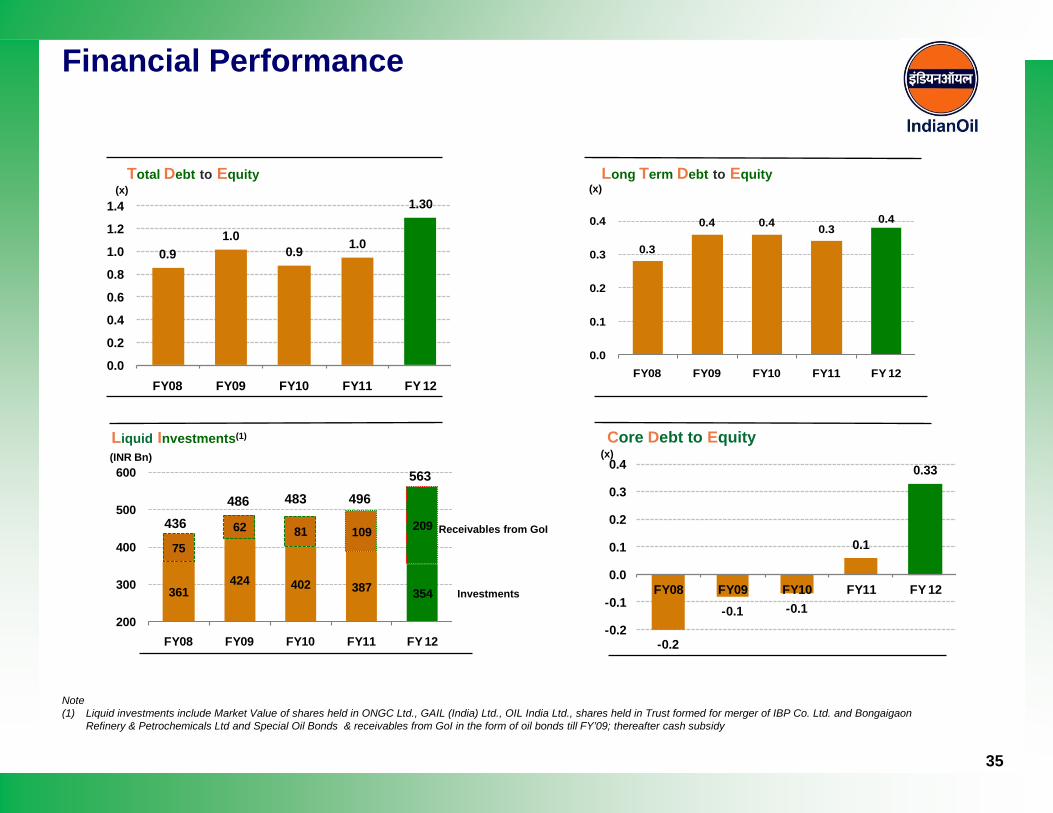
Financial Performance
361424 402 387 354
7562 81 109 209
200
300
400
500
600
FY08 FY09 FY10 FY11 FY 12
Liquid Investments(1)
(INR Bn)
(x)
0.3
0.4 0.4 0.30.4
0.0
0.1
0.2
0.3
0.4
FY08 FY09 FY10 FY11 FY 12
0.91.0
0.9 1.0
1.30
0.0
0.2
0.4
0.6
0.8
1.0
1.2
1.4
FY08 FY09 FY10 FY11 FY 12
Total Debt to Equity
Core Debt to Equity(x)
Note (1) Liquid investments include Market Value of shares held in ONGC Ltd., GAIL (India) Ltd., OIL India Ltd., shares held in Trust formed for merger of IBP Co. Ltd. and Bongaigaon
Refinery & Petrochemicals Ltd and Special Oil Bonds & receivables from GoI in the form of oil bonds till FY’09; thereafter cash subsidy
Long Term Debt to Equity
Receivables from GoI
Investments
436486 483 496
563
(x)
-0.2
-0.1 -0.1
0.1
0.33
-0.2
-0.1
0.0
0.1
0.2
0.3
0.4
FY08 FY09 FY10 FY11 FY 12
35
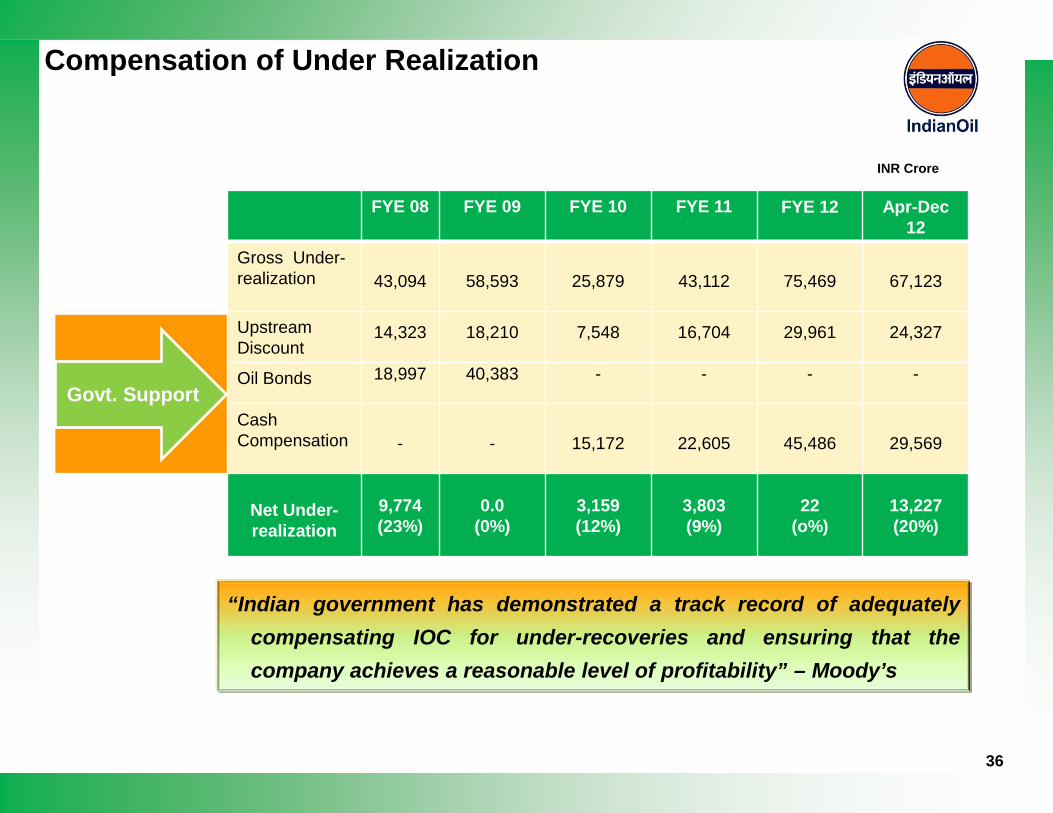
INR Crore
Compensation of Under Realization
“Indian government has demonstrated a track record of adequatelycompensating IOC for under-recoveries and ensuring that thecompany achieves a reasonable level of profitability” – Moody’s
FYE 08 FYE 09 FYE 10 FYE 11 FYE 12 Apr-Dec12
Gross Under-realization 43,094 58,593 25,879 43,112 75,469 67,123
Upstream Discount
14,323 18,210 7,548 16,704 29,961 24,327
Oil Bonds 18,997 40,383 - - - -
CashCompensation - - 15,172 22,605 45,486 29,569
Net Under-realization
9,774 (23%)
0.0 (0%)
3,159 (12%)
3,803 (9%)
22(o%)
13,227(20%)
Govt. Support
36
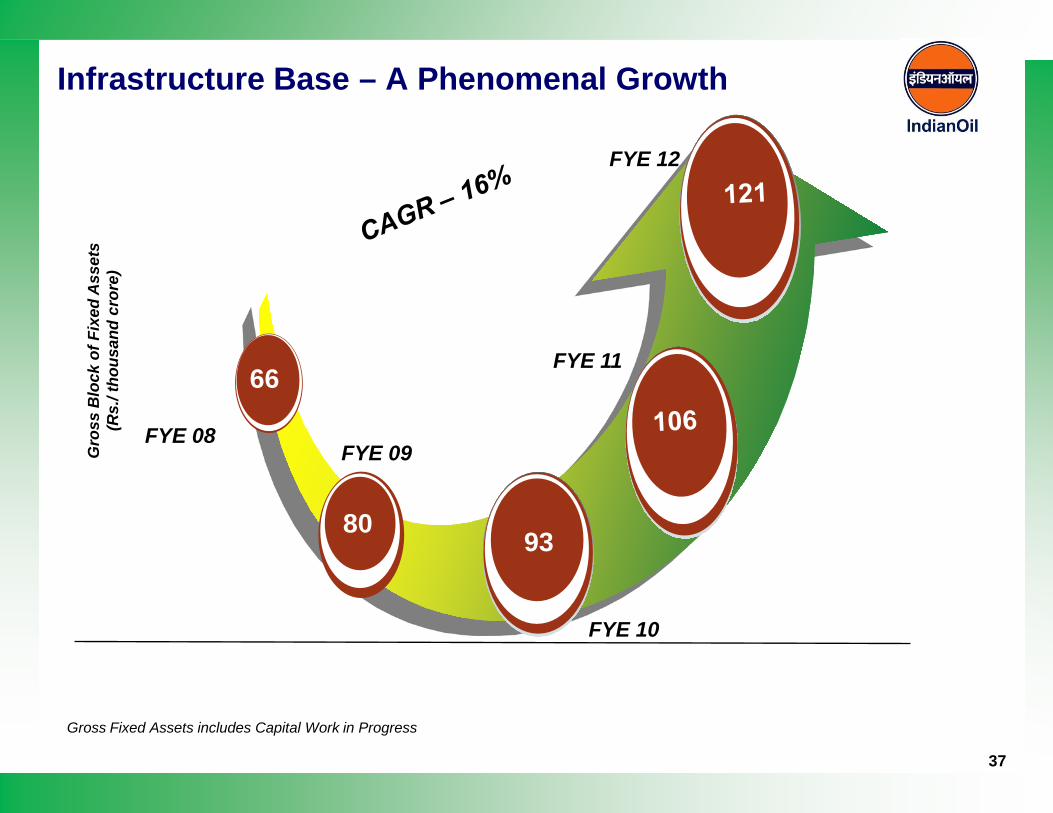
Infrastructure Base – A Phenomenal GrowthG
ross
Blo
ck o
f Fix
ed A
sset
s
(Rs.
/ tho
usan
d cr
ore)
Gross Fixed Assets includes Capital Work in Progress
FYE 08FYE 09
80
66
FYE 10
93
FYE 11
37
FYE 12

38
IOCL – An Overview
Oil Industry In India
IOCL’s Core Operations
Strategic Initiatives
Financial Performance
Nine Months Snapshot
Ongoing Projects
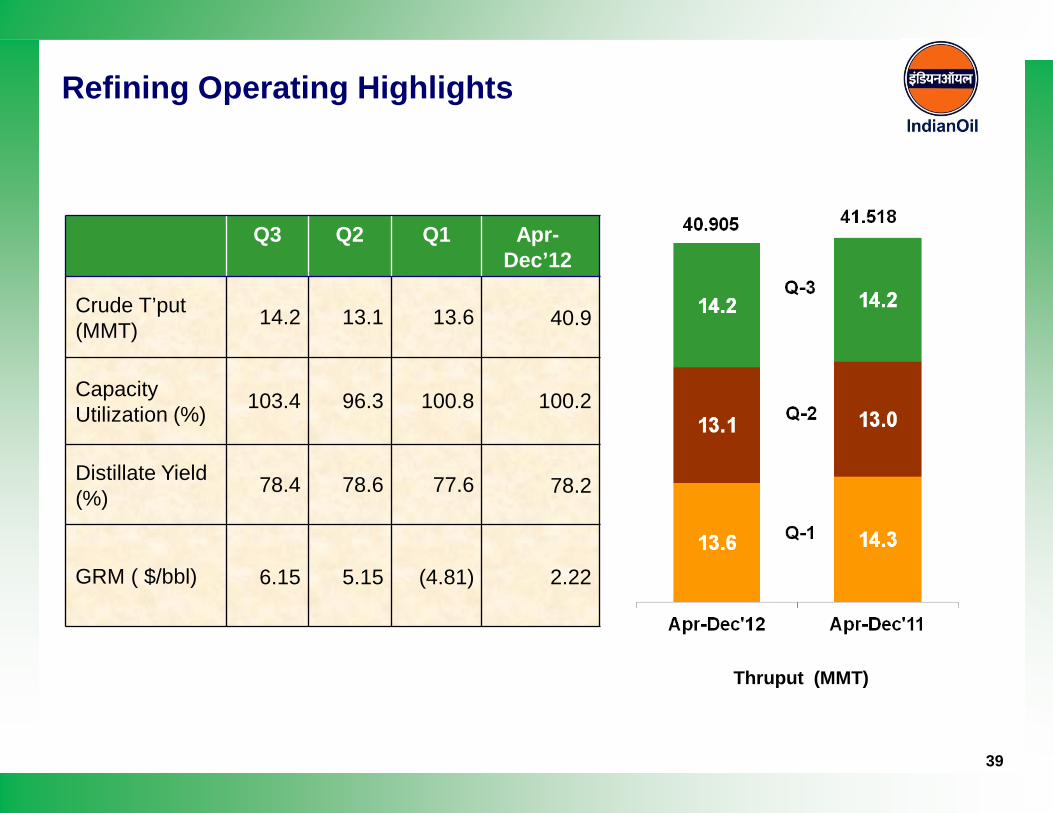
Refining Operating Highlights
39
Q3 Q2 Q1 Apr-Dec’12
Crude T’put (MMT) 14.2 13.1 13.6 40.9
Capacity Utilization (%) 103.4 96.3 100.8 100.2
Distillate Yield (%) 78.4 78.6 77.6 78.2
GRM ( $/bbl) 6.15 5.15 (4.81) 2.22
Thruput (MMT)
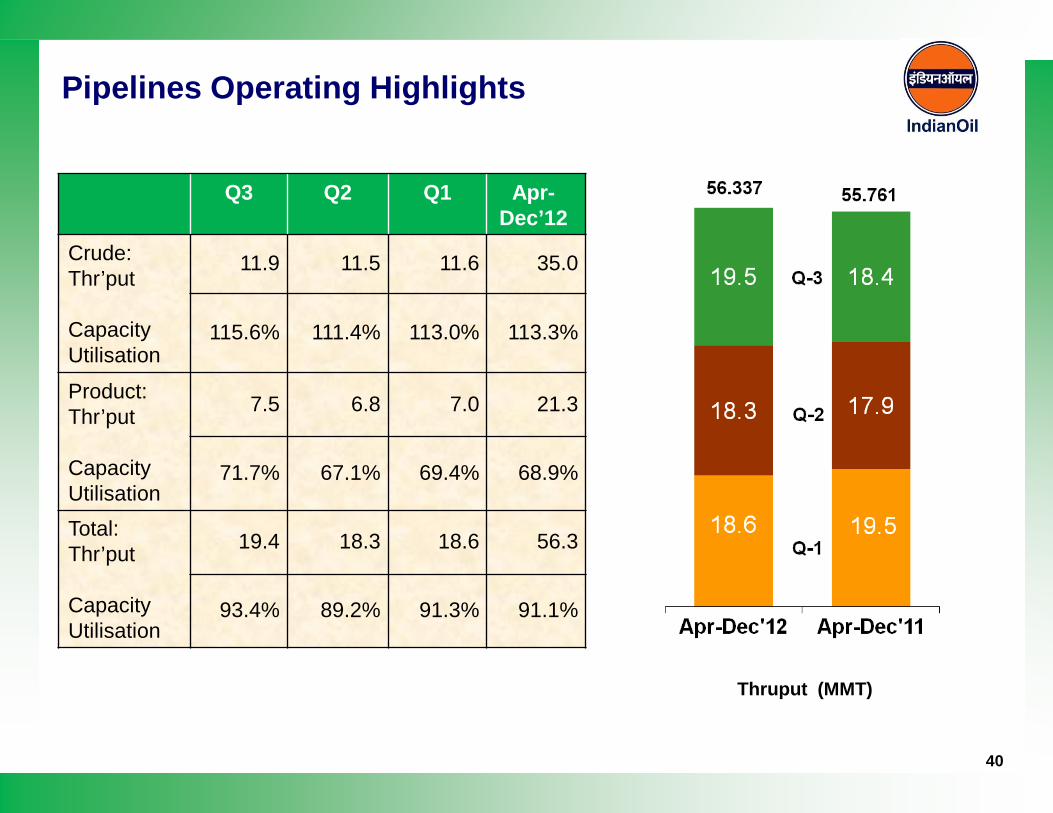
Pipelines Operating Highlights
40
Q3 Q2 Q1 Apr-Dec’12
Crude:Thr’put
Capacity Utilisation
11.9 11.5 11.6 35.0
115.6% 111.4% 113.0% 113.3%
Product:Thr’put
Capacity Utilisation
7.5 6.8 7.0 21.3
71.7% 67.1% 69.4% 68.9%
Total:Thr’put
Capacity Utilisation
19.4 18.3 18.6 56.3
93.4% 89.2% 91.3% 91.1%
Thruput (MMT)
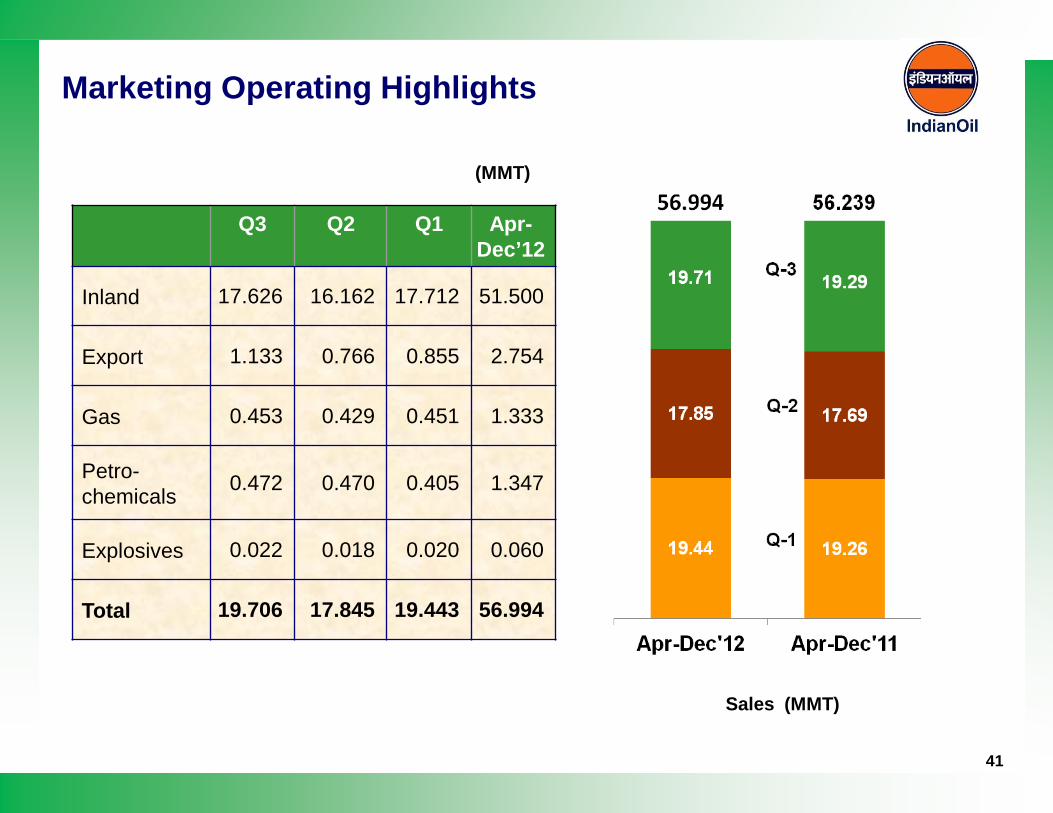
Marketing Operating Highlights
41
Q3 Q2 Q1 Apr-Dec’12
Inland 17.626 16.162 17.712 51.500
Export 1.133 0.766 0.855 2.754
Gas 0.453 0.429 0.451 1.333
Petro-chemicals 0.472 0.470 0.405 1.347
Explosives 0.022 0.018 0.020 0.060
Total 19.706 17.845 19.443 56.994
Sales (MMT)
(MMT)
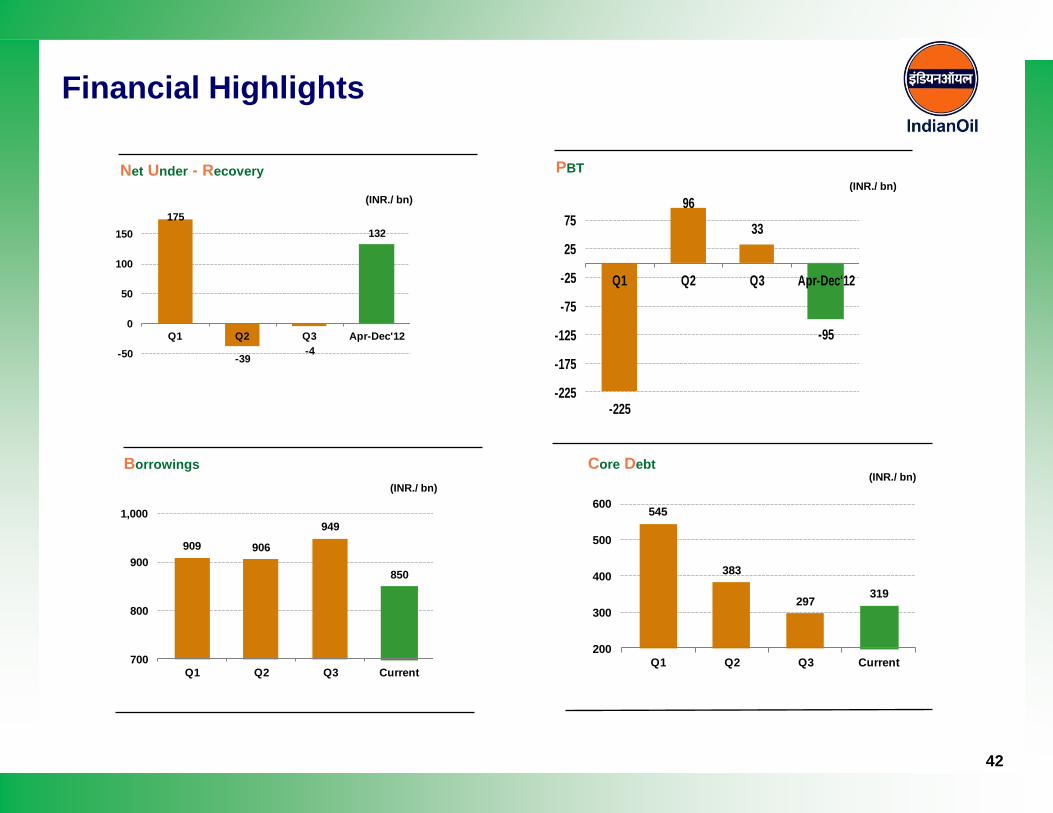
Financial Highlights
42
545
383
297319
200
300
400
500
600
Q1 Q2 Q3 Current
Core Debt
PBT
-225
96
33
-95
-225
-175
-125
-75
-25
25
75
Q1 Q2 Q3 Apr-Dec'12
(INR./ bn)
175
-39-4
132
-50
0
50
100
150
Q1 Q2 Q3 Apr-Dec'12
(INR./ bn)
Net Under - Recovery
909 906
949
850
700
800
900
1,000
Q1 Q2 Q3 Current
(INR./ bn)
Borrowings(INR./ bn)
43
IOCL – An Overview
Oil Industry In India
IOCL’s Core Operations
Strategic Initiatives
Financial Performance
Ongoing Projects
Nine Months Snapshot
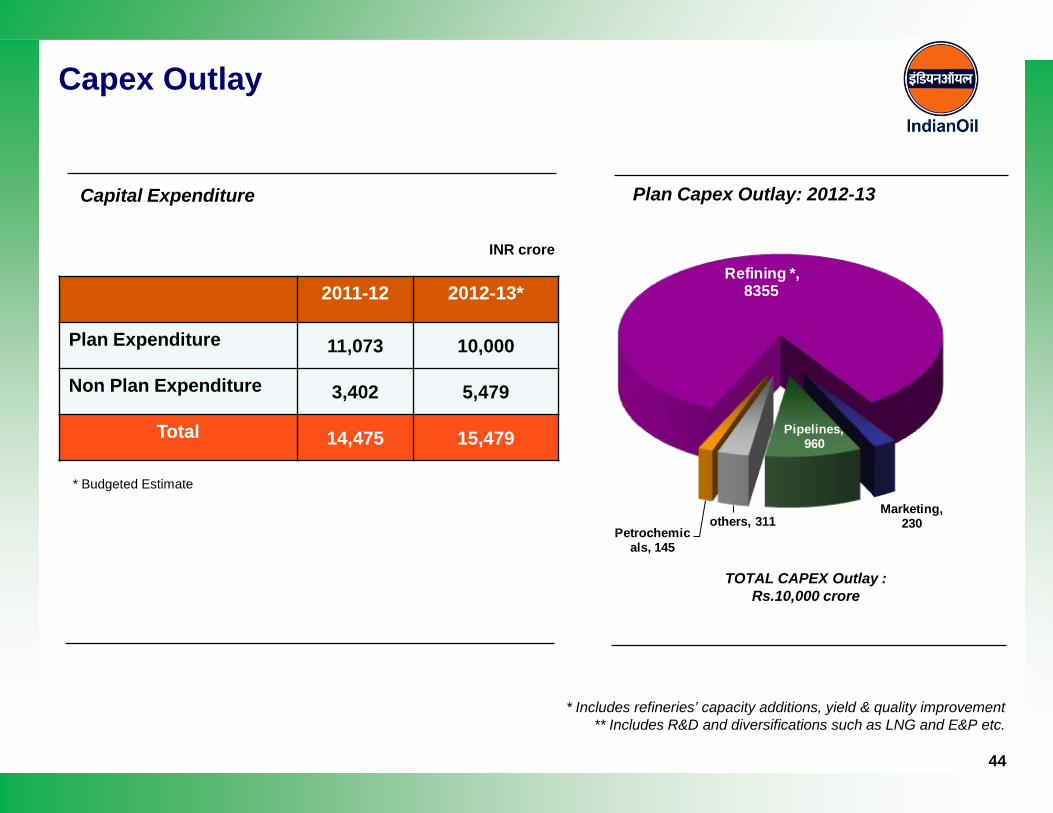
44
Petrochemicals, 145
Refining *, 8355
Marketing, 230
Pipelines, 960
others, 311
TOTAL CAPEX Outlay : Rs.10,000 crore
* Includes refineries’ capacity additions, yield & quality improvement** Includes R&D and diversifications such as LNG and E&P etc.
Plan Capex Outlay: 2012-13
Capex Outlay
INR crore
2011-12 2012-13*
Plan Expenditure 11,073 10,000
Non Plan Expenditure 3,402 5,479
Total 14,475 15,479
* Budgeted Estimate
Capital Expenditure
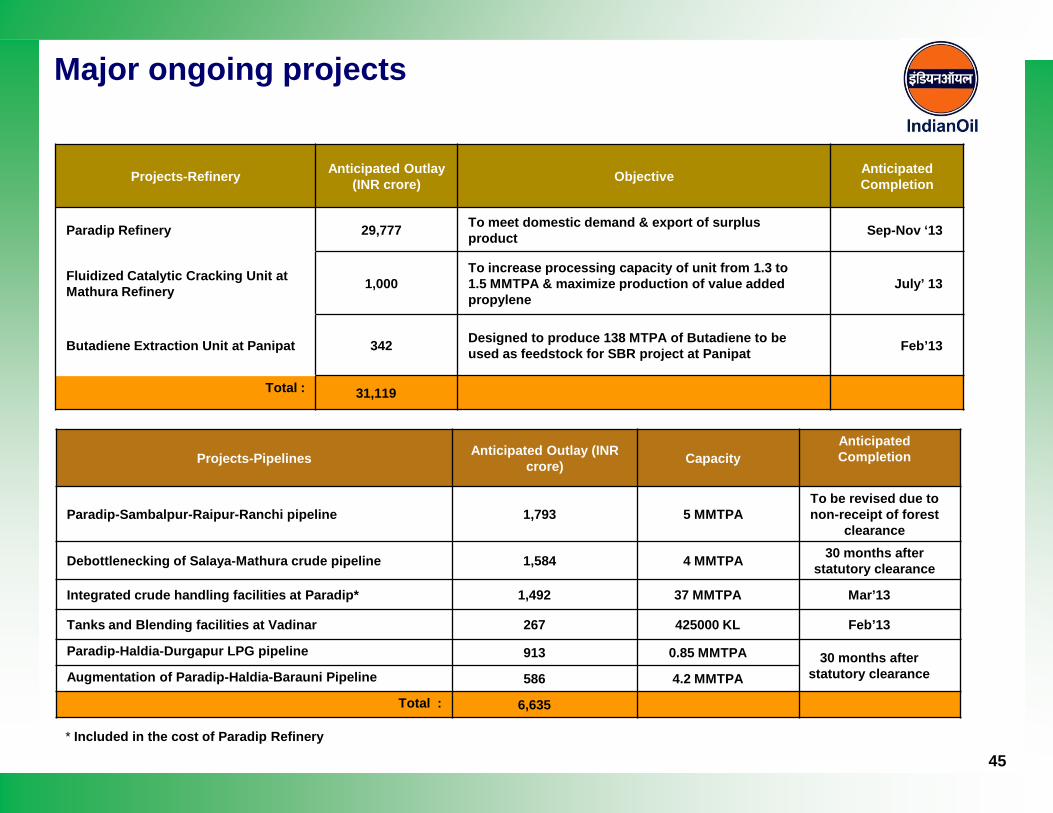
Major ongoing projects
Projects-Refinery Anticipated Outlay (INR crore) Objective Anticipated
Completion
Paradip Refinery 29,777 To meet domestic demand & export of surplus product Sep-Nov ‘13
Fluidized Catalytic Cracking Unit at Mathura Refinery 1,000
To increase processing capacity of unit from 1.3 to 1.5 MMTPA & maximize production of value added propylene
July’ 13
Butadiene Extraction Unit at Panipat 342 Designed to produce 138 MTPA of Butadiene to be used as feedstock for SBR project at Panipat Feb’13
Total : 31,119
Projects-Pipelines Anticipated Outlay (INR crore) Capacity
Anticipated Completion
Paradip-Sambalpur-Raipur-Ranchi pipeline 1,793 5 MMTPATo be revised due to non-receipt of forest
clearance
Debottlenecking of Salaya-Mathura crude pipeline 1,584 4 MMTPA 30 months after statutory clearance
Integrated crude handling facilities at Paradip* 1,492 37 MMTPA Mar’13
Tanks and Blending facilities at Vadinar 267 425000 KL Feb’13
Paradip-Haldia-Durgapur LPG pipeline 913 0.85 MMTPA 30 months after statutory clearanceAugmentation of Paradip-Haldia-Barauni Pipeline 586 4.2 MMTPA
Total : 6,635
45* Included in the cost of Paradip Refinery
Thank You