Investment Section - Phoenix, Arizona
12
Investment Section 41 Investment Section The Investment Section contains the Plan’s report on investment activity, its investment policies, and schedules of investment results and related information.
Transcript of Investment Section - Phoenix, Arizona
Investment Section
41
Investment Section
The Investment Section contains the Plan’s report on investment activity, its investment policies, and schedules of investment results and related information.

COPERS’ staff uses a documentimaging station to scan activemember documents, whichenables staff to quickly accessmember records in an efficientmanner. Paula Whisel,Secretary III, scans an activemember file.
Lollita Cordova,Administrative Assistant I,reviews a retirement benefitcalculation. As of June 30,2005, COPERS had 4,591retirees.
Investment Section 45
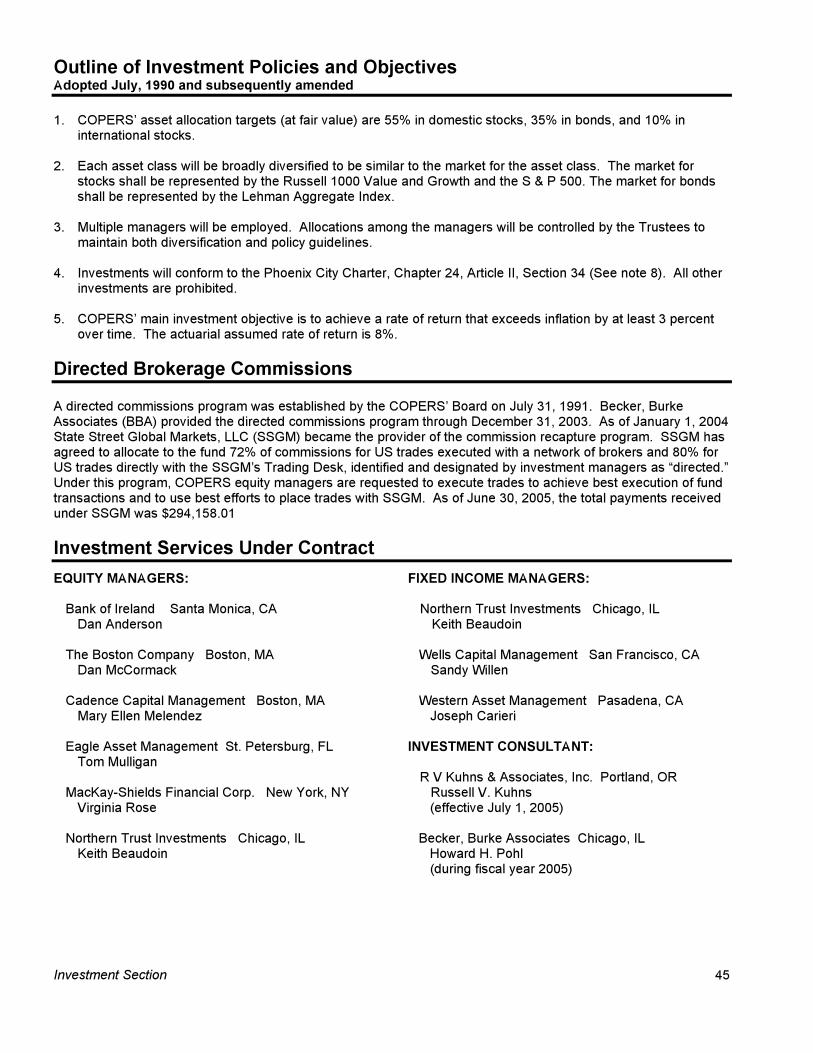
Outline of Investment Policies and Objectives Adopted July, 1990 and subsequently amended
1. COPERS’ asset allocation targets (at fair value) are 55% in domestic stocks, 35% in bonds, and 10% in international stocks.
2. Each asset class will be broadly diversified to be similar to the market for the asset class. The market for stocks shall be represented by the Russell 1000 Value and Growth and the S & P 500. The market for bonds shall be represented by the Lehman Aggregate Index.
3. Multiple managers will be employed. Allocations among the managers will be controlled by the Trustees to maintain both diversification and policy guidelines.
4. Investments will conform to the Phoenix City Charter, Chapter 24, Article II, Section 34 (See note 8). All other investments are prohibited.
5. COPERS’ main investment objective is to achieve a rate of return that exceeds inflation by at least 3 percent over time. The actuarial assumed rate of return is 8%.
Directed Brokerage Commissions
A directed commissions program was established by the COPERS’ Board on July 31, 1991. Becker, Burke Associates (BBA) provided the directed commissions program through December 31, 2003. As of January 1, 2004 State Street Global Markets, LLC (SSGM) became the provider of the commission recapture program. SSGM has agreed to allocate to the fund 72% of commissions for US trades executed with a network of brokers and 80% for US trades directly with the SSGM’s Trading Desk, identified and designated by investment managers as “directed.” Under this program, COPERS equity managers are requested to execute trades to achieve best execution of fund transactions and to use best efforts to place trades with SSGM. As of June 30, 2005, the total payments received under SSGM was $294,158.01
Investment Services Under Contract
EQUITY MANAGERS: FIXED INCOME MANAGERS:
Bank of Ireland Santa Monica, CA Northern Trust Investments Chicago, IL Dan Anderson Keith Beaudoin
The Boston Company Boston, MA Wells Capital Management San Francisco, CA Dan McCormack Sandy Willen
Cadence Capital Management Boston, MA Western Asset Management Pasadena, CA Mary Ellen Melendez Joseph Carieri
Eagle Asset Management St. Petersburg, FL INVESTMENT CONSULTANT: Tom Mulligan
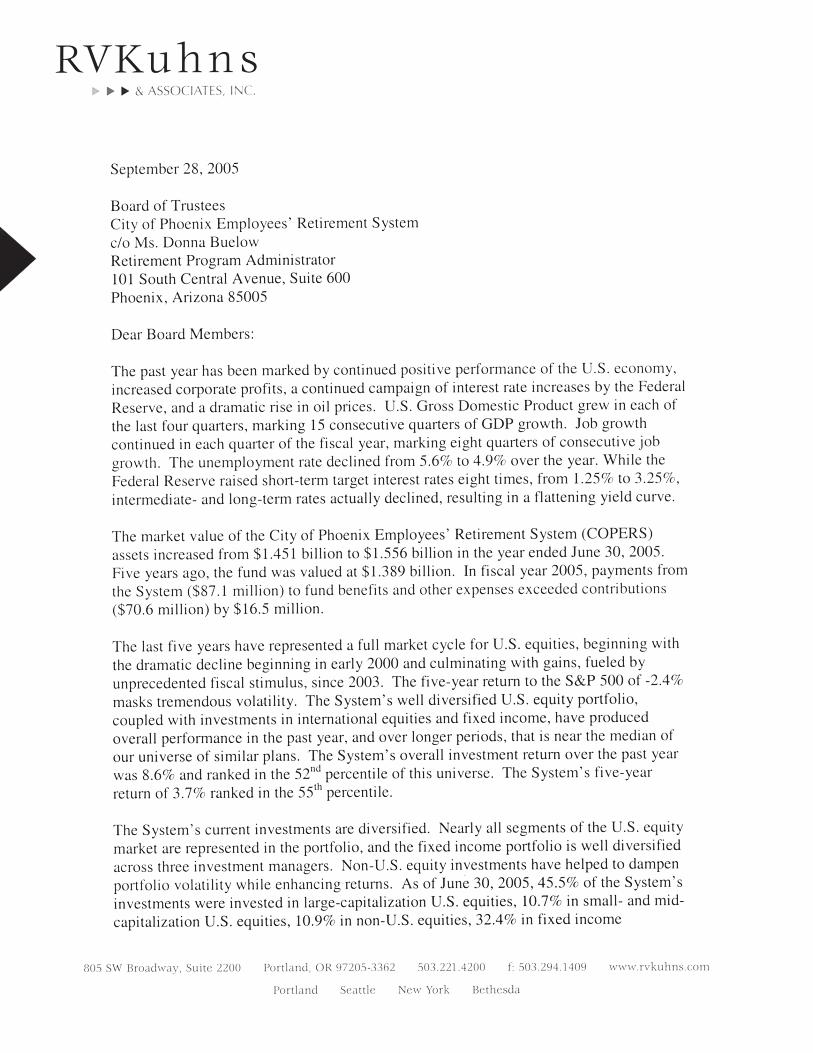
R V Kuhns & Associates, Inc. Portland, OR MacKay-Shields Financial Corp. New York, NY Russell V. Kuhns
Virginia Rose (effective July 1, 2005)
Northern Trust Investments Chicago, IL Becker, Burke Associates Chicago, IL Keith Beaudoin Howard H. Pohl
(during fiscal year 2005)
Investment Section 46
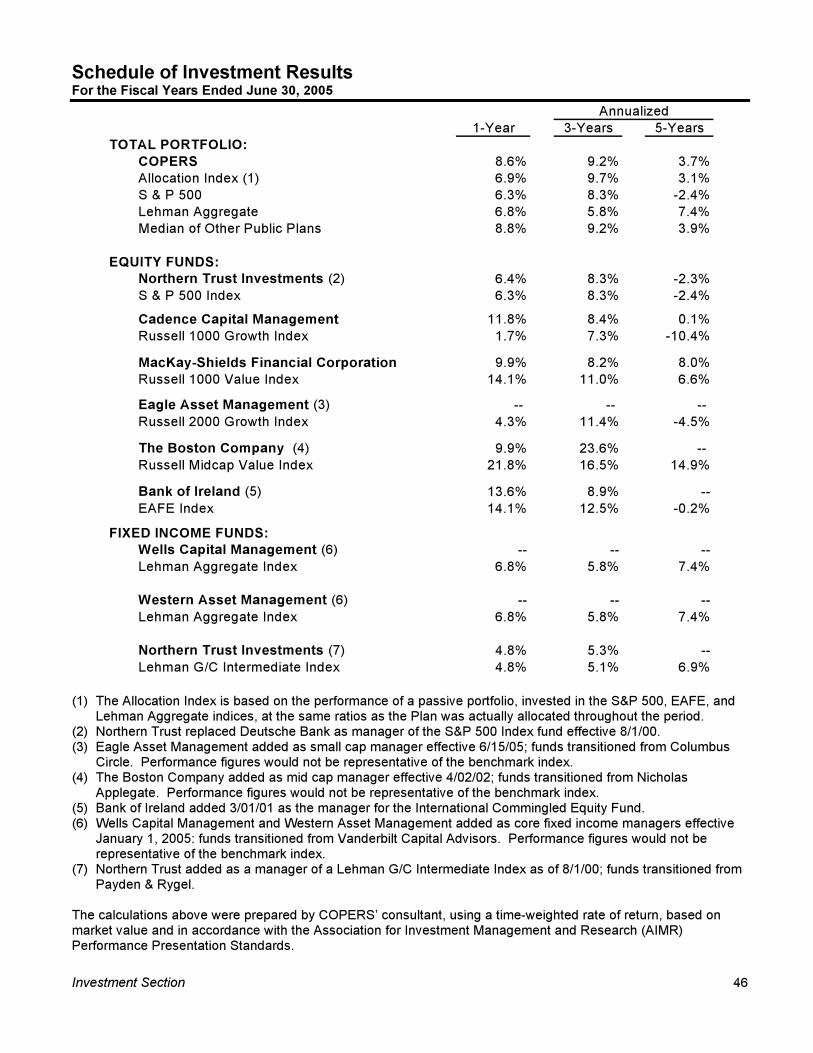
Schedule of Investment Results For the Fiscal Years Ended June 30, 2005
Annualized
1-Year 3-Years 5-Years
TOTAL PORTFOLIO:COPERS 8.6% 9.2% 3.7%
Allocation Index (1) 6.9% 9.7% 3.1%
S & P 500 6.3% 8.3% -2.4%
Lehman Aggregate 6.8% 5.8% 7.4%
Median of Other Public Plans 8.8% 9.2% 3.9%
EQUITY FUNDS:Northern Trust Investments (2) 6.4% 8.3% -2.3%
S & P 500 Index 6.3% 8.3% -2.4%
Cadence Capital Management 11.8% 8.4% 0.1%
Russell 1000 Growth Index 1.7% 7.3% -10.4%
MacKay-Shields Financial Corporation 9.9% 8.2% 8.0%
Russell 1000 Value Index 14.1% 11.0% 6.6%
Eagle Asset Management (3) -- -- --
Russell 2000 Growth Index 4.3% 11.4% -4.5%
The Boston Company (4) 9.9% 23.6% --
Russell Midcap Value Index 21.8% 16.5% 14.9%
Bank of Ireland (5) 13.6% 8.9% --
EAFE Index 14.1% 12.5% -0.2%
FIXED INCOME FUNDS:Wells Capital Management (6) -- -- --
Lehman Aggregate Index 6.8% 5.8% 7.4%
Western Asset Management (6) -- -- --
Lehman Aggregate Index 6.8% 5.8% 7.4%
Northern Trust Investments (7) 4.8% 5.3% --
Lehman G/C Intermediate Index 4.8% 5.1% 6.9%
(1) The Allocation Index is based on the performance of a passive portfolio, invested in the S&P 500, EAFE, and
Lehman Aggregate indices, at the same ratios as the Plan was actually allocated throughout the period.
(2) Northern Trust replaced Deutsche Bank as manager of the S&P 500 Index fund effective 8/1/00.
(3) Eagle Asset Management added as small cap manager effective 6/15/05; funds transitioned from Columbus
Circle. Performance figures would not be representative of the benchmark index.
(4) The Boston Company added as mid cap manager effective 4/02/02; funds transitioned from Nicholas
Applegate. Performance figures would not be representative of the benchmark index.
(5) Bank of Ireland added 3/01/01 as the manager for the International Commingled Equity Fund.
(6) Wells Capital Management and Western Asset Management added as core fixed income managers effective
January 1, 2005: funds transitioned from Vanderbilt Capital Advisors. Performance figures would not be
representative of the benchmark index.
(7) Northern Trust added as a manager of a Lehman G/C Intermediate Index as of 8/1/00; funds transitioned from
Payden & Rygel.
The calculations above were prepared by COPERS’ consultant, using a time-weighted rate of return, based on
market value and in accordance with the Association for Investment Management and Research (AIMR)
Performance Presentation Standards.
Investment Section 47
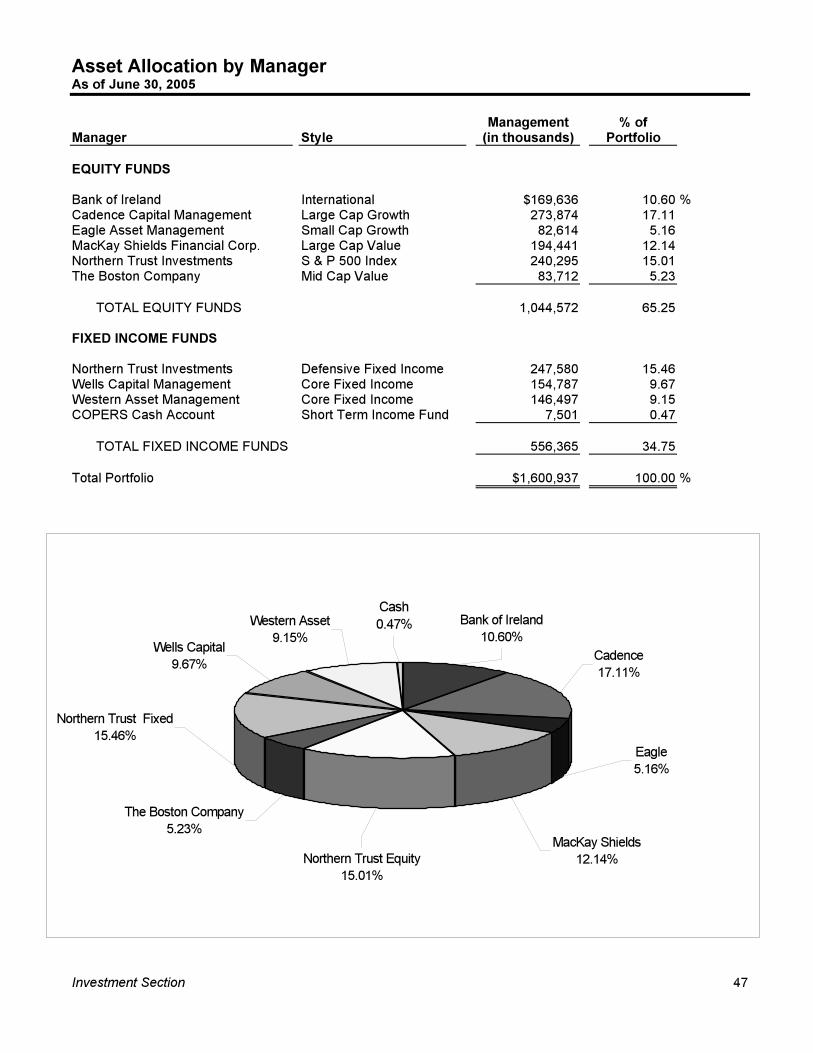
Asset Allocation by Manager As of June 30, 2005
Management % of Manager Style (in thousands) Portfolio
EQUITY FUNDS
Bank of Ireland International $169,636 10.60 % Cadence Capital Management Large Cap Growth 273,874 17.11Eagle Asset Management Small Cap Growth 82,614 5.16MacKay Shields Financial Corp. Large Cap Value 194,441 12.14Northern Trust Investments S & P 500 Index 240,295 15.01The Boston Company Mid Cap Value 83,712 5.23
TOTAL EQUITY FUNDS 1,044,572 65.25
FIXED INCOME FUNDS
Northern Trust Investments Defensive Fixed Income 247,580 15.46Wells Capital Management Core Fixed Income 154,787 9.67Western Asset Management Core Fixed Income 146,497 9.15COPERS Cash Account Short Term Income Fund 7,501 0.47
TOTAL FIXED INCOME FUNDS 556,365 34.75
Total Portfolio $1,600,937 100.00 %
Cash0.47%
Wells Capital9.67% Cadence
17.11%
MacKay Shields12.14%Northern Trust Equity
15.01%
Eagle5.16%
The Boston Company5.23%
Bank of Ireland10.60%
Northern Trust Fixed15.46%
Western Asset9.15%
Investment Section 48
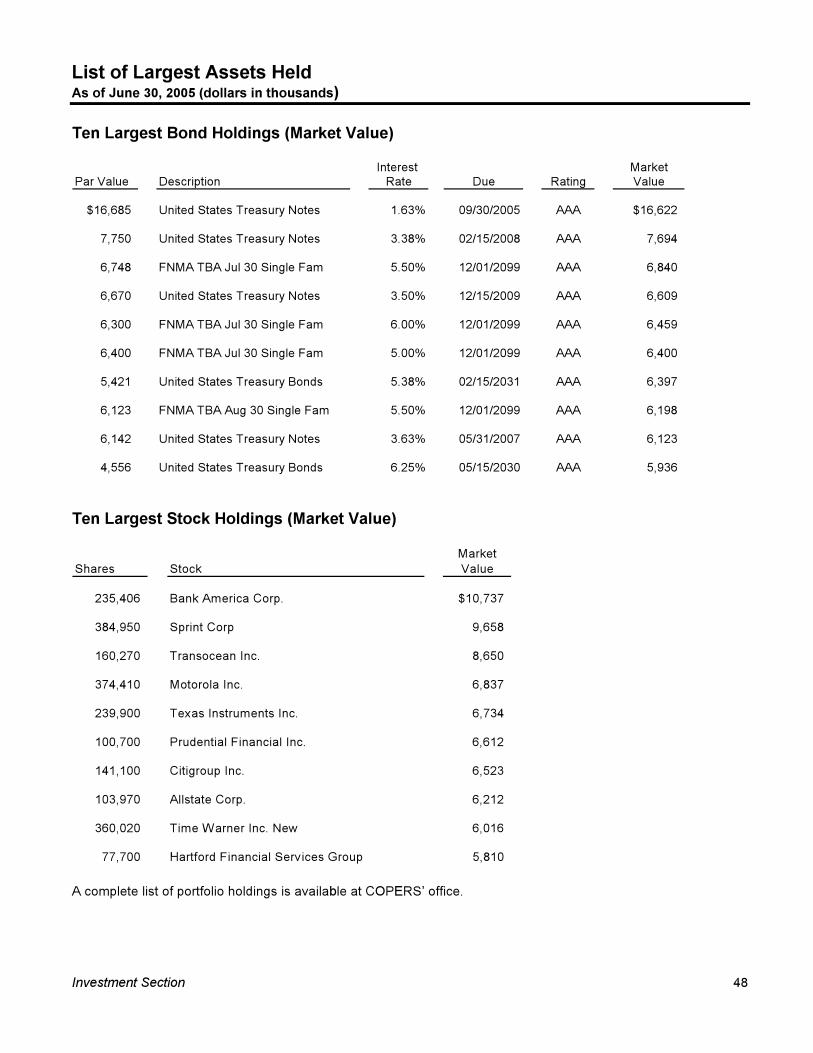
List of Largest Assets Held As of June 30, 2005 (dollars in thousands)
Ten Largest Bond Holdings (Market Value)
Interest MarketPar Value Description Rate Due Rating Value
$16,685 United States Treasury Notes 1.63% 09/30/2005 AAA $16,622
7,750 United States Treasury Notes 3.38% 02/15/2008 AAA 7,694
6,748 FNMA TBA Jul 30 Single Fam 5.50% 12/01/2099 AAA 6,840
6,670 United States Treasury Notes 3.50% 12/15/2009 AAA 6,609
6,300 FNMA TBA Jul 30 Single Fam 6.00% 12/01/2099 AAA 6,459
6,400 FNMA TBA Jul 30 Single Fam 5.00% 12/01/2099 AAA 6,400
5,421 United States Treasury Bonds 5.38% 02/15/2031 AAA 6,397
6,123 FNMA TBA Aug 30 Single Fam 5.50% 12/01/2099 AAA 6,198
6,142 United States Treasury Notes 3.63% 05/31/2007 AAA 6,123
4,556 United States Treasury Bonds 6.25% 05/15/2030 AAA 5,936
Ten Largest Stock Holdings (Market Value)
MarketShares Stock Value
235,406 Bank America Corp. $10,737
384,950 Sprint Corp 9,658
160,270 Transocean Inc. 8,650
374,410 Motorola Inc. 6,837
239,900 Texas Instruments Inc. 6,734
100,700 Prudential Financial Inc. 6,612
141,100 Citigroup Inc. 6,523
103,970 Allstate Corp. 6,212
360,020 Time Warner Inc. New 6,016
77,700 Hartford Financial Services Group 5,810
A complete list of portfolio holdings is available at COPERS’ office.
Investment Section 49
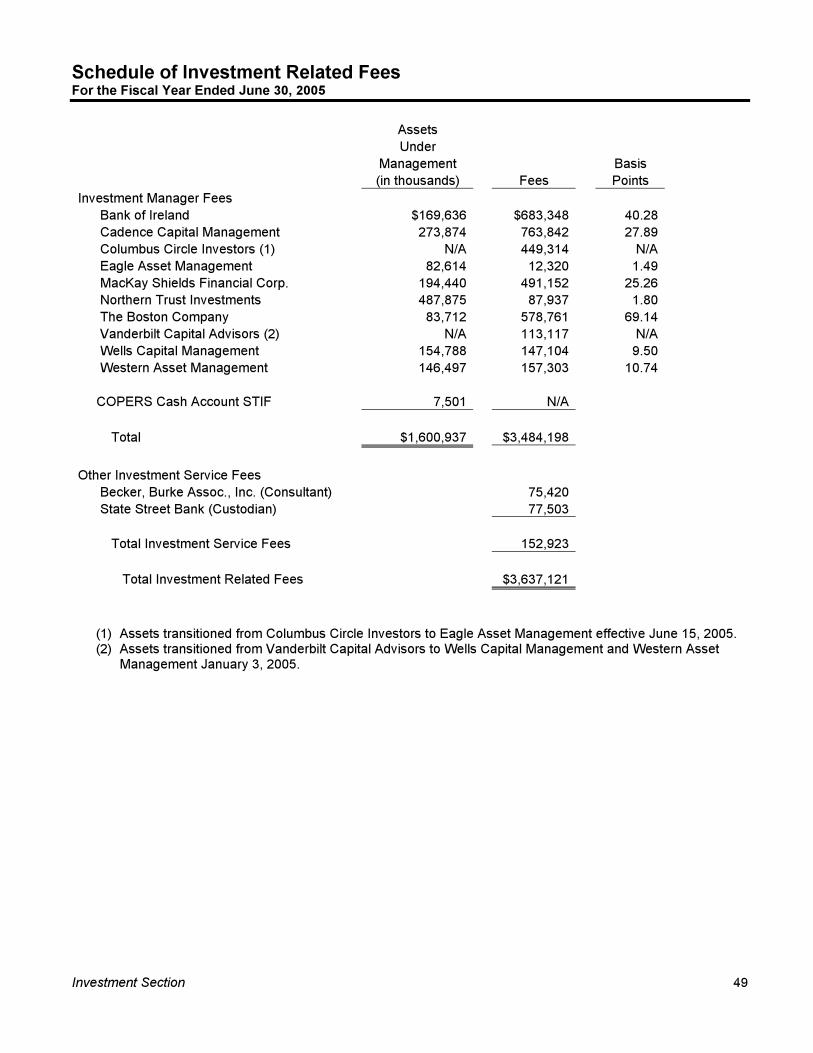
Schedule of Investment Related Fees For the Fiscal Year Ended June 30, 2005
Assets Under
Management Basis (in thousands) Fees Points
Investment Manager Fees Bank of Ireland $169,636 $683,348 40.28 Cadence Capital Management 273,874 763,842 27.89 Columbus Circle Investors (1) N/A 449,314 N/A Eagle Asset Management 82,614 12,320 1.49 MacKay Shields Financial Corp. 194,440 491,152 25.26 Northern Trust Investments 487,875 87,937 1.80 The Boston Company 83,712 578,761 69.14 Vanderbilt Capital Advisors (2) N/A 113,117 N/A Wells Capital Management 154,788 147,104 9.50 Western Asset Management 146,497 157,303 10.74
COPERS Cash Account STIF 7,501 N/A
Total $1,600,937 $3,484,198
Other Investment Service Fees Becker, Burke Assoc., Inc. (Consultant) 75,420 State Street Bank (Custodian) 77,503
Total Investment Service Fees 152,923
Total Investment Related Fees $3,637,121
(1) Assets transitioned from Columbus Circle Investors to Eagle Asset Management effective June 15, 2005. (2) Assets transitioned from Vanderbilt Capital Advisors to Wells Capital Management and Western Asset
Management January 3, 2005.
Investment Section 50
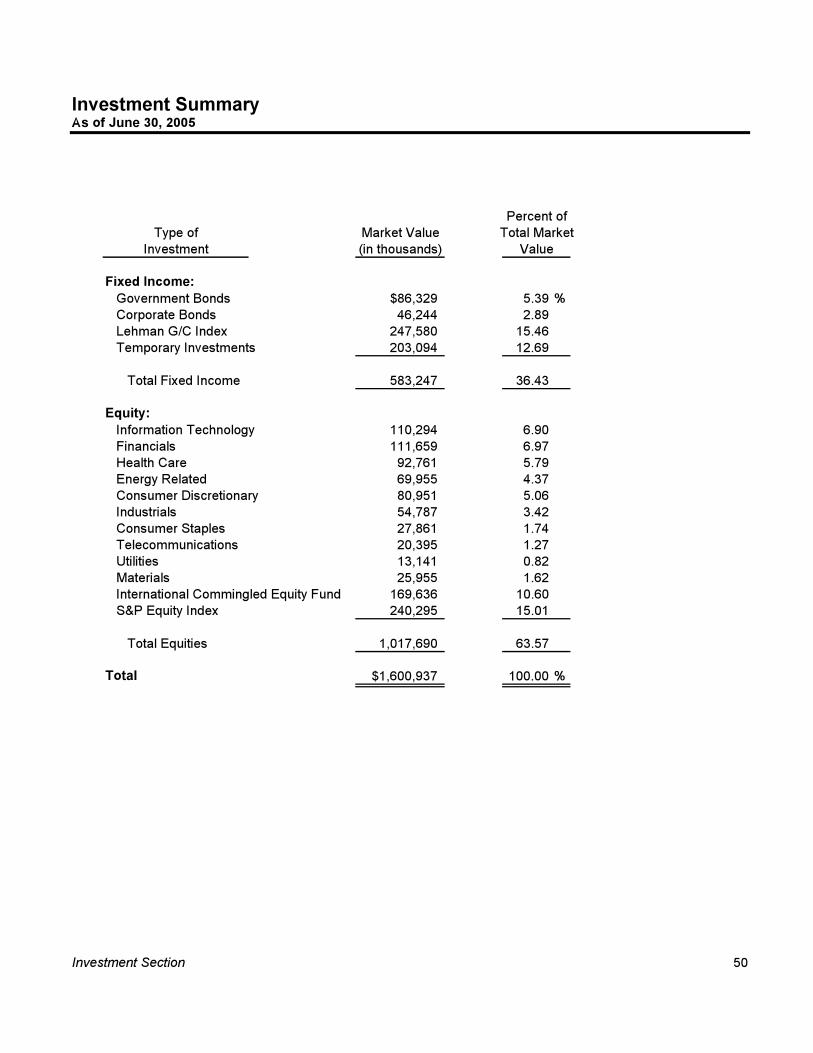
Investment Summary As of June 30, 2005
Percent ofType of Market Value Total Market
Investment (in thousands) Value
Fixed Income: Government Bonds $86,329 5.39 % Corporate Bonds 46,244 2.89 Lehman G/C Index 247,580 15.46 Temporary Investments 203,094 12.69
Total Fixed Income 583,247 36.43
Equity: Information Technology 110,294 6.90 Financials 111,659 6.97 Health Care 92,761 5.79 Energy Related 69,955 4.37 Consumer Discretionary 80,951 5.06 Industrials 54,787 3.42 Consumer Staples 27,861 1.74 Telecommunications 20,395 1.27 Utilities 13,141 0.82 Materials 25,955 1.62 International Commingled Equity Fund 169,636 10.60 S&P Equity Index 240,295 15.01
Total Equities 1,017,690 63.57
Total $1,600,937 100.00 %
Investment Section 51
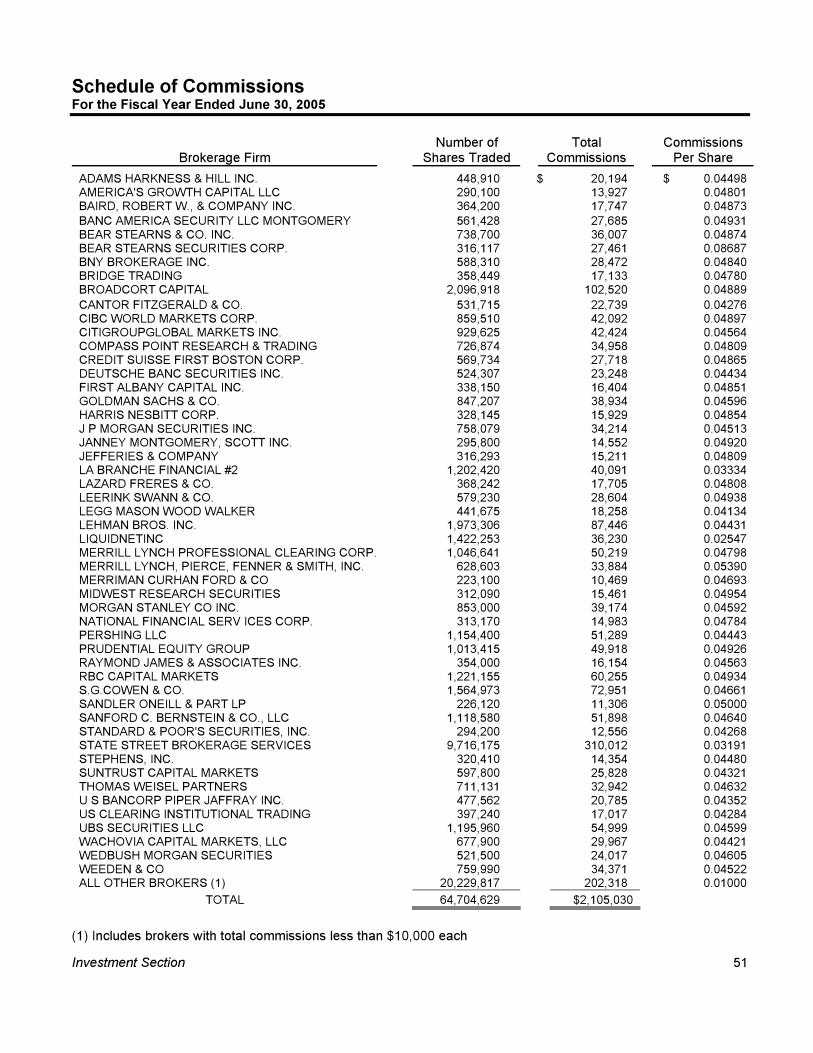
Schedule of Commissions For the Fiscal Year Ended June 30, 2005
Brokerage Firm Number of
Shares Traded Total
Commissions Commissions
Per Share ADAMS HARKNESS & HILL INC. 448,910 $ 20,194 $ 0.04498 AMERICA'S GROWTH CAPITAL LLC 290,100 13,927 0.04801 BAIRD, ROBERT W., & COMPANY INC. 364,200 17,747 0.04873 BANC AMERICA SECURITY LLC MONTGOMERY 561,428 27,685 0.04931 BEAR STEARNS & CO. INC. 738,700 36,007 0.04874 BEAR STEARNS SECURITIES CORP. 316,117 27,461 0.08687 BNY BROKERAGE INC. 588,310 28,472 0.04840 BRIDGE TRADING 358,449 17,133 0.04780 BROADCORT CAPITAL 2,096,918 102,520 0.04889 CANTOR FITZGERALD & CO. 531,715 22,739 0.04276 CIBC WORLD MARKETS CORP. 859,510 42,092 0.04897 CITIGROUPGLOBAL MARKETS INC. 929,625 42,424 0.04564 COMPASS POINT RESEARCH & TRADING 726,874 34,958 0.04809 CREDIT SUISSE FIRST BOSTON CORP. 569,734 27,718 0.04865 DEUTSCHE BANC SECURITIES INC. 524,307 23,248 0.04434 FIRST ALBANY CAPITAL INC. 338,150 16,404 0.04851 GOLDMAN SACHS & CO. 847,207 38,934 0.04596 HARRIS NESBITT CORP. 328,145 15,929 0.04854 J P MORGAN SECURITIES INC. 758,079 34,214 0.04513 JANNEY MONTGOMERY, SCOTT INC. 295,800 14,552 0.04920 JEFFERIES & COMPANY 316,293 15,211 0.04809 LA BRANCHE FINANCIAL #2 1,202,420 40,091 0.03334 LAZARD FRERES & CO. 368,242 17,705 0.04808 LEERINK SWANN & CO. 579,230 28,604 0.04938 LEGG MASON WOOD WALKER 441,675 18,258 0.04134 LEHMAN BROS. INC. 1,973,306 87,446 0.04431 LIQUIDNETINC 1,422,253 36,230 0.02547 MERRILL LYNCH PROFESSIONAL CLEARING CORP. 1,046,641 50,219 0.04798 MERRILL LYNCH, PIERCE, FENNER & SMITH, INC. 628,603 33,884 0.05390 MERRIMAN CURHAN FORD & CO 223,100 10,469 0.04693 MIDWEST RESEARCH SECURITIES 312,090 15,461 0.04954 MORGAN STANLEY CO INC. 853,000 39,174 0.04592 NATIONAL FINANCIAL SERV ICES CORP. 313,170 14,983 0.04784 PERSHING LLC 1,154,400 51,289 0.04443 PRUDENTIAL EQUITY GROUP 1,013,415 49,918 0.04926 RAYMOND JAMES & ASSOCIATES INC. 354,000 16,154 0.04563 RBC CAPITAL MARKETS 1,221,155 60,255 0.04934 S.G.COWEN & CO. 1,564,973 72,951 0.04661 SANDLER ONEILL & PART LP 226,120 11,306 0.05000 SANFORD C. BERNSTEIN & CO., LLC 1,118,580 51,898 0.04640 STANDARD & POOR'S SECURITIES, INC. 294,200 12,556 0.04268 STATE STREET BROKERAGE SERVICES 9,716,175 310,012 0.03191 STEPHENS, INC. 320,410 14,354 0.04480 SUNTRUST CAPITAL MARKETS 597,800 25,828 0.04321 THOMAS WEISEL PARTNERS 711,131 32,942 0.04632 U S BANCORP PIPER JAFFRAY INC. 477,562 20,785 0.04352 US CLEARING INSTITUTIONAL TRADING 397,240 17,017 0.04284 UBS SECURITIES LLC 1,195,960 54,999 0.04599 WACHOVIA CAPITAL MARKETS, LLC 677,900 29,967 0.04421 WEDBUSH MORGAN SECURITIES 521,500 24,017 0.04605 WEEDEN & CO 759,990 34,371 0.04522 ALL OTHER BROKERS (1) 20,229,817 202,318 0.01000
TOTAL 64,704,629 $2,105,030
(1) Includes brokers with total commissions less than $10,000 each

Investment Section 52
Amber Cole (far left),Administrative Assistant II, AnnaMartinez, Operations Analyst andBruce Smith, IT Service Specialist,discuss a performancemanagement report.
Gayle Richmond, AdministrativeAide, prepares for a counselingsession with an active memberregarding his upcomingretirement.