Investment Research Challenge Student Research - CFA · PDF fileCFA Society Sri Lanka...
29
CFA Institute Research Challenge Hosted in Sri Lanka University of Colombo
Transcript of Investment Research Challenge Student Research - CFA · PDF fileCFA Society Sri Lanka...

CFA Institute Research Challenge Hosted in
Sri Lanka
University of Colombo

University of Colombo Student Research This report is published for educational purposes only by
students competing in the
CFA Society Sri Lanka Investment Research Challenge, part of
CFA Institute Global Investment Research Challenge
Important disclosures appear at the back of this report 1
Source: Team estimates, Company data
Ticker: DIAL.SL Recommendation: BUY
Price: LKR 8.50 Price Target: LKR 10.96
Highlights
We issue a buy recommendation for the stock of Dialog Axiata PLC (DIAL) of LKR 10.96: The
current trading price is leading to an upside of 29%. The growth of revenue between the years of
2012A to 2016E is CAGR 12.2%. Here it is noticeable that the mobile segment revenue is the main
contributor towards the growth of revenue with a prior breakeven all new subscriber revenue would
directly contribute to profits of the business. The trailing P/E stands at 11.1 and EV/EBITDA at 4.5.
The Company is a typical dividend-paying firm, with dividend yield of 4% in 2012.
Revenue growth prospects: Keeping up with trends and innovations as a service provider in the ever
changing technology business DIAL is able to maintain a steady growth in its revenue portfolio. The
significant YOY growth in 2012A of 24.1% in revenue is expected the slow down to a level of 11%
in 2013E. The expected large investment in data sector makes a significant impact on this change. The
growth in revenue in the mobile and DBN sectors which generate revenue with data, solely
contributes to YOY 10.4% in 2013E. (1) 4G/LTE introduction to increase the data speed and usage
of customers and continuous investments in infrastructure; (2) Innovations in the e-commerce
segment of the business; (3) Strategic investments in Information Communication Technology, are all
contributors towards this growth.
Strong financial position: Liquidity position of dialog is maintained continuously at a stable rate
therefore, there would be a sound business continuity of DIAL. EBITDA margin amounting to 37.7%
in 2013E to 48.3% in 2018E. The ROA is continued to grow from 7%-11% in 2013E to 2018E. EPS
of 2012 0.75 is expected to show positive signs at 2018E at LKR 2.09.
Main risk issues are: the changes made to the floor price by the TRC, relaxing the price band,
USD/LKR exchange rate fluctuation, technological changes, first mover innovations duplication, and
macro economic conditions affecting customer trends.
Forecast Summary
2011A 2012A 2013E 2014E 2015E 2016E 2017E
Revenue (MN) 45,412 56,345 62,552 71,443 81,146 89,260 96,401
EBITDA (MN) 16,511 18,357 23,568 29,059 34,968 39,978 45,101
PAT (MN) 4,869 6,030 4,263 7,336 10,703 12,450 14,598
Per share(LKR)
Earnings 0.61 0.75 0.53 0.92 1.34 1.56 1.83
Dividend 0.25 0.34 0.25 0.35 0.42 0.63 0.81
Returns (%)
Total Asset 7% 7% 5% 7% 9% 10% 11%
Total Equity 15% 16% 11% 16% 20% 20% 21%
Dialog Axiata PLC
Date 30/09/2013
MARKET DATA
52 Week Price Range LKR 9.00/7. 80
Dividend Yield 2012 4%
Shares Outstanding 7,985,206,000
(Excluding the
ESOS)
Market
Capitalization (Rs)
66,778,984,448
Average annual
Volume
166,457,872
As a % of
outstanding shares
2.08%
Parent Holding 83.3%
Public float 14.7%
FINANCIAL DATA
EBITDA/Revenue
(X)
33%
PB(x) 1.8 times
PER (X) 11.1
EV/EBITDA (X) 4.5
Earnings per share .75
Dividend per share .33
Gearing 39%
Debt to Total Capital 1.44 times
Return On Equity 16.2% Source: Company data, CSE
Source: CSE 2013 DATA
Exchange: Colombo Stock Exchange
Sector/Industry: Telecommunication

CFA Society Sri Lanka Investment Research Challenge Student Research October 1, 2013
2
Figure 1- EBITDA
margin
Source: Team estimates
Figure 2 – Coverage
of Dialog
Source: Company data
Figure 3 - Dividend per
share and dividend
payout ratio
Source: Team estimates
Investment Summary
Bullish on DIAL
We issue a buy recommendation on DIAL with a target price of LKR 10.96 an upside movement of 29%. DIAL is
increasingly investing in infrastructure supporting a boom in the small screen data and large screen data revenue
segments together with the recent joint venture with anything.lk in to the E-commerce market. DIAL’s optimistic
movement as the countries competitive quad player seeks to reap the benefits of improving economic and political
stability. Therefore we expect DIAL which is currently trading at a 22% discounted EV/EBITDA and 44%
discounted PE to see a growth in the stock price.
Valuation method
As our primary valuation method we utilize the Discounted Cash Flow (DCF) and peer comparison method is
applied as a secondary valuation to support the value arrived in the primary valuation. In our opinion DCF
correctly reflects the value of a cash rich industry with heavy investments to drive revenue.
Reinvention through strategic acquisitions
In recent years group capital expenditure was directed mainly towards the expansion of High Speed Mobile
Broadband Services, Fixed Broadband services, and Optical Fiber Network. 2012 saw an assortment of business
creation initiatives including the acquisition of Suntel Limited, launch of eZ Cash - Sri Lanka’s first Mobile
Money and Payment service, acquiring a stake in Digital Commerce Lanka (Private) Limited, acquisition of Sky
TV, introduction of per-day Prepaid Television Service and launching HD Television services. We believe these
ventures signify Dialog’s foray in to the space of Digital Commerce and the strategic intent of the Group to
expand its operations in the future through the use of other well established organizations.
Prospects in telecommunications sector
As a revenue driven business mobile services subscribers have reached a level in which penetration has reach 96%
in the world. With the high entry barriers in fixed costs the threat of new competitor entering into the business is
minimum. The large number of player in the sector creates a favorable rivalry which leads towards a more
creativity and innovation in the telco industry. The governments’ encouragement towards the industry further
strengths the growth potential of the industry with the government’s economic policy paper(Road Map
2013)stating that Sri Lanka can reach the goal of becoming a billion dollar IT/BPO industry by 2016.
Importantly, ICT literacy has reached 40 % from around 5% in 2005.
Financial position
As the largest FDI investment in Sri Lanka DIAL is a listed company with high foreign transactions in terms of
financials. The confidence foreign banks have on the parent with a high credit rating gives DIAL the opportunity
to borrow foreign sources with low interest rates. The large debt portfolio (USD 200Mn at low interest rate) which
is obtained by DIAL for expansion of the diversity of the business gives investors the signals that the business
would grow with high liquidity. As the OCBC bank loan matures in 2018E to be USD 200MN, DIAL shows that
it is capable of making timely payments for these loans.
Stable dividend distribution
With investors being concerned on the return on individual investments the dividend payment for FY12 was LKR
.33 with a dividend payout ratio of 45%. It is stated that for future investments internally generated funds would
be used therefore, a significant effect on the dividend payout could be expected. Therefore, the dividend payout
ratio is expected to drop to 37% 2014E. But dividend per share for 2014E to be at a rate of LKR .35 making sure
that the individual investors are kept satisfied with their long term investment.
Downside of the valuation
In the background of an upside movement in the share price investors should be aware of the possible adverse
influences from high level of capital expenditure incurred, the over dependence on the CEO of DIAL as the
visionary leader while looking at the parent company owning 83% stake of DIAL which has brought cheap
financing sources to DIAL thus far and a brand name.

CFA Society Sri Lanka Investment Research Challenge
Student Research October 1, 2013
3
Table 1 - Valuation
DCF Valuation LKR 10.96
Relative
Valuation
(SLTL)
LKR12.70
Relative
Valuation
(Foreign)
LKR14.60
Source: Team estimates
Table 2 - Market turnover
SLTL DIAL
WTD 3,191 203,309
MTD 99,362 968,895
YTD 3,092,460 166,946,512
Source: Team estimates
Table 3 - WACC
Rf 12.0%
Beta 1.1
Market Risk Premium 9%
Tax Adjusted Kd 13%
Source: Team estimates
Table 4 - Cost of debt
Interest Weight
Local
Loan 20% 30%
Foreign
Loan 10% 70%
Source: Team estimates
Figure 4 - DIAL Share price movement and Information Flow
Source: CSE data (2012-2013)
Valuation
We predict a 29% upside movement in DIAL with share price moving up to LKR 10.96. As our primary valuation
we have used the DCF method and in order to support our recommendation and for completeness a peer
comparison with a relative valuation is obtained. However we do not base our recommendation on the relative
valuation due to;
High investments required - Telco industry requires heavy investments to keep pace with the
advancements in the environment in order to support a growth in its top-line. Therefore a valuation based
on cash flow would be appropriate more than a relative valuation based on earnings.
Inadequate comparisons – SLTL is the only comparable listed company in the CSE. However firstly it is
49.5% government control with high political influence therefore price behaviors would highly sensitive to
any political information and share prices movement would be seen as slightly distorted. Secondly looking
at the turnover SLTL is comparatively is a low liquid stock with low level of turnover. (table 2) Therefore
it is SLTL price being correctly priced is debatable.
DCF Valuation
We use the Free Cash Flow to Firm (FCFF) in our valuation model as DIAL is expecting changes in its capital
structure firstly since we are using historical data to predict the Free Cash Flow (FCF) FCFF growth rate would
reflect fundamentals more clearly than FCFE which reflect fluctuating amounts in leverage, secondly in a forward
looking context the required return on equity might be expected to be more sensitive to changes in leverage than
changes in the WACC, making the use of a constant discount rate.
WACC – DIAL is a low geared company with positive credit ratings. Management is promising a target capital
structure of 50:50 Debt to Equity capital structure. (Appendix 06. A)
Ke (Cost of Equity) - We have utilized the CAPM method in estimating the WACC as we expect the market to be
efficient. Therefore we have used the 5 year T- bond rate(11.17%) of 12.0% adjusted for taxes, and a Beta value of
1.1 using the past data however as the industry matures we expect beta to vary between 0.9 – 1.1. Risk Premium
(Rp) of 9% was assumed based on country risk premium (Appendix 06. B)
Kd (Cost of Debt) – DIAL is enjoying low cost of debt due to the positive credit ratings (AAA(lka) – Fitch) and
the parent company in Berhad enables DIAL to have access to low foreign currency loan. It finances 70% of loan
requirement through foreign loans therefore in our opinion DIAL is exposed foreign exchange loss for which we
have included a 4% average LKR/USD depreciation to the trend in the past floating lending rate the inflation rates
subjective to change in the US. (Appendix 06. C)
Terminal Growth Rate (TGR) – We expect a low TGR at 1% as DIAL is operating in mature industry with low
availability to grow in the long term as the markets saturate and with high level of rivalry.

CFA Society Sri Lanka Investment Research Challenge
Student Research October 1, 2013
4
Table 6 - Peer Multiples EV/
EBIDA
PE PB D
E
%
DIAL
:SL 4.5 11.1 1.8 40
SLTL
:SL
5.2
2 19.87 1.47 33
BHARTI
:IN
17.
0 30.0 11.0 23
RCOM
:BO
16.
97 46.07 1.08 85
ADVANC
:TB
10.
23 17.05
13.0
6 49
Source: Annual Report data
Table 7 - Relative value on
SLT
Multi
ple
Pric
e
(P)
Weig
ht
(W)
Value
(P*W
)
EV/
EBIT
DA
12.2
4
50% 6.12
P/E 14.9
0
35% 5.22
P/B 6.85 15% 1.03
12.39
Source: Team estimates
Table 8- Relative value on peer Multiple Price Weight Valu
e
EV/
EBITD
A
17.09 50% 8.54
P/E 11.72 35% 4.10
P/B 20.70 15% 3.10
15.75
Source: Team estimates
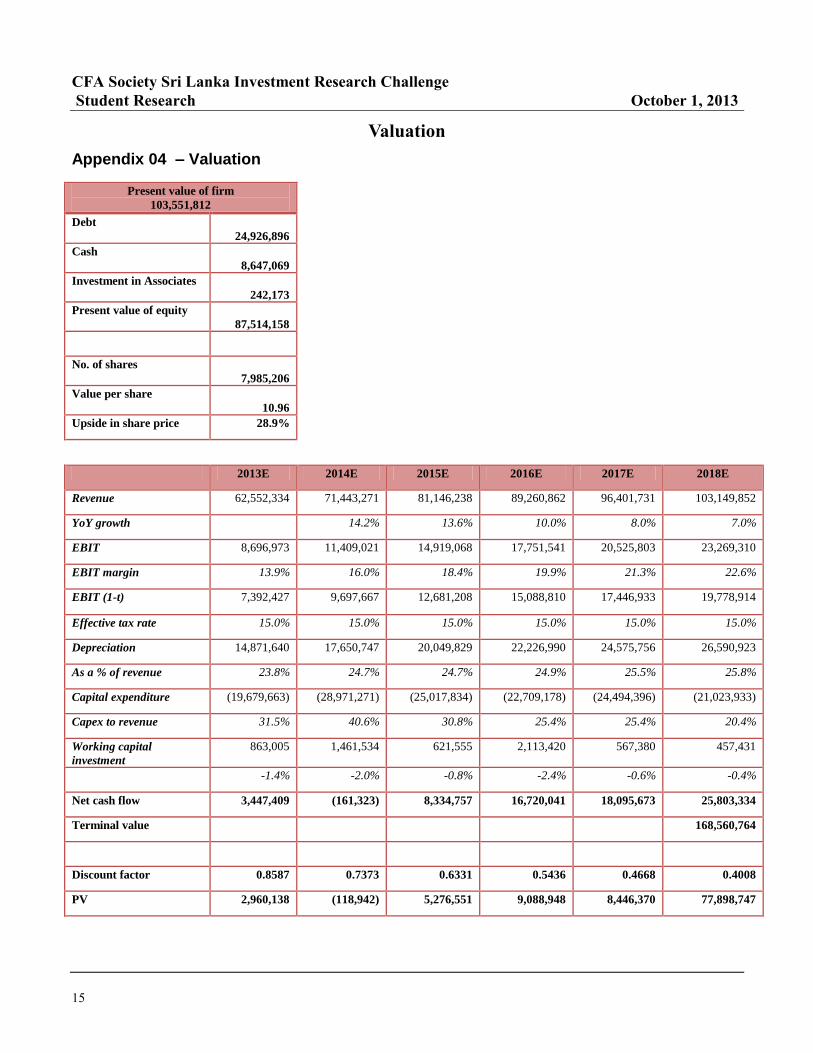
FCFF – FCFF is expected to be very low and negative in FY13 and FY14 due to the heavy capital expenditure
high data growth, DTV revenue growth and through other inventions in to the digital space through its
E-commerce /M-commerce arm. (Appendix 4)
Table 5 - Valuation
FY13E FY14E FY15E FY16E FY17E FY18E
EBIT(1-t) 7,392,427 9,697,667 12,681,208 15,088,810 17,446,933 19,778,914
Depreciation 14,871,640 17,650,747 20,049,829 22,226,990 24,575,756 26,590,923
FAinv (19,679,663) (28,971,271) (25,071,834) (22,709,178) (24,494,396) (21,023,933)
WCinv 863,005 1,461,534 621,555 2,113,420 567,380 457,431
NCF 3,447,409 (161,323) 8,334,757 16,720,041 18,095,673 25,803,334
TGR
(1%)
168,560,764
Source: Team estimates
Secondary Valuation – Peer Comparison
In order to support our recommendation in the DCF method we calculate the intrinsic value of DIAL based on its
local peer SLTL. However due to the lack of comparable peers within the country we have taken regional market
leaders to our valuation not overlooking the differences in the penetration levels, market conditions and macro
factors within the individual countries. ( Appendix 5)
We base our relative valuation on trailing P/E, EV/EBITDA and P/B for our peer companies. Trailing P/E is
commonly used by analysts and investors in determining the intrinsic value of a share as earnings power is
considered to be the driver for value creation therefore we have placed a 35% weight. However EV/EBITDA is
less sensitive to the effects of financial leverage therefore comparable across companies with varying capital
structures Hence we have placed a 50% weight. P/B was used as a valuation multiple because this industry is
mainly driven by the capital expenditure made on assets we have weight it at 15% due to the effect of different
business structures and varying useful life of assets being sensitive to this multiple. We have not based our
valuation on the dividend yield (DY) as DIAL re-invests majority of its earnings in capex to support the
continuous improvement in technology the bottom line of future earnings.
Comparative to SLTL, DIAL is trading at trailing PE of 79% and 31% and 36% discounted EV/EBITDA and 18%
premium PB. In our opinion with the international bandwidth expansion project together with lying of fiber optic
cables the competitive advantage enjoyed by SLTL is removed while reducing DIALs operational cost by a
considerable percentage. Therefore we expect DIALs EPS growth to improve in the future which would drive the
share price upward hence we forecast a relative value of LKR12.36 on currently oversold DIAL share. (Table 5)
We looked at our regional peers with similar corporate characteristics by discounting the multiple by 30% to
adjust for difference in market conditions and macro factors.
Risk to our valuation Our valuation under the DCF is heavily depended on the terminal value. However we
assigned a conservative TGR of 1% despite assuming a TGR of 0% by a pessimistic investor due to the cut throat
competition and the saturation in the target market in our opinion currently DIAL is trading at a discount.
Secondly our valuation is sensitive to the WACC of 16.5% however continued bearish outlook in the market or
dampening macro economic conditions causing the risk outlook of the country to worsen and causes an increase in
the WACC to 18% we see current market prices to be mispriced and an upward move is expected.

CFA Society Sri Lanka Investment Research Challenge
Student Research October 1, 2013
5
Figure 6- Revenue
segments
Source: Company data
Figure 7- Share
ownership
Source: Company data
the formatting of the
sidebar text box.
Figure 5 - Variation in the Valuation
Source: Team estimates
Business Description
Dialog Axiata PLC, a subsidiary of Axiata Group Berhad (Axiata), operates Sri Lanka’s largest and fastest
growing mobile telecommunications network representing approximately 3% of the total market capitalization of
the CSE, positioning the company within the top 10 largest companies in terms of market capitalization. Company
was incorporated in 1993 as a private limited liability company bearing the name of MTN networks (Private)
limited. In 2004 DIAL was listed in the CSE and by the year 2010 changed its name as Dialog Axiata PLC. The
operations of Dialog Axiata PLC include Mobile, International and Tele-Infrastructure businesses. The Company
delivers advanced mobile telephony and high speed mobile broadband services to a subscriber base in excess of
7.7Mn Sri Lankans, via a 2.5G and 3G/3.5G networks as well as 4G communication networks supporting the very
latest in multimedia and mobile internet services.
Subsidiaries
Dialog Axiata supplements its market leading position in the Mobile Telecommunications sector with a robust
footprint and market presence in Sri Lanka’s Fixed Telecommunications and Digital Television markets through
its fully owned subsidiaries Dialog Broadband Networks (Private) Limited (DBN) and Dialog Television (Private)
Limited, (DTV).
Dialog Mobile
Dialog mobile with a customer base of over 7.5 million, provides the best in mobile coverage, with over 2600 base
stations spanning all provinces. In addition customers are linked to over 200 global destinations via international
roaming, including 3G services. The Company also holds the distinction of being the first service provider in
South Asia to launch 3G and HSPA+ services, and most recently Mobile 4G services based on FD-LTE
technology contributing more than 80% of the total revenue of the group.
Dialog Broadband Networks
DBN the second largest fixed Telecommunication provider contributed 8% to the total revenue in the year 2012.
DBN has the distinction of being the first telecommunication operator in Sri Lanka to launched 4th generation
LTE High Speed Broad band Services. DBN remained dilutive to the Group at NPAT level, but registered
significant improvements in revenue and operational performance on the back of strong revenue and synergies
achieved through acquisition, merger and operational consolidation of Suntel Limited.
Dialog TV
Dialog TV which is the smaller contributor to the total revenue of Dialog Axiata PLC comparing with other
segments, is the market leader in Sri Lanka’s Pay TV sector. DTV supports a broad array of international and local
content in both Standard Definition (SD) and High Definition (HD) formats alongside a wide portfolio of Sri
Lankan television channels and delivers high quality infotainment to a viewer base in excess of 275000 Sri
Lankan Households.
Other Operations
Dialog Axiata has the distinction of being the first mobile operator in Sri Lanka to be awarded a Payment Systems
Provider license by the Central Bank of Sri Lanka, based on which it operates eZ Cash, the country’s pioneering
mobile money service.

CFA Society Sri Lanka Investment Research Challenge
Student Research October 1, 2013
6
Figure 8 - Composition of free
float
Source: Company data
Figure 9- Sustainabile aspects
Source : Company data
Figure 10- Mobile-cellular
Penetration 2013
Source : ITU/ICT indicators database
The Dialog Group also established a position of strength in Sri Lanka’s Digital Commerce space through a Joint
Venture (Digital Commerce Lanka) encompassing Sri Lanka’s leading daily deals site Anything.lk and the
incumbent e-commerce properties of the Dialog Group WoW.lk, ibuy.lk and tradenet.lk.
Dialog Axiata PLC’s Management
The CEO Dr.Wijayasuriya counts over 17 years experience in technology related business management. Under his
leadership company has achieved many awards and also expanded the business into several categories. Other
members in the team also have greater experience and knowledge related to the area they are handling which have
contributed and will contribute to the continuous success of Dialog Axiata PLC.
Other Headings Relevant to Dialog
Corporate governance safeguarding the best interest of shareholders and other stakeholders
To uphold accountability and sound internal control systems Dialog Axiata follows an internally generated Code
of Corporate governance which includes all regulatory and non regulatory standards. The Maintaining the highest
standards of business integrity, professionalism and ethical values is strictly followed by this code. The Securities
& Exchange Commission and the Institute of Chartered Accountants Sri Lanka were instrumental in drafting the
Corporate Governance Listing Rules, which are applicable to listed companies via the Colombo Stock Exchange
Listing Rules. Therefore all criteria on this Code of Best Practice on Corporate Governance are evident on the
corporate conduct of DIAL.(Appendix 8)
Assuring a sustainable future
For business continuity DIAL follows a strict sustainability policy where a three-fold incorporation of
Sustainability: into the core of our operations, into the consciousness of every employee, and in every facet of the
business is followed. To ensure the proper conduct of the organization in terms of sustainability DIAL prepares an
annual sustainability report under the guidelines of the Global Reporting Initiative (GRI). Within the past few
years DIAL has made progress with achieving partially sustainable targets set for the company where a fair
percentage of the targets have created a competitive advantage for the company.(Appendix 9 )
Giving back through corporate responsibility
Dialog operates with Triple Bottom Line spheres in economic, social and environmental performance to adhere to
its commitments. As a service provider DIAL has a large responsibility towards one of its largest stakeholders in
the business its customers who come from all walks of life. Therefore, DIAL gives high priority to this cause of
including everyone despite the demographic location to access of information and communication. Through
further innovation and creation DIAL looks into different aspects of social issues which could be mitigated
through proper allocation of technology.
Conditional drivers of additional upside
Possible consolidation of the industry. DIAL as the market leader on mobile communication has a well
established position in the market and sees little threat from other player. Where-as small players are facing many
difficulty in keeping up their businesses due to over heads. Therefore, there is high possibility the industry would
soon consolidate to a fewer number of player with time. In such instance DIAL would be at an advantage if it
acquires a small player due to the need of ever growing spectrum. Further through future consolidations there
adverse affects of unfair competition would reduce to a favorable condition
Growth through innovation. The R&D of DIAL keep innovating added services to give customers with better
features on a regular basis taking the company and industry to grater heights. As the first mover in the industry in
the past in many instances DIAL has been able to capture a larger customer base on based on the innovation and
push strategy. By attracting a loyal customer base DIAL is able to maintain such a relationship by providing
various VAS.
Partnerships for inorganic growth. DIAL has been serving in the telco industry so far with many partnerships
and it looks at improving and entering into more in the future. (1) Over The Top (OTT) content providers entering
into data and content sharing agreements (2) partnership through integration with parties in the ICT industry (3)
looking into cloud computing technology generation.

CFA Society Sri Lanka Investment Research Challenge
Student Research October 1, 2013
7
. It is often aligned on the left
or right of the page, or located
at the top or b
Figure 11: Subscriber
composition of service
providers
Source: Company data
Figure 12 :Global GDP vs
Global Telecom
Source: IMF
]
Figure 13- Vertical to
horizontal integration
Source: Company data
Industry Overview and Competitive Positioning
Current situation of the Industry in the words of Brahima Sanou, Director of the ITU Telecommunication
Development Bureau “I am pleased to present the latest ICT facts and figures which shows continued and almost
universal growth in ICT uptake. Every day we are moving closer to having almost as many mobile-cellular
subscriptions as people on earth. This is exciting news. The mobile revolution is empowering people in
developing countries by delivering ICT applications in education, health, government, banking, environment and
business. Let us all celebrate this mobile miracle that I have no doubt will hasten our pace towards sustainable
development”
In 2013, there are almost as many mobile-cellular subscriptions as people in the world, with more than half in the
Asia-Pacific region (3.5billion out of 6.8 billion total subscriptions). As global mobile-cellular penetration
approaches 100% and market saturation is reached, growth rates have fallen to their lowest levels in both
developed and developing countries. Mobile-cellular penetration rates stand at 96% globally; 128% in developed
countries; and 89% in developing countries. (Figure 10)
Growth in Internet Protocol Traffic
Total global Internet users will reach an estimated 2.7 billion worldwide by end of 2013. In developing countries,
the number of Internet users will have more than tripled between 2007 and 2013, to reach more than 1.8 billion.
Despite this rapid growth, however, less than a third of inhabitants in the developing world will be online by end
of 2013. In 2013, IP traffic is expected to grow by some 14’000 petabytes/month, the equivalent of twice the
global cumulated traffic over the whole decade from 1994 to 2003 (According to Telegeography data) These
tremendous volumes are driven by growth in the number of connected people and devices, and the growing
availability of abundant, diversified, and in most cases free, online content. In 2012, the number of individuals
using the Internet reached the milestone of 2.7 billion people according to the ITU and the total number of
applications downloaded over all types of mobile devices is estimated to have surpassed 50 billion. (ABI Research
2012)
High barriers to entry and high exit barriers
It comes as no surprise that in the capital-intensive telecom industry the biggest barrier to entry is access to
finance. To cover high fixed costs a lot of cash is typically required. When capital markets are generous, the threat
of competitive entrants escalates. When financing opportunities are less readily available, the pace of entry slows.
Meanwhile, ownership of a telecom license can represent a huge barrier to entry. There is also a finite amount of
"good" radio spectrum that lends itself to mobile voice and data applications. In addition, it is important to
remember that solid operating skills and management experience is fairly scarce, making entry even more difficult.
Subscriber acquisition and retention costs (SARCs) are likely to remain high so long as six telecom operators
compete for Sri Lanka’s 21 million population. High SARCs should affect challengers more than incumbents
(which benefit from greater economies of scale). Profitability pressure also stems from higher energy costs and
inflationary pressures since early 2012, as well as higher regulatory levies.
Telecom Sector growth still outpacing GDP growth
The potential of shaking business confidence everywhere in the world has risen to new heights, and the IMF
lowered its growth forecast and is warning of recession risks due to downward revision of global GDP. Economic
readings are worrisome everywhere but the U.S., but so far the impact on global telecom and enterprise remains
tame, and considerable growth in capex can be forecasted according to the principal analyst for mobile
infrastructure and carrier economics at Infonetics Research. Globally, mobile service revenue is the main growth
engine in the overall telecom. (Figure 12)
Shift from vertical integration to horizontal integration-supplier power reduce
Consumers and businesses are more demanding, expecting always-on service everywhere, forcing operators to
boost network capacity and connectivity. Industries are becoming increasingly digitized, demanding new services
like mobile payment platforms and cloud computing. Vertically integrated technologies, on which operators have
long depended, are growing increasingly modular and open and the telecom ecosystem is becoming more
competitive. These challenges and opportunities are creating a fundamental shift among operators from the
vertically integrated business models that dominated the industry for most of the past century. Now, four distinct,
though by no means mutually exclusive, horizontal business models designed to take full advantage of the
opportunities are emerging: Network Guarantors, Business Enablers, Experience Providers, Global Multi-
marketers. (Appendix 10)

CFA Society Sri Lanka Investment Research Challenge
Student Research October 1, 2013
8
Figure 14- Sri Lanka vs DIAL
Subscriber Growth
Source -TRC
Figure 15-Competitive position
Market
share % 38 25 22 8 7
Revenue
share % 55 28 17 - -
Source Industry data
Figure 16 – Internet
subscriber growth fixed and
mobile
Source TRC
Figure 17 – Porters five
forces
Source – Team estimates(Appendix 11)
Marketing, sales and customer care are becoming entirely digital
The web is nowadays the most important marketing, sales and customer care channel for operators. According to
eMarketer, telecom brands are the most successful at engaging consumers through online advertising. In fact,
telecom advertisements achieve a click-through rate six times that of standard online banners, thus providing a
high ROI. Customer self-service is regarded as highly profitable for operators, since the bottom-line savings in
online self-service are between 40-90%. In addition, when the self-service system is well designed, it can help
with customer retention and provide up-selling and cross-selling opportunities. This high efficiency achieved by
the existing service providers, weaken the entry of new comers.
Power of up- stream suppliers
Unarguably, the telecommunication operators will not be in existence if there were no telecom equipment
suppliers for the business of the former largely and mainly dependent on their ability to transmit voice and data
effectively which is done through the telecom equipment. But a single supplier becomes less powerful with a large
number of equipment makers around. There are enough vendors, arguably, to dilute bargaining power. The
telecom equipment industry was the first industry where private Chinese companies successfully expanded
overseas. Beginning in the late 1990s, Chinese firms began to establish a presence in foreign markets. After more
than a decade of growth, Chinese firms now account for more than 30% of the global market. These cheap
alternatives make the telecom operators powerful.
Economic support
Sri Lankan Economy is growing at 6.8% (June 2013) as per the State Statistics Office. Rubber, paddy, mining,
transport, hotels, banking and finance, wholesale, retail, textile, apparel sectors showed high performance as up-
to-date while tea, fishing, coconut showed contracted performance. Despite the inflationary situation telco
industry has grown by 8.9% which is a considerable growth. With the globalization and fast growth in technology,
we can hardly find a person without a mobile to make their life easy. Our idea is that Sri Lankan Telco industry
has promising prospects and with the growth in the economy telco industry would further expands.
Cut Throat Competition
With the massive industry deregulation coupled with flexible credit opened doors for the new entrants, this lead
the industry to be more competitive than before. Nearly everybody already pays for phone services, so all
competitors now must provide customers with lower prices and more exciting services. Sri Lanka’s Telecom
industry has been overcrowded during the last couple of years and this remains the key medium-term risk to
telecom operators in the country.
Sri Lanka’s mobile industry is one of the most competitive markets in the region with five operators competing for
a total addressable population of approximately 21.7 million and the competition among the five operators,
Dialog, Mobitel, Etisalat, Airtel and Hutch is expected to remain high in years ahead. With Bharti Airtel, India’s
biggest mobile operator launching its operations in Sri Lanka later in 2008 the other 4 operators engaged in
different strategies to block Airtel’s entry. With existing players reducing the prices so low and Airtel being well
equipped to face that, ultimate result was the Price war.
Dialog is Sri Lanka’s undisputed Mobile Market Leader-positioning
In terms of revenue and market share dialog is well above its competitors (with 55% revenue share and 38%
market share). Further, dialog has the widest distribution network within the country with the highest number of
arcades, service centers and outlets spread through-out the country. With Dialog’s strategic acquisition of Suntel
in 2012, it was ranked as the 2nd largest player in the fixed telecommunications sector in Sri Lanka. High fixed
cost increases rivalry since total costs are mostly fixed costs and high exit barriers place high cost in abandoning
the product (asset specificity)
DIAL, one of the largest companies on the Colombo Stock Exchange contributes towards 3.08% of the total
market capitalization.(with the distinction of being the first on the Colombo stock market with a market
capitalization exceeding $1 billion) DIAL also contributes for more than 40% of the market capitalization of the
telecommunication sector. Being Sri Lanka's largest foreign direct investor with a total FDIs exceeding US$ 1.5
billion during the last two decades. It also had entered into infrastructure investment agreements totaling to US$
150 million with the Board of Investment (BoI). Company has switched on its 4G LTE Network in Colombo—
said to be the first LTE pilot network in Southern Asia.
Sri Lanka reduces broadband tax to promote internet use
Sri Lanka has been ranked No.1 in the world with the lowest entry level fixed broadband charges according to a
report published by the International Telecommunication Union in 2012. Sri Lanka has achieved this global rating
for broadband charges within a short period of time after the TRC took steps to ensure subscribers got value for

CFA Society Sri Lanka Investment Research Challenge
Student Research October 1, 2013
9
Figure 18 - Growth in data
segment
Source: TRCSL and Student Estimates
Figure 19 - CAPEX and
Return
Source: Company data, student estimates
Figure 20 – Growing Margins
Source: Company data, student estimates
Figure 21 – Debt Capacity
Source: Company data, student estimates
money and entry prices were affordable to as many people. Telecommunication levy on the internet and
broadband services was reduced by 50% from Jan 1st 2013 from 20% - 10%. The Director General of TRC
pointed out that 1.2 million Sri Lankans use internet now in Sri Lanka and the government aims to increase it to
three million by 2015.
Financial Analysis
Revenue: DIAL has been able to realize superlative results over the years recording a strong growth across all
sectors. Group revenue demonstrated a 24%YoY growth in 2012 while revenue CAGR in years 2008-2012 was
ca. 11.6%. Our predictions suggest YoY revenue will decrease in the voice sector over the coming years as a
result of saturated voice penetration and aggressive competition, and DTV will only be able to sustain its market
share through economies of scale and price advantages. However, this will be compensated by the growth in other
sectors as group CAPEX has been directed mainly towards an assortment of business creation initiatives such as
the introduction of 4G technology, High Speed Mobile Broadband Services, Optical Fibre Network, the
international cable landing station and Investment in new submarine cable to boost international bandwidth We
believe these ventures signify Dialog’s foray in to the space of Digital Commerce and the strategic intent to
expand its operations through cost reductions. Thus we expect a CAPEX to Revenue of 30% and 40% in 2013
and 2014 respectively and a ratio around 25%-30% is expected to be maintained for the rest of the forecasted
period.
Data segment (mobile and fixed broadband) is anticipated to be the main revenue driver in the near future as the
data market penetration is expected to grow at a 2013-15E CAGR of 35% as a result of increase in data
penetration (2012 - 6.7% to 2015E – 23%), increase in smartphone penetration as smartphone users are expected
to spend more time on the internet than on traditional calls and SMS’s and regional trends. DBN is expected to
achieve consolidated benefits to costs while subscriber growth potential in terms of corporate customers is high
post acquisition. Implementation of high speed 4G technology is expected to convert subscribers to DIAL and
forecasted economic developments are likely to attract a larger number of high income earning corporate
personnel contributing revenue CAGR of 9% 2013-15E.In line with its past trends International telephony
revenue is expected to grow at a CAGR of 14% 2013-15E which is justified by low international tariffs and the
fact that Sri Lanka is poised to become one of the largest knowledge hubs in the world.
Margins and Performance: In 2012 Group EBITDA increased only by a mere 11% YoY and EBITDA margin
dropped 3 percentage points. However the potency of the group is emphasized by the astounding 23.2% growth in
PAT including non-cash exceptional items such as translational foreign exchange losses and network
modernization related impairment charges. But these extraordinary growth rates are expected to be held back in
2013 (YoY reduction of 29%) as the company is opting for a 2% revenue tax following the expiry of the tax
holiday along with volatile finance costs. We predict that the EBITDA and NP margins will remain at levels
similar to 2012 (refer Appendix 13 for a detailed ratio analysis) while EBITDA and NP will grow at CAGR of
16% and 32% respectively in 2013-18E. We anticipate these predictions will hold in the absence of dramatic
strategic acquisitions and investments.
ROA and ROE performance is expected to be relatively flat in 2013-14E. Low levels of performance are
attributable to the large investments in fixed assets made continuously to secure revenue and the plough back of
retained earnings. But ROE is expected to increase to an average 20% after 2014E as the quantum of investments
begins to reap benefits.
Debt: Over the years DIAL has maintained a Gearing and Debt ratio at around 70% along with a strong interest
cover (6 times of EBIT in 2012). Our forecasts depict that future investments will be funded through a
combination of debt and retained earnings and DIAL will attempt to maintain a debt equity ratio of 50%. The
high dependency on debt financing for strategic expansion is justifiable as most of this debt is acquired at a very
low interest rate from DIAL’s parent company in Malaysia, a healthy cash balance and lucrative investments that
adds up to a strong asset base.
Cash generation and Liquidity: In line with previous years cash from investing activities is expected to remain
negative as a result of high CAPEX. Cash flow from financing activities mainly consisting of borrowings and the
repayment of borrowings is expected to be positive as a result of the USD 200mn syndicated term loan, other
rupee loans and an estimated 40% dividend payout ratio (well below the 45% in 2012). DIAL’s liquidity ratios are
expected to improve from their current low levels (current ratio 0.86 and cash ratio 0.46 in 2015E) as a result of a
strong cash base. A comparison of DIALs key performance indicators is illustrated in table 9 below.

CFA Society Sri Lanka Investment Research Challenge
Student Research October 1, 2013
10
Figure 22 – Cash flow
patterns
Source: Company data, student estimates
Table 10- Mobile Cellular
Tariff
ols
Rank
Country Value
$
04 Bangaladesh 0.03
05 Sri Lanka 0.04
06 India 0.04
43 Malyasia 0.19
91 United
Kingdom 0.37
Source: Company data
Figure 23 USD/LKR 2008-
2013Sep
Source: CB Sri Lanka
Figure 11- Likely hood and
impact Risks Likely
hood Impa
ct
Rati
ng
Regulator
risk
1 5 H
Forex 1 5 H
ASPI
Volatility
2 3 M
Demand
Assumpti
ons
3 5 H
Rivalry 1 5 H
Longer
Payback
1 5 H
Parent
company
linkages
5 5 H
(Likely hood of a risk occurring: 5 –
very unlikely 1 – very probable /
Impact: 5 – High impact 1 – Low
Imapct) Source: student estimates
Table 09: Peer Financial Ratios
Source: Bloomberg, Company data
Investment Risks
Regulator risk - Telco industry in Sri Lanka is highly regulated with a floor price as well as heavy duties as VAT,
income taxes and licensing fee. Relaxation of the floor price with the current over populated industry or an increase
in the effective tax rates from current level of 15% to 25% could hurt the top line as well as the NP of DIAL. The
overcrowding in the industry with 5 mobile operators, 3 operators providing fixed telephony and pay TV providers
in an addressable population of 21mn is situation in the industry attributable to regulator risk together with
regulators independence from the political frame work draws our concerns.
Forex – We expect the LKR to depreciate by 6% against the USD (Appendix). DIAL holds over 80% loan in USD
causing major exchange losses. (Appendix 14)
ASPI Volatility – CSE has been facing major shocks with high volatility in share prices. CSE is highly sensitive
towards the foreign investors therefore economic and political changes especially in the US would affect the
volatility of the local index. This overall behavior of the index could affect DIALs share prices to be highly volatile
resulting in share prices to trade at a discounted value.
Demand Assumptions – Our valuation is highly sensitive towards the GDP growth rate, Computer literacy and
purchasing power of the consumers. Telco considered the engine of technological enhancement of the country is
highly correlated with the macro economic conditions. Major revenue generating sources for Data, DBN and DTV
are seen from business as BPOs and hotel projects, dampening GDP growth would affect the revenue in this
segment as well further deterioration of purchasing power caused through an inflation rate in excess of 7% would
cause the revenue of DIAL to decline. 87% of its revenue is generated through voice however with the replacement
of its cash cow with cheap third party mobile applications is a threat DIAL would face.
Rivalry – DIAL was experiencing a low ARPU growth because of the low tariffs in operation (Table 10). We see
consolidations taking place in the future taking away the prevailing cut throat price war we see this as a positive in
terms of DIALs top line which could cause an increase in the RPU. However we see potential threat of other forms
of competition such as number portability which if introduced enables the consumer to move between networks
freely. We see reasonably a less threat to DIAL as it is the market leader in introduction of new technology with a
reasonably loyal customer base.
Longer Payback - DIAL has shown signs of heavy Capex in FY13 FY14 and FY15 causing the high level of
depreciation cost in their financial statement as well as liquidity risk with non - recoverability of its investments in
the future.
Parent company linkages – Axiata Bhd is the parent of DIAL claiming 83% ownership of DIAL creates both
positive and negative impact on DIAL. DIAL uses Axiata brand name in its business activities which has enabled
DIAL to obtain a AAA(lka)Fitch rating creating a positive impact of having access to cheap debt financing,
however we also identify the risk with a large controlling parent in the event of DIAL loses its status as the
subsidiary of Axiata it would face a liquidity crisis.
EBITDA
Margin
NP Margin Capex/ Revenue Debt/Equity Current Ratio ROE
DIAL 33% 11% 31% 64% 0.54 16%
SLT 33% 7% 33% 25% 0.92 7%
Airtel 33% 6% 20% 129% 1.89 9%
AIS 43% 25% 8% 47% 1.05 84%
Reliance 32% 5% 29% 96% 0.56 2%

CFA Society Sri Lanka Investment Research Challenge
Student Research October 1, 2013
11
Appendix – Table of Content page
HISTORICAL AND PRO FORMA FINANCIAL STATEMENTS 12 – 14
Appendix 01 : Statement of Comprehensive Income
Appendix 02 : Balance sheet
Appendix 03 : Statement of Cash Flow
VALUATION 15 - 19
Appendisx 04 – Valuation
Appendix 05 – Business Model
Appendix 07 : Peer Comparison
OTHER TOPICS 20 – 22
Appendix 08 – Corporate Governance
Appendix 09 – Sustainability Report
INDUSTRY OVERVIEW AND COMPETITIVE POSITIONING 23 - 24
Appendix 10– Horizontal Business Models
Apendix 11 – Porter’s five forces
Appendix 12 – SWOT of Sri Lanka
FINANCIAL ANALYSIS 25
Appendix 13 – Key Financial Ratios
INVESTMENT RISK 26
Appendix 14 – Foreign Exchange loss expected
Appendix 15 – Risk Mitigation
ABBREVIATION 27

CFA Society Sri Lanka Investment Research Challenge
Student Research October 1, 2013
12
HISTORICAL AND PRO FORMA FINANCIAL STATEMENTS
Appendix 1: Statement of Comprehensive Income (In millions)
(LKR 000 000) 2010 2011 2012 2013E 2014E 2015E 2016E 2017E 2018E
Revenue 41,423 45,412 56,345 62,552 71,443 81,146 89,261 96,402 103,150
Direct costs 23,600 24,949 32,216
35,029
39,294
43,413
46,416
48,683
50,543
Gross profit 17,822 20,463 24,129 27,523 32,149 37,733 42,845 47,719 52,606
Gross profit Margin 43% 45% 43%
Distribution Costs 5,432 6,265 7,601
8,423
9,621
10,927
12,020
12,982
13,890
Administrative Costs 7,112 8,074 9,865
10,556
11,295
12,085
13,292
14,448
15,700
Other Income 134 83 138
153
175
199
219
236
253
Operating Profit 5,413 6,207 6,801 8,697 11,409 14,919 17,752 20,526 23,269
Finance Costs – Net 125 769 2,727 3,683 2,782 2,332 3,107 3,355 3,604
Share of (loss)/profit associates 0 10 9 2 4 6 4 4 4
Profit before income tax 5,538 5,448 4,066 5,016 8,631 12,593 14,648 17,175 19,670
Income Tax 490 579 1,965 752 1,295 1,889 2,197 2,576 2,951
Profit for the year 5,047 4,870 6,030 4,263 7,336 10,704 12,451 14,598 16,720
Other comprehensive income 0 19 9 0 0 0 0 0 0
Total comprehensive income for
the year 5,047 4,888 6,021 4,263 7,336 10,704 12,451 14,598 16,720
Margin 12% 11% 11% 7% 10% 13% 14% 15% 16%
EBITDA 11,468 16,512 18,357 23,569 29,060 34,969 39,979 45,102 49,860
EBITD Margin 28% 36% 33% 38% 41% 43% 45% 47% 48%
EPS 0.63 0.61 0.75 0.53 0.92 1.34 1.56 1.83 2.09
DPS 0.25 0.34 0.21 0.34 0.46 0.62 0.73 0.84 0.25
Dividend payout ratio 32% 42% 45% 40% 37% 34% 40% 40% 40%
Source: Company Documents, Student Estimates
CFA Society Sri Lanka Investment Research Challenge
Student Research October 1, 2013
13
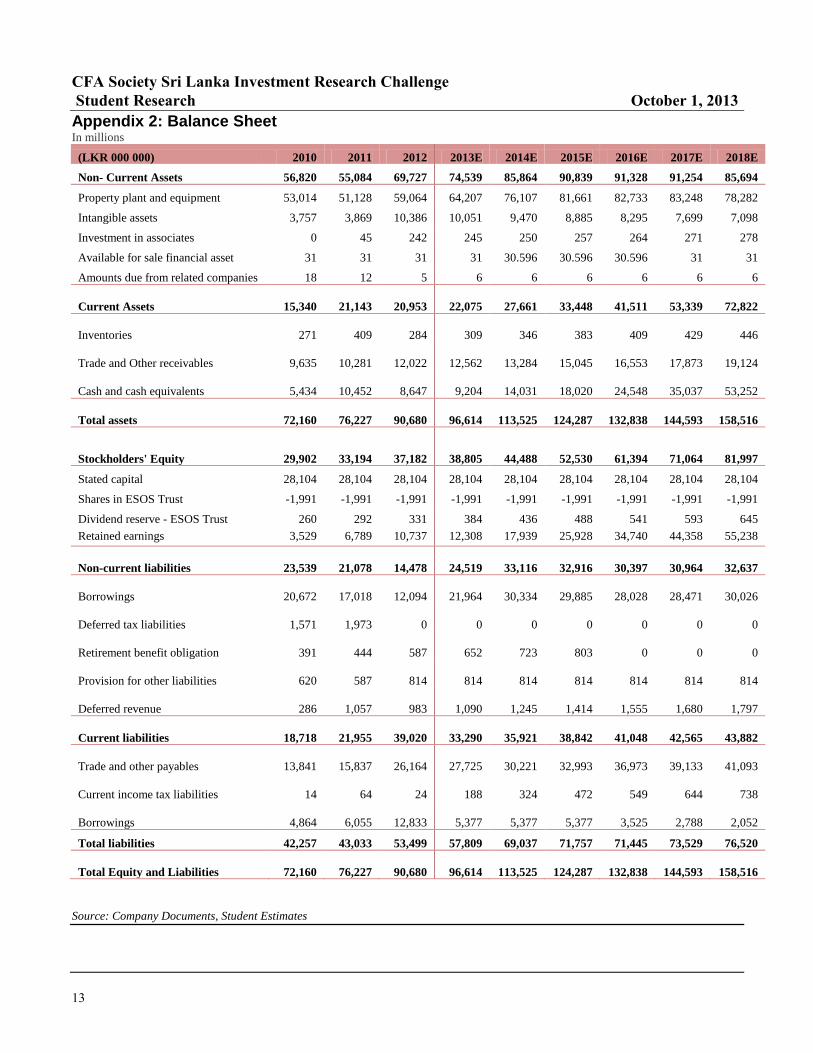
Appendix 2: Balance Sheet In millions
(LKR 000 000) 2010 2011 2012 2013E 2014E 2015E 2016E 2017E 2018E
Non- Current Assets 56,820 55,084 69,727 74,539 85,864 90,839 91,328 91,254 85,694
Property plant and equipment 53,014 51,128 59,064 64,207 76,107 81,661 82,733 83,248 78,282
Intangible assets 3,757 3,869 10,386 10,051 9,470 8,885 8,295 7,699 7,098
Investment in associates 0 45 242 245 250 257 264 271 278
Available for sale financial asset 31 31 31 31 30.596 30.596 30.596 31 31
Amounts due from related companies 18 12 5 6 6 6 6 6 6
Current Assets
15,340
21,143
20,953 22,075 27,661 33,448 41,511 53,339 72,822
Inventories
271
409
284
309
346
383
409
429
446
Trade and Other receivables
9,635
10,281
12,022 12,562 13,284 15,045 16,553 17,873 19,124
Cash and cash equivalents
5,434
10,452
8,647 9,204 14,031 18,020 24,548 35,037 53,252
Total assets
72,160
76,227
90,680 96,614 113,525 124,287 132,838 144,593 158,516
Stockholders' Equity
29,902
33,194
37,182 38,805 44,488 52,530 61,394 71,064 81,997
Stated capital 28,104 28,104 28,104 28,104 28,104 28,104 28,104 28,104 28,104
Shares in ESOS Trust -1,991 -1,991 -1,991 -1,991 -1,991 -1,991 -1,991 -1,991 -1,991
Dividend reserve - ESOS Trust 260 292 331 384 436 488 541 593 645
Retained earnings 3,529 6,789 10,737 12,308 17,939 25,928 34,740 44,358 55,238
Non-current liabilities
23,539
21,078
14,478 24,519 33,116 32,916 30,397 30,964 32,637
Borrowings
20,672
17,018
12,094 21,964 30,334 29,885 28,028 28,471 30,026
Deferred tax liabilities
1,571
1,973 0 0 0 0 0 0 0
Retirement benefit obligation
391
444
587 652 723 803 0 0 0
Provision for other liabilities
620
587
814 814 814 814 814 814 814
Deferred revenue
286
1,057
983 1,090 1,245 1,414 1,555 1,680 1,797
Current liabilities
18,718
21,955
39,020 33,290 35,921 38,842 41,048 42,565 43,882
Trade and other payables
13,841
15,837
26,164 27,725 30,221 32,993 36,973 39,133 41,093
Current income tax liabilities
14
64
24
188
324
472
549
644
738
Borrowings
4,864
6,055
12,833
5,377
5,377
5,377
3,525
2,788
2,052
Total liabilities 42,257 43,033 53,499 57,809 69,037 71,757 71,445 73,529 76,520
Total Equity and Liabilities
72,160
76,227
90,680 96,614 113,525 124,287 132,838 144,593 158,516
Source: Company Documents, Student Estimates

CFA Society Sri Lanka Investment Research Challenge
Student Research October 1, 2013
14
Appendix 3: Statement of Cash Flows In millions
(LKR 000 000) 2010 2011 2012 2013E 2014E 2015E 2016E 2017E 2018E
Cash generated from operations 14,789 17,087 21,727 24,736 31,023 36,192 38,515 41,743 45,315
Interest received 86 384 347 307 307 307 412 450 488
Interest paid -665 -355 -286 -1,371 -1,370 -1,556 0 0 0
TDC refunds received -95 1,650 0 0 0 0 0 0 0
Tax paid 210 -106 -126 -588 -1,159 -1,740 -2,120 -2,481 -2,857
Retirement benefit obligation paid -43 -20 -80 0 0 0 0 0 0
Net cash generated from operations 14,283 18,640 21,583 23,083 28,801 33,203 36,807 39,712 42,946
Purchase of property, plant and
equipment -78 -8,335 -17,248 -18,766 -28,577 -24,344 -22,315 -24,100 -20,630
Purchase of intangible assets -23 -385 -161 -114 -114 -114 -114 -114 -114
Investment in associates -13
-11
-156 0 0 0 0 0 0
Expenditure incurred on capital work-
in-progress -6,689 0 0 0 0 0 0 0 0
Acquisition of subsidiary, net of cash
acquired 0 0 -3,363 -800 -280 -560 -280 -280 -280
Proceeds from sale of subsidiary 0 69 0 0 0 0 0 0 0
Proceeds from sale of property, plant
and equipment 55 10 63 0 0 0 0 0 0
Net cash used in investing activities -6,748 -8,651 -20,864 -19,680 -28,971 -25,018 -22,709 -24,494 -21,024
Repayment of finance leases -26 -6 -11 0 0 0 0 0 0
Repayment of borrowings -7,899 -3,161 -3,917 -16,931 -7,256 -6,700 -5,360 -4,676 -5,651
Proceeds from borrowings 3,492 1,096 4,885 26,800 15,627 6,251 3,503 5,118 7,207
Net Current Borrowings 0 0 0 -7,456 0 0 -1,852 -737 -737
Redemption of rated cumulative
redeemable preference shares -1,250 -1,250 -1,250 0 0 0 0 0 0
Dividend paid to equity holders -343 -1,629 -2,036 -2,687 -1,705 -2,714 -3,639 -4,980 -5,839
Dividend received by ESOS Trust 0 32 40 52 52 52 52 52 52
Dividend paid to rated cumulative
redeemable - preference shareholders 0 -177 -83 0 0 0 0 0 0
Direct cost on share issue 0 0 -38 -5 0 0 0 0 0
Net cash used in financing activities -6,025 -5,095 -2,409 -227 6,718 -3,111 -7,296 -5,222 -4,968
Net (decrease) / increase in cash and
cash equivalents 1,510 4,893 -1,691 3,176 6,546 5,072 6,799 9,993 16,951
Movement in cash and cash
equivalents
At start of the year 3,019 4,476 9,406 8,647 9,204 14,031 18,020 24,548 35,037
(Decrease) / increase 1,510 4,893 -1,691 3,176 6,546 5,072 6,799 9,993 16,951
Exchange (losses) / gains on cash and
cash equivalents -53 37 -347 -2,619 -1,719 -1,083 -271 496 1,264
At end of the year 4,476 9,406 7,368 9,204 14,031 18,020 24,548 35,037 53,252
Source: Company Documents, Student Estimates
CFA Society Sri Lanka Investment Research Challenge
Student Research October 1, 2013
15
Valuation
Appendix 04 – Valuation
Present value of firm
103,551,812
Debt
24,926,896
Cash
8,647,069
Investment in Associates
242,173
Present value of equity
87,514,158
No. of shares
7,985,206
Value per share
10.96
Upside in share price 28.9%
2013E 2014E 2015E 2016E 2017E 2018E
Revenue 62,552,334 71,443,271 81,146,238 89,260,862 96,401,731 103,149,852
YoY growth 14.2% 13.6% 10.0% 8.0% 7.0%
EBIT 8,696,973 11,409,021 14,919,068 17,751,541 20,525,803 23,269,310
EBIT margin 13.9% 16.0% 18.4% 19.9% 21.3% 22.6%
EBIT (1-t) 7,392,427 9,697,667 12,681,208 15,088,810 17,446,933 19,778,914
Effective tax rate 15.0% 15.0% 15.0% 15.0% 15.0% 15.0%
Depreciation 14,871,640 17,650,747 20,049,829 22,226,990 24,575,756 26,590,923
As a % of revenue 23.8% 24.7% 24.7% 24.9% 25.5% 25.8%
Capital expenditure (19,679,663) (28,971,271) (25,017,834) (22,709,178) (24,494,396) (21,023,933)
Capex to revenue 31.5% 40.6% 30.8% 25.4% 25.4% 20.4%
Working capital
investment
863,005 1,461,534 621,555 2,113,420 567,380 457,431
-1.4% -2.0% -0.8% -2.4% -0.6% -0.4%
Net cash flow 3,447,409 (161,323) 8,334,757 16,720,041 18,095,673 25,803,334
Terminal value 168,560,764
Discount factor 0.8587 0.7373 0.6331 0.5436 0.4668 0.4008
PV 2,960,138 (118,942) 5,276,551 9,088,948 8,446,370 77,898,747

CFA Society Sri Lanka Investment Research Challenge
Student Research October 1, 2013
16
Appendix 05 – Business Model
Revenue
Segment Subscriber ARPU Market Share
Mobile Subscriber growth of 2%CAGR over FY13E – FY18E
1. Voice Saturating with current penetration levels nearing
100%
2.Data revenue to increase mainly due to
Smartphone penetration FY18E - 40%
Growing middle class
ARPU growth of 9%CAGR
over FY13E – FY18E
1.RPU would deteriorate
2.MoU would increase as the
rate cuts make mobile usage
cheaper
48%
(57% Revenue
share)
Expect – Data
revenue to
increase to 25% -
30% of total
revenue
Broadband and
Fixed line
Subscriber growth of 2%CAGR over FY13E – FY18E
1.100% penetrated. But DIAL is targeting the corporates
with Suntel acquisition. With the economic development we
expect the growth in the service and industry sector.
2.4G technology is expected to attract competitor’s internet
users.
ARPU growth of 4%CAGR
over FY13E – FY18E
1.4G perceived as a high speed
internet. DIAL’s broadband
revenue would improve
16%
(2nd player in
terms of revenue
share)
Pay TV Subscriber growth of 23%CAGR over FY13E – FY18E
1. DIAL’s current marketing campaign penetrates in to low
income earning population.
2. Improving entertainment industry and the hotel industry
which subscribe to DTV over competitive pay TV brands
3. Technological advancements and Number of channels
offered is more compared to competitors.
ARPU growth of 0%CAGR
over FY13E – FY18E
1. Still at the initial stage of the
industry cycle.
2. making offers with rate cuts
and pre – paid options being
introduced
75%
(Market leader)
Joint Venture – Anything.lk – CAGR 15%
Joint venture with Anything.lk was entered in to in the FY 12. This venture enhances the E-Commerce and M-Commerce segments of the
country. In our opinion this is a revenue source that could expect a boom in its performance with the
rapid increase in Smartphone penetration
Increasing SMEs
GDP growth.
Appendix 06 - WACC
A) WACC Computation
Financing
Method
Cost Weight Value
Ke 21.0% 0.5 10.5%
Kd 13.0% 0.5 6.5%
DCF 16.5%
Current capital structure - Debt 40% and Equity 60%.
Target Capital Structure – Debt 50% and Equity 50%
B) Cost of Equity Estimation
We assume the capital market to be efficient therefore we utilize the CAPM in estimating the Ke.
Risk Free (Rf) 12%
Beta 1.1

CFA Society Sri Lanka Investment Research Challenge
Student Research October 1, 2013
17
Market Risk Premium (Rp) 9%
Risk Free Rate - 5 Year T – Bond rate
DIAL Beta Calculation
Past 6 Year Beta – 1.065
Expect Beta – 0.9 – 1.1 (Due to behavior of DIAL’s share with the ASPI coupled with the maturing industry with great potential to
reduce risk we expect DIAL’s beta to be trading in the range of 0.9 – 1.1.)
Market Risk Premium Calculation
Method 01 - Country Bond Default Spread
adjust the mature market risk premium for the emerging market default spread.
Therefore in arriving at Sri Lankan equity risk premium we have added 4% Sri Lankan Bond default spread to US risk premium of 4.8%.
(Source : (A. Damodaran) - http://pages.stern.nyu.edu/~adamodar/New_Home_Page/datafile/ctryprem.html)
Method 02 – Relative Country Risk Premium
According to this method we add the relative country risk (Standard deviation of Equity/Standard deviation of Bond) to the risk premium
of the mature market.
(Source : http://pages.stern.nyu.edu/~adamodar/New_Home_Page/datafile/ctryprem.html)
Sri Lanka Country risk premium 6%
US risk Premium 6%
Total 12%

CFA Society Sri Lanka Investment Research Challenge
Student Research October 1, 2013
18
Method 03 – Macro – economic conditions
Variables
Expected Inflation (EINFL) 6%
Expected growth rate in real earnings per share (EGREPS) 8%
Expected growth rate in PE (EGPE) 0
Expected income component (EINC) 12%
Risk Free rate (Rf) 10%
Expected Inflation and Expected growth rate in real earnings per share was estimated based on the senior government officials
statements made regarding the economic.
Expected growth rate in PE – we assume the capital market to be efficient in the long run therefore the growth in PE to be 0.
Expected income component was arrived at by assuming the average turnover in the CSE over the period of past 6 years.
Risk Free rate is the 5 year T – Bond rate offered by the Central Bank.
EINFL) (1+EGREPS)(1+EGPE) – 1]+ ENIC} – Rf
Conclusion
Historically Sri Lanka’s Rp moves between 5% - 9% during a bearish market Rp of 8% could be observed. However we are optimistic on
DIAL risk premium at 9% as DIAL being a company with a 3.09% of total market capitalization with a large public float and good
governance would be highly attractive to foreign investors.
C) Cost of Debt Estimation
Debt Category Loan Interest Rate Interest Cost
Sri Lankan Rupee Loan 15,626,926 11%* 1,718,962
USD Loan 30,825,000 2%* 616,500
Total 46,451,926 2,335,462
*Interest rate for Sri Lankan rupee loan was assumed at the AWPLR and the USD loan interest was the average interest rate DIAL had in
its previous USD loans
Cost of debt adjusted for Taxes (Kd)
Kd 5%
Tax 15%
Kd(1-t) 4.27%

CFA Society Sri Lanka Investment Research Challenge
Student Research October 1, 2013
19
Appendix 07 – Peer Comparison
A) Peer Company Business Characteristic Comparison
DIAL:SL SLTL:SL RCOM:BO BHAR:IN ADVANC:TB
Market Position Market Leader and
First mover
Government 49.5%
control Competitive
in Fixed line
Second largest
player in the market
Market leader and
First mover
Market leader and
First Mover
(44%Subscriber
market share 54%
Revenue share)
Network Coverage 2G – 97%
3G – 82%
4G – Introduced in
2012
2G – 97%
3G – 80%
4G –introduced in
2012
2G – 100%
3G -
2G – 100%
3G -
4G – introduced in
2013 April
2G–100%
3G – Yet to introduce
Subscriber CAGR Mobile – 6.63%
Fixed – 32%
TV – 21%
Megaline – 4.67%
CDMA – (3.1%)
Broadband - 28%
PEOTV – 65%
Wireless – 35%
Broadbad – 14%
Mobile – 45%
Broadband –15%
TV – 160%
7.0%
Revenue Model Mobile – 87%
Fixed – 7%
TV – 5%
Megaline – 52%
CDMA – 26.7%
Broadband – 17.4%
PEOTV – 3.5%
Wireless – 67%
Broadband – 33%
Voice Revenue –
78%
Other – 22%
Voice – 72%
Non Voice – 20.2%
International – 3.1%
Capex 4G network, Fiber
optic and
International
Bandwidth
4G , Next
Generation Network
implementing all
access network in to
a single platform,
Fiber optic cables,
Internet protocol
enabled PEO Tv
facility,
Infrastructure
sharing agreements,
Introducing of
Reliance 3G Tablet
Increase global
foot print – African
countries
3G and 4G roll out
Obtaining the license
to operate
Roll out of 3G
Dividend 40% Payout ratio 37.9% Payout ratio 34.2% Payout Ratio 9% Payout ratio 100% Payout ratio
Tele density 79.82% 79.82%
B) DIAL Value Relative to SLTL
Company PE EV/EBITDA PB
SLTL 19.87 5.32 1.47
DIAL 11.1 4.5 1.8
Discount 44% 15% (22%)
Peer
Multiple
DIAL
(Accounting
Information)
Price W Price * W
Peer PE
19.87
0.75
14.98 0.35 5.24
Peer
EV/EBITDA
5.32
2.30
12.23 0.5 6.12
Peer P/B
1.47
4.66
6.84 0.15 1.03
CFA Society Sri Lanka Investment Research Challenge
Student Research October 1, 2013
20
12.39
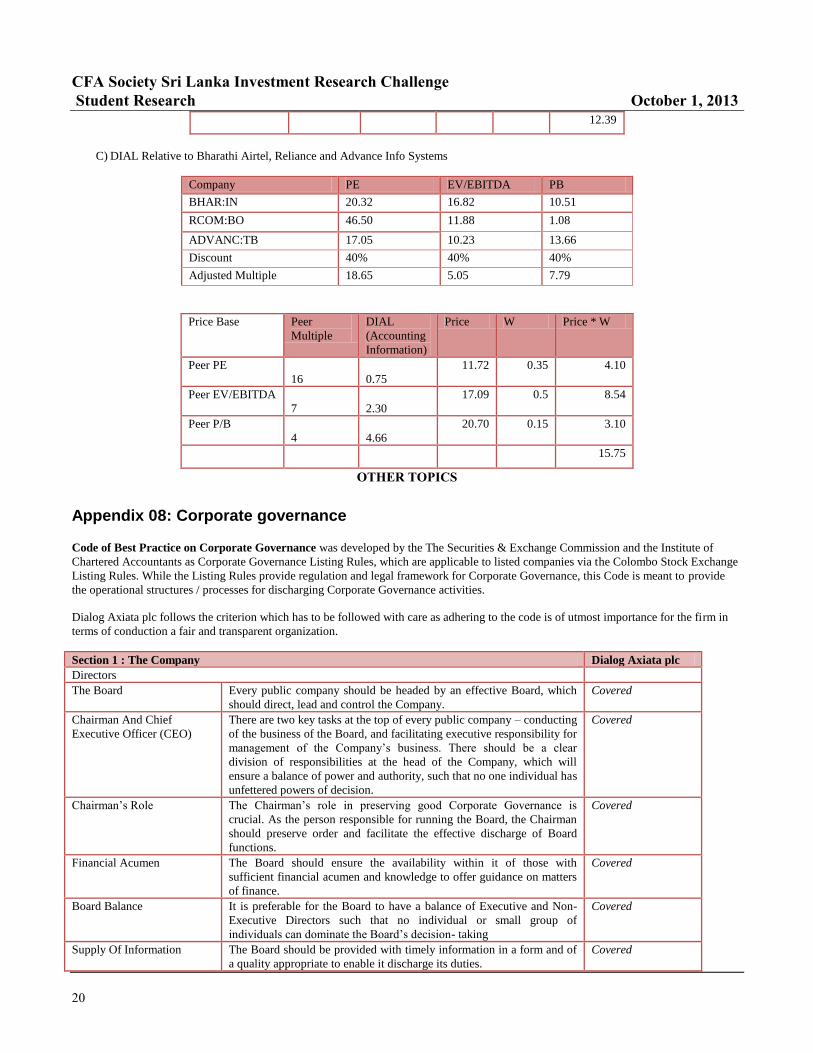
C) DIAL Relative to Bharathi Airtel, Reliance and Advance Info Systems
Company PE EV/EBITDA PB
BHAR:IN 20.32 16.82 10.51
RCOM:BO 46.50 11.88 1.08
ADVANC:TB 17.05 10.23 13.66
Discount 40% 40% 40%
Adjusted Multiple 18.65 5.05 7.79
Price Base Peer
Multiple
DIAL
(Accounting
Information)
Price W Price * W
Peer PE
16
0.75
11.72 0.35 4.10
Peer EV/EBITDA
7
2.30
17.09 0.5 8.54
Peer P/B
4
4.66
20.70 0.15 3.10
15.75
OTHER TOPICS
Appendix 08: Corporate governance Code of Best Practice on Corporate Governance was developed by the The Securities & Exchange Commission and the Institute of
Chartered Accountants as Corporate Governance Listing Rules, which are applicable to listed companies via the Colombo Stock Exchange
Listing Rules. While the Listing Rules provide regulation and legal framework for Corporate Governance, this Code is meant to provide
the operational structures / processes for discharging Corporate Governance activities.
Dialog Axiata plc follows the criterion which has to be followed with care as adhering to the code is of utmost importance for the firm in
terms of conduction a fair and transparent organization.
Section 1 : The Company Dialog Axiata plc
Directors
The Board Every public company should be headed by an effective Board, which
should direct, lead and control the Company.
Covered
Chairman And Chief
Executive Officer (CEO)
There are two key tasks at the top of every public company – conducting
of the business of the Board, and facilitating executive responsibility for
management of the Company’s business. There should be a clear
division of responsibilities at the head of the Company, which will
ensure a balance of power and authority, such that no one individual has
unfettered powers of decision.
Covered
Chairman’s Role The Chairman’s role in preserving good Corporate Governance is
crucial. As the person responsible for running the Board, the Chairman
should preserve order and facilitate the effective discharge of Board
functions.
Covered
Financial Acumen
The Board should ensure the availability within it of those with
sufficient financial acumen and knowledge to offer guidance on matters
of finance.
Covered
Board Balance It is preferable for the Board to have a balance of Executive and Non-
Executive Directors such that no individual or small group of
individuals can dominate the Board’s decision- taking
Covered
Supply Of Information The Board should be provided with timely information in a form and of
a quality appropriate to enable it discharge its duties.
Covered

CFA Society Sri Lanka Investment Research Challenge
Student Research October 1, 2013
21
Appointments To The Board There should be a formal and transparent procedure for the appointment
of new Directors to the Board.
Covered
Re Election All Directors should be required to submit themselves for re-election at
regular intervals and at least once every three years.
Covered
Appraisal Of Board
Performance
Boards should periodically appraise their own performance in order to
ensure that Board responsibilities are satisfactorily discharged.
Covered
Disclosure Of Information In
Respect Of Directors
Shareholders should be kept advised of relevant details in respect of
Directors.
Covered
Appraisal Of Chief Executive
Officer (CEO)
The Board should be required, at least annually, to assess the
performance of the CEO.
Covered
Directors’ Remuneration
Remuneration Procedure Companies should establish a formal and transparent procedure for
developing policy on executive remuneration and for fixing the
remuneration packages of individual Directors. No Director should be
involved in deciding his/her own remuneration.
Covered
The Level And Make Up Of
Remuneration
Levels of remuneration of both Executive and Non-executive Directors
should be sufficient to attract and retain the Directors needed to run the
Company successfully. A proportion of Executive Directors’
remuneration should be structured to link rewards to corporate and
individual performance.
Covered
Disclosure Of Remuneration
The Company’s Annual Report should contain a Statement of
Remuneration Policy and details of remuneration of the Board as a
whole
Covered
Relations With Shareholders
Constructive Use Of The
Annual General Meeting
(AGM) And
Conduct Of General
Meetings
Boards should use the AGM to communicate with shareholders and
should encourage their participation.
Covered
Major Transactions Further to compliance with the requirements under the Companies Act,
directors should disclose to shareholders all proposed corporate
transactions, which if entered into, would materially alter/vary the
Company’s net assets base or in the case of a company with
subsidiaries, the consolidated group net asset base.
Covered
Accountability And Audit
Financial Reporting The Board should present a balanced and understandable assessment of
the Company’s financial position, performance and prospects.
Covered
Internal Control The Board should maintain a sound system of internal control to
safeguard shareholders’ investments and the Company’s assets.
Covered
Audit Committee The Board should establish formal and transparent arrangements for
considering how they should select and apply accounting policies,
financial reporting and internal control principles and maintaining an
appropriate relationship with the Company’s Auditors.
Covered
Code Of Business Conduct
& Ethics
Companies must adopt a Code of Business Conduct & Ethics for
directors, and members of the senior management team and must
promptly disclose any waivers of the Code for directors or others.
Covered
Corporate Governance
Disclosures
Directors should be required to disclose the extent to which the
Company adheres to established principles and practices of good
Corporate Governance.
Covered
Section 2 : Shareholders
Institutional Investors
Shareholder Voting Institutional shareholders have a responsibility to make considered use
of their votes and should be encouraged to ensure their voting intentions
are translated into practice.
Covered
Evaluation Of Governance
Disclosures
When evaluating Companies’ governance arrangements, particularly
those relating to board structure and composition, institutional investors
should be encouraged to give due weight to all relevant factors drawn to
their attention.
Covered
Other Investors

CFA Society Sri Lanka Investment Research Challenge
Student Research October 1, 2013
22
Investing/ Divesting
Decision
Individual shareholders, investing directly in shares of companies
should be encouraged to carry out adequate analysis or seek
independent advice in investing or divesting decisions.
Covered
Shareholder Voting Individual shareholders should be encouraged to participate in General
Meetings of companies and exercise their voting rights.
Covered
Appendix 09 : Sustainability Reporting
The Global Reporting Initiative (GRI) is a leading organization in the sustainability field. GRI promotes the use of sustainability reporting
as a way for organizations to become more sustainable and contribute to sustainable development.
Within the years DIAL has been able to set targets as well as make progress to the set targets to an extent,
Economic
Introduce Vendor Code of Conduct - Vendor CoC introduced, incorporating requirements specified by ISO14001/SA8000.
Increase local procurement to 60% of total procurement -Local procurement spent was 37%.
Social
Increase regional employees to 25% of total employee base - Regional employee base increased to 23%.
Introduce human rights training- Few trainings on anti-sexual harassment were conducted.
Review whistle blowing policy and implement changes - Operationalization of whistle blowing policy reviewed through employee
focus-group discussions.
Distribute Sinhala and Tamil code of conduct booklets
Environment
Add 5 Green Base Stations to network -5 new sites added during 2012.
350 M-waste collection points by 2014 -120 collection points by end 2012.
Implement Environment Management System - Aspect-impact analysis complete.
Increase e-bill subscriber base by 25% - Achieved a 1222% growth in the e-bill subscriber base. Percentage of e-bill subscribers
increased from 1.58% to 20.93% in 2012 of the total base.
Reduce water consumption in office sites by 10% -Water consumption reduced by 7%. This maybe a result of the modified data
capturing system.
Add 300 more free cooling and hybrid sites to network - 70 more free cooling and hybrid sites added.
Introduce carbon calculator for customers-DIAL will carry this target to 2013 as progress was not made against the stated target.
Det Norske Veritas AS (‘DNV’) had also been commissioned by the Management of Dialog Axiata PLC for the assessment of Sustainable
business in their conclusion it was stated that Dialog Axiata PLC Sustainability Report - 2012, provides a fair representation of the
Company’s sustainability policies, objectives, management approach and performance during the reporting year. And it was confirmed that
the Report generally meets the requirements for GRI application level A+.

CFA Society Sri Lanka Investment Research Challenge
Student Research October 1, 2013
23
INDUSTRY OVERVIEW AND COMPETITIVE POSITIONING
Appendix 10 : Horizontal Business Models Network Guarantors
Offering network infrastructure and related services to other players
Capabilities:
Cost efficiency in the operation of their infrastructure
Scalability in replicating their technology platforms and operating models
Reliability in terms of network and IT availability and quality
Smoothly integrated IT platforms and applications
What next: Building these capabilities requires operators to make large investments in new fiber and LTE infrastructure, which may limit
competitors to government-led networking companies and operators willing to share costs with other like-minded players.
Business Enablers
Monetize assets by opening up their infrastructures and extending their business strategy.
Capabilities:
Ability to broker and manage relationships with different partners, offering tailored services to each
Flexibility and willingness to cater to the needs of partners with different business models
Capacity for aggregating platforms and services into attractive packages for its partners
Willingness to partner with others to augment portfolio of offerings
What next: Incumbents that have embraced the concept and plan to open up their networks and assets to third parties should build on their
partner management and wholesaling capabilities.
Experience Providers
Offer the best combination of targeted applications and content, and a high level of user experience.
Capabilities:
Ability to develop innovative new applications and services
Willingness to dedicate themselves to creating the best customer experience possible, including the ability to develop world-class
user interfaces.
Capacity for excellent customer management and service
What next: This model may be the most difficult for telecom operators to follow, given their lack of experience and questionable track
record in creating truly innovative new businesses. Moreover, the competition is already fierce.
Global Multi marketers
The largest telecom operators that have a real opportunity to expand their businesses into multiple segments and markets, through a
combination of the three models discussed above. The goal: to build value by creating synergies among different segments and markets, by
managing their portfolios effectively, and by replicating the necessary capabilities from market to market.
Capabilities:
Proficiency in going global—organizing, operating, and marketing across many different geographies, and thus thinking both
globally and locally
Capacity to develop different business models and accompanying capabilities that can be replicated in different markets without
increasing overall complexity
What next: Competition among these players will likely be limited to those that already have significant scale, and the willingness to
reorganize to push that scale even further.

CFA Society Sri Lanka Investment Research Challenge
Student Research October 1, 2013
24
Conclusion
Operators must begin making the strategic choices necessary to determine their future direction, deciding which of the four models—or
combination of models—works for them. This decision should depend, in part, on whether they can effectively leverage the capabilities
they already possess, and, in part, on careful consideration of their ability to build new ones.
Appendix 11 : Porter’s 5 Forces
Threat of new entrants
High barriers to enter the market 2
High customer loyalty to the current service provider 1
Finite amount of good radio spectrum 2
Ownership of telecommunication license 2
Expensive start-up costs 2
Average 9/5 = 2.5
Bargaining power of suppliers-less
Limited pool of talented managers and engineers 1
A number of large equipment makers around 2
Cheap Chinese Alternatives 2
Average 5/3 = 1.6
Bargaining power of buyers-moderate
Market is over populated with 5 service providers 2
Less switching cost 5
High customer loyalty 2
Differentiation is less 4
Single customer has less or no power 2
Average 15/5 = 3
Rivalry among existing firms
Asset specificity 4
High exit barriers 4
High fixed cost 4
Average 12/3 = 4
Threat of substitutes
Availability of OTT content providers and cable telecommunication providers 4
Easy and cheap access to data and internet via substitutes 3
Average 7/2 =3.5
Appendix 12 : SWOT of Sri Lanka Strengths
Advantage of multiple undersea cables ( this will help it
mitigate to the next generation network
Ranked only behind India ( in the SAARC region ) in the
global networked readiness index
NBN rollout is a landmark achievement for the region
Capability to provide sophisticated communications solutions
through world –class optical fiber connectivity as well as wired
and wireless broadband technology.
Weaknesses
Broadband penetration remains below the average of other
developing nations
Geographical coverage of high speed fixed internet services for
households remains below 50%
Opportunities
Rapid growth in the economic, social and cultural sectors
Significant improvements infrastructure
Ability to cater to the trends of internet enabled products
New hope for development and nation- building
National ICT targets have been clearly defined as 75% ICT
literacy
Treats
Increase in fuel prices
Hikes in energy costs
Rise of other input cost
Increase in operating costs ( mainly driven by inflationary
factors like the exchange rate risk)

CFA Society Sri Lanka Investment Research Challenge
Student Research October 1, 2013
25
The e-Government project continues on a positive note
FINANCIAL ANALYSIS
Appendix 13 : Key Financial Ratios
(LKR 000 000) 2010 2011 2012 2013E 2014E 2015E 2016E 2017E 2018E
Liquidity Ratios
Current Ratio
0.82
0.96
0.54
0.66
0.77
0.86
1.01
1.25
1.66
Quick ratio
0.81
0.94
0.53
0.65
0.76
0.85
1.00
1.24
1.65
Cash ratio
0.29
0.48
0.22
0.28
0.39
0.46
0.60
0.82
1.21
Efficiency Ratios
Asset Turnover 0.57 0.60 0.62 0.65 0.63 0.65 0.67 0.67 0.65
Inventory turnover 95.12 71.36 82.47 86.90 91.25 93.59 93.59 93.59 93.59
Inventory turnover days 3.84 5.11 4.43 4.2 4.0 3.9 3.9 3.9 3.9
Receivable turnover 4.03 4.36 4.56 4.68 4.87 5.21 5.14 5.07 5.00
Receivable turnover days 90.53 83.72 80.00 78 75 70 71 72 73
Payable turnover
7.20
9.64
8.08 7.93 7.77 7.45 7.30 7.16 7.02
Payable turnover days
50.68
37.84
45.20 46 47 49 50 51 52
Cash conversion cycle
134.97
117.23
117.27
118.90
119.25
114.59
114.59
114.59
114.59
Profitability Ratios
GP Margin 43% 45% 43% 44% 45% 47% 48% 50% 51%
NP Margin 12% 11% 11% 7% 10% 13% 14% 15% 16%
EBITDA Margin 28% 36% 33% 38% 41% 43% 45% 47% 48%
EBIT Margin 13% 14% 12% 14% 16% 18% 20% 21% 23%
ROA 7% 7% 7% 5% 7% 9% 10% 11% 11%
ROE 17% 15% 16% 11% 16% 20% 20% 21% 20%
Solvency Ratios
Debt Ratio 59% 56% 59% 60% 61% 58% 54% 51% 48%
Debt/equity 78% 63% 64% 70% 80% 67% 53% 46% 41%
Interest Cover
21.88
5.2
2.24
2.18
3.69
5.65
5.04
5.39
5.69
Cash Flow Ratios
CAPEX/Revenue 19% 19% 31% 30% 40% 30% 25% 25% 20%
Cash flow to debt 34% 43% 40% 40% 42% 46% 52% 54% 56%
CFO/CAPEX (Internal financing of
CAPEX) 181% 220% 123% 123% 101% 136% 165% 165% 208%

CFA Society Sri Lanka Investment Research Challenge
Student Research October 1, 2013
26
Investment Risk
Appendix 14 – Foreign Exchange Loss
LKR has depreciated by 4.5% since the beginning of FY13 however do not expect a further currency depreciation because firstly according
to the Central Bank of Sri Lanka the 3 month forward USD exchange rate is at LKR 135.6 secondly in our opinion with the NSB USD
bond inflow CBSL would be able to maintain the LKR. However with the economic changes expected in US with the possible tapering
Quantitative Easing (QE) we could expect these conditions to change in the extended period of our forecast. Following of table shows the
inflation rate and interest rate parity between the two countries.
US Sri Lanka
Inflation Rate 1.7% - 2.0% 6% - 7%
Therefore we assume the currency to depreciate at 5%- 6% or more in the future considering the inflation rate interest rate differential
between US and Sri Lanka.
The graph 1 shows the LKR NEER and REER movement during the reporting period. REER and NEER is the relative exchange rate
against a basket of goods in selected foreign currencies. REER is the rate adjusted for the inflation rate. It is clear that the LKR is
depreciating from the uptick trend in the REER and NEER charts.
In addition the current situation in the BOP and the government’s financing we could conclude that LKR would see a further depreciation.
Following graphs are indicative of the debt servicing ratio of the country and the net foreign inflows. This is indicative of the high demand
for USD during the forecasted period causing the LKR to further depreciate. Therefore in our opinion LKR depreciation could be expected
to be greater than our estimate. (Graph 2)
*2013 figures are as at June Graph 2 – USD/LKR and Export/Foreign Debt
Graph 1 – Reer Neer
Appendix 14 : Risk Mitigation

CFA Society Sri Lanka Investment Research Challenge
Student Research October 1, 2013
27
ABBREVIATIONS CAGR Compounded Annual Growth Rate
Capex Capital Expenditure
CAPM Capital Asset Pricing Model
COS Cost of Sales
DBN Dialog Broad band Network
DCF Discounted Cash Flow
DIAL Dialog Axiata PLC
DTV Dialog TV
DY Dividend Yeild
EBIT Earnings Before Interest and Tax
EBITDA Earnings Before Interest Tax Depreciation and Amortization
EV Enterprise Value
FCF Free Cash Flow
FCFE Free Cash Flow the Equity
FCFF Free Cash Flow to Firm
FDD Frequency Division Duplex
FDI Foreign Direct Investment
FD-LTE Long Term Evolution
GP Gross Profit
GRI Global Reporting Initiative
HDTV High Definition Television
HSPA High Speed packet Access
ICT Information Communication Technology
Kd Cost of Debt
Ke Cost of Equity
LKR Lanka Rupee
OTT Over the top players
PB Price to Book Value
PE Price Earnings Ratio
PESTEL Political, Economic, Socio Cultural, Technological, Environmental and Legal
R&D Research and Development
SLTL Sri Lanka Telecom
Telco Telecom
TGR Terminal Growth Rate
TRC Telecommunication Regulatory Commission
USD United State of America Dollar
WACC Weighted Average Cost of Capital

CFA Society Sri Lanka Investment Research Challenge
Student Research October 1, 2013
28
Disclosures: Ownership and material conflicts of interest:
The author(s), or a member of their household, of this report does not hold a financial interest in the securities of this company.
The author(s), or a member of their household, of this report does not know of the existence of any conflicts of interest that might bias the content
or publication of this report.
Receipt of compensation:
Compensation of the author(s) of this report is not based on investment banking revenue.
Position as a officer or director:
The author(s), or a member of their household, does not serve as an officer, director or advisory board member of the subject company.
Market making:
The author(s) does not act as a market maker in the subject company’s securities.
Disclaimer:
The information set forth herein has been obtained or derived from sources generally available to the public and believed by the author(s) to be
reliable, but the author(s) does not make any representation or warranty, express or implied, as to its accuracy or completeness. The information is
not intended to be used as the basis of any investment decisions by any person or entity. This information does not constitute investment advice,
nor is it an offer or a solicitation of an offer to buy or sell any security. This report should not be considered to be a recommendation by any
individual affiliated with CFA Society of Sri Lanka, CFA Institute or the CFA Institute Research Challenge with regard to this company’s stock.
CFA Institute Research Challenge