Analiza Principalilor Indicatori Financiari - SC Albalact SA
Upload
doannguyetCategory
view
219download
0
CFA Institute Research Challenge
Hosted in Romania
The Bucharest University of Economic Studies
CFA Institute Research Challenge | 15 Feb 2016
1
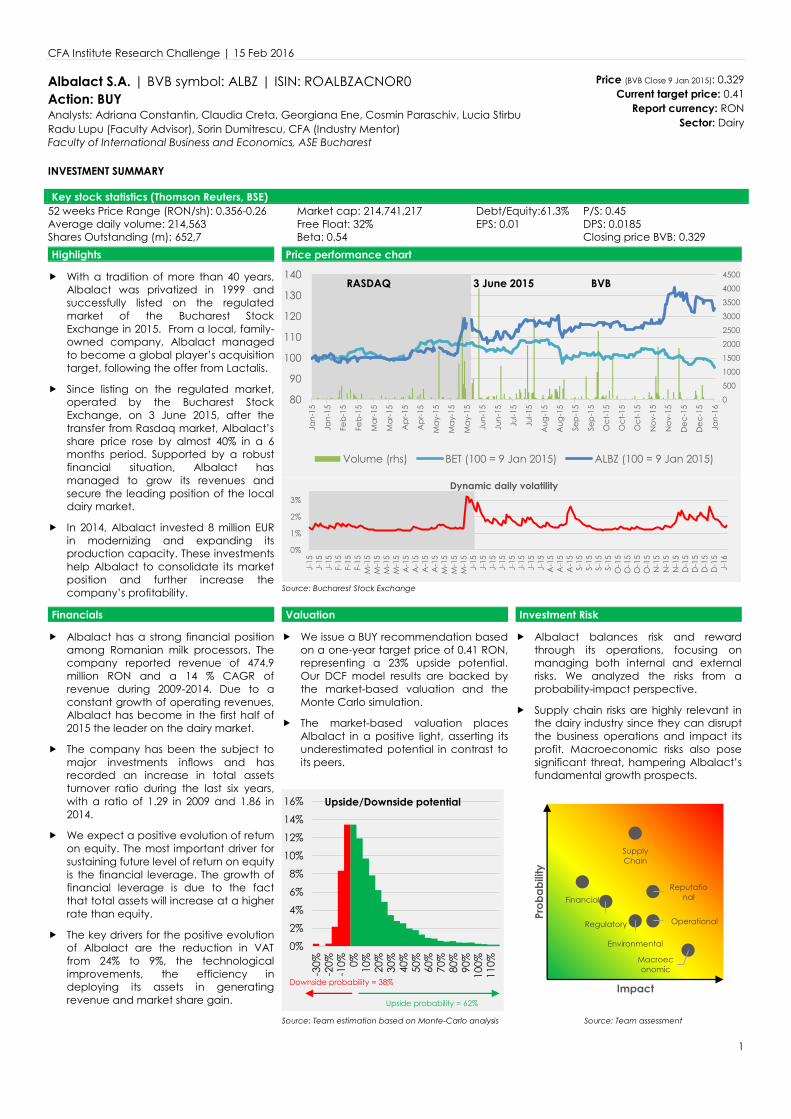
Albalact S.A. | BVB symbol: ALBZ | ISIN: ROALBZACNOR0 Action: BUY Analysts: Adriana Constantin, Claudia Creta, Georgiana Ene, Cosmin Paraschiv, Lucia Stirbu Radu Lupu (Faculty Advisor), Sorin Dumitrescu, CFA (Industry Mentor) Faculty of International Business and Economics, ASE Bucharest INVESTMENT SUMMARY
Price (BVB Close 9 Jan 2015): 0.329 Current target price: 0.41
Report currency: RON Sector: Dairy
Key stock statistics (Thomson Reuters, BSE)
52 weeks Price Range (RON/sh): 0.356-0.26 Market cap: 214,741,217 Debt/Equity:61.3% P/S: 0.45 Average daily volume: 214,563 Free Float: 32% EPS: 0.01 DPS: 0.0185 Shares Outstanding (m): 652,7 Beta: 0.54 Closing price BVB: 0.329
Highlights Price performance chart
f With a tradition of more than 40 years, Albalact was privatized in 1999 and successfully listed on the regulated market of the Bucharest Stock Exchange in 2015. From a local, family-owned company, Albalact managed to become a global player’s acquisition target, following the offer from Lactalis.
f Since listing on the regulated market, operated by the Bucharest Stock Exchange, on 3 June 2015, after the transfer from Rasdaq market, Albalact’s share price rose by almost 40% in a 6 months period. Supported by a robust financial situation, Albalact has managed to grow its revenues and secure the leading position of the local dairy market.
f In 2014, Albalact invested 8 million EUR in modernizing and expanding its production capacity. These investments help Albalact to consolidate its market position and further increase the company’s profitability.
Source: Bucharest Stock Exchange
Financials Valuation Investment Risk f Albalact has a strong financial position
among Romanian milk processors. The company reported revenue of 474.9 million RON and a 14 % CAGR of revenue during 2009-2014. Due to a constant growth of operating revenues, Albalact has become in the first half of 2015 the leader on the dairy market.
f The company has been the subject to major investments inflows and has recorded an increase in total assets turnover ratio during the last six years, with a ratio of 1.29 in 2009 and 1.86 in 2014.
f We expect a positive evolution of return on equity. The most important driver for sustaining future level of return on equity is the financial leverage. The growth of financial leverage is due to the fact that total assets will increase at a higher rate than equity.
f The key drivers for the positive evolution of Albalact are the reduction in VAT from 24% to 9%, the technological improvements, the efficiency in deploying its assets in generating revenue and market share gain.
f We issue a BUY recommendation based on a one-year target price of 0.41 RON, representing a 23% upside potential. Our DCF model results are backed by the market-based valuation and the Monte Carlo simulation.
f The market-based valuation places Albalact in a positive light, asserting its underestimated potential in contrast to its peers.
f Albalact balances risk and reward through its operations, focusing on managing both internal and external risks. We analyzed the risks from a probability-impact perspective.
f Supply chain risks are highly relevant in the dairy industry since they can disrupt the business operations and impact its profit. Macroeconomic risks also pose significant threat, hampering Albalact’s fundamental growth prospects.
Source: Team estimation based on Monte-Carlo analysis Source: Team assessment
0
500
1000
1500
2000
2500
3000
3500
4000
4500
80
90
100
110
120
130
140
Jan-
15
Jan-
15
Feb-
15
Feb-
15
Mar
-15
Mar
-15
Apr
-15
Apr
-15
May
-15
May
-15
May
-15
Jun-
15
Jun-
15
Jul-1
5
Jul-1
5
Aug
-15
Aug
-15
Sep
-15
Sep
-15
Oct
-15
Oct
-15
Oct
-15
Nov
-15
Nov
-15
Dec
-15
Dec
-15
Jan-
16
Volume (rhs) BET (100 = 9 Jan 2015) ALBZ (100 = 9 Jan 2015)
RASDAQ 3 June 2015 BVB
0%
1%
2%
3%
J-15
J-15
J-15
F-15
F-15
F-15
M-1
5M
-15
M-1
5M
-15
A-1
5A
-15
A-1
5A
-15
M-1
5M
-15
M-1
5J-
15J-
15J-
15J-
15J-
15J-
15J-
15J-
15A
-15
A-1
5A
-15
S-15
S-15
S-15
S-15
O-1
5O
-15
O-1
5O
-15
N-1
5N
-15
N-1
5D
-15
D-1
5D
-15
D-1
5J-
16
Dynamic daily volatility
0%
2%
4%
6%
8%
10%
12%
14%
16%
-30%
-20%
-10% 0% 10
%20
%30
%40
%50
%60
%70
%80
%90
%10
0%11
0%
Upside/Downside potential
Upside probability = 62%
Downside probability = 38%
Supply Chain
Financial
Regulatory
Reputational
Environmental
Operational
Macroeconomic
Prob
abilit
y
Impact
CFA Institute Research Challenge | 15 Feb 2016
2
Update: Lactalis set to take over Albalact A statement issued by Albalact on 28th of January reveals that Lactalis has reached an agreement to acquire shares representing in aggregate 70.3% of the company’s capital. The price will be determined by deducting from 407.3 million RON the contractually agreed adjusted net debt of 118.2 million RON. Following the approval of Romania’s Competition Council and after all other conditions are met, Lactalis will launch a public takeover bid, targeting 100% of Albalact’s shares. This would translate into a price per share of 0.4543 RON, representing a premium of approximately 37% over the closing price of Albalact shares on 27th of January 2016, as quoted on the Bucharest Stock Exchange. In this case of a strategic acquisition, price is not solely determined by the estimated enterprise value. Brand, economies of scale, market share gain, synergies, are also relevant factors that backed the ~40% premium. Even though our valuation was conducted before the public announcement (9th January 2016), the results are not conflicting with Lactalis’ assessment, both revealing a significant upside potential and hinting towards a strong buy decision.
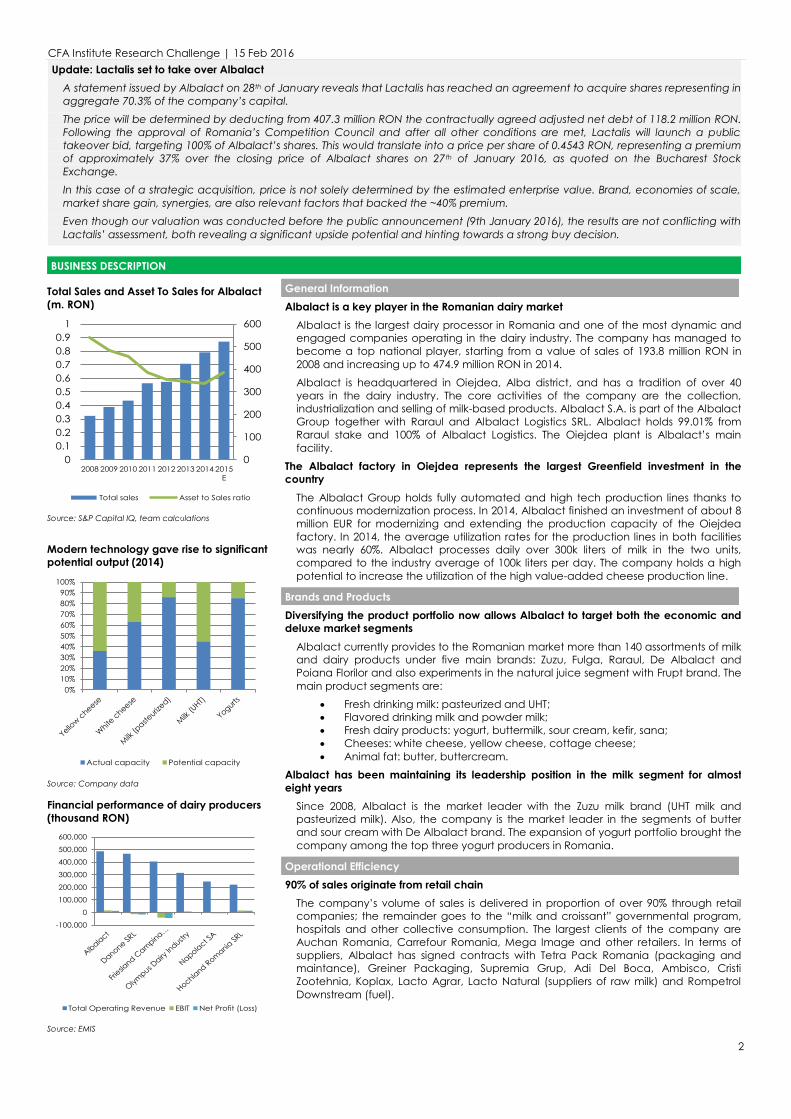
BUSINESS DESCRIPTION Total Sales and Asset To Sales for Albalact (m. RON)
Source: S&P Capital IQ, team calculations Modern technology gave rise to significant potential output (2014)
Source: Company data Financial performance of dairy producers (thousand RON)
Source: EMIS
General Information Albalact is a key player in the Romanian dairy market
Albalact is the largest dairy processor in Romania and one of the most dynamic and engaged companies operating in the dairy industry. The company has managed to become a top national player, starting from a value of sales of 193.8 million RON in 2008 and increasing up to 474.9 million RON in 2014. Albalact is headquartered in Oiejdea, Alba district, and has a tradition of over 40 years in the dairy industry. The core activities of the company are the collection, industrialization and selling of milk-based products. Albalact S.A. is part of the Albalact Group together with Raraul and Albalact Logistics SRL. Albalact holds 99.01% from Raraul stake and 100% of Albalact Logistics. The Oiejdea plant is Albalact’s main facility.
The Albalact factory in Oiejdea represents the largest Greenfield investment in the country
The Albalact Group holds fully automated and high tech production lines thanks to continuous modernization process. In 2014, Albalact finished an investment of about 8 million EUR for modernizing and extending the production capacity of the Oiejdea factory. In 2014, the average utilization rates for the production lines in both facilities was nearly 60%. Albalact processes daily over 300k liters of milk in the two units, compared to the industry average of 100k liters per day. The company holds a high potential to increase the utilization of the high value-added cheese production line.
Brands and Products Diversifying the product portfolio now allows Albalact to target both the economic and deluxe market segments
Albalact currently provides to the Romanian market more than 140 assortments of milk and dairy products under five main brands: Zuzu, Fulga, Raraul, De Albalact and Poiana Florilor and also experiments in the natural juice segment with Frupt brand. The main product segments are:
x Fresh drinking milk: pasteurized and UHT; x Flavored drinking milk and powder milk; x Fresh dairy products: yogurt, buttermilk, sour cream, kefir, sana; x Cheeses: white cheese, yellow cheese, cottage cheese; x Animal fat: butter, buttercream.
Albalact has been maintaining its leadership position in the milk segment for almost eight years
Since 2008, Albalact is the market leader with the Zuzu milk brand (UHT milk and pasteurized milk). Also, the company is the market leader in the segments of butter and sour cream with De Albalact brand. The expansion of yogurt portfolio brought the company among the top three yogurt producers in Romania.
Operational Efficiency 90% of sales originate from retail chain
The company’s volume of sales is delivered in proportion of over 90% through retail companies; the remainder goes to the “milk and croissant” governmental program, hospitals and other collective consumption. The largest clients of the company are Auchan Romania, Carrefour Romania, Mega Image and other retailers. In terms of suppliers, Albalact has signed contracts with Tetra Pack Romania (packaging and maintance), Greiner Packaging, Supremia Grup, Adi Del Boca, Ambisco, Cristi Zootehnia, Koplax, Lacto Agrar, Lacto Natural (suppliers of raw milk) and Rompetrol Downstream (fuel).
0
100
200
300
400
500
600
00.10.20.30.40.50.60.70.80.9
1
2008 2009 2010 2011 2012 2013 2014 2015E
Total sales Asset to Sales ratio
0%10%20%30%40%50%60%70%80%90%
100%
Actual capacity Potential capacity
-100,000
0
100,000
200,000
300,000
400,000
500,000
600,000
Total Operating Revenue EBIT Net Profit (Loss)
CFA Institute Research Challenge | 15 Feb 2016
3
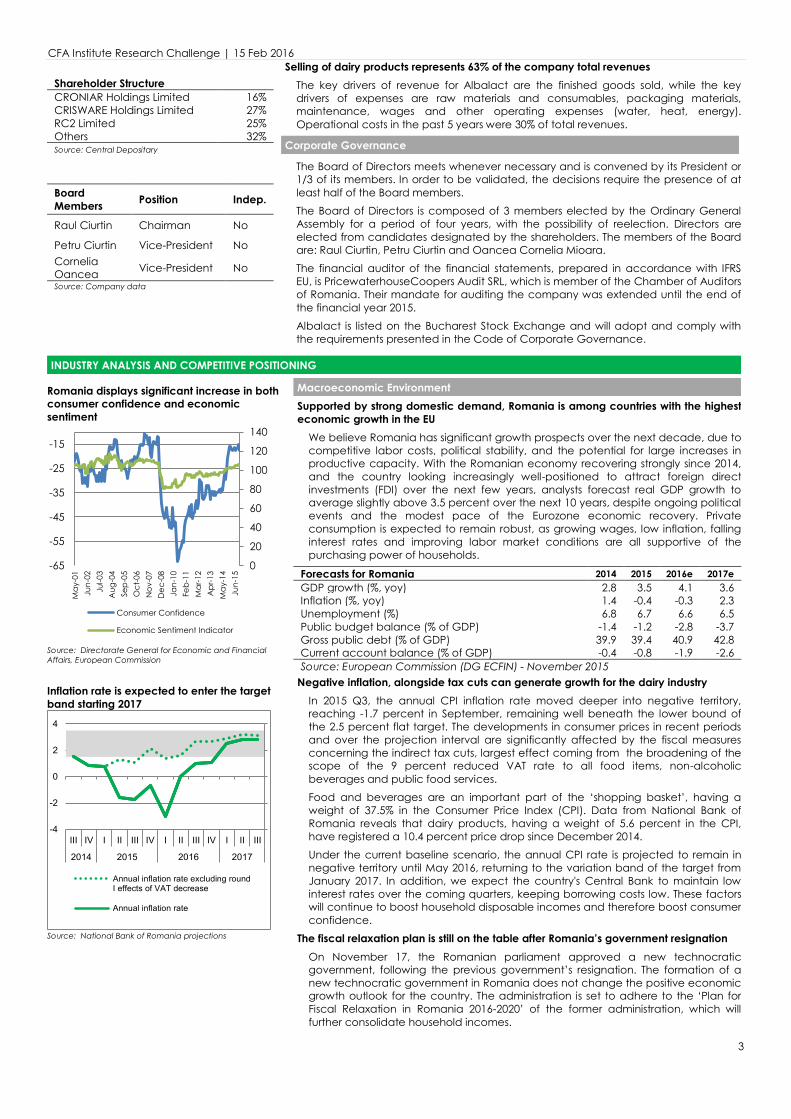
Shareholder Structure CRONIAR Holdings Limited 16% CRISWARE Holdings Limited 27% RC2 Limited 25% Others 32% Source: Central Depositary
Board Members Position Indep.
Raul Ciurtin Chairman No
Petru Ciurtin Vice-President No Cornelia Oancea Vice-President No Source: Company data
Selling of dairy products represents 63% of the company total revenues The key drivers of revenue for Albalact are the finished goods sold, while the key drivers of expenses are raw materials and consumables, packaging materials, maintenance, wages and other operating expenses (water, heat, energy). Operational costs in the past 5 years were 30% of total revenues.
Corporate Governance
The Board of Directors meets whenever necessary and is convened by its President or 1/3 of its members. In order to be validated, the decisions require the presence of at least half of the Board members. The Board of Directors is composed of 3 members elected by the Ordinary General Assembly for a period of four years, with the possibility of reelection. Directors are elected from candidates designated by the shareholders. The members of the Board are: Raul Ciurtin, Petru Ciurtin and Oancea Cornelia Mioara. The financial auditor of the financial statements, prepared in accordance with IFRS EU, is PricewaterhouseCoopers Audit SRL, which is member of the Chamber of Auditors of Romania. Their mandate for auditing the company was extended until the end of the financial year 2015. Albalact is listed on the Bucharest Stock Exchange and will adopt and comply with the requirements presented in the Code of Corporate Governance.
INDUSTRY ANALYSIS AND COMPETITIVE POSITIONING Romania displays significant increase in both consumer confidence and economic sentiment
Source: Directorate General for Economic and Financial Affairs, European Commission Inflation rate is expected to enter the target band starting 2017
Source: National Bank of Romania projections
Macroeconomic Environment Supported by strong domestic demand, Romania is among countries with the highest economic growth in the EU
We believe Romania has significant growth prospects over the next decade, due to competitive labor costs, political stability, and the potential for large increases in productive capacity. With the Romanian economy recovering strongly since 2014, and the country looking increasingly well-positioned to attract foreign direct investments (FDI) over the next few years, analysts forecast real GDP growth to average slightly above 3.5 percent over the next 10 years, despite ongoing political events and the modest pace of the Eurozone economic recovery. Private consumption is expected to remain robust, as growing wages, low inflation, falling interest rates and improving labor market conditions are all supportive of the purchasing power of households.
Forecasts for Romania 2014 2015 2016e 2017e GDP growth (%, yoy) 2.8 3.5 4.1 3.6 Inflation (%, yoy) 1.4 -0.4 -0.3 2.3 Unemployment (%) 6.8 6.7 6.6 6.5 Public budget balance (% of GDP) -1.4 -1.2 -2.8 -3.7 Gross public debt (% of GDP) 39.9 39.4 40.9 42.8 Current account balance (% of GDP) -0.4 -0.8 -1.9 -2.6 Source: European Commission (DG ECFIN) - November 2015
Negative inflation, alongside tax cuts can generate growth for the dairy industry In 2015 Q3, the annual CPI inflation rate moved deeper into negative territory, reaching -1.7 percent in September, remaining well beneath the lower bound of the 2.5 percent flat target. The developments in consumer prices in recent periods and over the projection interval are significantly affected by the fiscal measures concerning the indirect tax cuts, largest effect coming from the broadening of the scope of the 9 percent reduced VAT rate to all food items, non-alcoholic beverages and public food services. Food and beverages are an important part of the ‘shopping basket’, having a weight of 37.5% in the Consumer Price Index (CPI). Data from National Bank of Romania reveals that dairy products, having a weight of 5.6 percent in the CPI, have registered a 10.4 percent price drop since December 2014. Under the current baseline scenario, the annual CPI rate is projected to remain in negative territory until May 2016, returning to the variation band of the target from January 2017. In addition, we expect the country's Central Bank to maintain low interest rates over the coming quarters, keeping borrowing costs low. These factors will continue to boost household disposable incomes and therefore boost consumer confidence.
The fiscal relaxation plan is still on the table after Romania’s government resignation On November 17, the Romanian parliament approved a new technocratic government, following the previous government’s resignation. The formation of a new technocratic government in Romania does not change the positive economic growth outlook for the country. The administration is set to adhere to the ‘Plan for Fiscal Relaxation in Romania 2016-2020’ of the former administration, which will further consolidate household incomes.
0
20
40
60
80
100
120
140
-65
-55
-45
-35
-25
-15
May
-01
Jun-
02Ju
l-03
Aug
-04
Sep
-05
Oct
-06
Nov
-07
Dec
-08
Jan-
10Fe
b-11
Mar
-12
Apr
-13
May
-14
Jun-
15
Consumer Confidence
Economic Sentiment Indicator
-4
-2
0
2
4
IIIIIIIVIIIIIIIVIIIIIIIVIII
2017201620152014
Annual inflation rate excluding roundI effects of VAT decrease
Annual inflation rate
CFA Institute Research Challenge | 15 Feb 2016
4
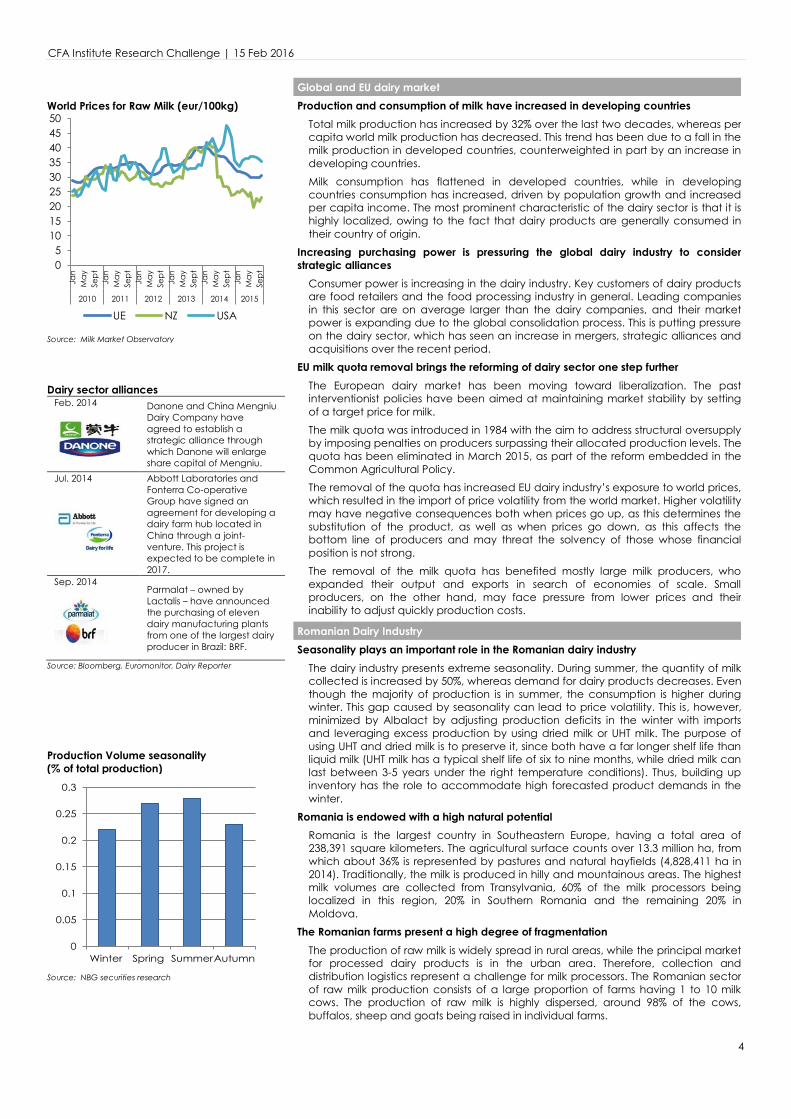
World Prices for Raw Milk (eur/100kg)
Source: Milk Market Observatory Dairy sector alliances
Feb. 2014
Danone and China Mengniu Dairy Company have agreed to establish a strategic alliance through which Danone will enlarge share capital of Mengniu.
Jul. 2014
Abbott Laboratories and Fonterra Co-operative Group have signed an agreement for developing a dairy farm hub located in China through a joint-venture. This project is expected to be complete in 2017.
Sep. 2014
Parmalat – owned by Lactalis – have announced the purchasing of eleven dairy manufacturing plants from one of the largest dairy producer in Brazil: BRF.
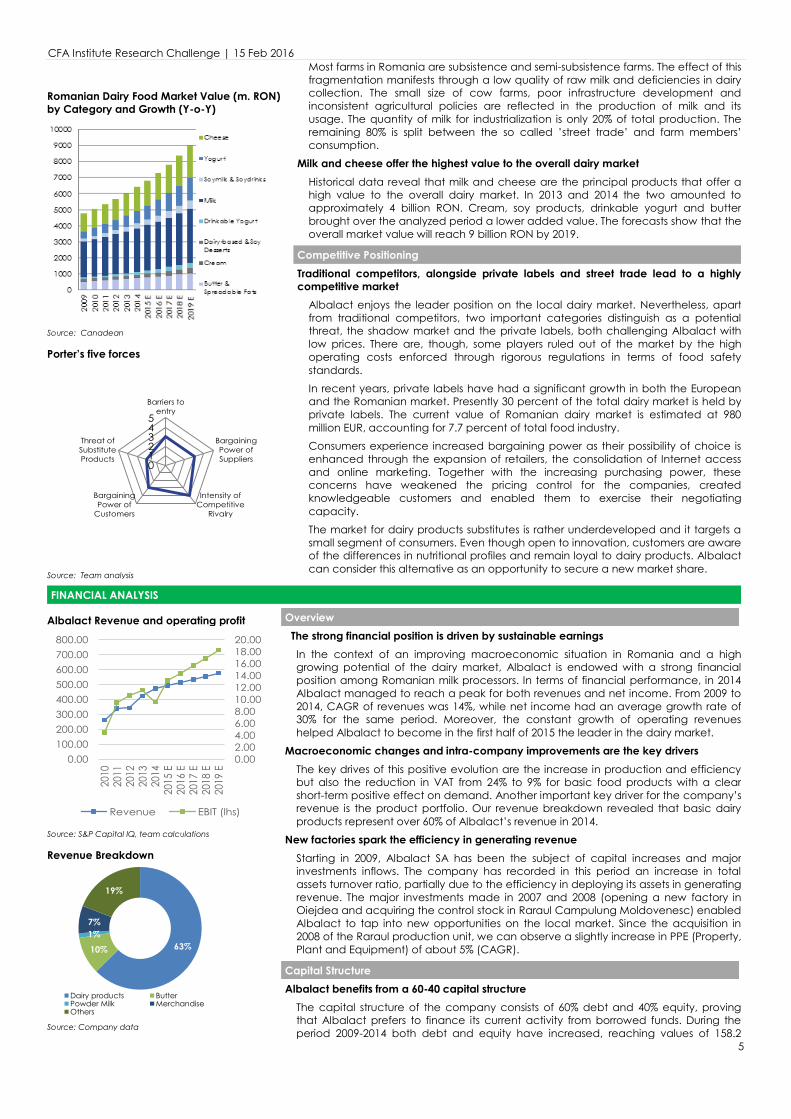
Source: Bloomberg, Euromonitor, Dairy Reporter Production Volume seasonality (% of total production)
Source: NBG securities research
Global and EU dairy market Production and consumption of milk have increased in developing countries
Total milk production has increased by 32% over the last two decades, whereas per capita world milk production has decreased. This trend has been due to a fall in the milk production in developed countries, counterweighted in part by an increase in developing countries. Milk consumption has flattened in developed countries, while in developing countries consumption has increased, driven by population growth and increased per capita income. The most prominent characteristic of the dairy sector is that it is highly localized, owing to the fact that dairy products are generally consumed in their country of origin.
Increasing purchasing power is pressuring the global dairy industry to consider strategic alliances
Consumer power is increasing in the dairy industry. Key customers of dairy products are food retailers and the food processing industry in general. Leading companies in this sector are on average larger than the dairy companies, and their market power is expanding due to the global consolidation process. This is putting pressure on the dairy sector, which has seen an increase in mergers, strategic alliances and acquisitions over the recent period.
EU milk quota removal brings the reforming of dairy sector one step further The European dairy market has been moving toward liberalization. The past interventionist policies have been aimed at maintaining market stability by setting of a target price for milk. The milk quota was introduced in 1984 with the aim to address structural oversupply by imposing penalties on producers surpassing their allocated production levels. The quota has been eliminated in March 2015, as part of the reform embedded in the Common Agricultural Policy. The removal of the quota has increased EU dairy industry’s exposure to world prices, which resulted in the import of price volatility from the world market. Higher volatility may have negative consequences both when prices go up, as this determines the substitution of the product, as well as when prices go down, as this affects the bottom line of producers and may threat the solvency of those whose financial position is not strong. The removal of the milk quota has benefited mostly large milk producers, who expanded their output and exports in search of economies of scale. Small producers, on the other hand, may face pressure from lower prices and their inability to adjust quickly production costs.
Romanian Dairy Industry Seasonality plays an important role in the Romanian dairy industry
The dairy industry presents extreme seasonality. During summer, the quantity of milk collected is increased by 50%, whereas demand for dairy products decreases. Even though the majority of production is in summer, the consumption is higher during winter. This gap caused by seasonality can lead to price volatility. This is, however, minimized by Albalact by adjusting production deficits in the winter with imports and leveraging excess production by using dried milk or UHT milk. The purpose of using UHT and dried milk is to preserve it, since both have a far longer shelf life than liquid milk (UHT milk has a typical shelf life of six to nine months, while dried milk can last between 3-5 years under the right temperature conditions). Thus, building up inventory has the role to accommodate high forecasted product demands in the winter.
Romania is endowed with a high natural potential Romania is the largest country in Southeastern Europe, having a total area of 238,391 square kilometers. The agricultural surface counts over 13.3 million ha, from which about 36% is represented by pastures and natural hayfields (4,828,411 ha in 2014). Traditionally, the milk is produced in hilly and mountainous areas. The highest milk volumes are collected from Transylvania, 60% of the milk processors being localized in this region, 20% in Southern Romania and the remaining 20% in Moldova.
The Romanian farms present a high degree of fragmentation The production of raw milk is widely spread in rural areas, while the principal market for processed dairy products is in the urban area. Therefore, collection and distribution logistics represent a challenge for milk processors. The Romanian sector of raw milk production consists of a large proportion of farms having 1 to 10 milk cows. The production of raw milk is highly dispersed, around 98% of the cows, buffalos, sheep and goats being raised in individual farms.
05
101520253035404550
Jan
May
Sep
tJa
nM
aySe
pt
Jan
May
Sep
tJa
nM
aySe
pt
Jan
May
Sep
tJa
nM
aySe
pt
2010 2011 2012 2013 2014 2015
UE NZ USA
0
0.05
0.1
0.15
0.2
0.25
0.3
Winter Spring SummerAutumn
CFA Institute Research Challenge | 15 Feb 2016
5
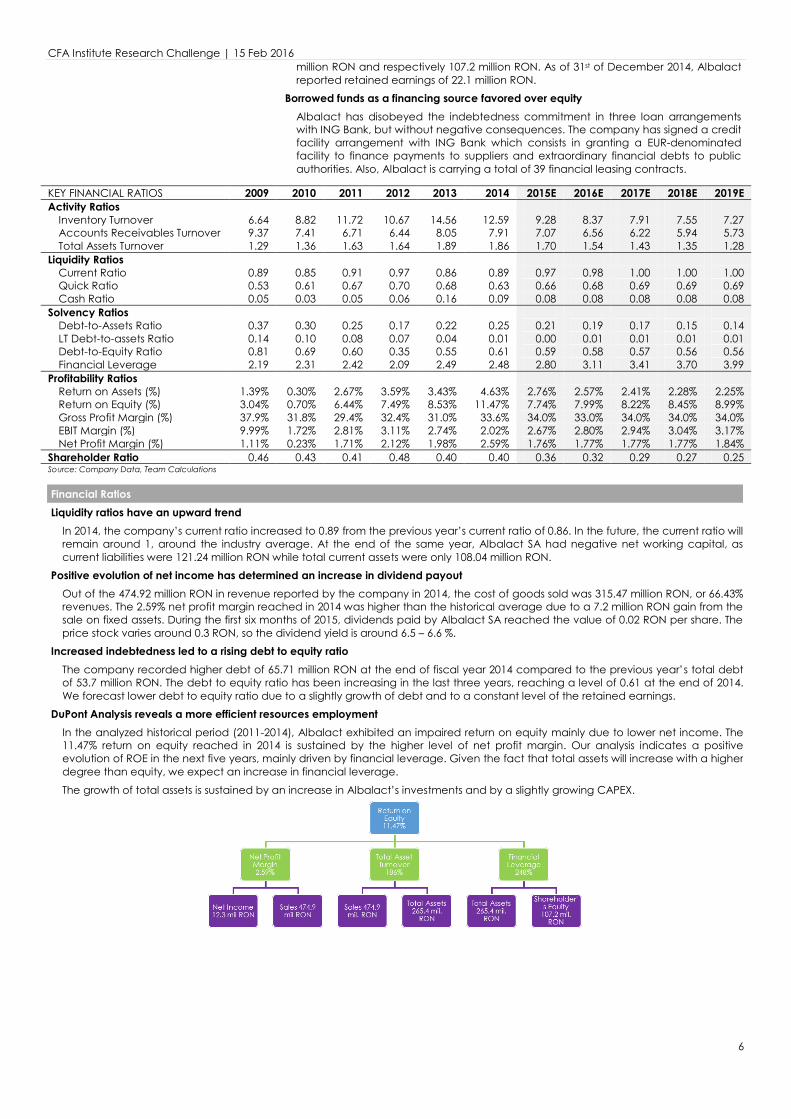
Romanian Dairy Food Market Value (m. RON) by Category and Growth (Y-o-Y)
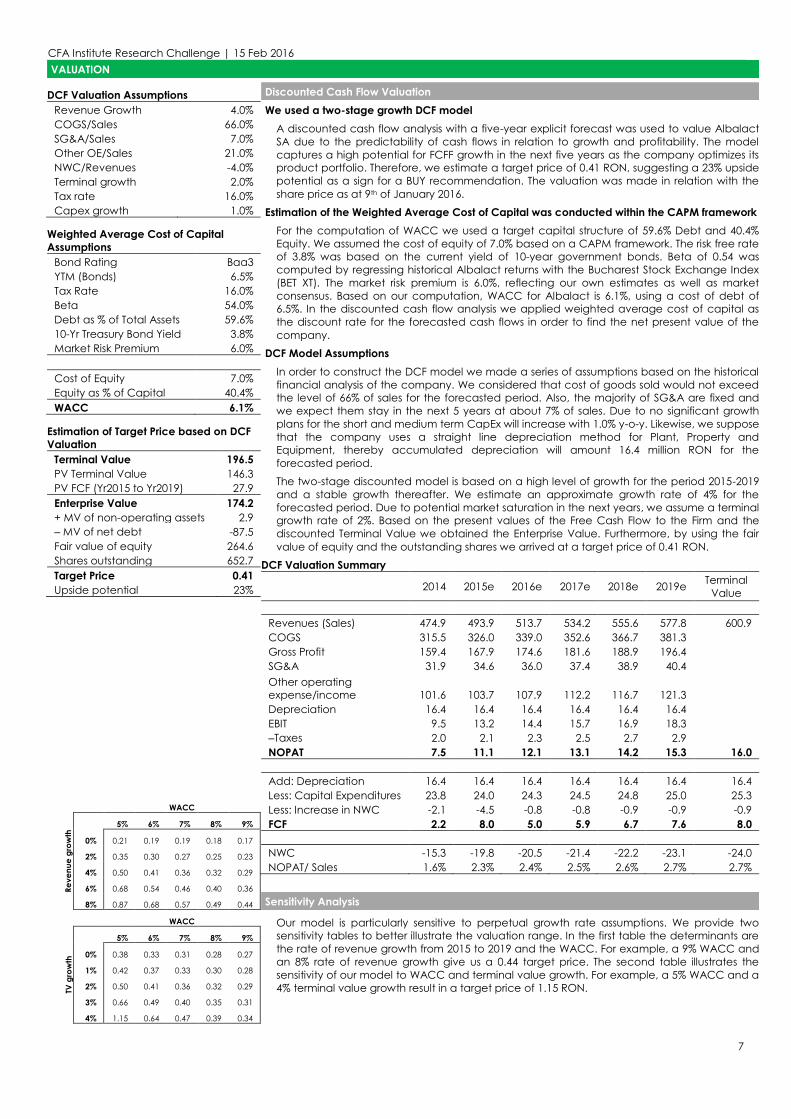
Source: Canadean Porter’s five forces
Source: Team analysis
Most farms in Romania are subsistence and semi-subsistence farms. The effect of this fragmentation manifests through a low quality of raw milk and deficiencies in dairy collection. The small size of cow farms, poor infrastructure development and inconsistent agricultural policies are reflected in the production of milk and its usage. The quantity of milk for industrialization is only 20% of total production. The remaining 80% is split between the so called ’street trade’ and farm members’ consumption.
Milk and cheese offer the highest value to the overall dairy market Historical data reveal that milk and cheese are the principal products that offer a high value to the overall dairy market. In 2013 and 2014 the two amounted to approximately 4 billion RON. Cream, soy products, drinkable yogurt and butter brought over the analyzed period a lower added value. The forecasts show that the overall market value will reach 9 billion RON by 2019.
Competitive Positioning Traditional competitors, alongside private labels and street trade lead to a highly competitive market
Albalact enjoys the leader position on the local dairy market. Nevertheless, apart from traditional competitors, two important categories distinguish as a potential threat, the shadow market and the private labels, both challenging Albalact with low prices. There are, though, some players ruled out of the market by the high operating costs enforced through rigorous regulations in terms of food safety standards. In recent years, private labels have had a significant growth in both the European and the Romanian market. Presently 30 percent of the total dairy market is held by private labels. The current value of Romanian dairy market is estimated at 980 million EUR, accounting for 7.7 percent of total food industry. Consumers experience increased bargaining power as their possibility of choice is enhanced through the expansion of retailers, the consolidation of Internet access and online marketing. Together with the increasing purchasing power, these concerns have weakened the pricing control for the companies, created knowledgeable customers and enabled them to exercise their negotiating capacity. The market for dairy products substitutes is rather underdeveloped and it targets a small segment of consumers. Even though open to innovation, customers are aware of the differences in nutritional profiles and remain loyal to dairy products. Albalact can consider this alternative as an opportunity to secure a new market share.
FINANCIAL ANALYSIS Albalact Revenue and operating profit
Source: S&P Capital IQ, team calculations Revenue Breakdown
Source: Company data
Overview The strong financial position is driven by sustainable earnings
In the context of an improving macroeconomic situation in Romania and a high growing potential of the dairy market, Albalact is endowed with a strong financial position among Romanian milk processors. In terms of financial performance, in 2014 Albalact managed to reach a peak for both revenues and net income. From 2009 to 2014, CAGR of revenues was 14%, while net income had an average growth rate of 30% for the same period. Moreover, the constant growth of operating revenues helped Albalact to become in the first half of 2015 the leader in the dairy market.
Macroeconomic changes and intra-company improvements are the key drivers The key drives of this positive evolution are the increase in production and efficiency but also the reduction in VAT from 24% to 9% for basic food products with a clear short-term positive effect on demand. Another important key driver for the company’s revenue is the product portfolio. Our revenue breakdown revealed that basic dairy products represent over 60% of Albalact’s revenue in 2014.
New factories spark the efficiency in generating revenue Starting in 2009, Albalact SA has been the subject of capital increases and major investments inflows. The company has recorded in this period an increase in total assets turnover ratio, partially due to the efficiency in deploying its assets in generating revenue. The major investments made in 2007 and 2008 (opening a new factory in Oiejdea and acquiring the control stock in Raraul Campulung Moldovenesc) enabled Albalact to tap into new opportunities on the local market. Since the acquisition in 2008 of the Raraul production unit, we can observe a slightly increase in PPE (Property, Plant and Equipment) of about 5% (CAGR).
Capital Structure Albalact benefits from a 60-40 capital structure
The capital structure of the company consists of 60% debt and 40% equity, proving that Albalact prefers to finance its current activity from borrowed funds. During the period 2009-2014 both debt and equity have increased, reaching values of 158.2
012345Barriers to
entry
BargainingPower ofSuppliers
Intensity ofCompetitive
Rivalry
BargainingPower of
Customers
Threat ofSubstituteProducts
0.002.004.006.008.0010.0012.0014.0016.0018.0020.00
0.00100.00200.00300.00400.00500.00600.00700.00800.00
2010
2011
2012
2013
2014
2015
E20
16 E
2017
E20
18 E
2019
E
Revenue EBIT (lhs)
63%10%1%7%
19%
Dairy products ButterPowder Milk MerchandiseOthers
CFA Institute Research Challenge | 15 Feb 2016
6
KEY FINANCIAL RATIOS 2009 2010 2011 2012 2013 2014 2015E 2016E 2017E 2018E 2019E Activity Ratios
Inventory Turnover 6.64 8.82 11.72 10.67 14.56 12.59 9.28 8.37 7.91 7.55 7.27 Accounts Receivables Turnover 9.37 7.41 6.71 6.44 8.05 7.91 7.07 6.56 6.22 5.94 5.73 Total Assets Turnover 1.29 1.36 1.63 1.64 1.89 1.86 1.70 1.54 1.43 1.35 1.28
Liquidity Ratios Current Ratio 0.89 0.85 0.91 0.97 0.86 0.89 0.97 0.98 1.00 1.00 1.00 Quick Ratio 0.53 0.61 0.67 0.70 0.68 0.63 0.66 0.68 0.69 0.69 0.69 Cash Ratio 0.05 0.03 0.05 0.06 0.16 0.09 0.08 0.08 0.08 0.08 0.08
Solvency Ratios Debt-to-Assets Ratio 0.37 0.30 0.25 0.17 0.22 0.25 0.21 0.19 0.17 0.15 0.14 LT Debt-to-assets Ratio 0.14 0.10 0.08 0.07 0.04 0.01 0.00 0.01 0.01 0.01 0.01 Debt-to-Equity Ratio 0.81 0.69 0.60 0.35 0.55 0.61 0.59 0.58 0.57 0.56 0.56 Financial Leverage 2.19 2.31 2.42 2.09 2.49 2.48 2.80 3.11 3.41 3.70 3.99
Profitability Ratios Return on Assets (%) 1.39% 0.30% 2.67% 3.59% 3.43% 4.63% 2.76% 2.57% 2.41% 2.28% 2.25% Return on Equity (%) 3.04% 0.70% 6.44% 7.49% 8.53% 11.47% 7.74% 7.99% 8.22% 8.45% 8.99% Gross Profit Margin (%) 37.9% 31.8% 29.4% 32.4% 31.0% 33.6% 34.0% 33.0% 34.0% 34.0% 34.0% EBIT Margin (%) 9.99% 1.72% 2.81% 3.11% 2.74% 2.02% 2.67% 2.80% 2.94% 3.04% 3.17% Net Profit Margin (%) 1.11% 0.23% 1.71% 2.12% 1.98% 2.59% 1.76% 1.77% 1.77% 1.77% 1.84%
Shareholder Ratio 0.46 0.43 0.41 0.48 0.40 0.40 0.36 0.32 0.29 0.27 0.25 Source: Company Data, Team Calculations
million RON and respectively 107.2 million RON. As of 31st of December 2014, Albalact reported retained earnings of 22.1 million RON.
Borrowed funds as a financing source favored over equity Albalact has disobeyed the indebtedness commitment in three loan arrangements with ING Bank, but without negative consequences. The company has signed a credit facility arrangement with ING Bank which consists in granting a EUR-denominated facility to finance payments to suppliers and extraordinary financial debts to public authorities. Also, Albalact is carrying a total of 39 financial leasing contracts.
Financial Ratios Liquidity ratios have an upward trend
In 2014, the company’s current ratio increased to 0.89 from the previous year’s current ratio of 0.86. In the future, the current ratio will remain around 1, around the industry average. At the end of the same year, Albalact SA had negative net working capital, as current liabilities were 121.24 million RON while total current assets were only 108.04 million RON.
Positive evolution of net income has determined an increase in dividend payout Out of the 474.92 million RON in revenue reported by the company in 2014, the cost of goods sold was 315.47 million RON, or 66.43% revenues. The 2.59% net profit margin reached in 2014 was higher than the historical average due to a 7.2 million RON gain from the sale on fixed assets. During the first six months of 2015, dividends paid by Albalact SA reached the value of 0.02 RON per share. The price stock varies around 0.3 RON, so the dividend yield is around 6.5 – 6.6 %.
Increased indebtedness led to a rising debt to equity ratio The company recorded higher debt of 65.71 million RON at the end of fiscal year 2014 compared to the previous year’s total debt of 53.7 million RON. The debt to equity ratio has been increasing in the last three years, reaching a level of 0.61 at the end of 2014. We forecast lower debt to equity ratio due to a slightly growth of debt and to a constant level of the retained earnings.
DuPont Analysis reveals a more efficient resources employment In the analyzed historical period (2011-2014), Albalact exhibited an impaired return on equity mainly due to lower net income. The 11.47% return on equity reached in 2014 is sustained by the higher level of net profit margin. Our analysis indicates a positive evolution of ROE in the next five years, mainly driven by financial leverage. Given the fact that total assets will increase with a higher degree than equity, we expect an increase in financial leverage.
The growth of total assets is sustained by an increase in Albalact’s investments and by a slightly growing CAPEX.
CFA Institute Research Challenge | 15 Feb 2016
7
VALUATION DCF Valuation Assumptions
Revenue Growth 4.0% COGS/Sales 66.0% SG&A/Sales 7.0% Other OE/Sales 21.0% NWC/Revenues -4.0% Terminal growth 2.0% Tax rate 16.0% Capex growth 1.0%
Weighted Average Cost of Capital Assumptions
Bond Rating Baa3 YTM (Bonds) 6.5% Tax Rate 16.0% Beta 54.0% Debt as % of Total Assets 59.6% 10-Yr Treasury Bond Yield 3.8% Market Risk Premium 6.0%
Cost of Equity 7.0% Equity as % of Capital 40.4% WACC 6.1%
Estimation of Target Price based on DCF Valuation
Terminal Value 196.5 PV Terminal Value 146.3 PV FCF (Yr2015 to Yr2019) 27.9 Enterprise Value 174.2 + MV of non-operating assets 2.9 ‒ MV of net debt -87.5 Fair value of equity 264.6 Shares outstanding 652.7 Target Price 0.41 Upside potential 23%
WACC
Reve
nue
grow
th 5% 6% 7% 8% 9%
0% 0.21 0.19 0.19 0.18 0.17
2% 0.35 0.30 0.27 0.25 0.23
4% 0.50 0.41 0.36 0.32 0.29
6% 0.68 0.54 0.46 0.40 0.36
8% 0.87 0.68 0.57 0.49 0.44
WACC
TV g
row
th
5% 6% 7% 8% 9%
0% 0.38 0.33 0.31 0.28 0.27
1% 0.42 0.37 0.33 0.30 0.28
2% 0.50 0.41 0.36 0.32 0.29
3% 0.66 0.49 0.40 0.35 0.31
4% 1.15 0.64 0.47 0.39 0.34
Discounted Cash Flow Valuation We used a two-stage growth DCF model
A discounted cash flow analysis with a five-year explicit forecast was used to value Albalact SA due to the predictability of cash flows in relation to growth and profitability. The model captures a high potential for FCFF growth in the next five years as the company optimizes its product portfolio. Therefore, we estimate a target price of 0.41 RON, suggesting a 23% upside potential as a sign for a BUY recommendation. The valuation was made in relation with the share price as at 9th of January 2016.
Estimation of the Weighted Average Cost of Capital was conducted within the CAPM framework For the computation of WACC we used a target capital structure of 59.6% Debt and 40.4% Equity. We assumed the cost of equity of 7.0% based on a CAPM framework. The risk free rate of 3.8% was based on the current yield of 10-year government bonds. Beta of 0.54 was computed by regressing historical Albalact returns with the Bucharest Stock Exchange Index (BET XT). The market risk premium is 6.0%, reflecting our own estimates as well as market consensus. Based on our computation, WACC for Albalact is 6.1%, using a cost of debt of 6.5%. In the discounted cash flow analysis we applied weighted average cost of capital as the discount rate for the forecasted cash flows in order to find the net present value of the company.
DCF Model Assumptions In order to construct the DCF model we made a series of assumptions based on the historical financial analysis of the company. We considered that cost of goods sold would not exceed the level of 66% of sales for the forecasted period. Also, the majority of SG&A are fixed and we expect them stay in the next 5 years at about 7% of sales. Due to no significant growth plans for the short and medium term CapEx will increase with 1.0% y-o-y. Likewise, we suppose that the company uses a straight line depreciation method for Plant, Property and Equipment, thereby accumulated depreciation will amount 16.4 million RON for the forecasted period. The two-stage discounted model is based on a high level of growth for the period 2015-2019 and a stable growth thereafter. We estimate an approximate growth rate of 4% for the forecasted period. Due to potential market saturation in the next years, we assume a terminal growth rate of 2%. Based on the present values of the Free Cash Flow to the Firm and the discounted Terminal Value we obtained the Enterprise Value. Furthermore, by using the fair value of equity and the outstanding shares we arrived at a target price of 0.41 RON.
DCF Valuation Summary
2014 2015e 2016e 2017e 2018e 2019e Terminal Value
Revenues (Sales) 474.9 493.9 513.7 534.2 555.6 577.8 600.9 COGS 315.5 326.0 339.0 352.6 366.7 381.3 Gross Profit 159.4 167.9 174.6 181.6 188.9 196.4 SG&A 31.9 34.6 36.0 37.4 38.9 40.4 Other operating expense/income 101.6 103.7 107.9 112.2 116.7 121.3 Depreciation 16.4 16.4 16.4 16.4 16.4 16.4 EBIT 9.5 13.2 14.4 15.7 16.9 18.3 ‒Taxes 2.0 2.1 2.3 2.5 2.7 2.9 NOPAT 7.5 11.1 12.1 13.1 14.2 15.3 16.0 Add: Depreciation 16.4 16.4 16.4 16.4 16.4 16.4 16.4 Less: Capital Expenditures 23.8 24.0 24.3 24.5 24.8 25.0 25.3 Less: Increase in NWC -2.1 -4.5 -0.8 -0.8 -0.9 -0.9 -0.9 FCF 2.2 8.0 5.0 5.9 6.7 7.6 8.0 NWC -15.3 -19.8 -20.5 -21.4 -22.2 -23.1 -24.0 NOPAT/ Sales 1.6% 2.3% 2.4% 2.5% 2.6% 2.7% 2.7%
Sensitivity Analysis
Our model is particularly sensitive to perpetual growth rate assumptions. We provide two sensitivity tables to better illustrate the valuation range. In the first table the determinants are the rate of revenue growth from 2015 to 2019 and the WACC. For example, a 9% WACC and an 8% rate of revenue growth give us a 0.44 target price. The second table illustrates the sensitivity of our model to WACC and terminal value growth. For example, a 5% WACC and a 4% terminal value growth result in a target price of 1.15 RON.
CFA Institute Research Challenge | 15 Feb 2016
8
Company EV/Sales P/S
S.C. Albalact S.A. 0.63 0.45 AB Vilkyskiu pienine 0.36 0.17 Centrale del Latte di Torino & C. S.p.A.
0.53 0.35
Kri Kri S.A. 0.81 0.73 Lanzhou Zhuangyuan Pasture Co., Ltd.
1.64 1.18
Savencia SA 0.29 0.18 Schwalbchen Molkerei Jakob Berz AG
0.20 0.17
AB Pieno Zvaigzdes 0.33 0.22 Ausnutria Dairy Corporation Ltd. 1.39 1.17
Dutch Lady Milk Industries Bhd 2.88 3.04
Jordan Dairy Company Ltd. 1.27 1.35
Source: S&P Capital IQ
EV/Sales upside 6%
P/Sales upside 20%
Average upside potential based on sales multiples 13%
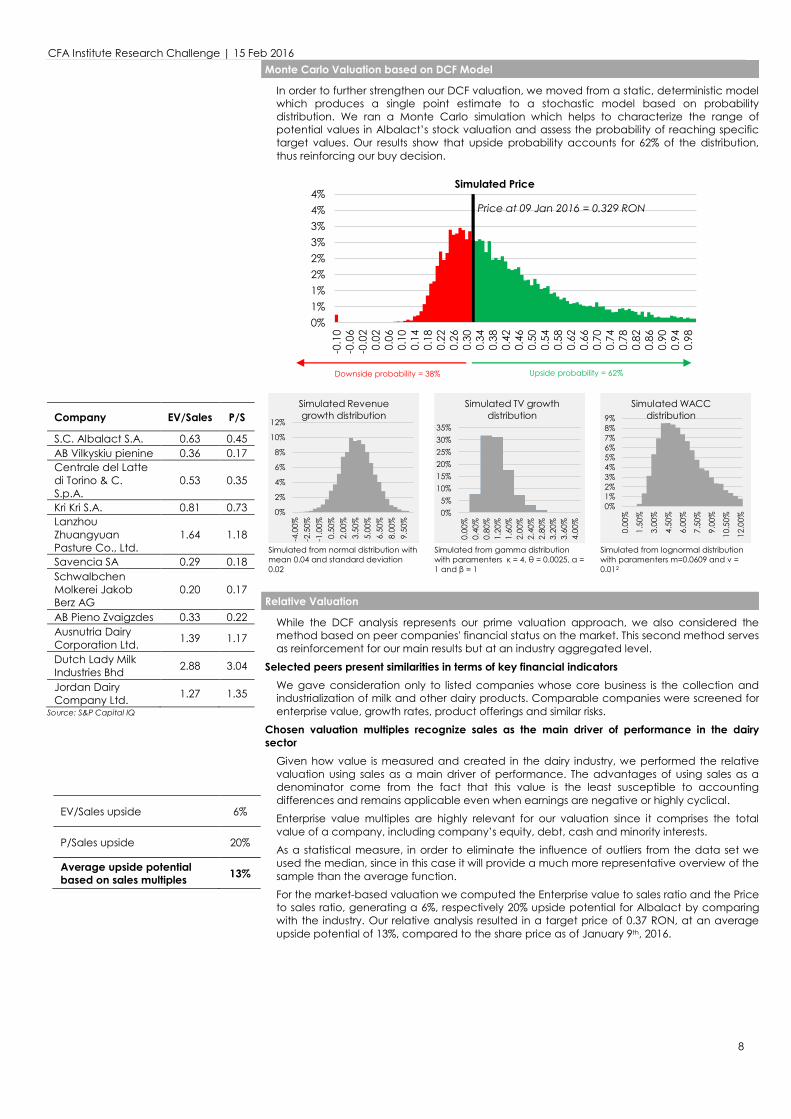
Monte Carlo Valuation based on DCF Model
In order to further strengthen our DCF valuation, we moved from a static, deterministic model which produces a single point estimate to a stochastic model based on probability distribution. We ran a Monte Carlo simulation which helps to characterize the range of potential values in Albalact’s stock valuation and assess the probability of reaching specific target values. Our results show that upside probability accounts for 62% of the distribution, thus reinforcing our buy decision.
Simulated from normal distribution with mean 0.04 and standard deviation 0.02
Simulated from gamma distribution with paramenters κ = 4, θ = 0.0025, α = 1 and β = 1
Simulated from lognormal distribution with paramenters m=0.0609 and v = 0.012
Relative Valuation
While the DCF analysis represents our prime valuation approach, we also considered the method based on peer companies' financial status on the market. This second method serves as reinforcement for our main results but at an industry aggregated level.
Selected peers present similarities in terms of key financial indicators We gave consideration only to listed companies whose core business is the collection and industrialization of milk and other dairy products. Comparable companies were screened for enterprise value, growth rates, product offerings and similar risks.
Chosen valuation multiples recognize sales as the main driver of performance in the dairy sector
Given how value is measured and created in the dairy industry, we performed the relative valuation using sales as a main driver of performance. The advantages of using sales as a denominator come from the fact that this value is the least susceptible to accounting differences and remains applicable even when earnings are negative or highly cyclical. Enterprise value multiples are highly relevant for our valuation since it comprises the total value of a company, including company’s equity, debt, cash and minority interests. As a statistical measure, in order to eliminate the influence of outliers from the data set we used the median, since in this case it will provide a much more representative overview of the sample than the average function. For the market-based valuation we computed the Enterprise value to sales ratio and the Price to sales ratio, generating a 6%, respectively 20% upside potential for Albalact by comparing with the industry. Our relative analysis resulted in a target price of 0.37 RON, at an average upside potential of 13%, compared to the share price as of January 9th, 2016.
0%1%1%2%2%3%3%4%4%
-0.1
0-0
.06
-0.0
20.
020.
060.
100.
140.
180.
220.
260.
300.
340.
380.
420.
460.
500.
540.
580.
620.
660.
700.
740.
780.
820.
860.
900.
940.
98
Simulated Price
Price at 09 Jan 2016 = 0.329 RON
Upside probability = 62%Downside probability = 38%
0%
2%
4%
6%
8%
10%
12%
-4.0
0%-2
.50%
-1.0
0%0.
50%
2.00
%3.
50%
5.00
%6.
50%
8.00
%9.
50%
Simulated Revenue growth distribution
0%5%
10%15%20%25%30%35%
0.00
%0.
40%
0.80
%1.
20%
1.60
%2.
00%
2.40
%2.
80%
3.20
%3.
60%
4.00
%
Simulated TV growth distribution
0%1%2%3%4%5%6%7%8%9%
0.00
%
1.50
%
3.00
%
4.50
%
6.00
%
7.50
%
9.00
%
10.5
0%
12.0
0%
Simulated WACC distribution
CFA Institute Research Challenge | 15 Feb 2016
9
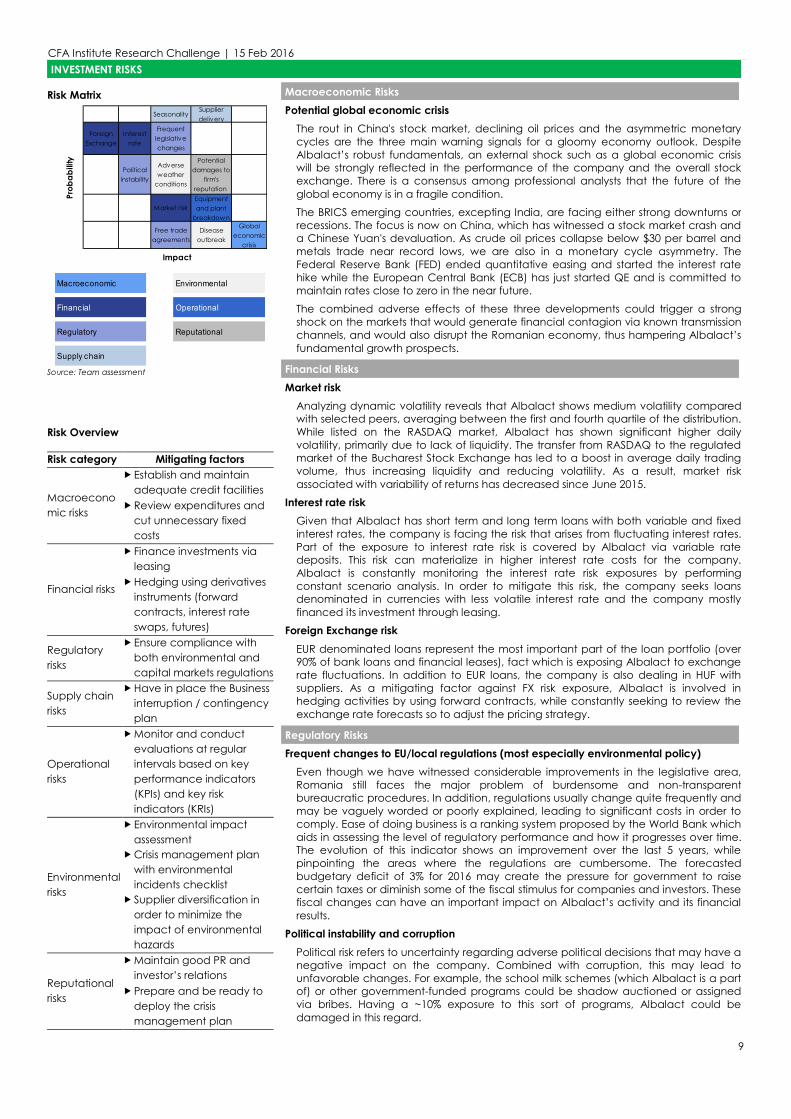
INVESTMENT RISKS Risk Matrix
Source: Team assessment Risk Overview Risk category Mitigating factors
Macroeconomic risks
f Establish and maintain adequate credit facilities
f Review expenditures and cut unnecessary fixed costs
Financial risks
f Finance investments via leasing
f Hedging using derivatives instruments (forward contracts, interest rate swaps, futures)
Regulatory risks
f Ensure compliance with both environmental and capital markets regulations
Supply chain risks
f Have in place the Business interruption / contingency plan
Operational risks
f Monitor and conduct evaluations at regular intervals based on key performance indicators (KPIs) and key risk indicators (KRIs)
Environmental risks
f Environmental impact assessment
f Crisis management plan with environmental incidents checklist
f Supplier diversification in order to minimize the impact of environmental hazards
Reputational risks
f Maintain good PR and investor’s relations
f Prepare and be ready to deploy the crisis management plan
Macroeconomic Risks Potential global economic crisis
The rout in China's stock market, declining oil prices and the asymmetric monetary cycles are the three main warning signals for a gloomy economy outlook. Despite Albalact’s robust fundamentals, an external shock such as a global economic crisis will be strongly reflected in the performance of the company and the overall stock exchange. There is a consensus among professional analysts that the future of the global economy is in a fragile condition. The BRICS emerging countries, excepting India, are facing either strong downturns or recessions. The focus is now on China, which has witnessed a stock market crash and a Chinese Yuan's devaluation. As crude oil prices collapse below $30 per barrel and metals trade near record lows, we are also in a monetary cycle asymmetry. The Federal Reserve Bank (FED) ended quantitative easing and started the interest rate hike while the European Central Bank (ECB) has just started QE and is committed to maintain rates close to zero in the near future. The combined adverse effects of these three developments could trigger a strong shock on the markets that would generate financial contagion via known transmission channels, and would also disrupt the Romanian economy, thus hampering Albalact’s fundamental growth prospects.
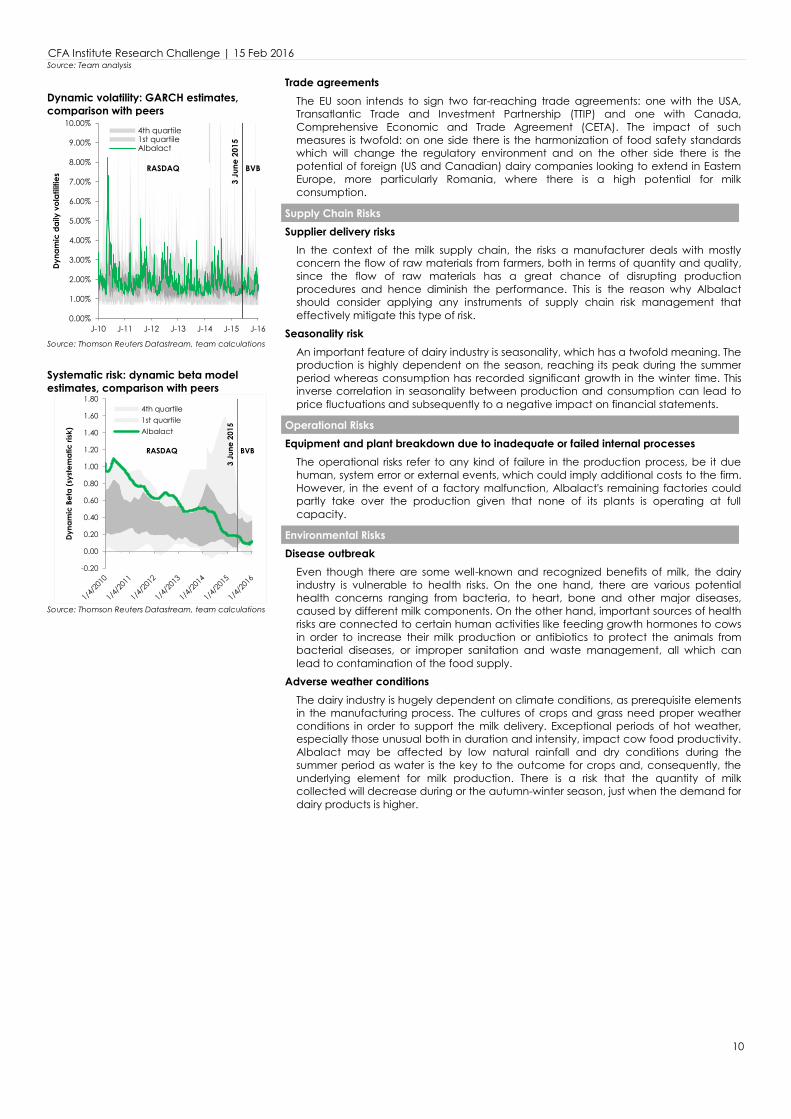
Financial Risks Market risk
Analyzing dynamic volatility reveals that Albalact shows medium volatility compared with selected peers, averaging between the first and fourth quartile of the distribution. While listed on the RASDAQ market, Albalact has shown significant higher daily volatility, primarily due to lack of liquidity. The transfer from RASDAQ to the regulated market of the Bucharest Stock Exchange has led to a boost in average daily trading volume, thus increasing liquidity and reducing volatility. As a result, market risk associated with variability of returns has decreased since June 2015.
Interest rate risk Given that Albalact has short term and long term loans with both variable and fixed interest rates, the company is facing the risk that arises from fluctuating interest rates. Part of the exposure to interest rate risk is covered by Albalact via variable rate deposits. This risk can materialize in higher interest rate costs for the company. Albalact is constantly monitoring the interest rate risk exposures by performing constant scenario analysis. In order to mitigate this risk, the company seeks loans denominated in currencies with less volatile interest rate and the company mostly financed its investment through leasing.
Foreign Exchange risk EUR denominated loans represent the most important part of the loan portfolio (over 90% of bank loans and financial leases), fact which is exposing Albalact to exchange rate fluctuations. In addition to EUR loans, the company is also dealing in HUF with suppliers. As a mitigating factor against FX risk exposure, Albalact is involved in hedging activities by using forward contracts, while constantly seeking to review the exchange rate forecasts so to adjust the pricing strategy.
Regulatory Risks Frequent changes to EU/local regulations (most especially environmental policy)
Even though we have witnessed considerable improvements in the legislative area, Romania still faces the major problem of burdensome and non-transparent bureaucratic procedures. In addition, regulations usually change quite frequently and may be vaguely worded or poorly explained, leading to significant costs in order to comply. Ease of doing business is a ranking system proposed by the World Bank which aids in assessing the level of regulatory performance and how it progresses over time. The evolution of this indicator shows an improvement over the last 5 years, while pinpointing the areas where the regulations are cumbersome. The forecasted budgetary deficit of 3% for 2016 may create the pressure for government to raise certain taxes or diminish some of the fiscal stimulus for companies and investors. These fiscal changes can have an important impact on Albalact’s activity and its financial results.
Political instability and corruption Political risk refers to uncertainty regarding adverse political decisions that may have a negative impact on the company. Combined with corruption, this may lead to unfavorable changes. For example, the school milk schemes (which Albalact is a part of) or other government-funded programs could be shadow auctioned or assigned via bribes. Having a ~10% exposure to this sort of programs, Albalact could be damaged in this regard.
SeasonalitySupplier delivery
Foreign Exchange
Interest rate
Frequent legislative changes
Political instability
Adverse weather
conditions
Potential damages to
firm's reputation
Market riskEquipment and plant
breakdown
Free trade agreements
Disease outbreak
Global economic
crisis
Impact
Probability
Macroeconomic Environmental
Financial Operational
Regulatory Reputational
Supply chain
CFA Institute Research Challenge | 15 Feb 2016
10
Source: Team analysis Dynamic volatility: GARCH estimates, comparison with peers
Source: Thomson Reuters Datastream, team calculations Systematic risk: dynamic beta model estimates, comparison with peers
Source: Thomson Reuters Datastream, team calculations
Trade agreements
The EU soon intends to sign two far-reaching trade agreements: one with the USA, Transatlantic Trade and Investment Partnership (TTIP) and one with Canada, Comprehensive Economic and Trade Agreement (CETA). The impact of such measures is twofold: on one side there is the harmonization of food safety standards which will change the regulatory environment and on the other side there is the potential of foreign (US and Canadian) dairy companies looking to extend in Eastern Europe, more particularly Romania, where there is a high potential for milk consumption.
Supply Chain Risks Supplier delivery risks
In the context of the milk supply chain, the risks a manufacturer deals with mostly concern the flow of raw materials from farmers, both in terms of quantity and quality, since the flow of raw materials has a great chance of disrupting production procedures and hence diminish the performance. This is the reason why Albalact should consider applying any instruments of supply chain risk management that effectively mitigate this type of risk.
Seasonality risk An important feature of dairy industry is seasonality, which has a twofold meaning. The production is highly dependent on the season, reaching its peak during the summer period whereas consumption has recorded significant growth in the winter time. This inverse correlation in seasonality between production and consumption can lead to price fluctuations and subsequently to a negative impact on financial statements.
Operational Risks Equipment and plant breakdown due to inadequate or failed internal processes
The operational risks refer to any kind of failure in the production process, be it due human, system error or external events, which could imply additional costs to the firm. However, in the event of a factory malfunction, Albalact's remaining factories could partly take over the production given that none of its plants is operating at full capacity.
Environmental Risks Disease outbreak
Even though there are some well-known and recognized benefits of milk, the dairy industry is vulnerable to health risks. On the one hand, there are various potential health concerns ranging from bacteria, to heart, bone and other major diseases, caused by different milk components. On the other hand, important sources of health risks are connected to certain human activities like feeding growth hormones to cows in order to increase their milk production or antibiotics to protect the animals from bacterial diseases, or improper sanitation and waste management, all which can lead to contamination of the food supply.
Adverse weather conditions The dairy industry is hugely dependent on climate conditions, as prerequisite elements in the manufacturing process. The cultures of crops and grass need proper weather conditions in order to support the milk delivery. Exceptional periods of hot weather, especially those unusual both in duration and intensity, impact cow food productivity. Albalact may be affected by low natural rainfall and dry conditions during the summer period as water is the key to the outcome for crops and, consequently, the underlying element for milk production. There is a risk that the quantity of milk collected will decrease during or the autumn-winter season, just when the demand for dairy products is higher.
0.00%
1.00%
2.00%
3.00%
4.00%
5.00%
6.00%
7.00%
8.00%
9.00%
10.00%
J-10 J-11 J-12 J-13 J-14 J-15 J-16
Dyna
mic
dai
ly v
olat
ilitie
s
4th quartile1st quartileAlbalact
RASDAQ
3Ju
ne 2
015
BVB
-0.20
0.00
0.20
0.40
0.60
0.80
1.00
1.20
1.40
1.60
1.80
Dyna
mic
Bet
a (s
yste
mat
ic ri
sk)
4th quartile1st quartileAlbalact
RASDAQ
3Ju
ne 2
015
BVB
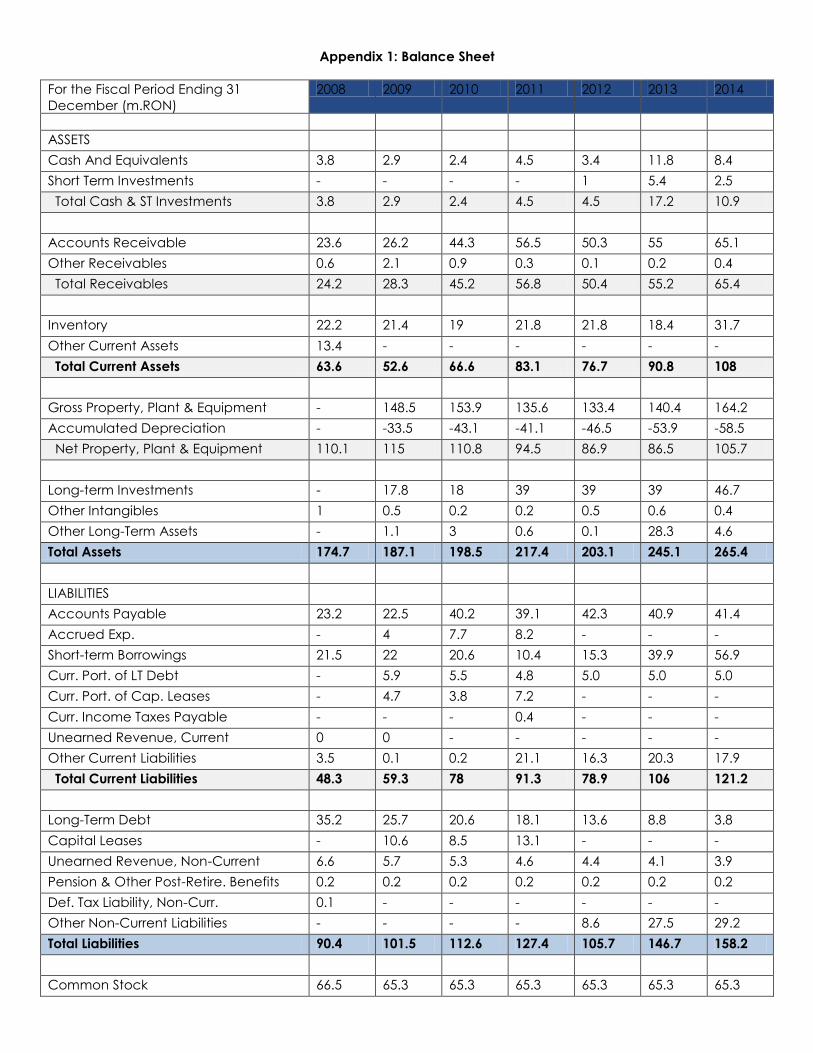
Appendix 1: Balance Sheet
For the Fiscal Period Ending 31 December (m.RON)
2008 2009 2010 2011 2012 2013 2014
ASSETS Cash And Equivalents 3.8 2.9 2.4 4.5 3.4 11.8 8.4 Short Term Investments - - - - 1 5.4 2.5 Total Cash & ST Investments 3.8 2.9 2.4 4.5 4.5 17.2 10.9 Accounts Receivable 23.6 26.2 44.3 56.5 50.3 55 65.1 Other Receivables 0.6 2.1 0.9 0.3 0.1 0.2 0.4 Total Receivables 24.2 28.3 45.2 56.8 50.4 55.2 65.4 Inventory 22.2 21.4 19 21.8 21.8 18.4 31.7 Other Current Assets 13.4 - - - - - - Total Current Assets 63.6 52.6 66.6 83.1 76.7 90.8 108 Gross Property, Plant & Equipment - 148.5 153.9 135.6 133.4 140.4 164.2 Accumulated Depreciation - -33.5 -43.1 -41.1 -46.5 -53.9 -58.5 Net Property, Plant & Equipment 110.1 115 110.8 94.5 86.9 86.5 105.7 Long-term Investments - 17.8 18 39 39 39 46.7 Other Intangibles 1 0.5 0.2 0.2 0.5 0.6 0.4 Other Long-Term Assets - 1.1 3 0.6 0.1 28.3 4.6 Total Assets 174.7 187.1 198.5 217.4 203.1 245.1 265.4 LIABILITIES Accounts Payable 23.2 22.5 40.2 39.1 42.3 40.9 41.4 Accrued Exp. - 4 7.7 8.2 - - - Short-term Borrowings 21.5 22 20.6 10.4 15.3 39.9 56.9 Curr. Port. of LT Debt - 5.9 5.5 4.8 5.0 5.0 5.0 Curr. Port. of Cap. Leases - 4.7 3.8 7.2 - - - Curr. Income Taxes Payable - - - 0.4 - - - Unearned Revenue, Current 0 0 - - - - - Other Current Liabilities 3.5 0.1 0.2 21.1 16.3 20.3 17.9 Total Current Liabilities 48.3 59.3 78 91.3 78.9 106 121.2 Long-Term Debt 35.2 25.7 20.6 18.1 13.6 8.8 3.8 Capital Leases - 10.6 8.5 13.1 - - - Unearned Revenue, Non-Current 6.6 5.7 5.3 4.6 4.4 4.1 3.9 Pension & Other Post-Retire. Benefits 0.2 0.2 0.2 0.2 0.2 0.2 0.2 Def. Tax Liability, Non-Curr. 0.1 - - - - - - Other Non-Current Liabilities - - - - 8.6 27.5 29.2 Total Liabilities 90.4 101.5 112.6 127.4 105.7 146.7 158.2 Common Stock 66.5 65.3 65.3 65.3 65.3 65.3 65.3
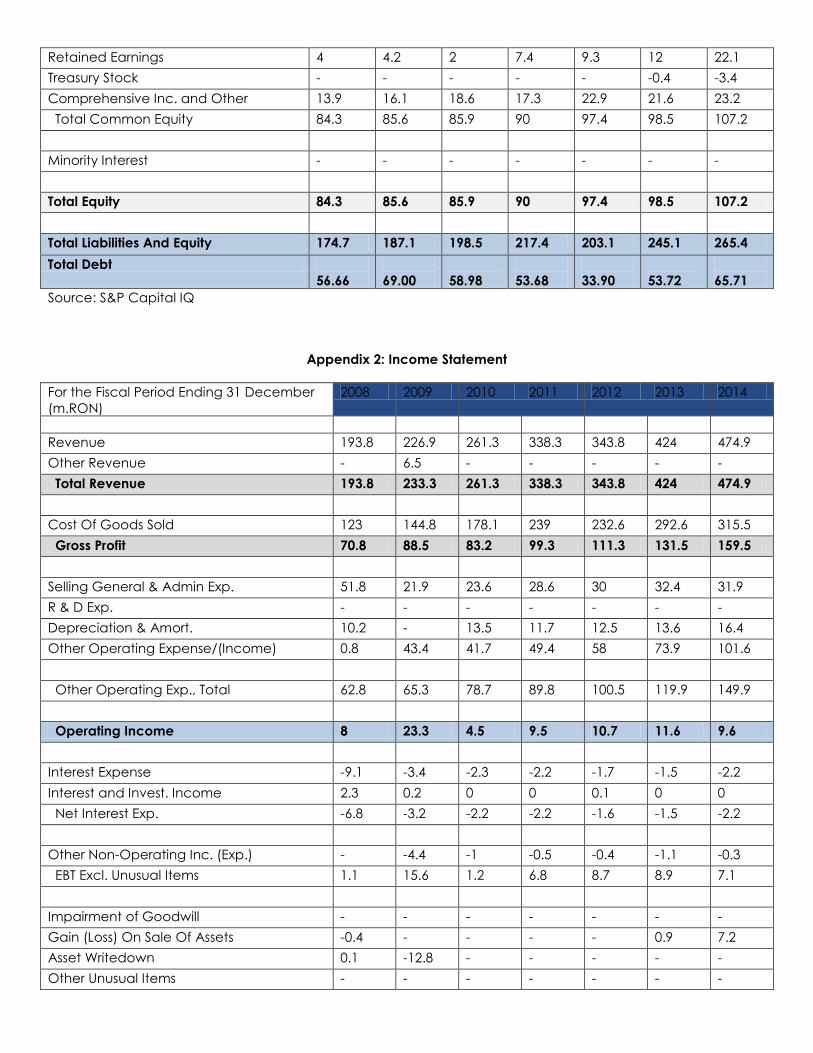
Retained Earnings 4 4.2 2 7.4 9.3 12 22.1 Treasury Stock - - - - - -0.4 -3.4 Comprehensive Inc. and Other 13.9 16.1 18.6 17.3 22.9 21.6 23.2 Total Common Equity 84.3 85.6 85.9 90 97.4 98.5 107.2 Minority Interest - - - - - - - Total Equity 84.3 85.6 85.9 90 97.4 98.5 107.2 Total Liabilities And Equity 174.7 187.1 198.5 217.4 203.1 245.1 265.4 Total Debt
56.66 69.00
58.98
53.68
33.90
53.72
65.71
Source: S&P Capital IQ
Appendix 2: Income Statement
For the Fiscal Period Ending 31 December (m.RON)
2008 2009 2010 2011 2012 2013 2014
Revenue 193.8 226.9 261.3 338.3 343.8 424 474.9 Other Revenue - 6.5 - - - - - Total Revenue 193.8 233.3 261.3 338.3 343.8 424 474.9 Cost Of Goods Sold 123 144.8 178.1 239 232.6 292.6 315.5 Gross Profit 70.8 88.5 83.2 99.3 111.3 131.5 159.5 Selling General & Admin Exp. 51.8 21.9 23.6 28.6 30 32.4 31.9 R & D Exp. - - - - - - - Depreciation & Amort. 10.2 - 13.5 11.7 12.5 13.6 16.4 Other Operating Expense/(Income) 0.8 43.4 41.7 49.4 58 73.9 101.6 Other Operating Exp., Total 62.8 65.3 78.7 89.8 100.5 119.9 149.9 Operating Income 8 23.3 4.5 9.5 10.7 11.6 9.6 Interest Expense -9.1 -3.4 -2.3 -2.2 -1.7 -1.5 -2.2 Interest and Invest. Income 2.3 0.2 0 0 0.1 0 0 Net Interest Exp. -6.8 -3.2 -2.2 -2.2 -1.6 -1.5 -2.2 Other Non-Operating Inc. (Exp.) - -4.4 -1 -0.5 -0.4 -1.1 -0.3 EBT Excl. Unusual Items 1.1 15.6 1.2 6.8 8.7 8.9 7.1 Impairment of Goodwill - - - - - - - Gain (Loss) On Sale Of Assets -0.4 - - - - 0.9 7.2 Asset Writedown 0.1 -12.8 - - - - - Other Unusual Items - - - - - - -
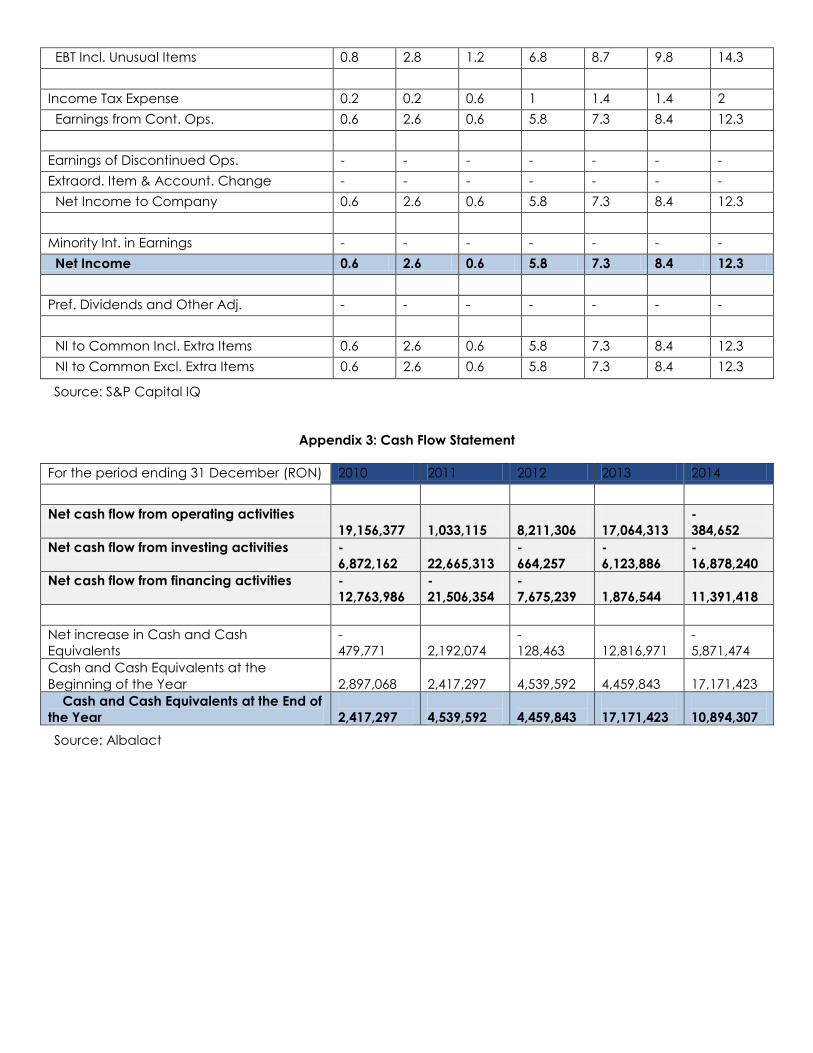
EBT Incl. Unusual Items 0.8 2.8 1.2 6.8 8.7 9.8 14.3 Income Tax Expense 0.2 0.2 0.6 1 1.4 1.4 2 Earnings from Cont. Ops. 0.6 2.6 0.6 5.8 7.3 8.4 12.3 Earnings of Discontinued Ops. - - - - - - - Extraord. Item & Account. Change - - - - - - - Net Income to Company 0.6 2.6 0.6 5.8 7.3 8.4 12.3 Minority Int. in Earnings - - - - - - - Net Income 0.6 2.6 0.6 5.8 7.3 8.4 12.3 Pref. Dividends and Other Adj. - - - - - - - NI to Common Incl. Extra Items 0.6 2.6 0.6 5.8 7.3 8.4 12.3 NI to Common Excl. Extra Items 0.6 2.6 0.6 5.8 7.3 8.4 12.3
Source: S&P Capital IQ
Appendix 3: Cash Flow Statement
For the period ending 31 December (RON) 2010 2011 2012 2013 2014 Net cash flow from operating activities
19,156,377 1,033,115
8,211,306
17,064,313
- 384,652
Net cash flow from investing activities - 6,872,162
22,665,313
- 664,257
- 6,123,886
- 16,878,240
Net cash flow from financing activities - 12,763,986
- 21,506,354
- 7,675,239
1,876,544
11,391,418
Net increase in Cash and Cash Equivalents
- 479,771
2,192,074
- 128,463
12,816,971
- 5,871,474
Cash and Cash Equivalents at the Beginning of the Year
2,897,068
2,417,297
4,539,592
4,459,843
17,171,423
Cash and Cash Equivalents at the End of the Year
2,417,297
4,539,592
4,459,843
17,171,423
10,894,307
Source: Albalact
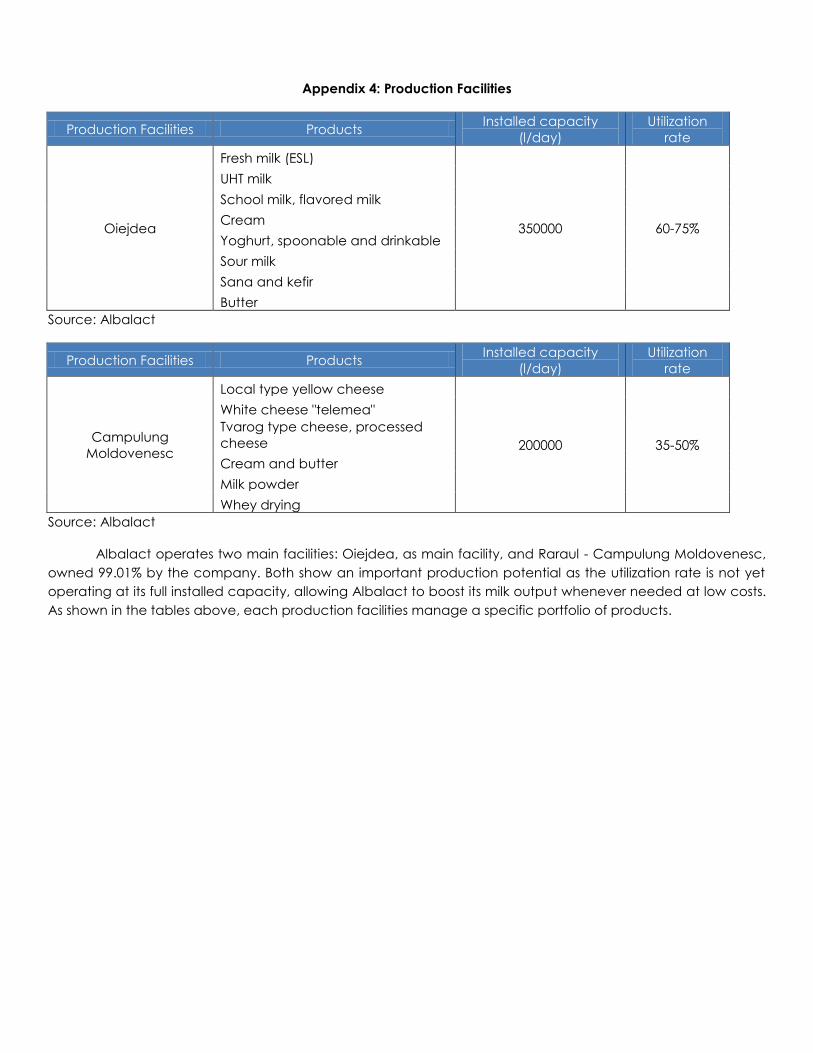
Appendix 4: Production Facilities
Production Facilities Products Installed capacity (l/day)
Utilization rate
Oiejdea
Fresh milk (ESL)
350000 60-75%
UHT milk School milk, flavored milk Cream Yoghurt, spoonable and drinkable Sour milk Sana and kefir Butter
Source: Albalact
Production Facilities Products Installed capacity (l/day)
Utilization rate
Campulung Moldovenesc
Local type yellow cheese
200000 35-50%
White cheese "telemea" Tvarog type cheese, processed cheese Cream and butter Milk powder Whey drying
Source: Albalact
Albalact operates two main facilities: Oiejdea, as main facility, and Raraul - Campulung Moldovenesc, owned 99.01% by the company. Both show an important production potential as the utilization rate is not yet operating at its full installed capacity, allowing Albalact to boost its milk output whenever needed at low costs. As shown in the tables above, each production facilities manage a specific portfolio of products.
0
5
10
15
20
25
30
yr2012 yr2013 yr2014
Volume Value
0
1
2
3
4
5
yr2012 yr2013 yr2014
Volume Value
0
0.1
0.2
0.3
0.4
0.5
0.6
yr2012 yr2013 yr2014
Volume Value
0
5
10
15
20
yr2012 yr2013 yr2014
Volume Value
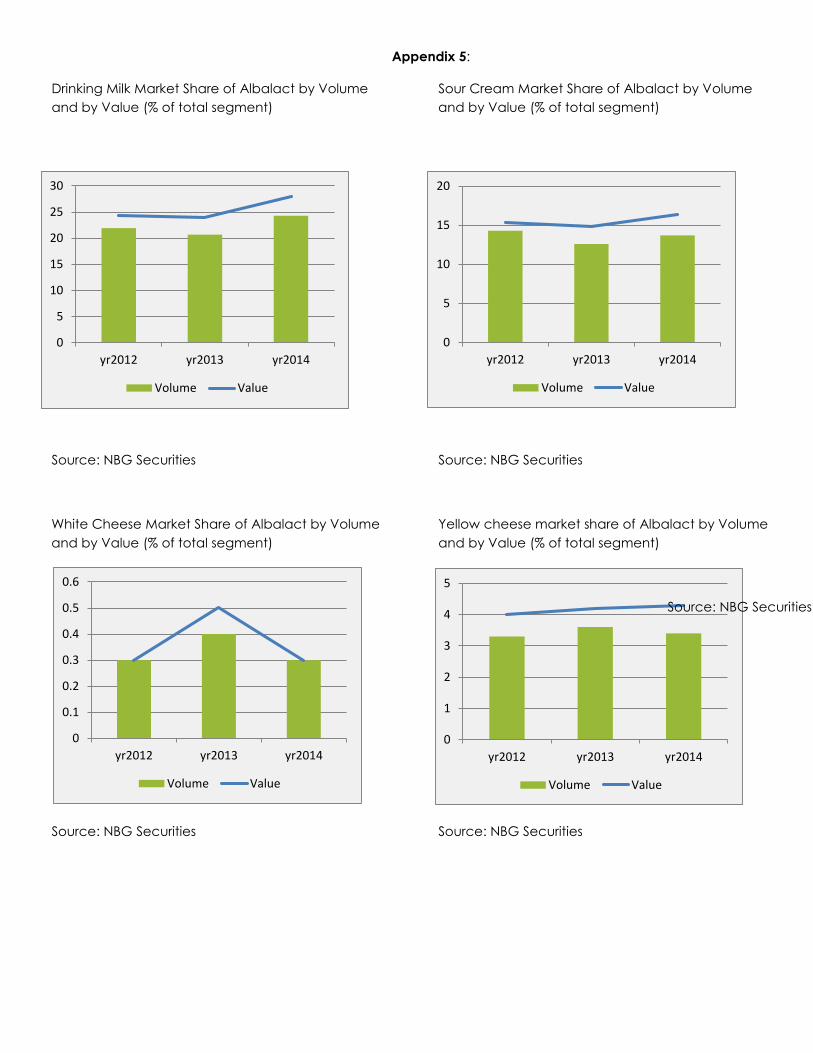
Appendix 5:
Drinking Milk Market Share of Albalact by Volume Sour Cream Market Share of Albalact by Volume and by Value (% of total segment) and by Value (% of total segment)
Source: NBG Securities Source: NBG Securities
White Cheese Market Share of Albalact by Volume Yellow cheese market share of Albalact by Volume and by Value (% of total segment) and by Value (% of total segment)
Source: NBG Securities
Source: NBG Securities Source: NBG Securities
0
5
10
15
20
yr2012 yr2013 yr2014
Volume Value
0
2
4
6
8
10
yr2012 yr2013 yr2014
Volume Value
212223242526272829
yr2012 yr2013 yr2014
Volume Value
0
2
4
6
8
10
12
yr2012 yr2013 yr2014
Volume Value
Yogurt Market Share of Albalact by Volume and by Sana Market Share of Albalact by Volume and by Value (% of total segment) Value (% of total segment)
Source: NBG Securities Source: NBG Securities
Buttermilk Market Share of Albalact by Volume Butter market share of Albalact by Volume and and by Value (% of total segment) by Value (% of total segment)
Source: NBG Securities
Source: NBG Securities Source: NBG Securities
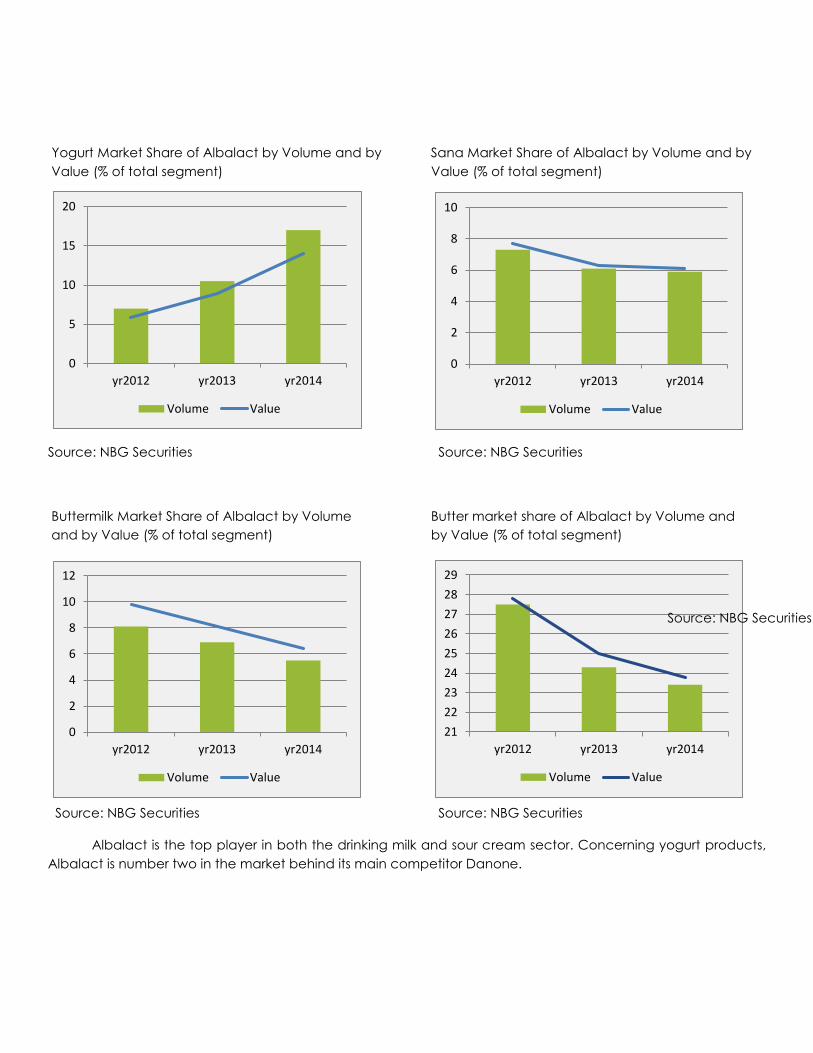
Albalact is the top player in both the drinking milk and sour cream sector. Concerning yogurt products, Albalact is number two in the market behind its main competitor Danone.
Appendix 6: Albalact’s cheese market potential
Source: Albalact
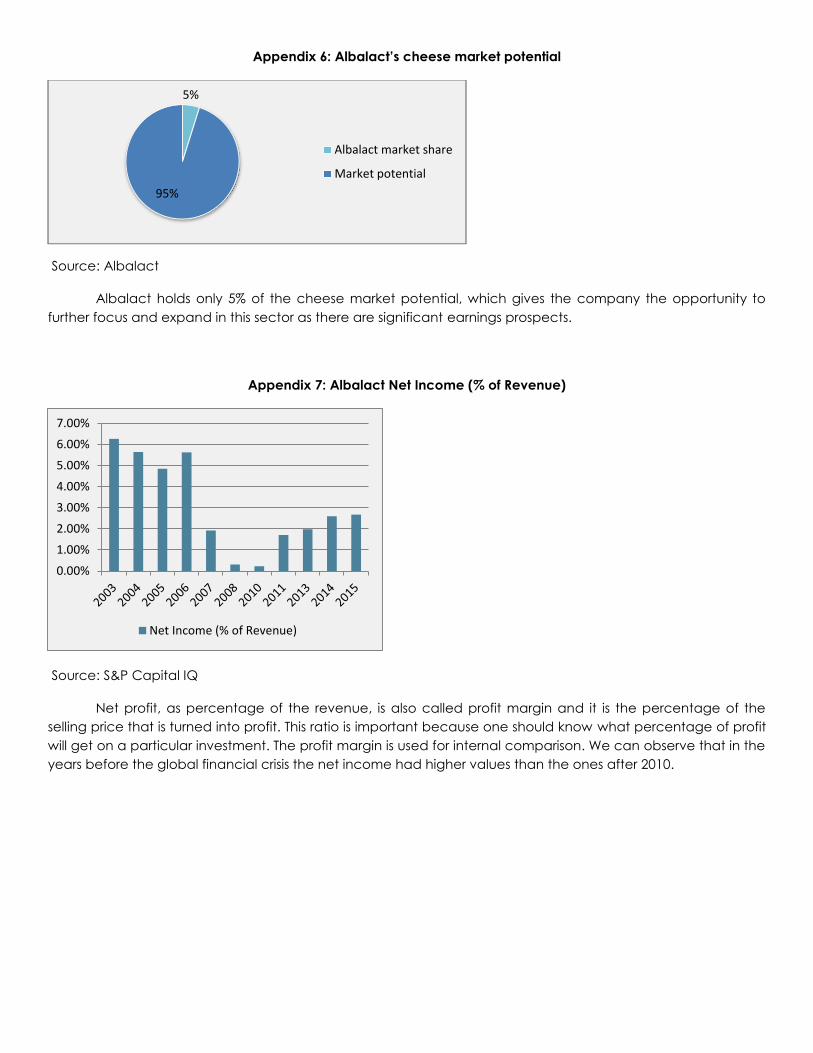
Albalact holds only 5% of the cheese market potential, which gives the company the opportunity to further focus and expand in this sector as there are significant earnings prospects.
Appendix 7: Albalact Net Income (% of Revenue)
Source: S&P Capital IQ
Net profit, as percentage of the revenue, is also called profit margin and it is the percentage of the selling price that is turned into profit. This ratio is important because one should know what percentage of profit will get on a particular investment. The profit margin is used for internal comparison. We can observe that in the years before the global financial crisis the net income had higher values than the ones after 2010.
5%
95%
Albalact market share
Market potential
0.00%1.00%2.00%3.00%4.00%5.00%6.00%7.00%
Net Income (% of Revenue)
Appendix 8: Dupont Analysis
Source: Team computations
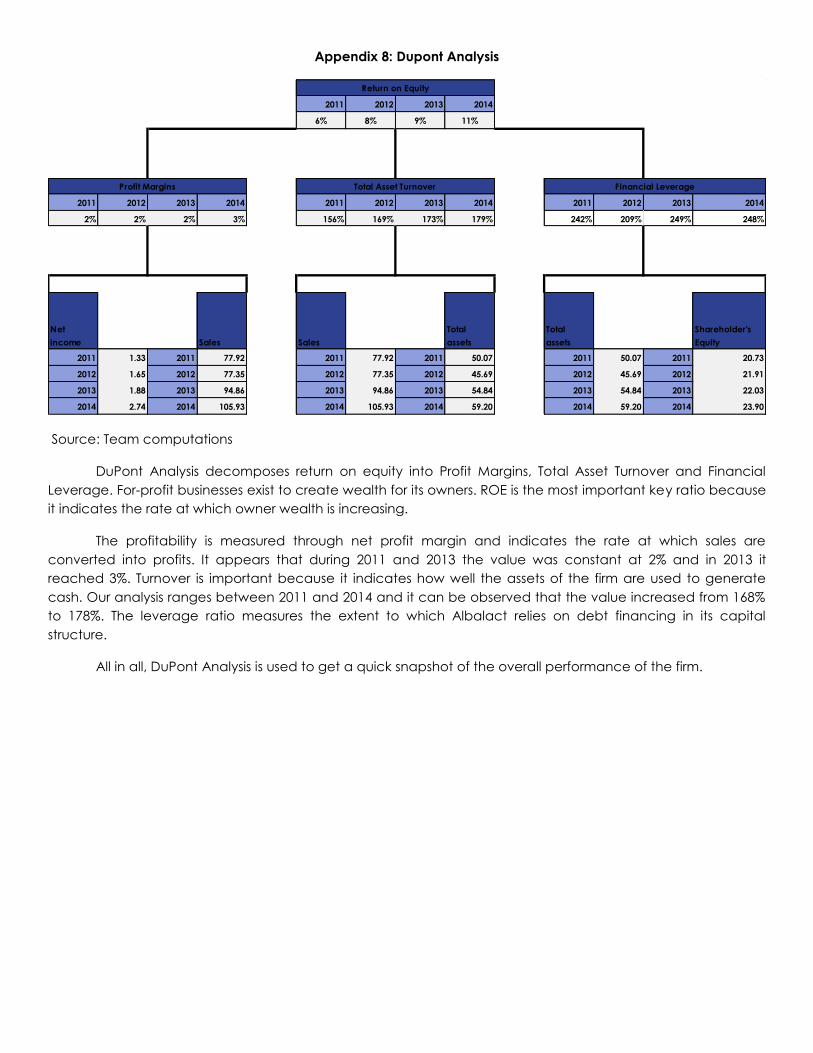
DuPont Analysis decomposes return on equity into Profit Margins, Total Asset Turnover and Financial Leverage. For-profit businesses exist to create wealth for its owners. ROE is the most important key ratio because it indicates the rate at which owner wealth is increasing.
The profitability is measured through net profit margin and indicates the rate at which sales are converted into profits. It appears that during 2011 and 2013 the value was constant at 2% and in 2013 it reached 3%. Turnover is important because it indicates how well the assets of the firm are used to generate cash. Our analysis ranges between 2011 and 2014 and it can be observed that the value increased from 168% to 178%. The leverage ratio measures the extent to which Albalact relies on debt financing in its capital structure.
All in all, DuPont Analysis is used to get a quick snapshot of the overall performance of the firm.
2011 2012 2013 2014
6% 8% 9% 11%
2011 2012 2013 2014 2011 2012 2013 2014 2011 2012 2013 2014
2% 2% 2% 3% 156% 169% 173% 179% 242% 209% 249% 248%
Net income Sales Sales
Total assets
Total assets
Shareholder's Equity
2011 1.33 2011 77.92 2011 77.92 2011 50.07 2011 50.07 2011 20.73
2012 1.65 2012 77.35 2012 77.35 2012 45.69 2012 45.69 2012 21.91
2013 1.88 2013 94.86 2013 94.86 2013 54.84 2013 54.84 2013 22.03
2014 2.74 2014 105.93 2014 105.93 2014 59.20 2014 59.20 2014 23.90
Return on Equity
Profit Margins Total Asset Turnover Financial Leverage
Appendix 9: Executive Team
Name Position held Description
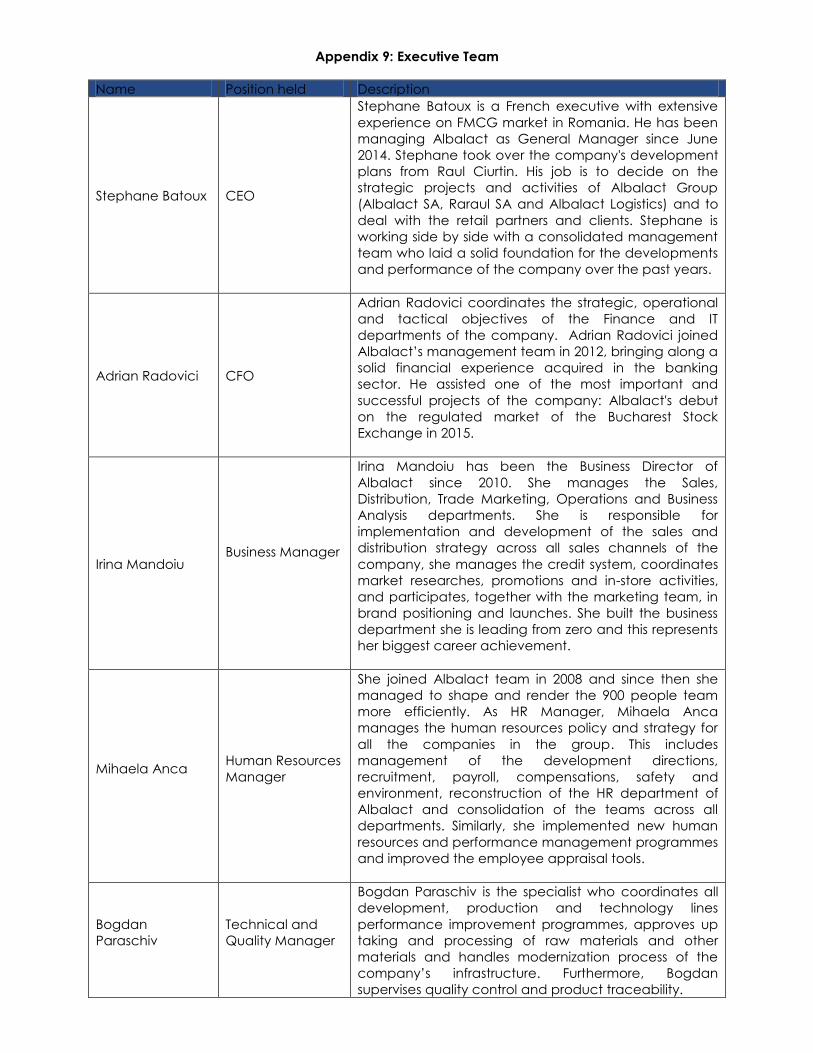
Stephane Batoux CEO
Stephane Batoux is a French executive with extensive experience on FMCG market in Romania. He has been managing Albalact as General Manager since June 2014. Stephane took over the company's development plans from Raul Ciurtin. His job is to decide on the strategic projects and activities of Albalact Group (Albalact SA, Raraul SA and Albalact Logistics) and to deal with the retail partners and clients. Stephane is working side by side with a consolidated management team who laid a solid foundation for the developments and performance of the company over the past years.
Adrian Radovici CFO
Adrian Radovici coordinates the strategic, operational and tactical objectives of the Finance and IT departments of the company. Adrian Radovici joined Albalact’s management team in 2012, bringing along a solid financial experience acquired in the banking sector. He assisted one of the most important and successful projects of the company: Albalact's debut on the regulated market of the Bucharest Stock Exchange in 2015.
Irina Mandoiu Business Manager
Irina Mandoiu has been the Business Director of Albalact since 2010. She manages the Sales, Distribution, Trade Marketing, Operations and Business Analysis departments. She is responsible for implementation and development of the sales and distribution strategy across all sales channels of the company, she manages the credit system, coordinates market researches, promotions and in-store activities, and participates, together with the marketing team, in brand positioning and launches. She built the business department she is leading from zero and this represents her biggest career achievement.
Mihaela Anca
Human Resources Manager
She joined Albalact team in 2008 and since then she managed to shape and render the 900 people team more efficiently. As HR Manager, Mihaela Anca manages the human resources policy and strategy for all the companies in the group. This includes management of the development directions, recruitment, payroll, compensations, safety and environment, reconstruction of the HR department of Albalact and consolidation of the teams across all departments. Similarly, she implemented new human resources and performance management programmes and improved the employee appraisal tools.
Bogdan Paraschiv
Technical and Quality Manager
Bogdan Paraschiv is the specialist who coordinates all development, production and technology lines performance improvement programmes, approves up taking and processing of raw materials and other materials and handles modernization process of the company’s infrastructure. Furthermore, Bogdan supervises quality control and product traceability.
Bogdan joined Albalact team in 2006, and from the very beginning he coordinated all internal procedures for acquisition and functioning of modern production equipment.
Source: Albalact
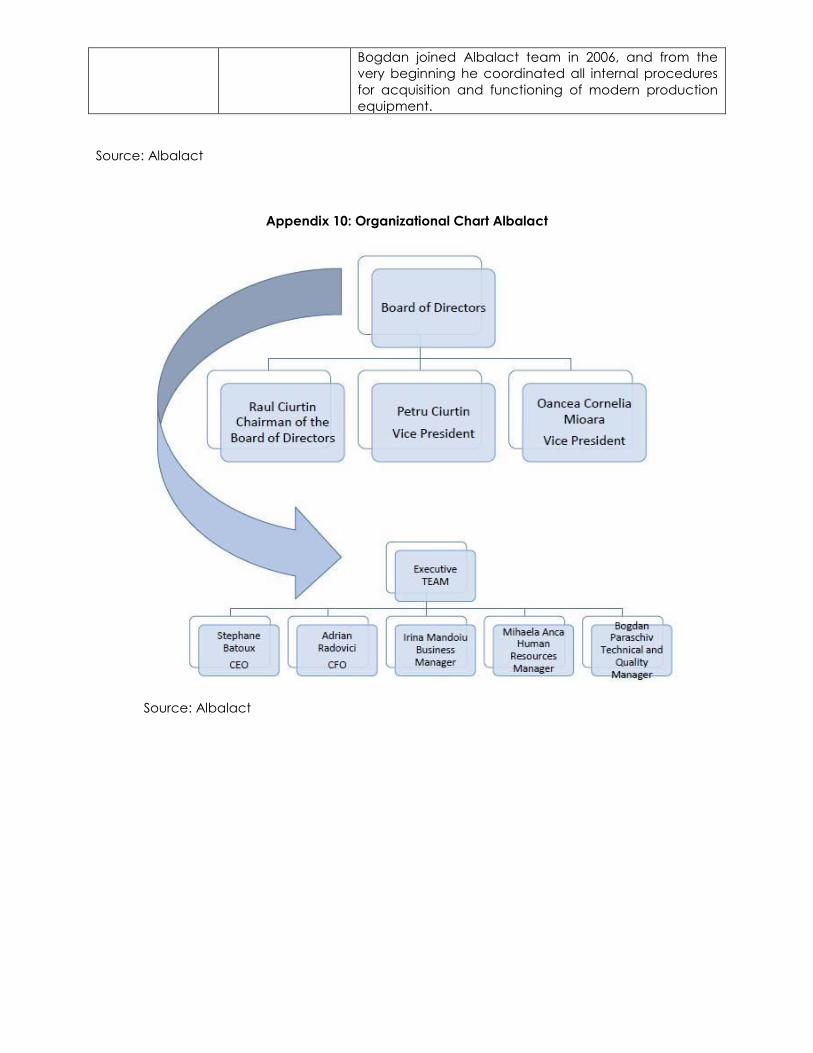
Appendix 10: Organizational Chart Albalact
Source: Albalact
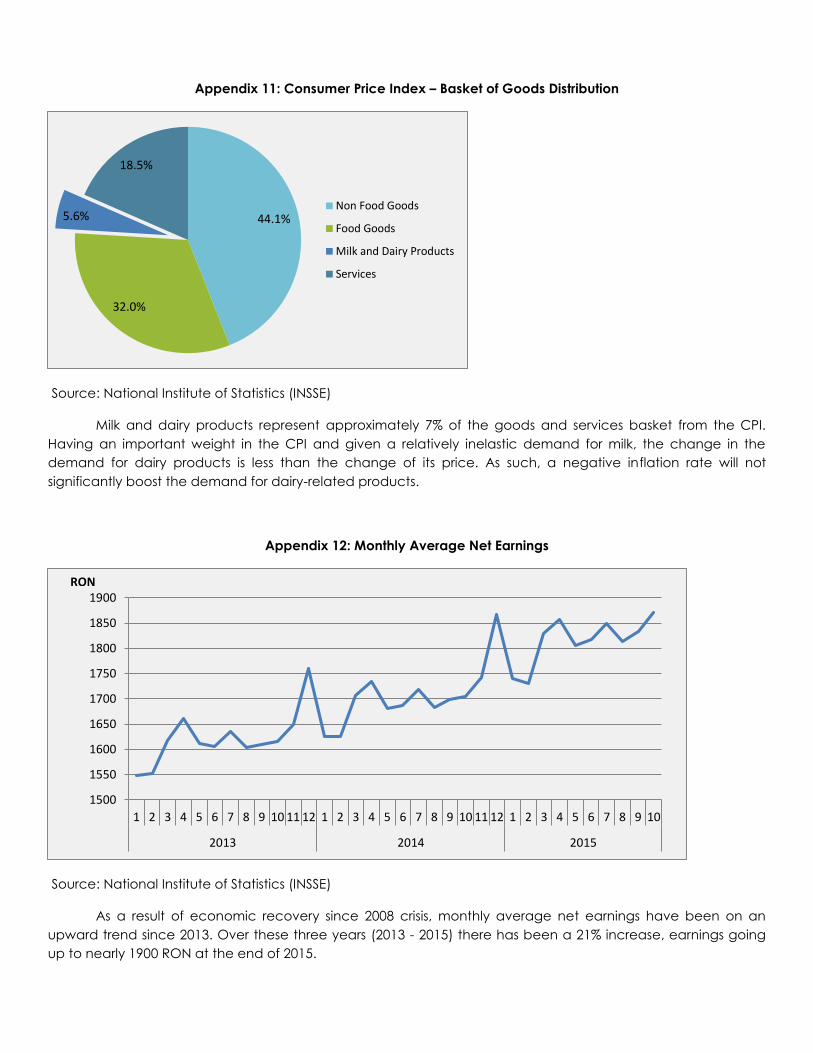
Appendix 11: Consumer Price Index – Basket of Goods Distribution
Source: National Institute of Statistics (INSSE)
Milk and dairy products represent approximately 7% of the goods and services basket from the CPI. Having an important weight in the CPI and given a relatively inelastic demand for milk, the change in the demand for dairy products is less than the change of its price. As such, a negative inflation rate will not significantly boost the demand for dairy-related products.
Appendix 12: Monthly Average Net Earnings
Source: National Institute of Statistics (INSSE)
As a result of economic recovery since 2008 crisis, monthly average net earnings have been on an upward trend since 2013. Over these three years (2013 - 2015) there has been a 21% increase, earnings going up to nearly 1900 RON at the end of 2015.
44.1%
32.0%
5.6%
18.5%
Non Food Goods
Food Goods
Milk and Dairy Products
Services
1500
1550
1600
1650
1700
1750
1800
1850
1900
1 2 3 4 5 6 7 8 9 10 11 12 1 2 3 4 5 6 7 8 9 10 11 12 1 2 3 4 5 6 7 8 9 10
2013 2014 2015
RON
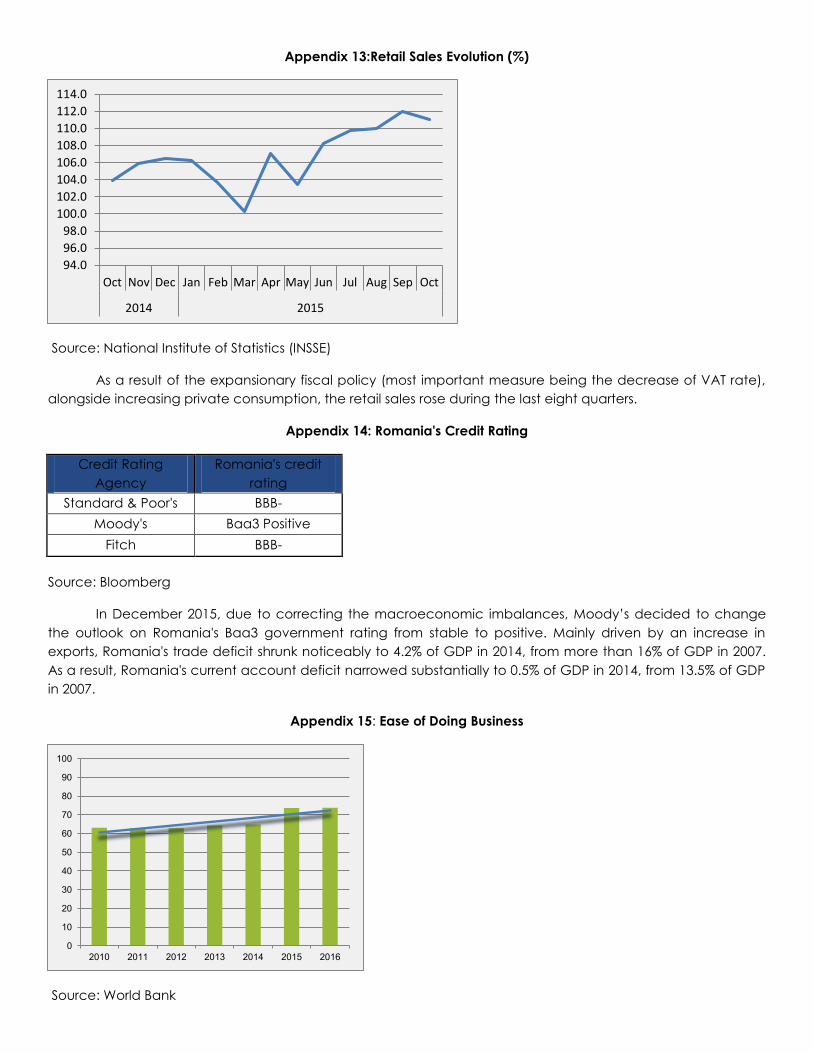
Appendix 13:Retail Sales Evolution (%)
Source: National Institute of Statistics (INSSE)
As a result of the expansionary fiscal policy (most important measure being the decrease of VAT rate), alongside increasing private consumption, the retail sales rose during the last eight quarters.
Appendix 14: Romania's Credit Rating
Credit Rating Agency
Romania's credit rating
Standard & Poor's BBB- Moody's Baa3 Positive
Fitch BBB-
Source: Bloomberg
In December 2015, due to correcting the macroeconomic imbalances, Moody’s decided to change the outlook on Romania's Baa3 government rating from stable to positive. Mainly driven by an increase in exports, Romania's trade deficit shrunk noticeably to 4.2% of GDP in 2014, from more than 16% of GDP in 2007. As a result, Romania's current account deficit narrowed substantially to 0.5% of GDP in 2014, from 13.5% of GDP in 2007.
Appendix 15: Ease of Doing Business
Source: World Bank
94.096.098.0
100.0102.0104.0106.0108.0110.0112.0114.0
Oct Nov Dec Jan Feb Mar Apr May Jun Jul Aug Sep Oct
2014 2015
0
10
20
30
40
50
60
70
80
90
100
2010 2011 2012 2013 2014 2015 2016
0.00%
1.00%
2.00%
3.00%
4.00%
5.00%
6.00%
7.00%
8.00%
0
1000
2000
3000
4000
5000
6000
7000
8000
9000
10000
2009 2010 2011 2012 2013 2014 2015 2016 E 2017 E 2018 E 2019 E
Market Value Y-o-Y Growth
Knowing where an economy stands relative to the ease of doing business is useful for investors. Doing Business Index is measuring the regulations that enhance business activity and those that constrain it. A high ease of doing business ranking means the regulatory environment is more friendly to the starting and operating of a local firm. Doing Business presents quantitative indicators on business regulations and the protection of property rights that can be compared across multiple countries. Following continuous improvements in the regulatory area, Romania is ranked the 37th place in 2016.
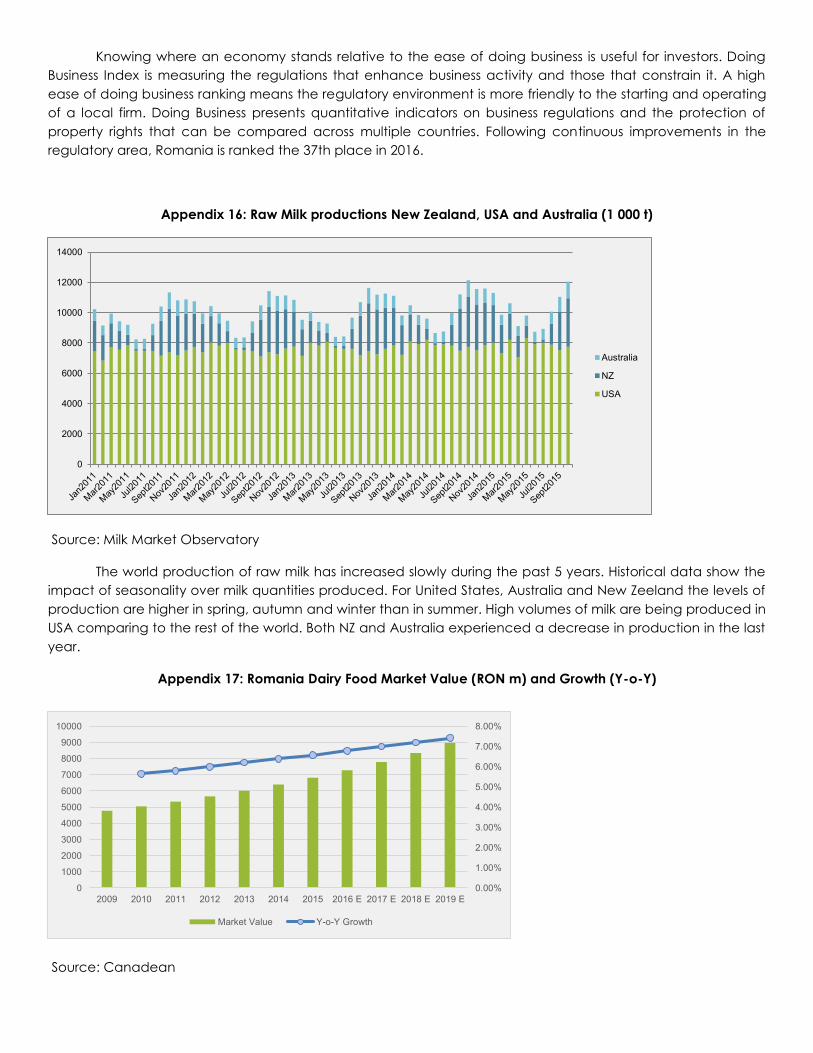
Appendix 16: Raw Milk productions New Zealand, USA and Australia (1 000 t)
Source: Milk Market Observatory
The world production of raw milk has increased slowly during the past 5 years. Historical data show the impact of seasonality over milk quantities produced. For United States, Australia and New Zeeland the levels of production are higher in spring, autumn and winter than in summer. High volumes of milk are being produced in USA comparing to the rest of the world. Both NZ and Australia experienced a decrease in production in the last year.
Appendix 17: Romania Dairy Food Market Value (RON m) and Growth (Y-o-Y)
Source: Canadean
0
2000
4000
6000
8000
10000
12000
14000
Australia
NZ
USA
0
1000
2000
3000
4000
5000
6000
7000
8000
9000
10000
2009 2010 2011 2012 2013 2014 2015E
2016E
2017E
2018E
2019E
Cheese
Yogurt
Soymilk & Soydrinks
Milk
Drinkable Yogurt
Dairy-based &Soy Desserts
Cream
Butter & Spreadable Fats
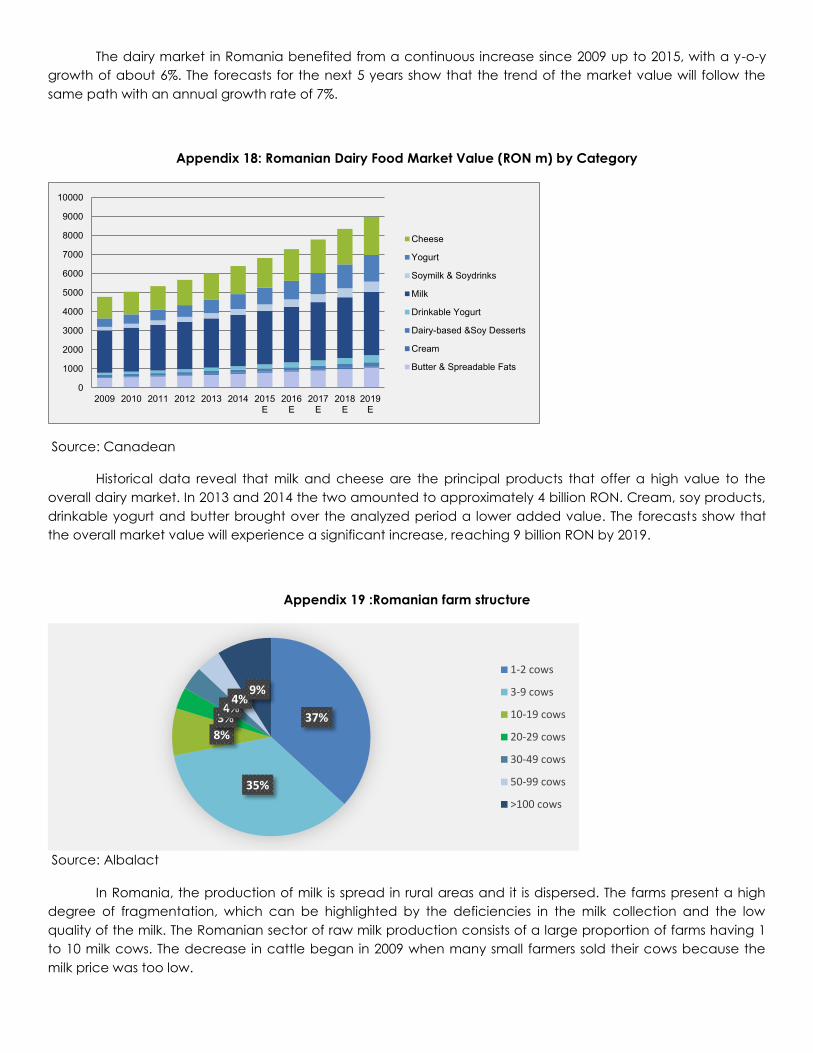
The dairy market in Romania benefited from a continuous increase since 2009 up to 2015, with a y-o-y growth of about 6%. The forecasts for the next 5 years show that the trend of the market value will follow the same path with an annual growth rate of 7%.
Appendix 18: Romanian Dairy Food Market Value (RON m) by Category
Source: Canadean
Historical data reveal that milk and cheese are the principal products that offer a high value to the overall dairy market. In 2013 and 2014 the two amounted to approximately 4 billion RON. Cream, soy products, drinkable yogurt and butter brought over the analyzed period a lower added value. The forecasts show that the overall market value will experience a significant increase, reaching 9 billion RON by 2019.
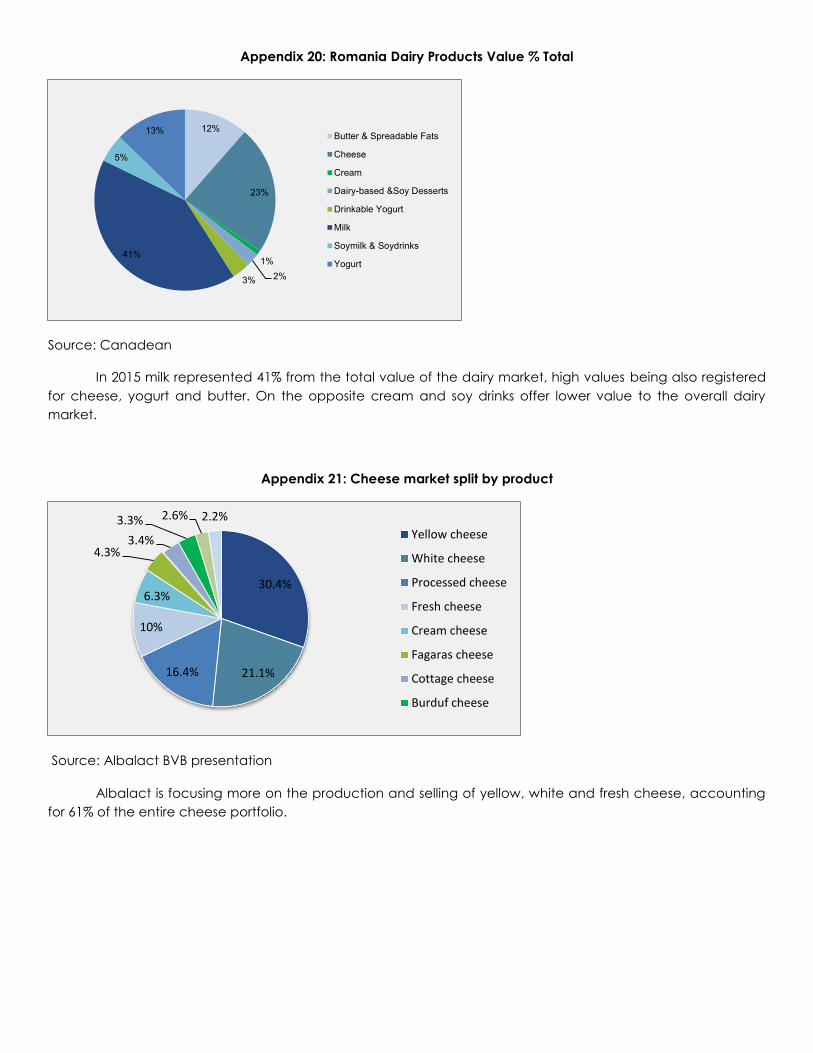
Appendix 19 :Romanian farm structure
Source: Albalact
In Romania, the production of milk is spread in rural areas and it is dispersed. The farms present a high degree of fragmentation, which can be highlighted by the deficiencies in the milk collection and the low quality of the milk. The Romanian sector of raw milk production consists of a large proportion of farms having 1 to 10 milk cows. The decrease in cattle began in 2009 when many small farmers sold their cows because the milk price was too low.
37%
35%
8%3%4%4%
9%1-2 cows
3-9 cows
10-19 cows
20-29 cows
30-49 cows
50-99 cows
>100 cows
12%
23%
1%2%3%
41%
5%
13% Butter & Spreadable Fats
Cheese
Cream
Dairy-based &Soy Desserts
Drinkable Yogurt
Milk
Soymilk & Soydrinks
Yogurt
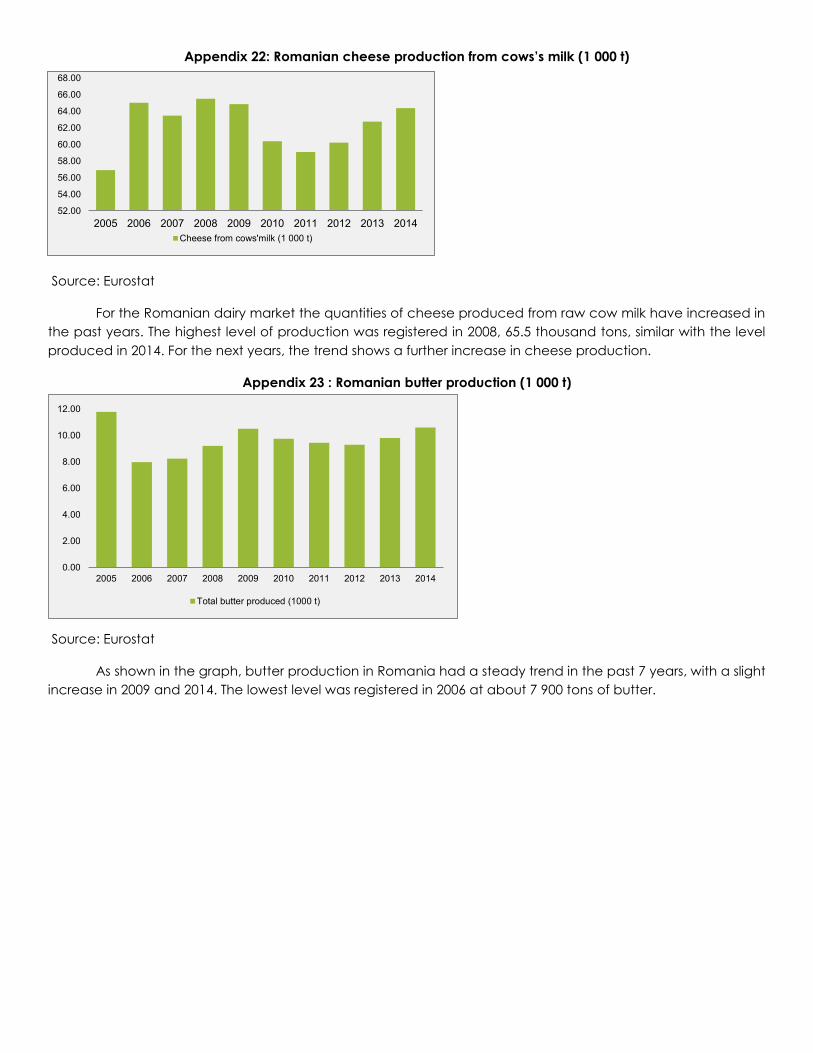
Appendix 20: Romania Dairy Products Value % Total
Source: Canadean
In 2015 milk represented 41% from the total value of the dairy market, high values being also registered for cheese, yogurt and butter. On the opposite cream and soy drinks offer lower value to the overall dairy market.
Appendix 21: Cheese market split by product
Source: Albalact BVB presentation
Albalact is focusing more on the production and selling of yellow, white and fresh cheese, accounting for 61% of the entire cheese portfolio.
30.4%
21.1%16.4%
10%
6.3%
4.3%3.4%
3.3% 2.6% 2.2%Yellow cheese
White cheese
Processed cheese
Fresh cheese
Cream cheese
Fagaras cheese
Cottage cheese
Burduf cheese
52.00
54.00
56.00
58.00
60.00
62.00
64.00
66.00
68.00
2005 2006 2007 2008 2009 2010 2011 2012 2013 2014Cheese from cows'milk (1 000 t)
0.00
2.00
4.00
6.00
8.00
10.00
12.00
2005 2006 2007 2008 2009 2010 2011 2012 2013 2014
Total butter produced (1000 t)
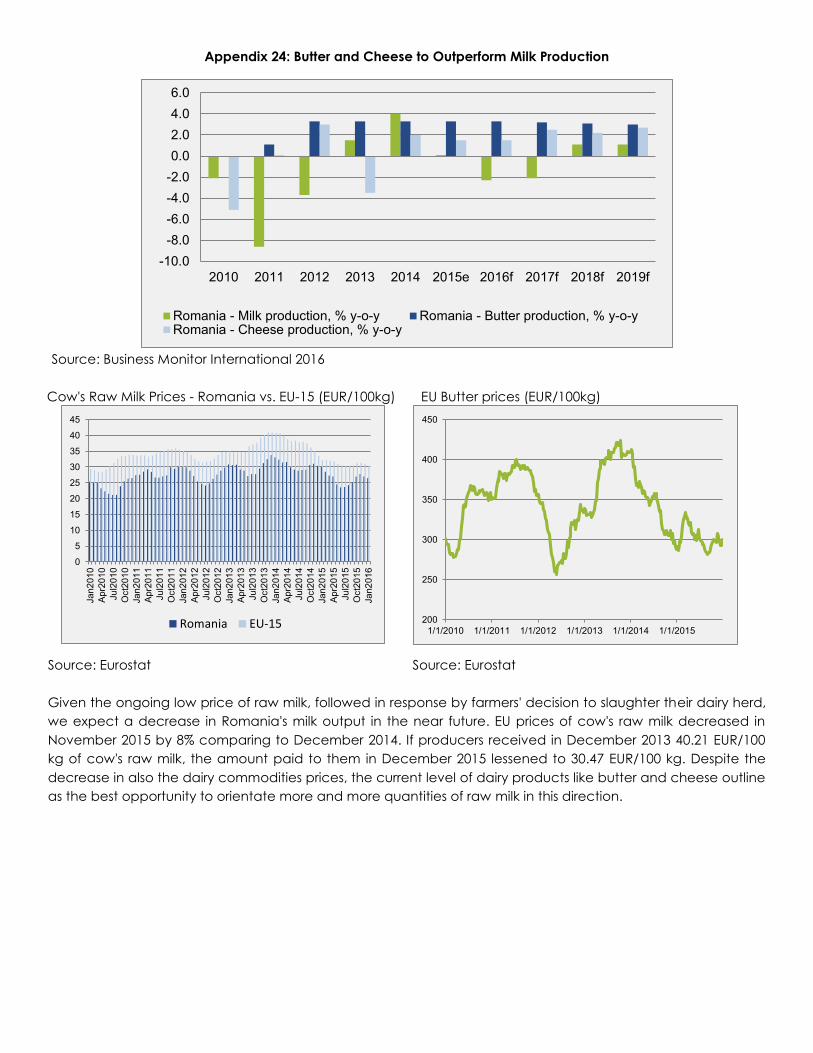
Appendix 22: Romanian cheese production from cows’s milk (1 000 t)
Source: Eurostat
For the Romanian dairy market the quantities of cheese produced from raw cow milk have increased in the past years. The highest level of production was registered in 2008, 65.5 thousand tons, similar with the level produced in 2014. For the next years, the trend shows a further increase in cheese production.
Appendix 23 : Romanian butter production (1 000 t)
Source: Eurostat
As shown in the graph, butter production in Romania had a steady trend in the past 7 years, with a slight increase in 2009 and 2014. The lowest level was registered in 2006 at about 7 900 tons of butter.
0
5
10
15
20
25
30
35
40
45
Jan2
010
Apr
2010
Jul2
010
Oct
2010
Jan2
011
Apr
2011
Jul2
011
Oct
2011
Jan2
012
Apr
2012
Jul2
012
Oct
2012
Jan2
013
Apr
2013
Jul2
013
Oct
2013
Jan2
014
Apr
2014
Jul2
014
Oct
2014
Jan2
015
Apr
2015
Jul2
015
Oct
2015
Jan2
016
Romania EU-15 200
250
300
350
400
450
1/1/2010 1/1/2011 1/1/2012 1/1/2013 1/1/2014 1/1/2015
Appendix 24: Butter and Cheese to Outperform Milk Production
Source: Business Monitor International 2016
Cow's Raw Milk Prices - Romania vs. EU-15 (EUR/100kg) EU Butter prices (EUR/100kg)
Source: Eurostat Source: Eurostat Given the ongoing low price of raw milk, followed in response by farmers' decision to slaughter their dairy herd, we expect a decrease in Romania's milk output in the near future. EU prices of cow's raw milk decreased in November 2015 by 8% comparing to December 2014. If producers received in December 2013 40.21 EUR/100 kg of cow's raw milk, the amount paid to them in December 2015 lessened to 30.47 EUR/100 kg. Despite the decrease in also the dairy commodities prices, the current level of dairy products like butter and cheese outline as the best opportunity to orientate more and more quantities of raw milk in this direction.
-10.0-8.0-6.0-4.0-2.00.02.04.06.0
2010 2011 2012 2013 2014 2015e 2016f 2017f 2018f 2019f
Romania - Milk production, % y-o-y Romania - Butter production, % y-o-yRomania - Cheese production, % y-o-y
012345
Barriers to entry
BargainingPower ofSuppliers
Intensity ofCompetitive
Rivalry
BargainingPower of
Customers
Threat ofSubstituteProducts
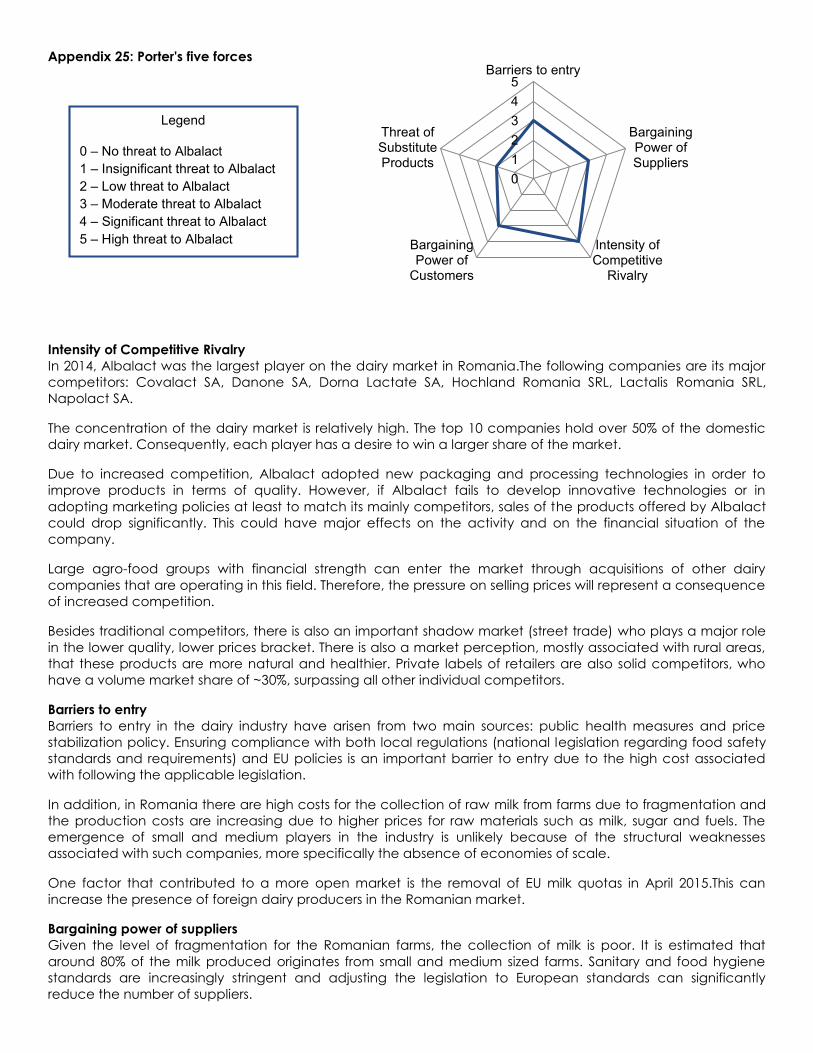
Appendix 25: Porter's five forces
Intensity of Competitive Rivalry In 2014, Albalact was the largest player on the dairy market in Romania.The following companies are its major competitors: Covalact SA, Danone SA, Dorna Lactate SA, Hochland Romania SRL, Lactalis Romania SRL, Napolact SA.
The concentration of the dairy market is relatively high. The top 10 companies hold over 50% of the domestic dairy market. Consequently, each player has a desire to win a larger share of the market.
Due to increased competition, Albalact adopted new packaging and processing technologies in order to improve products in terms of quality. However, if Albalact fails to develop innovative technologies or in adopting marketing policies at least to match its mainly competitors, sales of the products offered by Albalact could drop significantly. This could have major effects on the activity and on the financial situation of the company.
Large agro-food groups with financial strength can enter the market through acquisitions of other dairy companies that are operating in this field. Therefore, the pressure on selling prices will represent a consequence of increased competition.
Besides traditional competitors, there is also an important shadow market (street trade) who plays a major role in the lower quality, lower prices bracket. There is also a market perception, mostly associated with rural areas, that these products are more natural and healthier. Private labels of retailers are also solid competitors, who have a volume market share of ~30%, surpassing all other individual competitors.
Barriers to entry Barriers to entry in the dairy industry have arisen from two main sources: public health measures and price stabilization policy. Ensuring compliance with both local regulations (national legislation regarding food safety standards and requirements) and EU policies is an important barrier to entry due to the high cost associated with following the applicable legislation.
In addition, in Romania there are high costs for the collection of raw milk from farms due to fragmentation and the production costs are increasing due to higher prices for raw materials such as milk, sugar and fuels. The emergence of small and medium players in the industry is unlikely because of the structural weaknesses associated with such companies, more specifically the absence of economies of scale.
One factor that contributed to a more open market is the removal of EU milk quotas in April 2015.This can increase the presence of foreign dairy producers in the Romanian market.
Bargaining power of suppliers Given the level of fragmentation for the Romanian farms, the collection of milk is poor. It is estimated that around 80% of the milk produced originates from small and medium sized farms. Sanitary and food hygiene standards are increasingly stringent and adjusting the legislation to European standards can significantly reduce the number of suppliers.
Legend
0 – No threat to Albalact 1 – Insignificant threat to Albalact 2 – Low threat to Albalact 3 – Moderate threat to Albalact 4 – Significant threat to Albalact 5 – High threat to Albalact
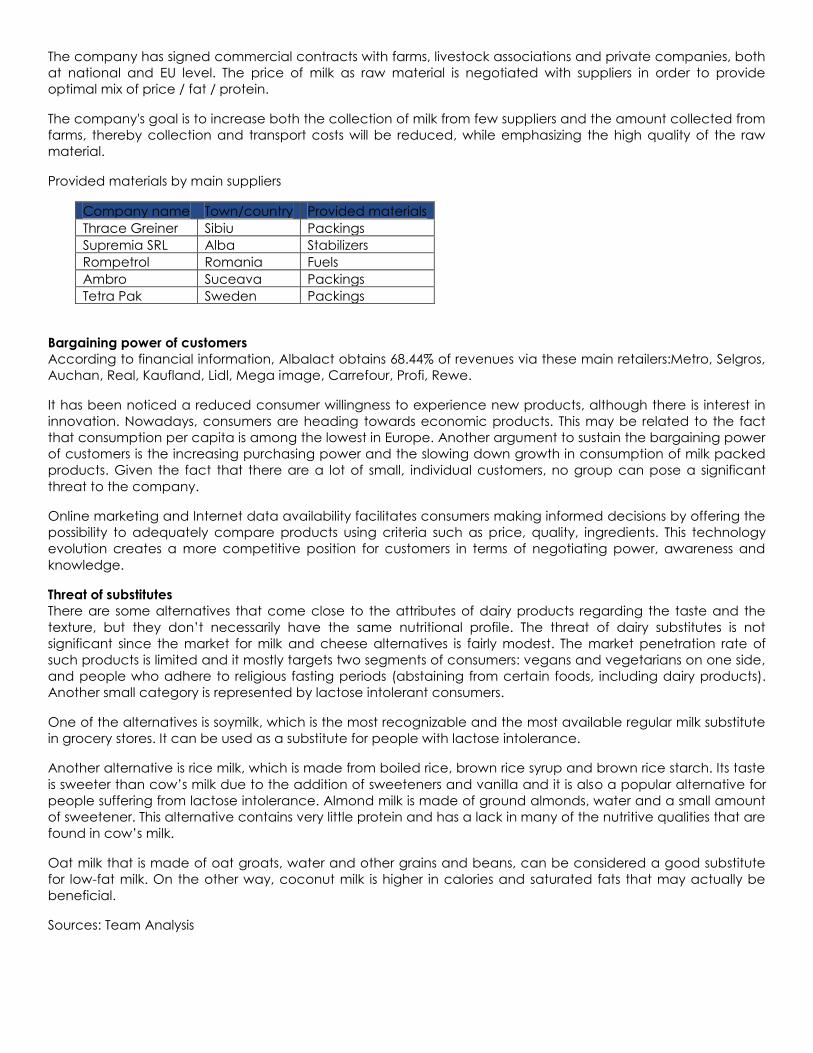
The company has signed commercial contracts with farms, livestock associations and private companies, both at national and EU level. The price of milk as raw material is negotiated with suppliers in order to provide optimal mix of price / fat / protein.
The company's goal is to increase both the collection of milk from few suppliers and the amount collected from farms, thereby collection and transport costs will be reduced, while emphasizing the high quality of the raw material.
Provided materials by main suppliers
Company name Town/country Provided materials Thrace Greiner Sibiu Packings Supremia SRL Alba Stabilizers Rompetrol Romania Fuels Ambro Suceava Packings Tetra Pak Sweden Packings
Bargaining power of customers According to financial information, Albalact obtains 68.44% of revenues via these main retailers:Metro, Selgros, Auchan, Real, Kaufland, Lidl, Mega image, Carrefour, Profi, Rewe.
It has been noticed a reduced consumer willingness to experience new products, although there is interest in innovation. Nowadays, consumers are heading towards economic products. This may be related to the fact that consumption per capita is among the lowest in Europe. Another argument to sustain the bargaining power of customers is the increasing purchasing power and the slowing down growth in consumption of milk packed products. Given the fact that there are a lot of small, individual customers, no group can pose a significant threat to the company.
Online marketing and Internet data availability facilitates consumers making informed decisions by offering the possibility to adequately compare products using criteria such as price, quality, ingredients. This technology evolution creates a more competitive position for customers in terms of negotiating power, awareness and knowledge.
Threat of substitutes There are some alternatives that come close to the attributes of dairy products regarding the taste and the texture, but they don’t necessarily have the same nutritional profile. The threat of dairy substitutes is not significant since the market for milk and cheese alternatives is fairly modest. The market penetration rate of such products is limited and it mostly targets two segments of consumers: vegans and vegetarians on one side, and people who adhere to religious fasting periods (abstaining from certain foods, including dairy products). Another small category is represented by lactose intolerant consumers.
One of the alternatives is soymilk, which is the most recognizable and the most available regular milk substitute in grocery stores. It can be used as a substitute for people with lactose intolerance.
Another alternative is rice milk, which is made from boiled rice, brown rice syrup and brown rice starch. Its taste is sweeter than cow’s milk due to the addition of sweeteners and vanilla and it is also a popular alternative for people suffering from lactose intolerance. Almond milk is made of ground almonds, water and a small amount of sweetener. This alternative contains very little protein and has a lack in many of the nutritive qualities that are found in cow’s milk.
Oat milk that is made of oat groats, water and other grains and beans, can be considered a good substitute for low-fat milk. On the other way, coconut milk is higher in calories and saturated fats that may actually be beneficial.
Sources: Team Analysis
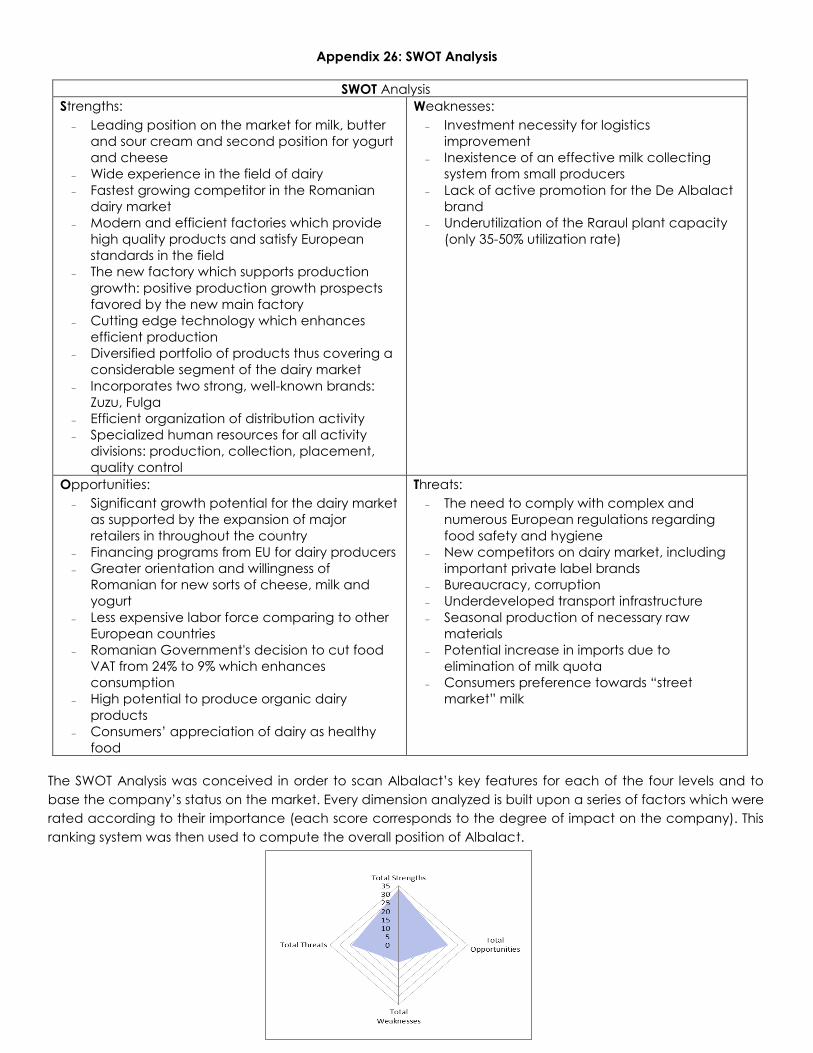
Appendix 26: SWOT Analysis
SWOT Analysis Strengths:
� Leading position on the market for milk, butter and sour cream and second position for yogurt and cheese
� Wide experience in the field of dairy � Fastest growing competitor in the Romanian
dairy market � Modern and efficient factories which provide
high quality products and satisfy European standards in the field
� The new factory which supports production growth: positive production growth prospects favored by the new main factory
� Cutting edge technology which enhances efficient production
� Diversified portfolio of products thus covering a considerable segment of the dairy market
� Incorporates two strong, well-known brands: Zuzu, Fulga
� Efficient organization of distribution activity � Specialized human resources for all activity
divisions: production, collection, placement, quality control
Weaknesses: � Investment necessity for logistics
improvement � Inexistence of an effective milk collecting
system from small producers � Lack of active promotion for the De Albalact
brand � Underutilization of the Raraul plant capacity
(only 35-50% utilization rate)
Opportunities: � Significant growth potential for the dairy market
as supported by the expansion of major retailers in throughout the country
� Financing programs from EU for dairy producers � Greater orientation and willingness of
Romanian for new sorts of cheese, milk and yogurt
� Less expensive labor force comparing to other European countries
� Romanian Government's decision to cut food VAT from 24% to 9% which enhances consumption
� High potential to produce organic dairy products
� Consumers’ appreciation of dairy as healthy food
Threats: � The need to comply with complex and
numerous European regulations regarding food safety and hygiene
� New competitors on dairy market, including important private label brands
� Bureaucracy, corruption � Underdeveloped transport infrastructure � Seasonal production of necessary raw
materials � Potential increase in imports due to
elimination of milk quota � Consumers preference towards “street
market” milk
The SWOT Analysis was conceived in order to scan Albalact’s key features for each of the four levels and to base the company’s status on the market. Every dimension analyzed is built upon a series of factors which were rated according to their importance (each score corresponds to the degree of impact on the company). This ranking system was then used to compute the overall position of Albalact.
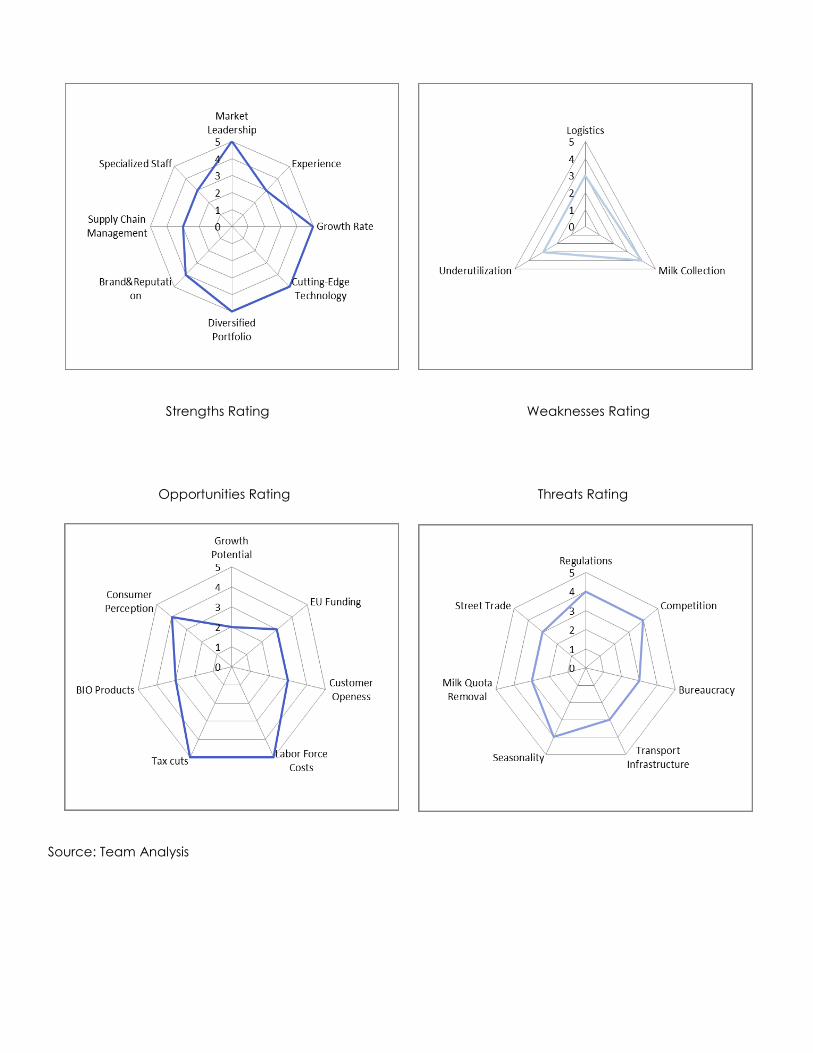
Strengths Rating Weaknesses Rating
Opportunities Rating Threats Rating
Source: Team Analysis
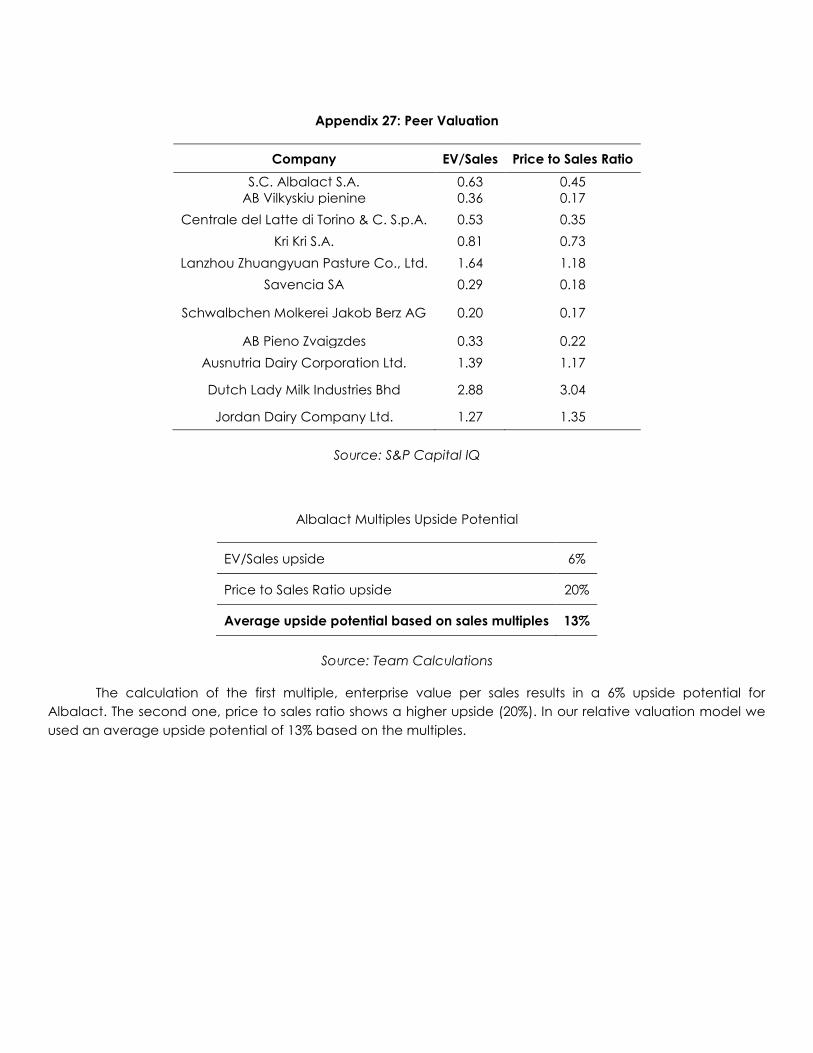
Appendix 27: Peer Valuation
Company EV/Sales Price to Sales Ratio
S.C. Albalact S.A. 0.63 0.45 AB Vilkyskiu pienine 0.36 0.17
Centrale del Latte di Torino & C. S.p.A. 0.53 0.35 Kri Kri S.A. 0.81 0.73
Lanzhou Zhuangyuan Pasture Co., Ltd. 1.64 1.18 Savencia SA 0.29 0.18
Schwalbchen Molkerei Jakob Berz AG 0.20 0.17
AB Pieno Zvaigzdes 0.33 0.22 Ausnutria Dairy Corporation Ltd. 1.39 1.17
Dutch Lady Milk Industries Bhd 2.88 3.04
Jordan Dairy Company Ltd. 1.27 1.35
Source: S&P Capital IQ
Albalact Multiples Upside Potential
EV/Sales upside 6%
Price to Sales Ratio upside 20%
Average upside potential based on sales multiples 13%
Source: Team Calculations
The calculation of the first multiple, enterprise value per sales results in a 6% upside potential for Albalact. The second one, price to sales ratio shows a higher upside (20%). In our relative valuation model we used an average upside potential of 13% based on the multiples.
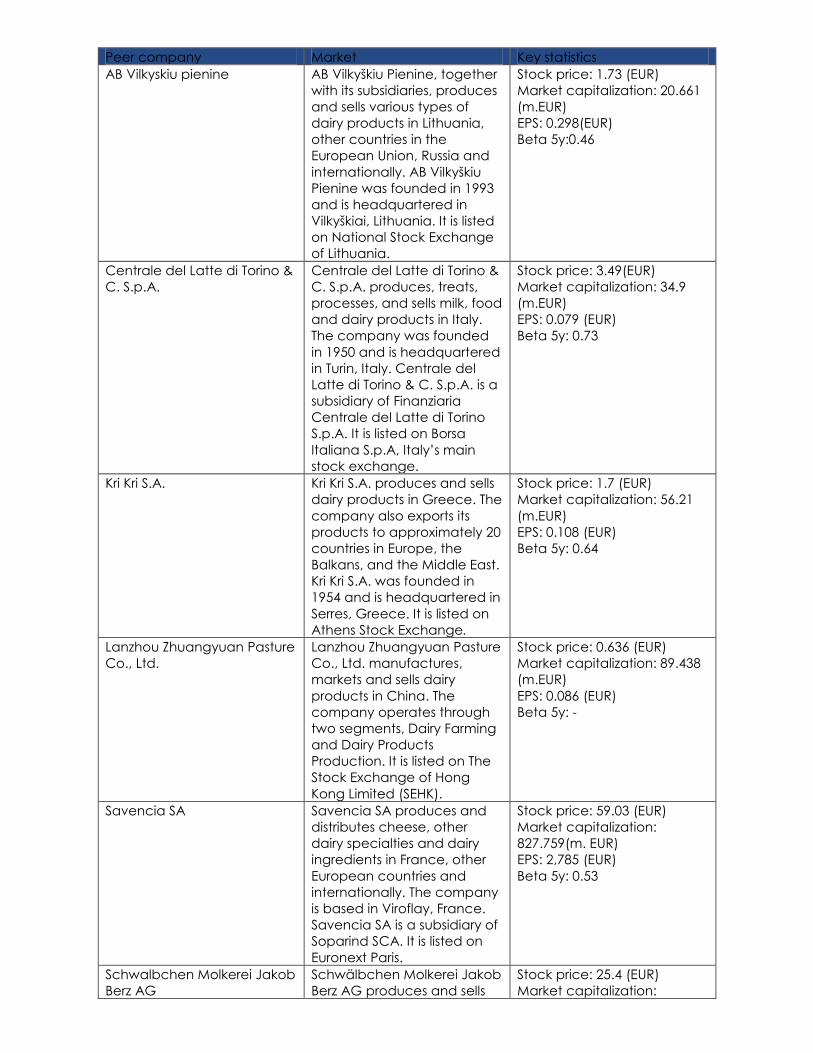
Peer company Market Key statistics AB Vilkyskiu pienine AB Vilkyškiu Pienine, together
with its subsidiaries, produces and sells various types of dairy products in Lithuania, other countries in the European Union, Russia and internationally. AB Vilkyškiu Pienine was founded in 1993 and is headquartered in Vilkyškiai, Lithuania. It is listed on National Stock Exchange of Lithuania.
Stock price: 1.73 (EUR) Market capitalization: 20.661 (m.EUR) EPS: 0.298(EUR) Beta 5y:0.46
Centrale del Latte di Torino & C. S.p.A.
Centrale del Latte di Torino & C. S.p.A. produces, treats, processes, and sells milk, food and dairy products in Italy. The company was founded in 1950 and is headquartered in Turin, Italy. Centrale del Latte di Torino & C. S.p.A. is a subsidiary of Finanziaria Centrale del Latte di Torino S.p.A. It is listed on Borsa Italiana S.p.A, Italy’s main stock exchange.
Stock price: 3.49(EUR) Market capitalization: 34.9 (m.EUR) EPS: 0.079 (EUR) Beta 5y: 0.73
Kri Kri S.A. Kri Kri S.A. produces and sells dairy products in Greece. The company also exports its products to approximately 20 countries in Europe, the Balkans, and the Middle East. Kri Kri S.A. was founded in 1954 and is headquartered in Serres, Greece. It is listed on Athens Stock Exchange.
Stock price: 1.7 (EUR) Market capitalization: 56.21 (m.EUR) EPS: 0.108 (EUR) Beta 5y: 0.64
Lanzhou Zhuangyuan Pasture Co., Ltd.
Lanzhou Zhuangyuan Pasture Co., Ltd. manufactures, markets and sells dairy products in China. The company operates through two segments, Dairy Farming and Dairy Products Production. It is listed on The Stock Exchange of Hong Kong Limited (SEHK).
Stock price: 0.636 (EUR) Market capitalization: 89.438 (m.EUR) EPS: 0.086 (EUR) Beta 5y: -
Savencia SA Savencia SA produces and distributes cheese, other dairy specialties and dairy ingredients in France, other European countries and internationally. The company is based in Viroflay, France. Savencia SA is a subsidiary of Soparind SCA. It is listed on Euronext Paris.
Stock price: 59.03 (EUR) Market capitalization: 827.759(m. EUR) EPS: 2,785 (EUR) Beta 5y: 0.53
Schwalbchen Molkerei Jakob Berz AG
Schwälbchen Molkerei Jakob Berz AG produces and sells
Stock price: 25.4 (EUR) Market capitalization:
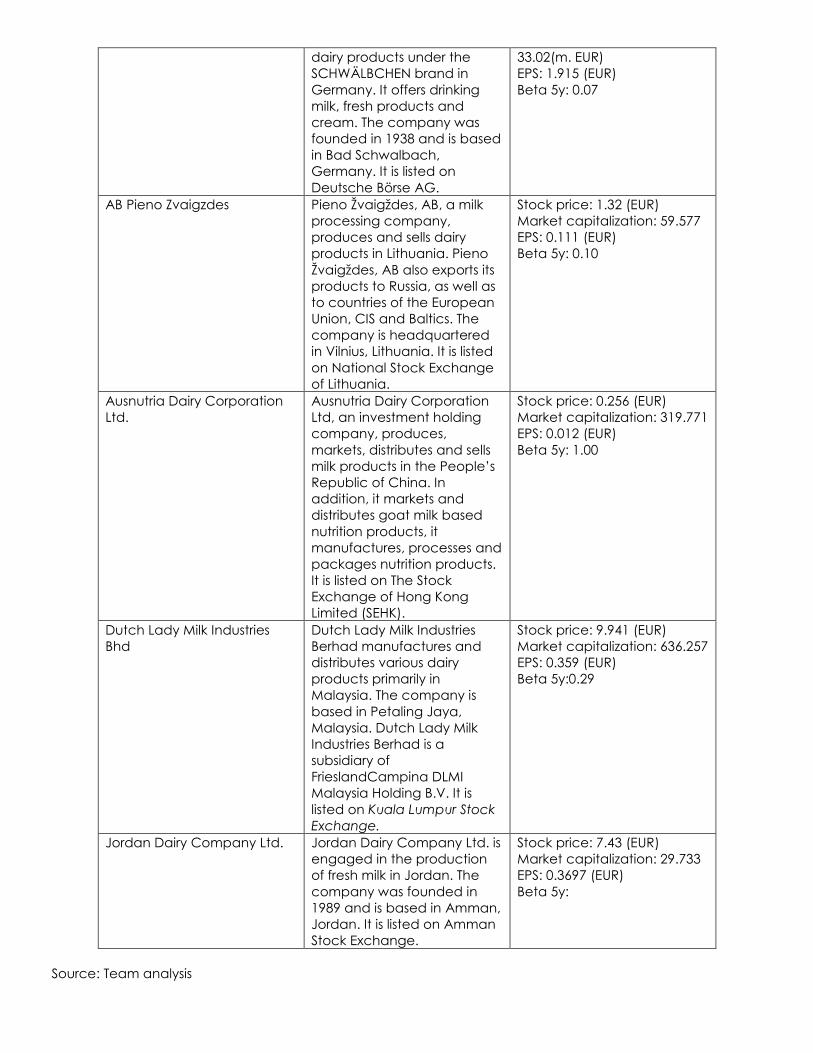
dairy products under the SCHWÄLBCHEN brand in Germany. It offers drinking milk, fresh products and cream. The company was founded in 1938 and is based in Bad Schwalbach, Germany. It is listed on Deutsche Börse AG.
33.02(m. EUR) EPS: 1.915 (EUR) Beta 5y: 0.07
AB Pieno Zvaigzdes Pieno Žvaigždes, AB, a milk processing company, produces and sells dairy products in Lithuania. Pieno Žvaigždes, AB also exports its products to Russia, as well as to countries of the European Union, CIS and Baltics. The company is headquartered in Vilnius, Lithuania. It is listed on National Stock Exchange of Lithuania.
Stock price: 1.32 (EUR) Market capitalization: 59.577 EPS: 0.111 (EUR) Beta 5y: 0.10
Ausnutria Dairy Corporation Ltd.
Ausnutria Dairy Corporation Ltd, an investment holding company, produces, markets, distributes and sells milk products in the People’s Republic of China. In addition, it markets and distributes goat milk based nutrition products, it manufactures, processes and packages nutrition products. It is listed on The Stock Exchange of Hong Kong Limited (SEHK).
Stock price: 0.256 (EUR) Market capitalization: 319.771 EPS: 0.012 (EUR) Beta 5y: 1.00
Dutch Lady Milk Industries Bhd
Dutch Lady Milk Industries Berhad manufactures and distributes various dairy products primarily in Malaysia. The company is based in Petaling Jaya, Malaysia. Dutch Lady Milk Industries Berhad is a subsidiary of FrieslandCampina DLMI Malaysia Holding B.V. It is listed on Kuala Lumpur Stock Exchange.
Stock price: 9.941 (EUR) Market capitalization: 636.257 EPS: 0.359 (EUR) Beta 5y:0.29
Jordan Dairy Company Ltd. Jordan Dairy Company Ltd. is engaged in the production of fresh milk in Jordan. The company was founded in 1989 and is based in Amman, Jordan. It is listed on Amman Stock Exchange.
Stock price: 7.43 (EUR) Market capitalization: 29.733 EPS: 0.3697 (EUR) Beta 5y:
Source: Team analysis
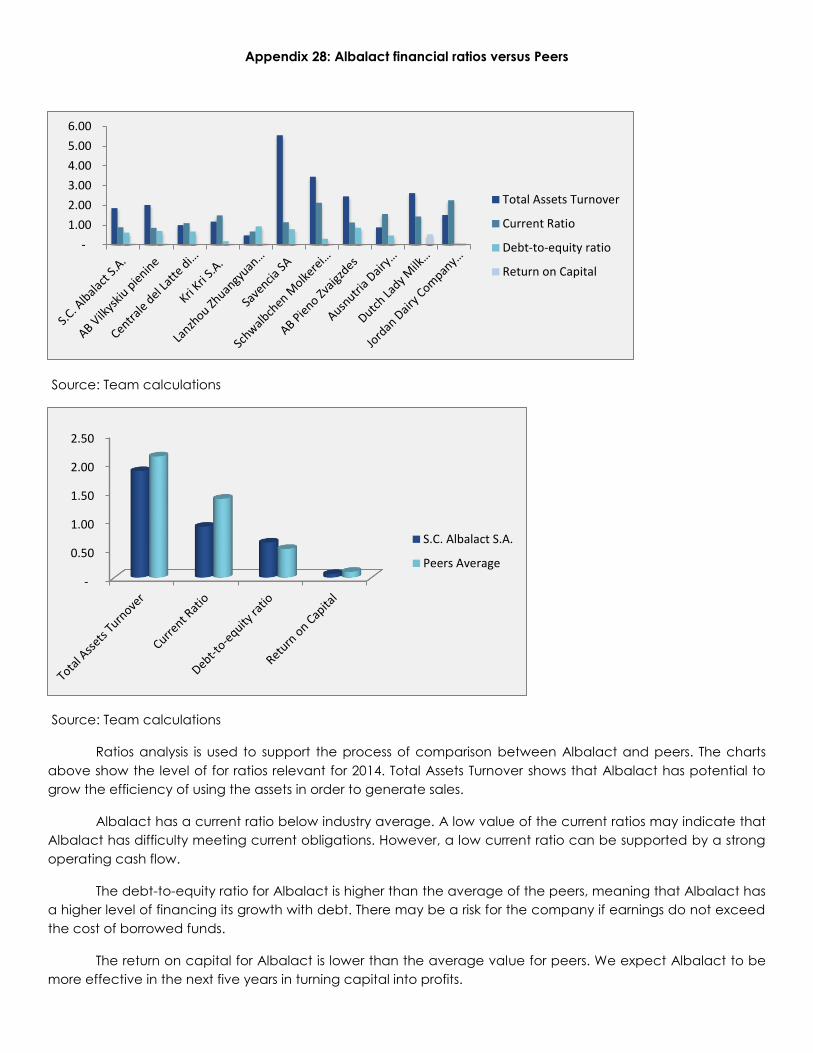
Appendix 28: Albalact financial ratios versus Peers
Source: Team calculations
Source: Team calculations
Ratios analysis is used to support the process of comparison between Albalact and peers. The charts above show the level of for ratios relevant for 2014. Total Assets Turnover shows that Albalact has potential to grow the efficiency of using the assets in order to generate sales.
Albalact has a current ratio below industry average. A low value of the current ratios may indicate that Albalact has difficulty meeting current obligations. However, a low current ratio can be supported by a strong operating cash flow.
The debt-to-equity ratio for Albalact is higher than the average of the peers, meaning that Albalact has a higher level of financing its growth with debt. There may be a risk for the company if earnings do not exceed the cost of borrowed funds.
The return on capital for Albalact is lower than the average value for peers. We expect Albalact to be more effective in the next five years in turning capital into profits.
- 1.00 2.00 3.00 4.00 5.00 6.00
Total Assets Turnover
Current Ratio
Debt-to-equity ratio
Return on Capital
-
0.50
1.00
1.50
2.00
2.50
S.C. Albalact S.A.
Peers Average
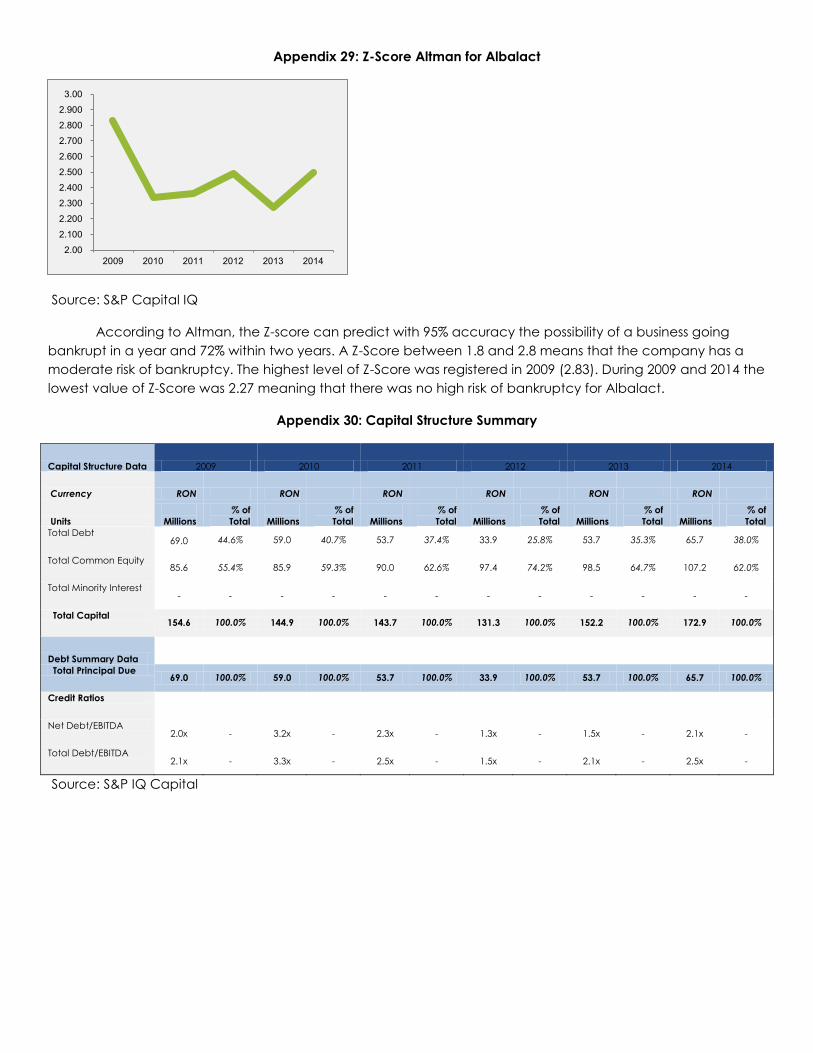
Appendix 29: Z-Score Altman for Albalact
Source: S&P Capital IQ
According to Altman, the Z-score can predict with 95% accuracy the possibility of a business going bankrupt in a year and 72% within two years. A Z-Score between 1.8 and 2.8 means that the company has a moderate risk of bankruptcy. The highest level of Z-Score was registered in 2009 (2.83). During 2009 and 2014 the lowest value of Z-Score was 2.27 meaning that there was no high risk of bankruptcy for Albalact.
Appendix 30: Capital Structure Summary
Capital Structure Data 2009 2010 2011 2012 2013 2014
Currency RON RON RON RON RON RON
Units
Millions % of Total
Millions
% of Total
Millions
% of Total
Millions
% of Total
Millions
% of Total
Millions
% of Total
Total Debt 69.0 44.6% 59.0 40.7% 53.7 37.4% 33.9 25.8% 53.7 35.3% 65.7 38.0%
Total Common Equity 85.6 55.4% 85.9 59.3% 90.0 62.6% 97.4 74.2% 98.5 64.7% 107.2 62.0%
Total Minority Interest - - - - - - - - - - - -
Total Capital 154.6 100.0% 144.9 100.0% 143.7 100.0% 131.3 100.0% 152.2 100.0% 172.9 100.0%
Debt Summary Data Total Principal Due
69.0 100.0% 59.0 100.0% 53.7 100.0% 33.9 100.0% 53.7 100.0% 65.7 100.0%
Credit Ratios
Net Debt/EBITDA 2.0x - 3.2x - 2.3x - 1.3x - 1.5x - 2.1x -
Total Debt/EBITDA 2.1x - 3.3x - 2.5x - 1.5x - 2.1x - 2.5x -
Source: S&P IQ Capital
2.00
2.100
2.200
2.300
2.400
2.500
2.600
2.700
2.800
2.900
3.00
2009 2010 2011 2012 2013 2014
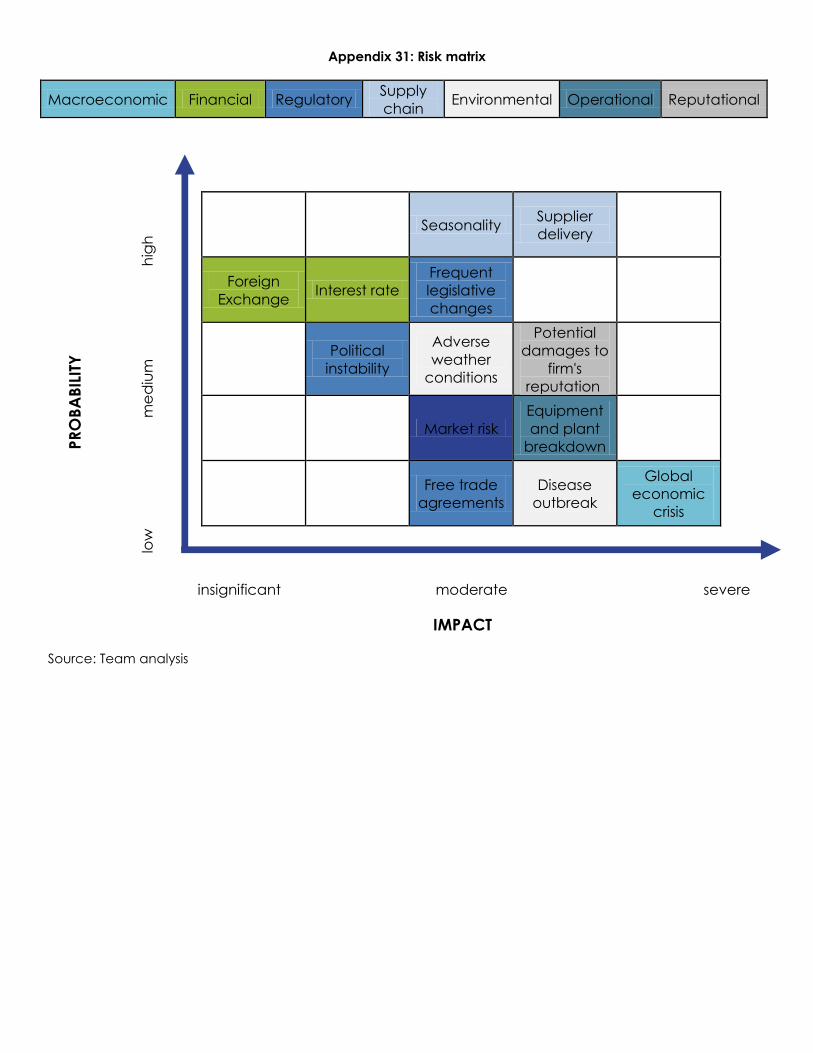
Appendix 31: Risk matrix
Macroeconomic Financial Regulatory Supply chain Environmental Operational Reputational
insignificant moderate severe
IMPACT
Source: Team analysis
Seasonality Supplier delivery
Foreign Exchange Interest rate
Frequent legislative changes
Political instability
Adverse weather
conditions
Potential damages to
firm's reputation
Market risk Equipment and plant
breakdown
Free trade agreements
Disease outbreak
Global economic
crisis
PRO
BABI
LITY
lo
w
m
ediu
m
h
igh
Ownership and material conflicts of interest: The author(s), or a member of their household, of this report does not hold a financial interest in the securities of this company. The author(s), or a member of their household, of this report does not know of the existence of any conflicts of interest that might bias the content or publication of this report. Receipt of compensation: Compensation of the author(s) of this report is not based on investment banking revenue. Position as a officer or director: The author(s), or a member of their household, does not serve as an officer, director or advisory board member of the subject company. Market making: The author(s) does not act as a market maker in the subject company’s securities. Disclaimer: The information set forth herein has been obtained or derived from sources generally available to the public and believed by the author(s) to be reliable, but the author(s) does not make any representation or warranty, express or implied, as to its accuracy or completeness. The information is not intended to be used as the basis of any investment decisions by any person or entity. This information does not constitute investment advice, nor is it an offer or a solicitation of an offer to buy or sell any security. This report should not be considered to be a recommendation by any individual affiliated with CFA Society of Buffalo and Rochester, CFA Institute or the CFA Institute Research Challenge with regard to this company’s stock.