Investment Propensities under Carbon Policy...
42
77 The Energy Journal, Vol. 32, No. 1, Copyright 2011 by the IAEE. All rights reserved. * Corresponding author. University of Calgary, 2500 University Drive NW, Calgary, Alberta, T2N 1N4, Canada. E-mail: [email protected] ** London Business School, Regent’s Park, London NW1 4SA, UK, [email protected] *** Oxford Energy Associates, Forest Hill, Oxford OX33 1EH, UK, william.blyth@ oxfordenergy.com Investment Propensities under Carbon Policy Uncertainty Janne Kettunen*, Derek W. Bunn** and William Blyth*** Whether companies invest in new power facilities at a particular point in time, or delay, depends upon the perceived evolution of uncertainties and the investors’ attitudes to risk and return. With additional risks emerging through climate change mitigation mechanisms, the propensity to invest may increasingly depend upon how each technology and company is exposed to carbon price un- certainty. We approach this by estimating the cumulative probabilities of invest- ment over time in various technologies as a function of behavioral, policy, finan- cial and market assumptions. Using a multistage stochastic optimization model with exogenous uncertainty in carbon price, we demonstrate that detailed finan- cial analysis with real options and risk constraints can make substantial difference to the investment propensities compared to conventional economic analysis. Fur- ther, we show that the effects of different carbon policies and market instruments on these decision propensities depend on the characteristics of the companies and may induce market structure evolution. 1. INTRODUCTION Many regional and state institutions are formulating policies to mitigate global warming that will change the operations of, and investment in, fossil fuel energy facilities. The European Union has had a mandatory cap-and-trade market for carbon dioxide emissions in the power and heavy industry sectors since 2005, with the ambitious post-Kyoto target of at least a 20% reduction by 2020 and much more by 2050, depending upon international accords (BERR 2008, Euro- pean Commission 2008). Other regions, countries, and states are following (La- batt and White 2007). For decision-making in the electricity sector, carbon price uncertainty and the associated policy risks present major new uncertainties, the properties of which are quite different from the usual fuel, demand and market uncertainties to which power company managers have become accustomed.
-
Upload
truongquynh -
Category
Documents
-
view
216 -
download
1
Transcript of Investment Propensities under Carbon Policy...

77
The Energy Journal, Vol. 32, No. 1, Copyright �2011 by the IAEE. All rights reserved.
* Corresponding author. University of Calgary, 2500 University Drive NW, Calgary, Alberta, T2N1N4, Canada. E-mail: [email protected]
** London Business School, Regent’s Park, London NW1 4SA, UK, [email protected]*** Oxford Energy Associates, Forest Hill, Oxford OX33 1EH, UK, william.blyth@
oxfordenergy.com
Investment Propensities under Carbon Policy Uncertainty
Janne Kettunen*, Derek W. Bunn** and William Blyth***
Whether companies invest in new power facilities at a particular pointin time, or delay, depends upon the perceived evolution of uncertainties and theinvestors’ attitudes to risk and return. With additional risks emerging throughclimate change mitigation mechanisms, the propensity to invest may increasinglydepend upon how each technology and company is exposed to carbon price un-certainty. We approach this by estimating the cumulative probabilities of invest-ment over time in various technologies as a function of behavioral, policy, finan-cial and market assumptions. Using a multistage stochastic optimization modelwith exogenous uncertainty in carbon price, we demonstrate that detailed finan-cial analysis with real options and risk constraints can make substantial differenceto the investment propensities compared to conventional economic analysis. Fur-ther, we show that the effects of different carbon policies and market instrumentson these decision propensities depend on the characteristics of the companies andmay induce market structure evolution.
1. INTRODUCTION
Many regional and state institutions are formulating policies to mitigateglobal warming that will change the operations of, and investment in, fossil fuelenergy facilities. The European Union has had a mandatory cap-and-trade marketfor carbon dioxide emissions in the power and heavy industry sectors since 2005,with the ambitious post-Kyoto target of at least a 20% reduction by 2020 andmuch more by 2050, depending upon international accords (BERR 2008, Euro-pean Commission 2008). Other regions, countries, and states are following (La-batt and White 2007). For decision-making in the electricity sector, carbon priceuncertainty and the associated policy risks present major new uncertainties, theproperties of which are quite different from the usual fuel, demand and marketuncertainties to which power company managers have become accustomed.

78 / The Energy Journal
Figure 1: Carbon Price Evolution, European Energy Exchange andEuropean Climate Exchange
As an externality to economic activities, global warming is quite differ-ent even to air pollution. The benefits of air pollution controls accrue locally andregulations often set a credible framework within which companies need to adapttheir operations (e.g., the US sulphur dioxide cap and trade initiative since 1995,Ellerman et al. 2000). Global warming is truly global, however, in that the benefitsonly materialize through substantial international co-operation, and so there arepolicy risks of a higher order than the usual, notwithstanding extensive, regulatoryrisks to be faced by the energy sector. Apart from the fragility of multi-regionalaccords and the burden sharing agreements, there is uncertainty in the feasibilityof targets, the social willingness to pay as well as the actual effectiveness of theeconomic and technological implementations, all of which motivate governmentsto maintain flexibility in their carbon mitigation measures. Policy risk is thereforean important consideration in the investment decision-making of the companiesaffected by carbon trading.
Figure 1 shows the evolution of carbon spot prices in the EU since thecap-and-trade market for allowances started in 2005. Cap-and-trade marketsevolve through stages of cap-setting. The first stage was 2005–2007, and it isclear that within that stage there was considerable volatility with many jumps inthe price. Towards the end, the price declined to zero as it became evident thatthe cap had been more generous than original market expectations and conse-quently that there was no shortage of allowances in the system. Furthermore,allowances in Phase I could not be carried forward to Phase II. In the secondphase, 2008–2012, spot prices initially rose with the apparently stricter caps, butsince 2009, prices again declined with the economic recession this time mitigatingthe intended shortage in the market. Policy uncertainty for 2013 and beyonddepends upon the tightness of the cap-setting. Uncertainty in the carbon markettherefore has stochastic evolution within each phase of cap-setting, and jumps

Investment Propensities under Carbon Policy Uncertainty / 79
1. In the study of Walls and Dyer (1996) all companies had an asset base of $50 million or greater.
between each phase as new targets get set. The impact of these prices can besubstantial. For coal fired generation, each unit increase in the price of carbonper ton adds about the same amount to the marginal cost of generation, so thatin the early months of 2006 and 2008, the marginal cost of coal fired generationwas almost doubled because of the carbon allowances. On gas-fired generation,the effect is about half that of coal, so the policy intent is to motivate switchingfrom coal to gas.
The conventional real option analysis to explore the timing of an in-vestment decision is a well-known theoretical framework (Dixit and Pindyck1994), with extensions by, inter alia, Santiago and Vakili (2005), Huchzermeierand Loch (2001) and demonstrates value in several practical contexts (e.g., Mit-tendorf 2004, Tseng and Barz 2002, Meier et al. 2001). Faced with an exogenouscarbon policy uncertainty, real options analysis would be expected to indicate apropensity to delay investments, and this appears to depend upon the technol-ogies (Reedman et al. 2006, Blyth et al. 2007), with nuclear power plants inparticular having different optionality properties compared to coal and gas powerplants (Roques et al. 2006, Rothwell 2006). This theoretical propensity is ap-pearing in practice, with press comments, such as “Shell has threatened to haltinvestment . . . as the uncertainty of this [emissions] policy is too high” (Gribben2008) whilst Vincent de Rivas, CEO of EDF Energy in the UK comments that“we will not deliver decarbonized electricity without the right signal from carbonprices” (Crooks 2009). Also, regulatory uncertainty is mentioned as delayingwork on biomass conversions of coal plant at Drax (p.26, Thompson and Quin-lan 2010). To the extent that delays in new power plant construction affectsecurity of supply as well as the achievement of decarbonization, such mani-festations are of serious concern to Governments as the UK Energy Ministernoted, in 2010, the “ . . . actions to introduce the transparency, certainty andlong-termism needed to unlock investment” (p.23, Thompson and Quinlan2010). The purpose of this paper is therefore to analyze in greater detail howvarious policies on carbon pricing may affect the investment propensities ofpower companies, defined as the cumulative probabilities of investment overtime, and hence further inform policy-making in this respect.
Whilst the straightforward option value to delay follows analyticallyfrom a risk-neutral decision analysis (Dixit and Pindyck 1994), the investmentmodel in power generation usually needs to incorporate some degree of riskaversion. In this respect, it is similar to the petroleum sector, e.g., Walls and Dyer(1996). In particular, Walls and Dyer (1996) and Howard (1988) show that therisk aversion decreases in company size.1 Explanations for this include observa-tions that larger companies are more capable of taking larger and riskier projectsbecause their asset portfolio is more technologically diversified and spread inter-nationally reducing market, political and regulatory risks. In some investmentdecision analyses, real options and risk aversion have been implicitly combined

80 / The Energy Journal
2. The general interpretation of a real option as “the right, but not the obligation, to take an actionat a predetermined cost called the exercise price, for a predetermined period of time” (Copeland andAntikarov 2003) leaves quite open how its value will be calculated.
using stochastic dynamic programming and large decision trees with risk-averseutility functions (e.g., Keeney et al. 1986, Smith and Nau 1995, Smith and Mccar-dle 1998). In practice, however, companies are now more inclined to considerrisk as a set of constraints within their financial planning models for investment,using Monte Carlo simulations of the embedded net cash-flow streams to providerisk metrics for cash-flow-at-risk (Froot et al. 1993, Denton et al. 2003, Mintonand Schrand 1999, LaGattuta et al. 2001). Companies appear to be increasinglyconcerned about preserving various financial ratios (e.g., earnings to debt cov-erage ratios) necessary to maintain their investment grades with the credit ratingagencies (Hempstead et al. 2007), and the probability of falling below such criticalratios throughout the life of the project may be their most important articulationof risk. In our analysis, we therefore take this financial planning perspective onrisk and formulate a set of intermediate risk constraints throughout the investmentplanning model.
This modeling perspective is an extension of typical optimal power in-vestment models which assume that new plant will be built whenever there is apositive net present value (Caramanis 1982, Schumacher and Sands 2006, Mur-phy and Smeers 2005, Sen et al. 2006), and even with real options (Reinelt andKeith 2007), these would be inadequate to reflect any importance placed uponrisk constraints. Furthermore, conventional net present value calculations rarelyevaluate financial planning considerations such as optimizing debt exposures. Wetherefore extend the multistage stochastic optimization model to deal with theserisk considerations and include real options to (i) postpone the investment, (ii)retrofit carbon capture and storage (CCS) for coal and gas fired power plants, and(iii) pay back debt earlier.2 We do not value these real options using the riskneutral contingent claims analysis with replicated portfolios or dynamic stochasticprogramming approach. Our approach is similar to the decision analytic approachof evaluating the option to delay using stochastic optimization and values theinvestment opportunity with this and other similarly embedded options. Whilststochastic optimization in this context is not new (Birge and Rose 1995, Birgeand Louveaux 1997), we incorporate the real options, a new scenario generationapproach, risk constraints, and a more detailed level of financial planning into themethodology. Our approach allows to compute specific cumulative probabilitiesof investment over the temporal domain, thereby focusing more precisely, thanin previous studies including real options, upon the way that policy uncertainty,under various assumptions, affects investment timing. This focus upon relativepropensities to invest at particular points in time is a new departure from con-ventional power investment models, but one that we think is needed to addressthe delay implications, in the uncertain context of exogenous carbon policies.
Our modeling approach is also motivated by Gross et al. (2010) whostate that policy needs to look beyond the investment costs. Particularly, they

Investment Propensities under Carbon Policy Uncertainty / 81
conclude that “policymaking in the energy area needs new tools of analysis thatcan deal with the market risks associated with policy design . . . when designingpolicies intended to promote or direct investment.” In this context, our investmentframework accounts for the exogenous carbon price uncertainty and analyzespolicies, such as enforcing cap or floor for carbon prices, CCS for older lessefficient fossil fuel power plants, free emission allocations for new power plants,and accelerated depreciation. Also, we discuss how these policies and investmentdecisions are impacted by financial, resource, and risk aversion differentiation ofcompanies.
In more specific terms, whilst it is clear that the mandatory requirementto cover carbon emissions from fossil fuel plants increases their marginal costsby the price of these carbon allowances, how uncertainty in carbon prices affectsthe investment in different technologies in the presence of real option to postponethe investment has subtle implications. Since costs get passed through into thewholesale markets (Fezzi and Bunn 2008), if the fossil fuel plant, gas and coal,are the marginal price-setters in the market, it may seem that carbon price uncer-tainty will not affect investment in the carbon emitting plant, if it is financiallyviable, as much as in the infra marginal, possibly more capital-intensive, noncarbon emitting plant, such as nuclear. This then raises the questions of whetherrisk aversion will have a larger effect on the non-fossil technologies, and howGovernment policies to reduce uncertainties will affect decision-making in dif-ferent technologies. If it is apparent that there is a substantial difference in pro-pensities to invest between the risk-averse and the risk-neutral, and also betweenthe debt financed (i.e., financing via issuing bonds or taking loan from bank andpaying interest based on the debt rate) and cash financed (i.e., financing usingexisting cash that could be invested otherwise in company specific projects pro-viding an opportunity rate of return) participants, then, apart from the level ofcarbon prices per se, the associated policy uncertainty will have an effect onmarket structure evolution through a tendency for investment to be led by dom-inant incumbents rather than smaller independent power producers, leading to amore concentrated and hence less competitive market. This may be further en-hanced if the resource-base benefits of a particular portfolio of existing facilitiesincrease the propensity to invest. Finally, and more fundamentally, one mightexpect that risk aversion would generally tend to increase the propensity to delay.However, if the temporal evolution of risks is perceived as sufficiently increasing,the reverse may happen. We are therefore particularly interested in how carbonpolicy uncertainty may affect market structure evolution and most of the com-mentary on the results achieved is developed to provide general insights into thisquestion.
However, in focusing specifically on the impact of carbon policy uncer-tainty upon the temporal cumulative probability function of investment, we donot seek to address the issue of technology choice. Rather, we envisage a companyconsidering the investment decision in a new power plant of a particular tech-nology accounting for the characteristics of the company which are not limited

82 / The Energy Journal
to the availability and conditions of the existing assets but include also carbonpolicies, financial considerations, and risk attitudes. We analyze in detail how theprobability of investment by a particular date would increase or decrease, andhow their relative effects emerge. Whilst a general economic perspective mightview an industry with homogeneous agents each willing to invest in any tech-nology, we take the observation that the industry is heterogeneous and that, pro-viding an investment is financially attractive, companies will pursue technologieswith which they have experience or to which they are strategically attracted. Wedo not, therefore, engage in a discussion of whether one technology or anotheris the most preferred, as, even from an economic perspective, that is so dependentupon fuel and construction assumptions that change rapidly (Milborrow 2008).We do, however, address questions of whether carbon policies and other factorsaffect different technologies to a relatively different extent. Nor do we address,for the same reason, the issue of the optimal capacity mix for carbon mitigation(Roques et al. 2006, Grubb et al. 2006, Green 2007), except insofar as identifyingthe effect that an existing technology portfolio might have on a singular newinvestment. Finally, we take a liberalized market perspective on power investmentin that companies, without a captive retail market and an obligation to serve, willlook at each investment as a project, evaluated on its financial merits in the market,distinct from a regulated monopoly which would engage in least cost long-termplanning of multiple investments over a long horizon (Bloom 1982). This singleinvestment perspective is therefore quite distinct from the conventional capacityplanning models that have been prevalent for many years in the context of ag-gregate planning, but we believe it is more realistic in a market setting, whereincumbents compete with smaller independent power producers, and more suit-able to provide the focus on the specific investment propensities that we areseeking.
Our research contributions are four-fold. First, our results show that thecarbon policy uncertainty leads to a more concentrated and less competitive mar-ket structure. This is because, larger financially stronger incumbent players, whichare typically less risk averse and can borrow money with a lower debt rate thansmaller independent power producers, are more likely to make investments innew power plants under the extra risks from carbon policy uncertainty. This ten-dency to more concentrated power market is reinforced by the higher investmentpropensities of incumbent power producers with existing power plants comparedto new entrants without existing plants. Second, the tendency to concentration,due to carbon policy uncertainty, can be reduced by supporting policies to estab-lish caps and floors for the carbon price and allow the early transmission of carbonshocks to the market. In addition, our results demonstrate that the concentrationeffect can be reduced for gas and coal fired power producers by supporting theearly CCS adoption. Third, this study shows that a simple broad diversity inexisting power plants or a portfolio of existing gas fired power plants does notencourage new risk-averse investments, but rather, specific synergies, such asnuclear and coal, can be effective in promoting investments. This suggests a path

Investment Propensities under Carbon Policy Uncertainty / 83
dependency in the investment propensity depending on the existing asset base,which needs to be accounted for when policies are being developed. Fourth, ourresults show that the Government technology support policies will not be properlyspecified if the investment analysis does not incorporate concurrently (i) financialdetails, such as interest and depreciation tax shields, optimization of debt level,and financing restrictions, (ii) real options, and (iii) uncertainties.
The results of the study also provide some surprises that reinforce thevalue of accounting for company specific characteristic, as it is clear that in as-sessing the relative effects of carbon policy uncertainty and policy instruments,the “devil” is indeed often in the detail. For example, whilst one might expectthe risk-averse participants to always invest later than the risk-neutral, we findthe opposite occurs for coal and gas if their opportunity rate of return is relativelylow, and just as surprising, that increased price volatility may encourage invest-ment by risk-averse gas generators. We also observe that enforcing CCS for olderless efficient fossil fuel power plants may actually encourage risk-neutral anddiscourage risk-averse investments in the competing technology, nuclear. We de-velop the intuition behind these observations in Section 4, but such subtle policy-agent interactions would not have become evident without the precise focus ofthe modeling specification used in this research.
The paper is organized as follows. Section 2 formulates the carbon riskinvestment setting and Section 3 describes the model. Section 4 motivates theexperimental propositions and comments upon the results. Section 5 concludes.
2. THE INVESTMENT FRAMEWORK
We focus upon the two heavy carbon-emitting technologies, coal andgas, where carbon trading will directly influence operational costs and investment.We also consider a non-fossil capital intensive alternative, nuclear, the propertiesof which can be generalized to similar low carbon, low marginal cost, high capitalcost facilities such as hydro and renewables. A company is considering investmentin one facility, in the presence of exogenous industry-wide carbon price uncer-tainty. The investment decision can be taken immediately or be postponed to awaitmore information regarding the expected future carbon prices. Once the decisionto invest is made, it is followed by a construction period, after which the plantcan be taken into operation. In later time periods, a company can also make adecision to retrofit carbon capture and storage (CCS) to coal or gas facilities toreduce its emissions.
Given the industry-wide uncertainty and no exclusive right to invest, thevalue of a real option to delay the investment would, in theory, be zero underperfect competition if the uncertainty were endogenous (Dixit and Pindyck 1994).The carbon price uncertainty is, however, exogenous to the investment decisionsreflecting the global carbon policy uncertainty that depends on the negotiatedburden sharing agreements, emerging new information regarding the impacts ofglobal warming, feasibility of Governments to set abatement targets, the social

84 / The Energy Journal
willingness to pay, and the actual effectiveness of the economic and technologicalimplementations, for example. Moreover, power production markets are not per-fectly competitive and tend to be oligopolistic by nature. Thus, a real optionsanalysis of delaying an investment could be indicative in this context.
We assume that the company makes its investment decision withoutspeculating upon the possible investments of competing companies and whatimpacts these might have. This is clearly a pragmatic behavioral perspective,motivated by the focus upon one incremental investment, rather than the dynamicsof multi-agent investments. In a contestable market, the option to invest will beopen to all, and it is plausible that awareness of competitive intentions and delib-erate signaling will enter the investment considerations of all participants. How-ever, we are not seeking to derive capacity equilibrium or forecasts of marketevolution, but rather compare the behavioral propensities of different agents toanalyze the signals that different policies set. To the extent that market participantsmay substantially follow these signals, a transition will occur in the market struc-ture, but we are seeking only to understand how these tendencies may dependupon various factors. Furthermore, this assumption of the firm acting indepen-dently, though boundedly rational, may not be substantially unrealistic as it tendsto be part of the explanation for evident investment cycles. Roques et al. (2006)discusses how “in the U.S. in 1999–2000 investors . . . saw nothing but cheapnatural gas prices and started building CCGT plants . . . and led to the financialcollapse of many investors.” Herding occurs in power generation investmentsresulting in cyclical investment patterns as Ford (2001, 2002) demonstrate. Thisis also in line with the study of Bernanke (1983), who explains that when in-vestments are irreversible and the underlying stochastic process is subject to ran-dom changes, investment cycles can emerge.
Apart from deciding upon the timing of the investments, the companyconsiders how the investments are to be financed. The investments can initiallybe financed by using full, part, or no debt capital depending on the asset circum-stances of the company (see Figure 2). Later, the company may decide to pay offsome of its debt until finally the remaining debt is paid off at the end of the lifetime of the plant. The company’s cash position is hence dynamic and depends onthe revenues received, taxes, debt servicing, and depreciation.
The risks of the investment are the outcomes which result in lower cashpositions than if the investment were not made. We assume that the company’sobjective is to maximize the expected net present value of the investment whileacknowledging the credit risks throughout the life time of the power plant. Theinvestment framework therefore consists of the following two modules (i) carbonand electricity price scenario generation and (ii) investment model and risk anal-ysis. The first module generates the uncertain evolution of carbon and electricityprices using a scenario tree. The second module formulates the investment timingdecision as a stochastic optimization problem using the carbon and electricityprice scenario tree. For a particular technology, the model computes the optimaltime to invest, if at all, over all scenarios accounting for the financial risk con-

Investment Propensities under Carbon Policy Uncertainty / 85
Figure 2: A Power Plant Investment and an Example of Asset (dashedline) and Debt Values (solid line)
straints that are applied for the cash positions. Given the various financial param-eters, the model then allows the computation of the expected net present value,conditional cash-flows-at-risk, and the cumulative probabilities of investment ateach of the time intervals.
3. THE MODEL SPECIFICATION
3.1. Carbon and Electricity Price Scenario Generation
Exogenous inputs for the carbon price scenario generation are expectedcarbon price trajectory and the carbon price volatility. We assume that the carbonprice is log-normally distributed and that the carbon price process follows a Mar-kov chain. We model this carbon price uncertainty using a recombining scenariotree. The scenario outcomes for carbon prices and their probabilities are generatedextending the “bracket-mean” method (Smith 1993, Miller and Rice 1983) formultiple periods (for details see Appendix).
In the generation of electricity price scenarios, we take exogenous as-sumptions about fuel prices and the electricity generation profit spread. The profitspread is a much smaller component than fuel in the marginal cost of power andexists when the power market is not perfectly competitive, which is typically thecase, to ensure the recovery of at least long-run marginal costs. The profit spreadappears to persist as a mean reverting process, rather than being a percentage ofthe electricity price, (e.g., Bunn 2004, Hobbs 1986) and based on that, togetherwith the fuel prices ultimately relating to oil, we can take electricity prices, to-gether with carbon, to be exogenous.

86 / The Energy Journal
Figure 3: Electricity Price and Marginal Cost Power Plant Depend onCarbon Price
The wholesale electricity price scenarios are created with the help of fuelprices, the electricity generation profit spread, and carbon prices at the particularpoints in the scenario tree. These power prices are assumed to be set by themarginal generator, which could be gas or coal depending upon the additionalsupplement of carbon at particular points (gas uses about half the carbon allow-ance of coal for the same unit of output), see Figure 3. Hence, the electricity pricevaries depending on the carbon price and the emission amounts of the price settingcoal and gas plants. The emission amounts of the price setting plants can bereduced if CCS technology is retrofitted. We envisage this in experiments withthe fast CCS technology adoption, for example.
3.2. Investment Model and Risk Analysis
The investment model, presented in the Appendix, is formulated as amixed integer stochastic programming problem in which the investor maximizesthe expected net present value (Birge and Louveaux 1997). One of the benefitsof stochastic programming is that the decisions are contingent on all availableinformation at the moment of decision in the specified time period and scenariowithout any foresight on which of the possible future scenarios will occur. Theformulation consists of multiple discrete time stages when the power plant in-vestment decision can be made. Recourse decisions can be taken to adjust thedebt amount and retrofit the CCS. The optimization is conducted over the wholescenario tree concurrently, such that optimal actions are chosen for all powerplant and CCS investment decisions and debt payment decisions. Decision con-

Investment Propensities under Carbon Policy Uncertainty / 87
straints are set for the actions to depend on the actions of the previous time periodsto enforce decision consistency, i.e., if the power plant is built at a specific timeand scenario then this decision remains in all subsequent time periods and sce-narios. We have included financial details in the model by specifying interest anddepreciation tax shield constraints and optimization of debt payments. In theexperiments, we consider also financing constraints that limit the maximumamount of redeemable debt to the cash flow to capture realistic restrictions.
The risk aversion of the investor is considered using the ConditionalCash Flow at Risk (CCFAR) measure, which is an expected cash flow measureconditional on a particular lower fractile of the cash position. It is defined similarlyto the more general Conditional Value at Risk (see e.g., Rockafeller and Uryasev2000, Uryasev 2000). These risk constraints can be set for multiple points in timeconcurrently to manage the cash flow risks throughout the power plant’s life time.This is important as investments in power plants are long-lasting and risk man-agement applied only at the terminal period would overlook the realistic concernsof financial distress during the plant’s life time.
Using the risk constraints we can define a risk-neutral investor as adecision maker who maximizes return in E[NPV] and a risk-averse investor as adecision maker who minimizes the risk exposure, in CCFAR. This is done bysupplementing the objective function with the CCFAR risk objective where–kqthe risk aversion factor if the function characterizes risk-neutral investor�kr0and if it characterizes a risk-averse investor. The possible time inconsis-kr �tency problem of the risk-averse investor (see e.g., Boda and Filar 2006, Gemanand Ohana 2009), we avoid by conducting the optimization using the composedapproach of Cheridito and Stadje (2008), in which the risk minimization problemis solved recursively. Based on the findings of Walls and Dyer (1996), and Howard(1988) risk-neutral and risk-averse investors could characterize the investmentdecision making of large and small power producers, respectively, although wedo not necessarily presume that. What will be more interesting is to use these twocriteria to test the sensitivity of various policies to risk aversion by investors.
Overall, the model, as applied here, is distinct from other approaches byincluding risk aversion using CCFAR measure, including financing constraints,and focusing on investment propensities. In particular, our approach considersthe risk-averse and risk-neutral investment propensities for gas, coal, and nuclearpower plants and compares the emergent effects of carbon price uncertainty, thusextending the work of Yang et al. (2008), Bergerson and Lave (2007), Fleten andNasakkala (2010), Patino-Echeverri et al. (2007) who focus on risk neutral in-vestments in one of these power generation technologies under carbon price un-certainty. Besides including risk aversion using CCFAR measure, our approachadds on the work of Green (2007), Roques et al. (2006, 2008), Reinelt and Keith(2007), Fuss et al. (2009) by analyzing the impact of the existing power plantportfolio on investment decisions and how different policy interventions, such asenforcing caps or floors for carbon prices, CCS for older less efficient fossil fuelpower plants, and free emission allocations for new power plants, impact theinvestment decisions.

88 / The Energy Journal
4. COMPUTATIONAL EXPERIMENTS
The experiments were done with an evaluation horizon consisting oft�0, . . . ,6 time states, such that investment in a power plant was possible in timestates t�0, . . . ,4 (i.e., �4) and for CCS in t�4 (i.e., o t t
td x �0, ∀s � S ,s
). Each of the first 4 time periods were 3 years. The length of thet�0, . . . ,3periods 5 and 6 varied by technology in order to incorporate the full operatinglife in the case where the investment is made at the end of period 4. Recall thatthe focus of this work is not to compare the economic value of different tech-nologies, as in conventional long term capacity planning models, where consid-erable care has to be taken to evaluate alternatives over the same economic ho-rizons, but rather we are seeking to test the decision maker’s propensity to investin a particular technology sooner or later against various behavioral and policyassumptions. In a liberalized market with heterogeneous agents, it is perhaps morerelevant for Governments to understand the effectiveness of investment incentivesupon particular players with their own strategic inclinations, than to envisage anoptimal long-term, least-cost market planning solution. We evaluated CCFAR riskconstraints on time states t�5, 6 which are the mid and terminal states of theinvestment, for the cash flow 5% percentiles i.e., �0.95. We did not considerbrisk constraints in the very beginning, since during the construction and the earlyperiods of operation, investors would still be taking a longer term view on theproject.
The optimization problems were solved with the Dash Optimization soft-ware Xpress� applying branch-and-bound method. The base case assumptionsare represented in Table 1. The formulation presented in equation 6 was linearizedand the equation 5 was adjusted for the different lengths between the time states.The binomial carbon price scenarios were created from log-normal distributions,which expected values are as listed in Table 1 and volatilities are 20%. Thecalibration of the carbon price scenarios is based on industry experts’ estimations,extrapolations for several decades based upon approximately five years of actualcarbon price data is not credible. In published research, carbon prices have beencalibrated using several different approaches (e.g., Green 2007, Roques et al.2008, Szolgayova et al. 2008, Fuss et al. 2009, Roques et al. 2006, Abadie andChamorro 2008, Kemp and Kasim 2008). Our carbon price volatility of 20% isin line with the volatilities used in such studies. For example, Roques et al. (2008)use 25% and Fuss et al. (2009) consider a range between 0–30%. Also, our otherbase case parameters are similar to the ones used in other studies. For example,Roques et al. (2006) report discount rates in power plant investment between 5–12.5% and the construction period for nuclear power plant to be between 5–10years. Blyth et al. (2007) consider the lifetimes of a new coal-fired and gas-firedpower plants to be 40 and 25 years respectively. However, as several of theseparameters depend on the market conditions and power plant type, as for examplewith the CCS retrofitting cost (Kemp and Kasim 2008), we conducted sensitivityanalysis. In the sensitivity analysis, we explore the impacts of applying 50%

Investment Propensities under Carbon Policy Uncertainty / 89
Table 1: Data for the Experiments
Common parameters Values
lt expected carbon prices for period 0, . . . ,4 (£/ton of )CO2 17, 21, 24, 27, 30r opportunity rate of return or return on excess cash (%) 12
dr interest rate on debt (%) 12w tax rate (%) 38y profit spread of electricity price over the marginal production
cost (£/MWh) 5D , . . . ,D1 4 length of time periods 1,2,3,4 (years) 3z effective yearly electricity production capacity (TWh) 7.5
Power plant dependent parameters Gas Coal Nuclear
j construction time (years) 3 3 6l lifetime (years) 30 40 50D ,D5 6 length of time periods 5 and 6 (years) 16, 17 21, 22 28, 28
lt expected carbon prices for periods 5 and 6 (£) 39, 49 41, 53 45, 60
c lump sum investment cost of power plant (millions of £) 300 600 1500oc lump sum investment cost of CCS facility (millions of £) 200 400 —fc fixed operating cost (millions of £/year) 16 24 36vc variable operating cost (£/MWh) 25 12 3
u efficiency multiplier of new plant (%) 90 85 100h increase in variable cost if CCS facility built (%) 50 75 —e CO2 emissions (tons/MWh) 0.35 0.75 0
oe CO2 emission reductions of CCS (tons/MWh) 0.3 0.65 —
Data is estimated from a number of sources, such as Metz et al. (2005), Blyth et al. (2007), andvarious industry experts. Note that the construction times assume that all preliminaries are done, suchas general permission and licensing, construction plans, grid connection agreements, etc. . . .
variations for investment costs of power plants and CCS facilities, variable op-erating costs, and increase in variable costs if CCS facility is built. Also, weconducted a sensitivity analysis using 30% for the carbon price volatility. Thesensitivity analysis supported the robustness of the general comparative insights.
4.1. Specification Relevance
Since an important aspect of our investment model is the incorporationof uncertainties, real options (i.e., delay investment, retrofit CCS, and earlier debtpayments), and financial details (i.e., interest and depreciation tax shield effects),an initial set of experiments were undertaken to calibrate the relevance of thesefeatures against a simple, standard, net present value evaluation. Figure 4 sum-marizes this comparison using the developed optimization model with base casedata and different configurations regarding (i) carbon price evolution (determin-istic vs. stochastic), (ii) investment timing (fixed at t�0 for power plant and t�4for CCS vs. optimization of power plant investment at t�0, 1, 2, 3, 4 and CCSinvestment at t�4), and (iii) financial details (all debt paid immediately, no tax

90 / The Energy JournalF
igur
e4:
Com
pari
son
ofD
iffe
rent
Inve
stm
ent
Mod
els

Investment Propensities under Carbon Policy Uncertainty / 91
3. E[ROCE]� .E[NPV]
t
T 1D �� D i� mdd nm�10 i i ix � (1�r(1�w)) prob [x � k (1�r(1�w)) ]s � � s s � s
i ii�1 s �S n�0
or depreciation vs. optimization of debt payments at t�0, 1, 2, 3, 4, 5, 6 withtax and depreciation).
Remarkably, Figure 4 highlights that all of the power plant investmentswould be dismissed based on a simple NPV or return on capital expenditure
( ) analysis, yet they are all highly profitable when theNPV
ROCE�o 12c�c /(1�r)
three behavioral elements are included. The simple NPV uses deterministic ex-pected carbon prices, assumes that the investment in power plant is made at t�0and for CCS at t�4, investments are paid from cash, and that sub-sequent earningare discounted with opportunity rate pre tax without considering interest anddepreciation tax benefits. For example, the conventional NPV and ROCE of thenuclear power plant investment increase from –£304 million and –20% to £352million and 28% of E[NPV] and E[ROCE]�E[NPV]/(expected discounted cap-ital expenditure)3 respectively when the three behavioral elements are included.Including carbon price uncertainty increases plant’s value as in the low carbonand electricity price scenarios losses are reduced by not operating the power plant.Consequently, the maximum loss is limited to the fixed operating costs of theplant (see equation 6). The value of the investment in E[NPV] terms increasesfurther when the real options and also the financial planning details are includedand optimized concurrently. The incremental effect of including financial plan-ning details is strong as it increased E[NPV] for the nuclear power plant by £261million regardless the overall reduction in profits due to taxation. This increasein E[NPV] is explained primarily (approximately 70%) by the reduced opportu-nity rate of return due to taxation (see equation 4) and secondarily (approximately30%) by the effective use of depreciation and interest tax shield benefits. Theinclusion of financial details, however, reduces E[ROCE]. For nuclear powerplant this reduction is 9%. This is because the opportunity rate of return is reducedby taxation increasing thus the discounted capital expenditures.
Figure 5 shows the investment timing and cumulative investment prob-abilities (i.e., at time t) with and without financial details. As mightprob xt t� s s
t ts � S
be expected, the impacts are greater on the more capital intensive projects, nu-clear, then coal, then gas. The effects are substantial and so any capacity modelingwithout considering the financial planning details would underestimate the pro-pensity to invest in the capital intensive projects. They also suggest that selectivetaxation and depreciation incentives for these technologies could have materialbenefits, if policy were so disposed.
The impacts of including financial details for the investment decisionand profitability are stronger than the authors expected. Most conventional ca-

92 / The Energy JournalF
igur
e5:
Inve
stm
ent
Dec
isio
nin
(a)
Nuc
lear
,(b)
Gas
,and
(c)
Coa
lPow
erP
lant
sw
ith
Fin
anci
alD
etai
ls(s
olid
line)
and
wit
hout
Fin
anci
alD
etai
ls(d
ashe
dlin
e)
(a)
(b)
(c)

Investment Propensities under Carbon Policy Uncertainty / 93
pacity planning models in use by policy makers, to the authors’ awareness, donot include the real options (delaying investment, retrofitting CCS, and earlierdebt payments), financing details (cash vs. debt financed), and accounting con-siderations (depreciation and taxation). Furthermore, earlier work by Bunn et al.(1993) suggested that, in the context of a traditional large scale (non-stochastic)capacity expansion model, financial details are second order effects, but that anal-ysis did not incorporate all of the three elements at the same time, nor, moreimportantly did it focus more precisely upon the propensities to invest. Thus, itseems that all of the three behavioral specification elements beyond simple eco-nomic NPV are important to include simultaneously in a precise analysis of in-vestment inclinations.
4.2. Economic Interventions
The economic policy intervention variations were done from the per-spectives of risk-neutral and risk-averse investors (i.e., large and small playersrespectively). We analyze the effects in terms of encouraging (discouraging) in-vestments, i.e. whether the cumulative investment probabilities are higher (lower)and the “gap” in these probabilities between the risk-neutral and risk-averse mar-ket participants. We propose the following hypotheses:
• H1: Enforcing a floor or cap for the carbon price decreases the gapbetween the investment probability of the risk-neutral and risk-averseinvestors as the volatility in electricity and carbon prices is reduced.(The desirability of closing the gap between the risk-averse and risk-neutral players could be motivated by policy aspirations to encouragesmaller companies and new entrants.)
• H2: Enforcing a floor (cap) on the carbon price encourages (discour-ages) investments in inframarginal technologies as expected revenuesare increased (decreased) because of the pass through of carbon intoelectricity prices. (Capital intensive investors, e.g., nuclear, may arguethat they need a guaranteed level of policy support in order to pro-ceed.)
• H3: Whilst retaining the overall unconditional carbon price expecta-tion, if Governments introduce major carbon policy changes, orshocks, in early time periods, these will discourage the investments ofrisk-averse investors, as risks in terms of volatility are increased, butencourage the investments of risk neutral investors as early shocksprovide more information regarding the conditional expectations ofthe carbon price evolution. (This hypothesis is the converse of a belief,often expressed in industry, that Governments should maintain carbonprice stability by holding back potential market shocks in the socialcost of carbon for longer periods than their emergence would imply.)
• H4: Providing free CO2 emission allowances during the early periodsfor new power plants encourages investments as it increases revenues.

94 / The Energy Journal
Figure 6: Investment Timing
(This was the motivation in Phase 1 of the EU carbon trading, althoughit does open up the criticism of providing excessive windfall profitsto those who emit the most carbon dioxide.)
• H5: Accelerated depreciation for new power plants encourages in-vestments as it increases depreciation tax shield. (Changes in depre-ciation rules can be a tool for Governments to stimulate investmentsin new power plants to secure supply, for example.)
The base case in Figure 8 (a) shows that the risk-averse investor post-pones the investment decision in all technologies as it can thus (i) learn moreabout the expected carbon price and invest selectively in cases where risks arethe smallest and (ii) have the CCS technology available at t�4. The risk-neutralinvestor does not invest either at t�0, as it balances between the benefits ofinvesting early to earn revenues and of postponing to (i) learn and eliminateinvestments in the unprofitable scenarios, (ii) receive higher revenues on latertime periods as the carbon and electricity prices are expected to be higher in thefuture, and (iii) discount the interest payments more heavily (see Figure 6).
From the base case we can observe that risk-averse investors’ investmentpropensities are actually the same for all technologies, since the risk-averse in-vestments are only done in the same high carbon and electricity price scenarioswhen the downside risks are the smallest. More significantly the risk-averse pro-pensities are all very low and substantially below the risk-neutral. Investment ismuch more likely, therefore, in any technology, by the risk-neutral incumbentssuggesting that carbon policy uncertainty leads to market concentration. Withcoal, moreover, both risk-averse and risk-neutral investors prefer to wait for theavailability of the CCS technology.

Investment Propensities under Carbon Policy Uncertainty / 95
Figure 7: Decisions to Retrofit CCS for Coal and Gas Fired Power PlantsGiven Investment is Made
Figure 7 demonstrates for the base case that the propensity to retrofitCCS, given power plant investment decision is taken, is higher for risk-neutralcoal than gas fired power plant investments, being approximately 90% and 25%respectively. This is because coal fired power plants emit more carbon dioxidethan gas fired power plants and can hence benefit more from CCS in high carbonprice scenarios. Also, Figure 7 shows that a risk-averse investor, given powerplant investment is taken, is more likely to adopt CCS than a risk-neutral investor.These results extend the work of Abadie and Chamorro (2008), Patino-Echeverriet al. (2007) by demonstrating that (i) the CCS retrofitting decision depends alsoon the risk aversion besides the planning horizon and carbon price and (ii) coal-fired power producers are more likely to invest in CCS than gas-fired powerproducers.
The effects of floors and caps are demonstrated in Figures 8 (b) and (c)(for summary of the indications on all of the hypothesis see Table 2). With a floorimposed on the carbon price, the propensity of the risk-averse participant to investincreases substantially, and significantly closes the gap with the risk-neutral in-vestor. This is very apparent for the more capital intensive plant. For coal, riskaversion does not make any difference, and for nuclear, there is only an apparentdelay in the first three years. This removal of the corporate discrimination ininvestment may be more interesting for policy than the overall increased propen-sity to invest. In contrast, the opposite effects of the cap are most evident for therisk-neutral coal investor whose investment probabilities are reduced. However,the cap did not postpone the investment decisions of the risk-averse investors.Thus, we extend the results of Nagel and Rammerstorfer (2009) demonstratingthat (i) price cap may not impact the investment behavior of risk averse companies

96 / The Energy JournalF
igur
e8:
Inve
stm
ent
deci
sion
(a)
inba
seca
se,(
b)w
hen
aflo
or(o
nth
ele
velo
fex
pect
edca
rbon
pric
eof
the
tim
est
ate)
isap
plie
d,(c
)w
hen
aca
p(o
nth
ele
velo
fth
eex
pect
edca
rbon
pric
eof
the
tim
est
ate)
isap
plie
d,an
d(d
)w
hen
maj
orpo
licy
chan
ges,
orsh
ocks
,at
t�2,
4ar
ein
clud
ed.T
hegr
aphs
from
left
tori
ght
are
for
nucl
ear,
gas,
and
coal
pow
erpl
ants
whe
reso
lidlin
eis
risk
neut
rala
ndda
shed
line
risk
-ave
rse
inve
stor
(a)
(b)

Investment Propensities under Carbon Policy Uncertainty / 97
(c)
(d)

98 / The Energy Journal
Table 2: Summary of the Hypotheses Validity
Hypotheses Validity
H1: Floor and cap decrease the spread between the investment probability ofthe risk-neutral and risk-averse investors
Confirmed
H2: Floor (cap) encourages (discourages) investments in inframarginaltechnologies
Partially confirmed
H3: Early carbon policy shocks discourage (encourage) the investments of arisk-averse investor (risk-neutral)
Partially refuted
H4: Providing free emission allowances for new plants encouragesinvestments
Partially confirmed
H5: Accelerated depreciation for new power plants encourages investmentsas it increases depreciation tax shield
Partially confirmed
H6: Higher (lower) opportunity rate of return discourages (encourages)investments
Partially confirmed
H7: Higher (lower) debt rate discourages (encourages) investments ConfirmedH8: Existing power plants encourage risk-averse investments ConfirmedH9: Harsher (More relaxed) electricity price competition discourages
(encourages) investmentsPartially confirmed
H10: Faster CCS technology adoption rate discourages investments Partially refutedH11: Faster CCS technology adoption rate decreases spread between the
investment probability of the risk-neutral and risk-averse investorsPartially refuted
H12: Lack (Availability) of CCS technology discourages (encourages) gasand coal power plant investments
Partially confirmed
and (ii) enforcing cap or floor can hence be a useful policy tool in reducing marketconcentration caused by carbon policy uncertainty.
To test the effects of having major policy changes in earlier periods, weinclude large shocks up and down in the carbon price at time states t�2 and t�4.These shocks are modeled symmetrically by including additional scenario branch-ing, such that the probability to jump up and down is 50% and the jump size, ,�is 50% of the expected carbon price at t�2, i.e. �£13.5/ton of CO2. Hence, the�expected carbon price level at t�2 if the jump is up is and if thel �l ��2 u 2
jump is down is . The shifts in the expected carbon prices persist atl �l –�2 d 2
t�3, i.e. if the jump was up at t�2 then and if the jump was downl �l ��3 u 3
at t�2 then . The second shock occurs at t�4 resulting into the fol-l �l –�3 d 3
lowing possible expected carbon prices (jumps up at t�2, 4),l �l �2�4 uu 4
(jump up at t�2 and down at t�4 or jump down at t�2 and upl �l �l4 ud 4 du 4
at t�4), and (jumps down at t�2, 4). We assumed these shifts inl �l –2�4 dd 4
the expected carbon prices persisted at time states t�5, 6 resulting in four timesmore scenarios in these time periods compared to base case. Consequently, theexpected carbon prices at all time states remained the same as in the base casebut the volatility was increased. This is similar to the mean-preserving increasein uncertainty as in the study of Bernanke (1983) in which he shows that anincrease in uncertainty increases the option value and decreases the investmentpropensity due to the possibility of unfavorable outcomes.

Investment Propensities under Carbon Policy Uncertainty / 99
As Figure 8 (d) shows the hypothesis 3 regarding the shocks is partiallyrefuted. The increase in volatility encourages risk-neutral investments, which con-tradicts also the result of Bernanke (1983) that an increase in uncertainty decreasesthe investment propensity. The reason is that the shocks occur during the earlyperiods when the investor can learn from them and make more profitable invest-ments. This is particularly the case in the gas and coal power plant investmentsas investors have better knowledge whether to build the CCS facility. The earlyshocks increased the E[NPV] of risk-neutral investor by 12%, 23%, and 36% fornuclear, coal, and gas plants respectively, which is due to an increase in the optionvalue as Bernanke (1983) states. The shocks also increased the propensities forthe risk-averse investor. This seems to suggest, that it is not in the interests ofGovernments to “hold back” carbon price shocks from the trading mechanism, ifthey are beginning to emerge in the scientific awareness and geopolitical processesof global climate change mitigation. Hence, we extend the research of Yang etal. (2008), who model a single carbon price shock and demonstrate that it causesdelays in investment decisions, by modeling several shocks and showing thatshocks do not have to cause delays if they are passed to market early on whenthey can inform investment decisions. Also, we provide new insights to the resultsof Fuss et al. (2009) by showing that longer periods of stability are not necessarilydesirable particularly in the early phases when the additional information canguide the power producers’ investment decisions.
The “free allowances” hypothesis 4 was partially confirmed in an ex-periment in which emission contracts equivalent of the emissions of a gas plantwere provided for free during the first 4 time states if a power plant was built.This was an effective instrument to encourage risk-neutral investors as all of theinvestments would be made at t�0 with 100% investment probability. Thispolicy had no effects on the risk-averse power plant investments because theacquired windfall profits would occur only in the first 12 years, which after thesame risks exist as without this policy. Experiments with a policy in which “freeallowances” were provided for longer periods showed that also risk-averse in-vestments were encouraged and gap between the risk-neutral and risk-averse in-vestment propensities got narrower. Thus, providing “free allowances” for shortterm may lead into a more concentrated market structure by encouraging only theinvestments of bigger players, to the extent that they are the less risk-aversecompanies. On the other hand, providing “free allowances” for a longer termeffectively reduces the carbon price uncertainty and can mitigate the tendency formore concentrated market structure due to carbon policy uncertainties.
We partially confirmed the hypothesis 5 regarding accelerated depreci-ation rules. By allowing power plants and CCS to be depreciated in half of theirlifetimes, both risk-neutral and risk averse investments were made at t�0 with100% probability. But experiments with less generous depreciation policies dem-onstrated that only risk-neutral investments were encouraged. Thus, policies al-lowing little acceleration in depreciation may lead into a more concentrated mar-ket structure.

100 / The Energy Journal
4.3. Financial and Resource Differentiation
Here we analyze how different financial situations, the availability ofalternative opportunities, and an existing portfolio of power plants affect the pro-pensity to invest. We propose the following hypotheses:
• H6: Higher (lower) opportunity rate of return discourages (encour-ages) investments as the hurdle rate to invest is higher (lower).
• H7: Higher (lower) debt rate discourages (encourages) investments asthe investments become less (more) profitable.
• H8: Existing power plants encourage the investments of a risk-averseinvestor as the investment can be used to hedge risks.
In the investigation of the financial differentiation of the companies, werelax the assumption of having perfectly efficient capitalization and financing,where . We consider that a financially stronger company may be able todr �rborrow money with a lower debt rate than another even though the opportunityrate of return may still be the same for both. Also, we consider that companiesmay have different opportunity rates of return due to different company specificprojects (e.g., construction permits for certain locations, proprietary technologies,supply or demand contracts, available skills) for what the companies can invest.The opportunity rate of return may be marked up for smaller companies because(i) the cost if company comes under financial stress can be higher and (ii) a closelyheld smaller company may not be able to diversify and reduce risks resulting thatowners require higher return. Furthermore, the opportunity rate of return may bemarked up due to the management agency problem as the managers’ income andcareer depend on the firm’s success. By varying the debt rate and the opportunityrate of return it is possible to characterize a financially stronger and highly cap-italized incumbent or a financially weaker and strongly leveraged independentpower producer.
Figure 9 (a) is consistent with the hypothesis 6 in terms of increasedinvestment probabilities following from a lower cost of capital. It also demon-strates that risk-averse investor may invest before the risk-neutral investor in thegas and coal power plants. This is because risk-neutral investor is willing to takemore risk in the tradeoff of a higher E[NPV] as the future carbon and electricityprices are expected to be higher. Note, also that as , the fi-dr�5%�r �12%nancing of the project is optimal using cash rather than debt. If r�5% and cashfinancing is not available and the maximum amount of redeemable debt is limitedto the cash proceedings of the investment, the investments of both investors areencouraged but the effects are not as strong as if full cash financing is available.Experiments with r�20% confirmed partially the hypothesis 6. The investmentsof the risk neutral investor were discouraged as expected, but the investmentpropensities of the risk-averse investor remained the same as in the base case.
Clearly, higher debt rate discourages investments, as suggested by hy-pothesis 7. Figure 9 (b) shows a financially troubled company, , wheredr �20%

Investment Propensities under Carbon Policy Uncertainty / 101
investment was not permitted to be cash financed and the maximum amount ofredeemable debt was limited to the cash proceedings of the investment. If cashfinancing were possible and the investments would be fully cash fi-dr �20%nanced and identical to the base case. Lower debt rate, , confirmed hy-dr �5%pothesis 7.
Hypothesis 8 was tested by examining how the investment behavior ofa risk-averse power producer with three existing power plants differs from a risk-averse new entrant. The existing power plant portfolio consisted either of 3 nu-clear power plants, 3 coal power plants, 3 gas power plants, or 1 power plant ofeach type. Existing power plants were assumed to be of older generation, whichefficiency multiplier u�100. In particular, our approach differs from the onepresented by e.g., Green (2007), Roques et al. (2006, 2008) because we do nottry to model what would be the optimal power plant portfolio when built fromthe scratch but instead consider how different portfolios of existing power plantsimpact a specific new power plant investment. As Figure 9 (c) illustrates, hy-pothesis 8 holds. This suggests that the investment propensity of a risk-aversepower producer is encouraged by the existing power plants highlighting the im-portance of including existing power plant portfolio in the optimization model.
In particular, Figure 9 (c) shows that the investment in gas or coal powerplant is encouraged most if the existing portfolio consists of nuclear power plants.The explanation is that nuclear and fossil fuel power plants are a mutual hedgeas also identified by Green (2007). In low carbon price scenarios a fossil fuelpower plant is the more profitable while in high carbon price scenarios it is thenuclear power plant. The reduction in the risk due to hedging are 8%, 18%, and23% when investments are made for nuclear, coal, and gas plants respectively inthe presence of 3 existing coal power plants. If an investment is considered for anuclear power plant then an existing portfolio of nuclear power plant encouragesthe investment most. This occurs because the expected return can be increasedwhile risks remain at the same level. The risks remain at the same level becausethey are generated by the existing nuclear power plants in low carbon and elec-tricity price scenarios, in which the investment in the new nuclear power plant isnot made. What is particularly significant in Figure 9 (c) is that the encouragingeffects for new investments appear to be quite selective, and mainly relate to coaland nuclear interactions. This adds to the research of Roques et al. (2006) dem-onstrating that a nuclear power plant investment is significantly more favorablewhen the existing power plants and risk aversion are considered. Figure 9 (c) alsodemonstrates that an existing, fully diversified portfolio of three different plantsis not substantially advantageous, compared to none, for any investment, nor isa portfolio of three gas plants. This suggests a path dependency in the investmentpropensity depending also on the existing asset base adding hence to the researchof Carraro and Hourcade (1998) who investigate the impacts of climate policyon technical changes. We also experimented with the changes in investment strat-egies of the risk-neutral investor in the presence of an existing portfolio. Asexpected, without any risk aversion, the portfolio benefits were immaterial. Note,

102 / The Energy JournalF
igur
e9:
Inve
stm
ent
deci
sion
whe
nco
mpa
nyha
s(a
)a
low
erop
port
unit
yra
teof
retu
rnr�
0,05
and
(b)
ahi
gher
debt
rate
,and
(c)
anex
isti
ngpo
rtfo
lioof
pow
erpl
ants
.The
grap
hsfr
omle
ftto
righ
tar
efo
rnu
clea
r,ga
s,an
dd r�
0.2
coal
pow
erpl
ants
whe
reso
lidlin
eis
risk
-neu
tral
and
dash
edlin
eri
sk-a
vers
ein
vest
or
(a)
(b)

Investment Propensities under Carbon Policy Uncertainty / 103
(c)

104 / The Energy Journal
that we have not included potential benefits for firms to construct power plantsof same type due to existing knowledge and experience. These existing conditionswould encourage investments in power plants of same type.
The behavioral differentiation of the companies in the market may alsostem from the different structural aspects related to the (i) profitability of theelectricity generating sector, (ii) adoption rate of the CCS technology, and (iii)availability of the CCS technology. We provide the following hypotheses:
• H9: Harsher (More relaxed) electricity price competition discourages(encourages) investments as the revenues are reduced (increased).
• H10: Faster CCS technology adoption rate discourages investments asthe revenues are reduced due to lower electricity prices.
• H11: Faster CCS technology adoption rate decreases spread betweenthe investment probability of the risk-neutral and risk-averse investorsas the volatility of the electricity is reduced.
• H12: Lack (Availability) of the CCS technology discourages (encour-ages) gas and coal power plant investments as CCS cannot be used tohedge against high carbon prices.
The effects of lower competition in the electricity sector with a higherprofit spread partially confirmed hypothesis 9. Figure 10 (a) shows that both risk-averse and risk-neutral investments are encouraged when the profit spread isy�£10/MWh. However, experiments with a smaller increase in profit spread dem-onstrated that only risk-neutral investments were encouraged. We experimentedalso with profit spreads less than £5/MWh and the results were consistent withhypothesis 9.
Faster adoption of the CCS technology was tested by including the CCSfacility in the older, less efficient, and hence more carbon intensive marginalproduction cost plants at time state t�5, 6 (i.e., in the equation 3), which couldoccur due to regulatory requirements, for example. This resulted in decreasedelectricity prices at high carbon price scenarios due to the reduction in the emis-sions but increased the electricity prices at low carbon price scenarios with theoeadditional variable costs of the CCS facility h. These effects are asymmetric andthe reductions outweigh the increases, reducing the expected electricity prices.As a result, the E[NPV]s of the risk-neutral investors were reduced by 25%, 30%,and 40% for nuclear, coal, and gas power plants respectively. Surprisingly, all theinvestments except risk-averse investments in nuclear power plant are encouragedand the hypothesis 10 is partially refuted (see Figure 10 (b)). The explanation forthe increase in the investment probability is that the reduction in the volatility ofthe electricity price allows investors to make better investment decisions. Par-ticularly, this is the case for coal and gas power plants because they can makebetter informed investment decision regarding the retrofitting of the CCS. Forreduced probability of risk-averse investment in nuclear power plant the reasonis that in high carbon price scenarios, when nuclear power plant is the most

Investment Propensities under Carbon Policy Uncertainty / 105
profitable and least risky, the reduction in electricity prices increases risks. Forthe same reason the gap between the cumulative investment probabilities of therisk-averse and risk-neutral nuclear power plant investments are further awayfrom each other and hence hypothesis 11 is partially refuted. In particular, theseresults add to the study of Otto and Reilly (2008) by demonstrating that policies,such as R&D or CCS adoption subsidies, to encourage a wide adoption of theCCS technology would discourage risk-averse investments in inframarginal non-carbon emitting technologies, such as nuclear, hydro, or wind.
As suggested by hypothesis 12, investment in the coal power plant with-out an opportunity to retrofit the CCS facility is discouraged and the investmentprobability is reduced to 0% (see Figure 10 (c)). The investment probability ofthe gas power plant, on the other hand, is not affected, although the E[NPV] isreduced, e.g., risk-neutral investor loses 25% of its E[NPV]. The reason is thatin the higher carbon price scenarios, in which CCS would have been built, existingcoal power plants are the marginal cost producers resulting in profits for the gasplants regardless of the availability of the CCS technology. Hence, the CCS fa-cility is not as crucial for the gas plants in short term as it is for the coal powerplants. However, the lack of the CCS technology could eventually force coalpower plants out of operation after which gas plants would be the marginal costplants and their profitability would then be eroded.
5. CONCLUSIONS
Overall, our analysis indicates that carbon policy uncertainty may leadto a more concentrated and less competitive market structure, which, althoughintuitive, has not, to our knowledge, been shown formally. This tendency forconcentration occurs because larger financially stronger incumbent players, whichare typically less risk averse and can borrow money with a lower debt rate thansmaller independent power producers, are more likely to make investments innew power plants under the increased risks of carbon policy uncertainty. Thetendency to more concentrated power market is reinforced by the higher invest-ment propensities of incumbent power producers with existing power plants com-pared to new entrants without existing plants. Thus, carbon price uncertainty isan entry barrier for new entrants. Other possible entry barriers, which are out ofthe scope of this study, include market power of incumbents to (i) temporarilyreduce electricity prices, (ii) build overcapacity, (iii) increase the volatility ofelectricity prices, and (iv) integrate vertically.
The tendency to further concentration due to carbon policy uncertaintycan be reduced by selective government support mechanisms. Thus, for gas andcoal fired power producers this could be through supporting early CCS adoption(but for nuclear power producers our study shows the opposite effect). Althoughnot explicitly modeled, it is clear that similarly selective support for renewablewind and solar in parts of the EU (e.g., Germany and Spain) has encouragedmarket entry. We identify that policies to support caps and floors in the carbon
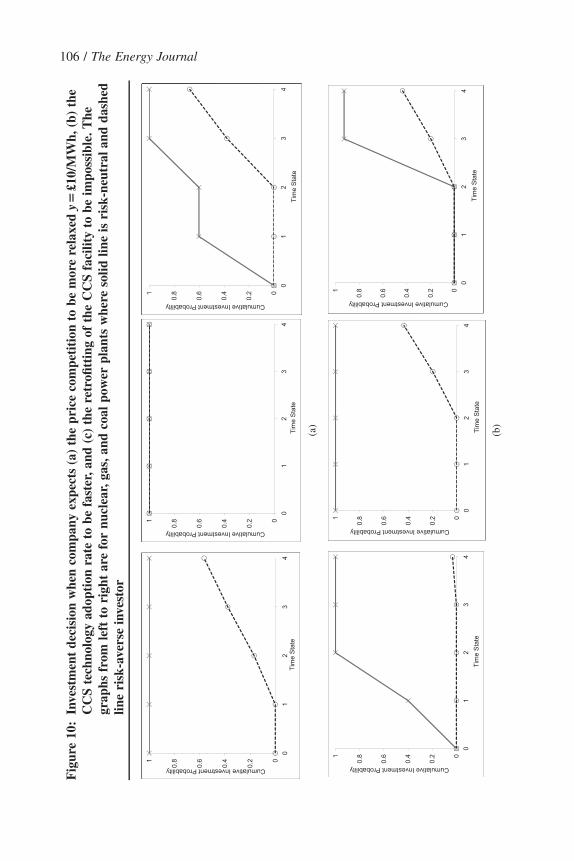
106 / The Energy JournalF
igur
e10
:In
vest
men
tde
cisi
onw
hen
com
pany
expe
cts
(a)
the
pric
eco
mpe
titi
onto
bem
ore
rela
xed
y�£1
0/M
Wh,
(b)
the
CC
Ste
chno
logy
adop
tion
rate
tobe
fast
er,a
nd(c
)th
ere
trofi
ttin
gof
the
CC
Sfa
cilit
yto
beim
poss
ible
.The
grap
hsfr
omle
ftto
righ
tar
efo
rnu
clea
r,ga
s,an
dco
alpo
wer
plan
tsw
here
solid
line
isri
sk-n
eutr
alan
dda
shed
line
risk
-ave
rse
inve
stor
(a)
(b)

Investment Propensities under Carbon Policy Uncertainty / 107
(c)

108 / The Energy Journal
price and the early transmission of carbon shocks to the market can help to reducethis tendency to further concentration. The latter is particularly interesting in thatmany market participants, generally the large incumbents, have lobbied for longerperiods of carbon price stability to encourage investment. Evidently longer periodof artificial stability will only delay larger shocks if governments then have tocatch up with global trend in the cost of carbon mitigation. Also, we show thatpolicies that allow more profitable power markets, such as (i) accelerated depre-ciation, (ii) tolerance of higher profitability in power spreads, and (iii) providing“free allowances,” can on the one hand lead into a more concentrated powermarket if they marginally increase profitability and on the other hand can reducemarket concentration if they significantly increase profitability.
This study demonstrates that existing power plant portfolios are impor-tant in the analysis of the risk-averse investor in ways that can be quite subtle. Asimple broad diversity, as is often advocated, or a fleet of gas fired power plants,as seems to be emerging, do not appear to encourage risk-averse investments, butspecific synergies, such as nuclear and coal or even the scale effect of nuclearand nuclear, can be very effective in promoting new investments under carbonprice uncertainty. Given heterogeneous market players the effects of governmentincentives therefore have path dependent aspects depending upon the resourcebased characteristics of the market participants.
Our results show that real options, uncertainties, and financial details,such as debt and depreciation tax shields and optimization of debt payments, arecrucial in the investment analysis when the capital costs are high and the decisionsare irreversible, and the debt and opportunity rate are not necessarily the same.The more detailed analysis can reveal substantial differences compared to thebasic economic net present value evaluation in terms of the value of the invest-ment and the optimal investment propensity and timing. Government technologysupport policies will not, therefore, be properly targeted unless these details arecorrectly modeled, but they could be very effective.
The experiments shed light on some surprising aspects. First, a risk-averse investor may, under certain circumstances, invest before a risk-neutral one,even though the overall cumulative investment probability is lower. This canoccur, for example, if the opportunity rate of return is low. Second, early carbonpolicy shocks can encourage risk averse investments regardless of the increase involatility. Third, earlier adoption of the CCS technology may encourage gas, coal,and risk-neutral nuclear investments in spite of the reduction in expected revenuesdue to lower electricity prices. Fourth, if the retrofitting of the CCS facility tocoal and gas fired power plants proved to be infeasible, investment propensitiesin gas fired power plants are not impacted in the short-term despite the lowerexpected revenues.
Taking the approach of focusing upon the individual propensities to in-vest, rather than seeking to analyze market level equilibrium, can evidently pro-vide complementary insights into the evolution of industrial organization and theformulation of public policy. Whilst the type of model specified here can become
Investment Propensities under Carbon Policy Uncertainty / 109
much more complicated, one of the interesting aspects is that within the class oflarge scale optimization models for the electricity sector, where there has beenenormous research in the past 40 years, the approach taken here deliberatelyavoids seeking to model the full system of generators in a collective long termoptimizing way. Rather it focuses upon the effects of incentives on different kindsof players in the market. This seems to be quite relevant in age of liberalizedmarkets, without centralized capacity planning, captive retail markets and obli-gations to serve, but it does leave open many aspects of incompleteness, notablystrategic inclinations such as first-mover investments, investment signaling, for-ward contracting, changes in firms’ power technology preferences, and verticalintegration. It also leaves open the endogenous aggregate effects if many agentsin the market follow the same incentives. Modeling capacity investment in com-petitive markets for prescriptive purposes is clearly elusive, as strategic behaviorhas many drivers, and in a global context even more. Analysis of a particularmarket might suggest positive economic investment, but if the agents are mainlyinternational companies, even better opportunities could exist elsewhere. Reflect-ing upon all of these aspects of corporate investment behavior, therefore, clearlysuggests that modeling such decision-making in this context has to be very fo-cused on developing insights into particular issues and their relative propensities.
APPENDIX. INVESTMENT MODEL
Carbon Price Scenarios
We represent the uncertain evolution of the carbon price over a finitetime horizon t�0, . . . ,T using a recombining binomial scenario tree. Each sce-nario st at time t is a row vector with t elements. The moves in the scenario treeare given by the vector element that is 1 if the price increases, and 0 if the pricetsi
decreases in the scenario tree in period i�1, . . . ,t. The set of all scenarios at timet is defined as St and it consists of 2t scenarios
t t tS �{s ⎪s �{0,1}, i�1, . . . , t, t�0, . . . ,T}.i
The unique immediate predecessor of scenario st � St (t�0) is b(st)�st–1 � St–1
such that scenario st–1 is the t–1 subvector of st, in other words if st�[u1 u2 u3
. . . ut] then b(st)�[u1 u2 u3 . . . ut–1], also b2(st)�b(b(st)) and so on (for similarscenario notation see e.g., Kettunen et al. (2010)). The backward operator b(st)is essential in the model formulation as it, together with the equation (10), en-forces the decision consistency, which ensures that a decision remains the sameover all consecutive sub-scenarios. In technical terms, this imposes the non-anticipativity principle of stochastic programming, i.e., the decision is taken with-out knowing in advance which of the possible outcomes will be realized.
We define
F�1(m) [0,1]r�� inverse cumulative log-normal probabilitydistribution,
fbin(n,t,0.5) {n�0,...,T}r [0,1] binomial probability distribution,

110 / The Energy Journal
Figure 11: An example of price scenario generation from log-normalCO2
distribution when �17, �21, �24, ,l l l r �0.2*l r �0.2*l0 1 2 1 1 2 2
lt ��� the expected carbon prices at time state t�0,...,T asseen at time zero,
���etcs cost of an emission contract to emit one ton of CO2 at
scenario st � St,� [0,1]tprobs probability of occurrence of scenario st � St, and
qt � [0,1] probability of increase in carbon price at time statet�0,...,T�1.
The carbon price outcomes at each time state t�0,...,T are generatedfrom the log-normal distribution using the “bracket-mean” method (Smith 1993,Miller and Rice 1983). We let in each time state t�0,...,T to be brackets n�0,...,tand derive the probability masses of these brackets from the binomial distributionfbin(n,t,0.5). The associated carbon prices in the mid points of these bracketsmtn,t�0,...,T, n�0,...,t are obtained from inverse log-normal cumulative prob-ability distribution F�1(mtn). The binomial path dependent carbon price scenariosare obtained by connecting the mid points mtn,t�0,...,T�1, n�0,...,t to midpoints m(t�1)(n) (i.e., decrease in price) and m(t�1)(n�1) (i.e., increase in price), asdemonstrated in Figure 11. The probabilities of increase in carbon prices qt attime states t�0,...,T are solved recursively to match the expected carbon priceslt using equations (1) and (2). The probabilities of decrease in carbon prices attime states t�0,...,T are 1�qt.

Investment Propensities under Carbon Policy Uncertainty / 111
et tprob c �l (1)� s s t
t ts �S
tt ts 1 s�j jtprob � ∏ q (1�q ) . (2)s jj
j�1
Electricity Price Scenarios
We introduce the following notation to derive the electricity prices:
I�{g,c} set of price setting plants (g�gas, c�coal),���tps electricity price/MWh, st � St,
y��� profit spread of electricity price over the marginalproduction cost per MWh,
ei ���, i � I tons of CO2 emission/MWh, andcvi ���, i � I variable cost of power plant/MWh capacity.
The electricity price is, ∀ t�1,...,Tt ts �S
e i vit tp �y�max c e �c . (3)s s� �
i� I
Optimization Model for Power Plant Investment
We define (suppressing, for clarity, the superscript i for technology type)
�{0,1}txs decision to build power plant at time state t, st � St,�{0,1}o
txs decision to build CCS facility at time state t,st �St,
���dtxs decision to pay the specified amount debt back at
time state, t, st � St,Xt set of all company’s decisions up to time state t,D time in years between time states t�0,...,T,
���tvs annual revenue from power generation, st �St,j�Z� construction time of a power plant in years,cf ��� yearly fixed operating cost of power plant,cv ��� variable operating cost of power plant/MWh
capacity,h��� percentage increase in variable cost if CCS built,z��� energy production capacity in MWh/year,u� [0,1] efficiency multiplier of the new plants (compared
to the variable costs of existing plant of the sametechnology in the market),
e��� tons of CO2 emission/MWh of the plant,

112 / The Energy Journal
eo ��� reduction in emission in tons of CO2/MWh whenCCS is constructed,
���tds one year depreciation of power plant, st �St,���o
tds one year depreciation of CCS, st �St,l�Z� lifetime of a power plant in years (including
construction time),���tks one year interest payments, st � St,
rd ��� interest rate on debt,c��� lump sum investment cost of power plant,co ��� lump sum investment cost of CCS facility,
���tas cash position, st �St,a0 ��� initial amount of available cash,r��� opportunity rate of return,w� [0,1] company’s tax rate,d� [0,....,T] final time state when investments can be made,b� [0,1] probability of non-tail event in CCFAR
computation,����, ���tcs auxiliary variables, andq�� risk tolerance measured in CCFAR.
The overall optimization problem is
T Tprob a� s sT Ts �S 0max �a (4)
TT (1�r (1�w))X
subject to cash position constraints, t t∀s �S
d0ta �x t�0s
dDt ta (1�r (1�w)) �x �b(s ) sta � (5)s
1D�� o it t t t[(v �k )(1�w)�(d �d )w](1�r (1�w)) t�0� s s s s
i�0
in which received revenue, interest payment, and depreciation of the investmentare, t t∀s �S , t�1,...,T
te o o o v f�t i t t t t tv �1 (x )D�j z[p �c (e�x e )�(1�x h)uc ] �c (6)s � � b (s ) s s b(s ) b(s )� �� �Z
i�1
t
o o d dt t t i tk � x c�x c � x r (7)s b(s ) b(s ) � b (s )� �
i�1
ct td �x (8)s b(s ) l

Investment Propensities under Carbon Policy Uncertainty / 113
oco ot td �x (9)s b(s ) t
oi t i tl� [x �x ]D� b (s ) b (s )
i�1
decision constraints, t t∀s �S
t tx �xs b(s ) 0� t �d (10)o ot tx �xs b(s ) 0� t �d (11)
t tx �xs b(s ) t�d (12)ot tx �xs s t� 0 (13)
td o dot t t i tx �x c�x c � xs s s � b (s )
i�1
t� 0 (14)
To do
T T i t0�x c�x c � xs s � b (s )i�1
t�T (15)
risk constraints
1tq��� c� s
t t1�b s �S
(16)
0 tt t t tc �prob (a (1�r(1�w)) �a ��) and c �0.s s s s (17)
and integrality constraints, ∀st �St, t�0,...,T
ot tx , x �{0,1}.s s (18)
Equation (4) maximizes the expected net present value (E[NPV]) of theinvestment. Equation (5) balances the cash flows, ensuring that the cash positionequals cash inflows and outflows during the years between the time states.Equation (6) represents the revenues. The multiplication by the indicator functionensures that the revenues are obtained only if the power plant is constructed.Note, that (i) the minimum revenues of the power plant is limited to the fixedoperating costs of the power plant as it is not operated if variable operating costsare greater than the obtained revenue from the sale of electricity and (ii) theinvested plants are of newer generation than the current ones on operation (whichset the market price) and therefore gain the inframarginal profit benefit throughthe efficiency multiplier u. Equation (7) keeps track of the interest payments onthe outstanding principal. Equations (8) and (9) provide the depreciation amountfor the power plant and the CCS facility by applying a straight-line depreciation

114 / The Energy Journal
method. Equations (10) and (11) ensure that once an investment decision is madeit remains. Equation (12) restricts the investment window when the investmentcan be done. Equation (13) constrains that investment in a CCS facility can betaken only if the investment in the power plant is done. Equations (14) and (15)ensure that more debt can not be paid back than is initially taken and that it hasto be paid back at some point during the investment horizon. Finally, equations(16)–(17) provide CCFAR risk constraints, which are formulated analogously toCVAR constraints (Rockafeller and Uryasev 2000, Uryasev 2000).
By replacing equation (14) with the projectt
d o o dt t t i tx �x c�x c � xs s s � b (s )
i�1
can be forced to be cash financed. Debt financing can be forced by adding anadditional constraint . It is straightforward to show with thesed
tx �0, t�Ts
definitions and the investment equations that if the debt and the opportunity rateof returns are the same, rd�r, the financing structure of the investment does notinfluence the E[NPV].
ACKNOWLEDGMENTS
We are grateful to the Economic and Social Research Council, DEFRA andBERR in the UK for support in this research. This research has also benefittedfrom the feedback of the judges of the “Dennis J. O’Brien United States Asso-ciation for Energy Economics Best Student Paper Competition” in which anearlier version of this work was one of the four finalists in 2008.
REFERENCES
Abadie, L. M. and J. M. Chamorro (2008). “European CO2 prices and carbon capture investments.”Energy Economics 30 (6): 2992–3015.
Bergerson, J. A. and L. B. Lave (2007). “Baseload coal investment decisions under uncertain carbonlegislation.” Environmental Science & Technology 41 (10): 3431–3436.
Bernanke, B. S. (1983). “Irreversibility, uncertainty, and cyclical investment.” The Quarterly Journalof Economics 98 (1): 85–106.
BERR (2008). EU emission trading scheme. Available at www.berr.gov.uk/energy/environment/euets.Birge, J. R. and F. Louveaux (1997). “Introduction to Stochastic Programming.” New York: Springer.Birge, J. R. and C. H. Rose (1995). “Modeling investment uncertainty in the costs of global CO2
emission policy.” European Journal of Operational Research 83 (3): 466–488.Bloom, J. A. (1982). “Long-range generation planning using decomposition and probabilistic simu-
lation.” IEEE Transactions on Power Apparatus and Systems 101 (4): 797–802.Blyth, W., R. Bradley, D. Bunn, C. Clarke, T. Wilson, and M. Yang (2007). “Investment risks under
uncertain climate change policy.” Energy Policy 35 (11): 5766–5773.Boda, K. and J. A. Filar (2006). “Time consistent dynamic risk measures.” Mathematical Methods of
Operations Research 1 (63): 1432–2994.Bunn, D., E. R. Larsen, and K. Vlahos (1993). “Complementary modelling approaches for analyzing
several effects of privatization on electricity investment.” Journal of Operational Research Society44 (10): 957–971.
Bunn, D. W. (2004). “Modelling Prices in Competitive Electricity Markets.” Wiley: London.Caramanis, M. (1982). “Investment decisions and long-term planning under electricity spot pricing.”

Investment Propensities under Carbon Policy Uncertainty / 115
IEEE Transactions on Power Apparatus and Systems 101 (12): 4640–4648.Carraro, C. and J. C. Hourcade (1998). “Climate modelling and policy strategies. The role of technical
change and uncertainty.” Energy Economics 20 (5–6): 463–471.Cheridito, P. and M. Stadje (2008). “Time-inconsistency of VaR and time-consistent alternatives.”
Finance Research Letters 6 (1): 40–46.Copeland, T. and V. Antikarov (2003). ”Real Options: A Practitioner’s Guide.” Texere: New York.Crooks, E. (2009). “EDF calls for support for nuclear industry.” Financial Times: 25.5.2009.Denton, M., A. Palmer, A. Masiello, and P. Skantze (2003). “Managing market risk in energy.” IEEE
Transactions on Power Systems 18: 494–502.Dixit, A. K. and R. S. Pindyck (1994). “Investment under Uncertainty.” Princeton University Press:
Princeton.Ellerman, D., P. L. Joskow, R. Schmalensee, J.-P. Montero, and E. M. Bailey (2000). “Markets for
Clean Air: The US Acid Rain Program.” Cambridge University Press: New York.European Commission (2008). “20 20 by 2020: Europe’s climate change opportunity.” COM(2008)30
Final, Communication from the Commission, Brussels 23.1.2008 . Available at www.energy.eu/directives/com2008 0030en01.pdf.
Fezzi, C. and D. W. Bunn (2008). “A vector error correction model of the interactions among gas,electricity and carbon prices.” In F. Gulli (Ed.), Markets for carbon and power pricing in EuropeTheoretical Issues and Empirical Analyses: pp. 145–159. Edward Elgar, Cheltenham.
Fleten, S.-E. and E. Nasakkala (2010). “Gas-fired power plants: Investment timing, operating flexi-bility and CO2 capture.” Energy Economics. Forthcoming.
Ford, A. (2001). “Waiting for the boom: A simulation study of power plant construction in California.”Energy Policy 29 (11): 847–869.
Ford, A. (2002). “Boom and bust in power plant construction: Lessons from the California electricitymarket.” Journal of Industry, Competition and Trade 2 (1–2): 59–74.
Froot, K. A., D. S. Scharfstein, and J. C. Stein (1993). “Risk management: Coordinating corporateinvestment and financing policies.” The Journal of Finance 48 (5): 1629–1658.
Fuss, S., D. J. A. Johansson, J. Szolgayova, and M. Obersteiner (2009). “Impact of climate policyuncertainty on the adoption of electricity generating technologies.” Energy Policy 37 (2): 733–743.
Geman, H. and S. Ohana (2009). “Time-consistency in managing a commodity portfolio: A dynamicrisk measure approach.” Journal of Banking & Finance 32 (10): 1991–2005.
Green, R. (2007). “Carbon tax or carbon permits: The impact on generators’ risks.” Available atftp://ftp.bham.ac.uk/pub/RePEc/pdf/RGreen.pdf.
Gribben, R. (2008). “Shell warns Europe on CO2 permits.” Daily Telegraph: 10.4.2008.Gross, R., W. Blyth, and P. Heptonstall (2010). “Risks, revenues and investment in electricity gen-
eration: Why policy needs to look beyond costs.” Energy Economics. Forthcoming.Grubb, M., L. Butler, and P. Twomey (2006). “Diversity and security in UK electricity generation:
The influence of low-carbon objectives.” Energy Policy 34 (18): 4050–4062.Hempstead, J., I. Sambandam, I. Chan, and R. Wobbrock (2007). “Storm clouds gathering on the
horizon for the north American electric utility sector.” Moody’s Report 103941. Available atwww.Moodys.com.
Hobbs, B. F. (1986). “Network models of spatial oligopoly with an application to deregulation ofelectricity generation.” Operations Research 34 (3): 395–409.
Howard, R. A. (1988). “Decision analysis: Practise and promise.” Management Science 34 (6): 679–695.
Huchzermeier, A. and C. H. Loch (2001). “Project management under risk: Using the real optionsapproach to evaluate flexibility in R&D.” Management Science 47 (1): 85–101.
Keeney, R. L., J. F. Lathrop, and A. Sicherman (1986). “An analysis of Baltimore gas and electriccompany’s technology choice.” Operations Research 34 (1): 18–39.
Kemp, A. G. and A. S. Kasim (2008). “A least-cost optimisation model of co2 capture applied tomajor UK power plants within the EU-ETS framework.” The Energy Journal 29 (Special Issue):99–134.
116 / The Energy Journal
Kettunen, J., A. Salo, and D. Bunn (2010). “Optimization of electricity retailer’s contract portfoliosubject to risk preferences.” IEEE Transactions on Power Systems. 25 (1): 117–128.
Labatt, S. and R. White (2007). “Carbon Finance: The Financial Implications of Climate Change.”Wiley: Hoboken.
LaGattuta, D., J. C. Stein, M. L. Tennican, S. E. Usher, and J. Youngen (2001). “Cashflow-at-riskand financial policy for electricity companies in the new world order.” The Electricity Journal 13(10): 15–20.
Meier, H., N. Christofides, and G. Salkin (2001). “Capital budgeting under uncertainty—an integratedapproach using contingent claims analysis and integer programming.” Operations Research 49 (2):196–206.
Metz, B., O. Davidson, H. Coninck, M. Loos, and L. Meyer (2005). “Carbon dioxide captureand storage.” IPCC special report. Working Group III of the Intergovernmental Panel onClimate Change, Available from http://arch.rivm.nl/env/int/ipcc/pages media/SRCCS-final/SRCCSWholeReport.pdf.
Milborrow, D. (2008). “Electricity generation costs: Little to choose between the options?” PowerUK 173: 6–8.
Miller, A. C. and T. R. Rice (1983). “Discrete approximations of probability distributions.” Manage-ment Science 29 (3): 352–362.
Minton, B. A. and C. Schrand (1999). “The impact of cash flow volatility on discretionary investmentand the costs of debt and equity financing.” Journal of Financial Economics 54 (3): 423–460.
Mittendorf, B. (2004). “Information revelation, incentives, and the value of a real option.” Manage-ment Science 50 (12): 1638–1645.
Murphy, F. H. and Y. Smeers (2005). “Generation capacity expansion in imperfectly competitiverestructured electricity markets.” Operations Research 53 (4): 646–661.
Nagel, T. and M. Rammerstorfer (2009). “Modeling investment behavior under price cap regulation.”Central European Journal of Operations Research 17 (2): 111–129.
Otto, V. M. . and J. Reilly (2008). “Directed technical change and the adoption of CO2 abatementtechnology: The case of CO2 capture and storage.” Energy Economics 30 (6): 2879–2898.
Reedman, L., P. Graham, and P. Coombes (2006). “Using a real-options approach to model technologyadoption under carbon price uncertainty: An application to the Australian electricity generationsector.” Economic Record 82 (S1): 64–73.
Reinelt, P. S. and D. W. Keith (2007). “Carbon capture retrofits and the cost of regulatory uncertainty.”The Energy Journal 28 (4): 101–127.
Rockafeller, R. T. and S. Uryasev (2000). “Optimization of conditional value-at-risk.” The Journalof Risk 2 (3): 21–41.
Roques, F. A., D. M. Newbery, and W. J. Nuttall (2008). “Fuel mix diversification incentives inliberalized electricity markets: A mean-variance portfolio theory approach.” Energy Economics 30(4): 1831–1849.
Roques, F. A., W. J. Nuttall, D. M. Newbery, R. D. Neufville, and S. Connors (2006). “Nuclear power:a hedge against uncertain gas and carbon prices.” The Energy Journal 27 (4): 1–23.
Rothwell, G. (2006). “A real options approach to evaluating new nuclear power plants.” The EnergyJournal 27 (1): 37–53.
Santiago, L. and P. Vakili (2005). “On the value of flexibility in R&D projects.” Management Science51 (8): 1206–1218.
Schumacher, K. and R. D. Sands (2006). “Innovative energy technologies and climate policy inGermany.” Energy Policy 34 (18): 3929–3941.
Sen, S., L. Yu, and T-Genc (2006). “A stochastic programming approach to power portfolio optimi-zation.” Operations Research 54 (1): 55–72.
Smith, J. E. (1993). “Moment methods for decision analysis.” Management Science 39 (3): 340–358.Smith, J. E. and K. F. Mccardle (1998). “Valuing oil properties: Integrating option pricing and decision
analysis approaches.” Operations Research 46 (2): 198–217.Smith, J. E. and R. F. Nau (1995). “Valuing risky projects: Option pricing theory and decision anal-

Investment Propensities under Carbon Policy Uncertainty / 117
ysis.” Management Science 41 (5): 795–816.Szolgayova, J., S. Fuss, and M. Obersteiner (2008). “Assessing the effects of CO2 price caps on
electricity investments—A real options analysis.” Energy Policy 36 (10): 3974–3981.Patino-Echeverri, D., B. Morel, J. Apt, and C. Chen (2007). “Should a coal-fired power plant be
replaced or retrofitted?” Environmental Science & Technology 41 (23): 7980–7986.Thompson, D. and T. Quinlan (2010). “Drax: Half year results six months ended 30 june 2010.”
Available at www.draxgroup.plc.uk/.Tseng, C. L. and G. Barz (2002). “Short-term generation asset valuation: A real options approach.”
Operations Research 50 (2): 297–310.Uryasev, S. (2000). “Introduction to the theory of probabilistic functions and percentiles (value-at-
risk).” In S. Uryasev (Ed.), Probabilistic Constrained Optimization: Methodology and Applications:pp. 1–25. Kluwer Academic Publishers.
Walls, M. R. and J. S. Dyer (1996). “Risk propensity and firm performance: A study of the petroleumexploration industry.” Management Science 42 (7): 1004–1021.
Yang, M., W. Blyth, R. Bradley, D. Bunn, C. Clarke, and T. Wilson (2008). “Evaluating the powerinvestment options with uncertainty in climate policy.” Energy Economics 30 (4): 1933–1950.

118 / The Energy Journal