
Investment Insights from CI Investment Consulting Yoonjai Shin, CFA Director, CI Investment...
19
Investment Insights from CI Investment Consulting Yoonjai Shin, CFA Director, CI Investment Consulting
-
Upload
randolph-poole -
Category
Documents
-
view
219 -
download
1
Transcript of Investment Insights from CI Investment Consulting Yoonjai Shin, CFA Director, CI Investment...

Investment Insights fromCI Investment Consulting
Yoonjai Shin, CFADirector, CI Investment Consulting
2
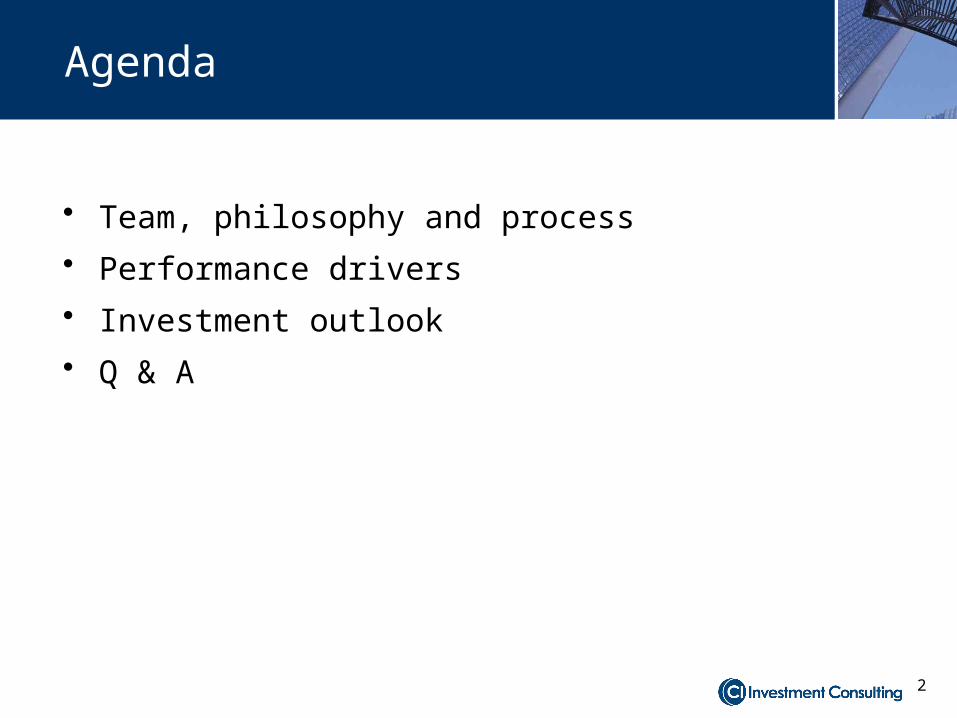
Agenda
• Team, philosophy and process
• Performance drivers
• Investment outlook
• Q & A
3
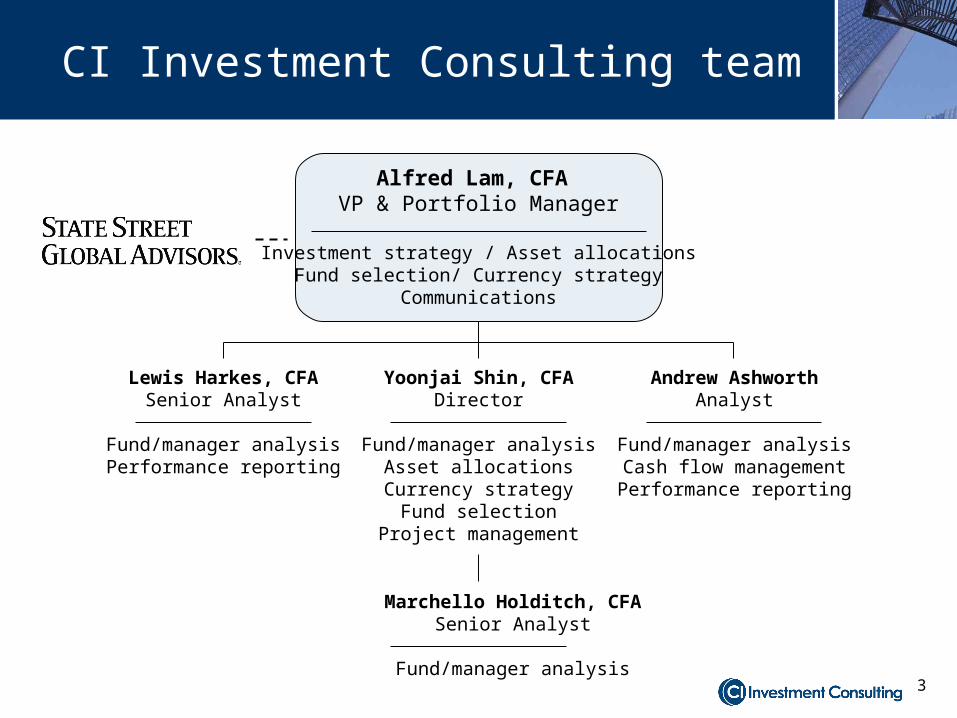
Yoonjai Shin, CFADirector
Fund/manager analysisAsset allocationsCurrency strategy
Fund selectionProject management
Andrew AshworthAnalyst
Fund/manager analysisCash flow managementPerformance reporting
Lewis Harkes, CFASenior Analyst
Fund/manager analysisPerformance reporting
Alfred Lam, CFA VP & Portfolio Manager
Investment strategy / Asset allocationsFund selection/ Currency strategy
Communications
Marchello Holditch, CFASenior Analyst
Fund/manager analysis
CI Investment Consulting team

4
Total return = Asset mix + Alpha + Market beta + Currency – Tax – Fees
Optimize
Maximize Manage
Manage/
reduce Minimize
Reduce
Total return equation

6
Attribution analysis of Evolution models
Please refer to the next page for full performance history
Multiple sources of added value
80i20e 70i30e 60i40e 50i50e 40i60e 30i70e 20i80e 100e
Total Return (net MER) Total Return 7.6% 10.2% 13.4% 15.8% 19.2% 22.1% 25.1% 31.2%Blended Index (net MER)* Market Return (Beta) 1.8% 4.3% 6.9% 9.4% 12.0% 14.6% 17.1% 22.3%Added Value Active Management 5.8% 5.9% 6.5% 6.3% 7.2% 7.6% 7.9% 8.9%
Asset mix 4.1% 3.9% 4.0% 3.0% 3.1% 2.7% 2.3% 1.9%Currency (Total) -0.1% -0.1% -0.2% -0.2% -0.2% -0.3% -0.3% -0.3%
Currency model -0.6% -0.7% -0.9% -1.1% -1.3% -1.5% -1.6% -1.8%Currency tactics 0.5% 0.6% 0.8% 0.9% 1.0% 1.2% 1.3% 1.5%
Security Selection 1.8% 2.2% 2.6% 3.6% 4.4% 5.1% 5.9% 7.3%*Blended benchmark is a blended performance of the DEX Universe Bond Index for the income portion and a blend of 50% S&P/TSX Composite Index and 50% MSCI World Index C$ for the equity portion; the same MER charged to our portfolio was deducted from the index performance.

7
Performance of Evolution models
Standard models represent mix of pools and mutual funds recommended by CI Investment Consulting.Returns are net of fees.
As of September 30, 2013 3m 6m YTD 1y 2y 3y 5yEvolution 100i 0.7 -0.8 0.7 2.2 4.6 3.6 5.2Evolution 80i20e 1.2 0.9 4.5 6.5 7.3 5.2 5.4Evolution 70i30e 1.6 1.9 6.3 8.6 8.6 5.9 5.6Evolution 60i40e 2.1 3.0 8.4 11.1 10.2 6.6 5.8Evolution 50i50e 2.6 3.8 10.0 13.2 11.7 7.3 6.1Evolution 40i60e 3.2 5.1 12.3 15.8 13.5 8.3 6.5Evolution 30i70e 3.7 6.0 14.2 18.0 15.0 8.9 6.7Evolution 20i80e 4.1 7.1 16.1 20.3 16.5 9.5 6.8Evolution 100e 5.1 9.2 19.9 24.6 18.8 10.6 7.2
As of December 31, 2013 3m 6m YTD 1y 2y 3y 5yEvolution 100i 1.8 2.4 2.5 2.5 4.4 4.4 5.3Evolution 80i20e 3.0 4.2 7.6 7.6 7.5 5.7 6.9Evolution 70i30e 3.7 5.4 10.2 10.2 9.2 6.3 7.5Evolution 60i40e 4.6 6.8 13.4 13.4 11.0 7.1 8.0Evolution 50i50e 5.3 8.0 15.8 15.8 12.7 7.7 8.9Evolution 40i60e 6.2 9.5 19.2 19.2 14.7 8.6 10.1Evolution 30i70e 7.0 10.9 22.1 22.1 16.5 9.2 10.8Evolution 20i80e 7.7 12.1 25.1 25.1 18.2 9.9 11.4Evolution 100e 9.4 15.0 31.2 31.2 21.3 11.0 12.5
Multiple sources of added value
8
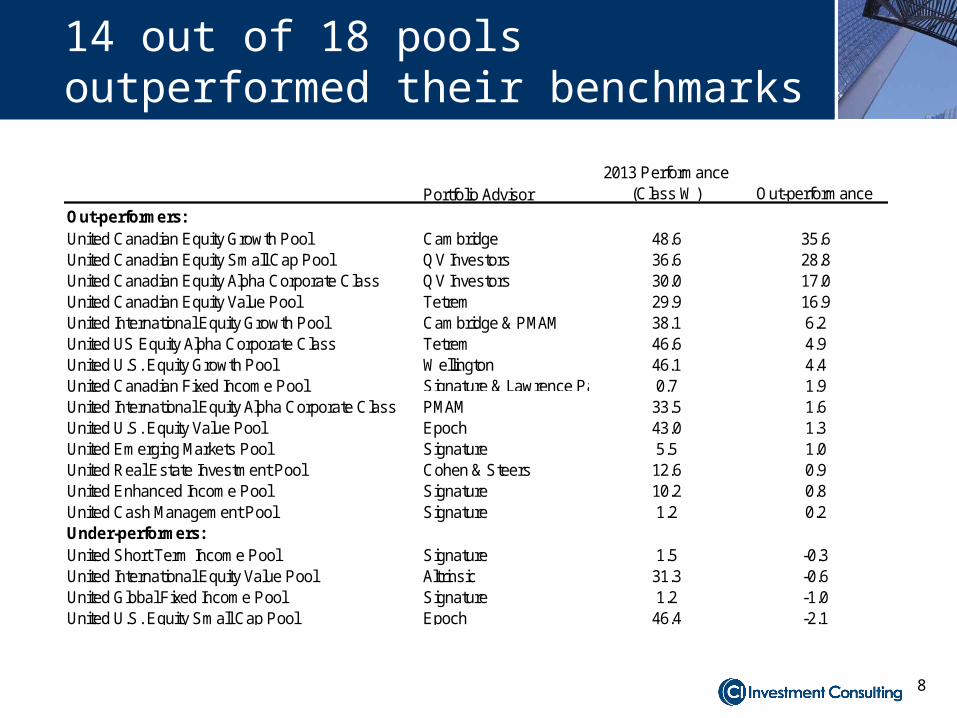
14 out of 18 pools outperformed their benchmarks
Portfolio Advisor2013 Performance
(Class W) Out-performance
Out-performers:United Canadian Equity Growth Pool Cambridge 48.6 35.6United Canadian Equity Small Cap Pool QV Investors 36.6 28.8United Canadian Equity Alpha Corporate Class QV Investors 30.0 17.0United Canadian Equity Value Pool Tetrem 29.9 16.9United International Equity Growth Pool Cambridge & PMAM 38.1 6.2United US Equity Alpha Corporate Class Tetrem 46.6 4.9United U.S. Equity Growth Pool Wellington 46.1 4.4United Canadian Fixed Income Pool Signature & Lawrence Park 0.7 1.9United International Equity Alpha Corporate Class PMAM 33.5 1.6United U.S. Equity Value Pool Epoch 43.0 1.3United Emerging Markets Pool Signature 5.5 1.0United Real Estate Investment Pool Cohen & Steers 12.6 0.9United Enhanced Income Pool Signature 10.2 0.8United Cash Management Pool Signature 1.2 0.2Under-performers:United Short Term Income Pool Signature 1.5 -0.3United International Equity Value Pool Altrinsic 31.3 -0.6United Global Fixed Income Pool Signature 1.2 -1.0United U.S. Equity Small Cap Pool Epoch 46.4 -2.1
9
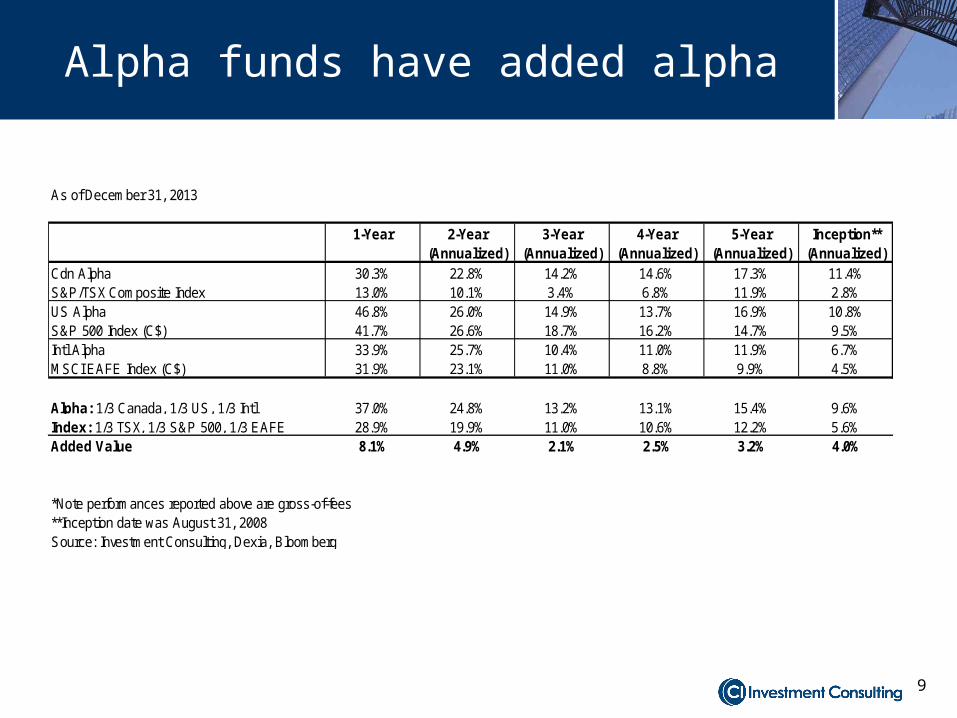
Alpha funds have added alpha
As of December 31, 2013
1-Year 2-Year 3-Year 4-Year 5-Year Inception**(Annualized) (Annualized) (Annualized) (Annualized) (Annualized)
Cdn Alpha 30.3% 22.8% 14.2% 14.6% 17.3% 11.4%S&P/TSX Composite Index 13.0% 10.1% 3.4% 6.8% 11.9% 2.8%US Alpha 46.8% 26.0% 14.9% 13.7% 16.9% 10.8%S&P 500 Index (C$) 41.7% 26.6% 18.7% 16.2% 14.7% 9.5%Intl Alpha 33.9% 25.7% 10.4% 11.0% 11.9% 6.7%MSCI EAFE Index (C$) 31.9% 23.1% 11.0% 8.8% 9.9% 4.5%
Alpha: 1/3 Canada, 1/3 US, 1/3 Intl 37.0% 24.8% 13.2% 13.1% 15.4% 9.6%Index: 1/3 TSX, 1/3 S&P 500, 1/3 EAFE 28.9% 19.9% 11.0% 10.6% 12.2% 5.6%Added Value 8.1% 4.9% 2.1% 2.5% 3.2% 4.0%
*Note performances reported above are gross-of-fees**Inception date was August 31, 2008Source: Investment Consulting, Dexia, Bloomberg

10
Canadian dollar (US$)
0.70
0.80
0.90
1.00
1.10
Jan-08 Jan-09 Jan-10 Jan-11 Jan-12 Jan-13
Dynamic hedging introduced
12% cumulative return$120 million added value
50% hedged
30% hedged
10% hedged
70% hedged
30% hedged
Source: Bloomberg, CI Investments
Currency management also sets us apart

11
Portfolio Series - Best Fund of Funds Award - 2011
Portfolio Series - Best Fund of Funds Award - 2012
Portfolio Series Income Fund - Best Global Fixed Income Balanced Award - 2012
Portfolio Series Income Fund - Best Global Fixed Income Balanced Award - 2013
Portfolio Select Series - Best Fund of Funds Award - 2013
Industry recognition

12
Sound and proven philosophy
Solid track record
Industry recognition
Strong net flows
To sum it up…
13For illustration purposes only; there is no guarantee on results
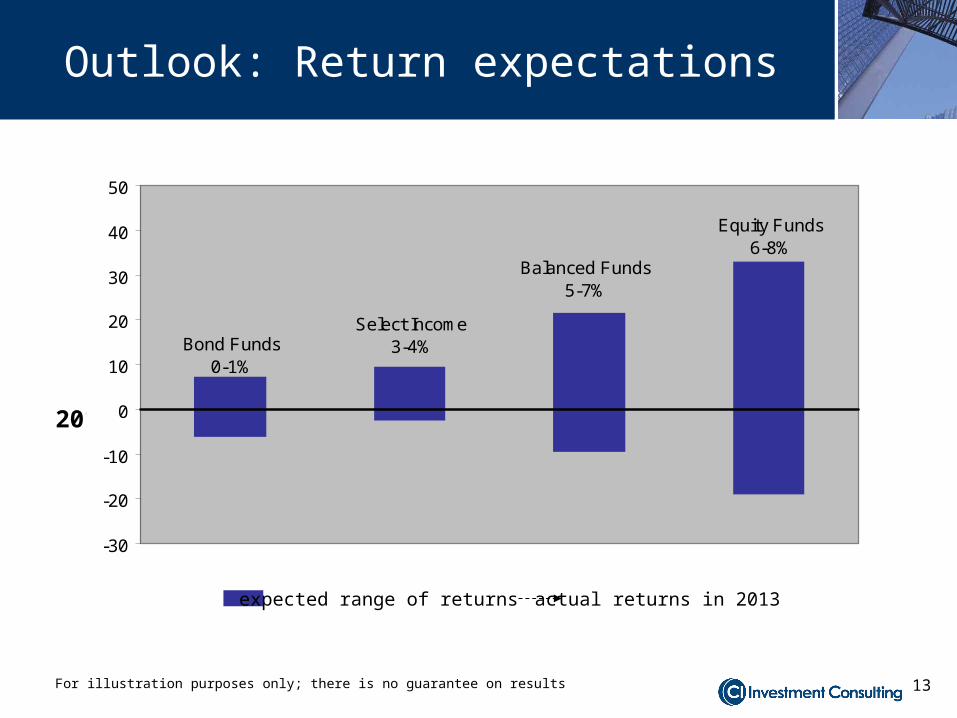
Outlook: Return expectations
Equity Funds 6-8%
Balanced Funds 5-7%
Select Income 3-4%Bond Funds
0-1%
-30
-20
-10
0
10
20
30
40
50
2013
expected range of returns actual returns in 2013
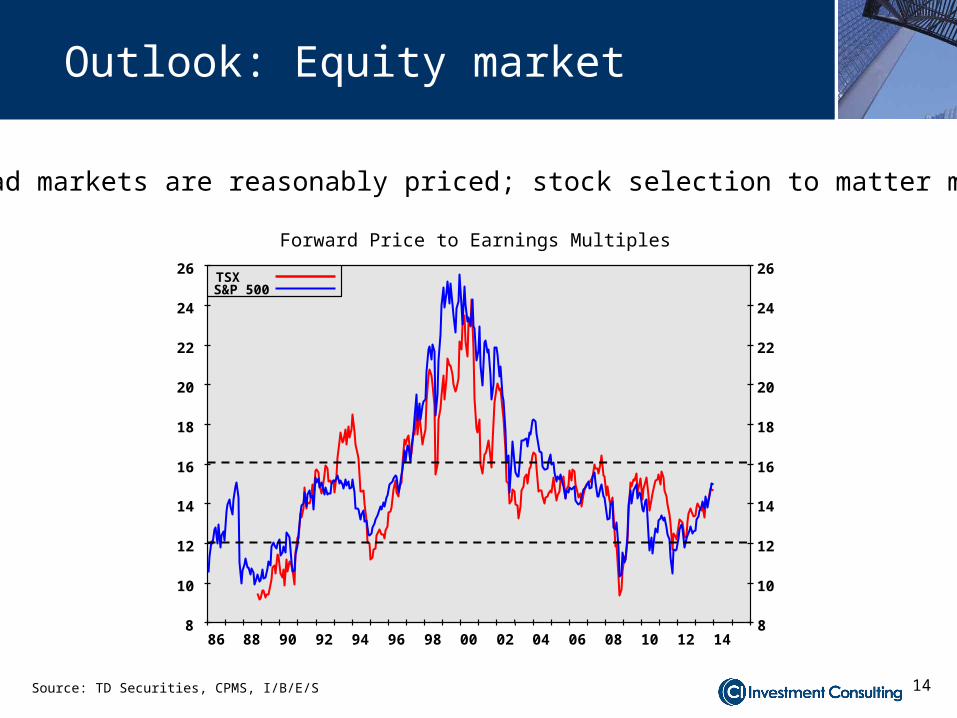
14Source: TD Securities, CPMS, I/B/E/S
Outlook: Equity market
26 26
24 24
22 22
20 20
18 18
16 16
14 14
12 12
10 10
8 886 88 90 92 94 96 98 00 02 04 06 08 10 12 14
TSXS&P 500
Forward Price to Earnings Multiples
Broad markets are reasonably priced; stock selection to matter more
15
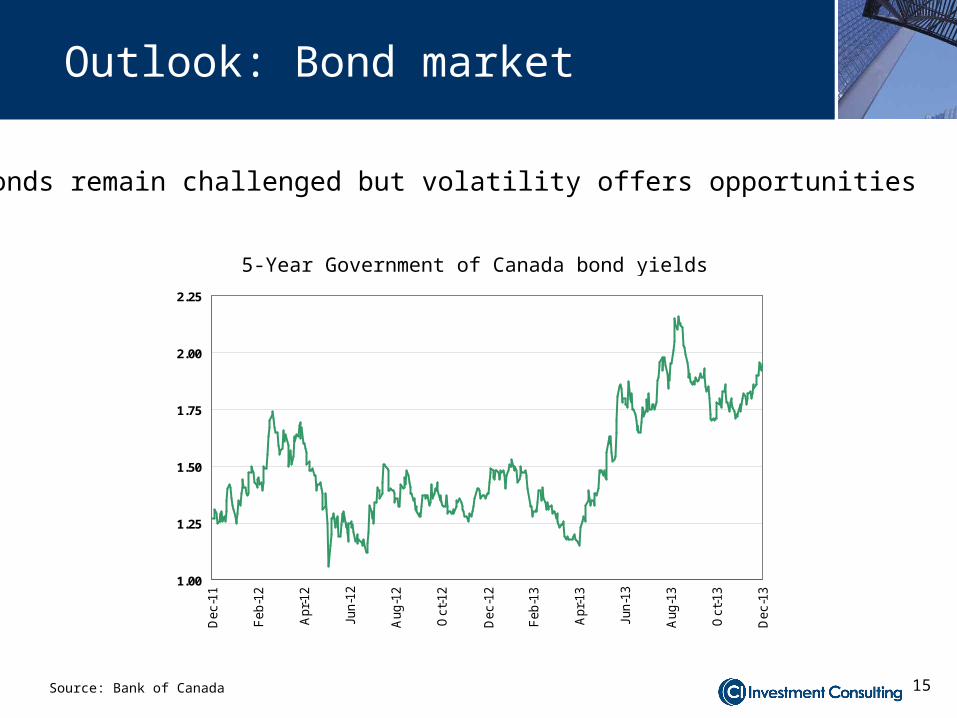
5-Year Government of Canada bond yields
Source: Bank of Canada
Bonds remain challenged but volatility offers opportunities
Outlook: Bond market
1.00
1.25
1.50
1.75
2.00
2.25
Dec-1
1
Feb-1
2
Apr-
12
Jun-1
2
Aug-1
2
Oct-
12
Dec-1
2
Feb-1
3
Apr-
13
Jun-1
3
Aug-1
3
Oct-
13
Dec-1
3
16
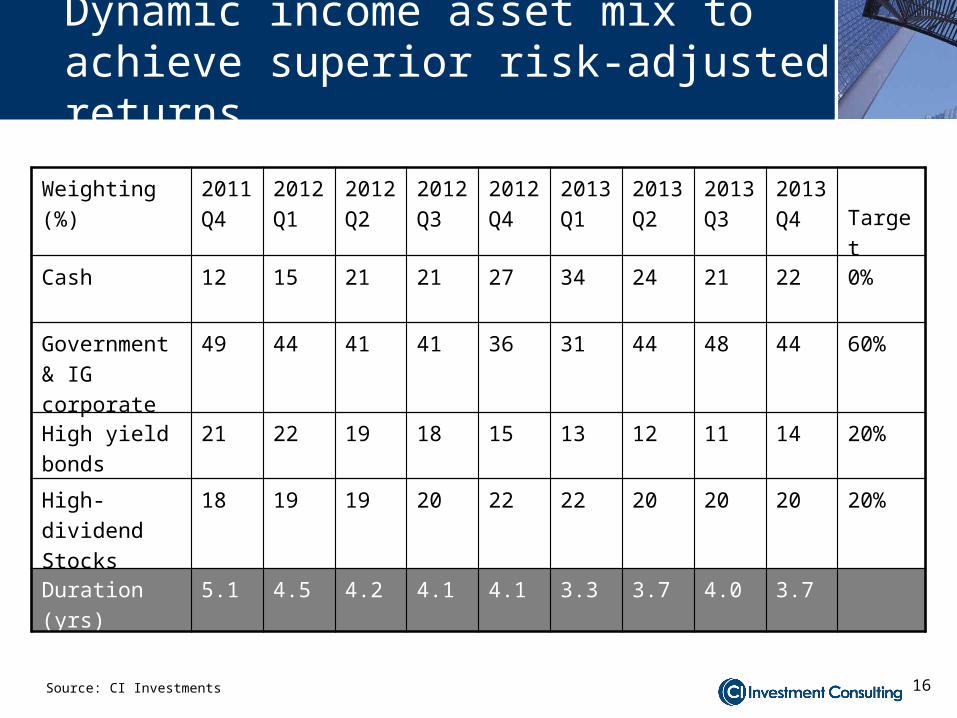
Represented by Select Income Managed Corporate Class
Source: CI Investments
Weighting (%) 2011Q4
2012Q1
2012Q2
2012Q3
2012Q4
2013Q1
2013Q2
2013Q3
2013Q4 Target
Cash 12 15 21 21 27 34 24 21 22 0%
Government & IG corporate
49 44 41 41 36 31 44 48 44 60%
High yield bonds
21 22 19 18 15 13 12 11 14 20%
High-dividend Stocks
18 19 19 20 22 22 20 20 20 20%
Duration (yrs) 5.1 4.5 4.2 4.1 4.1 3.3 3.7 4.0 3.7
Dynamic income asset mix to achieve superior risk-adjusted returns
17
FOR INTERNAL USE ONLY
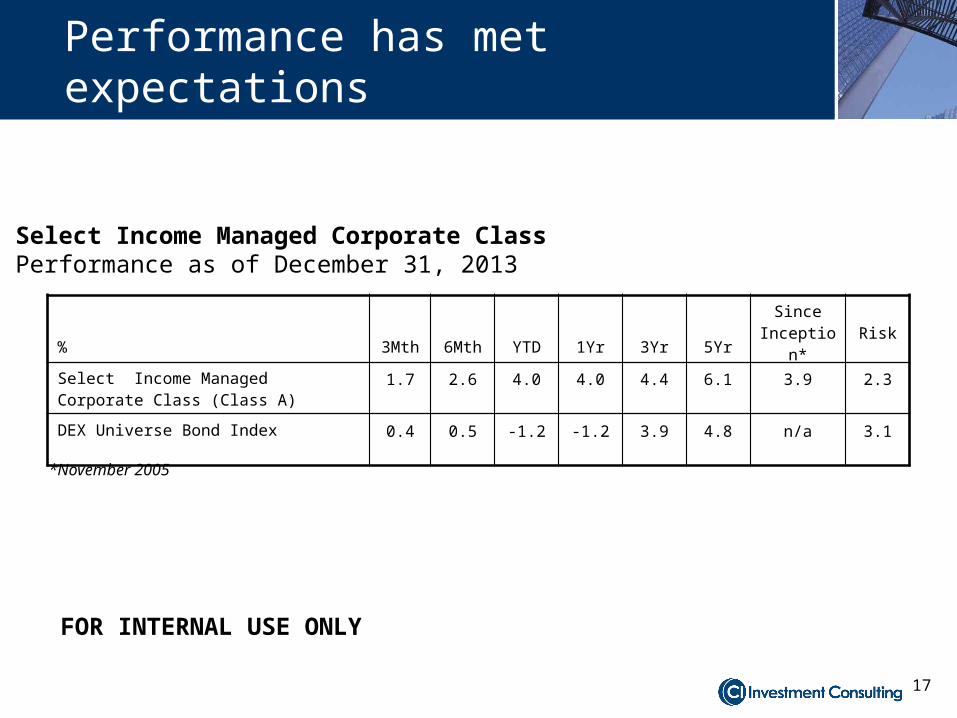
Select Income Managed Corporate ClassPerformance as of December 31, 2013
% 3Mth 6Mth YTD 1Yr 3Yr 5YrSince
Inception* Risk
Select Income Managed Corporate Class (Class A)
1.7 2.6 4.0 4.0 4.4 6.1 3.9 2.3
DEX Universe Bond Index 0.4 0.5 -1.2 -1.2 3.9 4.8 n/a 3.1
*November 2005
Performance has met expectations
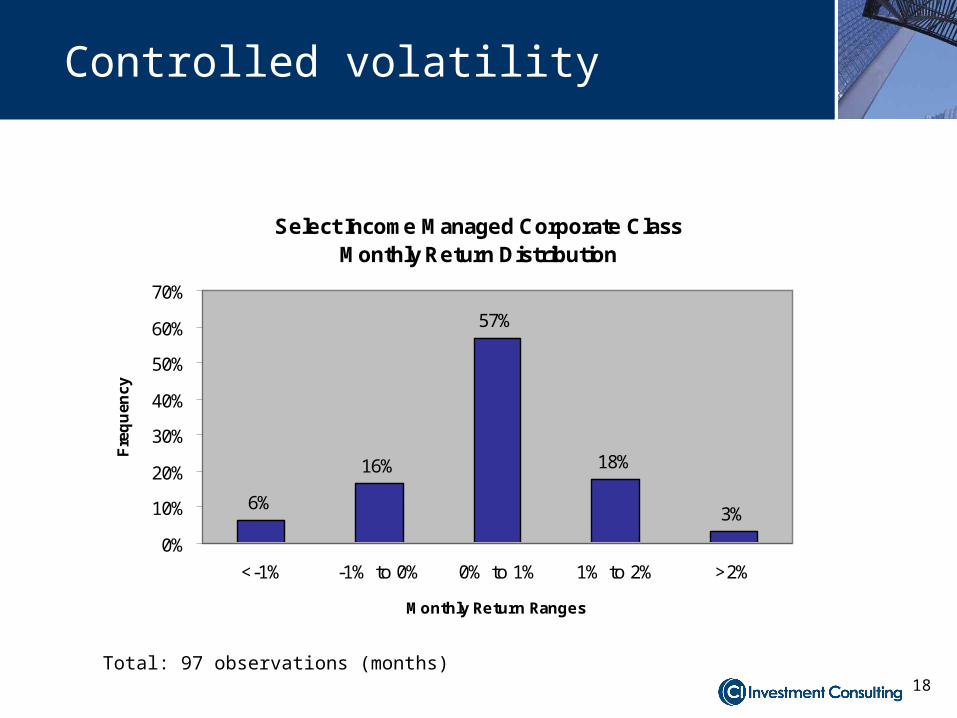
18Total: 97 observations (months)
Select Income Managed Corporate ClassMonthly Return Distribution
6%
16%
57%
18%
3%
0%
10%
20%
30%
40%
50%
60%
70%
<-1% -1% to 0% 0% to 1% 1% to 2% >2%
Monthly Return Ranges
Fre
qu
ency
Controlled volatility

19
Thank you®CI Investments and the CI Investments design are registered trademarks of CI Investments Inc. This communication is published by CI. Any commentaries and information contained in this communication are provided as a general source of information and should not be considered personal investment advice. Every effort has been made to ensure that the material contained herein is accurate at the time of publication. However, CI cannot guarantee its accuracy or completeness and accepts no responsibility for any loss arising from any use of or reliance on the information contained herein. Facts and data provided by CI and other sources are believed to be reliable when posted. CI cannot guarantee that they are accurate or complete or that they will be current at all times. Information in this presentation is not intended to provide legal, accounting, investment or tax advice, and should not be relied upon in that regard. CI and its affiliates will not be responsible in any manner for direct, indirect, special or consequential damages howsoever caused, arising out of the use of this presentation. You may not modify, copy, reproduce, publish, upload, post, transmit, distribute, or commercially exploit in any way any content included in this presentation. You may download this presentation for your activities as a financial advisor provided you keep intact all copyright and other proprietary notices. Unauthorized downloading, re-transmission, storage in any medium, copying, redistribution, or republication for any purpose is strictly prohibited without the written permission of CI.
For advisor use only
Thank you.