Investment Banking I Industry Spotlight - 53.com · PDF fileFifth Third is a leading provider...
20
Investment Banking I Industry Spotlight Healthcare I Q3 2017
Transcript of Investment Banking I Industry Spotlight - 53.com · PDF fileFifth Third is a leading provider...

1
Investment Banking I Industry Spotlight
Healthcare I Q3 2017

2
Healthcare I Industry Spotlight
Q3 2017
August 2017
$800,000,000 Senior Unsecured
Notes
Co-Manager
July 2017
$215,000,000 Senior Secured Credit
Facility
Co-Doc Agent
Michael Burr M&A – Group Head Managing Director
Fifth Third is a leading provider of Corporate and Investment Banking Advisory Services to the
Healthcare Industry, with over $9 billion in bank capital deployed to the U.S. Healthcare Market and
M&A professionals having completed over 75 sell-side and capital raising transactions for middle market
companies, representing $5 billion in value. Our diversified client base spans all healthcare sectors,
markets and geographies and is comprised of 500+ healthcare businesses.
Contacts
Rob Schipper IB – Group Head
Managing Director [email protected]
Bill Priester Head of Large Corporate [email protected]
Casey Jones Head of Middle Market
Representative Transactions
Bill Tyson Co-Head Capital Markets [email protected]
Jeff Thieman Managing Director
Elizabeth Zajicek Director
Mike Ryan Managing Director
Investment Banking
M&A Advisory
Capital Raising
Strategic Alternatives
Capital Markets Advisory Expertise
Fifth Third’s experienced healthcare capital markets team understands that healthcare companies face
an increasingly complex set of challenges and opportunities. Leading our team are bankers who have
years of market experience and long-established industry relationships across the healthcare industry.
Debt Capital Markets
Loan Capital Markets:
– Pro Rata
– Institutional
Bond Capital Markets:
– Investment Grade
– High Yield
– Acquisition & Bridge Finance
Securitization & Private Placements
Equity Capital Markets
Initial Public Offerings
Follow-On Offerings
Convertible Debt
Investment Banking
Debt Capital Markets Equity Capital Markets
Corporate Banking
Sponsor Coverage
Healthcare Group Overview
Kevin Wagley Head of Healthcare Banking
August 2017
$1,200,000,000 Senior Unsecured
Notes
Co-Manager
September 2017
€420,000,000 Senior Unsecured
Notes
Co-Manager
September 2017
$1,600,000,000 Senior Unsecured
Notes
Co-Manager
September 2017
$600,000,000 Senior Unsecured Credit Facilities
Joint Lead Arranger
August 2017
$3,100,000,000 Senior Secured Credit
Facility
Joint Lead Arranger

3
Healthcare I Industry Spotlight
Q3 2017
Sub-Sector Indices’ Performance
Public Market Valuation Trends Improved Stock Performance YTD in Comparison to LTM
Public Market Valuation Trends 40% of Sub Sectors’ LTM EBITDA Multiples Trade Higher than the S&P 500
Source: S&P Capital IQ LCD As of 9/29/17 LTM Financials as of 6/30/17
Median Enterprise
Value
Median
% Change in Stock Price
Median TEV /
LTM Multiples
Median TEV /
2017E Multiples
Sub-Sector Number of Companies $ in millions 1 Year 3 Year Revenue EBITDA Revenue EBITDA
Biotechnology 11 $37,428 9.9% 30.3% 11.6x 10.9x 10.8x 10.1x
Pharmaceuticals 16 103,499 1.3% (12.1%) 4.2x 12.1x 4.1x 11.2x
Biotechnology / Pharmaceuticals 27 $70,464 5.0% (6.6%) 7.9x 11.5x 7.5x 10.7x
Medical Devices 21 $3,266 11.1% 23.8% 3.3x 17.3x 3.3x 14.1x
Medical Equipment 23 6,338 18.5% 57.5% 3.8x 17.1x 3.8x 16.5x
Medical Supplies 20 1,885 29.1% 57.5% 3.8x 19.8x 3.3x 15.4x
Dental Products 3 15,079 10.5% 30.3% 4.0x 17.6x 3.8x 15.8x
MedTech 67 $4,802 14.8% 43.9% 3.8x 17.5x 3.6x 15.6x
Contract Research Organizations 4 $6,175 32.6% 78.9% 3.5x 17.4x 3.5x 13.9x
Disease Management 1 7,493 18.0% 28.0% 3.2x 28.7x 3.1x 14.6x
Distribution 7 15,047 (14.5%) (11.5%) 0.2x 10.0x 0.2x 9.2x
Healthcare Information Technology 15 1,682 11.7% 3.2% 3.3x 21.0x 3.3x 13.8x
Healthcare Consulting 5 1,116 16.3% 63.5% 1.5x 11.9x 1.5x 10.5x
Healthcare Staffing 3 2,506 41.7% 99.2% 1.3x 12.9x 1.2x 10.3x
Managed Care 8 40,223 39.8% 100.2% 0.7x 10.9x 0.7x 10.5x
Outsourced Pharmacy Management 3 1,331 (5.8%) (11.3%) 0.6x 8.4x 0.6x 8.1x
Physician Practice Management 3 5,715 (34.7%) (22.0%) 1.7x 12.3x 1.4x 8.4x
Specialty Managed Care 2 1,694 48.9% 56.7% 1.2x 11.9x 0.4x 7.2x
Specialty Pharmacy 1 1,533 (26.5%) NA 0.3x 27.1x 0.3x 15.6x
Healthcare Services 52 $2,506 16.3% 42.3% 1.3x 12.3x 1.2x 10.5x
Acute Care 4 $17,161 (14.1%) (45.3%) 0.9x 8.1x 1.0x 7.4x
Alternative Site 6 731 (12.1%) 23.1% 1.4x 12.3x 1.7x 12.1x
Behavioral 3 7,411 (9.8%) (1.6%) 1.7x 12.9x 1.4x 8.2x
Clinical Labs 5 8,875 9.8% 29.3% 2.2x 11.4x 2.2x 10.6x
Diagnostic Imaging 1 1,169 60.9% 70.4% 1.5x 9.9x 1.3x 8.3x
Dialysis 3 20,722 (10.3%) 12.1% 1.5x 8.5x 1.4x 9.6x
Post-Acute 16 1,336 5.4% 11.8% 1.1x 10.8x 1.0x 12.2x
Healthcare Providers 38 $7,411 (9.8%) 12.1% 1.5x 10.8x 1.4x 9.6x
S&P 500 500 16.6% 29.5% 2.4x 12.3x 2.3x 10.6x

4
Healthcare I Industry Spotlight
Q3 2017
Public Market Valuation Trends (Cont’d) 60% of the Sector Outperformed the S&P 500 During the Last Five Years
5-Year EV / NTM EBITDA Multiples [1] % Change in Stock Price
[1] EV = Enterprise Value (defined as Market Value of Equity + Book Value of Debt – Cash & Cash Equivalents) Note: Current as of 9/29/17 Source: S&P Capital IQ
Low Current High
NA
(16.5%)
1.1%
15.8%
24.1%
25.7%
40.9%
56.8%
71.6%
71.7%
82.6%
92.6%
95.8%
97.7%
101.4%
105.2%
108.9%
121.5%
143.5%
158.2%
161.6%
200.8%
250.4%
270.0%
315.5%
(26.5%)
11.7%
(5.8%)
(34.7%)
(10.3%)
1.3%
5.0%
10.5%
5.4%
(14.5%)
11.1%
(12.1%)
14.8%
16.3%
16.3%
48.9%
18.5%
(9.8%)
29.1%
9.9%
18.0%
41.7%
39.8%
32.6%
60.9%
Specialty Pharmacy
HCIT
Outsourced Pharmacy Management
Physician Practice Management
Dialysis
Pharmaceuticals
Biotechnology / Pharmaceuticals
Dental Products
Post-Acute Care
Distribution
Medical Devices
Alternate Site
MedTech
Healthcare Consulting
Healthcare Services
Specialty Managed Care
Medical Equipment
Behavioral
Medical Supplies
Biotechnology
Disease Management
Healthcare Staffing
Managed Care
Contract Research Organizations
Diagnostic Imaging
1 Year 5 Year
8.7x
8.2x
6.3x
4.4x
8.3x
7.1x
7.9x
11.3x
5.3x
6.8x
8.1x
4.8x
9.1x
6.1x
6.8x
3.8x
8.9x
6.1x
9.3x
8.7x
8.3x
7.3x
4.8x
9.0x
5.3x
14.3x
14.4x
8.9x
10.4x
8.1x
11.0x
11.3x
16.0x
11.0x
8.8x
13.6x
9.1x
16.4x
10.5x
10.4x
6.5x
16.8x
8.2x
17.4x
11.6x
16.8x
10.2x
9.6x
13.9x
8.0x
43.9x
18.0x
11.3x
13.6x
11.0x
15.3x
17.3x
17.0x
13.8x
12.3x
15.2x
11.6x
17.3x
12.3x
13.5x
7.0x
17.5x
19.4x
18.5x
19.3x
16.8x
13.5x
11.1x
15.3x
8.6x
Specialty Pharmacy
HCIT
Outsourced Pharmacy Management
Physician Practice Management
Dialysis
Pharmaceuticals
Biotechnology / Pharmaceuticals
Dental Products
Post-Acute Care
Distribution
Medical Devices
Alternate Site
MedTech
Healthcare Consulting
Healthcare Services
Specialty Managed Care
Medical Equipment
Behavioral
Medical Supplies
Biotechnology
Disease Management
Healthcare Staffing
Managed Care
Contract Research Organizations
Diagnostic Imaging
5
Healthcare I Industry Spotlight
Q3 2017
8.0x
9.3x
8.7x
7.2x
8.1x8.4x 8.3x 8.4x
9.3x
9.9x 9.7x10.0x 10.2x
8.8x 8.7x9.0x
8.3x8.8x 9.0x
8.7x 8.7x 8.9x
9.6x9.3x
10.2x
8.5x
6.0x
8.0x
10.0x
12.0x
2006 2007 2008 2009 2010 2011 2012 2013 2014 2015 2016 YTD8/2016
YTD8/2017
Financial Buyers Strategic Buyers
0
4,000
8,000
12,000
16,000
20,000
24,000
2000 2001 2002 2003 2004 2005 2006 2007 2008 2009 2010 2011 2012 2013 2014 2015 2016 3Q 2016 3Q 2017
Under $25mm $25 to $500mm Above $500mm Undisclosed
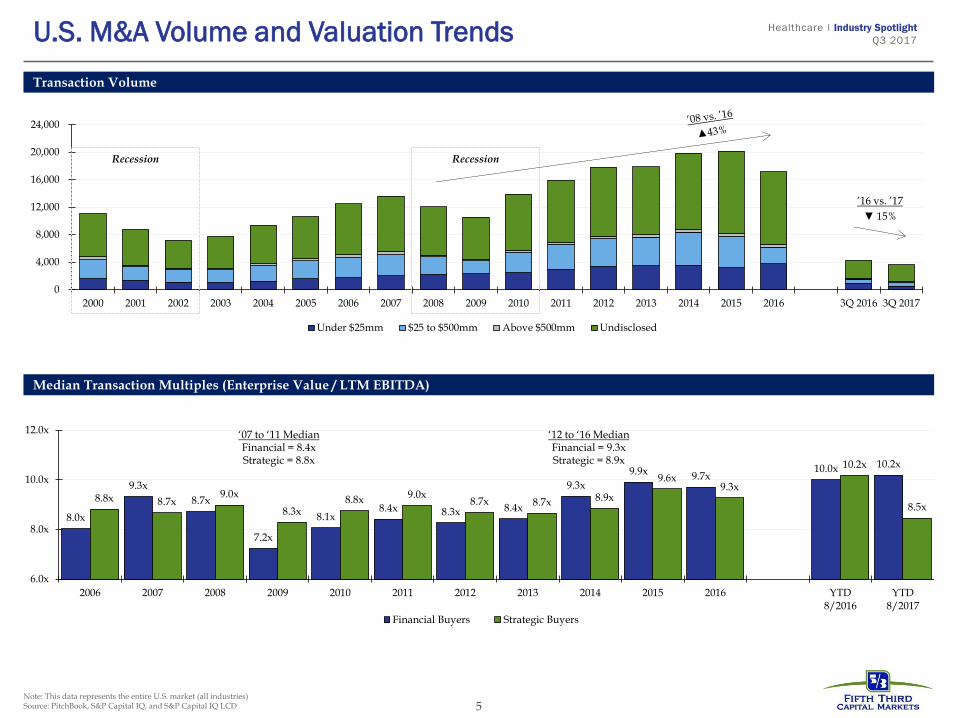
U.S. M&A Volume and Valuation Trends
Median Transaction Multiples (Enterprise Value / LTM EBITDA)
Transaction Volume
Note: This data represents the entire U.S. market (all industries) Source: PitchBook, S&P Capital IQ, and S&P Capital IQ LCD
Recession Recession
’16 vs. ’17
▼ 15%
‘07 to ‘11 Median Financial = 8.4x Strategic = 8.8x
‘12 to ‘16 Median Financial = 9.3x Strategic = 8.9x
6
Healthcare I Industry Spotlight
Q3 2017
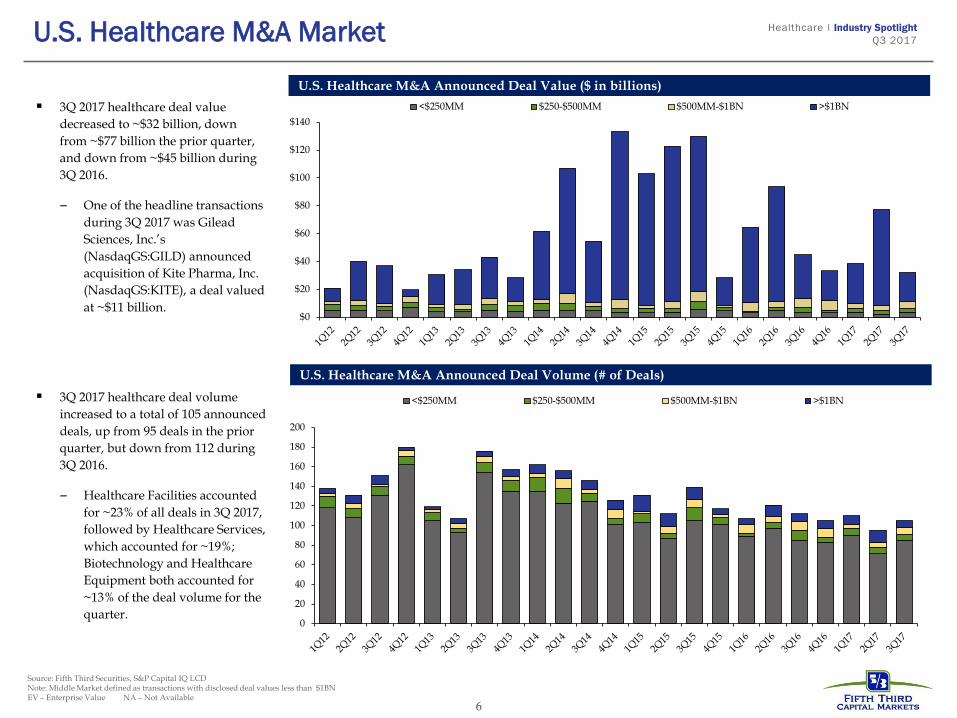
3Q 2017 healthcare deal value
decreased to ~$32 billion, down
from ~$77 billion the prior quarter,
and down from ~$45 billion during
3Q 2016.
– One of the headline transactions
during 3Q 2017 was Gilead
Sciences, Inc.’s
(NasdaqGS:GILD) announced
acquisition of Kite Pharma, Inc.
(NasdaqGS:KITE), a deal valued
at ~$11 billion.
U.S. Healthcare M&A Announced Deal Value ($ in billions)
U.S. Healthcare M&A Announced Deal Volume (# of Deals)
Source: Fifth Third Securities, S&P Capital IQ LCD Note: Middle Market defined as transactions with disclosed deal values less than $1BN EV – Enterprise Value NA – Not Available
U.S. Healthcare M&A Market
3Q 2017 healthcare deal volume
increased to a total of 105 announced
deals, up from 95 deals in the prior
quarter, but down from 112 during
3Q 2016.
– Healthcare Facilities accounted
for ~23% of all deals in 3Q 2017,
followed by Healthcare Services,
which accounted for ~19%;
Biotechnology and Healthcare
Equipment both accounted for
~13% of the deal volume for the
quarter.
$0
$20
$40
$60
$80
$100
$120
$140
<$250MM $250-$500MM $500MM-$1BN >$1BN
0
20
40
60
80
100
120
140
160
180
200
<$250MM $250-$500MM $500MM-$1BN >$1BN

7
Healthcare I Industry Spotlight
Q3 2017
U.S. Healthcare Private Equity Deal Flow ($ in billions)
U.S. Healthcare Private Equity Exits ($ in billions)
Source: Fifth Third Securities, PitchBook Data, Inc. *3Q2017 preliminary Pitchbook data
Private Equity Market
Overall U.S. Private Equity Deal Flow ($ in billions) U.S. Private Equity deal flow was down during the third quarter of 2017 on a volume basis and up on a deal value basis
Several large private equity transactions were announced in the third quarter driving total deal value
– HPS Investment Partners and Equity Group Investments agreed to acquire Waste Industries USA
– Sycamore Partners agreed to acquire Staples Inc. for $6.9 billion
– Bain Capital acquired a stake in Surgery Partners Inc. which will use the funding to acquire National Surgical Healthcare
Private equity activity started off slow in 2017, yet market fundamentals point to strong deal flow in the year ahead as fundraising has continued at a rampant pace
Healthcare deal flow YTD 9/2017 saw a ~12% decline from YTD 9/2016, with the number of deals closed decreasing from 588 to 520
– However, private equity disclosed capital invested increased dramatically, up $21.8 billion YTD 9/2017 when compared to YTD 9/2016
$21.4 $36.6
$17.4 $22.1 $36.1
$28.7 $32.9 $26.1 $47.9
438 474 520 546617
687764
588520
2010 2011 2012 2013 2014 2015 2016 YTD9/2016
YTD9/2017
Capital Invested ($) # of Deals Closed
$95.0 $121.5 $110.0 $92.0$375.0
$125.0 $166.5 $135.0$351.4
58 5972 72 73
98 9671 76
2010 2011 2012 2013 2014 2015 2016 YTD9/2016
YTD9/2017
Median Deal Size ($) # of Exits
0
500
1,000
1,500
$0
$50
$100
$150
$200
$250
1Q
11
2Q
11
3Q
11
4Q
11
1Q
12
2Q
12
3Q
12
4Q
12
1Q
13
2Q
13
3Q
13
4Q
13
1Q
14
2Q14
3Q
14
4Q
14
1Q
15
2Q
15
3Q
15
4Q
15
1Q
16
2Q
16
3Q
16
4Q
16
1Q
17
2Q
17
3Q
17*
Deal Value ($) # of Deals Closed

8
Healthcare I Industry Spotlight
Q3 2017
0.0%
1.0%
2.0%
3.0%
4.0%
5.0%
6.0%
7.0%
8.0%
9.0%
10.0%
MM B-rated MM NR
6.12%
6.29%
Note: This data represents the entire U.S. middle market (all industries) Note: The middle market is defined as deal size < $100 million and borrower sales < $500 million [1] Includes both non-sponsored and sponsored transactions; sufficient data not available for MM NR loans in 1Q15 and 1Q17 Source: Bloomberg, S&P Capital IQ LCD, and Thomson Reuters LPC
U.S. Middle Market Loan Market Trends
Loan Volume: Low Level of Supply Continues ($ in billions) Non-Rated Term Loan Yields Tighten Further [1]
Covenant-Lite Volume Surges in 2Q17 ($ in billions) Leverage Multiples Remain Aggressive on Middle Market LBOs
$0.0
$10.0
$20.0
$30.0
$40.0
$50.0
$60.0
$70.0
Non-Sponsored Sponsored
$0.0
$1.0
$2.0
$3.0
$4.0
$5.0
$6.0
$7.0
0.0x
1.0x
2.0x
3.0x
4.0x
5.0x
6.0x
7.0x1st Lien Debt to EBITDA Junior Debt to EBITDA

9
Appendix

10
Healthcare I Industry Spotlight
Q3 2017
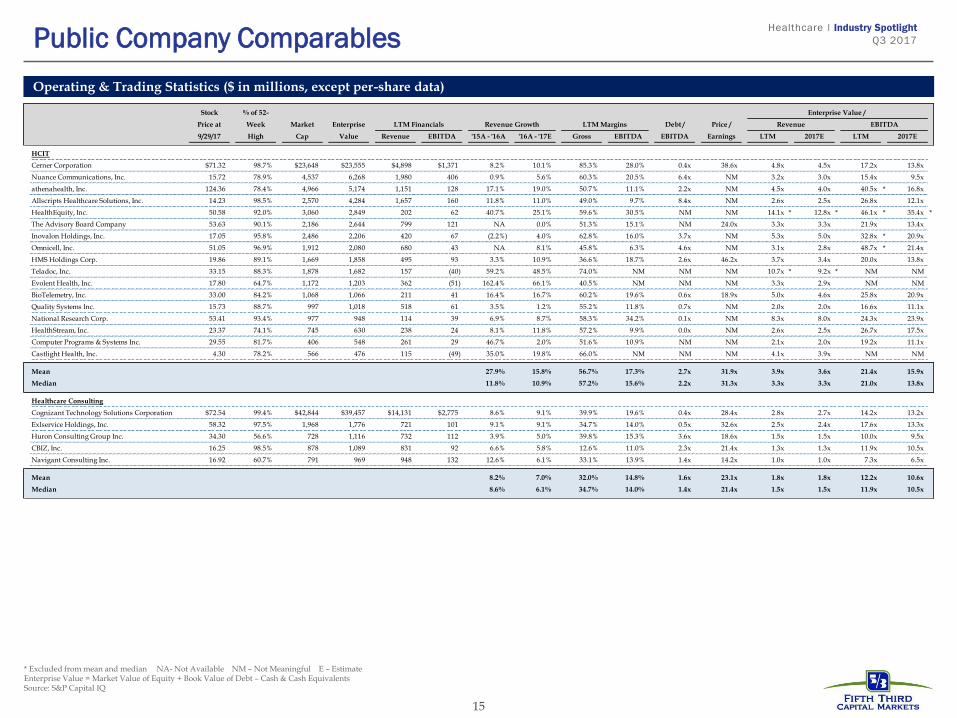
Operating & Trading Statistics ($ in millions, except per-share data)
Public Company Comparables
* Excluded from mean and median NA- Not Available NM – Not Meaningful E – Estimate Enterprise Value = Market Value of Equity + Book Value of Debt – Cash & Cash Equivalents Source: S&P Capital IQ
Stock % of 52- Enterprise Value /
Price at Week Market Enterprise LTM Financials Revenue Growth LTM Margins Debt / Price / Revenue EBITDA
9/29/17 High Cap Value Revenue EBITDA '15A - '16A '16A - '17E Gross EBITDA EBITDA Earnings LTM 2017E LTM 2017E
Biotechnology
Amgen Inc. $186.45 97.6% $136,048 $131,883 $21,952 $12,358 6.1% (1.0%) 81.9% 56.3% 2.8x 18.2x 6.0x 5.7x 10.7x 9.6x
Celgene Corporation 145.82 99.8% 114,082 118,226 12,152 4,834 21.3% 0.3% 87.8% 39.8% 3.0x 58.6x 9.7x 8.9x 24.5x 14.6x
Gilead Sciences, Inc. 81.02 93.9% 105,806 110,906 28,466 17,966 (6.9%) (0.5%) 86.0% 63.1% 1.5x 8.2x 3.9x 4.5x 6.2x * 7.2x
Biogen Inc. 313.12 94.9% 66,204 69,813 10,062 6,422 6.4% 0.6% 87.5% 63.8% 1.0x 18.5x 6.9x 6.1x 10.9x 10.7x
Regeneron Pharmaceuticals, Inc. 447.12 82.3% 47,662 47,095 4,987 1,821 18.4% 1.3% 51.6% 36.5% 0.4x 58.1x 9.4x 8.6x NM 27.1x *
Vertex Pharmaceuticals Incorporated 152.04 90.6% 38,332 37,428 2,131 409 64.9% (0.4%) 26.1% 19.2% NM NM 17.6x 18.1x NM NM
Incyte Corporation 116.74 76.2% 24,591 24,006 1,306 10 46.7% (0.0%) 42.1% 0.8% 2.4x NM 18.4x 15.2x NM NM
BioMarin Pharmaceutical Inc. 93.07 92.6% 16,312 16,261 1,201 (107) 25.5% (0.3%) 22.4% NM NM NM 13.5x 12.7x NM NM
Juno Therapeutics, Inc. 44.86 95.4% 5,009 4,321 83 (289) 335.7% NM NM NM NM NM 52.3x 69.3x NM NM
FibroGen, Inc. 53.80 99.5% 4,261 4,034 118 (110) (0.7%) (6.1%) NM NM NM NM 34.2x 23.4x NM NM
NantKwest, Inc. 5.48 64.9% 435 282 0 (102) (81.4%) (4.5%) NM NM NM NM NM NM NM NA
Mean 39.6% (1.1%) 60.7% 39.9% 1.8x 32.3x 17.2x 17.3x 15.3x 10.5x
Median 18.4% (0.3%) 66.8% 39.8% 1.9x 18.5x 11.6x 10.8x 10.9x 10.1x
Pharmaceuticals
Pfizer Inc. $35.70 98.6% $212,320 $242,101 $52,347 $20,244 8.1% 0.1% 77.4% 38.7% 2.2x 30.5x 4.6x 4.5x 12.0x 10.9x
Roche Holding AG 255.11 90.5% 217,559 234,931 56,548 22,346 2.9% (3.7%) 71.3% 39.5% 1.0x 23.3x 4.2x 4.4x 10.5x 10.8x
Novartis AG 85.55 98.3% 200,439 222,639 48,229 14,458 (1.9%) (1.7%) 64.9% 30.0% 2.1x 30.6x 4.6x 4.6x 15.4x 15.9x
Merck & Co., Inc. 64.03 95.9% 174,632 187,824 40,016 15,449 0.8% 0.5% 66.4% 38.6% 1.6x 45.4x 4.7x 4.7x 12.2x 11.3x
Sanofi 99.29 90.4% 122,166 130,964 40,167 12,429 (3.2%) 3.7% 69.2% 30.9% 1.7x 27.7x 3.3x 3.4x 10.5x 11.1x
GlaxoSmithKline plc 19.96 85.3% 96,899 120,745 38,744 10,591 (2.4%) (0.7%) 67.8% 27.3% 2.3x NM 3.1x 3.3x 11.4x 9.3x
Novo Nordisk A/S 47.81 97.3% 117,578 114,563 17,523 8,255 1.0% (0.1%) 84.6% 47.1% 0.0x 22.5x 6.5x 6.8x 13.9x 14.9x
Abbott Laboratories 53.36 97.4% 92,710 107,151 23,607 5,140 2.2% 0.2% 56.8% 21.8% 4.7x NM 4.5x 4.1x 20.8x 15.8x
AstraZeneca PLC 66.43 89.8% 84,098 99,354 20,068 5,913 (6.9%) 0.5% 82.6% 29.5% 3.3x 24.1x 5.0x 4.6x 16.8x 14.0x
Eli Lilly and Company 85.54 98.6% 89,568 96,540 22,005 5,995 6.3% (1.1%) 73.4% 27.2% 2.1x 33.2x 4.4x 4.4x 16.1x 15.2x
Teva Pharmaceutical Industries Limited 17.60 37.6% 17,868 57,555 23,371 7,424 11.5% (0.9%) 55.9% 31.8% 4.7x NM 2.5x 2.4x 7.8x 7.5x
Alexion Pharmaceuticals, Inc. 140.29 93.9% 31,311 33,115 3,410 1,343 18.4% 0.2% 91.6% 39.4% 2.4x NM 9.7x * 9.5x * 24.7x * 18.8x
Valeant Pharmaceuticals International, Inc. 14.33 56.1% 4,994 32,339 9,087 3,754 (7.4%) (0.7%) 73.4% 41.3% 7.6x NM 3.6x 3.7x 8.6x 9.2x
Mylan N.V. 31.37 68.4% 16,823 31,045 11,865 3,924 17.5% (0.8%) 45.3% 33.1% 3.8x 34.1x 2.6x 2.4x 7.9x 7.2x
Perrigo Company plc 84.65 87.1% 12,072 14,972 5,025 1,103 5.3% 3.8% 38.4% 22.0% 3.3x NM 3.0x 3.1x 13.6x 12.3x
Endo International plc 8.57 39.2% 1,912 9,581 4,039 313 22.7% (2.2%) 34.3% 7.8% 26.4x * NM 2.4x 2.7x 30.6x * 6.3x
Mean 4.7% (0.2%) 65.8% 31.6% 2.9x 30.1x 3.9x 3.9x 12.7x 11.9x
Median 2.6% (0.4%) 68.5% 31.4% 2.3x 30.5x 4.2x 4.1x 12.1x 11.2x

11
Healthcare I Industry Spotlight
Q3 2017
Operating & Trading Statistics ($ in millions, except per-share data)
Public Company Comparables
* Excluded from mean and median NA- Not Available NM – Not Meaningful E – Estimate Enterprise Value = Market Value of Equity + Book Value of Debt – Cash & Cash Equivalents Source: S&P Capital IQ
Stock % of 52- Enterprise Value /
Price at Week Market Enterprise LTM Financials Revenue Growth LTM Margins Debt / Price / Revenue EBITDA
9/29/17 High Cap Value Revenue EBITDA '15A - '16A '16A - '17E Gross EBITDA EBITDA Earnings LTM 2017E LTM 2017E
Medical Devices
Johnson & Johnson $130.01 94.8% $348,947 $370,935 $72,531 $25,146 2.6% 4.3% 69.9% 34.7% 1.4x 21.9x 5.1x 4.9x 14.8x 14.1x
Medtronic plc 77.77 86.7% 105,347 126,395 29,934 9,193 3.0% 2.6% 68.8% 30.7% 3.7x 27.5x 4.2x 4.1x 13.7x 12.8x
Thermo Fisher Scientific, Inc. 189.20 97.4% 75,719 92,004 19,199 4,812 7.7% 6.8% 46.2% 25.1% 3.5x 37.1x 4.8x 4.7x 19.1x 18.4x
Stryker Corporation 142.02 95.4% 53,124 56,702 11,957 3,285 13.9% 7.5% 66.6% 27.5% 2.2x 32.6x 4.7x 4.7x 17.3x 16.5x
Boston Scientific Corporation 29.17 99.2% 40,025 45,665 8,714 2,312 13.3% 4.9% 70.8% 26.5% 2.5x NM 5.2x 5.2x 19.8x 18.3x
Baxter International Inc. 62.75 96.9% 34,191 33,821 10,283 2,227 2.0% 0.2% 42.3% 21.7% 1.6x 7.0x 3.3x 3.3x 15.2x 15.0x
Edwards Lifesciences Corp. 109.31 89.8% 23,082 22,967 3,232 1,046 18.8% 10.2% 73.1% 32.3% 1.0x 41.9x 7.1x * 7.0x * 22.0x 21.8x
Smith & Nephew plc 18.07 95.5% 15,784 17,383 4,677 1,315 0.8% 2.1% 72.8% 28.1% 1.3x 20.6x 3.7x 3.6x 13.2x 12.5x
Teleflex Incorporated 241.97 99.2% 10,898 12,221 1,986 521 3.8% 10.8% 55.0% 26.2% 3.8x 48.6x 6.2x * 5.9x * 23.5x 19.5x
Varian Medical Systems, Inc. 100.06 92.8% 9,186 8,896 3,273 643 3.8% (15.3%) 43.0% 19.6% NM 28.5x 2.7x 3.3x NM NM
NuVasive, Inc. 55.46 67.9% 2,818 3,348 1,021 226 18.6% 11.0% 76.6% 22.1% NM NM 3.3x 3.1x NM NM
Wright Medical Group N.V. 25.87 82.0% 2,663 3,266 707 59 70.3% 10.5% 77.6% 8.3% 14.2x NM 4.6x 4.3x NM NM
Penumbra, Inc. 90.30 99.2% 3,050 2,831 294 (3) 41.5% 20.5% 64.9% NM 0.0x NM 9.6x * 8.9x * NM 597.7x *
NovoCure Limited 19.85 89.0% 1,767 1,679 125 (69) 150.5% 123.9% 51.9% NM NM NM 13.4x * 9.0x * NM NM
AtriCure, Inc. 22.37 88.8% 768 772 166 (20) NM NM 71.6% NM NM NM 4.6x 4.4x NM NM
AngioDynamics Inc. 17.09 90.7% 627 673 347 48 (0.5%) 3.1% 49.6% 13.7% NM NM 1.9x 1.9x NM 11.5x
Exactech Inc. 32.95 97.9% 473 478 263 44 6.5% 4.0% 68.8% 16.5% NM NM 1.8x 1.8x NM 10.2x
Accuray Incorporated 4.00 62.6% 335 404 383 1 (3.9%) 13.4% 38.7% 0.2% 256.7x NM 1.1x 0.9x 629.6x * 9.4x
RTI Surgical Inc. 4.55 75.8% 271 399 280 15 (3.3%) 3.0% 48.5% 5.5% 5.2x NM 1.4x 1.4x 25.8x 13.3x
Cogentix Medical, Inc. 2.56 78.5% 156 131 54 3 18.8% 8.2% 68.7% 6.0% 0.0x NM 2.4x 2.3x 41.1x * NA
ConforMIS, Inc. 3.52 32.2% 158 119 79 (55) 20.9% NA 33.4% NM NM NM 1.5x 1.4x NM NM
Zemach Hammerman Ltd. 3.41 79.7% 62 114 134 12 NM NA 9.8% * 8.8% 7.0x 19.2x 0.9x NA 9.8x NA
Mean 19.5% 12.2% 59.9% 19.6% 20.3x 28.5x 3.2x 3.3x 17.6x 14.9x
Median 7.1% 6.8% 66.6% 21.9% 2.5x 28.0x 3.3x 3.3x 17.3x 14.1x

12
Healthcare I Industry Spotlight
Q3 2017
Operating & Trading Statistics ($ in millions, except per-share data)
Public Company Comparables
* Excluded from mean and median NA- Not Available NM – Not Meaningful E – Estimate Enterprise Value = Market Value of Equity + Book Value of Debt – Cash & Cash Equivalents Source: S&P Capital IQ
Stock % of 52- Enterprise Value /
Price at Week Market Enterprise LTM Financials Revenue Growth LTM Margins Debt / Price / Revenue EBITDA
9/29/17 High Cap Value Revenue EBITDA '15A - '16A '16A - '17E Gross EBITDA EBITDA Earnings LTM 2017E LTM 2017E
Medical Equipment
Danaher Corporation $85.78 96.8% $59,590 $70,461 $17,432 $4,163 17.0% 5.8% 55.6% 23.9% NM 27.9x 4.0x 3.9x 16.9x 16.5x
Intuitive Surgical, Inc. 1,045.88 99.2% 38,994 37,171 2,870 1,082 14.2% 9.5% 69.9% 37.7% 0.0x NM 13.0x * 12.6x * 34.4x * 32.5x *
Illumina Inc. 199.20 92.9% 29,083 28,444 2,487 667 8.0% 10.5% 71.3% 26.8% 1.8x NM 11.4x * 10.7x * 42.7x * 35.1x *
IDEXX Laboratories, Inc. 155.49 89.9% 13,571 14,453 1,862 468 10.8% 8.4% 54.9% 25.1% 2.8x NM 7.8x * 7.5x * 30.9x * 30.6x *
Waters Corporation 179.52 94.3% 14,330 13,116 2,212 766 6.1% 3.2% 58.9% 34.6% 2.5x 28.0x 5.9x 5.9x 17.1x 17.0x
Hologic Inc. 36.69 78.4% 10,291 12,945 2,983 1,006 4.7% 10.7% 65.5% 33.7% 3.2x 31.4x 4.3x 4.1x 12.9x 12.2x
ResMed Inc. 76.96 94.0% 10,951 11,208 2,067 569 12.4% 4.3% 57.9% 27.5% 1.9x 33.3x 5.4x 5.2x 19.7x 18.2x
Steris Plc 88.40 100.0% 7,516 8,729 2,582 521 17.0% (0.7%) 38.6% 20.2% 2.9x NM 3.4x 3.4x 16.7x 14.0x
PerkinElmer Inc. 68.97 98.3% 7,602 8,077 2,142 416 0.5% 4.1% 47.9% 19.4% 2.6x 35.2x 3.8x 3.7x 19.4x 17.6x
Getinge AB 18.73 82.7% 5,100 7,460 3,596 692 (8.5%) 4.6% 46.5% 19.2% 3.6x 34.1x 2.1x 2.2x 10.8x 10.6x
Hill-Rom Holdings, Inc. 74.00 87.4% 4,875 6,979 2,711 465 33.5% 4.4% 47.5% 17.2% 5.0x 34.5x 2.6x 2.5x 15.0x 11.8x
Bio-Rad Laboratories, Inc. 222.22 91.5% 6,616 6,338 2,085 234 2.4% 1.9% 55.1% 11.2% NM NM 3.0x 3.0x NM NM
Bruker Corporation 29.75 98.4% 4,726 4,724 1,653 275 (0.8%) 2.3% 46.8% 16.6% 1.6x 31.3x 2.9x 2.9x 17.2x 16.2x
Integra LifeSciences Holdings Corporation 50.48 89.5% 3,941 4,667 1,047 241 12.4% 13.6% 66.7% 23.0% 3.7x NM 4.5x 4.1x 19.4x 17.7x
Masimo Corporation 86.56 82.7% 4,496 4,164 730 182 11.5% 8.4% 66.8% 24.9% 0.0x 15.3x 5.7x 5.5x 22.9x 21.4x
Cantel Medical Corp. 94.17 99.6% 3,930 4,019 770 150 16.2% 5.8% 47.6% 19.4% NM NM 5.2x 4.9x NM NM
CONMED Corporation 52.47 99.2% 1,465 1,922 773 124 6.2% 1.4% 54.5% 16.0% 4.0x NM 2.5x 2.5x 15.5x 14.4x
Nxstage Medical, Inc. 27.60 89.6% 1,827 1,778 378 14 9.0% 9.6% 41.6% 3.8% * 1.0x NM 4.7x 4.4x NM 53.7x *
Abaxis, Inc. 44.65 79.8% 1,013 876 228 50 3.8% 4.3% 55.7% 21.9% 0.0x 30.4x 3.8x 3.7x 17.6x 16.7x
Invacare Corporation 15.75 94.6% 518 596 980 (14) (8.3%) (6.6%) 27.1% NM NM NM 0.6x 0.6x NM NM
Surmodics, Inc. 31.00 97.5% 406 363 71 16 15.3% (5.3%) 55.9% 21.9% 0.0x 42.5x 5.1x 5.4x 23.3x NA
InfuSystem Holdings, Inc. 2.05 73.2% 47 79 63 8 (0.7%) NA 75.0% 12.8% 4.0x NM 1.3x NA 9.8x NA
Alphatec Holdings, Inc. 2.26 23.4% 25 70 106 (3) (10.5%) NA 63.3% NM NM NM 0.7x NA NM NA
Mean 7.5% 4.8% 55.2% 22.7% 2.2x 31.3x 3.6x 3.8x 16.9x 15.7x
Median 8.0% 4.4% 55.6% 21.9% 2.6x 31.4x 3.8x 3.8x 17.1x 16.5x

13
Healthcare I Industry Spotlight
Q3 2017
Operating & Trading Statistics ($ in millions, except per-share data)
Public Company Comparables
* Excluded from mean and median NA- Not Available NM – Not Meaningful E – Estimate Enterprise Value = Market Value of Equity + Book Value of Debt – Cash & Cash Equivalents Source: S&P Capital IQ
Stock % of 52- Enterprise Value /
Price at Week Market Enterprise LTM Financials Revenue Growth LTM Margins Debt / Price / Revenue EBITDA
9/29/17 High Cap Value Revenue EBITDA '15A - '16A '16A - '17E Gross EBITDA EBITDA Earnings LTM 2017E LTM 2017E
Medical Supplies
Becton, Dickinson and Company $195.95 94.8% $44,591 $49,732 $12,158 $3,190 21.4% (2.7%) 48.6% 26.2% 6.0x 32.6x 4.1x 4.1x 15.6x 11.9x
CR Bard Inc. 320.50 98.7% 23,291 23,972 3,828 1,185 9.6% 4.7% 63.1% 31.0% 1.4x 45.6x 6.3x 6.2x 20.2x 19.1x
Agilent Technologies, Inc. 64.20 96.6% 20,661 20,182 4,394 1,021 4.1% 4.7% 52.7% 23.2% 2.0x 41.2x 4.6x 4.6x 19.8x 19.4x
The Cooper Companies Inc. 237.11 92.5% 11,606 12,774 2,096 642 9.4% 8.9% 63.3% 30.6% 1.9x 39.1x 6.1x 6.0x 19.9x 18.2x
VWR Corporation 33.11 88.9% 4,365 6,482 4,581 492 4.5% 1.6% 28.0% 10.7% 4.5x 29.6x 1.4x 1.4x 13.2x 13.1x
Bruker Corporation 29.75 98.4% 4,726 4,724 1,653 275 (0.8%) 2.3% 46.8% 16.6% 1.6x 31.3x 2.9x 2.9x 17.2x 16.2x
ICU Medical, Inc. 185.85 98.4% 3,680 3,514 771 92 11.7% 224.3% 53.1% 12.0% 0.8x NM 4.6x 2.9x 38.0x * 20.9x
Neogen Corp. 77.46 99.8% 2,962 2,802 373 82 12.5% 6.7% 47.3% 21.9% 0.0x NM 7.5x * 7.3x * 34.2x * 33.3x *
Haemonetics Corporation 44.87 99.8% 2,360 2,492 887 165 (2.5%) 0.4% 43.9% 18.5% 1.8x NM 2.8x 2.8x 15.1x 11.9x
Merit Medical Systems, Inc. 42.35 99.4% 2,123 2,327 672 102 12.3% 18.3% 43.9% 15.1% 2.4x NM 3.5x 3.3x 22.8x 21.0x
Quidel Corp. 43.86 96.3% 1,467 1,443 214 39 (1.3%) 14.1% 61.4% 18.4% 3.8x NM 6.7x 6.6x 36.6x * 28.9x *
Natus Medical Inc. 37.50 85.5% 1,224 1,253 445 48 1.6% 32.1% 62.1% 10.8% 2.3x 29.1x 2.8x 2.5x 26.1x 14.6x
ATRION Corp. 672.00 97.1% 1,244 1,197 146 49 (1.5%) NA 47.1% 33.5% 0.0x 45.3x 8.2x * NA 24.5x NA
OraSure Technologies, Inc. 22.50 98.7% 1,338 1,178 125 24 2.6% NA 67.3% 19.2% 0.0x NM 9.4x * 8.8x * 49.2x * 42.7x *
Abaxis, Inc. 44.65 79.8% 1,013 876 228 50 3.8% NA 55.7% 21.9% 0.0x 30.4x 3.8x 3.7x 17.6x 16.7x *
Cardiovascular Systems Inc. 28.15 85.0% 929 841 205 5 15.8% 5.7% 81.2% 2.6% 3.9x NM 4.1x 3.9x 155.0x * 58.6x *
CryoLife Inc. 22.70 97.2% 759 776 183 24 23.6% 5.0% 67.6% 12.9% 2.9x NM 4.2x 4.1x 32.9x * 27.8x *
Meridian Bioscience, Inc. 14.30 72.4% 604 604 198 53 1.4% 0.2% 64.5% 26.7% 1.1x 20.4x 3.0x 3.1x 11.4x 11.8x
Endologix Inc. 4.46 33.7% 372 525 191 (54) 25.6% 1.5% 64.2% NM NM NM 2.8x 2.7x NM NM
Trinity Biotech plc 5.61 42.1% 130 161 99 7 (0.6%) 2.2% 43.3% 7.5% 12.9x NM 1.6x 1.6x 21.8x 10.4x
Mean 7.7% 19.4% 55.3% 18.9% 2.6x 34.4x 3.8x 3.7x 18.9x 15.7x
Median 4.3% 4.7% 54.4% 18.5% 1.9x 32.0x 3.8x 3.3x 19.8x 15.4x
Dental Products
Danaher Corp. $85.78 96.8% $59,590 $70,461 $17,432 $4,163 17.0% 5.8% 55.6% 23.9% 2.8x 27.9x 4.0x 3.9x 16.9x 16.5x
DENTSPLY SIRONA Inc. 59.81 91.1% 13,727 15,079 3,844 824 40.0% 7.7% 53.4% 21.4% 2.0x 30.8x 3.9x 3.7x 18.3x 15.0x
Align Technology Inc. 186.27 98.0% 14,930 14,328 1,239 307 27.7% 21.0% 75.5% 24.7% NM NM 11.6x * 11.0x * 46.7x * 42.8x *
Mean 28.2% 11.5% 61.5% 23.4% 2.4x 29.3x 4.0x 3.8x 17.6x 15.8x
Median 27.7% 7.7% 55.6% 23.9% 2.4x 29.3x 4.0x 3.8x 17.6x 15.8x

14
Healthcare I Industry Spotlight
Q3 2017
Operating & Trading Statistics ($ in millions, except per-share data)
Public Company Comparables
* Excluded from mean and median NA- Not Available NM – Not Meaningful E – Estimate Enterprise Value = Market Value of Equity + Book Value of Debt – Cash & Cash Equivalents Source: S&P Capital IQ
Stock % of 52- Enterprise Value /
Price at Week Market Enterprise LTM Financials Revenue Growth LTM Margins Debt / Price / Revenue EBITDA
9/29/17 High Cap Value Revenue EBITDA '15A - '16A '16A - '17E Gross EBITDA EBITDA Earnings LTM 2017E LTM 2017E
Contract Research Organizations
Quintiles Transnational Holdings Inc. $95.07 95.1% $20,450 $28,706 $6,969 $1,507 24.0% 49.8% 39.7% 21.6% 5.9x NM 4.1x 3.6x 19.0x 14.1x
ICON Public Limited Company 113.88 96.9% 6,154 6,188 1,718 394 5.8% 3.5% 42.3% 22.9% 0.9x 24.5x 3.6x 3.6x 15.7x 15.5x
Charles River Laboratories International, Inc. 108.02 98.6% 5,141 6,163 1,807 436 23.3% 8.8% 39.4% 24.1% 2.6x 33.5x 3.4x 3.4x 14.1x 13.6x
PRA Health Sciences, Inc. 76.17 94.0% 4,772 5,497 1,698 251 14.8% 16.6% 34.6% 14.8% 3.3x NM 3.2x 3.0x 21.9x NM
Mean 17.0% 19.7% 39.0% 20.9% 3.2x 29.0x 3.6x 3.4x 17.7x 10.8x
Median 19.1% 12.7% 39.5% 22.3% 3.0x 29.0x 3.5x 3.5x 17.4x 13.9x
Disease Management
Alere Inc. $50.99 100.0% $4,466 $7,493 $2,325 $261 (2.8%) 2.3% 44.9% 11.2% 11.1x NM 3.2x 3.1x 28.7x 14.6x
Mean (2.8%) 2.3% 44.9% 11.2% 11.1x NA 3.2x 3.1x 28.7x 14.6x
Median (2.8%) 2.3% 44.9% 11.2% 11.1x NA 3.2x 3.1x 28.7x 14.6x
Distribution
McKesson Corporation $153.61 90.7% $32,298 $39,537 $199,851 $3,943 4.0% 0.9% 5.8% 2.0% 2.0x 17.0x 0.2x 0.2x 10.0x 9.5x
Cardinal Health, Inc. 66.92 78.8% 21,094 24,769 129,976 3,069 6.9% 3.8% 5.1% 2.4% 3.4x 16.1x 0.2x 0.2x 8.1x 7.6x
AmerisourceBergen Corporation 82.75 84.6% 18,131 20,606 151,584 2,426 8.0% 9.1% 2.8% 1.6% 1.6x 13.8x 0.1x 0.1x 8.5x 8.7x
Henry Schein, Inc. 81.99 87.7% 12,964 15,047 11,968 1,020 8.9% 4.3% 27.9% 8.5% 1.4x 13.2x 1.3x 1.2x 14.8x 14.3x
Patterson Companies, Inc. 38.65 78.5% 3,617 4,694 5,565 400 3.8% 2.6% 23.7% 7.2% 2.9x 20.8x 0.8x 0.8x 11.7x 10.8x
Owens & Minor Inc. 29.20 78.9% 1,788 2,310 9,378 230 (0.5%) 0.7% 12.2% 2.5% 2.5x 16.6x 0.2x 0.2x 10.0x 9.2x
Aceto Corp. 11.23 50.0% 338 635 638 68 14.3% 18.4% 24.5% 10.7% 5.2x 15.9x 1.0x 0.8x 9.3x 6.1x
Mean 6.5% 5.7% 14.6% 5.0% 2.7x 16.2x 0.6x 0.5x 10.3x 9.5x
Median 6.9% 3.8% 12.2% 2.5% 2.5x 16.1x 0.2x 0.2x 10.0x 9.2x
15
Healthcare I Industry Spotlight
Q3 2017
Operating & Trading Statistics ($ in millions, except per-share data)
Public Company Comparables
* Excluded from mean and median NA- Not Available NM – Not Meaningful E – Estimate Enterprise Value = Market Value of Equity + Book Value of Debt – Cash & Cash Equivalents Source: S&P Capital IQ
Stock % of 52- Enterprise Value /
Price at Week Market Enterprise LTM Financials Revenue Growth LTM Margins Debt / Price / Revenue EBITDA
9/29/17 High Cap Value Revenue EBITDA '15A - '16A '16A - '17E Gross EBITDA EBITDA Earnings LTM 2017E LTM 2017E
HCIT
Cerner Corporation $71.32 98.7% $23,648 $23,555 $4,898 $1,371 8.2% 10.1% 85.3% 28.0% 0.4x 38.6x 4.8x 4.5x 17.2x 13.8x
Nuance Communications, Inc. 15.72 78.9% 4,537 6,268 1,980 406 0.9% 5.6% 60.3% 20.5% 6.4x NM 3.2x 3.0x 15.4x 9.5x
athenahealth, Inc. 124.36 78.4% 4,966 5,174 1,151 128 17.1% 19.0% 50.7% 11.1% 2.2x NM 4.5x 4.0x 40.5x * 16.8x
Allscripts Healthcare Solutions, Inc. 14.23 98.5% 2,570 4,284 1,657 160 11.8% 11.0% 49.0% 9.7% 8.4x NM 2.6x 2.5x 26.8x 12.1x
HealthEquity, Inc. 50.58 92.0% 3,060 2,849 202 62 40.7% 25.1% 59.6% 30.5% NM NM 14.1x * 12.8x * 46.1x * 35.4x *
The Advisory Board Company 53.63 90.1% 2,186 2,644 799 121 NA 0.0% 51.3% 15.1% NM 24.0x 3.3x 3.3x 21.9x 13.4x
Inovalon Holdings, Inc. 17.05 95.8% 2,486 2,206 420 67 (2.2%) 4.0% 62.8% 16.0% 3.7x NM 5.3x 5.0x 32.8x * 20.9x
Omnicell, Inc. 51.05 96.9% 1,912 2,080 680 43 NA 8.1% 45.8% 6.3% 4.6x NM 3.1x 2.8x 48.7x * 21.4x
HMS Holdings Corp. 19.86 89.1% 1,669 1,858 495 93 3.3% 10.9% 36.6% 18.7% 2.6x 46.2x 3.7x 3.4x 20.0x 13.8x
Teladoc, Inc. 33.15 88.3% 1,878 1,682 157 (40) 59.2% 48.5% 74.0% NM NM NM 10.7x * 9.2x * NM NM
Evolent Health, Inc. 17.80 64.7% 1,172 1,203 362 (51) 162.4% 66.1% 40.5% NM NM NM 3.3x 2.9x NM NM
BioTelemetry, Inc. 33.00 84.2% 1,068 1,066 211 41 16.4% 16.7% 60.2% 19.6% 0.6x 18.9x 5.0x 4.6x 25.8x 20.9x
Quality Systems Inc. 15.73 88.7% 997 1,018 518 61 3.5% 1.2% 55.2% 11.8% 0.7x NM 2.0x 2.0x 16.6x 11.1x
National Research Corp. 53.41 93.4% 977 948 114 39 6.9% 8.7% 58.3% 34.2% 0.1x NM 8.3x 8.0x 24.3x 23.9x
HealthStream, Inc. 23.37 74.1% 745 630 238 24 8.1% 11.8% 57.2% 9.9% 0.0x NM 2.6x 2.5x 26.7x 17.5x
Computer Programs & Systems Inc. 29.55 81.7% 406 548 261 29 46.7% 2.0% 51.6% 10.9% NM NM 2.1x 2.0x 19.2x 11.1x
Castlight Health, Inc. 4.30 78.2% 566 476 115 (49) 35.0% 19.8% 66.0% NM NM NM 4.1x 3.9x NM NM
Mean 27.9% 15.8% 56.7% 17.3% 2.7x 31.9x 3.9x 3.6x 21.4x 15.9x
Median 11.8% 10.9% 57.2% 15.6% 2.2x 31.3x 3.3x 3.3x 21.0x 13.8x
Healthcare Consulting
Cognizant Technology Solutions Corporation $72.54 99.4% $42,844 $39,457 $14,131 $2,775 8.6% 9.1% 39.9% 19.6% 0.4x 28.4x 2.8x 2.7x 14.2x 13.2x
Exlservice Holdings, Inc. 58.32 97.5% 1,968 1,776 721 101 9.1% 9.1% 34.7% 14.0% 0.5x 32.6x 2.5x 2.4x 17.6x 13.3x
Huron Consulting Group Inc. 34.30 56.6% 728 1,116 732 112 3.9% 5.0% 39.8% 15.3% 3.6x 18.6x 1.5x 1.5x 10.0x 9.5x
CBIZ, Inc. 16.25 98.5% 878 1,089 831 92 6.6% 5.8% 12.6% 11.0% 2.3x 21.4x 1.3x 1.3x 11.9x 10.5x
Navigant Consulting Inc. 16.92 60.7% 791 969 948 132 12.6% 6.1% 33.1% 13.9% 1.4x 14.2x 1.0x 1.0x 7.3x 6.5x
Mean 8.2% 7.0% 32.0% 14.8% 1.6x 23.1x 1.8x 1.8x 12.2x 10.6x
Median 8.6% 6.1% 34.7% 14.0% 1.4x 21.4x 1.5x 1.5x 11.9x 10.5x

16
Healthcare I Industry Spotlight
Q3 2017
Operating & Trading Statistics ($ in millions, except per-share data)
Public Company Comparables
* Excluded from mean and median NA- Not Available NM – Not Meaningful E – Estimate Enterprise Value = Market Value of Equity + Book Value of Debt – Cash & Cash Equivalents Source: S&P Capital IQ
Stock % of 52- Enterprise Value /
Price at Week Market Enterprise LTM Financials Revenue Growth LTM Margins Debt / Price / Revenue EBITDA
9/29/17 High Cap Value Revenue EBITDA '15A - '16A '16A - '17E Gross EBITDA EBITDA Earnings LTM 2017E LTM 2017E
Healthcare Staffing
On Assignment, Inc. $53.68 96.7% $2,835 $3,395 $2,530 $263 18.2% 7.4% 32.6% 10.4% 2.2x 29.7x 1.3x 1.3x 12.9x 10.9x
AMN Healthcare Services, Inc. 45.70 99.5% 2,191 2,506 1,945 236 30.0% 6.0% 32.6% 12.1% 1.4x 21.3x 1.3x 1.2x 10.6x 9.8x
Cross Country Healthcare, Inc. 14.23 86.9% 519 521 854 39 8.6% 7.6% 26.6% 4.5% 0.9x NM 0.6x 0.6x 13.4x 0.0x *
Mean 18.9% 7.0% 30.6% 9.0% 1.5x 25.5x 1.1x 1.0x 12.3x 10.3x
Median 18.2% 7.4% 32.6% 10.4% 1.4x 25.5x 1.3x 1.2x 12.9x 10.3x
Managed Care
UnitedHealth Group Incorporated $195.85 97.6% $189,360 $210,546 $178,380 $15,567 17.7% 7.5% 23.5% 8.7% 2.1x 27.0x 1.2x 1.1x 13.5x 12.7x
Anthem, Inc. 189.88 95.4% 49,860 62,804 82,509 5,754 7.2% 2.4% 21.2% 7.0% 3.0x 20.6x 0.8x 0.7x 10.9x 12.4x
Aetna Inc. 159.01 96.7% 52,744 58,513 56,589 6,056 4.9% (4.0%) 26.6% 10.7% 1.5x 24.8x 1.0x 1.0x 9.7x 13.1x
Cigna Corporation 186.94 99.2% 47,067 48,278 35,519 4,212 4.7% 1.9% 32.1% 11.9% 1.1x 26.0x 1.4x 1.2x 11.5x 10.8x
Humana Inc. 243.63 93.8% 35,209 32,167 52,853 2,661 0.2% (0.8%) 17.2% 5.0% 1.9x NM 0.6x 0.6x 12.1x 9.1x
Centene Corporation 96.77 98.0% 16,690 17,188 41,416 2,186 77.0% 23.5% 18.7% 5.3% 2.2x 28.4x 0.4x 0.4x 7.9x 10.2x
WellCare Health Plans, Inc. 171.74 92.9% 7,644 4,793 15,361 623 2.5% 18.2% 14.6% 4.1% 1.9x 28.3x 0.3x 0.3x 7.7x 7.6x
Molina Healthcare, Inc. 68.76 94.5% 3,927 2,936 17,805 106 25.6% 11.7% 14.7% 0.6% 18.8x NM 0.2x 0.2x 27.7x * 7.0x
Mean 17.5% 7.5% 21.1% 6.7% 4.1x 25.8x 0.7x 0.7x 10.5x 10.4x
Median 6.0% 4.9% 20.0% 6.1% 2.0x 26.5x 0.7x 0.7x 10.9x 10.5x
Outsourced Pharmacy Management
Express Scripts Holding Company $63.32 81.7% $36,570 $49,210 $100,276 $7,160 (1.4%) 2.1% 8.6% 7.1% 2.1x 11.7x 0.5x 0.5x 6.9x 6.7x
PharMerica Corporation 29.30 99.7% 912 1,331 2,206 133 3.1% 12.3% 15.6% 6.0% 3.3x 42.5x 0.6x 0.6x 10.0x 9.6x
BioScrip, Inc. 2.75 80.2% 351 864 901 25 (4.7%) (4.4%) 28.4% 2.8% 19.0x * NM 1.0x 1.0x 34.5x * 17.9x *
Mean (1.0%) 3.3% 17.5% 5.3% 2.7x 27.1x 0.7x 0.7x 8.4x 8.1x
Median (1.4%) 2.1% 15.6% 6.0% 2.7x 27.1x 0.6x 0.6x 8.4x 8.1x
Physician Practice Management
Envision Healthcare Corporation $44.95 60.1% $5,361 $12,118 $6,038 $983 44.0% 185.3% 36.7% 16.3% 6.4x NM 2.0x 1.1x 12.3x 8.7x
MEDNAX, Inc. 43.12 59.8% 3,994 5,715 3,337 628 14.5% 10.7% 33.7% 18.8% 2.8x 12.4x 1.7x 1.6x 9.1x 8.0x
Birner Dental Management Services, Inc. 5.50 29.6% 10 19 60 1 (3.3%) NA 9.4% 1.6% 9.3x NM 0.3x NA 19.8x NA
Mean 18.4% 98.0% 26.6% 12.2% 6.2x 12.4x 1.3x 1.4x 13.7x 8.4x
Median 14.5% 98.0% 33.7% 16.3% 6.4x 12.4x 1.7x 1.4x 12.3x 8.4x
Specialty Managed Care
Magellan Health, Inc. $86.30 99.5% $2,043 $2,403 $5,280 $243 5.2% 21.3% 5.9% 4.6% 2.6x 26.8x 0.5x 0.4x 9.9x 7.2x
CorVel Corporation 54.40 97.2% 1,020 985 528 71 3.0% NA 20.2% 13.4% 0.0x 38.1x 1.9x NA 13.9x NA
Mean 4.1% 21.3% 13.0% 9.0% 1.3x 32.4x 1.2x 0.4x 11.9x 7.2x
Median 4.1% 21.3% 13.0% 9.0% 1.3x 32.4x 1.2x 0.4x 11.9x 7.2x
Specialty Pharmacy
Diplomat Pharmacy, Inc. $20.71 70.5% $1,408 $1,533 $4,531 $70 31.0% 2.7% 7.4% 1.6% 1.9x 49.3x 0.3x 0.3x 21.7x 15.6x

17
Healthcare I Industry Spotlight
Q3 2017
Operating & Trading Statistics ($ in millions, except per-share data)
Public Company Comparables
* Excluded from mean and median NA- Not Available NM – Not Meaningful E – Estimate Enterprise Value = Market Value of Equity + Book Value of Debt – Cash & Cash Equivalents Source: S&P Capital IQ
Stock % of 52- Enterprise Value /
Price at Week Market Enterprise LTM Financials Revenue Growth LTM Margins Debt / Debt / Revenue EBITDA
9/29/17 High Cap Value Revenue EBITDA '15A - '16A '16A - '17E Gross EBITDA EBITDA Cap LTM 2017E LTM 2017E
Acute Care
HCA Holdings, Inc. $79.59 87.4% $28,752 $61,377 $42,267 $8,203 4.6% 4.3% 37.7% 19.4% 3.9x 123.0% 1.5x 1.4x 7.5x NM
Tenet Healthcare Corp. 16.43 68.1% 1,656 18,799 19,324 2,074 5.3% 1.0% 36.4% 10.7% 7.3x 80.9% 1.0x 0.9x 9.1x 7.4x
Community Health Systems, Inc. 7.68 65.4% 860 15,523 17,478 1,780 (5.1%) (13.3%) 36.9% 10.2% 8.3x 84.1% 0.9x 1.0x 8.7x 7.6x
LifePoint Health, Inc. 57.90 81.6% 2,323 5,262 6,416 760 22.0% 3.2% 32.4% 11.9% 3.8x 55.3% 0.8x 0.8x 6.9x 6.6x
Mean 6.7% (1.2%) 35.9% 13.0% 5.8x 85.8% 1.0x 1.0x 8.0x 7.2x
Median 4.9% 2.1% 36.6% 11.3% 5.6x 82.5% 0.9x 1.0x 8.1x 7.4x
Alternative Site
HEALTHSOUTH Corp. $46.35 93.2% $4,576 $7,604 $3,773 $817 17.0% 7.6% 41.7% 21.7% 3.3x 65.2% 2.0x 1.9x 9.3x 9.4x
Select Medical Holdings Corporation 19.20 98.0% 2,552 5,838 4,258 475 14.5% 5.9% 18.4% 11.2% 5.9x 68.7% 1.4x 1.3x 12.3x 10.7x
Surgery Partners, Inc. 10.35 43.0% 505 2,759 1,135 162 NM 12.5% 26.8% 14.3% 11.3x 93.7% 2.4x 2.2x 17.0x 13.6x
US Physical Therapy Inc. 61.45 78.8% 773 925 363 51 7.8% 10.9% 24.4% 14.1% 1.5x 28.2% 2.5x 2.4x 18.1x 15.8x
Medical Facilities Corp. 12.47 66.5% 386 531 372 97 9.9% 11.5% 42.4% 26.1% 1.6x 40.7% 1.4x 1.4x 5.5x * 5.3x *
Adeptus Health Inc. 1.22 2.8% 20 260 404 38 73.1% 36.5% 9.3% 4.3x 31.8% 0.6x NA 6.9x NA
Nobilis Health Corp. 1.50 40.7% 117 191 313 34 NM 13.8% 62.6% 10.7% 2.7x 36.7% 0.6x 0.6x 5.7x * 4.6x *
Mean 24.5% 10.4% 36.1% 15.3% 4.3x 52.1% 1.6x 1.6x 12.7x 12.4x
Median 14.5% 11.2% 36.5% 14.1% 3.3x 40.7% 1.4x 1.7x 12.3x 12.1x
Behavioral
Universal Health Services Inc. $110.94 85.5% $10,613 $14,733 $10,111 $1,711 8.0% 9.1% 42.5% 16.9% 2.4x 16.9% 1.5x 1.4x 8.6x 8.2x
Acadia Healthcare Company, Inc. 47.76 87.9% 4,197 7,411 2,833 575 56.6% 2.4% 41.0% 20.3% 5.7x 20.3% 2.6x 2.6x 12.9x 11.8x
AAC Holdings, Inc. 9.93 49.7% 239 429 258 30 33.0% 15.9% 35.9% 11.7% 7.1x 11.7% 1.7x 1.4x 14.3x 8.2x
Mean 32.6% 9.1% 39.8% 16.3% 5.1x 16.3% 1.9x 1.8x 11.9x 9.4x
Median 33.0% 9.1% 41.0% 16.9% 5.7x 16.9% 1.7x 1.4x 12.9x 8.2x
Clinical Labs
Laboratory Corp. of America Holdings $150.97 91.9% $15,369 $21,213 $9,667 $1,859 11.0% 5.3% 33.7% 19.2% 3.3x 53.9% 2.2x 2.1x 11.4x 10.3x
Quest Diagnostics Inc. 93.64 82.9% 12,773 16,389 7,588 1,444 0.3% 2.1% 38.7% 19.0% 2.6x 44.6% 2.2x 2.1x 11.3x 10.6x
Sonic Healthcare Limited 16.40 85.1% 6,889 8,832 3,931 637 5.2% 3.8% 33.3% 16.2% 3.5x 46.9% 2.2x 2.2x 13.9x 12.3x
Genomic Health Inc. 32.09 94.5% 1,112 1,002 334 3 14.1% 9.8% 81.5% 0.8% NM NM 3.0x 2.8x 384.3x * 89.9x *
Psychemedics Corp. 18.43 65.8% 101 100 43 14 44.5% NA 55.0% 32.6% 0.1x 8.5% 2.3x NA 7.2x NA
Mean 15.0% 5.2% 48.4% 17.6% 2.4x 38.5% 2.4x 2.3x 11.0x 11.1x
Median 11.0% 4.6% 38.7% 19.0% 3.0x 45.7% 2.2x 2.2x 11.4x 10.6x
Diagnostic Imaging
RadNet, Inc. 11.55 97.1% 546 1,169 798 118 9.3% NA 20.7% 14.8% 5.3x 91.1% 1.5x 1.3x 9.9x 8.3x
Mean 9.3% NA 20.7% 14.8% 5.3x 91.1% 1.5x 1.3x 9.9x 8.3x
Median 9.3% NA 20.7% 14.8% 5.3x 91.1% 1.5x 1.3x 9.9x 8.3x

18
Healthcare I Industry Spotlight
Q3 2017
Operating & Trading Statistics ($ in millions, except per-share data)
Public Company Comparables
* Excluded from mean and median NA- Not Available NM – Not Meaningful E – Estimate Enterprise Value = Market Value of Equity + Book Value of Debt – Cash & Cash Equivalents Source: S&P Capital IQ
Stock % of 52- Enterprise Value /
Price at Week Market Enterprise LTM Financials Revenue Growth LTM Margins Debt / Debt/ Revenue EBITDA
9/29/17 High Cap Value Revenue EBITDA '15A - '16A '16A - '17E Gross EBITDA EBITDA Cap LTM 2017E LTM 2017E
Dialysis
Fresenius Medical Care AG & Co. KGAA $97.94 93.0% $30,054 $39,591 $19,570 $3,572 7.0% 5.1% 33.9% 18.3% 2.6x 43.2% 2.0x 2.1x 11.1x 10.8x
DaVita HealthCare Partners Inc. 59.39 84.6% 11,355 20,722 13,777 2,448 7.0% 3.6% 27.7% 17.8% 3.7x 60.9% 1.5x 1.4x 8.5x 8.4x
American Renal Associates Holdings, Inc. 14.97 58.9% 468 1,136 755 150 14.8% 4.6% 39.7% 19.9% 3.8x 78.7% 1.5x 1.4x 7.6x NM
Mean 9.6% 4.4% 33.8% 18.6% 3.3x 60.9% 1.7x 1.6x 9.0x 9.6x
Median 7.0% 4.6% 33.9% 18.3% 3.7x 60.9% 1.5x 1.4x 8.5x 9.6x
Post-Acute
Brookdale Senior Living Inc. $10.60 59.9% $1,975 $6,982 $4,078 $759 0.0% 9.5% 34.0% 18.6% 6.8x 63.9% 1.7x 1.5x 9.2x 10.2x
Genesis Healthcare, Inc. 1.16 24.4% 110 4,795 5,453 450 1.9% (2.8%) 40.1% 8.3% 11.2x 117.1% * 0.9x 0.9x 10.6x 8.6x
Kindred Healthcare Inc. 6.80 57.1% 592 3,914 7,081 471 2.3% (0.8%) 42.6% 6.6% 7.1x 77.7% 0.6x 0.5x 8.3x 4.3x
Chemed Corp. 202.05 93.5% 3,231 3,342 1,617 227 2.2% 3.9% 29.3% 14.0% 0.6x 19.8% 2.1x 2.0x 14.8x 13.3x
Amedisys Inc. 55.96 84.9% 1,895 1,928 1,455 106 12.0% 7.3% 41.2% 7.3% 0.9x 16.5% 1.3x 1.3x 18.2x * 13.7x
LHC Group, Inc. 70.92 99.0% 1,297 1,416 962 92 12.9% 12.2% 38.0% 9.6% 0.9x * 16.9% 1.5x 1.4x 15.4x 15.6x
The Ensign Group, Inc. 22.59 96.7% 1,149 1,401 1,751 122 23.3% 7.6% 11.4% 7.0% 2.4x 39.3% 0.8x 0.8x 11.5x 8.0x
Capital Senior Living Corp. 12.55 70.2% 381 1,375 458 78 8.5% 6.8% 41.9% 17.0% 13.0x 95.7% 3.0x 2.9x 17.7x 13.5x
Civitas Solutions, Inc. 18.45 88.0% 689 1,297 1,456 150 3.0% 7.7% 22.2% 10.3% 4.2x 80.1% 0.9x 0.9x 8.6x 7.8x
Almost Family Inc. 53.70 85.3% 750 899 716 40 17.2% NA 46.2% 5.6% 3.3x 23.3% 1.3x 1.1x 22.3x * 12.2x
National HealthCare Corporation 62.57 79.2% 951 891 902 102 2.2% NA 40.9% 11.3% 1.5x 18.1% 1.0x NA 8.8x NA
Providence Service Corp. 54.08 98.3% 730 752 1,606 68 6.8% (2.4%) 8.6% 4.2% 0.0x 0.8% * 0.5x 0.5x 11.0x 12.2x
Addus HomeCare Corporation 35.30 86.6% 406 434 411 33 19.0% 6.3% 26.5% 8.1% 1.3x 23.9% 1.1x 1.0x 13.0x 12.2x
Diversicare Healthcare Services Inc. 11.50 89.7% 74 162 516 26 NM NA NM 5.0% 3.5x 100.5% 0.3x * NA 6.2x NA
AdCare Health Systems, Inc. 0.91 41.4% 18 153 26 11 48.6% NA 100.0% 43.3% 6.7x 71.7% 6.0x NA 13.8x NA
Five Star Quality Care Inc. 1.55 51.0% 78 118 1,130 13 0.3% NA 51.6% 1.2% 4.5x 26.5% 0.1x 0.1x 9.0x 6.6x
Mean 10.7% 5.0% 38.3% 11.1% 4.5x 48.1% 1.5x 1.1x 11.3x 10.6x
Median 6.8% 6.8% 40.1% 8.2% 3.5x 32.9% 1.1x 1.0x 10.8x 12.2x

19
Healthcare I Industry Spotlight
Q3 2017 Notes & Definitions
S&P 500 Index- A broad index that includes American Companies. EBITDA- A company's earnings before interest, taxes, depreciation, and amortization, is an accounting measure calculated using a company's net earnings, before interest expenses, taxes, depreciation and amortization are subtracted, as a proxy for a company's current operating profitability. Dry Powder- Refers to cash reserves kept on hand to cover future obligations or to purchase assets. GDP- Gross domestic product is the market value of the goods and services produced by labor and property located in the United States Consumer Sentiment Index- The University of Michigan Consumer Sentiment Index is a consumer confidence index published monthly by the University of Michigan. The index is normalized to have a value of 100 in December 1964 National Unemployment Rate- the percentage of the total labor force that is unemployed but actively seeking employment and willing to work. Non-Farm Payroll- Nonfarm payroll employment is a compiled name for goods, construction and manufacturing companies in the US. It does not include farm workers, private household employees, non-profit organization employees, or government employees . It is an economic indicator released monthly by the United States Department of Labor as part of a comprehensive report on the state of the labor market. Housing Starts- are the number of new residential construction projects that have begun during any particular month. The Economist- offers authoritative insight and opinion on international news, politics, business, finance, science, technology and the connections between them LBO -- leveraged buyout (LBO) is the acquisition of another company using a significant amount of borrowed money to meet the cost of acquisition. The assets of the company being acquired are often used as collateral for the loans, along with the assets of the acquiring company. Industrial Production Index (IPI)- is an economic indicator published by the Federal Reserve Board of the United States that measures the real production output of manufacturing, mining, and utilities Capital Goods Orders. Covenant-lite loans- means that debt is being issued, both personally and commercially, to borrowers with less restrictions on collateral, payment terms, and level of income. IRR-Internal Rate of Return.

20
Are Not FDIC Insured Offer No Bank Guarantee May Lose Value
Are Not Insured By Any Federal Government Agency Are Not A Deposit
About Fifth Third Capital Markets
Fifth Third Capital Markets is the marketing name under which Fifth Third Bank and its subsidiary, Fifth Third Securities, Inc., provide certain securities and investment banking products and services. Banking products and services are offered by Fifth Third Bank. Securities products and services are offered by licensed securities representatives of Fifth Third Securities, Inc., who may be employees of Fifth Third Bank. Important notice This document has been prepared by Fifth Third Bank (“Fifth Third”) or one of its subsidiaries for the sole purpose of providing a proposal to the parties to whom it is addressed in order that they may evaluate the capabilities of Fifth Third to supply the proposed services. It is not intended to provide specific investment advice or investment recommendations and does not constitute either a commitment to enter into a specific transaction or an offer or solicitation, with respect to the purchase or sale of any security. The information contained in this document has been compiled by Fifth Third and includes material which may have been obtained from information provided by various sources and discussions with management but has not been verified or audited. This document also contains confidential material proprietary to Fifth Third. Except in the general context of evaluating our capabilities, no reliance may be placed for any purposes whatsoever on the contents of this document or on its completeness. No representation or warranty, express or implied, is given and no responsibility or liability is or will be accepted by or on behalf of Fifth Third or by any of its subsidiaries, members, employees, agents or any other person as to the accuracy, completeness or correctness of the information contained in this document or any other oral information made available and any such liability is expressly disclaimed. This document and its contents are confidential and may not be reproduced, redistributed or passed on, directly or indirectly, to any other person in whole or in part without our prior written consent. Past performance is No Guarantee of Future Results. Fifth Third Capital Markets is a wholly owned subsidiary of Fifth Third Bank offering investment banking++, debt capital markets+, bond capital markets++, equity capital markets++, financial risk management+, and fixed income sales and trading++. Fifth Third Bank provides access to investments and investment services through various subsidiaries, including Fifth Third Securities. Fifth Third Securities is the trade name used by Fifth Third Securities, Inc., member FINRA/SIPC, a registered broker-dealer and registered investment advisor registered with the U.S. Securities and Exchange Commission (SEC). Registration does not imply a certain level of skill or training. Securities and investments offered through Fifth Third Securities, Inc. and insurance products: + Services and activities offered through Fifth Third Bank ++ Services and activities offered through Fifth Third Securities, Inc. © Fifth Third Bank 2017