INVESTIGATIONS OF AQUACULTURE … › islandora › object › etd:3566 › ...Streamside rearing...
124
INVESTIGATIONS OF AQUACULTURE METHODOLOGIES TO ENHANCE SUCCESS OF GREAT LAKES LAKE STURGEON STREAMSIDE FACILITIES By John Matthew Bauman A THESIS Submitted to Michigan State University in partial fulfillment of the requirements for the degree of Fisheries and Wildlife - Master of Science 2015
Transcript of INVESTIGATIONS OF AQUACULTURE … › islandora › object › etd:3566 › ...Streamside rearing...

INVESTIGATIONS OF AQUACULTURE METHODOLOGIES TO ENHANCE SUCCESS
OF GREAT LAKES LAKE STURGEON STREAMSIDE FACILITIES
By
John Matthew Bauman
A THESIS
Submitted to
Michigan State University
in partial fulfillment of the requirements
for the degree of
Fisheries and Wildlife - Master of Science
2015

ABSTRACT
INVESTIGATIONS OF AQUACULTURE METHODOLOGIES TO ENHANCE SUCCESS
OF GREAT LAKES LAKE STURGEON STREAMSIDE FACILITIES
By
John Matthew Bauman
Streamside rearing facilities (SRFs) have been widely advocated in the Great Lakes basin
as the preferred method of culturing Lake Sturgeon in situations where restoration goals to
enhance or repatriate populations can be met by stocking. However, over the past decade,
targeted stocking goals have been difficult to achieve due in large part to low survival and low
growth during early life periods. This study examined three specific early life periods
encountered during streamside operation (egg, free-embryo, and larval) and aimed to quantify
the effects of different methodologies on the body size and survival of lake sturgeon in a SRF.
Information collected during the egg period provides insight regarding the use of different egg
chemotherapeutants, de-adhesion and incubation procedures, as well as the documentation of
microbial community composition on lake sturgeon egg surfaces. At the free-embryo period, the
effects of rearing density and family on body size and survival in association with dissolved
oxygen concentration were quantified to the time of emergence. Feeding regimes, as well as the
effects of different weekly prophylactic chemotherapeutants were quantified during the larval
period. This investigation at multiple life periods highlights methods that improve survival and
growth, as well as serves as a tool for the development of standard operating procedures for
SRFs geared to enhance current production and recovery of the Great Lakes Lake Sturgeon.

Copyright by
JOHN MATTHEW BAUMAN
2015

iv
TABLE OF CONTENTS
LIST OF TABLES………………………………………………………………………….viii
LIST OF FIGURES ………...………………………………………………………………x
THESIS INTRODUCTION ………………………………………………………………...1
LITERATURE CITED ……………………………………………………………………...4
CHAPTER I: EFFECTS OF DE-ADHESION METHOD AND INCUBATION CONDITION
ON BODY SIZE, SURVIVAL, OXYGEN CONSUMPTION RATE, AND MICROBIAL
COMMUNITY COMPOSITION OF LAKE STURGEON EGG SURFACE
…….……………………………………………………………………………………….6
ABSTRACT ……………………………………………………………………….6
INTRODUCTION …………………………………………………………………7
METHODS ………………………………………………………………………10
Study site ………………………………………………………………………10
Gamete collection, fertilization, and incubation ………………………...……10
Experimental treatments ………………………………………………...………10
De-adhesion treatment. – ………………………………………………...………11
Clay (Fuller’s Earth) de-adhesion. – ……………………………………11
Tannic acid de-adhesion. – ……………………………………………11
Control de-adhesion. – …………………………………………………….12
Incubation treatment. – …………………………………………………………12
Mini egg-hatching jar. – …………………………………………………..12
Heath tray. – ……………………………………………………………….12
Data collection …………………………………………………………………….13
Body size. – ………………………………………………………………………..13
Survival. – …………………………………………………………………………13
Oxygen consumption rate. – ……………………………………………………..13
Daily egg chemotherapeutant ……………………………………………………14
Microbial DNA extraction ……………………………………………………….14
Processing 16S microbial sequencing data ……………………………………15
Statistical analysis ………………………………………………………………15
RESULTS ………………………………………………………………………16
Effects of de-adhesion method and incubation conditions on body size and survival
……………………………………………………………………………………...16
Total length at hatch. – …………………………………………..…………….…16
Yolk-sac area at hatch. – …………………………………………………………16
Body area at hatch. – ……………………………….………………………….…16
Survival at hatch. – ……………………………………….………………………17
Effects of de-adhesion method and incubation conditions on oxygen consumption
rate ………………………………………………………………………………...18
Developmental period 1. – ……………………………………………………….18

v
Developmental period 2. – ……………………………………………………….18
Effects of de-adhesion method and incubation conditions on microbial diversity
……………………………………………………………………………………..19
Alpha-diversity. – ………………………………………………………………...19
Developmental period 1. – ………………………………………………...19
Developmental period 2. – ………………………………………………...20
Beta-diversity. – …………………………………………………………………..24
Developmental period 1. – ………………………………………………...24
Developmental period 2. – ………………………………………………...24
DISCUSSION ……………………………………………………………………..26
Effects of de-adhesion method and incubation conditions on body size and survival
……………………………………………………………………………………..26
Body size at hatch. – ……………………………………………………………...26
Egg Survival. – ……………………………………………………………………26
Effects of de-adhesion method and incubation conditions on oxygen consumption
rate ………………………………………………………………………………...28
Effects of de-adhesion method and incubation conditions on microbial diversity
……………………………………………………………………………………28
Conclusions ……………………………………………………………………….29
LITERATURE CITED ……………………………………………………………31
CHAPTER II: EFFECTS OF EGG CHEMOTHERAPEUTANTS ON BODY SIZE,
SURVIVAL, OXYGEN CONSUMPTION RATE, AND MICROBIAL DIVERSITY, OF FISH
EGGS. ………………………………………………………………………………….34
ABSTRACT ……………………………………………………………………34
INTRODUCTION ……………………………………………………………...….35
METHODS ………………………………………………………………………..38
Study site ………………………………………………………………………38
Gamete collection, fertilization, and incubation ……………………………......38
Experimental chemotherapeutant treatments …………………………………39
Data collection ……………………………………………………………………39
Body size. – ……………………………………………………………………….39
Survival. – ………………………………………………………………………...39
Oxygen measurement. – ……………………………………………………….39
Microbial DNA extraction ……………………………………………………….40
Processing16S sequencing data ………………………………………………….41
Statistical Analysis ……………………………………………………………….41
RESULTS ………………………………………………………………………43
Effects of chemotherapeutants on body size at hatch ………………………….43
Effects of chemotherapeutants on survival at hatch …………………………...43
Effects of chemotherapeutants on embryo oxygen consumption ……………...43
Effects of chemotherapeutants on microbial alpha-diversity ………………….44
Effects of chemotherapeutants on microbial beta-diversity …………………...47
DISCUSSION ……………………………………………………………………..49
Impact of chemotherapeutants on body size, survival, and oxygen consumption
……………………………………………………………………………………..49

vi
Body size at hatch. – ……………………………………………………………...49
Egg survival. – ……………………………………………………………………50
Oxygen consumption rate. – …………………………………………………......50
Impacts of chemotherapeutants on egg microbial diversity …………………...51
Conclusions ……………………………………………………………………….52
LITERATURE CITED …………………………………………………………….53
CHAPTER III: EFFECTS OF REARING DENSITY ON BODY SIZE AND SURVIVAL OF
LAKE STURGEON (ACIPENSER FULVESCENS) FREE-EMBRYOS.…………….….57
ABSTRACT. ……………………………………………………………………....57
INTRODUCTION …………………………………………………………………58
METHODS ………………………………………………………………………60
Study site ………………………………………………………………………...60
Fertilization and incubation ……………………………………………………..60
Experimental treatments ………………………………………………………...61
Statistical analysis ………………………………………………………………...62
RESULTS …………………………………………………………………………63
Effects of rearing density and family on body size at emergence ……………...63
Effects of rearing density and family on dissolved oxygen concentration …….64
Effects of rearing density and family on survival to emergence ………………65
DISCUSSION …………………………………………………………………......66
Effects of density on body size, dissolved oxygen concentration, and survival
……………………………………………………………………………………..66
Body size. – ……………………………………………………………………….66
Dissolved oxygen. – ………………………………………………………………67
Survival. – ………………………………………………………………………...67
Effects of family on body size, dissolved oxygen, and survival ………………...68
Body size, dissolved oxygen, and survival. – ……………………………………68
LITERATURE CITED …………………………………………………………...69
CHAPTER IV: BODY SIZE AND SURVIVAL OF HATCHERY- AND WILD-PRODUCED
LARVAE AS A FUNCTION OF FEEDING FREQUENCY AND ALTERNATE FOOD TYPE
…………………………………………………………………………………..................72
ABSTRACT ………………………………………………………………….........72
INTRODUCTION ……………………………………………………………........73
METHODS ……………………………………………………………………….77
Study site ………………………………………………………………………77
Feeding rate ……………………………………………………………………77
Experimental treatments ………………………………………………………78
Collection, fertilization, and incubation of hatchery-produced larvae. – ….....78
Feeding frequency with hatchery-produced larvae 2013. – ……………79
Alternate food types with hatchery-produced larvae 2013. – ………...79
Collection of wild-produced larvae. – …………………………………………80
Alternate food types with wild-caught larvae 2014. – …………………80
Statistical analysis ………………………………………………………………81
RESULTS ……………………………………………………………………….82

vii
Feeding frequency with hatchery-produced larvae in 2013 …………………82
Total length at 30 days post-exogenous feeding. – ……………………………82
Weight per fish at 30 days post-exogenous feeding. – ……………………….....82
Survival at 30 days post-exogenous feeding. – ………………………………83
Alternate food types with hatchery-produced larvae 2013 ……………………83
Weight per fish at 14 days post-exogenous feeding. – …………………………83
Survival at 14 days post-exogenous feeding. – ……………………………….....84
Alternate food types with wild-caught larvae 2014 ……………………………85
Weight per fish at 14 days post-exogenous feeding. – …………………………85
Survival at 14 days post-exogenous feeding. – …………………………………85
DISCUSSION ……………………………………………………………………..87
Feeding frequency with hatchery-produced larvae 2013 ………………………87
Alternate food types with hatchery-produced larvae 2013 …………………….89
Alternate food types with wild-produced larvae 2014 …………………………90
Survival of larvae in feeding frequency and alternate food type experiments .91
Conclusions ……………………………………………………………………….92
LITERATURE CITED ……………………………………………………………93
CHAPTER V: SURVIVAL OF LAKE STURGEON AS A FUNCTION OF DIFFERENT
CHEMOTHERAPEUTANT PROPHYLACTICS. ………………………………………..98
ABSTRACT ……………………………………………………………………….98
INTRODUCTION …………………………………………………………………99
METHODS …………………………………………………………...…………..102
Study site …………………………………………………………………………102
Study fish ……………………………………………………………………….102
Hatchery-produced larvae gamete collection, fertilization and incubation. –
……………………………………………………………………………………102
Wild naturally-produced larvae field collection and incubation. – ………….103
Egg incubation and chemical treatment ………………………………………103
Experimental treatments ……………………………………………………...103
Statistical analysis ………………………………………………………………106
RESULTS ………………………………………………………………………107
Survival at 35 days (49 days post-exogenous feeding) ………………………...107
DISCUSSION ……………………………………………………………………108
Conclusions ……………………………………………………………………...110
LITERATURE CITED …………………………………………………………111

viii
LIST OF TABLES
Table 1. Lake sturgeon mean (±SE) body size (total length (TL), yolk-sac area (YSA), and body
area (BA)), and proportional survival to hatch as a function of de-adhesion and incubation
treatment. Identical lowercase letters within columns represent treatments that are not
significantly different (Tukey-Kramer, P < 0.05)…………………………………………17
Table 2. Lake sturgeon mean (±SE) body size (total length (TL), yolk-sac area (YSA), and body
area (BA)), and proportional survival to hatch as a function of family. Identical lowercase letters
within columns represent treatments that are not significantly different (Tukey-Kramer, P <
0.05)…………………………………………….…………………………………………18
Table 3. Lake Sturgeon mean (±SE) egg oxygen consumption rate at two developmental periods
(30 to 36 CTU and 55 to 67 CTU; Kempinger 1988) as a function of different de-adhesion
methods and incubation conditions………………..……………………………………….19
Table 4. Mean (±SE) alpha diversity (Simpson’s and Shannon diversity) of lake sturgeon egg
microbial communities at two developmental periods (Development period 1 30 to 36 CTU and
development period 2 55 to 67 CTU; Kempinger 1988) and de-adhesion and incubation mehods.
Identical lowercase letters within columns represent treatments that are not significantly different
(Tukey-Kramer, P < 0.05)……………………... …………………………………………22
Table 5. Mean (±SE) Bray-Curtis dissimilarity index of lake sturgeon egg microbial community
as a function of development period (Development period 1 30 to 36 CTU and development
period 2 55 to 67 CTU; Kempinger 1988), de-adhesion and incubation ………………….24
Table 6. Lake Sturgeon mean (±SE) body size (total length (TL), yolk-sac area (YSA), and body
area (BA)), and proportional survival at hatch as well as oxygen consumption rate at two
developmental periods (Development period 1 30 to 36 CTU and development period 2 55 to 67
CTU; Kempinger 1988)………………………... …………………………………………44
Table 7. Microbial alpha diversity estimated for lake sturgeon eggs exposed to different
chemotherapeutants at two developmental periods (Development period 1 30 to 36 CTU and
development period 2 55 to 67 CTU; Kempinger 1988). Alpha diversity indices include
Simpson, Shannon diversity indices (Simpson’s and Shannon diversity indices; mean
(±SE))………………………………………….. …………………………………………45
Table 8. Mean (±SE) Bray-Curtis dissimilarity index of lake sturgeon egg microbial community
as a function of development period (Development period 1 30 to 36 CTU and development
period 2 55 to 67 CTU; Kempinger 1988) and chemotherapeutant……………….………48
Table 9. Lake sturgeon mean (±SE) body size (mm) differs at emergence as a function of rearing
density (individuals per tank) and between families. Fixed effects with identical lowercase
letters are not significantly different (Tukey-Kramer, P < 0.05) ……………….…………64

ix
Table 10. Mean (±SE) dissolved oxygen concentration (mg/L) as a function of rearing density
(individuals per tank) and family. Fixed effects (density and family) with identical lowercase
letters are not significantly different (Tukey-Kramer, P < 0.05) ……………….…………65
Table 11. Mean (±SE) proportional survival to emergence as a function of rearing density
(individuals per tank) and family. Fixed effects with identical lowercase letters are not
significantly different (Tukey-Kramer, P < 0.05) ……………….………………………...65
Table 12. Hatchery produced larvae: mean total length (mm ±SE), weight per fish (g ±SE), and
proportional survival (±SE) at 30 days post-exogenous feeding as a function of feeding
frequency and family. Response variables within the same column followed by similar
lowercase letters are not significantly different (P < 0.05) ……………….……………….83
Table 13. Hatchery produced larvae: mean weight per fish ((g) ±SE) and proportional survival
(±SE) at 30 days post-exogenous feeding as a function of food type and family. Response
variables within the same column followed by similar lowercase letters are not significantly
different (P < 0.05) ……………….……………………………………………………….84
Table 14. Wild-produced larvae: mean weights per fish ((g) ±SE) and proportional (±SE)
survival at 14 days post-exogenous feeding as a function of food type portioned by recommend
%BWD. Response variables within the same column followed by similar lowercase letters are
not significantly different (P < 0.05) ……………………………………………………...86
Table 15. Mean number of fish surviving each week and proportional survival (±SE) at the end
of this study as a function of different commonly used chemotherapeutant prophylactics. CT =
60 min, 15 ppm chloramine-T bath, H2O2 = 15 min, 60 ppm H2O2 bath, NaCl- & H2O2 = 3 parts
per thousand (ppt) NaCl- bath for 15 min followed 24 hr later by a 15 min, 60 ppm H2O2 bath,
and Control = no chemical treatment). Identical lower-case letters in the same column are not
significantly different (Tukey-Kramer, P < 0.05)………………………………………..107

x
LIST OF FIGURES
Figure 1. Microbial phylotype mean proportional abundance as a function of embryonic
development time and de-adhesion and incubation treatment. Thirty major phylotypes
represented in the community sample based on 5 percent contribution to total operational
taxonomic units. Each unique color represents a unique species phylotype based on 97%
similarity of operational taxonomic units………………………………………………….23
Figure 2. Neighbor-joining tree construct using Bray-Curtis dissimilarity for lake sturgeon egg
microbial communities as a function of embryonic development period (Development period 1
30 to 36 CTU and development period 2 55 to 67 CTU; Kempinger 1988) and de-adhesion and
incubation conditions………………………………………………………………………25
Figure 3. Microbial phylotype mean proportional abundance as a function of embryonic
development time and chemotherapeutant treatment. Thirty major phylotypes represented in the
community sample based on 5 percent contribution to total operational taxonomic units. Each
unique color represents a unique species phylotype based on 97% similarity of operational
taxonomic unit……….…..…………………………………………………………………47
Figure 4. Neighbor-joining tree construct using Bray-Curtis dissimilarity for lake sturgeon egg
microbial communities as a function of embryonic development period (Development period 1
30 to 36 CTU and development period 2 55 to 67 CTU; Kempinger 1988), and
chemotherapeutant treatment………………………………………………………………48
Figure 5. Experimental design of larval chemotherapeutant study. Each 1.2 m diameter tank held
separate, 400 fish from hatchery- and wild naturally-produced fish which were split into four
tanks and sub-divided into eight equal-sized sections (50 fish per section). Each partition was
randomly assigned to one of four weekly treatment types, each with two replicates.
Chemotherapeutant treatments included: 1) 60 min, 15 ppm CT bath, 2) 15 min, 60 ppm H2O2,
3) 3 parts per thousand (ppt) NaCl- bath for 15 min followed 24 hr later by a 15 min, 60 ppm
H2O2 bath, and 4) a control (no chemical treatment). Arrows indicate water flow………105

1
THESIS INTRODUCTION
High mortality during early life periods can reduce rates of recruitment for many fish
species, compromising recovery efforts using aquaculture and stocking as primary means of
recovery. As a result, aquaculture methods (i.e., chemical treatments, de-adhesion procedures,
feeding regimes) that address stage-specific life-history characteristics (e.g., egg adhesion) that
hinder hatchery success have been employed to increase growth and survival during early life
periods. However, the direct and indirect effects of these aquaculture practices on growth and
survival of developing embryos to hatch and on through subsequent life periods is understudied
and thus needs further investigation, especially for species of conservation concern such as
Sturgeons (Acipenseridae).
According to the International Union for Conservation of Nature (IUCN), 85% of the
world’s Sturgeons (Acipenseridae) are in danger of extinction (IUCN, 2010). The decline and
persistent low abundance of sturgeon populations worldwide have been attributed to several
anthropogenic factors including over-fishing, poaching, habitat degradation, and discontinuity of
migration routes utilized for reproduction (Auer and Dempsey 2013). In North America, there
are nine species of sturgeon, all of which are protected and have either continued to decline in
number or have remained constant at low levels of abundance for the past 25 years (FishBase
2013).
As a result of sturgeons’ imperiled status, agencies have begun assessing and
enumerating localized populations to evaluate viable recovery options. However, life-history
traits (e.g., spawning periodicity, late maturity, spawning site fidelity) of sturgeons make
recovery goals expensive and difficult to attain in time periods that are consistent with

2
management goals. Also, there is concern regarding stocking and the negative effects associated
with out-breeding depression when non-natal brood sources are used. For Lake Sturgeon
(Acipenser fulvescens), Welsh et al. (2010) provided genetically-based guidelines for Great
Lakes recovery programs involving stocking. These guidelines provide genetic decision-trees
for managers focused on recovery of remnant populations or repatriation of extirpated Great
Lakes sturgeon populations. Choosing brood-source populations within a specified genetic
management region increases the likelihood that biological attributes (e.g., river-imprinting,
temperature regimes) related to fitness are maintained and deleterious effects avoided (Welsh et
al. 2010).
Since 2004, the use of streamside rearing facilities (SRFs) has been widely advocated in
the Great Lakes basin as the preferred method for culturing lake sturgeon in situations where
restoration goals to enhance or repatriate populations can be met by stocking (Holtgren et al.
2007). SRFs utilize a flow-through natal water source, believed to improve fitness of progeny
and in turn maximize the probability of imprinting, compared to traditional hatcheries which use
non-natal well-water for rearing (Pepper 1992, Travis et al. 1998, Flagg and Nash 1999, Holtgren
et al. 2007, Crossman 2011). The use of SRFs pose challenges which include increased exposure
to fish pathogens and extreme temperature fluctuations during early development when mortality
is already especially high. SRFs have been used for nearly a decade, however, targeted stocking
goals have been difficult to achieve when SRFs are used, due in large part to high mortality rates
during early life periods. Information pertaining to optimal rearing strategies during early life
periods in SRFs do not exist and if evaluated may improve production results for lake sturgeon in
the Great Lakes.

3
The need for quantitative evaluation of currently SRFs rearing methodologies is the focus
of my thesis which encompasses multiple life periods during the rearing period. For example,
during embryogensis there are properties (i.e, egg adhesion) and behavioral traits (i.e., phototaxis
and crowding) exhibited, while advantages in riverine environments can reduce success of
hatchery propagation. The effects of these different embryonic rearing conditions (i.e.,
mechanical and chemical egg de-adhesion, egg incubation) on potentially symbiotic or
pathogenic microbial communities is also a focus of this study which may provide insight
regarding potential mechanisms effecting growth and survival to hatch. Also, feeding regimes
(i.e., feeding frequency, food type) employed during the larval period that reduce the occurrence
of low growth and high mortality events are quantified. Chemotherapeutant prophylactics
utilized during the egg and larval periods are common practice in SRFs, however the effects of
these treatments on the growth and survival during rearing are not well understood and is a focus
in two chapters of my thesis. Growth (body size) and survival are used as response variables for
the direct and indirect effects of hatchery practices given that under stressful rearing conditions
anaerobic metabolic processes associated with stress indirectly affect somatic tissue growth
(body size) and may directly affect survival (Kamler 2008, Conte 1998).
Results from my thesis research focuses on methodologies currently utilized in SRFs to
quantify effects on body size and survival of lake sturgeon at multiple life periods to provide
information necessary for the development of standard operating procedures that may enhance
success of SRFs.

4
LITERATURE CITED
5
LITERATURE CITED
Auer, N. A., and D. Dempsey. 2013. The Great Lake sturgeon. Michigan State University Press
East Lansing, Michigan 48823-5245.
Conte, F. S. (Ed.). (1988). Hatchery Manual for the White Sturgeon (Acipenser Transmontanus
Richardson): With Application to Other North American Acipenseridae (Vol. 3322). UCANR
Publications.
IUCN (International Union for Conservation of Nature and Natural Resources), 2010. The IUCN
red list of threatened species. http://www.iucnredlist.org/details/223/0 (accessed November
2014).
Kamler, E. 2008. Resource allocation in yolk-feeding fish. Reviews in Fish Biology and
Fisheries 18:143-200.
FishBase. 2012. Family Acipenseridae – Sturgeons
http://www.fishbase.org/Summary/FamilySummary.php?ID=32 (Accessed June 2014).
Welsh, A. B., R. F. Elliott, K. T. Scribner, H. R. Quinlan, E. A. Baker, B. T. Eggold, J. M.
Holtgren, C. C. Krueger, B. May. 2010. Genetic guidelines for the stocking of lake sturgeon
(Acipenser fulvescens) in the Great Lakes basin. Great Lakes Fish. Comm. Misc. Publ. 2010-01.

6
CHAPTER I: EFFECTS OF DE-ADHESION METHOD AND INCUBATION CONDITION
ON BODY SIZE, SURVIVAL, OXYGEN CONSUMPTION RATE, AND MICROBIAL
COMMUNITY COMPOSITION OF LAKE STURGEON EGG SURFACE
ABSTRACT
In the wild, many fish have developed ecological, physiological, and behavioral
reproductive traits that place fertilized gametes in locations within aquatic habitats that are
conducive to survival during egg incubation. However, under artificial or semi-natural rearing
conditions these unique ecological adaptations confront hatchery personnel with logistical
difficulties that compromise production efforts. This study was conducted using Lake Sturgeon
eggs to quantify the effects of different egg de-adhesion and incubation methods on the body size
and survival of fish eggs. Furthermore, this study aimed to quantify egg oxygen consumption
rates in association with the relative abundance and community composition of microbes on the
egg surface at different egg developmental periods. Results revealed that body size parameters
did not vary significantly as a function of different de-adhesion and incubation methods.
However, significantly higher survival was documented among individuals incubated in trays
(except the control) compared to jars. Oxygen consumption rate varied between two
developmental periods but did not vary as a function of different de-adhesion and incubation
methods. Using 16S rRNA sequence data, this study documented significant differences in
microbial community composition at two developmental periods which may be related to unique
binding properties of microbial taxa and egg surface substrates. Evaluation of de-adhesion and
incubation procedures in association with body size, survival, and the effects of microbial
communities provides hatchery managers with best-practices information that can be used to
develop standard operating procedures for Lake Sturgeon during the egg period.
7
INTRODUCTION
High mortality during early life periods can reduce rates of recruitment for many fish
species, compromising recovery efforts using aquaculture and stocking as primary means of
recovery. Species reared in artificial conditions experience barriers (i.e., egg quality, egg
adhesion) to successful fish production due to many species-specific life history traits,
particularly during the egg period. As a result, aquaculture methods, including de-adhesion and
incubation conditions, have been employed to increase survival during egg incubation and early
larval periods. Direct and indirect effects of these aquacultural practices on growth and survival
of developing embryos to hatch is understudied and thus needs further investigation.
In the wild, many fish have developed ecological, physiological, and behavioral traits that
place fertilized gametes in locations within aquatic habitats that are conducive to survival
through incubation (Balon 1975). Egg adhesion (or ‘stickiness’), which is characteristic of litho-
philic and litho-pelagophilic fish species (Balon 1975), serves as an example of how ecological
adaptation can, under artificial conditions, make production of such species difficult in
aquaculture settings. For example, in aquatic environments eggs are extruded into the water
column, initiating enzymatic reactions that hydrolyze glycoproteins (Cherr and Clark 1984,
Hansen and Olafsen 1999) causing eggs to adhere to substrates in habitats critical for
embryogenesis (i.e., high oxygen availability, limited predation) (Balon 1975, Kamler 2008). In
addition, as documented more recently using meta-genomic techniques (Cole et al. 2009, Nelson
et al. 2014), adhesive egg surfaces are quickly colonized by symbiotic as well as pathogenic
members of the aquatic microbial community. After initial colonization, egg surfaces experience

8
a rapid succession in microbial community composition which can affect offspring phenotype
and survival (Fujimoto et al. 2013).
In contrast, in aquacultural settings eggs are incubated in high numbers and adhesive
properties of the eggs can become problematic. For example, mass clumping in incubation
devices can cause egg asphyxiation and can increase levels of microbial infection by bacterial
(Barnes et al. 2009) and eukaryotic oomycetes (Van Den Berg et al. 2013), negatively affecting
growth and survival during embryogenesis (Barnes et al. 2009). As a result, physical and
chemical de-adhesion techniques have been used for egg de-adhesion for several fish species
(Cyprinus carpio, Silurus glanis, Tinca tinca; Linhart et al. 2003: Acipenser fulvescens;
Bouchard and Aloisi 2000: Acipenser baerii; Feledi et al. 2011) in aquaculture programs.
Physical egg de-adhesion includes the use of milk, talc, or more commonly Fuller’s Earth
solution (hereinafter referred to as ‘clay’) whereby charged particles bind to adhesive
glycoproteins released after initial contact of the egg with water (Doroshov 1983). Chemical
compounds such as alcase, or Woynarovich solution and tannic acid (hereinafter collectively
referred to ‘tannic acid’) removes the glycoprotein from the outer surface of the egg (Kowtal et.
al 1986). Despite wide use of de-adhesion compounds, limited information pertaining to the
effects of egg de-adhesion on the growth, respiration and survival of embryo to hatch exists.
Given advances in 16S meta-genomic sequencing techniques and bioinformatics tools (Cole et
al. 2009, Nelson et al. 2014, Schloss et al. 2014), studies aimed to quantify the effects of these
de-adhesion compounds and incubation devices on growth, respiration and survival at hatch in
association with microbial communities present during embryogenesis are warranted.
The purpose of this study was to quantify the effects of different de-adhesion methods
and incubation conditions on the body size and survival to hatch of Lake Sturgeon. Furthermore,

9
quantification of egg respiration rates in association with the relative abundance and taxonomic
composition of microbial communities during different egg development periods may provide
insight regarding the potential physiological mechanisms responsible for observed results. Lake
Sturgeon were used in this study due to egg properties (Cherr and Clark 1982, Cherr and Clark
1984), similar to those of other aquaculture species, as well as their conservation status which
has prompted a need for aquaculture standard operating procedures. The hypotheses of this
study are 1) body size and survival at hatch will differ as a function different de-adhesion and
incubation techniques, 2) physical and chemical de-adhesion treatment of egg surfaces will result
in different bacterial taxa colonizing the egg.

10
METHODS
Study site
This study was conducted at the Black River Streamside Rearing Facility (BR-SRF),
which is supplied with ambient river water (~680 L/min) from the Kleber Reservoir, located near
primary spawning areas for lake sturgeon in the upper Black River in Cheboygan County,
Michigan. The study took place in May 2013 when BR-SRF water temperature ranged from 9.5
to 17.6⁰C with a mean of 14.3⁰C. Water used for rearing in the BR-SRF is passed once through
a high output UV sterilizer (Pentair #E50S).
Gamete collection, fertilization, and incubation
Gametes were collected from adult lake sturgeon spawning in the upper Black River
following procedures described by Crossman et al. (2011). Gametes were transported to the BR-
SRF for fertilization of four full-sibling families, which took place within twelve hours of
collection. Eggs were fertilized using a 1:200 milt dilution of ambient river water immediately
poured over the eggs and allowing 90 seconds for fertilization. Excess milt was then removed
and eggs were rinsed once with ambient river water. On 9 May (one male and one female:
Family 1), 11 May (two males and two females Family 2 and Family 3), and 3 June (one male
and one female: Family 4) 2013, de-adhesion procedures for each family were administered
immediately after fertilization. Fertilizations for each family were performed in duplicate to
provide replicates for each experimental treatment.
Experimental treatments
The purpose of this experiment was to quantify the effects of different de-adhesion and
incubation procedures on lake sturgeon body size and survival at hatch. In addition, this study

11
was designed to document microbial community taxonomic composition and relative abundance
on the egg surface as a function of different de-adhesion and incubation conditions in association
with oxygen consumption rate during embryogenesis and body size at hatch. Microbial and
oxygen experiments focused on two development periods, determined by calculating cumulative
daily water temperature units (CTU) (Kempinger 1988), representing two time periods (30 to 36
CTU and 55 to 67 CTU) during embryogenesis when significant mortality occurs in Lake
Sturgeon culture (Scribner and Marsh, unpublished data).
De-adhesion treatment. – Immediately following fertilization, eggs were divided into three de-
adhesion treatment groups; 1) clay de-adhesion, 2) tannic acid, and 3) control de-adhesion. De-
adhesion procedures were performed simultaneously.
Clay (Fuller’s Earth) de-adhesion. – Clay de-adhesion procedures began by applying a
Fuller’s Earth solution (Sigma Aldrich) and gently mixing for 50 min. After 50 min, Fuller’s
Earth was rinsed from the eggs and a 15 min, 50 ppm Iodophor disinfection treatment was
administered. Following a 10 min rinse to remove residual Iodophor using ambient river water,
eggs were split into two groups of 100 to 150 randomly selected eggs to be incubated using two
different rearing apparatuses.
Tannic acid de-adhesion. – The tannic acid de-adhesion procedure (Kowtal et al. 1986)
began by treating eggs with a 0.4% urea (Sigma Aldrich) and 0.3% sodium chloride (Sigma
Aldrich) solution for 5 min, followed by a 1.0 min rinse with 0.1% tannic acid (Kowtal et al.
1986). Tannic acid was partially decanted three times over the period of three min. After three
min, eggs were rinsed and a 15 min, 50 ppm Iodophor disinfection treatment was administered as
described for the clay treatment. Following a 10 min rinse to remove residual Iodophor using
12
ambient river water, eggs were split into two groups of 100 to 150 randomly selected eggs to be
incubated using two different rearing apparatuses.
Control de-adhesion. – The control for de-adhesion was not provided any de-adhesion
treatment after fertilization. After fertilization eggs were rinsed and a 15 min, 50 ppm Iodophor
disinfection treatment was administered as described for the clay treatment. Eggs for control de-
adhesion were not split into two groups following iodiphor treatment.
Incubation treatment. – After de-adhesion procedures were performed, three groups of 100 to
150 eggs (one from clay, tannic acid, and the control for de-adhesion) from each family were
placed at random into each of two common incubation units used for hatchery production, with
one exception.
Mini egg-hatching jar. – Following the rinse to remove residual Iodophor using ambient
river water, one groups of 100 to 150 eggs from each de-adhesion treatment was added to a mini
egg-hatching jar (Pentair J32, Apopka, FL) hereinafter referred to as “jar”. Due to logistical
difficulty and the potential for mass mortality, eggs from control de-adhesion groups were not
incubated in a jar. Jar flow rate was set to provide eggs a gentle roll and was checked twice daily
throughout incubation.
Heath tray. – Following the rinse to remove residual Iodophor using ambient river water,
one group of 100 to 150 eggs from each de-adhesion treatment (including the control) was added
to a 7.6 cm diameter PVC coupling with 1.0 by 1.0 mm mesh on top (removable) and bottom,
hereinafter referred to as ‘tray’, to represent Heath tray incubation conditions. Couplings were
placed into a Heath tray for incubation and the flow rate was set to approximately 19 L per min
and checked twice daily.

13
Data collection
Body size. – At hatch, we used a digital camera to photograph and measure a random subsample
(n=25) of fish from each treatment, each family (except Family 4), and each replicate for mean
body size (total length (TL mm), yolk-sac area (YSA mm²), and body area (BA mm²)) using
Image J software (v.1.43u).
Survival. – Incubation units from each treatment, each family (except family 4) and each
replicate were checked daily to enumerate and remove dead eggs and to quantify proportional
survival at hatch.
Oxygen consumption rate. – At each of two development periods, eight eggs from one family
(only family 4), each treatment and each replicate were sub-sampled to quantify oxygen
consumption rate (mg/L / 5 min / eight eggs) using two, 24-well SensorDish reader plates
(PreSens Precision Sensing, GmbH, Regensburg, Germany) (Naciri et al. 2008). Each well was
filled with 1.5 mL of ambient river water, and eight eggs from each treatment were placed
circumpolar to the electro-florescence sensor, and then topped with 0.5 mL of autoclaved
mineral oil. Oxygen concentration (mg/L) was recorded every 30 sec for up to one hr. After 1
hr, eggs were removed from the SensorDish reader and placed into separate 2.0 mL posi-click
tubes, filled with 1.5 mL of 95% ethanol, for downstream microbial 16S rRNA extraction.
Oxygen concentration data were plotted using Excel (time on x-axis, oxygen concentration y-
axis) to determine the oxygen consumption rate. Oxygen consumption was quantified by
identifying the initial decline (time 1), and selecting the tenth (5 min) measurement (time 2)
following the initial decline point. Oxygen consumption was calculated for each treatment group
and each family by subtracting time 2 from time 1 (mg/L over the 5 min period for eight eggs).
Oxygen consumption due to microbial respiration was assumed to be negligible (Boucher 2012).

14
Daily egg chemotherapeutant
Beginning two days post-fertilization; eggs in jars and trays were exposed to daily
chemotherapeutant treatment of 500 ppm hydrogen peroxide treatment for the duration of 15
min. Daily chemical treatments were performed until 24 hours prior to hatch as determined by
observing embryo development stage 32 to 34 (Detlaff et al. 1993).
Microbial DNA extraction
Microbial genomic DNA was extracted from 8 eggs per treatment per development
period (from those used in oxygen consumption rate experiment), using a modified DNeasy
Blood & Tissue QIAGEN Kit (QIAGEN Group, 2006). Modified steps include the initial
incubation of samples in an enzymatic lysis buffer at 37⁰C for 30 min followed by bead-beating
(Fujimoto et al. 2013) for 10 min. After bead-beating, steps were followed according to
manufacturer’s protocols. To ensure sufficient DNA was extracted for analysis, eight eggs from
each sample were pooled during the extraction process (Fujimoto et al. 2013). Polymerase chain
reaction (PCR) amplification and sequencing of 16S rRNA gene was used to estimate the
microbial community composition as a function of chemotherapeutants and development time
period during incubation. PCR was conducted in a 50 uL reaction volume, containing 10 uL
template DNA (6 to 110 ng/uL), 0.4 uL of AquPrime HiFi Taq DNA polymerase (Invitrogen
Corp., Carlsbad, CA), 5.0 uL 10X PCR Buffer II, 1.0 uL 27 Forward Primer, 1.0 uL 1389
Reverse Primer, and 32.6 uL sterile water. Reactions were performed using the following
thermocycle conditions; initial denaturation step at 95ºC for 2 min, then 30 cycles of
denaturation at 95ºC for 20 sec, annealing at 55ºC for 30 sec, and extension at 72ºC for 7 min
(Fujimoto 2013).

15
Processing 16S microbial sequencing data
Sequencing analyses for the 16S rRNA gene were generated using the Illumina MiSeq
platform using paired-end reads (Kozich et al. 2013). Sequences were categorized using
operational taxonomic units (OTUs) at 97% similarity threshold. To statistically and graphically
describe similarity and dissimilarity among treatment groups, program Mothur (Schloss 2014)
was used to compute alpha (Simpson 1949, Shannon 1948) and beta (Bray Curtis 1957) diversity
indices. Dendrograms (using program FigTree) and lower-triangle dissimilarity matrices were
created based on Bray-Curtis values. Furthermore, to visualize relationships in diversity among
samples, a comparison of dominant phylotypes as function of de-adhesion, incubation, and
developmental period were graphed as a stacked column chart using Microsoft Excel.
Statistical analysis
Differences tested among treatments included mean (±SE) body size (TL, YSA, and BA)
at hatch, and proportional survival at hatch from families 1, 2, and 3. At two developmental
periods, oxygen consumption rate and alpha diversity (using Simpsons and Shannon values)
were tested using family 4. Due to unbalanced design (missing jar control) de-adhesion and
incubation groups were merged as a single treatment (total of 5 treatments). All analyses and
summary statistics were performed using SAS (SAS Institute version 9.3 Cary, NC). Egg
incubation tray (coupling) and jar, which included 100 to 150 eggs were the experimental units
for all response variables used in the analysis. A p value < 0.05 was considered statistically
significant for all analyses. A general linear model using analysis of variance was used to
analyze all response variables. We used Tukey-Kramer multiple pair-wise comparison tests for
all response variables.

16
RESULTS
Effects of de-adhesion method and incubation conditions on body size and survival
Total length at hatch. – The effect of de-adhesion and incubation on mean (±SE) TL at hatch
was not significant (F4,23 = 1.04, P = 0.41). At hatch, mean TL was greatest in clay jar (TL:
13.51 ±0.045) and smallest among tannic jar treatment groups (TL: 13.33 ±0.072), although
differences were not statistically significant (Table 1). The effect of family on the mean TL at
hatch was not significant (F2,23 = 1.17, P = 0.33) (Table 1).
Yolk-sac area at hatch. – The effect of de-adhesion and incubation treatment on mean YSA at
hatch was not statistically significant (F4,23 = 2.62, P = 0.06) (Table 1). At hatch, mean (±SE)
YSA was greatest in control tray (YSA: 7.80 ±0.12) and smallest among tannic jar (YSA: 7.57
±0.16) treatment groups, although differences were not statistically significant (Table 1). The
effect of family on YSA at hatch was significant (F2,23 = 40.86, P < 0.0001). Multiple pair-wise
comparison tests revealed a significant difference in mean YSA between families 1 (YSA: 7.35
±0.08) versus family 2 (YSA: 8.01 ±0.05) (t23 = -8.85, P < 0.0001), family 1 versus family 3
(YSA: 7.79 ±0.04) (t23 = -6.02, P < 0.0001), and family 2 versus family 3 (t23 = 2.83, P = 0.02)
(Table 2).
Body area at hatch. – The effect of de-adhesion and incubation treatments on mean (±SE) BA
at hatch was not statistically significant (F4,23 = 1.51, P = 0.23). At hatch, mean BA was greatest
in clay tray (BA: 29.03 ±0.16), and smallest among tannic jar (BA: 27.93 ±0.34) treatment
groups, although differences were not statistically significant (Table 1). The effect of family on
the mean BA at hatch was not significant (F2,23 = 2.31, P = 0.12) (Table 2).
17
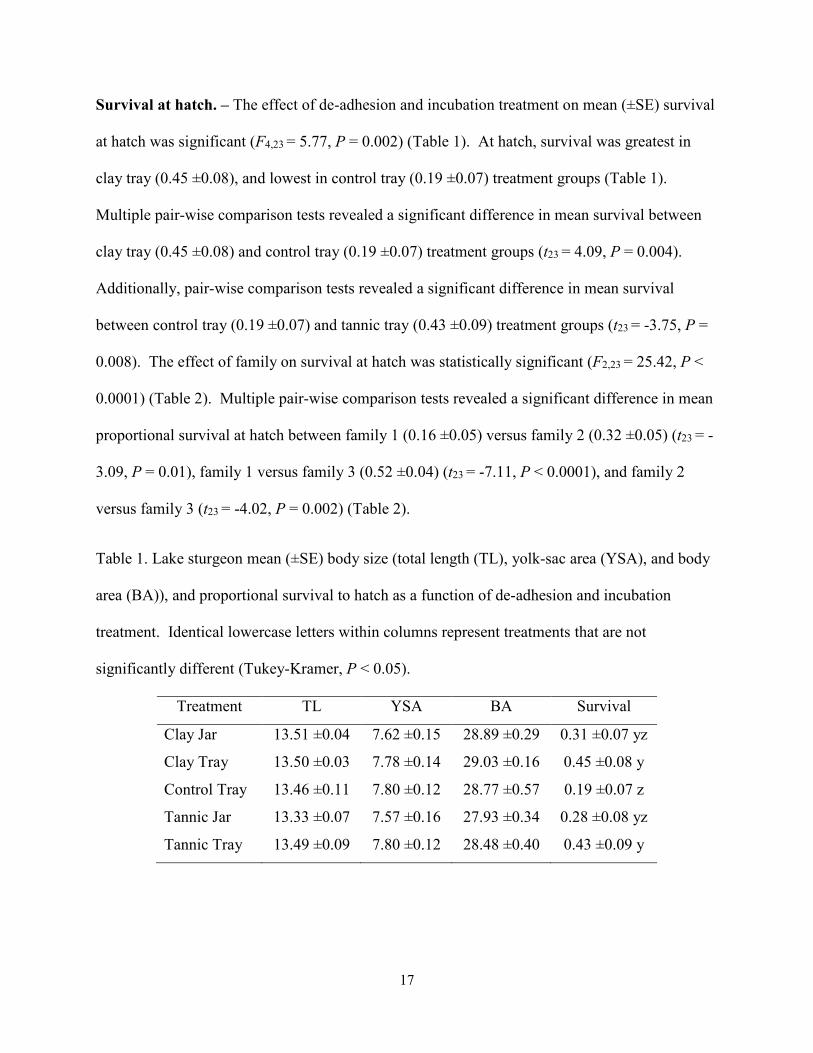
Survival at hatch. – The effect of de-adhesion and incubation treatment on mean (±SE) survival
at hatch was significant (F4,23 = 5.77, P = 0.002) (Table 1). At hatch, survival was greatest in
clay tray (0.45 ±0.08), and lowest in control tray (0.19 ±0.07) treatment groups (Table 1).
Multiple pair-wise comparison tests revealed a significant difference in mean survival between
clay tray (0.45 ±0.08) and control tray (0.19 ±0.07) treatment groups (t23 = 4.09, P = 0.004).
Additionally, pair-wise comparison tests revealed a significant difference in mean survival
between control tray (0.19 ±0.07) and tannic tray (0.43 ±0.09) treatment groups (t23 = -3.75, P =
0.008). The effect of family on survival at hatch was statistically significant (F2,23 = 25.42, P <
0.0001) (Table 2). Multiple pair-wise comparison tests revealed a significant difference in mean
proportional survival at hatch between family 1 (0.16 ±0.05) versus family 2 (0.32 ±0.05) (t23 = -
3.09, P = 0.01), family 1 versus family 3 (0.52 ±0.04) (t23 = -7.11, P < 0.0001), and family 2
versus family 3 (t23 = -4.02, P = 0.002) (Table 2).
Table 1. Lake sturgeon mean (±SE) body size (total length (TL), yolk-sac area (YSA), and body
area (BA)), and proportional survival to hatch as a function of de-adhesion and incubation
treatment. Identical lowercase letters within columns represent treatments that are not
significantly different (Tukey-Kramer, P < 0.05).
Treatment TL YSA BA Survival
Clay Jar 13.51 ±0.04 7.62 ±0.15 28.89 ±0.29 0.31 ±0.07 yz
Clay Tray 13.50 ±0.03 7.78 ±0.14 29.03 ±0.16 0.45 ±0.08 y
Control Tray 13.46 ±0.11 7.80 ±0.12 28.77 ±0.57 0.19 ±0.07 z
Tannic Jar 13.33 ±0.07 7.57 ±0.16 27.93 ±0.34 0.28 ±0.08 yz
Tannic Tray 13.49 ±0.09 7.80 ±0.12 28.48 ±0.40 0.43 ±0.09 y

18
Table 2. Lake sturgeon mean (±SE) body size (total length (TL), yolk-sac area (YSA), and body
area (BA)), and proportional survival to hatch as a function of family. Identical lowercase letters
within columns represent treatments that are not significantly different (Tukey-Kramer, P <
0.05).
Family TL YSA BA Survival
1 13.53 ±0.08 7.35 ±0.08a 28.82 ±0.38 0.16 ±0.05 x
2 13.45 ±0.04 8.01 ±0.05b 28.13 ±0.22 0.32 ±0.05 y
3 13.40 ±0.05 7.79 ±0.04c 28.90 ±0.23 0.52 ±0.04 z
Effects of de-adhesion method and incubation conditions on oxygen consumption rate
Developmental period 1. – The effect of de-adhesion and incubation on mean (±SE) oxygen
consumption rate at developmental period 1 was not statistically significant (F4,5 = 0.77, P =
0.59) (Table 3). At developmental period 1, the mean oxygen consumption rate was highest in
tannic jar (0.35 ±0.03) and lowest in control tray (0.28 ±0.01) (Table 3), although differences
were not statistically significant.
Developmental period 2. – The effect of de-adhesion and incubation treatment on mean oxygen
consumption rate at developmental period 2 was not statistically significant (F4,5 = 0.88, P =
0.53) (Table 3). At developmental period 2, the mean oxygen consumption rate was highest in
tannic tray (1.04 ±0.04) and lowest in control tray (0.49 ±0.14) treatment groups (Table 3),
although differences were not statistically significant.

19
Table 3. Lake Sturgeon mean (±SE) egg oxygen consumption rate at two developmental periods
(30 to 36 CTU and 55 to 67 CTU; Kempinger 1988) as a function of different de-adhesion
methods and incubation conditions.
Treatment Development Period 1 Development Period 2
Clay Jar 0.30 ±0.06 0.85 ±0.48
Clay Tray 0.33 ±0.01 0.92 ±0.27
Control Tray 0.28 ±0.01 0.49 ±0.14
Tannic Jar 0.35 ±0.03 0.55 ±0.03
Tannic Tray 0.30 ±0.03 1.04 ±0.04
Effects of de-adhesion method and incubation conditions on microbial diversity
Alpha-diversity. –
Developmental period 1. – The effect of de-adhesion and incubation treatments on mean
Shannon diversity at developmental period 1 was statistically significant (F4,5 = 17.12, P =
0.004) (Table 4). Multiple pair-wise comparison tests revealed that the mean Shannon diversity
for clay jar (1.06 ±0.03) was statistically lower than the tannic jar (2.09 ±0.02: t23 = -7.73, P =
0.003), tannic tray (1.84 ±0.02: t23 = -6.05, P = 0.01), clay tray (1.79 ±0.04: t23 = -5.72, P = 0.01),
and control tray (1.60 ±0.21: t23 = -4.31, P = 0.04) treatment groups (Table 4). The effect of de-
adhesion and incubation on mean Simpson’s diversity at developmental period 1 was statistically
significant (F4,5 = 28.38, P = 0.001). Multiple mean comparison tests revealed Simpson’s
diversity was significantly higher in clay jar (0.61 ±0.02) compared to clay tray (0.37 ±0.02) (t5 =
4.05, P = 0.05) (Table 4). Additionally, the mean Simpson’s diversity in tannic tray (0.29 ±0.01)
was significantly higher compared to tannic jar (0.17 ±0.01) (t5 = -4.29, P = 0.04) (Table 4).
Multiple mean comparison tests revealed that the mean Simpson’s diversity in clay jar (0.61
±0.02) was significantly higher than tannic jar (0.17 ±0.01) (t5 = 10.18, P = 0.0009) (Table 4).

20
However, mean Simpson’s diversity in clay tray (0.37 ±0.02) was not significantly different from
tannic tray (0.29 ±0.01) (t5 = 1.85, P = 0.44).
Microbial phylotypes that contributed 5 percent or higher of the mean proportional
abundance in clay jar include: Flavobacteriaceae (0.78) (Figure 2). In addition, in the clay jar
treatment, phylotypes identified as Flavobacteriaceae included only one species
(Flavobacteriaceae Chryseobacterium). Phylotypes that contributed 5 percent or higher of the
mean proportion abundance in clay tray included: Comamonadaceae (0.59), Chromatiaceae
(0.06), Cryomorphaceae (0.05), and Burkholdariales unclassified (0.05) (Figure 2). Phylotypes
that contributed 5 percent or higher of the mean proportional abundance in control tray included:
Comamonadaceae (0.63) and Oxalobacteraceae (0.06) (Figure 2). Phylotypes that contributed 5
percent or higher of the mean proportional abundance in tannic jar included: Comamonadaceae
(0.28), Flavobacteriaceae (0.43), and Moraxellaceae (0.16) (Figure 2). In addition, in the tannic
jar treatment, phylotypes identified as Flavobacteriaceae included 4 different species
(Flavobacterium n=3 (0.38), Chryseobacterium n=1 (0.05)). Phylotypes that contributed 5
percent or higher of the mean proportional abundance in tannic tray included: Comamonadaceae
(0.50), Moraxellaceae (0.16), Burkholdariales unclassified (0.08), Chromatiaceae (0.05) (Figure
2).
Developmental period 2. – The effect of de-adhesion and incubation on Shannon
diversity at developmental period 2 was statistically significant (F4,5 =7.31, P = 0.03) (Table 4).
Multiple comparison tests revealed that mean Shannon diversity in clay jar (2.14 ±0.04) was
significantly lower than that in clay tray (2.38 ±0.01) and control tray (2.37 ±0.05) (t5 = -4.61, P
= 0.03 and t5 = -4.48, P = 0.03, respectively) (Table 4). The effect of de-adhesion and incubation
on mean Simpson’s diversity at developmental period 2 was not statistically significant

21
(F4,5=4.37, p=0.0687). Mean Simpson’s diversity at development period 2 was highest in tannic
tray (0.202 ±0.008) and lowest in tannic jar (0.160 ±0.005) (Table 4), however differences were
not statistically significant.
Microbial phylotypes that contributed to 5 percent or higher of the man proportional
abundance in clay jar included: Flavobacteriaceae (0.65) and Comamonadaceae (0.16) (Figure
2). In addition, in the clay jar treatment, phylotypes identified as Flavobacteriaceae included 3
different species (Flavobacterium n=2 (0.47), Chryseobacterium n=1 (0.18)). Phylotypes that
contributed 5 percent or higher of the mean proportional abundance in clay tray included:
Comamonadaceae (0.39), Chromatiaceae (0.10), Cryomorphaceae (0.07), and Moraxellaceae
(0.06) (Figure 2). Phylotypes that contributed 5 percent or higher of the mean proportional
abundance in control tray included: Comamonadaceae (0.48), Moraxellaceae (0.09),
Rhodobacteraceae (0.05), and Aeromonadaceae (0.05) (Figure 2). Phylotypes that contributed 5
percent or higher of the mean proportional abundance in tannic jar included: Comamonadaceae
(0.31), Flavobacteriaceae (0.15), Burkholdariales unclassified (0.14), Moraxellaceae (0.13), and
unclassified (0.05) (Figure 2). In addition, in the tannic jar treatment, phylotypes identified as
Flavobacteriaceae included one species (Flavobacterium n=1 (0.15)). Phylotypes that
contributed 5 percent or higher of the mean proportional abundance in tannic tray included:
Comamonadaceae (0.39), Moraxellaceae (0.18), and Aeromonadaceae (0.05) (Figure 2).

22
Table 4. Mean (±SE) alpha diversity (Simpson’s and Shannon diversity) of lake sturgeon egg
microbial communities at two developmental periods (Development period 1 30 to 36 CTU and
Development period 2 55 to 67 CTU; Kempinger 1988) and de-adhesion and incubation
methods. Identical lowercase letters within columns represent treatments that are not
significantly different (Tukey-Kramer, P < 0.05).
Development Period Treatment Simpson Shannon
1 Clay Jar 0.39 ±0.02 a 1.06 ±0.03 y
1 Clay Tray 0.63 ±0.02 b 1.79 ±0.04 z
1 Control Tray 0.58 ±0.07 ab 1.60 ±0.21 z
1 Tannic Jar 0.83 ±0.01 c 2.09 ±0.02 z
1 Tannic Tray 0.71 ±0.01 b 1.84 ±0.02 z
2 Clay Jar 0.83 ±0.01 2.14 ±0.04 z
2 Clay Tray 0.82 ±0.01 2.38 ±0.01 y
2 Control Tray 0.81 ±0.01 2.37 ±0.05 y
2 Tannic Jar 0.84 ±0.01 2.27 ±0.04 yz
2 Tannic Tray 0.80 ±0.01 2.24 ±0.04 yz

23
Figure 1. Microbial phylotype mean proportional abundance as a function of embryonic
development time and de-adhesion and incubation treatment. Thirty major phylotypes
represented in the community sample based on 5 percent contribution to total operational
taxonomic units. Each unique color represents a unique species phylotype based on 97%
similarity of operational taxonomic units.
0.00
0.10
0.20
0.30
0.40
0.50
0.60
0.70
0.80
0.90
1.00
Cla
y_
Jar
Cla
y_
Tra
y
Con
tro
l_T
ray
Tan
nic
_Ja
r
Tan
nic
_T
ray
Cla
y_
Jar
Cla
y_
Tra
y
Con
tro
l_T
ray
Tan
nic
_Ja
r
Tan
nic
_T
ray
Development Period 1 Development Period 2
Ph
ylo
typ
e M
ean
Pro
port
ion
al A
bu
nd
an
ceBurkholderiales Comamonadaceae Hydrogenophaga
Aeromonadales Aeromonadaceae Aeromonas
Caulobacterales Caulobacteraceae Brevundimonas
Flavobacteriales Flavobacteriaceae Flavobacterium
Deinococcales Deinococcaceae Deinococcus
Flavobacteriales Flavobacteriaceae Flavobacterium
unclassified unclassified unclassified
unclassified unclassified unclassified
Flavobacteriales Flavobacteriaceae Flavobacterium
unclassified unclassified unclassified
Flavobacteriales Flavobacteriaceae Flavobacterium
Burkholderiales Oxalobacteraceae unclassified
Burkholderiales Oxalobacteraceae unclassified
Chromatiales Chromatiaceae Rheinheimera
Flavobacteriales Flavobacteriaceae Flavobacterium
Sphingomonadales Sphingomonadaceae Novosphingobium
Flavobacteriales Cryomorphaceae Fluviicola
Rhodobacterales Rhodobacteraceae Rhodobacter
Burkholderiales unclassified unclassified
Rhodobacterales Rhodobacteraceae Rhodobacter
Flavobacteriales Flavobacteriaceae Flavobacterium
Sphingomonadales Sphingomonadaceae unclassified
Burkholderiales Comamonadaceae unclassified
Flavobacteriales Flavobacteriaceae Flavobacterium
Pseudomonadales Moraxellaceae Acinetobacter
Flavobacteriales Flavobacteriaceae Chryseobacterium
Burkholderiales unclassified unclassified
Flavobacteriales Flavobacteriaceae Flavobacterium
Flavobacteriales Flavobacteriaceae Flavobacterium
Burkholderiales Comamonadaceae unclassified

24
Beta-diversity. –
Developmental period 1. – Among de-adhesion and incubation treatments greater
dissimilarity was observed among those incubated in jars compared to those incubated in trays
(Figure 2: Table 5). Control tray at developmental period 1 was more dissimilar to those
incubated in jars (Figure 2: Table 5).
Developmental period 2. – Among de-adhesion and incubation treatments greater
dissimilarity was observed among those incubated in jars compared to trays (Figure 2: Table 5).
Control tray at developmental period 2 was more dissimilar to those incubated in jars (Figure 2:
Table 5).
Table 5. Mean (±SE) Bray-Curtis dissimilarity index of lake sturgeon egg microbial community
as a function of development period (Development period 1 30 to 36 CTU and development
period 2 55 to 67 CTU; Kempinger 1988), de-adhesion, and incubation.
Time 1 1 1 1 1 2 2 2 2 2
Time Treatment
Clay
Jar
Clay
Tray
Control
Jar
Tannic
Jar
Tannic
Tray
Clay
Jar
Clay
Tray
Control
Tray
Tannic
Jar
Tannic
Tray
1 Clay Jar 0.000
1 Clay Tray 0.853 0.000
1 Control Tray 0.855 0.229 0.000
1 Tannic Jar 0.771 0.620 0.620 0.000
1 Tannic Tray 0.889 0.284 0.271 0.509 0.000
2 Clay Jar 0.614 0.666 0.715 0.393 0.737 0.000
2 Clay Tray 0.834 0.355 0.441 0.477 0.455 0.488 0.000
2 Control Tray 0.834 0.345 0.327 0.540 0.329 0.621 0.302 0.000
2 Tannic Jar 0.803 0.568 0.616 0.323 0.624 0.425 0.414 0.523 0.000
2 Tannic Tray 0.839 0.352 0.431 0.483 0.440 0.494 0.221 0.297 0.369 0.000

25
Figure 2. Neighbor-joining tree construct using Bray-Curtis dissimilarity for lake sturgeon egg
microbial communities as a function of embryonic development period (Development period 1
30 to 36 CTU and development period 2 55 to 67 CTU; Kempinger 1988) and de-adhesion and
incubation conditions.
Time 2 Tannic Tray
Time 2 Clay Tray
Time 2 Control Tray
Time 1 Tannic Tray
Time 1 Control Tray
Time 1 Clay Tray
Time 2 Tannic Jar
Time 1 Tannic Jar
Time 2 Clay Jar
Time 1 Clay Jar
0.04

26
DISCUSSION
The effects of de-adhesion and incubation on lake sturgeon eggs were quantified using
egg survival, egg oxygen consumption rate, and body size as response variables. Results
revealed that these variables, except egg survival, did not vary significantly among de-adhesion
and incubation treatments. Also, this study incorporated a novel approach by using 16S genomic
data to quantify community taxonomic composition of bacteria present on the egg surface in
response to different de-adhesion methods and incubation conditions utilized in aquaculture.
Results suggests de-adhesion and incubation techniques affect the bacterial community
composition on the egg surface which may provide insight into the mechanisms responsible for
differences detected in survival.
Effects of de-adhesion method and incubation conditions on body size and survival
Body size at hatch. – No significant effects of de-adhesion or incubation were identified using
body size parameters (total length, yolk-sac area, and body area) measured. However, the larger
mean total length at hatch in clay jar groups compared to those from other de-adhesion and
incubation treatments is encouraging given that these de-adhesion and incubation methods are
among those most often utilized in aquaculture facilities. Body size, more specifically total
length, is important given results from other studies that suggest body size at hatch is positively
correlated with timing and likelihood of exogenous feeding during the larval period and
subsequent survival to later life periods (Gisbert et al. 2000, Blaxter and Hempel 1963).
Egg Survival. – The effect of de-adhesion and incubation treatments on the mean proportion of
survival to hatch was significant among treatments. Currently, most rearing facilities utilize jars
during incubation to limit space utilized for egg production. However in this study, individuals

27
incubated in trays exhibited greater survival (except de-adhesion control) compared to those
incubated in jars. Differences observed between incubation devices (i.e., jar versus tray) may be
explained by the rolling action that jar-incubated eggs experience compared to those in trays that
remain still. In addition to benefits of space, anecdotal evidence has suggested that eggs in jars
‘knock’ into one another while rolling in the jar which might inhibit microbial growth at the egg
surface and improve survival at hatch. However, results from this study show that survival is
higher among egg groups incubated in trays. Therefore, rolling within the jars may 1) remove or
inhibit symbiotic microbial taxa that potentially aid in egg development and subsequent survival
or 2) removes most bacteria except those that are pathogenic and may have greater binding
affinity and also act as a potential egg pathogen (i.e., Flavobacterium). Sensitivity to friction
associated with the rolling action encountered in the jar incubators during early embryogenesis
may also explain high mortality in jars compared to trays. Green sturgeon are reported to be
more sensitive to similar jar apparatuses which may explained by differences in egg chorion
thickness (Van Eenennaam et al. 2008), however it is unknown if this is the case for lake
sturgeon which warrants further attention.
Differences in survival observed between clay tray and tannic tray compared to control
tray might be explained by the reduced adhesive surface area available to be colonized by
microbes. Clay particles adhere to the glycoprotein that is released through the egg surface
(Doroshov et al. 1983); while tannic acid removes this adhesive glycoprotein layer (Kowtal et al.
1986) processes may both provide less suitable substrates available for microbes to adhere.
Control tray groups did not receive any de-adhesion compound and as a result greater adhesive
surface area may have been available for colonization by potentially pathogenic microbes.

28
Effects of de-adhesion method and incubation conditions on oxygen consumption rate
During egg incubation, oxygen consumption rate was measured to identify physiological
stress associated with different de-adhesion and incubation treatments. Results revealed that
oxygen consumption rate did not vary significantly among de-adhesion and incubation
treatments. Higher oxygen consumption rates at the second development period relative to the
first are consistent with embryonic stage of development for all de-adhesion and incubation
groups. To date, no known study has documented oxygen consumption rates for lake sturgeon
eggs. Oxygen consumption rate data provided herein are beneficial to future studies
investigating oxygen consumption rates of developing embryos at two critical developmental
periods.
Effects of de-adhesion method and incubation conditions on microbial diversity
The effects of de-adhesion and incubation on community alpha diversity (species
richness) were significant. Relative to all treatment groups, trends were observed when
comparing beta-diversity among jars and trays. These data suggest that de-adhesion and
incubation techniques employed prior to egg incubation alter the microbial community on the
egg surface.
When comparing the body size and survival at hatch from family 1 through 3 with that of
the microbial diversity data from family 4, it is interesting to note that only those incubated in
jars were documented to be colonized with Flavobacteriaceae at both developmental periods.
Flavobacteriaceae is a known fish pathogen and is ubiquitous in hatchery environments (Loch et
al. 2013). This might explain the lower mean survival (albeit not statistically significant)
observed among the clay jar and tannic jar, compared to that of the clay tray and tannic tray.
Among those incubated in trays, Comamonadaceae (unclassified) dominated the major

29
phylotypes at both developmental periods, however, it is unknown if the species within the
groups are pathogenic. Based on body size and survival of groups incubated in trays from family
1 through 3, it would suggest that this phylotypes may be symbiotic. However, additional
studies are needed with growth and microbe data collected from similar families to further
support this.
Conclusions
Relative to parameters measured in this study (egg survival, egg oxygen consumption
rate, microbial community composition, and body size at hatch), benefits that may result from
employing different de-adhesion and incubation methods during embryogenesis were apparent in
terms of mean survival at hatch. Although mean differences were not significant, incubating
eggs in trays resulted in higher mean survival to hatch. In addition, genomic interrogation of egg
microbe communities demonstrated that microbial community composition on the egg surface is
changed as a function of different de-adhesion and incubation methods. Furthermore, phylotypes
documented on egg surfaces may act as potential egg pathogens or symbionts. Therefore
additional studies are needed to further demonstrate costs or benefits with respect to growth and
survival in relationship with different microbial communities on egg surfaces. Additional
information gathered about the relative abundance of phylotypes, using quantitative PCR would
also provide information to interpret oxygen consumption data. Lastly, it is unclear if microbial
communities on the fish egg surface effect growth and survival from hatch through subsequent
ontogenetic stages. Therefore additional studies are needed to further support this hypothesis.
Additional information gathered about the specific abundances of certain phylotypes, using
quantitative PCR may also provide researchers additional information related to parameters used
in this study highlighting potential mechanisms for the observed results. Lastly, it is unclear if

30
microbial communities on the fish egg surface, as a function of different de-adhesion and
incubation conditions, effects growth and survival from hatch through ontogenetic contingency
which warrants further investigation as well.

31
LITERATURE CITED

32
LITERATURE CITED
Balon, E. K. 1975. Reproductive guild of fishes: A proposal and definition. Journal of Fisheries
Research Board of Canada 32(6):821-864.
Barnes, M. E., D. Bergmann, J. Jacobs, and M. Gabel. 2009. Effect of Flavobacterium
columnare inoculation, antibiotic treatments and resident bacteria on rainbow trout Oncorynchus
mykiss eyed egg survival and external membrane structure. Journal of Fish Biology 74:576-590.
Blaxter, J. H. S., and G. Hempel. 1963. The influence of egg size on Herring larvae (Clupea
harengus L.). J. Const. Int. Explor. Mer. 28:211-240.
Bouchard, J. H. and D. B. Aloisi. 2002. Investigations in concurrent disinfection and de-adhesion
of lake sturgeon eggs. North American Journal of Aquaculture 64:212-216.
Boucher, M. A. 2012. The effect of substrate rearing on the growth, development, and survival
of larval white sturgeon (Acipenser transmontanus) during early ontogeny. The University of
Northern British Columbia Master’s Thesis 1-97.
Bray, J. R., and J. T. Curtis. 1957. An ordination of the upland forest communities southern
Wisconsin. Ecological Monographs 27:325:349.
Cherr, G. N., and W. H. Clark. 1982. Fine structures of the envelope and micropyles in the eggs
of the White Sturgeon, Acipenser transmontanus Richardson. Developmental Growth and
Differentiation 24(4):341-352.
Cherr, G. N., and W. H. Clark. 1984. Jelly release in the eggs of the White Sturgeon, Acipenser
transmontanus: An enzymatically mediated event. The Journal of Experimental Zoology
230:145-149.
Crossman, J. A., P. S. Forsythe, K. T. Scribner, and E. A. Baker. 2011. Hatchery rearing
environment and age affect survival and movements of stocked juvenile lake sturgeon. Fisheries
Management Ecology 18:132-144.
Doroshov, S. I., W. H. Clark, P. B. Lutes, R. L. Swallow, K. E. Beer, A. B. McGuire, and M. D.
Cochran. Artificial propagation of the White Sturgeon (Acipenser transmontanus) Richardson.
Aquaculture 32:93-104.
Feledi, T., B. Kucska, and A. Ronyai. 2011. Effect of different fertilization and egg-de-adhesion
methods on the artificial propagation of Siberian sturgeon. Archives of Polish Fisheries 19:119-
122.
Gisbert, E., P. Williot, and F. Castello-Orvay. Influence of egg size on growth and survival of
early stages of Siberian sturgeon (Acipenser baeri) under small scale hatchery conditions.
Aquaculture 183:83-94.

33
Fujimoto, M., J. A. Crossman, K. T. Scribner, and T. A. Marsh. 2013. Microbial community
assembly and succession on Lake Sturgeon egg surfaces as a function of simulated spawning
stream flow rate. Microbial Ecology 66:500-511.
Hansen, G. H., and J. A. Olafsen. 1999. Bacterial interactions in early life stages of marine cold
water fish. Microbial Ecology 38:1-26.
Jeon, Y., S. Park, J. Lim, J. Chun, and B. Kim. 2015. Improved pipeline techniques for reducing
erroneous identification by 16S rRNA sequences using the Illumina MiSeq platform. Journal of
Microbiology 53(1):60-69.
Kamler, E. 2008. Resource allocation in yolk-feeding fish. Reviews in Fish Biology and
Fisheries 18:143-200.
Kempinger, J. J. 1988. Spawning ad early life history of lake sturgeon in the Lake Winnebago
system, Wisconsin. American Fisheries Society Symposium 5:110-122.
Kowtal, G. V., W. H. Clark, and G. B. Cherr. 1986. Elimination of adhesiveness in eggs from the
White sturgeon, Acipenser transmontanus: Chemical treatment of fertilized eggs. Aquaculture
56:139-143.
Kozich, J. J., S. L. Wescott, N. T. Baxter, S. K. Highlander, and P. D. Schloss. 2015. Improved
pipeline for reducing erroneous identification of 16S rRNA sequences using the Illumina MiSeq
platform.
Linhart, O., M. Rodina, D. Gela, M. Flajshans, and M. Kocour. 2003. Enzyme treatment for
elimination of egg stickiness in tench (Tinca tinca L.), European catfish (Silurus glanis L.) and
common carp (Cyprinus carpio L.). Fish Physiology and Biochemistry 28:507-508.
Naciri, M., D. Kuystermans, and M. Al-Rubeai. 2008. Monitoring pH and dissolved oxygen in
mammalian cell culture using optical sensors. Cytotechnology 57:245-250.
Nelson, M. C., H. G. Morrison, J. Benjamino, S. L. Grim, ad J. Graf. 2014. Analysis,
optimization and verification of illumina-generated 16S rRNA gene amplicon surveys. PLOS
ONE 9(4):1-14.
Schloss P. D., D. Gevers, and S. L. Westcott. 2014. Reducing the effects of PCR amplification
and sequencing artifacts on 16S rRNA-based studies. PloS ONE. 6:e27310.
Shannon, C. E. 1948. A mathematical theory of communication. Reprinted for the Bell System
Technical Journal with corrections 5(1):3-55.
Simpson, E. H. 1949. Measurement of diversity. Nature 163:688-689.
Van Den Berg, A. H., D. McLaggan, J. Dieguez-Uribeondo, and P. Van West. 2013. The impact
of the water moulds Saprolignia diclina and Saprolegnia parasitica on natural ecosystems and
the aquaculture industry. Fungal Biology Reviews 27:33-42.

34
CHAPTER II: EFFECTS OF EGG CHEMOTHERAPEUTANTS ON BODY SIZE,
SURVIVAL, OXYGEN CONSUMPTION RATE, AND MICROBIAL DIVERSITY, OF FISH
EGGS
ABSTRACT
Microbial communities including pathogens in water-sources used for aquaculture
represent a significant source of mortality during the egg period for many fish species. As a
result, preventative measures are integrated in aquaculture protocols to ensure that infection
outbreaks are prevented or reduced. In this study, Lake Sturgeon eggs were used to quantify the
effect of different chemotherapeutants on the survival and body size at hatch. Oxygen
consumption rates were also quantified in association with the relative abundance and
community composition of microbes on the egg surface at different developmental periods. Of
the parameters measured in this study (egg survival, egg oxygen consumption rate, microbial
community composition, and body size at hatch), benefits of treating lake eggs using peroxide or
formalin were not evident. 16S rRNA gene sequencing was used to quantify relative abundance
and community composition of microbes as a function of fish egg chemotherapeutants.
Microbial analysis data showed that diversity of microbial communities on the egg surfaces were
altered as a function of chemotherapeutant treatment, indicating a shift towards pathogenic taxa
(i.e., Flavobacteriaceae) particularly during early embryogenesis. Downstream effects of these
treatments and altered microbial community structures on the growth and survival at subsequent
life periods are unknown, warranting additional studies.

35
INTRODUCTION
Microbial communities including pathogens in water-sources used for aquaculture
represent a significant source of mortality during the egg period for many fish species (Barnes et
al. 2005[Bacterial], Wagner et al. 2012[Bacterial], Van Den Berg et al. 2013[oomycete], Meyer
1991[oomycete]). Egg surfaces provide suitable substrates for microbial taxa to attach and
proliferate during incubation (Hansen and Olafsen 1989, Fujimoto et al. 2013). Importantly,
pathogenic microbes, (e.g., Flavobacterium) can negatively affect production of developing eggs
by attaching to the adhesive glycoprotein matrices that envelope the outer surface of the egg
(Cherr and Clark 1984, Hansen and Olafsen 1999) and degrading the chorion (Hansen et al.
1992, Barnes et al. 2009). Additional research suggests that bacterial communities colonize the
egg surface in great abundance causing developmental arrest (Forsythe et al. 2014) due possibly
to oxygen depletion (Barker 1989).
In addition to pathogenic bacteria, a common eukaryotic oomycete known as
Saprolegnia, which causes Saprolegniosis, is a disease commonly found on fish egg surfaces,
and is believed to inhabit surfaces of dead or unfertilized eggs (Van Den Berg et al. 2013). It is
therefore only through subsequent ‘hyphal infection’ that viable eggs raised in nearby incubation
devices become infected (Van Den Berg et al. 2013) likely resulting in suffocation and mortality
(Meyer 1991). In addition to egg surface properties, hatchery environments (e.g., water sources,
incubation devices) expose developing eggs to sub-optimal incubation conditions and provide
favorable environments for pathogenic taxa to colonize the egg surface causing direct (mortality)
and indirect effects (growth) (Hansen et al. 1992[Bacterial], Van Den Berg et al.

36
2013[oomycete]). As a result, preventative measures are integrated in aquaculture protocols to
ensure that infection outbreaks are prevented or reduced.
Preventative measures include the use of ultraviolet irradiation which is believed to
disrupt replication of and reduce microbial abundance (Sharrer et al. 2005) in aquaculture water-
sources. Additionally, chemical treatments (hereinafter referred to as “chemotherapeutants”)
administered during egg incubation have reduced microbial abundance and increased hatch
success in some species (Barnes 2009[Bacterial], Stephenson et al. 2003[Bacterial] Van Der
Berg et al. 2013[oomycete]), although results vary. Two chemotherapeutants commonly used to
reduce microbial abundance and improve hatch success are formalin and hydrogen peroxide,
both of which are currently listed by the U. S. Food and Drug Administration as approved drugs
for treatment of freshwater finfish eggs (Bowker 2011). Formalin (37%) is typically used to treat
eggs for 15 min at 1,500 uL/L concentration using a constant flow water supply (Bowker 2011).
Hydrogen Peroxide (35%) is typically used to treat eggs for 15 minutes at 500 ppm concentration
using a constant flow water supply (Bowker 2011). Despite the wide use of these
chemotherapeutants, little information exists pertaining to the effects on microbial community
abundance and diversity following treatment, or the potential effects of colonization on egg
respiration, growth and hatch success. Recent advances in meta-genomic 16S rRNA techniques
and software involving high throughput data management tools (Cole et al. 2009, Nelson et al.
2014, Schloss et al. 2014) allows documentation of changes in community abundance in
response to chemotherapeutants in aquaculture settings. Also, since approved
chemotherapeutants were initially and most commonly assessed using salmonids, further
research is needed to evaluate the applicability of common chemotherapeutants for other fish
species, including those of conservation concern, such as Sturgeons (IUCN, 2010).

37
Sturgeons are highly fecund, migratory litho-pelagophiles (Balon 1975) with unique egg
properties that differ from most teleosts (Cherr and Clark 1982, Cherr and Clark 1984, Detlaff et
al. 1993). The economic value of roe and flesh gathered from mature adults, as well as the
conservation status of many sturgeon species has prompted recovery efforts through the use of
traditional as well as conservation hatchery programs (Memis 2009, Bronzi et al. 1999).
Conservation hatchery programs, such as those which utilize streamside rearing facilities (SRFs)
for Lake Sturgeon (Acipenser fulvescens) (Holtgren et al. 2007), have been in place for nearly a
decade in an attempt to recover or repatriate populations in the North American Great Lakes.
However, desired annual production levels have been difficult to achieve due in large part to
high mortality during early development, including the egg period.
The objectives of this study were to: 1) quantify the effects of different egg
chemotherapeutants on body size and survival at hatch, and 2) quantify the respiration rates of
eggs and the relative abundance of microbial communities on egg surfaces as a function of
different chemotherapeutants used in aquaculture. The research hypotheses of this study were:
1) egg survival will differ significantly as a function of different chemotherapeutants used during
incubation, 2) body size at hatch will differ significantly based on the use of different
chemotherapeutants, 3) egg chemotherapeutants reduce the relative abundance of microbial and
oomycete communities on the egg surface, and 4) egg chemotherapeutants alter the microbial
and oomycete community composition and in particular, reduce the relative abundance of
pathogenic microbes.

38
METHODS
Study site
The Black River Streamside Rearing Facility (BR-SRF) is supplied with ambient river
water (~680 L/min) from the Kleber Reservoir, located near primary spawning areas for Lake
Sturgeon in the upper Black River in Cheboygan County, Michigan. Water used for rearing in
the BR-SRF is passed once through a high output UV sterilizer (Pentair #E50S). This study was
conducted in May 2012 and water temperatures ranged from 13.1 to 17.0⁰C (mean 14.9⁰C).
Gamete collection, fertilization, and incubation
Gametes were collected from one male and one female lake sturgeon (5 May and 11
May, 2012,) during spawning in the upper Black River following procedures described by
Crossman et al. (2011). Gametes were transported to the BR-SRF for the fertilization of two
full-sibling families, which took place within twelve hours of collection. Eggs were fertilized
using a 1:200 milt dilution of 0.22 um filtered, re-circulated UV treated ambient river water and
immediately poured over the eggs allowing 90 seconds for fertilization. Excess milt was then
removed and eggs were rinsed once with 0.22 um filtered, re-circulated UV-treated river water.
Egg de-adhesion procedures began by applying a Fuller’s Earth solution (Sigma Aldrich) and
gently mixing for 50 min. After 50 min, Fuller’s Earth was rinsed from the eggs and a 15 min,
50 ppm Iodophor disinfection treatment was administered. Following a 10 min rinse to remove
residual Iodophor using ambient river water, three batches of 150 to 200 randomly selected eggs
from each family were placed into three separate 7.6 cm diameter PVC couplings with 1.0 by 1.0
mm mesh on the top (removable) and bottom. Each coupling (experimental unit) was randomly

39
assigned to one of two disinfectant treatment groups and a control and transferred to Heath trays
for incubation with a flow rate of 19.0 L/min.
Experimental chemotherapeutant treatments
The purpose of this experiment was to quantify the effects of chemotherapeutants on lake
sturgeon body size and survival at hatch. In addition, the microbial community composition and
relative abundance on the egg surface was quantified as a function of different
chemotherapeutants used during incubation in association with oxygen consumption rate.
Microbial and oxygen experiments focused on two development periods, determined by
calculating cumulative daily water temperature units (30 to 36 CTU and 55 to 67 CTU;
Kempinger 1988), during embryogenesis when significant mortality occurs (Scribner and Marsh,
unpublished data). Beginning two days post-fertilization, eggs in couplings were exposed to
daily chemotherapeutants treatment: 1) 15 min, 500 ppm constant-flow hydrogen peroxide
treatment, 2) 15 min, 1667 uL/L constant-flow formalin treatment, or 3) a control (no chemical
treatment). Daily chemical treatments were performed until 24 hours prior to hatch.
Data collection
Body size. –At hatch, we used a digital camera to photograph and measure body size (total
length (TL mm), yolk-sac area (YSA mm²), and body area (BA mm²)) for a random subsample
(3≤n≤25) of fish from each treatment, and each family using Image J software (v.1.43u).
Survival. – Beginning at 3 days post-fertilization, dead eggs were removed and recorded at the
start of each day to quantify cumulative proportional survival at hatch.
Oxygen measurement. – At each of two development periods, eight eggs from each treatment
and each family (replicate) were sub-sampled to quantify mean oxygen consumption rate (mg/L /
5 min / eight eggs) using a 24-well SensorDish reader plate (PreSens Precision Sensing, GmbH,

40
Regensburg, Germany) (Naciri et al. 2008). Each well was filled with 1.5 mL of ambient 0.22
um, UV treated river water, and eight eggs from each treatment (including a negative control –
no eggs) were placed circumpolar to the electro-florescence sensor, and then topped with 0.5 mL
of sterile mineral oil. Oxygen consumption rate was recorded every 30 sec for up to one hr.
After 1 hr, eggs were removed from the SensorDish reader and placed into separate 2.0 mL posi-
click tubes, filled with 1.5 mL of 95% ethanol, for microbial 16S rRNA extraction. Oxygen
consumption rate data were plotted using Excel (time on x-axis, oxygen concentration y-axis)
and visually inspected to determine the initial point of decreasing oxygen concentration
(representing oxygen consumption) which has been shown to vary (up to 10 min from initial
measurement) (Warkentin et al. 2007, Strecker et al. 2011). Oxygen consumption was quantified
by identifying the initial decline point (time 1), and selecting a second time point (5 min later)
(time 2). Oxygen consumption was calculated for replicates of each treatment group and each
family by subtracting oxygen levels at time 2 from time 1 (mg/L). Selection criteria for time 1
and time 2 was necessary to capture the initial respiration rate prior to the point that embryo may
begin to ‘adapt’ to potentially hypoxic conditions (Strecker et al. 2011). Microbes were not
considered a significant source of oxygen loss during this experiment (Boucher 2012).
Microbial DNA extraction
Microbial genomic DNA was extracted from 8 eggs per treatment per time point using a
modified DNeasy Blood & Tissue QIAGEN Kit (QIAGEN Group, 2006). Modified steps
include the initial incubation of samples in an enzymatic lysis buffer at 37⁰C for 30 min followed
by bead-beating (Fujimoto et al. 2013) for 10 min. After bead-beating, steps were followed
manufacturer’s protocols. To ensure sufficient DNA was extracted for analysis, eight eggs from
each sample were pooled during the extraction process (Fujimoto et al. 2013). Amplification of

41
16S rRNA gene was used to estimate the microbial community composition as a function of
chemotherapeutants and development time period during incubation. Polymerase chain reaction
(PCR) was conducted in a 50 uL reaction volume, containing 10 uL template DNA (6 to 110
ng/uL), 0.4 uL of AquPrime HiFi Taq DNA polymerase (Invitrogen Corp., Carlsbad, CA), 5.0
uL 10X PCR Buffer II, 1.0 uL 454 HMP Forward Primer, 1.0 uL Barcode Reverse Primer, and
32.6 uL sterile water. Reactions were performed using the following thermocycle conditions;
initial denaturation step at 95ºC for 2 min, then 30 cycles of denaturation at 95ºC for 20 sec,
annealing at 55ºC for 30 sec, and extension at 72ºC for 7 min (Fujimoto et al. 2013).
Processing16S sequencing data
16S sequencing analysis was performed using default settings in program Mothur
(Schloss 2014). Sequences were assigned to operational taxonomic units (OTUs) using a 97%
similarity threshold. To statistically and graphically describe similarity and dissimilarity among
samples, program Mothur was used to compute alpha (Simpson 1949, Shannon 1948) and beta
(Bray and Curtis 1957) diversity indices and construct a dendrogram and lower-triangle
dissimilarity matrix based on Bray-Curtis values. Furthermore, to visualize relationships in
diversity among samples, a comparison of dominant phylotypes as function of
chemotherapeutant and developmental period were graphed as a stacked column chart using
Microsoft Excel.
Statistical Analysis
Trait differences among chemotherapeutant treatments tested included mean (±SE) body
size (TL, YSA, and BA) at hatch and mean proportional survival at hatch. Furthermore, oxygen
consumption rate and alpha diversity of egg microbial communities were tested at two
development periods as a function of different chemotherapeutants. Parameters were tested
using SAS (SAS Institute version 9.3 Cary, NC). Egg incubation coupling, which contained 150

42
to 200 eggs, was the experimental unit for all response variables used in the analysis. A p value
< 0.05 was considered statistically significant for all analyses. A general linear model using
analysis of variance was used to analyze all response variables except proportional survival.
Data for total length and yolk-sac area were log-transformed to validate the normality
assumption. Data for oxygen consumption was square-root transformed to validate the normality
assumption. A generalized linear mixed model using analysis of variance was used to analyze
survival data. Survival to hatch was modeled assuming a beta-distribution and reported as
proportional survival. We used Tukey-Kramer multiple pair-wise comparison tests for all
response variables.

43
RESULTS
Effects of chemotherapeutants on body size at hatch
The effect of chemotherapeutant treatments on body size at hatch was not statistically
significant (TL: F2,3 = 3.20, P = 0.1801; YSA: F2,3 = 0.63, P = 0.5908 ; BA: F2,3 = 0.1.87, P =
0.2975). Mean (±SE) body size at hatch was smallest for individuals hatching from eggs treated
with formalin (TL = 12.30 ±0.54, YSA = 8.14 ±0.16, BA = 24.76 ±3.64) and largest for
individuals from control groups (TL = 13.81 ±0.35, YSA = 8.39 ±0.29, BA = 30.51 ±0.91) with
the exception of body area which was largest in individuals that hatched from eggs treated with
peroxide (TL = 13.41 ±0.41, YSA = 8.54 ±0.30, BA = 30.39 ±1.83) (Table 6).
Effects of chemotherapeutants on survival at hatch
The effect of chemotherapeutant treatments on mean proportion of eggs surviving to
hatch was not significant (F2,3 = 1.78, P = 0.3097). Mean (±SE) proportional survival in the
control (0.43 ±0.18) was lower than that observed in hydrogen peroxide (0.62 ±0.03), and higher
than that observed in with formalin (0.32 ±0.21) (Table 6).
Effects of chemotherapeutants on embryo oxygen consumption
The effects of chemotherapeutant treatments on mean (±SE) oxygen consumption rate
(mg/L /5 min for eight eggs) at development periods 1 and 2 were not statistically significant
(time 1: F2,3 = 0.07, P = 0.9305, time 2: F2,3 = 1.00, P = 0.4642). Compared to a control (0.32
±0.01 mg/L) at development period 1, mean oxygen consumption rate was higher in groups
treated with peroxide (0.34 ±0.01 mg/L), and lower in groups treated with formalin (0.31 ±0.10
mg/L); however, differences were not statistically significant (Table 6). Compared to the control
(0.50 ±0.11 mg/L) at development period 2, mean oxygen consumption rate was higher in groups
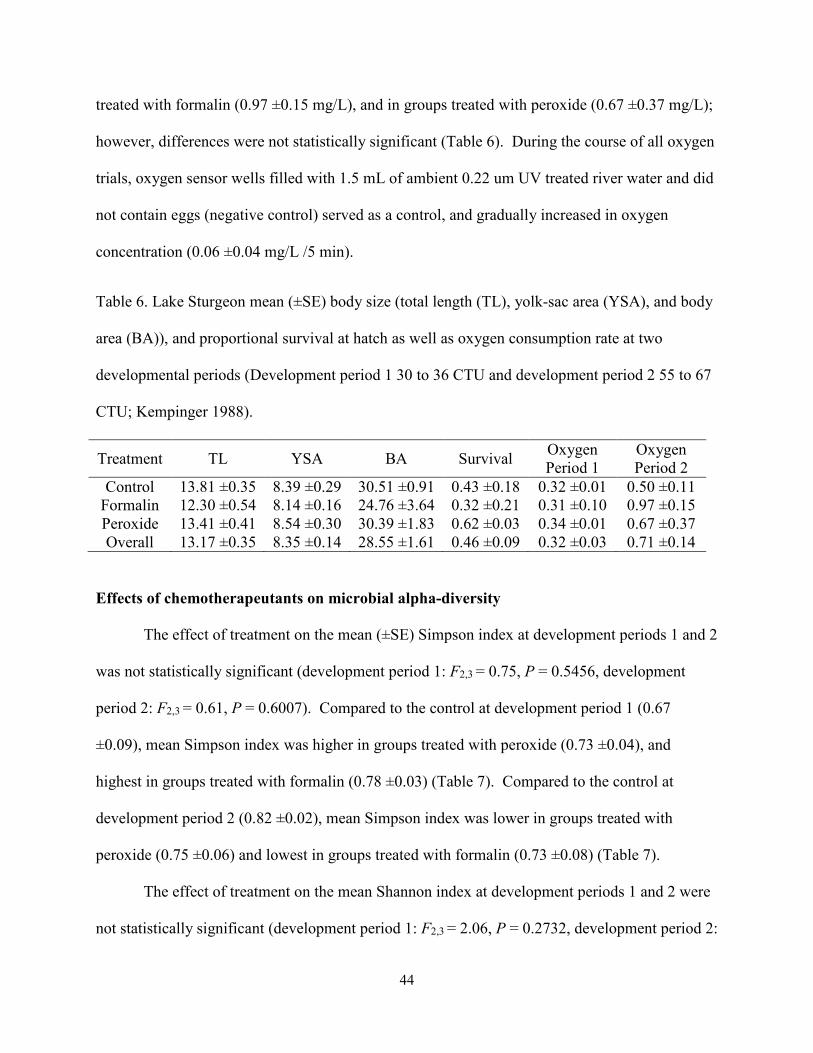
44
treated with formalin (0.97 ±0.15 mg/L), and in groups treated with peroxide (0.67 ±0.37 mg/L);
however, differences were not statistically significant (Table 6). During the course of all oxygen
trials, oxygen sensor wells filled with 1.5 mL of ambient 0.22 um UV treated river water and did
not contain eggs (negative control) served as a control, and gradually increased in oxygen
concentration (0.06 ±0.04 mg/L /5 min).
Table 6. Lake Sturgeon mean (±SE) body size (total length (TL), yolk-sac area (YSA), and body
area (BA)), and proportional survival at hatch as well as oxygen consumption rate at two
developmental periods (Development period 1 30 to 36 CTU and development period 2 55 to 67
CTU; Kempinger 1988).
Effects of chemotherapeutants on microbial alpha-diversity
The effect of treatment on the mean (±SE) Simpson index at development periods 1 and 2
was not statistically significant (development period 1: F2,3 = 0.75, P = 0.5456, development
period 2: F2,3 = 0.61, P = 0.6007). Compared to the control at development period 1 (0.67
±0.09), mean Simpson index was higher in groups treated with peroxide (0.73 ±0.04), and
highest in groups treated with formalin (0.78 ±0.03) (Table 7). Compared to the control at
development period 2 (0.82 ±0.02), mean Simpson index was lower in groups treated with
peroxide (0.75 ±0.06) and lowest in groups treated with formalin (0.73 ±0.08) (Table 7).
The effect of treatment on the mean Shannon index at development periods 1 and 2 were
not statistically significant (development period 1: F2,3 = 2.06, P = 0.2732, development period 2:
Treatment TL YSA BA Survival Oxygen
Period 1
Oxygen
Period 2
Control 13.81 ±0.35 8.39 ±0.29 30.51 ±0.91 0.43 ±0.18 0.32 ±0.01 0.50 ±0.11
Formalin 12.30 ±0.54 8.14 ±0.16 24.76 ±3.64 0.32 ±0.21 0.31 ±0.10 0.97 ±0.15
Peroxide 13.41 ±0.41 8.54 ±0.30 30.39 ±1.83 0.62 ±0.03 0.34 ±0.01 0.67 ±0.37
Overall 13.17 ±0.35 8.35 ±0.14 28.55 ±1.61 0.46 ±0.09 0.32 ±0.03 0.71 ±0.14

45
F2,3 = 0.75, P = 0.5430). Compared to the control at development period 1 (1.28 ±0.14), mean
Simpson index was higher in groups treated with peroxide (1.79 ±0.40), and highest in groups
treated with formalin (2.03 ±0.17) (Table 7). Compared to the control at development period 2
(2.08 ±0.09), mean Shannon index was lower in groups treated with peroxide (1.84 ±0.16) and
lowest in groups treated with formalin (1.70 ±0.33) (Table 7).
Table 7. Microbial alpha diversity estimated for lake sturgeon eggs exposed to different
chemotherapeutants at two developmental periods (Development period 1 30 to 36 CTU and
development period 2 55 to 67 CTU; Kempinger 1988). Alpha diversity indices include
Simpson, Shannon diversity indices (Simpson’s and Shannon diversity indices; mean (±SE)).
Treatment Simpson
Period 1
Simpson
Period 2
Shannon
Period 1
Shannon
Period 2
Control 0.67 ±0.09 0.82 ±0.02 1.28 ±0.14 2.08 ±0.09
Formalin 0.78 ±0.03 0.73 ±0.08 2.03 ±0.17 1.70 ±0.33
Peroxide 0.73 ±0.04 0.75 ±0.06 1.79 ±0.40 1.84 ±0.16
Overall 0.73 ±0.03 0.77 ±0.03 1.70 ±0.18 1.87 ±0.12
Microbial phylotypes which contributed 5 percent or higher of the mean proportional
abundance in the control group at development period 1 included: Enterobacteriaceae (0.30),
Comamonadaceae (0.17), Oxalobacteraceae (0.16), Veillonellaceae (0.09), Clostridiaceae (0.09),
and Burkholdariales (0.07) (Figure 3). In addition, for the control at development period 1,
phylotypes identified as Flavobacteriaceae included 3 species and comprised approximately 0.03
of the mean proportional contribution to the microbial community (Figure 3). Phylotypes which
contributed to 5 percent or higher of the mean proportional abundance in the formalin group at
developmental period 1 included: Comamonadaceae (0.27), Flavobacteriaceae (0.25),
Flavobacteriaceae (0.17), Oxalobacteraceae (0.06), and Burkholdariales (0.05) (Figure 3). In
addition, for formalin at developmental period 1, Flavobacteriaceae included 5 species and

46
comprised approximately 0.44 of the mean proportional contribution to the microbial community
(Figure 3). Phylotypes which contributed to 5 percent or higher of the mean proportional
abundance in the peroxide group at developmental period 1 included: Comamonadaceae (0.23),
Aeromonadaceae (0.21), Clostridiaceae (0.16), Shewanellaceae (0.08), and Flavobacteriaceae
(0.06) (Figure 3). In addition, for peroxide at developmental period 1, Flavobacteriaceae
included 5 species and comprised approximately 0.12 of the mean proportional contribution to
the microbial community (Figure 3).
Phylotypes which contributed 5 percent or higher of the mean proportional abundance in
the control group at development period 2 included: Enterobacteriaceae (0.27), Veillonellaceae
(0.27), Comamonadaceae (0.10), Burkholdariales (0.06), Burkholdariales (0.06), and
Neisseriaceae (0.05) (Figure 3). In addition, for the control at development period 2, phylotypes
identified as Flavobacteriaceae included 3 species and comprised approximately 0.01 of the
mean proportional contribution to the microbial community (Figure 3). Phylotypes which
contributed to 5 percent or more of the mean proportional abundance in the formalin group at
developmental period 1 included: Comamonadaceae (0.35), Oxalobacteraceae (0.28),
Enterobacteriaceae (0.16), and Aeromonadaceae (0.06), (Figure 3). In addition, for formalin at
developmental period 2, Flavobacteriaceae included 3 species and comprised approximately 0.01
of the mean proportional contribution to the microbial community (Figure 3). Phylotypes which
contributed to 5 percent or higher of the mean proportional abundance in the peroxide group at
developmental period 2 included: Enterobacteriaceae (0.40), Comamonadaceae (0.25),
Oxalobacteraceae (0.09), and Chromatiaceae (0.08) (Figure 3). In addition, for peroxide at
developmental period 2, Flavobacteriaceae included 3 species and comprised approximately 0.05
of the mean proportional contribution to the microbial community (Figure 3).

47
Figure 3. Microbial phylotype mean proportional abundance as a function of embryonic
development time and chemotherapeutant treatment. Thirty major phylotypes represented in the
community sample based on 5 percent contribution to total operational taxonomic units. Each
unique color represents a unique species phylotype based on 97% similarity of operational
taxonomic units.
Effects of chemotherapeutants on microbial beta-diversity
Among treatments comparisons at developmental period 1 between peroxide and
formalin (0.73 ±0.30) suggests moderate dissimilarity as a function of chemotherapeutant
treatment (Table 8: Figure 3). Mean Bray-Curtis dissimilarity index between egg microbial
communities at developmental period 2 for the control suggests moderate dissimilarity compared
to peroxide (0.51 ±0.06) and formalin (0.64 ±0.16) (Table 8: Figure 3). An additional
comparison at developmental period 2 between peroxide and formalin (0.46 ±0.11) communities
0.00
0.10
0.20
0.30
0.40
0.50
0.60
0.70
0.80
0.90
1.00
Co
ntr
ol
Form
alin
Per
ox
ide
Co
ntr
ol
Form
alin
Per
ox
ide
Time 1 Time 2
Ph
ylo
typ
e M
ea
n P
ro
po
rti
on
al A
bu
nd
an
ce i
n C
om
mu
nit
y
Neisseriales_Neisseriaceae_Vogesella
Actinomycetales_Microbacteriaceae_unclassified
Flavobacteriales_Flavobacteriaceae_Flavobacterium
Sphingomonadales_Sphingomonadaceae_unclassified
Sphingomonadales_Sphingomonadaceae_unclassified
Methylophilales_Methylophilaceae_Methylophilus
Rhodobacterales_Rhodobacteraceae_unclassified
Alteromonadales_Shewanellaceae_Shewanella
Sphingomonadales_Sphingomonadaceae_Sphingobium
Selenomonadales_Veillonellaceae_Zymophilus
Caulobacterales_Caulobacteraceae_Brevundimonas
Rhizobiales_Rhizobiaceae_Rhizobium
Sphingomonadales_unclassified_unclassified
Burkholderiales_Burkholderiales_incertae_sedis_Aquabacterium
Burkholderiales_Burkholderiales_incertae_sedis_unclassified
Clostridiales_Clostridiaceae_1_unclassified
Chromatiales_Chromatiaceae_Rheinheimera
Pseudomonadales_Pseudomonadaceae_Pseudomonas
Flavobacteriales_Flavobacteriaceae_Flavobacterium
Rhodobacterales_Rhodobacteraceae_Rhodobacter
Burkholderiales_Oxalobacteraceae_Massilia
Aeromonadales_Aeromonadaceae_Aeromonas
Enterobacteriales_Enterobacteriaceae_Yersinia
Flavobacteriales_Flavobacteriaceae_Flavobacterium
Burkholderiales_Oxalobacteraceae_unclassified
Clostridiales_Clostridiaceae_1_Clostridium_sensu_stricto
Burkholderiales_Burkholderiales_incertae_sedis_Sphaerotilus
Flavobacteriales_Flavobacteriaceae_Flavobacterium
Flavobacteriales_Flavobacteriaceae_Flavobacterium
Burkholderiales_Comamonadaceae_unclassified

48
suggest lower dissimilarity with respect to the control (0.57 ±0.11) at development period 2
(Table 8: Figure 3).
Table 8. Mean (±SE) Bray-Curtis dissimilarity index of lake sturgeon egg microbial community
as a function of development period (Development period 1 30 to 36 CTU and development
period 2 55 to 67 CTU; Kempinger 1988) and chemotherapeutant.
Time 1 1 1 2 2 2
Time Treatment Control Formalin Peroxide Control Formalin Peroxide
1 Control 0.00 ±0.00
1 Formalin 0.84 ±0.20 0.00 ±0.00
1 Peroxide 0.70 ±0.33 0.73 ±0.30 0.00 ±0.00
2 Control 0.66 ±0.42 0.52 ±0.06 0.63 ±0.29 0.00 ±0.00
2 Formalin 0.93 ±0.07 0.30 ±0.06 0.84±0.16 0.64 ±0.16 0.00 ±0.00
2 Peroxide 0.78 ±0.30 0.43 ±0.05 0.65 ±0.46 0.51 ±0.06 0.46 ±0.11 0.00 ±0.00
Figure 4. Neighbor-joining tree construct using Bray-Curtis dissimilarity for lake sturgeon egg
microbial communities as a function of embryonic development period (Development period 1
30 to 36 CTU and development period 2 55 to 67 CTU; Kempinger 1988) and
chemotherapeutant treatment.
Time 1 Control
Time 1 Peroxide
Time 2 Control
Time 1 Formalin
Time 2 Formalin
Time 2 Peroxide

49
DISCUSSION
In this study, the effects of chemotherapeutants on lake sturgeon eggs and post-hatch
free-embryos were quantified using egg survival, egg oxygen consumption rate, and body size
data. Results revealed that these variables did not vary significantly among treatments. This
study incorporated a novel approach by using 16S genomic data to quantify the community
composition of bacteria present on the egg surface in response to different chemotherapeutants
utilized in aquaculture. In this study peroxide, among chemotherapeutants commonly utilized in
streamside hatcheries, showed a higher mean proportional survival compared to formalin and the
control (although results were not statistically significant). Additionally, chemotherapeutants
may have selected for microbial communities that have been determined in other studies to be
pathogenic, which warrants additional studies and possible refinement of hatchery egg-treatment
protocols.
Impact of chemotherapeutants on body size, survival, and oxygen consumption
Body size at hatch. – No significant effect of chemotherapeutant was identified using body size
parameters (total length, yolk-sac area, and body area) measured. However, the larger mean total
length at hatch from eggs in the control groups compared to those from the same families treated
with formalin or peroxide can be of biological significance for larvae during subsequent life
periods. For example, studies have reported that larger size at hatch is positively correlated with
the timing and likelihood of first-feeding, which is associated with larval survival (Gisbert et al.
2000, Blaxter and Hempel 1963). In this study, survival was not monitored beyond hatch,
therefore, additional studies are needed to quantify the effects of chemotherapeutants on survival
during subsequent life periods.

50
Egg survival. – The effect of chemotherapeutants on the mean proportion of survival to hatch
was not significant. However, though variability was high across replicates we did observe 20 to
30% differences in survival as a function of chemotherapeutant which is of practical significance
to hatchery managers. For example, if survival at the egg period limits hatchery production, use
of hydrogen peroxide as a chemotherapeutant may be beneficial, without reducing body size as
was demonstrated when formalin was applied. We failed to detect significant differences among
treatments likely due to high variability among replicates. For the purposes of these
experiments, we utilized family as a replicate which may have contributed to observed
variability.
Survival, measured as proportional hatch success, was similar across treatments,
compared to other studies. For example, Rach et al. (1998) showed that hatch success between
peroxide groups compared to controls were 57% and 40%, respectively and in an additional
study using formalin (Rach et al. 1997), treated eggs exhibited a 54% hatch rate versus 42% in
the control. However, in this study we failed to detect significant differences between treatments
likely due to the variability in replicates. For the purposes of these experiments, we utilized
family as a replicate which may have contributed to observed variability. Additional studies are
needed to account for variability that may be associated with family (genetic effects).
Oxygen consumption rate. – In this study, oxygen consumption rate was measured in attempt to
identify physiological stress associated with chemotherapeutants use. Results from this study
revealed that oxygen consumption rate did not vary significantly among treatment.
Chemotherapeutants are commonly administered during egg development to treat or prevent
microbial colonization of the egg surface which may contribute to egg asphyxiation (Barker

51
1989). However, we did not observe differences in oxygen consumption rate of controls
compared to groups treated with either formalin or peroxide.
Higher oxygen consumption rates at the second development period relative to the first
are consistent with embryonic stage of development. In this study, no effect of treatment was
observed for oxygen consumption rates at either developmental period. Results suggest that 1)
eggs are not affected (or stressed) by chemotherapeutant treatment and therefore do not alter
respiration rates, 2) the species composition of microbial communities and the abundance of
microbes present did not negatively affect egg oxygen consumption rates, or 3) experimental
manipulations of eggs were equally stressful and contributed to undetected differences due to
chemotherapeutant across all treatments. Furthermore it could be that the timing of oxygen
consumption trials, relative to when chemotherapeutants were administered provided ample time
for eggs to normalize post-treatment. In this study, oxygen consumption rates were administered
several hours after application of chemotherapeutants. To date, no known study has documented
oxygen consumption rates for lake sturgeon eggs. Oxygen consumption data summaries
provided herein are beneficial to future studies investigating oxygen consumption of developing
embryos and two critical development periods.
Impacts of chemotherapeutants on egg microbial diversity
There was no effect of chemotherapeutants on the alpha diversity (species richness)
within treatment groups at two developmental periods sampled during embryogenesis. However,
there are notable differences at developmental period 1 with regard to microbial beta-diversity
that deserves attention. At development period 1 for example, dissimilarity indices suggest that
peroxide and formalin treated groups select for dissimilar microbial communities. Phylotypes
present in formalin and peroxide groups were dissimilar compared the controls, especially at
52
developmental period 1, and the increase in abundance of pathogens (i.e., Flavobacteriaceae;
Barnes et al. 2009, Loch et al. 2013) among these two chemotherapeutants compared to the
controls is a concern.
Conclusions
Relative to parameters measured in this study (egg survival, egg oxygen consumption
rate, microbial community composition, and body size at hatch), benefits of treating lake
sturgeon eggs using peroxide or formalin were not apparent. However, using the novel genomic
interrogation of egg microbe communities it was demonstrated that beta diversity on the egg
surfaces are altered as a function of chemotherapeutant treatment which is a concern. The
downstream effects of these treatments and those altered microbial community structures on
growth and survival at subsequent life periods is important, warranting additional studies.

53
LITERATURE CITED

54
LITERATURE CITED
Balon, E. K. 1975. Reproductive guild of fishes: A proposal and definition. Journal of Fisheries
Research Board of Canada 32(6):821-864.
Barker, G. A., S. N. Smith, and N. R. Bromage. 1989. The bacterial flora of Rainbow Trout,
Salmo gairdneri Richardson, and Brown Trout, Salmo trutta L., eggs and its relationship to
developmental success.
Barnes, M. E., D. Bergmann, H. Stephenson, M. Gabel, and R. J. Cordes. 2005. Bacterial
numbers from landlocked fall Chinook Salmon eyed eggs subject to various formalin treatments
as determined by scanning electron microscopy and bacteriological culture methods. North
American Journal of Aquaculture 67(1):23-33.
Barnes, M. E., D. Bergmann, J. Jacobs, and M. Gabel. 2009. Effect of Flavobacterium
columnare inoculation, antibiotic treatments and resident bacteria on rainbow trout Oncorynchus
mykiss eyed egg survival and external membrane structure. Journal of Fish Biology 74:576-590.
Blaxter, J. H. S., and G. Hempel. 1963. The influence of egg size on Herring larvae (Clupea
harengus L.). J. Const. Int. Explor. Mer. 28:211-240.
Boucher, M. A. 2012. The effect of substrate on the growth, development, and survival of larval
white sturgeon (Acipenser transmontanus) during early ontogeny. University of Northern British
Columbia Master’s Thesis.
Bowker, J., M. Gaikowski, A. Goodman, L. Sprague, and M. Bowman. 2011. Guide to using
drugs, biologics, and other chemicals in aquaculture. U. S. Fish and Wildlife Service Aquatic
Animal Drug Approval Partnership Program http://www.fws.gov/fisheries/aadap/home.htm 1-62.
Bray, J. R., and J. T. Curtis. 1957. An ordination of the upland forest communities southern
Wisconsin. Ecological Monographs 27:325:349.
Bronzi, P., H. Rosenthal, G. Arlati, and P. Williot. 1999. A brief overview on the status and
prospects of sturgeon farming in Western and Central Europe. Journal of Applied Ichthyology
15:224-227.
Cherr, G. N., and W. H. Clark. 1982. Fine structures of the envelope and micropyles in the eggs
of the White Sturgeon, Acipenser transmontanus Richardson. Developmental Growth and
Differentiation 24(4):341-352.
Cherr, G. N., and W. H. Clark. 1984. Jelly release in the eggs of the White Sturgeon, Acipenser
transmontanus: An enzymatically mediated event. The Journal of Experimental Zoology
230:145-149.

55
Crossman, J. A., P. S. Forsythe, K. T. Scribner, and E. A. Baker. 2011. Hatchery rearing
environment and age affect survival and movements of stocked juvenile lake sturgeon. Fisheries
Management Ecology 18:132-144.
Detlaff, T. A., A. S. Ginsburg, O. I. Schmalhausen, G. G., Gause, and S. G. Vassetzky. 1993.
Sturgeon fishes: Developmental biology and aquaculture. Springer-Verlag 1st Edition.
Forsythe, R. S., K. T. Scribner, J. A. Crossman, A. Ragavendran, and E. A. Baker. 2013.
Experimental assessment of the magnitude and source of Lake Sturgeon egg mortality.
Transactions of the American Fisheries Society 142:1005-1011.
Fujimoto, M., J. A. Crossman, K. T. Scribner, and T. A. Marsh. 2013. Microbial community
assembly and succession on Lake Sturgeon egg surfaces as a function of simulated spawning
stream flow rate. Microbial Ecology 66:500-511.
Gisbert, E., P. Williot, and F. Castello-Orvay. Influence of egg size on growth and survival of
early stages of Siberian sturgeon (Acipenser baeri) under small scale hatchery conditions.
Aquaculture 183:83-94.
Hansen, G. H., and J. A. Olafsen. 1989. Bacterial colonization of Cod (Gadus morhua L.) and
Halibut (Hippoglossus hippoglossus) eggs in marine aquaculture. Applied and Environmental
Microbiology 55(6):1435-1446.
Hansen, G. H., O. Bergh, J. Michaelsen, and D. Knappskog. 1992. Flexibacter ovolyticus sp.
Nov., a pathogen of eggs and larvae of Atlantic Halibut, Hippoglossus hippoglossus L.
International Journal of Systematic Bacteriology 42(3):451-458.
Hansen, G. H., and J. A. Olafsen. 1999. Bacterial interactions in early life stages of marine cold
water fish. Microbial Ecology 38:1-26.
Holtgren, J. M., S. A. Ogren, A. J. Paquet, and S. Fajfer. 2007. Design of a portable streamside
rearing facility for Lake Sturgeon. North American Journal of Aquaculture 69:317-323.
Kempinger, J. J. 1988. Spawning ad early life history of lake sturgeon in the Lake Winnebago
system, Wisconsin. American Fisheries Society Symposium 5:110-122.
Memis, D., E. Ercan, M. S. Celikkale, M. Timur, and Z. Zarkua. 2009. Growth and survival rate
of Russian Sturgeon (Acipenser gueldenstaedtii) larvae from fertilized eggs to artificial feeding.
Turkish Journal of Fisheries and Aquatic Sciences 9:47-52.
Meyer, F. P. 1991. Aquaculture disease and health management. Journal of Animal Science
69:4201-4208.
Naciri, M., D. Kuystermans, and M. Al-Rubeai. 2008. Monitoring pH and dissolved oxygen in
mammalian cell culture using optical sensors. Cytotechnology 57:245-250.
Nelson, M. C., H. G. Morrison, J. Benjamino, S. L. Grim, ad J. Graf. 2014. Analysis,
optimization and verification of illumina-generated 16S rRNA gene amplicon surveys. PLOS
ONE 9(4):1-14.
56
Rach, J. J., M. P. Gaikowski, G. E. Howe, and T. M. Schreier. 1998. Evaluation of the toxicity
and efficacy of hydrogen peroxide treatments on eggs of warm- and coolwater fishes.
Aquaculture 165:11-25.
Rach, J. J., G. E. Howe, and T. M. Schreier. 1997. Safety of formalin treatments on warm- and
coolwater fish eggs. Aquaculture 149:183-191.
Schloss P. D., D. Gevers, and S. L. Westcott. 2014. Reducing the effects of PCR amplification
and sequencing artifacts on 16S rRNA-based studies. PloS ONE. 6:e27310.
Shannon, C. E. 1948. A mathematical theory of communication. Reprinted for the Bell System
Technical Journal with corrections 5(1):3-55.
Sharrer, M. J., S. T. Summerfelt, G. L. Bullock, L. E. Gleason, and J. Taeuber. 2005. Inactivation
of bacteria using ultraviolet irradiation in a recirculating salmonid culture system. Aquacultural
Engineering 33:135-149.
Simpson, E. H. 1949. Measurement of diversity. Nature 163:688-689.
Stephenson, H., M. Gabel, and M. E. Barnes. 2003. Microbial inhibition in response to
treatments of hydrogen peroxide and formalin on landlocked fall Chinook Salmon eyed eggs, as
determined by scanning electron microscopy. North American Journal of Aquaculture
65(4):324-329.
Strecher, R., T. B. Seiler, H. Hollert, T. Braunbeck. 2011. Oxygen requirements of zebrafish
(Danio rerio) embryos in toxicity tests with environmental samples. Comparative Biochemistry
and Physiology 318-327.
Van Den Berg, A. H., D. McLaggan, J. Dieguez-Uribeondo, and P. Van West. 2013. The impact
of the water moulds Saprolignia diclina and Saprolegnia parasitica on natural ecosystems and
the aquaculture industry. Fungal Biology Reviews 27:33-42.
Wagner, E. J., R. W. Oplinger, and M. Bartley. 2012. Laboratory production scale disinfection of
salmonid eggs with hydrogen peroxide. North American Journal of Aquaculture 74(1):92-99.
Warkentin, M., H. M. Freese, U. Karsten, and R. Schumann. 2007. New and fast method to
quantify respiration rates of bacterial and plankton communities in freshwater ecosystems by
using optical oxygen sensor spots. Applied Environmental Microbiology 73(21):6722-6729.
IUCN, 2010. http://www.iucnredlist.org/details/223/0 (January 2015).

57
CHAPTER III: EFFECTS OF REARING DENSITY ON BODY SIZE AND SURVIVAL OF
LAKE STURGEON (ACIPENSER FULVESCENS) FREE-EMBRYOS
ABSTRACT
Experiments were conducted to identify aquaculture conditions that improve growth and
survival. We quantified the effects of rearing density, family, and dissolved oxygen
concentration on free-embryo Lake Sturgeon (Acipenser fulvescens) body size and survival to the
time of emergence. Experiments were conducted using free-embryos from two full-sibling
families that were reared in four densities in 3.0 L aquaria. A significant density and family
effect on free-embryo body size at emergence was documented. Mean (±SE) body size (mm) at
emergence for rearing density of 9,688 (22.9 ±0.16) individuals per m2 was significantly greater
than mean body size of rearing densities of 19,375 (22.4 ±0.14) and 32,292 (21.8 ±0.17)
individuals per m2. Mean body size at emergence differed significantly between families (22.8
±0.13 mm versus 22.1 ±0.11 mm). Mean (±SE) dissolved oxygen concentration (mg/L)
decreased significantly as a function of increasing fish density. Mean dissolved oxygen
concentration from 3,229 individuals per m2 treatment was significantly greater than those from
the 19,375 (7.77 ±0.018) and 32,292 individuals per m2 (7.71 ±0.035) treatments. Mean survival
to emergence decreased as rearing density increased (0.976 ±0.008 versus 0.928 ±0.023; P =
0.97) from the 9,688 individuals per m2 treatment to 32,292 individuals per m2 treatment. There
was no significant difference in survival between families. Results reveal that rearing density of
free-embryos should be considered because of the effects on body size at emergence. These
results are useful for development of standard operating procedures in traditional and
conservation aquaculture facilities where free-embryos are raised.
58
INTRODUCTION
Survival and growth of free-embryo, and through subsequent ontogenetic life periods is
important to commercial as well as conservation aquaculture production programs. Rearing
conditions experienced at the free-embryo stage affects body size of larvae and is a significant
predictor of the likelihood of first-feeding and of mortality linked to starvation (Cushing 1972,
Heming and Buddington 1988, Hardy and Litvak 2002). However, there are few studies that
identify aquaculture conditions that improve free-embryo body size at emergence and initiation
of exogenous feeding, and results vary among taxa (Heming and Buddington 1988, Kamler
2008).
During the free-embryo stage, fish rely entirely on endogenous yolk-sac reserves for
energy and growth development (Heming and Buddington 1988, Kamler 2008). The rate or
efficiency at which yolk-reserves are utilized for growth is dependent upon abiotic (i.e.,
dissolved oxygen, light, temperature) and biotic factors (i.e., maternal provisioning) (Heming
and Buddington 1988, Kamler 2008). These factors dictate, how yolk reserves are allocated with
respect to either body tissue development or for competing anaerobic processes such as those
experienced during respiration in response to stress (Kamler 2008). If free-embryos are reared
under stressful conditions, there can be profound direct (mortality) and indirect (lower growth)
effects (Bates 2014, Boucher 2014). For example, stressful rearing conditions, such as those
experienced by negatively phototactic free-embryo in the absence of refugia, increases the rate at
which yolk-reserves are devoted to respiration (for locomotion) rather than to somatic
development (Hansen and Moller 1985, Finn et al. 1995, Bates 2014, Boucher 2014).
Additionally, biotic factors such as maternal provisioning (i.e., egg size) are documented to have

59
significant direct and indirect effects on free-embryos (Gisbert et al. 2000, Kamler 2008, Regnier
et al. 2012). In general, environmental conditions experienced during early life stages can also
affect traits during later ontogenetic stages (ontogenetic contingency; Diggle 1994), and thus
performance in aquaculture settings. Understanding the direct and indirect effects of
environmental conditions on yolk-reserve allocation, and thus body size, helps define
aquaculture practices that reduce stressful conditions and improve growth (e.g., as estimated by
body size at time of emergence).
Sturgeons, given their high market value and worldwide conservation status, are an
important species group (IUCN 2010, Bronzi et al. 1999, Holtgren et al. 2007) in aquaculture.
Recent research conducted with White (Acipenser transmontanus) and Lake (Acipenser
fulvescens) sturgeons has improved our understanding of species-specific behaviors (Hastings et
al. 2013, Boucher et al. 2014) which in turn has informed research needs for best aquaculture
practices. For example, Boucher et al. (2014) showed that providing cover to free-embryo
rearing tanks improved body size and survival at emergence, as well as survival to subsequent
life periods. However, other attributes of the rearing environment such as rearing density and
dissolved oxygen concentration may also be important when rearing free-embryo sturgeons
(Ceskleba 1985), yet data are lacking.
Our primary objective was to evaluate the effects of rearing conditions on free-embryo
body size and survival at emergence. Specifically, we quantified the effects of rearing density
and family, as well as dissolved oxygen concentration, on free-embryo lake sturgeon body size
and survival at emergence. Our hypothesis was that body size and survival would decrease as a
function of increasing rearing density from the time of hatch to emergence.

60
METHODS
Study site
Use of conservation streamside rearing facilities, such as the Black River Streamside
Rearing Facility (BR-SRF) have been widely advocated in the Great Lakes basin as the preferred
method for culturing lake sturgeon in situations, where restoration goals to repatriate or enhance
populations can be met by stocking (Holtgren et al. 2007). The BR-SRF is supplied with
ambient river water (~680 L/min) from the Kleber Reservoir, located near primary spawning
areas for lake sturgeon in the upper Black River in Cheboygan County, Michigan. This study
was conducted in June 2013 and the BR-SRF water temperature ranged from 17.7 to 20.5⁰C with
a mean of 19.06⁰C.
Fertilization and incubation
Gametes were collected from two male and two female lake sturgeon spawning in the
upper Black River following procedures described by Crossman et al. (2011). Gametes were
transported to the BR- SRF for fertilization, which took place within four hours of collection.
Prior to fertilization, we subsampled 20 eggs from each female and preserved them separately in
90% ethanol to measure egg size at a later date. Approximately 200 mL of eggs per female were
placed into separate dry bowls. Milt samples from a separate male per female were activated
using a 1:200 dilution of ambient river water and immediately poured over the eggs allowing 90
seconds for fertilization. Excess milt was then removed and eggs were rinsed once with ambient
river water. Egg de-adhesion procedures began by applying a Fuller’s Earth solution (Sigma
Aldrich) and gently mixing for 50 min. After 50 min, Fuller’s Earth was rinsed from the eggs
and a 15 min, 50 ppm Iodophor disinfection treatment was administered. Following a 10 min

61
rinse to remove residual Iodophor using ambient river water, eggs were transferred to Aquatic
Eco-Systems (Pentair) J32 Mini Egg-hatching jars for incubation. Beginning two days post
fertilization; eggs were treated daily using a 500 ppm, 15 min bath treatment of hydrogen
peroxide until 24 hours prior to hatch. Preserved eggs (n=20 per female) were photographed
with a ruler for scale and egg diameter was measured at the greatest linear distance (mm ±SE)
using Image J software (v.1.43u).
Experimental treatments
Density experiments were conducted using free-embryos from two full-sibling families in
four different rearing densities (n=50, n=150, n=300, n=500 offspring per 3.0 L tank; 3,229,
9,688, 19,375, and 32,292 individuals per m2). Densities are representative of currently utilized
protocols in sturgeon production facilities (DiLauro et al. 1998, Deng et al. 2003, Boucher et al.
2014, and Wisconsin DNR unpublished data). Rearing density was based on total rearing area of
the tank bottom. We kept families separate for the duration of this experiment to account for
differences in body size or survival associated with family. At hatch, free-embryos were
randomly placed into tanks by family until four replicates of each tank density level were filled
(32 tanks in total). During the free-embryo period, lake sturgeon seek refuge in substrate
(Hastings et al. 2013). Therefore, we utilized 3.0 L polycarbonate tanks (Aquatic Habitats)
filled with a single layer (n=24) of 2.54 cm3 sinking Bio-Balls (Pentair #CBB1-S) covering the
tank bottom. Tank flow was set at a rate of 57 L/hr (~20 changes per hr) and checked daily. We
used a 12 hr light and 12 hr dark environment. Mortality was recorded at the start of each
rearing day to quantify survival to emergence. Dissolved oxygen (mg/L) was recorded (YSI
ProODO Optical DO/Temp Meter) multiple times daily in each tank and reported as mean
dissolved oxygen concentration. At emergence, we used a digital camera to photograph and

62
measure a random subsample (n=30) of fish from each treatment, each family and each replicate
for body size (total length (TL) mm) using Image J software (v.1.43u).
Statistical analysis
We tested for differences in mean (±SE) egg size, mean body size at emergence, mean
dissolved oxygen concentration, and mean proportional survival as a function of fixed effects
including rearing density and family, using SAS (SAS Institute version 9.3 Cary, NC). Tank was
the experimental unit for all response variables used in the analysis. Normality assumptions
were assessed using the Shapiro-Wilk Test. Homogeneity of variance assumptions were
assessed using the Levene’s Test. A p value < 0.05 was considered statistically significant for all
analyses.
Comparison of mean egg size data between families were conducted using a two-sample
t-test. A general linear model using analysis of variance was used to analyze body size at
emergence and mean dissolved oxygen concentration. A generalized linear model using a logit
link function and analysis of variance was used to analyze survival data. Survival to emergence
data were modeled as a binomially distributed variable and reported as the proportion of
survival. We used Tukey-Kramer multiple pair-wise comparison tests for all response
variables.

63
RESULTS
Effects of rearing density and family on body size at emergence
Body size at emergence decreased as a function of increasing rearing density. We
documented a significant density (F3, 25 = 31.61, P < 0.0001) and family (F1, 25 = 82.36, P <
0.0001) effect on free-embryo body size at emergence. Multiple pair-wise comparison tests
revealed no significant difference in mean body size at emergence for rearing densities of 50 (TL
= 22.7 ±0.21) versus 150 (TL = 22.9 ±0.16) fish per tank (t25 = 0.91, P = 0.7988) (Table 9).
However, multiple pair-wise comparison tests revealed that mean body size at emergence for
rearing density of 50 fish per tank was significantly greater than mean body size of rearing
densities 300 (TL = 22.4 ±0.14) and 500 (TL = 21.8 ±0.17) fish per tank (t25 = -3.10, P = 0.0228
and t25 = 7.77, P < 0.0001, respectively) (Table 9). In addition, mean body size at emergence for
rearing density of 150 (TL = 22.9 ±0.16) fish per tank was significantly greater than mean body
size of rearing densities of 300 (TL = 22.4 ±0.14) and 500 (TL = 21.8 ±0.17) fish per tank (t25 =
4.16, P = 0.0017 and t25 = 8.96, P < 0.0001, respectively) (Table 9). Multiple pair-wise
comparison tests also revealed that mean body size at emergence for rearing density of 300 (TL
= 22.4 ±0.14) fish per tank was significantly greater than rearing density of 500 (TL = 21.8
±0.17) fish per tank (t25 = 4.95, P = 0.0002) (Table 9). Multiple pair-wise comparison tests
revealed that mean body size at emergence for Family 2 (TL = 22.8 ±0.13) was significantly
greater than Family 1 (TL = 22.1 ±0.11) (t25 = -9.08, P < 0.0001). Mean egg diameter measured
from Female 2 (3.06 ±0.025) was significantly larger compared to mean egg diameter from
Female 1(2.78 ±0.028) (t19 = -7.57, P < 0.0001).
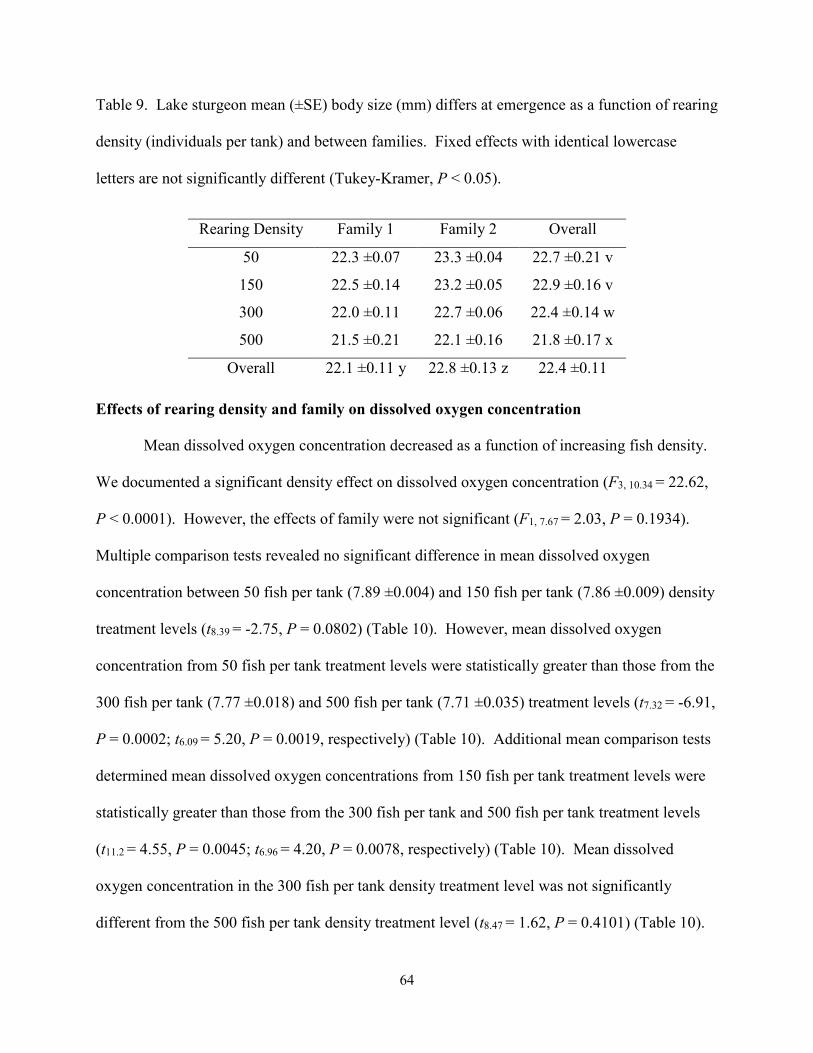
64
Table 9. Lake sturgeon mean (±SE) body size (mm) differs at emergence as a function of rearing
density (individuals per tank) and between families. Fixed effects with identical lowercase
letters are not significantly different (Tukey-Kramer, P < 0.05).
Rearing Density Family 1 Family 2 Overall
50 22.3 ±0.07 23.3 ±0.04 22.7 ±0.21 v
150 22.5 ±0.14 23.2 ±0.05 22.9 ±0.16 v
300 22.0 ±0.11 22.7 ±0.06 22.4 ±0.14 w
500 21.5 ±0.21 22.1 ±0.16 21.8 ±0.17 x
Overall 22.1 ±0.11 y 22.8 ±0.13 z 22.4 ±0.11
Effects of rearing density and family on dissolved oxygen concentration
Mean dissolved oxygen concentration decreased as a function of increasing fish density.
We documented a significant density effect on dissolved oxygen concentration (F3, 10.34 = 22.62,
P < 0.0001). However, the effects of family were not significant (F1, 7.67 = 2.03, P = 0.1934).
Multiple comparison tests revealed no significant difference in mean dissolved oxygen
concentration between 50 fish per tank (7.89 ±0.004) and 150 fish per tank (7.86 ±0.009) density
treatment levels (t8.39 = -2.75, P = 0.0802) (Table 10). However, mean dissolved oxygen
concentration from 50 fish per tank treatment levels were statistically greater than those from the
300 fish per tank (7.77 ±0.018) and 500 fish per tank (7.71 ±0.035) treatment levels (t7.32 = -6.91,
P = 0.0002; t6.09 = 5.20, P = 0.0019, respectively) (Table 10). Additional mean comparison tests
determined mean dissolved oxygen concentrations from 150 fish per tank treatment levels were
statistically greater than those from the 300 fish per tank and 500 fish per tank treatment levels
(t11.2 = 4.55, P = 0.0045; t6.96 = 4.20, P = 0.0078, respectively) (Table 10). Mean dissolved
oxygen concentration in the 300 fish per tank density treatment level was not significantly
different from the 500 fish per tank density treatment level (t8.47 = 1.62, P = 0.4101) (Table 10).

65
Table 10. Mean (±SE) dissolved oxygen concentration (mg/L) as a function of rearing density
(individuals per tank) and family. Fixed effects (density and family) with identical lowercase
letters are not significantly different (Tukey-Kramer, P < 0.05).
Rearing Density Family 1 Family 2 Overall
50 7.89 ±0.005 7.88 ±0.007 7.89 ±0.004 y
150 7.85 ±0.003 7.87 ±0.018 7.86 ±0.009 y
300 7.81 ±0.011 7.73 ±0.018 7.77 ±0.018 z
500 7.79 ±0.031 7.65 ±0.034 7.71 ±0.035 z
Overall 7.84 ±0.012 7.78 ±0.027 7.81 ±0.016
Effects of rearing density and family on survival to emergence
Mean survival to emergence decreased as rearing density increased from n=150 to n=500
fish per tank (0.976 ±0.008 versus 0.928 ±0.023), respectively, however differences were not
statistically significant (F3, 25 = 0.08, P = 0.9721) (Table 11). There was also no significant
difference in survival between families (F1, 25 = 0.01, P = 0.9274) (Table 11).
Table 11. Mean (±SE) proportional survival to emergence as a function of rearing density
(individuals per tank) and family. Fixed effects with identical lowercase letters are not
significantly different (Tukey-Kramer, P < 0.05).
Rearing Density Family 1 Family 2 Overall
50 0.995 ±0.005 0.940 ±0.020 0.971±0.014 z
150 0.972 ±0.010 0.980 ±0.013 0.976±0.008 z
300 0.946 ±0.025 0.961 ±0.003 0.954±0.012 z
500 0.929 ±0.055 0.928 ±0.019 0.928±0.023 z
Overall 0.963±0.013 0.953±0.009 0.958±0.008

66
DISCUSSION
Investigations focused on lake sturgeon during the ontogenetic period immediately after
hatch, extends previous research for a life period for which there is little information pertaining
to body size and survival. We documented significant effects of rearing density and also family
on the body size of free-embryos at emergence, and demonstrated a corresponding, potentially
related effect associated with dissolved oxygen concentration. We have also extended previous
literature (Gisbert et al. 2000, Regnier et al. 2012, and others) that suggested maternal
provisioning (i.e., egg size) has indirect effects on body size.
Effects of density on body size, dissolved oxygen concentration, and survival
Body size. – Mean body size decreased significantly as a function of increasing rearing density.
Body size of fish raised in densities of 150 fish per tank (or 9,688 individuals per m²) or less was
significantly larger (+0.5 to 1.1 mm) at emergence compared to other groups with greater
densities, indicating that density should be considered when rearing free-embryo. Some facilities
raise free-embryo sturgeon at densities which exceed 21,000 per m² , which based on our data
would result in a significant decrease in body size at emergence. Similar studies for demersal
larval-species such as Clarius batrachus and Clarius gariepinus have also shown that increasing
density results in a decrease in body size (Sahoo et al. 2004, Hossain et al. 1998). These studies
attributed decreased growth to increased competition for or reduced availability of food (Irwin et
al. 1999, Sahoo et al. 2004). However, during the free-embryo period fish are not feeding
exogenously which directs attention to other potential stress mechanisms such as the availability
of dissolved oxygen.

67
Dissolved oxygen. – Dissolved oxygen concentrations were significantly lower in higher rearing
density treatments, which may explain difference in mean body size at emergence. Lower levels
of dissolved oxygen can reduce the rate at which yolk-reserves are utilized for tissue
development instead of competing anaerobic metabolic processes (Kamler 2008). In our study,
free-embryo reared at higher densities may have devoted more yolk-reserves to respiration in
lower oxygen conditions rather than to developing tissue for body size. Similar studies have
shown that lower dissolved oxygen concentrations experienced during the embryo period
indirectly affect body size (Pichavant et al. 2001, Beuntello et al. 2000, Kamler 2008). At the
end of our study, the lowest recorded mean dissolved oxygen concentration was 7.60 mg/L
which is not characteristic of hypoxic rearing conditions. However, the lowest oxygen
concentrations recorded in this study may have been stressful, potentially causing negative
indirect effects on body size at emergence.
Survival. – Mean survival decreased as rearing density increased from 150 fish per tank to 500
fish per tank; however treatment differences were not significant. Survival to emergence of free-
embryo was high in all tanks (mean 96%) and was comparable to other sturgeons studies
(Gisbert et al. 2000, Boucher 2014). Our results suggest that although indirect effects on body
size were evident, no direct effects on survival to emergence were associated with rearing free-
embryos in high densities. Similar to results have been reported for other fish species (Hossain
et al. 1998). However, reduced body size at emergence, as well as other associated stresses
resulting from high density conditions, may lead to lower survival during subsequent ontogenetic
life periods (Bates 2014, Boucher 2014). We did not continue the study beyond the onset of
exogenous feeding to validate this.
68
Effects of family on body size, dissolved oxygen, and survival
Body size, dissolved oxygen, and survival. – Mean egg size and body size of free-embryo from
family 2 were significantly larger than those from family 1. The difference in body size is likely
due to initial egg size, which would suggest a maternal effect that has been documented before
for sturgeons (Gisbert et al. 2000), as well as other fish species (Regnier et al. 2012). Our
analysis was limited by the numbers of families represented (n=2). However, our results suggest
that additional studies with a greater number of families are needed to assess the potential
impacts of family on free-embryo body size. Aquaculture facilities that mix offspring from
several families during early rearing may provide free-embryos born from females with larger
eggs an advantage as larvae at emergence or initiation of exogenous feeding. Given that these
larvae are larger, they may out-compete others in the hatchery environment during early life
periods which could result in unequal family sizes at the end of the production cycle or stock-
out.
Rearing density of free-embryos in traditional as well as conservation aquaculture
facilities should be considered due to the indirect effects on body size. Larger body size at
emergence or at initiation of exogenous feeding is documented to increase the likelihood of first-
feeding at this critical period, reducing mortality linked to starvation (Cushing 1972, Yufera and
Darias 2007). Based on our study which utilized lake sturgeon free-embryo and a total rearing
area of 0.015 m², if free-embryo rearing density exceeds 9,688 individuals per m2, body size at
emergence will likely be significantly negatively affected. These results are useful for
development of standard operating procedures in traditional and conservation aquaculture
facilities where free-embryos are raised.

69
LITERATURE CITED
70
LITERATURE CITED
Bates, L. C., M. A. Boucher, and J. M. Shrimpton. 2014. Effect of temperature and substrate on
whole body cortisol and size of larval white sturgeon (Acipenser transmontanus Richardson,
1836). Journal of Applied Ichthyology 1-5.
Beuntello, J. A., D. M. Gatlin III, W. H. Neill. 2000. Effects of water temperature and dissolved
oxygen on daily feed consumption, feed utilization and growth of channel catfish (Ictalurus
punctatus). Aquaculture 182:339-352.
Boucher, M. A., S. O. McAdam, and J. M. Shrimpton. 2014. The effect of temperature and
substrate on the growth, development and survival of larval white sturgeon. Aquaculture
430:139-148.
Bronzi, P., H. Rosenthal, G. Arlati, and P. Williot. 1999. A brief overview on the status and
prospects of sturgeon farming in Western and Central Europe. Journal of Applied Ichthyology
15:224-227.
Ceskleba, D. G., S. AveLallemant, and T. F. Thuemler. 1985. Artificial spawning and rearing of
lake sturgeon, Acipenser fulvescens, in Wild Rose State Fish Hatchery, Wisconsin, 1982-1983.
Environmental Biology of Fishes 14(1):79-85.
Crossman, J. A., P. S. Forsythe, K. T. Scribner, and E. A. Baker. 2011. Hatchery rearing
environment and age affect survival and movements of stocked juvenile lake sturgeon. Fisheries
Management and Ecology 18:132-144.
Cushing, D. H. 1972. The production cycle and numbers of marine fish. Symposium of the
Zoological Society of London 29:213-232.
Deng, D., S. Koshio, S. Yokoyama, S. C. Bai, Q. Shao, Y. Cui, and S. S.O Hung. 2003. Effects
of feeding rate on growth performance of white sturgeon (Acipenser transmontanus) larvae.
Aquaculture 217(1-4):589-598.
Diggle, P. K. 1994. The expression of andromonoecy in Solanum hirtum (Solanaceae):
phenotypic plasticity and ontogenetic contingency. American Journal of Botany 81(10):1354-
1365.
DiLauro, M. N., W. F. Krise and K. Flynn-Aikins. 1998. Growth and survival of lake sturgeon
larvae fed formulated diets. The Progressive Fish Culturist 60(4):293-296.
Finn, R. N., I. Ronnestad, and H. J. Fyhn. 1995. Respiration, nitrogen and energy metabolism of
developing yolk-sac larvae of Atlantic halibut (Hippoglossus hippoglossus L.). Comparative
Biochemistry and Physiology 111A(4):647:671.
Gisbert, E., P. Williot, and F. Castello-Orvay. 2000. Influence of egg size on growth and survival
of early stages of Siberian sturgeon (Acipenser baeri) under small scale hatchery conditions.
Aquaculture 183:83-94.

71
Hansen, T. J., and D. Moller. 1985. Yolk absorption, yolk sac constrictions, mortality, and
growth during first feeding of Atlantic Salmon (Salmo salar) incubated on astro-turf. Canadian
Journal of Fisheries and Aquatic Sciences 42:1073-1078.
Hardy, R. S., and M. K. Litvak. 2004. Effects of temperature on the early development, growth,
and survival of shortnose sturgeon, Acipenser brevirostrum, and Atlantic sturgeon, Acipenser
oxyrhynchus, yolk-sac larvae. Environmental Biology of Fishes 70:145-154.
Hastings, R. P., J. M. Bauman, E. A. Baker, K. T. Scribner. 2013. Post-hatch dispersal of lake
sturgeon (Acipenser fulvescens, Rafinesque, 1817) yolk-sac larvae in relation to substrate in an
artificial stream. Journal of Applied Ichthyology 29:1208-1213.
Heming, T. A., and R. K. Buddington. 1988. Yolk absorption in embryonic and larval fishes.
Fish Physiology XIA:407-446.
Holtgren, J. M., S. A. Ogren, A. J. Paquet, and S. Fajfer. 2007. Design of a portable streamside
rearing facility for lake sturgeon. North American Journal of Aquaculture 69(4):317-323.
Hossain, M. A. R., M. C. M. Beveridge, and S. Haylor. 1998. The effects of density, light and
shelter on the growth and survival of African catfish (Clarias gariepinus Burchell, 1822)
fingerlings. Aquaculture 160(3-4):251-258.
Irwin, S., J. O. Halloran, and R. D. FitzGerald. 1999. Stocking density, growth, and growth
variation in juvenile turbot, Scopthalmus maximus (Rafinesque). Aquaculture 178:77-88.
Kamler, E. 2008. Resource allocation in yolk-feeding fish. Reviews in Fish Biology and
Fisheries 18:143-200.
Pichavant, K., J. Person-Le-Ruyet, N. Le Bayon, A. Severe, A. Le Roux, and G. Boeuf. 2001.
Comparative effects of long-term hypoxia on growth, feeding and oxygen consumption in
juvenile turbot and European sea bass. Journal of Fish Biology 59:875-883.
Regnier, T., V. Bolliet, P. Gaudin, and J. Labonne. 2012. Female effects in offspring energetic
status and consequences on early development in yolk feeding Brown Trout (Salmo trutta).
Journal of Experiment Zoology 317A:347-358.
Sahoo, S. K., S. S. Giri, and A. K. Sahu. 2004. Effect of stocking density on growth and survival
of Clarius batrachus (Linn.) larvae and fry during hatchery rearing. Journal of Applied
Ichthyology 20:302-305.
Yufera, M., and M. J. Darias. 2007. The onset of exogenous feeding in marine fish larvae.
Aquaculture 268:53-63.
IUCN, 2010. http://www.iucnredlist.org/details/223/0 (November 2014).
72
CHAPTER IV: BODY SIZE AND SURVIVAL OF HATCHERY- AND WILD-PRODUCED
LARVAE AS A FUNCTION OF FEEDING FREQUENCY AND ALTERNATE FOOD TYPE
ABSTRACT
During the transition from endogenous to exogenous feeding and for several weeks post-
exogenous feeding larval fishes typically exhibit periods of low growth and high mortality in
aquaculture. Therefore, studies that evaluate the effects of different feeding strategies (e.g.,
feeding frequency, food type) for larval fish growth and survival are important to aquaculture
productivity. In this study, the effects of commonly utilized feeding strategies on the body size
and survival of lake sturgeon larvae during this critical early life period were quantified. Results
from this study revealed significant differences in body size as a function of feeding frequency in
hatchery-produced larvae to 30 days post-exogenous feeding. In addition, using hatchery-
produced as well as wild-caught larvae, significant differences in body size and survival as a
function of alternate food types were documented. When hatchery-produced larvae were
utilized, families were kept separate to quantify family effects in response to hatchery feeding
strategies, which is lacking in the literature. Results from this study provide feeding strategy
information that can be used to develop standard operating procedures for lake sturgeon, a
species of conservation concern.

73
INTRODUCTION
Larval fishes commonly experience periods of reduced growth and high mortality in
aquaculture settings. Ontogenetic periods during which growth and survival can be negatively
affected include the period of transition from endogenous to exogenous feeding as well as
several weeks following initiation of exogenous feeding (Kamler 1992). During these critical
periods, nutrient deprivation or starvation can contribute to low growth and high mortality
(Heming et al. 1982, Li and Mathias 1982, Theilacker 1986, Alves et al. 1999, Kamali et al.
2006). In aquaculture settings, if proper feeding strategies are not employed at the onset of
exogenous feeding, larvae reach a “point of no return”, whereby larvae either fail to feed
exogenously or discontinue feeding, resulting in significant mortality (Blaxter and Hempel 1963,
Kamler 1992). Therefore, studies that evaluate the effects of different feeding strategies (e.g.,
feeding frequency, food type) for larval fish growth and survival are important to aquaculture
productivity.
Feeding frequency, the number of times fish are fed daily, has been found to significantly
affect growth and survival of larval fish (Mollah and Tan 1982, Wang et al. 1998, Hwoan Cho et
al. 2003). For example, Li et al. (2014) measured physiological stress-factors of Blunt Snout
Bream (Megalobrama amblycephala) and found those that fed at greater frequency exhibited
greater immunity to disease and exhibited greater growth and survival. Similar results were
observed by Tung and Shiau (1991) whereby higher feeding frequency resulted in greater growth
and survival due to more efficient carbohydrate metabolism. Investigations of alternate food in
aquaculture settings have also found food type to significantly affect growth and survival of
larval fish as well as reduce annual production costs (Hamre et al. 2013). For example, Naess et

74
al. (1995) determined that feeding live Artemia to Atlantic Halibut (Hippoglossus hippoglossus)
during early periods of development resulted in greater growth and survival compared to those
fed live-wild zooplankton. Improved growth and survival were attributed to greater assimilation
efficiency or greater palatability. More notably, formulated commercial diets as alternative food
types have been studied extensively in efforts to identify low-cost, nutrient-rich alternatives to
live food (Hamre 2013). However, despite extensive research of alternate feeding strategies
(e.g., feeding frequency and alternate food type) results are highly variable and warrant
evaluation of species-specific feeding strategies, particularly for species of economic and
conservation concern such as sturgeons (Rochard 1990, Auer 1996).
Sturgeons are highly marketable species, sought for their roe and flesh worldwide, yet
according to the International Union for Conservation of Nature (IUCN), 85% of the world’s
sturgeons are in danger of extinction (IUCN, 2010). Several anthropogenic factors have
contributed to low levels of abundance including over-fishing, poaching, habitat degradation, and
interruption of migration routes utilized for reproduction (Rochard 1990, Auer 1996). As a
result, aquaculture programs are in place to rebuild natural populations and recovery programs
aim to repatriate or improve recruitment of remnant populations (Memis et al. 2009). However,
low growth and high mortality during the larval period, attributed to inadequate feeding
strategies (Buddington and Christofferson 1988), serve as a bottleneck to successful aquaculture
production efforts for sturgeons. Research on sturgeons in aquaculture settings has demonstrated
that species-specific preferences for live food, the palatability or attractiveness of certain food
types, and the use of live food in combination with artificial or formulated food, all offer benefits
in the form of improved growth and survival during early life periods (Kappenman et al. 2011).
However, species-specific data are lacking regarding optimal feeding strategies (Giberson and

75
Litvak 2003), such as feeding frequency or beneficial alternate food types for larval lake
sturgeon (Acipenser fulvescens).
Lake sturgeon have been cultured for over 100 years (Post 1890, Leach 1920), yet
documentation of the optimal feeding frequency and food type, on growth and survival of larvae
are limited. Alternate food types have been investigated in some capacity for larval lake
sturgeon and live food outperformed other formulated food types (Anderson 1984, Ceskleba
1985, DiLauro et al. 1998). However, these studies were confounded because larvae were fed
Artemia prior to the onset of experiments that introduced alternate food. Research has been
conducted to improve juvenile growth and survival in aquaculture (Moreau and Dabrowski
1996); however, the larval period is when mortality is especially high (Harkness and Dymond
1961, Ceskleba 1985) and thus this ontogenetic period is deserving of further attention. High
mortality of larval lake sturgeon negatively affects the cost-effectiveness of current aquaculture
restoration programs, such as streamside rearing facilities (SRFs). SRFs, as opposed to
traditional hatcheries, have been widely advocated in the Great Lakes basin as opposed to
traditional hatcheries as the preferred method for culturing lake sturgeon in situations where
restoration goals to repatriate or enhance populations can be met by stocking (Holtgren et al.
2007). However, recent experience has shown that targeted stocking goals (~1,000 fish per year,
per facility) are difficult to achieve when SRFs are used, due in large part to high mortality rates
during the larval period.
Experiments have not been conducted to quantify and compare the effects of feeding
frequency and alternate food types on growth and survival of larval lake sturgeon, neither have
the effects of different sources of progeny for rearing been experimentally evaluated (Crossman
et al 2014). Therefore, the objectives of this study were to: 1) quantify and compare the effects

76
of feeding frequency on the body size and survival of hatchery-produced larval lake sturgeon
and, 2) quantify and compare the effects of alternate food types on body size and survival of
hatchery produced and wild captured larval lake sturgeon. Results from this study can be
utilized in the development of standard operating procedures for larval lake sturgeon which
currently experience high mortality in aquaculture settings.
77
METHODS
Study site
This study was conducted in spring of 2013 and 2014, at the Black River SRF (BR-SRF)
on the upper Black River, located in Cheboygan County, Michigan USA. The BR-SRF (316 m2)
provides conditions suitable for the evaluation of culture techniques utilized for sturgeon at
multiple life periods because of the large facility size and accessibility to gametes and larvae.
The BR-SRF is provided with 681 L/minute of ambient Black River water from Kleber
Reservoir.
Feeding rate
To ensure larval lake sturgeon were fed consistently in all experiments, we utilized
previously established dry-weight feeding rates for sturgeon (Deng et al. 2003), whereby larvae
in all tanks were fed 26% body weight daily (BWD), 26% BWD, 13% BWD, and 11% BWD
during the first, second, third, and fourth weeks post-exogenous feeding, respectively. For all
treatments that included Artemia, fish were fed live Artemia nauplii (Brine Shrimp Direct,
Premium Grade 90% Hatch Rate: Great Salt Lake strain). Artemia were hatched overnight and
harvested in the morning prior to the first feeding of the day. In addition, prior to the first
feeding each day, reservoir detritus retained by serial filtration through 100 then 50 micron Bag
Filter Vessels (Pentair Aquatic Eco-Systems) was used in three experimental food types
(hereinafter referred to as “filtrate”). Similar to Agh et al. (2012), a wet- to dry-weight
conversion was used to calculate feeding rates of Artemia and 50 micron filtrate material.
78
Experimental treatments
Collection, fertilization, and incubation of hatchery-produced larvae. –
The purpose of using hatchery-produced larvae for this study was to quantify and
compare the effects of feeding strategies on body size and survival of a progeny source
commonly utilized in traditional and streamside aquaculture. Gametes were collected from four
male and four female lake sturgeon spawning in the upper Black River following procedures
described by Crossman et al. (2011). Gametes were transported to the BR-SRF for fertilization,
which took place within four hours of collection. Approximately 50 mL of eggs per female were
placed into separate dry bowls. Milt from one male per female (full-sibling family) was
activated using a 1:200 dilution of ambient river water and immediately poured over the eggs
allowing 1.5 minutes (min) for fertilization. Excess milt was removed and eggs were rinsed once
with ambient river water. Egg de-adhesion was completed by applying a Fuller’s Earth solution
to the fertilized eggs (Sigma Aldrich) and gently mixing for 50 min. After 50 min, Fuller’s Earth
was rinsed from the eggs and a 15 min, 50 ppm Iodophor disinfection was administered. Eggs
were rinsed for 10 min to remove residual Iodophor using ambient river water. Eggs were kept
separate by family and incubated in Aquatic Eco-Systems (Pentair) J32 Mini Egg-hatching jars.
Beginning two days post-fertilization; eggs were treated daily using a 15 min, 500 ppm bath
treatment of hydrogen peroxide until 24 hours prior to hatch. At hatch, free-embryo lake
sturgeon were raised until endogenous resources were absorbed and fish began a ‘swim-up’
behavior (approx. 7-10 days post-hatch). During the free-embryo period, lake sturgeon seek
refuge in available substrate (Hastings et al. 2013). Therefore free-embryos were raised in 10 L
polycarbonate tanks (Aquatic Habitats) with a single layer of 2.54 cm3 sinking Bio-Balls (Pentair
#CBB1-S) covering the tank bottom.

79
Feeding frequency with hatchery-produced larvae 2013. – The purpose of this
experiment was to quantify the effects of feeding frequency and family on body size and survival
of hatchery-produced larvae at 30 days post-exogenous feeding. At the onset of exogenous
feeding, 50 larvae were placed into each of 32 (2 feeding frequencies and 2 families with 8
replicates) 3.0 L polycarbonate tanks (Aquatic Habitats). Each tank was then randomly assigned
to one of two feeding frequency treatments with eight replicates. Feeing frequency treatments
included: 1) fish fed 12 times daily and 2) fish fed 3 times daily. Feeding frequency treatments
were designed to mimic current SRF feeding protocols of twelve or three times per day. Fish
were acclimated in tanks for 24 hours prior to the start of the experiment. At 30 days post-
exogenous feeding the body size (total length (mm)), and batch weight (g), were determined for
all surviving fish. Mortality was recorded at the start of each rearing day to quantify survival.
Alternate food types with hatchery-produced larvae 2013. –The purpose of this
experiment was to quantify the effects of alternate food type and family on body size and
survival of hatchery-produced larvae at 30 days post-exogenous feeding. At the onset of
exogenous feeding, 25 larvae were placed into each of 24 (3 alternate food types and 2 families
with 4) 3.0 L polycarbonate tanks (Aquatic Habitats). Each tank was then randomly assigned to
one of three alternate food types, chosen to evaluate and compare alternate food types currently
utilized in SRFs. Alternate food types utilized for this experiment included; 1) 100%
recommended BWD of Artemia, 2) 50% recommend BWD of Artemia & 50% recommended
BWD of Otohime B2 Larval Diet (particle size 0.36 to 0.60 mm), and 3) 100% recommended
BWD of Otohime B2 Larval Diet. Otohime B2 Larval Diet hereinafter referred to as “Otohime”.
Surviving fish from each tank were batch weighed every other day to adjust food rates according
to Deng et al. (2003). Mortality was recorded at the start of each rearing day to quantify
80
survival. Significant mortality occurred in some treatments so this experiment was ended
prematurely at 14 days post-exogenous feeding.
Collection of wild-produced larvae. –
Dispersing larvae, which offer greater genetic diversity than hatchery-produced larvae,
are utilized in some SRFs for stocking (Holtgren et al. 2007; Duong et al. 2010; and Crossman et
al. 2014). However, higher mortality among these wild-produced larvae compared to hatchery-
produced larvae has been observed and may be associated with wild larvae imprinting to natural
food in the river prior to capture for rearing (DiLauro et al. 1998, Crossman et al 2014). The
purpose of using wild-caught larvae for this study was to quantify the effects of alternate food
type on body size and survival of an additional progeny source utilized in sturgeon aquaculture.
Therefore, wild dispersing-larvae were captured downstream of spawning areas using D-frame
drift nets and transported to the BR-SRF for rearing. Detailed information regarding
methodology and timing of drift capture can be found in Auer and Baker (2002) as well as Smith
and King (2005).
Alternate food types with wild-caught larvae 2014. – The purpose of this experiment
was to quantify the effect of alternate food types on body size and survival of wild-caught larvae
at 30 days post-exogenous feeding. Twenty-four hours post-capture, 20 larvae were placed into
each of 48 (6 alternate food types with 8 replicates) 3.0 L polycarbonate tanks (Aquatic
Habitats). Each tank was randomly assigned to one of six food types designed to mimic those
currently utilized in SRFs including a 50 micron filtrate material gathered from a nearby
reservoir (meant to represent natural forage types in the river). Alternate food type for this
experiment included; 1) 100% of recommended BWD of Artemia, 2) 50% of recommend BWD
of Artemia & 50% of recommended BWD of Otohime B2 Larval Diet, 3) 100% of recommended

81
BWD of Otohime B2 Larval Diet, 4) 90% of recommended BWD of Otohime B2 Larval Diet
and 10% of recommended BWD of 50 micron reservoir filtrate, 5) 90% of recommended BWD
of Artemia and 10% of recommended BWD of 50 micron reservoir filtrate, and 6) 45% of
recommended BWD of Artemia 45% of recommended BWD of Otohime B2 Larval Diet and
10% of recommended BWD of 50 micron reservoir filtrate. Fish were acclimated to the tanks
for 24-48 hours prior to the start of the experiment. Surviving fish from each tank were batch
weighed every other day to adjust food rations according to Deng et al. (2003). Mortality was
recorded at the start of each rearing day to quantify survival. Significant mortality occurred in
some treatments so this experiment was ended at 14 days post-exogenous feeding.
Statistical analysis
All statistical analyses to quantify response variables were performed using SAS (SAS
Institute version 9.3 Cary, NC). Summary statistics (mean and standard error) for all response
variables were calculated and reported in the Results section. Tank was the experimental unit
for all response variables used in the analysis. The assumption of normality was evaluated using
the Shapiro-Wilk Test. Analysis of variance (ANOVA) homogeneity of variance assumption
was analyzed by Levene’s Test. Body size measurements were analyzed using a general linear
model. A generalized linear model was used for proportional survival data which were modeled
using a beta-distribution and reported as proportional survival. A p value < 0.05 was considered
statistically significant for all results.

82
RESULTS
Feeding frequency with hatchery produced larvae in 2013
The effects of feeding frequency and family including their interaction term were
quantified at 30 days post-exogenous feeding using the following response variables; mean
(±SE) total length, mean (±SE) weight per fish, and mean (±SE) proportional survival.
Interaction terms for response variables, total length, weight per fish, and survival as a function
of feeding frequency by family were insignificant (F1, 28 = 0.11, P = 0.7371; F1, 28 = 0.00 P =
0.9829; and F1, 28 = 0.03, P = 0.8587, respectively) and were removed from each model.
Total length at 30 days post-exogenous feeding. – A significant feeding frequency treatment
effect (F1, 29 = 4.87, P = 0.0354) on total length of larvae at 30 days post-exogenous feeding was
detected. However, there was no significant effect of family (F1, 29 = 3.79, P = 0.0614). Mean
total length was significantly greater in groups fed 3 times per day (46.83 ±0.33 mm) versus 12
times per day (45.73 ±0.40 mm) (t29 = -2.21, P = 0.0354) (Table 1). Larvae fed three times per
day were 2.4% greater in total length at 30 days post-exogenous feeding than those fed twelve
times per day.
Weight per fish at 30 days post-exogenous feeding. – A significant feeding frequency
treatment effect (F1, 29 = 5.54, P = 0.0255) on weight per fish at 30 days post-exogenous feeding
was detected however, no effect of family was detected (F1, 29 = 3.09, P = 0.0894). Mean weight
per fish was significantly greater in groups fed 3 times per day (0.41 ±0.01) versus 12 times per
day (0.38 ±0.01) (t29 = -2.35, P = 0.0255) (Table 12). Larvae fed three times per day were 6.5%
greater in weight per fish at 30 days post-exogenous feeding than those fed twelve times per day.

83
Survival at 30 days post-exogenous feeding. – The effects of feeding frequency treatment and
family on mean proportional survival at 30 days-post exogenous feeding were not significant (F1,
29 = 0.29, P = 0.5939 and F1, 29 = 0.09, P = 0.7661, respectively). Mean proportional survival
was higher in groups fed 3 times per day (0.98 ±0.54) compared to those fed 12 times per day
(0.95 ±2.80), however, differences were not statistically significant (Table 12). Mean
proportional survival was higher in family 2 (0.97 ±0.83) compared to family 1 (0.95 ±2.79),
however, differences were not statistically significant (Table 12).
Table 12. Hatchery produced larvae: mean total length (mm ±SE), weight per fish (g ±SE), and
proportional survival (±SE) at 30 days post-exogenous feeding as a function of feeding
frequency and family. Response variables within the same column followed by similar
lowercase letters are not significantly different (P < 0.05).
Total Length (mm) Weight per Fish (g) Proportional Survival
Feeding
Frequency Family 1 Family 2 Family 1 Family 2 Family 1 Family 2
12 per day 45.16 ±0.61 a 46.30 ±0.46 a 0.37 ±0.02 a 0.40 ±0.01 a 0.93 ±0.06 a 0.98 ±0.01 a
3 per day 46.43 ±0.26 b 47.22 ±0.60 b 0.40 ±0.01 b 0.42 ±0.01 b 0.97 ±0.01 a 0.98 ±0.01 a
Alternate food types with hatchery-produced larvae 2013
The effects of alternate food type and family including their interaction term were
quantified at 14 days post-exogenous feeding (due to high mortality in some treatments) using
the following response variables; mean (±SE) weight per fish (g), and mean (±SE) proportional
survival. Interaction terms for the models which included response variable weight per fish, as
well as the model for proportional survival were insignificant (F2, 15 = 1.82 P = 0.1964 and F2, 4 =
0.31 P = 0.7520, respectively) and were removed from each model.
Weight per fish at 14 days post-exogenous feeding. – The effect of alternate food type on
weight per fish was significant among alternate food types (F2, 17 = 489.68, P < 0.0001) and

84
between different families (F1, 17 = 15.97, P < 0.0009). Mean weight per fish was significantly
greater in groups fed 100% Artemia (0.33 ±0.01), versus 50% Artemia & 50% Otohime (0.24
±0.01) and 100% Otohime (0.06 ±0.01) (t17 = -12.30, P < 0.0001 and t17 = 31.26, P < 0.0001,
respectively) (Table 13). Additionally, mean weight per fish in groups fed 50% Artemia & 50%
Otohime was significantly greater than those fed 100% Otohime (t17 = 20.50, P < 0.0001). Mean
weight per fish was significantly greater in family 2 (0.24 ±0.04) versus family 1 (0.22 ±0.03)
(t17 = -4.00, P < 0.0001).
Survival at 14 days post-exogenous feeding. – The effect of alternate food types on mean
proportional survival were significant at 14 days post-exogenous feeding (F2, 6, P = 0.0002),
however, not between different families (F1, 6, P = 0.1261). Mean proportional survival between
groups fed 100% Artemia (0.97 ±0.02) and groups fed 50% Artemia & 50% Otohime (0.99
±.0.1) was not statistically significant (t6 = 0.33, P = 0.9411) (Table 13). However, mean
proportional survival was significantly greater in groups fed 100% Artemia and those fed 50%
Artemia & 50% Otohime, when compared to those fed 100% Otohime (0.35 ±0.06) (t6 = 7.90, P
= 0.0005 and t6 = 6.74, P = 0.0013, respectively) (Table 13).
Table 13. Hatchery produced larvae: mean weight per fish ((g) ±SE) and proportional survival
(±SE) at 30 days post-exogenous feeding as a function of food type and family. Response
variables within the same column followed by similar lowercase letters are not significantly
different (P < 0.05).
Weight per Fish (g) Proportional Survival
Food Type Family 1 Family 2 Family 1 Family 2
100% Artemia 0.31 ±0.004 a 0.35 ±0.006 x 0.98 ±0.02 a 0.95 ±0.04 a
50% Artemia & 50% Otohime 0.22 ±0.011 b 0.25 ±0.005 y 0.99 ±0.01 a 0.98 ±0.02 a
100% Otohime 0.06 ±0.006 c 0.06 ±0.010 z 0.43 ±0.05 b 0.30 ±0.08 b

85
Alternate food types with wild-caught larvae 2014
The effects of alternate food type were quantified at 14 days post-exogenous feeding (due
to high mortality in some treatments) using the following response variables; mean (±SE) weight
per fish, and mean (±SE) proportional survival.
Weight per fish at 14 days post-exogenous feeding. – The effect of alternate food type on
mean weight per fish was significant at 14 days post-exogenous feeding (F5, 39 = 113.36, P <
0.0001). Mean weight per fish in groups fed 100% Artemia (0.41 ±0.02) and those fed 90%
Artemia & 10% filtrate (0.37 ±0.01) were significantly greater than those fed 50% Artemia &
50% Otohime (0.29 ±0.02), 100% Otohime (0.03 ±0.01), 90% Otohime & 10% filtrate (0.02
±0.002), and 45% Artemia & 45% Otohime & 10% filtrate (0.26 ±0.01), at 14 days post-
exogenous feeding (Table 14).
Survival at 14 days post-exogenous feeding. – Survival varied significantly among alternate
food types (F5, 28 = 55.86, P < 0.0001). Mean proportional survival of fish 100% Artemia (0.94
±0.018), 50% Artemia & 50% Otohime (0.90 ±0.023), 90% Artemia & 10% filtrate (0.96
±0.020), and 45% Artemia & 45% Otohime & 10% filtrate (0.94 ±0.031) was significantly
greater than those fed 100% Otohome (0.13 ±0.052) and 90% Otohime & 10% filtrate (0.11
±0.032) at 14 days post-exogenous feeding (Table 14). Mean proportional survival was highest
among alternate food types that included Artemia (0.94 ±0.018) compared to those that did not
include (0.12 ±0.042) Artemia.

86
Table 14. Wild-produced larvae: mean weight per fish ((g) ±SE) and proportional (±SE) survival
at 14 days post-exogenous feeding as a function of food type portioned by recommend %BWD.
Response variables within the same column followed by similar lowercase letters are not
significantly different (P < 0.05).
Food Type Weight per Fish (g) Proportional Survival
100% Artemia 0.41 ±0.024 a 0.94 ±0.018 a
50% Artemia & 50% Otohime 0.29 ±0.020 b 0.90 ±0.023 a
100% Otohime 0.03 ±0.006 c 0.13 ±0.052 b
90% Otohime & 10% filtrate 0.02 ±0.002 c 0.11 ±0.032 b
90% Artemia & 10% filtrate 0.37 ±0.014 a 0.96 ±0.020 a
45% Artemia & 45% Otohime & 10% filtrate 0.26 ±0.010 b 0.94 ±0.031 a
87
DISCUSSION
During the transition from endogenous to exogenous feeding and for several weeks post-
exogenous feeding, larval fishes typically exhibit periods of low growth and high mortality in
aquaculture. In this study, we quantified the effects of commonly utilized feeding strategies on
the body size and survival of lake sturgeon larvae during this critical early life period. We
identified significant differences in body size as a function of feeding frequency in hatchery-
produced larvae to 30 days post-exogenous feeding. In addition, using hatchery-produced as
well as wild-caught larvae, we identified significant differences in body size and survival as a
function of alternate food types. When hatchery-produced larvae were utilized, families were
kept separate to quantify family effects in response to hatchery feeding strategies, which is
lacking in the literature. Results from this study provide feeding strategy information that can be
used to develop standard operating procedures for lake sturgeon, a species of conservation
concern.
Feeding frequency with hatchery-produced larvae 2013
At the end of a thirty-day experiment, we quantified the effects of two commonly utilized
feeding frequencies and family on the body size and survival of lake sturgeon larvae. Increasing
feeding frequency has been documented to improve growth and survival of larvae for many fish
species (Tung and Shiau 1991, Cho et al. 2003, Li et al. 2013 and others). However, in this
study, mean body size (total length) of lake sturgeon larvae fed three times per day was
significantly greater than those fed twelve times per day. Our results are similar to those
reported for demersal species which found that fewer feedings either improved, or did not reduce
growth (Petkam and Moodie 2001, Giberson and Litvak 2003).

88
Observed differences in body size (total length) in this study could be due to differences
in size or energy content of Artemia as a function of feeding time (Sorgeloos et al. 2001). For
example, fish fed three times per day received a third of the total daily ration soon after Artemia
had been harvested, whereas fish fed 12 times per day did not receive a third of daily rations in
total until four hours later. Sorgeloos et al. (2001) determined that Artemia nauplii kept alive
may develop, after several hours, into a second larval stage which contains lower amounts of
amino acids and is not as digestible compared to those sampled soon after Artemia hatching
(Leger et al. 1987). In addition, the size of more developed nauplii, despite a reduced energy
content, may be larger and exhibit greater swimming ability and evasion from predators
(Sorgeloos et al. 2001), which may make feeding more difficult for larval sturgeon fed 12 times
per day. We did not measure energy content or size of Artemia in this study. Therefore,
additional studies using food types which do not lose energy content or change in size as a
function of time are needed to further support our results. Survival of larvae to 30 days post-
exogenous feeding was not significantly different as a function of feeding frequency, however, it
was higher than expected and higher compared to previous studies for sturgeon and will be
discussed later.
After thirty days post-exogenous feeding we did not detect differences in larval body size
or survival between families in this experiment. While acknowledging a small sample size, these
results are surprising given the amount of research which associates body size of larvae during
early and later ontogenetic life periods to genotypic origin (Nunez et al. 2011). It could be
however, that genetic effects diminish as a function of age similar to early life periods of
Chinook salmon (Oncorhynchus tshawytscha) (Heath et al. 1999). Similar aquaculture studies

89
are needed with larger sample sizes of different families to quantify the effects of family on body
size.
Alternate food types with hatchery-produced larvae 2013
At two weeks post-exogenous feeding we observed significant differences in body size
(weight per fish) as a function of three alternate food types. Larvae fed live Artemia alone or in
combination with formulated food types exhibited greater body size (weight per fish). These
data are similar to other studies (Petkam and Moodie 2001, Agh et al. 2012, Poitroswska et al.
2013). Previous research suggested that sturgeons imprint to food provided at the onset of
exogenous feeding (Buddington and Christofferson 1988, DiLauro et al. 1998), which warranted
additional studies using alternate food types fed to hatchery-produced larvae not pre-exposed to
other food types, namely Artemia. Our results add to previous research for hatchery-produced
larvae that may have been confounded by having fed Artemia prior to initiating experimental
food type studies (Anderson 1984, DiLauro et al. 1998). However, similar to DiLauro et al.
(1998), we did not observe hatchery-produced larvae feeding on formulated food types (Otohime
B2 Larval Diet) which suggests that larval lake sturgeon may not imprint to or may not prefer
formulated feed up to 14 days post-exogenous feeding. These findings are further supported by
our results that show significantly smaller body size (weight per fish) of hatchery-produced
larvae fed Otohime B2 Larval Diet. Conversely, Kappenman et al. (2010) reported promising
results for Otohime during a study of hatchery-produced larval pallid sturgeon (Scaphirhynchus.
albus) stating that larvae fed Otohime exhibited mean growth rates of 7.9% per day and survival
rates from 54 to 72%. This could be due to the fact that Kappenman et al. (2010) mixed
Otohime B2 Larval Diet in equal proportions with a smaller particle sized, more easily
ingestible, Otohime B1 Larval Diet providing a range of food particle size from 0.20 to 0.62 mm.

90
However, Artemia nauplii typically range in size from 0.43 to 0.52 mm (Leger et al. 1987) so a
gape-limitation due to particle size of formulated foods such as Otohime B2 Larval Diet (0.36 to
0.62 mm) used in this study is unlikely.
Mean proportional survival of hatchery-produced larvae was higher when fed food types
which contained Artemia versus those which contained only Otohime B2 Larval Diet, although
differences were not statistically significant. Survival of hatchery-produced larvae fed food
types containing Artemia were higher than expected and higher compared to previous studies.
Using hatchery-produced larvae, we documented significant differences in body size
(weight per fish) at two weeks post-exogenous feeding between two different families reared
separately during this experiment. Previous research has documented maternal and paternal
effects on body size during early and subsequent ontogenetic life periods for fishes (Nunez et al.
2011). Differences in body size by family of sturgeon could be due to differences in maternal
provisioning (i.e., egg size and hatched free-embryo size), as observed in Siberian sturgeon
(Acipenser baeri) (Gisbert et al. 2000). In this study, we did not measure egg size or size at
hatch, and we only used two families for comparing potential family effects. Therefore,
additional studies are needed to quantify and compare the effects of family on body size and
survival of larvae.
Alternate food types with wild-produced larvae 2014
At two weeks post-exogenous feeding we observed significant differences in body size,
measured as weight per fish, as a function of six alternate food types for wild-produced larvae.
Larvae fed live Artemia alone or in combination with formulated food types and filtrate exhibited
greater body size which is comparable to similar aquaculture studies (Petkam and Moodie 2001,
Agh et al. 2012, Poitroswska et al. 2013). However, our research using wild-caught larvae
91
extends upon previous research by providing results relative to a progeny source for which no
alternate food type information existed previously.
Early rearing of wild-caught larvae has been difficult in aquaculture due to the inability
of larvae to transition to Artemia near the onset of exogenous feeding (Holtgren et al. 2007,
Crossman et al. 2014). It was suggested that wild larvae may have already begun to feed in the
river and thus imprinted to natural food types (DiLauro 1998, Crossman et al. 2014). However,
comparisons of body size suggest, and visual observations confirmed, that wild-produced larvae
only fed on Artemia in this study. These results are similar for hatchery-produced larvae and
similar to DiLauro et al. (1998), given that we did not observe wild-produced larvae feeding on
formulated (Otohime B2 Larval Diet) food. In addition, we did not observe wild-produced
larvae feeding on food that was derived from filtrate. Our findings that suggest lake sturgeon
only fed on Artemia, are further supported by the results which show significantly smaller body
size as a function of decreasing proportions of Artemia. These data suggest that feeding rates, or
the amount of food provided may be causing high mortality rates during larval periods.
Mean proportional survival of wild-produced larvae was significantly higher when fed
food types which contained Artemia versus those which contained either only Otohime or a
mixture of Otohime and filtrate. Survival of wild-produced larvae fed Artemia was higher than
expected and higher compared to previous studies.
Survival of larvae in feeding frequency and alternate food type experiments
Survival of hatchery- and wild- produced lake sturgeon larvae fed Artemia in all
experiments was high compared to that experienced in traditional (Anderson 1984, Ceskleba
1985, DiLauro et al. 1998, Crossman 2014) or in SRF (Holtgren et al. 2007, Crossman et al.
2014) aquaculture settings. When fed Artemia, larvae in all experiments in this study exhibited

92
mean proportional survival rates near 0.96 (or 96%). We attribute high survival to the use of an
Artemia wet- to dry-weight conversion and the use of feeding rates pre-determined for white
sturgeon (Deng et al. 2003). Recommended feeding rates for lake sturgeon are not readily
available in the literature warranting investigation of optimal feeding rates for lake sturgeon
during the larval period.
As larvae begin exogenous feeding, several factors affect survival in hatchery
environments including tank complexity (i.e., water volume, water flow), as well as aquaculture
management practices (i.e., disease treatment, tank cleaning) (Conte et al. 1988, Crossman et al.
2014). In our study, we used 3.0 L polycarbonate aquaria that allowed us to utilize hatchery
space efficiently while populating experimental treatment groups with multiple families and
many replicates. At no time during any experiment were fish given any disease treatment or any
preventative prophylactic. Furthermore, tanks were cleaned once weekly which may have
reduced handling stress compared to facilities which clean tanks daily.
Conclusions
In this study, we quantified the effects of commonly utilized feeding strategies on the
body size and survival of larvae during the critical early life period. We identified significant
differences in body size as a function of feeding frequency in hatchery produced larvae to 30
days post-exogenous feeding. Based on results from these experiments we recommend feeding
lake sturgeon larvae Artemia three times per day to improve growth. Continued investigations
seeking more economical food types which either maintain or improve growth without
compromising survival are still needed. Furthermore, survival in traditional and SRF
aquaculture settings is likely to improve if optimal feeding rates are established for larval lake
sturgeon.

93
LITERATURE CITED

94
LITERATURE CITED
Agh, N., F. Noori, A. Irani, N. M. Makhdom. 2012. First feeding strategy for hatchery produced
Beluga sturgeon, Huso huso larvae. Iranian Journal of Fisheries Sciences. 11(4):713-723.
Alves, D., J. L. Specker, and D. A. Bengston. 1999. Investigations into the causes of early
larval mortality in cultured summer flounder (Paralichthys dentatus L.). Aquaculture. 176:155-
172.
Anderson, E. R. 1984. Formulated propagation of lake sturgeon Acipenser fulvescens
(Rafinesque), under hatchery conditions in Michigan, Michigan Department of Natural
Resources, Fisheries Division, Fisheries Report 1898, Ann Arbor.
Auer, N. A. (1996). Importance of habitat and migration to sturgeons with emphasis on lake
sturgeon. Canadian Journal of Fisheries and Aquatic Sciences, 53(S1), 152-160.
Auer, N. A., & Baker, E. A. (2002). Duration and drift of larval lake sturgeon in the Sturgeon
River, Michigan. Journal of Applied Ichthyology, 18(4‐6), 557-564.
Blaxter, J. H. S., and G. Hempel. 1963. The influence of egg size on Herring larvae (Clupea
harengus L.). J. Const. Int. Explor. Mer. 28:211-240.
Buddington, R. K., & Christofferson, J. P. (1985). Digestive and feeding characteristics of the
chondrosteans. Environmental Biology of Fishes, 14(1), 31-41.
Ceskleba, D. G., S. AveLallemant, and T. F. Thuemler. 1985. Artificial spawning and rearing of
lake sturgeon, Acipenser fulvescens, in Wild Rose State Fish Hatchery, Wisconsin, 1982-1983.
Cho, S. H., Lim, Y. S., Lee, J. H., Lee, J. K., Park, S., & Lee, S. M. (2003). Effects of Feeding
Rate and Feeding Frequency on Survival, Growth, and Body Composition of Ayu Post‐Larvae
Plecoglossus altivelis. Journal of the world aquaculture society, 34(1), 85-91.
Crossman, J. A., Forsythe, P. S., Scribner, K. T., & Baker, E. A. (2011). Hatchery rearing
environment and age affect survival and movements of stocked juvenile lake sturgeon. Fisheries
Management and Ecology, 18(2), 132-144.
Crossman, J. A., K. T. Scribner, C. A. Davis, P. S. Forsythe, and E. A. Baker. 2014. Survival
and growth of lake sturgeon during early life stages as a function of rearing environment.
Transaction of the American Fisheries Society. 143:104-116.
Conte, F. S. (Ed.). (1988). Hatchery Manual for the White Sturgeon (Acipenser Transmontanus
Richardson): With Application to Other North American Acipenseridae (Vol. 3322). UCANR
Publications.
DiLauro, M. N, W. F. Krise, and K. Fynn-Aikins. 1998. Growth and survival of lake sturgeon
larvae fed formulated diets. The Progressive Fish Culturist. 60:293-296.

95
Deng, D., S. Koshio, S. Yokoyama, S. C. Bai, Q. Shao, Y. Cui, and S. S. O. Hung. 2003.
Effects of feeding rate on growth performance of white sturgeon (Acipenser transmontanus)
larvae. Aquaculture. 217:589-598.
Giberson, A. V., and M. K. Litvak. 2003. Effect of feeding on growth, food conversion
efficiency, and meal size of juvenile Atlantic sturgeon and Shortnose sturgeon. North American
Journal of Aquacutlure. 65:99-105.
Gisbert, E., P. Williot, and F. Castello-Orvay. 2000. Influence of egg size on growth and
survival of early stages of Siberian sturgeon (Acipenser baeri) under small scale hatchery
conditions. Aquaculture 183:83-94.
Hamre, K., Yúfera, M., Rønnestad, I., Boglione, C., Conceição, L. E., & Izquierdo, M. (2013).
Fish larval nutrition and feed formulation: knowledge gaps and bottlenecks for advances in larval
rearing. Reviews in Aquaculture, 5(s1), S26-S58.
Harkness, W. J. K., & Dymond, J. R. (1961). The lake sturgeon: the history of its fishery and
problems of conservation. Fish & Wildlife Branch, Ontario Department of Lands and Forests.
Hastings, R. P., Bauman, J. M., Baker, E. A., & Scribner, K. T. (2013). Post‐hatch dispersal of
lake sturgeon (Acipenser fulvescens, Rafinesque, 1817) yolk‐sac larvae in relation to substrate in
an artificial stream. Journal of Applied Ichthyology, 29(6), 1208-1213.
Heath D. D., C. W. Fox, and J. W. Heath. 1999. Maternal effects on offspring size: variation
through early development of Chinook salmon. Evolution. 53(5):1605-1611.
Heming, T. A., J. E. McInerney, and D. F. Alderice. 1982. Effect of temperature on initial
feeding in alevins of chinook salmon (Oncorhynchus tshawytscha). Canadian Journal of
Fisheries and Aquatic Sciences. 39:1554-1562.
Holtgren, J. M., Ogren, S. A., Paquet, A. J., & Fajfer, S. (2007). Design of a portable streamside
rearing facility for lake sturgeon. North American Journal of Aquaculture, 69(4), 317-323.
Kamali, A., Z. Kordjazi, and R. Nazary. 2006. The effect of the timing of initial feeding on
growth and survival of ship sturgeon (Acipenser nudiventris) larvae: a small-scale hatchery
study. Journal of Applied Ichthyology. 22(Suppl. 1):294-297.
Kamler, E. (1992). Early life history of fish: an energetics approach (p. 267). London: Chapman
& Hall.
Kappenman, K. M., M. Toner, J. Illgen, and F. T. Barrows. 2011. The effect of diet on growth
and survival of first feeding pallid sturgeon Scaphirhynchus albus. Journal of Applied
Ichthyology. 27:755-760.
Leach, G. C. 1920. Artificial propagation of sturgeon. Part I. Review of sturgeon culture in the
United States. Report of the U.S. Fishery Commission. 1919:3-5.

96
Leger, P., D. A. Bengtson, P. Sorgeloos, K. L. Simpson, and A. D. Beck. 1987. The nutritional
value of Artemia: a review. In: Sorgeloos, P., Bengtson, D. A., Decleir, W., Jaspers, E. (Eds.),
Artemia research and its applications. Ecology, Culturing, Use in Aquaculture, vol. 3.
University Press, Wetteren, pp. 357-372.
Li, S., and J. A. Mathias. 1982. Causes of high mortality among culture larval walleye.
Transaction of the American Fisheries Society. 111(6):710-721.
Li, X. F., Tian, H. Y., Zhang, D. D., Jiang, G. Z., & Liu, W. B. 2014. Feeding frequency affects
stress, innate immunity and disease resistance of juvenile blunt snout bream Megalobrama
amblycephala. Fish & shellfish immunology. 38(1):80-87.
Memiş, D., Ercan, E., Çelikkale, M. S., Timur, M., & Zarkua, Z. (2009). Growth and survival
rate of Russian sturgeon (Acipenser gueldenstaedtii), larvae from fertilized eggs to artificial
feeding. Turkish Journal of Fisheries and Aquatic Sciences, 9(1), 47-52.
Mollah, M. F. A., & Tan, E. S. P. 1982. Effects of feeding frequency on the growth and survival
of catfish (Clarias macrocephalus Gunther) larvae. Indian Journal of Fisheries. 29(1&2):1-7.
Moreau, R., & Dabrowski, K. (1996). Feeding stimulants in semipurified diets for juvenile lake
sturgeon, Acipenser fulvescens Rafinesque*. Aquaculture Research, 27(12), 953-957.
Næss, T., Germain-Henry, M., & Naas, K. E. (1995). First feeding of Atlantic halibut (< i>
Hippoglossus hippoglossus</i>) using different combinations of< i> Artemia</i> and wild
zooplankton. Aquaculture, 130(2), 235-250.
Nunez, J., D. Castro, C. Fernandez, R. Dugue, F. Chu-Koo, F. Duponchelle, C. Garcia, and J.
Renno. 2011. Hatching rate and larval growth variation in Pseudoplatystoma punctifer:
maternal and paternal effects. Aquaculture Research. 42:764-775.
Petkam, R. and G. E. Moodie. 2001. Food particle size, feeding frequency, and the use of
prepared food to culture larval walking catfish (Clarias microcephalus). Aquaculture. 194:349-
362.
Piotrowska, I., B. Szczepkowska, M. Kozlowski, K. Wunderlich, and M. Szczepkowski. 2013.
Results of the larviculture of Atlantic sturgeon (Acipenser oxyrinchus) fed different types of
diets. Archives of Polish Fisheries. 21:53-61.
Post, H. 1890. Sturgeon: experiments in hatching. Transactions of the American Fisheries
Society. 19:36-40.
Smith, K. M., & King, D. K. (2005). Dynamics and extent of larval lake sturgeon Acipenser
fulvescens drift in the Upper Black River, Michigan. Journal of Applied Ichthyology, 21(3), 161-
168.
Sorgeloos, P., P. Dhert, and P. Candreva. 2001. Use of the brine shrimp, Artemia spp., in
marine fish larviculture. Aquaculture. 200:147-159.
97
Theilacker, G. H. 1986. Starvation-induced mortality of young sea-caught Jack Mackerel,
Trachurus symmetricus, determined with histological and morphological methods. Fisheries
Bulletin. 84(1):1-17.
Tung, P. H., & Shiau, S. Y. (1991). Effects of meal frequency on growth performance of hybrid
tilapia,< i> Oreochromis niloticus× O. aureus</i>, fed different carbohydrate diets. Aquaculture,
92, 343-350.
Wang, N., Hayward, R. S., & Noltie, D. B. 1998. Effect of feeding frequency on food
consumption, growth, size variation, and feeding pattern of age-0 hybrid sunfish. Aquaculture.
165(3):261-267.
Rochard, E., Castelnaud, G., & Lepage, M. (1990). Sturgeons (Pisces: Acipenseridae); threats
and prospects. Journal of Fish Biology, 37(sA), 123-132.
IUCN 2010. http://www.iucn.org/?4928/Sturgeon-more-critically-endangered-than-any-other-
group-of-species.

98
CHAPTER V: SURVIVAL OF LAKE STURGEON AS A FUNCTION OF DIFFERENT
CHEMOTHERAPEUTANT PROPHYLACTICS
ABSTRACT
In aquaculture settings, stress in fish increases as a result of unfavorable rearing
conditions (e.g., water quality, water source) or common production practices (e.g., handling,
disease treatment) and interferes with physiological processes that aid in the defense against
pathogens. Therefore, the development of therapeutic treatment protocols that limit stress-
induced infection or reduce the occurrence of high mortality events in aquaculture is essential to
successful fish production. In this study the effects of different chemotherapeutants (including a
control) on the survival of larval Lake Sturgeon were quantified at the end of a 5 week study
which began at two weeks post-exogenous feeding. The use of sodium chloride followed 24 hr
later by a hydrogen peroxide treatment resulted in higher mean proportional survival at the end
of this study. Results provide information that can be used to develop standard operating
procedures for lake sturgeon, a species of conservation concern.

99
INTRODUCTION
Stress-, as well as pathogen-induced mortality is common in aquaculture settings,
especially during early life periods, and often resulting in significant losses (Post 1987,
Subasinghe et al. 2001, Conte 2004). Therefore, developing therapeutic treatment protocols that
limit stress-induced infection or reduce the occurrence of high mortality events in aquaculture is
essential to successful fish production. In aquaculture settings, stress in fish increases as a result
of unfavorable rearing conditions (e.g., water quality, water source) or common production
practices (e.g., handling, disease treatment) and interferes with physiological processes that aid
in the defense against pathogens (Conte 2004, Davis 2006). For example, mucosal layers that
aid in ionic regulation as well as act as a primary defense mechanism against pathogens are
compromised in situations of stress (Esteban 2012). Furthermore, if defenses (i.e., mucosal
layers) are compromised, external pathogenic bacteria, such as flavobacterium columnare,
colonize external surfaces (e.g., skin and gills) and cause infection often resulting in significant
mortality (Esteban 2012, Tripathi et al. 2005). In response to high mortality and a growing need
for approved therapeutic regimes, culture managers have experimented with a variety of external
disinfectant treatment strategies (hereafter referred to as “chemotherapeutants”).
Common treatment strategies include the use of chemotherapeutants 1) to treat infected
fish as a consequence of visual detection of disease or in response to high mortality events, or 2)
administer weekly chemotherapeutant prophylactics to reduced stress and prevent incidences of
high mortality associated with pathogen infection (Bowker et al. 2011). Chemotherapeutant
prophylactics used to reduce stress and prevent most prevalent disease-causing bacteria include
chloramine-t (CT), hydrogen peroxide (H2O2), and sodium chloride (NaCl-) (Bowker et al.
100
2011). CT is an external disinfectant found to effectively treat fish with, or by prophylaxis
prevent, external bacterial infections (Thorburn and Moccia 1993, Gaikowski et al. 2008),
particularly those associated with flavobacteriosis (Bowker 2011). Similarly, hydrogen peroxide
is an oxidative external disinfectant that has been used in aquaculture since the 1930s (Tort
2000), and has been shown to reduce or eliminate infections improving survival across multiple
species and multiple life periods (Speare and Arsenault 1997, Rach et al. 2000, Rach et al. 2003).
For example, H2O2 has been used to control mortality associated with finfish egg saprolegniasis,
as well as mortality of larval and juvenile fish infected with external pathogens such as
flavobacterium (Bowker et al. 2011). NaCl- is one of the most commonly used
chemotherapeutants for the control and treatment of external pathogens (Schelkle et al. 2011,
Noga 2000) as well as for osmoregulatory aid (Swarm and Fitzgerald 1992, Francis-Floyd 1995,
Bowker 2011). In addition, NaCl- use is believed to be associated with the ‘shedding’ of the
mucosal layers, which exposes potential pathogens to treatment (Piper et al. 1982). The toxicity
and effectiveness of chemotherapeutants utilized in aquaculture differs by fish species, treatment
regime, treatment concentration, as well as the life period during which treatments are
administered (Sanchez et al. 1996, Gaikowski et al. 1999, Magondu et al. 2011, Schelkle et al.
2011). Given that approved chemotherapeutants were initially and most commonly assessed
using salmonids, further research is needed to evaluate the applicability of common
chemotherapeutants for other fish species, including those of conservation concern, such as Lake
Sturgeon (Acipenser fulvescens).
Lake sturgeon are a species of conservation concern throughout most of their historic
range. Where restoration goals to enhance lake sturgeon populations can be met by stocking,
streamside rearing facilities (SRFs) are used (Holtgren et al. 2007). SRFs utilize a natal water

101
source and are believed to improve the probability of imprinting, compared to traditional
hatcheries which use non-natal well-water for rearing (Flagg and Nash 1999, Holtgren et al.
2007). However, the use of SRFs pose challenges which include increased exposure to extreme
temperature fluctuations and fish pathogens during early development when mortality is
especially high. In the last decade, targeted stocking goals in SRFs have been difficult to achieve
due in large part to high mortality during early life periods. Although unconfirmed, the mortality
is attributed to common bacteria, such as flavobacterium columnare (Holtgren et al. 2007),
which are ubiquitous in nearby water-sources. These challenges and the lack of data pertaining
to the efficacy of chemotherapeutants utilized in lake sturgeon culture warrant refinement and
evaluation of current disease prevention strategies in aquaculture facilities.
Currently, quantitative data pertaining to the use of chemotherapeutant prophylactics are
lacking for lake sturgeon beyond the egg period. Therefore, the objective of this study was to
quantify and compare survival of young-of-year lake sturgeon raised in a SRF exposed to
different chemotherapeutant prophylactics. Our hypothesis was that survival of young-of-year
lake sturgeon will differ as a function of different chemotherapeutant prophylaxis treatments.

102
METHODS
Study site
This study was conducted from 26 June to 30 July 2013 at the BR-SRF which was
supplied with ambient river water (~680 L/min) from the Kleber Reservoir, located near primary
spawning areas for lake sturgeon in the upper Black River in Cheboygan County, Michigan. Use
of SRFs, such as the Black River Streamside Rearing Facility (BR-SRF) has been widely
advocated in the Great Lakes basin as the preferred method for culturing lake sturgeon. The
mean water temperature recorded during this study was 22.7ºC, and ranged from 20.0 to 26.3ºC.
Study fish
Hatchery-produced larvae gamete collection, fertilization and incubation. –
Gametes were collected from two male and two female lake sturgeon spawning in the
upper Black River. Gametes were transported to the BR-SRF for fertilization, which took place
within four hours of collection. Approximately 200 mL of eggs from each female were placed
into a separate dry bowl. Milt samples from a separate male per female were activated using a
1:200 dilution of ambient river water and immediately poured over eggs allowing 90 seconds for
fertilization. Excess milt was removed and eggs were rinsed once with ambient river water. Egg
de-adhesion procedures began by applying a Fuller’s Earth solution (Sigma Aldrich) and gently
mixing for 50 min. After 50 min, Fuller’s Earth was rinsed from the eggs and a 15 min, 50 ppm
Iodophor disinfection treatment was administered. Following a 10 min rinse to remove residual
Iodophor using ambient river water, eggs were transferred to Aquatic Eco-Systems (Pentair) J32
Mini Egg-hatching jars for incubation.

103
Wild naturally-produced larvae field collection and incubation. –
Naturally produced, fertilized eggs were collected from the Upper Black River at two
spawning locations approximately three days post-fertilization. Eggs were transported to the
BR-SRF and incubated, separated by capture location (Site B, and Site C), in Aquatic Eco-
Systems (Pentair) J32 Mini Egg-hatching jars.
Egg incubation and chemical treatment
Hatchery- and naturally-produced eggs were treated daily using a 500 ppm, 15 min bath
treatment of hydrogen peroxide until 24 hours prior to hatch determined by observing embryo
development stage 32 to 34 (Detlaff et al. 1993).. After hatch and during the free-embryo period,
lake sturgeon seek refuge in available substrate (Hastings et al. 2013), therefore free-embryo
were raised in 10 L polycarbonate tanks (Aquatic Habitats) with a single layer of 2.54 cm3
sinking Bio-Balls (Pentair #CBB1-S) covering the tank bottom. Wild free-embryos were raised
until endogenous resources were absorbed and fish began a ‘swim-up’ behavior (approx. 7-10
days post-hatch). At the onset of exogenous feeding we removed Bio-Balls and began feeding
brine shrimp three times daily.
Experimental treatments
At twelve days post-exogenous feeding, we transferred 400 fish from each family and
each spawning location group into four 1.2 m diameter tanks which were sub-divided into eight
equal-sized sections (50 fish per section). Each partition was randomly assigned to one of four
weekly treatment types, each with two replicates (Figure 5). This study began at fourteen days
post-exogenous feeding (two-day tank acclimation) and continued for thirty-five days to quantify
and compare the effects of different prophylactic chemotherapeutants when mortality in SRFs is
highest. Chemotherapeutants administered in this study include those commonly utilized in

104
traditional hatcheries and SRFs. Weekly prophylactic treatments in this study included: 1) 60
min, 15 ppm CT bath, 2) 15 min, 60 ppm H2O2, 3) 3 parts per thousand (ppt) NaCl- bath for 15
min followed 24 hr later by a 15 min, 60 ppm H2O2 bath, and 4) a control (no chemical
treatment). Fish were fed three times daily, except on treatment days, feeding was delayed until
all treatments had been performed. Each week, all fish from each treatment type (including
controls) were transferred using a small aquarium dip net to 10 L polycarbonate tanks with one
aerator in each tank. Fish were administered respective treatments, briefly rinsed, and placed
back into their rearing tank. All treatments were administered on the same day, once per week
except treatment 3, which included an additional treatment the following day with H2O2.
Controls were handled in the same manner as all other treatment groups, however, similar to
treatment 1, were held for 60 min in their ‘treatment’ tank before being rinsed and returned to
their rearing tanks. Mortalities were removed from the tanks each day and recorded to quantify
survival at the end of the study. The experiment lasted 35 days (49 days post-exogenous
feeding) to encompass the period of high mortality documented in all SRFs.

105
Figure 5. Experimental design of larval chemotherapeutant study. Each 1.2 m diameter tank held
separate, 400 fish from hatchery- and wild naturally-produced fish which were split into four
tanks and sub-divided into eight equal-sized sections (50 fish per section). Each partition was
randomly assigned to one of four weekly treatment types, each with two replicates.
Chemotherapeutant treatments included: 1) 60 min, 15 ppm CT bath, 2) 15 min, 60 ppm H2O2,
3) 3 parts per thousand (ppt) NaCl- bath for 15 min followed 24 hr later by a 15 min, 60 ppm
H2O2 bath, and 4) a control (no chemical treatment). Arrows indicate water flow.

106
Statistical Analysis
Analyses to quantify mean proportional survival (±SE) as a function of treatment, was
performed using SAS (SAS Institute version 9.3 Cary, NC). A p value < 0.05 was considered
statistically significant for all analyses. Progeny from each family and each capture location
were housed separately in four different tanks. Analyses were conducted and reported by
treatment. Tank section was the experimental unit for all analyses, not individual fish. A
generalized linear model using analysis of variance (ANOVA) was used to analyze proportional
survival data. Survival data were modeled using a beta-distribution and reported as the
proportion of survival. We used Tukey-Kramer multiple comparison tests for all response
variables.

107
RESULTS
Survival at 35 days (49 days post-exogenous feeding)
This study documented a significant effect of treatment on mean proportional survival at
the end of this study (F3,28 = 9.89, P = 0.0001). Mean proportional survival in groups treated
weekly with NaCl followed 24 hr later by peroxide was significantly higher than those treated
weekly with peroxide (t28 = -3.57, P = 0.0067) (Table 15), and those treated weekly with
chloramine-T (t28 = -4.93, P = 0.0002). However, mean proportional survival between those
treated weekly with NaCl- followed 24 hr later by peroxide was not significantly different from
the control (t28 = -1.29, P = 0.5775) (Table 15). Mean proportional survival in control groups
was significantly higher than those treated weekly with chloramine-T (t28 = -3.84, P = 0.0034)
(Table 15).
Table 15. Mean number of fish surviving each week and proportional survival (±SE) at the end
of this study as a function of different commonly used chemotherapeutant prophylactics. CT =
60 min, 15 ppm chloramine-T bath, H2O2 = 15 min, 60 ppm H2O2 bath, NaCl- & H2O2 = 3 parts
per thousand (ppt) NaCl- bath for 15 min followed 24 hr later by a 15 min, 60 ppm H2O2 bath,
and Control = no chemical treatment). Identical lower-case letters in the same column are not
significantly different (Tukey-Kramer, P < 0.05).
Chemotherapeutant Mean number of live fish
End (±SE) Week 1 Week 2 Week 3 Week 4
CT 24.6 20.1 19.4 19.1 19.1 (0.38 ±0.09) z
H2O2 31.5 25.6 25.3 25.3 25.0 (0.51 ±0.06) z
NaCl- & H2O2 46.5 43.5 42.6 42.3 41.5 (0.83 ±0.03) y
Control 43.8 36.1 35.6 35.4 35.1 (0.70 ±0.06) yz

108
DISCUSSION
This study was conducted to quantify the effects of weekly prophylactic
chemotherapeutants on the survival of hatchery- and naturally-produced young-of-year lake
sturgeon. CT and H2O2 are the most commonly utilized chemotherapeutant prophylactics in SRF
culture. However, these treatments showed the lowest mean proportional survival compared to
the remaining treatment and the control which suggests that modifications to current
chemotherapeutant prophylactic treatment regimens are necessary to improve aquaculture
success in SRFs through the early rearing period.
Lower survival exhibited by tanks treated with CT or H2O2 was surprising given that CT
and H2O2 have been used as a weekly chemotherapeutant prophylactic in lake sturgeon culture
under similar treatment and rearing conditions (e.g., fish age, water temperature) with promising
albeit not quantitative results (Ceskleba et at. 1985, Gaikowski et al. 2008, Holtgren et al. 2007).
Differences in survival in our study as a function of CT or H2O2 treatments could have been due
to stress associated with the initial treatment acting alone or in concert with rearing conditions
that may have increased the toxicity of treatments utilized in this study (i.e., pH, temperature).
Several studies, using other species (i.e., salmonids) have noted significant mortality occurs soon
after initial treatment with either CT or H2O2 which may indicate that the additional stress
associated with treatment resulted in increased mortality of already sick, stressed fish
(Gaikowski et al. 1999, Rach et al. 2000). Furthermore, given that we used a flow-through natal
water source, temperature as well as pH was subject to change during treatment which could
109
have increased the toxicity of CT or H2O2 treatments (Bills et al. 1988). However, we did not
measure pH or other water quality parameters to verify such changes.
In three of the four tanks used in this study, NaCl- & H2O2, which included a 3 ppt NaCl-
treatment followed 24 hr later by a 60 ppm H2O2 treatment, exhibited the highest mean
proportional survival compared to other treatments. Currently, we are unaware of any literature
which reports two treatments in tandem as a form of weekly chemotherapeutant prophylaxis.
The purpose of using NaCl- followed 24 hr later by H2O2 was to first shed the mucosal layer
exposing any potential pathogens (Piper et al. 1982, King and Farrell 2002), and then treat using
H2O2 which is a known external disinfectant for pathogens such as flavobacterium columnare
(Esteban 2012). There are two potential explanations for higher survival among those groups
from NaCl- & H2O2 treatment groups. First, fish may not have been infected at all during the
course of the study and moralities observed in other treatments were a by-product of handling
and/or treatment stress. Therefore, higher survival in NaCl- & H2O2 treatment groups could be
explained by the fact that NaCl- reduced stress-induced mortality that may have been associated
with handling and/or treatment (Swarm and Fitzgerald 1992, Francis-Floyd 1995, Bowker 2011).
Controls among all tanks exhibited higher mean proportional survival compared to H2O2 and CT
(although not significant higher than H2O2) and given that these groups were handled in a similar
manner suggests that mortality was caused by the effect of treatments rather than handling.
Therefore, the initial NaCl- bath in treatment 3, may have reduced the stress associated with
chemical treatment that followed 24 hr later. Second, fish may have been infected with
pathogens that were only treatable by first having the fish mucosal layer shed using the 3 ppt
NaCl- treatment followed by the 60 ppm H2O2 treatment. CT and H2O2 may not have been able
to disinfect pathogens which may have been embedded in the mucosal layer which could explain

110
the lower mean proportional survival. However, the latter is not well supported based on the
data from the controls. Controls showed higher mean proportional survival compared to those
from treatments CT and H2O2 which would suggest that mortalities may have been caused by
treatment rather than pathogen-induced infection.
Conclusions
The results suggest that SRFs which treat fish weekly using a 3 ppt NaCl- bath for 15 min
followed 24 hr later by a 60 ppm H2O2 bath for 15 min treatment, can increase mean proportional
survival during 30 days when mortality is high. Given that similar results were demonstrated
among different tanks and among different progeny source, we recommend discontinuing the use
of CT and H2O2 as stand-alone treatments. These data may be used to develop standard
operating procedures to reduce high mortality that occurs during early rearing of lake sturgeon in
SRFs.

111
LITERATURE CITED

112
LITERATURE CITED
Bills, T. D., L. L. Marking, V. K. Dawson, and J. J. Rach. 1988. Investigations in fish control:
Effects of environmental factors on the toxicity of Chloramine-T to fish. U.S. Fish and Wildlife
Service LaCrosse, WI USA.
Bowker, J., M. Gaikowski, A. Goodman, L. Sprague, and M. Bowman. 2011. Guide to using
drugs, biologics, and other chemicals in aquaculture. U. S. Fish and Wildlife Service Aquatic
Animal Drug Approval Partnership Program http://www.fws.gov/fisheries/aadap/home.htm 1-62.
Ceskleba, D. G., S. AveLallemant, and T. F. Thuemler. 1985. Artificial spawning and rearing of
lake sturgeon, Acipenser fulvescens, in Wild Rose State Fish Hatchery, Wisconsin, 1982-1983.
Environmental Biology of Fishes. Vol. 14(1), 79-85.
Conte, F. S. 2005. Stress and welfare of cultured fish. Applied Animal Behaviour Science
36:205-223.
Crossman, J. A., K. T. Scribner, C. A. Davis, P. S. Forsythe, and E. A. Baker. 2014. Survival
and growth of lake sturgeon during early life stages as a function of rearing environment.
Transaction of the American Fisheries Society. 143:104-116.
Davis, K. B. 2006. Management of physiological stress in finfish. Aquaculture 68(2):116-121.
Esteban, M. A. 2013. An overview of the immunology of fish larvae. Reviews in Aquaculture
5(1):S1-S25.
Flagg, T. A., and C. E. Nash. 1999. A Conceptual Framework for Conservation Hatchery
Strategies for Pacific Salmonids. Seattle, WA: U.S. Department of Commerce, NOAA
Technical Memorandum NMFS-NWFSC-38, 48.
Francis-Floyd, R. 1995. The use of salt in aquaculture. Retrieved from 307 University of
Florida, Cooperative 306 Extension Service: Fact Sheet, 86, pp. 1-3.
Gaikowski, M. P., J. J. Rach, and R. T. Ramsay. 1999. Acute toxicity of hydrogen peroxide
treatments to selected lifestages of cold-, cool-, and warmwater fish. Aquaculture. Vol. 178,
191-207.
Gaikoski, M. P., W. J. Larson, and W. H. Gingerich. 2008. Survival of cool and warm freshwater
fish following chloramine-T exposure. Aquaculture 275:20-25.
Hastings, R. P., J. M. Bauman, E. A. Baker, and K. T. Scribner. 2013. Post-hatch dispersal of
Lake Sturgeon (Acipenser fulvescens, Rafinesque, 1817) yolk-sac larvae in relation to substrate
in an artificial stream. Journal of Applied Ichthyology 29:1208-1213.

113
Holtgren, J. M., S. A. Ogren, A. J. Paquet, and S. Fajfer. 2007. Design of a Portable Streamside
Rearing Facility for Lake Sturgeon. North American Journal of Aquaculture. Vol. 69(4), 317-
323.
King, K. and P. Farrell. 2002. Sensitivity of juvenile Atlantic Sturgeon to three therapeutic
chemicals used in aquaculture. North American Journal of Aquaculture 64:60-65.
Magondu, E. W., J. Rasowo, E. Oyoo-Okoth, and H. Charo-Karisa. 2011. Evaluation of sodium
chloride (NaCl) for potential prophylactic treatment and its short-term toxicity to African catfish
Clarias gariepinus (Burchell 1822) yolk-sac and swim-up fry. Aquaculture. Vol. 319, 307-310.
Noga, E. J. 2000. Fish disease: Diagnosis and treatment. Wiley Publishing & Sons, Ames Iowa
USA .
Piper, R. G., I. B. McElwain, L. E. Orme, J. P. McCraren, L. G. Fowler, and R. J. Leonard. 1982.
Fish Hatchery Management. U.S. Fish and Wildlife Service, Washington D.C.
Post, G. 1987. Textbook of Fish Health. TFH Publications, Inc., Neptune City, NJ. 1-288.
Rach, J. J., M. P. Gaikowski, and R. T. Ramsay. 2000. Efficacy of hydrogen peroxide to control
mortalities associated with bacterial gill disease infection on hatchery-reared salmonids. Journal
of Aquatic Animal Health 12(2):119-127.
Rach, J. J., S. M. Schleis, M. Gaikowski, and A. Johnson. 2003. Efficacy of hydrogen peroxide
in controlling mortality associated with external columnaris in Walleye and Channel Catfish
fingerlings. North American Journal of Aquaculture 65:300-305.
Sanchez, J. G., D. J. Speare, N. McNair, and G. Johnson. 1996. Effects of a Prophylactic
Chloramine-T Treatment on Growth Performance and Condition Indices of Rainbow Trout.
Journal of Aquatic Animal Health. Vol. 8, 278-284.
Schelkle, B., R. Doetjes, and J. Cable. 2011. The salt myth revealed: Treatment of gyrodactlid
infections on ornamental guppies, Poecilia reticulate. Aquaculture 31(1):74-79.
Spear, D. J. and G. J. Arsenault. 1997. Effects of intermittent hydrogen peroxide exposure on
growth and columnaris disease prevention of juvenile rainbow trout (Oncorhynchus mykiss).
Canadian Journal of Fisheries and Aquatic Sciences 54:2653-2658.
Subasinghe, R. P., M. G. Bondad-Reantaso, S. E. McGladdery. 2001. Aquaculture development,
health and wealth. In: Subasinghe, R. P., P. Bueno, M. J. Phillips, C. Hough, S. E. McGladdery,
and J. R. Arthur (Eds.). 2000. Aquaculture in the third millennium. Technical Proceedings of the
Conference on Aquaculture in the third millennium, Bangkok, Thailand 20-25.
Swarm, L., and S. Fitzgerald. 1992. Use and Application of Salt in Aquaculture. North Central
Regional Aquaculture Center Publication, No. 105, pp 1-2.
Thorburn, M. A., and R. D. Moccia. 1993. Use of chemotherapeutics on trout farms in Ontario.
Journal of Aquatic Animal Health 5(2):85-91.
114
Tort, M. J. 2000. Studies of hydrogen peroxide for the treatment of bacterial gill disiease in fish.
Cornell University Dissertation 1-204..
Tripathi, N. K., K. S. Latimer, C. R. Gregory, B. W. Ritchie, R. E. Wooley, and R. L. Walker.
2005. Development and evaluation of an experimental model of cutaneous disease in koi
Cyprinus carpio. Journal of Veterinary Diagnostic Investigation 17:45-54.