Investigation of PISA 2015 Reading Ability Achievement of ...
13
International Journal of Assessment Tools in Education 2020, Vol. 7, No. 1, 30–42 https://dx.doi.org/10.21449/ijate.589280 Published at http://www.ijate.net http://dergipark.org.tr/en/pub/ijate Research Article 30 Investigation of PISA 2015 Reading Ability Achievement of Turkish Students in Terms of Student and School Level Variables Kazim Celik 1,* , Ahmet Yurdakul 2 1 Department of Education, Faculty of Education, Pamukkale University, Denizli, Turkey 2 Directorate of National Education, Usak, Turkey ARTICLE HISTORY Received: 09 July 2019 Revised: 25 November 2019 Accepted: 26 January 2020 KEYWORDS PISA, Reading ability, Hierarchical linear model, Student level factors, School level factors, Abstract: The aim of this study is to determine the students-level and school- level factors that are related to reading ability achievement of students who participated PISA 2015 (Programme for International Student Assessment) from Turkey. The effects of the student and school level factors on reading achievement of students were tested by 2 level hierarchical linear model. According to the findings, there are differences between schools in terms of students' reading ability scores in Turkey. When the findings of the effects of the student level variables on the reading ability scores are examined; mother’s socio-economic status, parental emotional support, and unfair teacher behavior variables seem to affect students' reading ability achievement. When the findings of the effects of the school level variables on the reading ability scores are examined; school size, teacher education level, and student behavior that hinders learning variables have a significant effect on the average reading ability scores of schools. When the student and school level variables mentioned above were modeled together, the significant effect of the school size variable was lost while the teacher education level and the student behavior that hinders learning variables continued to have a significant effect on the schools average reading ability scores. 1. INTRODUCTION The evaluation of the quality of education is crucial. The most commons of these evaluation methods in recent years are the PISA and TIMMS exams which are also applied in Turkey. Thanks to these exams, countries can see their level of education in the world compared to other countries. The PISA (Programme for International Student Assessment) is a screening survey conducted by the Organization for Economic Co-operation and Development (OECD) every 3 years and assesses the knowledge and skills gained by 15-year-old students (OECD, 2000; Schleicher, 2007; Breakspear, 2012). PISA focuses on the ability of young people using their skills and knowledge to cope with real life challenges (Reinikainen, 2012). The assessment, which focuses on reading, mathematics, science and problem-solving, not only recognizes that students can repeat what they have learned, but also examines how well they are able to benefit what they have learned and how they can apply this knowledge in and out of the school CONTACT: Kazim Celik [email protected] Department of Education, Faculty of Education, Pamukkale University, Denizli, Turkey ISSN-e: 2148-7456 /© IJATE 2020
Transcript of Investigation of PISA 2015 Reading Ability Achievement of ...
International Journal of Assessment Tools in Education
2020, Vol. 7, No. 1, 30–42
https://dx.doi.org/10.21449/ijate.589280
Published at http://www.ijate.net http://dergipark.org.tr/en/pub/ijate Research Article
30
Investigation of PISA 2015 Reading Ability Achievement of Turkish
Students in Terms of Student and School Level Variables
Kazim Celik 1,*, Ahmet Yurdakul 2
1Department of Education, Faculty of Education, Pamukkale University, Denizli, Turkey 2Directorate of National Education, Usak, Turkey
ARTICLE HISTORY
Received: 09 July 2019
Revised: 25 November 2019
Accepted: 26 January 2020
KEYWORDS
PISA,
Reading ability,
Hierarchical linear model,
Student level factors,
School level factors,
Abstract: The aim of this study is to determine the students-level and school-
level factors that are related to reading ability achievement of students who
participated PISA 2015 (Programme for International Student Assessment) from
Turkey. The effects of the student and school level factors on reading
achievement of students were tested by 2 level hierarchical linear model.
According to the findings, there are differences between schools in terms of
students' reading ability scores in Turkey. When the findings of the effects of the
student level variables on the reading ability scores are examined; mother’s
socio-economic status, parental emotional support, and unfair teacher behavior
variables seem to affect students' reading ability achievement. When the findings
of the effects of the school level variables on the reading ability scores are
examined; school size, teacher education level, and student behavior that hinders
learning variables have a significant effect on the average reading ability scores
of schools. When the student and school level variables mentioned above were
modeled together, the significant effect of the school size variable was lost while
the teacher education level and the student behavior that hinders learning
variables continued to have a significant effect on the schools average reading
ability scores.
1. INTRODUCTION
The evaluation of the quality of education is crucial. The most commons of these evaluation
methods in recent years are the PISA and TIMMS exams which are also applied in Turkey.
Thanks to these exams, countries can see their level of education in the world compared to other
countries. The PISA (Programme for International Student Assessment) is a screening survey
conducted by the Organization for Economic Co-operation and Development (OECD) every 3
years and assesses the knowledge and skills gained by 15-year-old students (OECD, 2000;
Schleicher, 2007; Breakspear, 2012). PISA focuses on the ability of young people using their
skills and knowledge to cope with real life challenges (Reinikainen, 2012). The assessment,
which focuses on reading, mathematics, science and problem-solving, not only recognizes that
students can repeat what they have learned, but also examines how well they are able to benefit
what they have learned and how they can apply this knowledge in and out of the school
CONTACT: Kazim Celik [email protected] Department of Education, Faculty of Education, Pamukkale University, Denizli, Turkey
ISSN-e: 2148-7456 /© IJATE 2020

Int. J. Asst. Tools in Educ., Vol. 7, No. 1, (2020) pp. 30–42
31
environment. This approach reflects the fact that modern societies reward what the students can
do instead of what they know (OECD, 2014).
In a short time, PISA has gone a long way and reinforced the role of OECD and its Education
Directorate as a leading global organization to develop and analyze comparative international
education performance data. PISA results now have a very high profile in the national media
and are in the awareness of high-level politicians (Fairclough, 2000; Lingard & Rawolle, 2004,
Grek, 2009). As Gür, Çelik and Özoğlu (2012) stated countries shape their educational policies
according to PISA results. PISA results enable policy makers from around the world to measure
the knowledge and skills of their country's students compared to other countries, to set policy
targets, and to learn from applied policies and practices elsewhere (Ringarp & Rothland, 2010).
PISA assesses the application of knowledge in mathematics, reading and science literacy to
problems in the context of real life (OECD, 1999). The PISA uses the term "literacy" in each
area to show focus on the application of knowledge and skills. For example, when reading is
assessed, PISA assesses how well students in the 15th year understand, use and reflect the
written text for various purposes and environments. In science, PISA assesses how students can
apply scientific knowledge and skills to different situations they may encounter in their lives.
Similarly, in mathematics, PISA evaluates how students analyze, reason, and interpret
mathematical problems in various situations. The scores on the PISA scales represent skill
levels throughout the continuity of literacy skills. PISA provides a range of proficiency levels
associated with points that define what a student can typically do at each level (OECD, 2006).
Mathematics and science education constitute large and dynamic elements of schooling that are
generally viewed as important to individual students in enhancing their understanding of the
world and improving their chances of lifetime achievement and also important at the larger
societal level in today’s knowledge-based economy where the capacities of the citizenry are
directly linked to the well-being of the nation. However, the importance of mathematics and
science education is a distant second compared to the importance ascribed to language and
literacy education, especially reading (Yore, Anderson & Chiu, 2010). According to Wellington
and Osborne (2001); to be successful in math and science, students should understand what
they read. Therefore, in this study the factors that affect the reading literacy of pupils are
investigated.
Apart from tests that assess students’ knowledge in mathematics reading and science literacy,
in PISA, some questionnaires are also applied. These questionnaires are designed to get
information about students and their families’ background including their economic, social and
cultural capital, students’ attitudes towards learning, the life aspects of students such as their
habits in and out of the school and, their lives and families, the quality of human and material
resources of schools, aspects of the school's such as teaching and learning processes, staffing
practices and emphasis on curriculum and extracurricular activities, organizational structures
and genres, class size, classroom and school environment and instructional content, including
science activities in the classroom (Rindermann, 2007). In the current study the factors that
affect the reading literacy achievement of students are determined according to the results of
these questionnaires.
When the literature is examined, some research studies on the subject are available. Yildirim
(2012) investigated the student and school variables that influence PISA 2009 reading
comprehension skills, Willms (2001) investigated the differences in the level of reading
comprehension in the Canadian provinces, and the factors that make this difference, Lietz and
Kotte (2004) compared the factors that affect the achievement of Finland’s, which is the most
successful country in reading skills according to PISA 2000 results, and Germany’s, which is
under average, Linnakyla, Malin and Taube (2004) compared PISA 2000 reading ability scores
of Finnish and Swedish students and tried to explain the reason of the difference, Kotte, Lietz

Çelik & Yurdakul
32
and Lopez (2005) used PISA 2000 data to investigate the factors that encourage and impede
students' reading achievement in Germany and Spain, Nonoyama (2006) investigated the
factors that affect the school-based and family-based factors in achievement of students in
reading skills. Besides these Thomson, Bortoli, Nicholas, Hillman and Buckley (2010)
investigated PISA results for Australia, Wilmms (2001) and Catwright and Allen (2002) for
Canada, Rindermann (2007) for Denmark, Brozo, Shiel and Topping (2007) for Ireland,
Scotland and the U.S.A, Grek (2009) for England, Finland and Germany.
When the literature was investigated, no studies were conducted on PISA 2015 data. When we
look at the work done in the past years, we have not encountered a study which deals
specifically with the variables of our study. PISA results reveal what is possible in education
by demonstrating what the highest performing and fastest growing educational system can do.
While applying cognitive tests to students, at the same time PISA also applies student, parents
and school questionnaires in order to evaluate the factors that affect students' achevement. In
the student questionnaire, the student is asked questions about his / her home (family, computer
use, technology use, etc.); In the school questionnaires, the school administrator or an
authorized person is asked questions about the structure of the school, the resources of the
school, the situation of students and teachers, educational policies and school climate. While
the PISA project demonstrates the academic achievement of students on an international scale
through cognitive tests, it also measures the relationship between school resources at national
and international levels with the data obtained from school surveys; it also reveals similarities
and differences between different schools. Findings allow policy makers around the world to
measure the knowledge and skills of students in their countries compared to other countries, to
set policy targets against measurable targets in other education systems, and to learn from
applied policies and practices elsewhere (MEB, 2015). But according to Özdemir (2017), in
Turkey the studies on PISA are mostly not original, these studies are repetition or the
interpretation of the results published by MEB (Turkish Ministry of National Education) and
OECD. Therefore, original studies in this field are needed. The hierarchical linear modeling
approach is a two-level strategy (Hoffman, Griffin and Gavin, 2000) that investigates the
variables involved in two-step analysis. As the PISA data are hierarchical, this approach is very
convenient. Students who are the sample group of PISA are in classrooms, classes in schools,
schools in cities, and cities in countries. In this context the aim of this study is to determine the
personal and school-based factors that affect Turkish students’ reading achievement in PISA
2015.
2. METHOD
2.1. Study Group
In PISA 2015, the 15 year-old student population was determined to be 925.366 students. In
the PISA study, school sampling was determined by stratified random sampling method. At the
first stage for PISA 2015 application, schools were selected by stratified random sampling
method in the Classification of Statistical Region Units (NUTS) Level 1, type of education,
type of school, place of schools and administrative forms of schools, and in the second stage
students who were to participate in these schools were determined by random method . 5895
students from 187 schools in 61 cities that represent 12 regions participated in the exam (MEB,
2015). 20.7 % of students participating in PISA 2015 application are 9th grade students and
72.9% are 10th grade students. 75% of the students attend vocational high schools and
Anatolian high schools. 50% of the students are male and 50% of the students are female.
2.2. Data Collection Tools
The data on students' achievements in reading comprehension, mathematics and science, and
demographic, socio-economic and educational variables that may be related to achievement in
Int. J. Asst. Tools in Educ., Vol. 7, No. 1, (2020) pp. 30–42
33
these areas were collected by PISA 2015 performance tests and questionnaires. In the research,
these tests and questionnaires were used. These data for PISA 2015 was obtained from the
official website of the OECD (http://www.oecd.org/pisa/data/2015database) which carried out
PISA applications. The student and school level variables determined in the study are given in
Table 1.
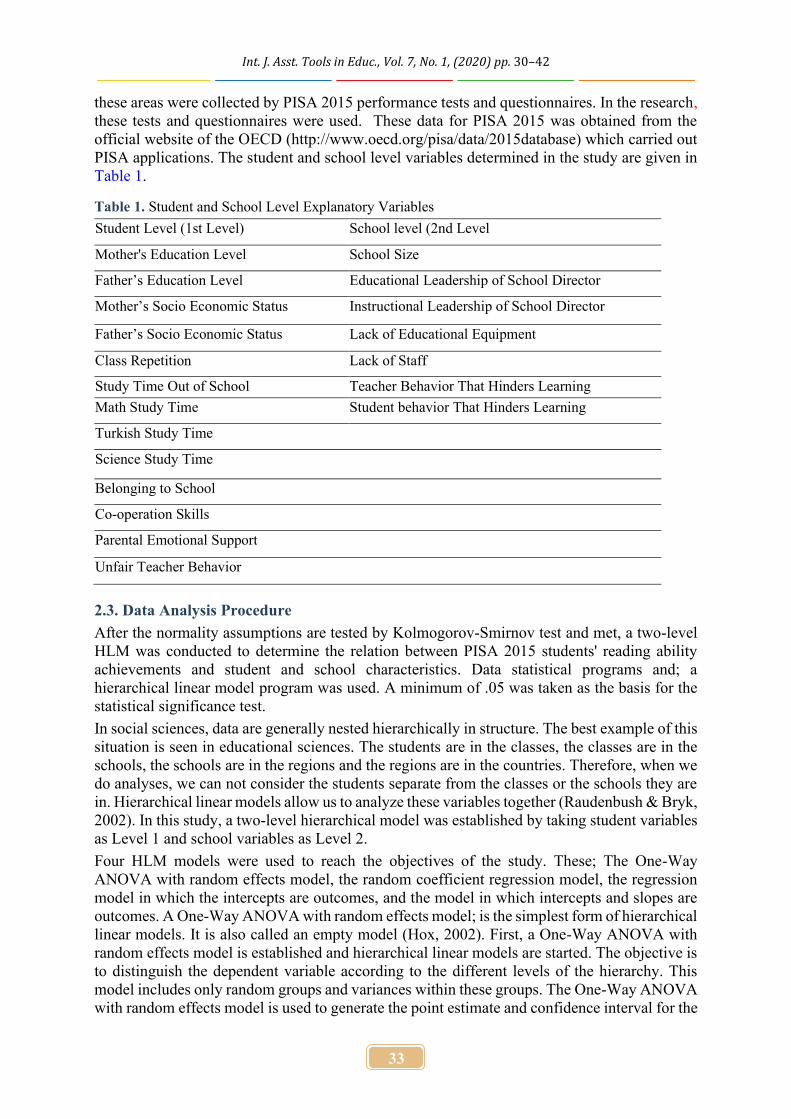
Table 1. Student and School Level Explanatory Variables
Student Level (1st Level) School level (2nd Level
Mother's Education Level School Size
Father’s Education Level Educational Leadership of School Director
Mother’s Socio Economic Status Instructional Leadership of School Director
Father’s Socio Economic Status Lack of Educational Equipment
Class Repetition Lack of Staff
Study Time Out of School Teacher Behavior That Hinders Learning
Math Study Time Student behavior That Hinders Learning
Turkish Study Time
Science Study Time
Belonging to School
Co-operation Skills
Parental Emotional Support
Unfair Teacher Behavior
2.3. Data Analysis Procedure
After the normality assumptions are tested by Kolmogorov-Smirnov test and met, a two-level
HLM was conducted to determine the relation between PISA 2015 students' reading ability
achievements and student and school characteristics. Data statistical programs and; a
hierarchical linear model program was used. A minimum of .05 was taken as the basis for the
statistical significance test.
In social sciences, data are generally nested hierarchically in structure. The best example of this
situation is seen in educational sciences. The students are in the classes, the classes are in the
schools, the schools are in the regions and the regions are in the countries. Therefore, when we
do analyses, we can not consider the students separate from the classes or the schools they are
in. Hierarchical linear models allow us to analyze these variables together (Raudenbush & Bryk,
2002). In this study, a two-level hierarchical model was established by taking student variables
as Level 1 and school variables as Level 2.
Four HLM models were used to reach the objectives of the study. These; The One-Way
ANOVA with random effects model, the random coefficient regression model, the regression
model in which the intercepts are outcomes, and the model in which intercepts and slopes are
outcomes. A One-Way ANOVA with random effects model; is the simplest form of hierarchical
linear models. It is also called an empty model (Hox, 2002). First, a One-Way ANOVA with
random effects model is established and hierarchical linear models are started. The objective is
to distinguish the dependent variable according to the different levels of the hierarchy. This
model includes only random groups and variances within these groups. The One-Way ANOVA
with random effects model is used to generate the point estimate and confidence interval for the

Çelik & Yurdakul
34
large intercept. It also provides information on output variability in each of the two levels (Acar,
2013). In the random coefficient regression model, all of the submodels are treated with the
assumption that the fixed parameter is a randomly changing model. There are no Level 2
independent variables in the model that explain the intercept and slope parameters. In the
regression model in which the intercepts are outcomes, the predictions are made using the Level
2 variables. Regression model consists of group intercepts which are predicted by Level 2
variables. Within the scope of the research, Level 1 of this model was constructed as the first
step of the random-effects ANOVA model. In Level 2, school-level variables, the effects of
which are sought on students’ reading achievement, are added to the model. The last model is
the model in which intercepts and slopes are outcomes. It is also called as full model as it
contains all the 1st and 2nd Level variables together (Raudenbush & Byrk, 2002). In this model
Level 1 variables are added and the change on the effect of Level 2 variables on the dependent
variable is observed.
3. RESULT / FINDINGS
We presented the descriptive statistics for the first sub-problem of the study in Table 2. We
established a One-Way ANOVA with random effects model in order to answer the research
question: “Are there differences between schools in terms of the students' reading
achievement?”
Table 2. Fixed Coefficients for One-Way ANOVA with Random Effects Model
Fixed Effects Coefficients Standard Error t df p
Reading Skills 458.861 5.728 80.105 110 0.000
As depicted in Table 2, there is a significant difference in reading skills achievement among
schools (p <0.01). The average reading scores of schools are 458,861. We presented the random
effect for one-way ANOVA with random effects model in table 3.
Table 3. Random Effects for One-Way ANOVA with Random Effects Model
Random Effect Variance df χ2 p
INTERCEPT 2861.809 110 887.301 .000
Level1 Effect 2213.043
As seen in Table 3, the random effects are significant in school level (χ2 =887.301, df110,
p<0.01). This indicates that the difference between the schools in terms of the average reading
comprehension scores is random. In addition, it was determined that the change in the intercept
score of reading between schools was caused 56% by school variables and 44% by student
variables (2861 / (2861+2213)). Reliability is calculated as 0.78 when the reliability of the Level
1 coefficients, which give information about whether the average obtained from the sample is
a sign of the actual school average. This suggests that the average obtained from the sample is
a reliable indicator of the true school average. In this respect, the model is established as
follows.
Level1 Model
READINGij = β0j + rij
Level2 Model
β0j = γ00 + u0j
Mixed Model

Int. J. Asst. Tools in Educ., Vol. 7, No. 1, (2020) pp. 30–42
35
READINGij = γ00 + u0j+ rij
READING = It is the literacy intercept of the students attended PISA 2015 application from
Turkey.
β0j = It is the literacy intercept of the students for school.
rij = It is the error of Level 1 equation.
γ00 = It is the intercept of schools number j.
u0j = It is the random effect.
We established the random coefficient regression model in order to answer the second sub-
problem of the study “What are the student-level variables that have significant effects on
students' reading comprehension achievements?”. We initially included 13 variables to the
model. These are; the educational status of the mother, the educational status of the father, the
socio-economic level of the mother, the socio-economic level of the father, the grade repetition,
the study time outside the school, the student behavior that prevents learning, mathematics
study time, Turkish study time, science study time, feelings of belonging, enjoyment of
cooperation, emotional support of the family, unfair teacher behavior. The significant ones
among these variables are presented in Table 4.
Table 4. Fixed Coefficents for Random Coefficient Regression Model
Fixed Effects Coefficients Standard
Error t df p
Intercept, β00 456.077067 5.531659 82.449 118 0.000
Mother’s Socio-Economic Status, γ10 0.504272 0.109915 4.588 374 0.000
Parents Emotional Support, γ20 5.715517 2.388353 2.393 374 0.017
Unfair Teacher Behavior, γ30 -2.107095 0.614764 -3.427 374 0.000
When Table 4 is investigated, it is seen that the variables that affect students' reading ability
achievement are mother's socio-economic status, parents’ emotional support and unfair teacher
behavior. According to Table 4, there is a significant positive correlation between the student's
reading ability score and the mother's socio-economic status (β10 = 0.504, SE= 0.10, p <0.05).
When other variables are held constant, a unit increase in mother's socio-economic status
increases reading skills by 0.504 units. There is a significant positive correlation between
students' reading ability scores and family emotional support (β20 = 5.715, SE= 2.388, p <0.05).
Students who perceive the emotional support of the family are more successful in the field of
reading skills than other students. There is a significant negative correlation between students'
reading ability scores and unfair teacher behavior perception variables (β50 = -2.107, SE= 0.61,
p <0.05). It is seen that the more unfair teacher behaviors are, the less students' reading ability
scores are. According to these data, we presented the model as;
Level 1 Model
READINGij = β0j + β1j*(BSMJ1ij) + β2j*(PARSUPij) + β3j*(UNFAIRTEij) + rij
Level-2 Model
β0j = γ00 + u0j
β1j = γ10
β2j = γ20
β3j = γ30

Çelik & Yurdakul
36
β4j = γ40
Mixed Model
READINGij = γ00+ γ10* BSMJ1ij + γ20* PARSUPij + γ30* UNFAIRTEij + u0j+ rij
READING = It is the literacy intercept of the students attended PISA 2015 application from
Turkey.
BSMJ1 = It is mother’s socio-economic status.
PARSUP = It is parental emotional support.
UNFAIRTE = It is unfair teacher behavior.
β0j = It is the reading intercept of j school.
β1j….. β4j = Intercept differences between schools.
γ00 = It is the expected value of constant parameters on Level 2 units.
γ10…...γ40 = They are the expected value of slope parameters on Level 2 units.
u0j = It is Level 2 j unit’s change in constant parameter.
rij = It is the error of Level 1.
The regression model in which the intercepts are outcomes was established in order to answer
the 3rd sub-question of the study “What are the school level variables that that have significant
effects on students' reading comprehension achievements?”. Table 5 shows the fixed and
random effects on the intercept reading score of the school according to the regression model
in which the intercepts are outcomes of school variables.
Table 5. Fixed and Random Effects of the Regression Model in Which The İntercepts Are Outcomes of
School Variables
Fixed Effects Coefficients Standard Error t df p
INTERCEPT, γ00 458.707530 4.880027 93.997 107 0.000
SCHOOLSIZE, γ01 -0.024048 0.007177 -3.351 107 0.001
TEACHER EDUCATON LEVEL, γ02 477.0057 179.673 2.655 107 0.009
STUDENT BEHAVIOR, γ03 -22.774649 4.843012 -4.703 115 0.000
Random Effect Variance df χ2 p
INTERCEPT, r0 2008.94783 107 613.75481 0.000
Level 1 Effect, e 2208.15542
As depicted in Table 5, the school level variables that affect students’ reading ability
achievement are school size, teachers’ educational level, and student behavior that hinders
learning. There is a negative correlation between students' reading ability scores and school size
(β01 = -0.024, Standard Error (SE) = 0.007, p <0.05). As the number of students increases, the
scores of reading skills of the students decrease. There is a positive significant relationship
between the reading ability scores of the students and the education levels of the teachers (β02
= 477.005, SE = 179.673, p <0.05). As the level of education of teachers increases, the scores
of students' reading skills also increase. There is a negative relationship between students'
reading ability scores and student behaviors that prevent learning (β03 = -22,774 SE = 4.84, p
<0.05). The more students’ behaviors that prevent students from learning is, the lower their
reading ability scores are. According to these data the regression model ın which the intercepts
are outcomes is established as;
Level-1 Model
READINGij = β0j + rij

Int. J. Asst. Tools in Educ., Vol. 7, No. 1, (2020) pp. 30–42
37
Level-2 Model
β0j = γ00 + γ01*(SCHSIZEj) + γ02*(TEACEDLEVj) + γ03*(TEACBEHj) + u0j
Mixed Model
READINGij = γ00 + γ01**(SCHSIZEj) + γ02*(TEACEDLEVj) + γ03*(TEACBEHj) + u0j+
rij
SCHSIZE = It is the school size.
TEACEDLEV = It is the teachers’ education level.
TEACBEH = It is the teacher behavior that hinders learning.
β0j = It is the reading achievement of school j.
β1j….. β4j = Intercept differences between schools.
γ00 = It is the expected value of constant parameters on Level 2 units.
γ01….. γ03 = They are the differentiating effects of school level variables on school average
achievement.
γ10…...γ40 = They are the expected value of slope parameters on Level 2 units.
u0j = It is Level 2 j unit’s change in constant parameter.
rij = It is the error of Level 1.
We established the model in which intercepts and slopes are outcomes to answer the 4th sub-
question of the study “When the student-level variables that affect reading ability achievement
of the students significantly are added in the model, how do school level variables affect reading
ability achievement of the students?”. In Table 5 we presented the results of the model in which
intercepts and slopes are outcomes.
Table 6. Fixed and Random Effects of the Model in Which Intercepts and Slopes Are Outcomes
Fixed Effects Coefficients Standard
Error t df p
Intercept, γ00 443.436647 6.627748 66.906 107 <0.001
SCHOOLSIZE, γ01 -0.002900 0.011157 -0.260 107 0.795
TEACHER EDUCATION
LEVEL, γ02 432.939496 170.412240 2.541 107 0.013
STUDENT BEHAVIOR, γ03 -19.945674 4.590593 -4.345 107 <0.001
MOTHER’S SOCIO-ECONOMIC STATUS, β1
Constant, γ10 0.358402 0.102493 3.497 371 <0.001
School Size, γ11 -0.000528 0.000186 -2.840 371 0.005
Constant, γ20 5.428292 2.251499 2.411 371 0.016
UNFAIR TEACHER BEHAVIOR, β3
Constant, γ30 -1.579701 0.520183 -3.037 371 0.003
School Size, γ31 0.002506 0.001194 2.099 371 0.037
Random Effect Variance df χ2 p
Intercept, r0 2034.02824 115 710.76624 0.000
Level1 Effect, e 1980.39148
When Table 6 is investigated it can be seen that the student level variables are added in the
model the significant effect of school level variables on students’ reading ability achievement
that were presented in the regression model in which the intercepts are outcomes, except for
Çelik & Yurdakul
38
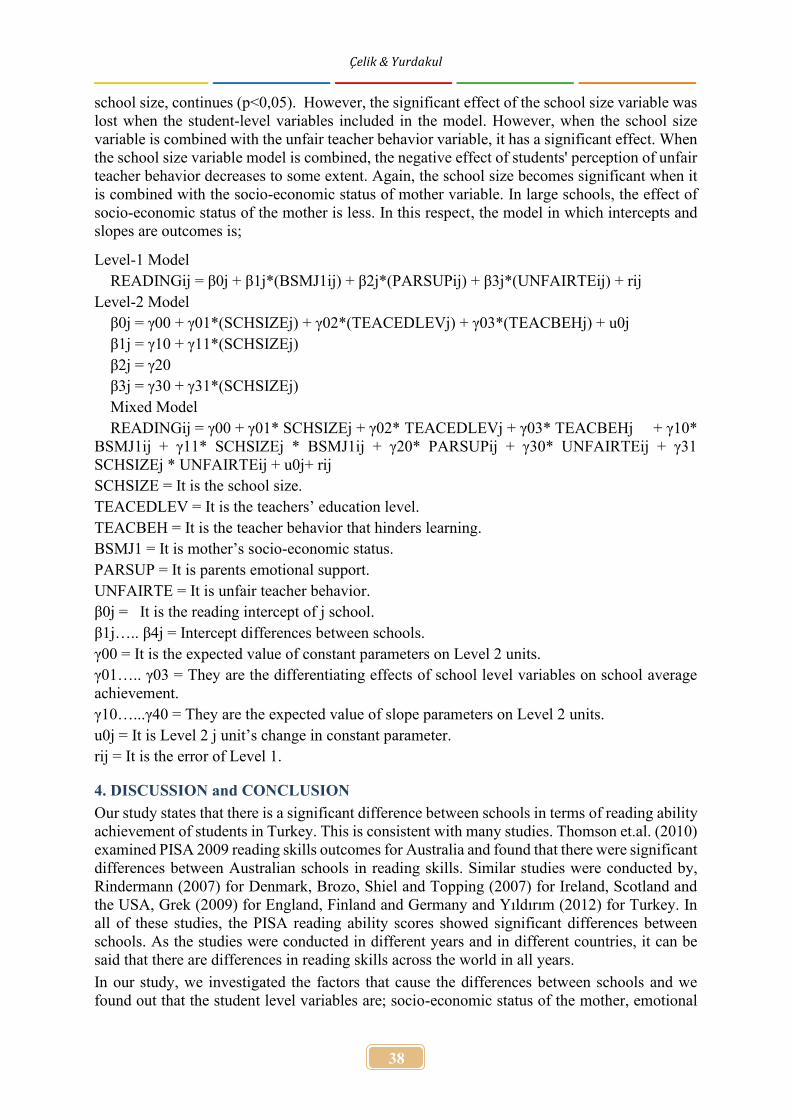
school size, continues (p<0,05). However, the significant effect of the school size variable was
lost when the student-level variables included in the model. However, when the school size
variable is combined with the unfair teacher behavior variable, it has a significant effect. When
the school size variable model is combined, the negative effect of students' perception of unfair
teacher behavior decreases to some extent. Again, the school size becomes significant when it
is combined with the socio-economic status of mother variable. In large schools, the effect of
socio-economic status of the mother is less. In this respect, the model in which intercepts and
slopes are outcomes is;
Level-1 Model
READINGij = β0j + β1j*(BSMJ1ij) + β2j*(PARSUPij) + β3j*(UNFAIRTEij) + rij
Level-2 Model
β0j = γ00 + γ01*(SCHSIZEj) + γ02*(TEACEDLEVj) + γ03*(TEACBEHj) + u0j
β1j = γ10 + γ11*(SCHSIZEj)
β2j = γ20
β3j = γ30 + γ31*(SCHSIZEj)
Mixed Model
READINGij = γ00 + γ01* SCHSIZEj + γ02* TEACEDLEVj + γ03* TEACBEHj + γ10*
BSMJ1ij + γ11* SCHSIZEj * BSMJ1ij + γ20* PARSUPij + γ30* UNFAIRTEij + γ31
SCHSIZEj * UNFAIRTEij + u0j+ rij
SCHSIZE = It is the school size.
TEACEDLEV = It is the teachers’ education level.
TEACBEH = It is the teacher behavior that hinders learning.
BSMJ1 = It is mother’s socio-economic status.
PARSUP = It is parents emotional support.
UNFAIRTE = It is unfair teacher behavior.
β0j = It is the reading intercept of j school.
β1j….. β4j = Intercept differences between schools.
γ00 = It is the expected value of constant parameters on Level 2 units.
γ01….. γ03 = They are the differentiating effects of school level variables on school average
achievement.
γ10…...γ40 = They are the expected value of slope parameters on Level 2 units.
u0j = It is Level 2 j unit’s change in constant parameter.
rij = It is the error of Level 1.
4. DISCUSSION and CONCLUSION
Our study states that there is a significant difference between schools in terms of reading ability
achievement of students in Turkey. This is consistent with many studies. Thomson et.al. (2010)
examined PISA 2009 reading skills outcomes for Australia and found that there were significant
differences between Australian schools in reading skills. Similar studies were conducted by,
Rindermann (2007) for Denmark, Brozo, Shiel and Topping (2007) for Ireland, Scotland and
the USA, Grek (2009) for England, Finland and Germany and Yıldırım (2012) for Turkey. In
all of these studies, the PISA reading ability scores showed significant differences between
schools. As the studies were conducted in different years and in different countries, it can be
said that there are differences in reading skills across the world in all years.
In our study, we investigated the factors that cause the differences between schools and we
found out that the student level variables are; socio-economic status of the mother, emotional

Int. J. Asst. Tools in Educ., Vol. 7, No. 1, (2020) pp. 30–42
39
support of the family, and perception of the teacher's unfair teacher behavior. Acar (2013)
investigated the results of 2005 and 2008 Turkey Student Achievement Test (SAT) and found
the student-level factors that affect reading ability achievement of students as; gender of the
student, father's education level, the number of books the student has, the time for reading, the
belief of success in Turkish class and the state of taking private lessons from Turkish. In her
study, in which she investigated the PISA 2009 reading ability achievements of students,
Yıldırım (2012) revealed that the factors that affect students’ success are; gender, enjoyment of
reading, parents’ socio-economic status and number of the books the student has.
As a result of the research, it was revealed that the socio-economic status of the mother affects
the reading ability score positively. This result is consistent with the studies made by Anılan
(1998), Ates (2008), Bölükbaşı (2010), Kaldan (2007), Öztürk (2010) and Kahraman and Çelik
(2017). As the socio-economic status and educational level of the parents increase, students'
reading achievement increases. Moreover, this is not only the case for reading achievement, but
also for other courses. For example, Erberber (2010) found that parents’ socio-economic status
was influential on the mathematical achievement of students in TIMSS. According to our study
another variable that affects reading achievement of students is parents’ emotional support.
Christenson, Rounds and Gorney (1992), Desimone (1999), Swap (1993), Gümüşeli (2004) and
Çelenk (2003) put forward that family support is a prerequisite for success. From this point of
view, we suggest that organizing seminars for parents to increase their support for their children
may be helpful to increase students’ success.
Another result of our study is that there is not a significant correlation between study time out
of school and having private Turkish lessons and students’ reading achievement. In the study
that they investigated the effect of homework on students’ achievement, Kapıkıran and Kıran
(1999) concluded that students who get less homework are more successful than students who
get more homework. However; Grodner and Rupp (2013) concluded that homework had
positive effects on the learning of students. Considering this data, it can be said that the quality
of the homework given to the students is important and sufficient homework should be given
so that students can do reinforcement instead of giving too much homework.
We found out that unfair teacher behaviour perceptions of students affect students’ reading
achievement in a negative way. Fryer (2013), Allen, Gregory, Mikami, Lun, J., Hamre and
Pianta (2013) and Jones and Jones (2015) found significant relationships between teacher
behavior and student achievement. As the positive teacher behaviors increase, the success and
attitudes of the students are found to be positive. For this reason, it can be said that the positive
attitude and behavior of the teachers towards the students will increase the success.
As a result of the research, school variables that affect students' reading achievement were
school size, teachers' education level and student behavior that hinders learning. There is a
negative relationship between school size and the success of reading skills. Fredriksson, Öckert
and Oosterbeek (2013) and Leithwood and Jantzi (2009) found negative relationships between
school size and success. Therefore, smaller schools instead of larger ones may increase the
success.
According to the results of the research, there is a positive relation between the education level
of the teachers in the schools and the reading ability scores of the students. As the education
levels of teacher’s increase, the success of students' reading skills also increases. In this data,
teachers should be encouraged to constantly improve themselves and to continue their master
education.
In this study the data from Turkey were used. Other countries can be included in the study and
comparative statistics can be made. Results related to reading skills in Turkey was investigated.
The results of science and mathematics achievement may also be investigated. Two levels of
HLM was done in the study by taking the students and school levels into consideration. Levels

Çelik & Yurdakul
40
such as class and district levels can be added and three or four level models can be established.
The research was conducted for PISA exam results. Similar examinations can be made in
examinations like TIMMS and the results of the research can be compared.
Acknowledgements
This study was derived from the PhD thesis supported by Pamukkale University Scientific
Research Projects Coordination Unit with project number 2018EĞBE009.
Declaration of Conflicting Interests and Ethics
The authors declare no conflict of interest. This research study complies with research
publishing ethics. The scientific and legal responsibility for manuscripts published in IJATE
belongs to the author(s).
ORCID
Kazım ÇELİK https://orcid.org/0000-0001-7319-6567
Ahmet YURDAKUL https://orcid.org/0000-0002-9995-7157
5. REFERENCES
Allen, J., Gregory, A., Mikami, A., Lun, J., Hamre, B., & Pianta, R. (2013). Observations of
effective teacher–student interactions in secondary school classrooms: Predicting student
achievement with the classroom assessment scoring system—secondary. School
Psychology Review, 42(1), 76.
Anılan, H. (1998). Beşinci sınıf öğrencilerinin Türkçe dersinde okuduğunu anlama becerisiyle
ilgili hedef davranışların gerçekleşme düzeyleri [Level of achievement of the general
objectives related to the ability of understanding reading in Turkish leassons by fifth
grade students]. Unpublished Master Dissertation, Pamukkale Üniversitesi, Denizli.
Akyol, H., Ateş, S., & Yıldırım, K. (2008). Sınıf öğretmenlerinin kullandıkları okuma
stratejileri ve bu stratejileri tercih nedenleri [Reading strategies used by primary school
teachers and the reasons for choosing these strategies]. VII. National Symposium on
Teacher Education (2-4 May 2008). Çanakkale. Çanakkale Onsekiz Mart Üniversitesi.
Ankara: Nobel Yayın Dağıtım, 723-728.
Bölükbaşı, C., & Sarıbaş, M. (2011). İlköğretim Birinci Kademe (1, 2, 3. Sınıf) Türkçe Öğretimi
Sorunları. [Primary Education (1st, 2nd, 3rd Grade) Turkish Teaching
Problems]. Academic student journal of Turkish researches, (1), 20-26.
Breakspear, S. (2012). The policy impact of PISA: An exploration of the normative effects of
international benchmarking in school system performance. OECD Education Working
Papers, (71), 1.
Brozo, W. G., Shiel, G., & Topping, K. (2007). Engagement in reading: Lessons learned from
three PISA countries. Journal of Adolescent & Adult Literacy, 51(4), 304-315.
Cartwright, F., & Allen, M. K. (2002). Understanding the rural-urban reading gap. Human
Resources Development Canada. Service Canada, Ottawa, ON K1A 0J9, Canada.
Christenson, S. L., Rounds, T., & Gorney, D. (1992). Family factors and student achievement:
An avenue to increase students' success. School Psychology Quarterly, 7(3), 178.
Çelenk, S. (2003). Okul başarısının ön koşulu: Okul aile dayanışması [The Prerequisite for
School Success: Home-School Cooperation]. İlköğretim online, 2(2).
Desimone, L. (1999). Linking parent involvement with student achievement: Do race and
income matter? The journal of educational research, 93(1), 11-30.
Erberber, E. (2010). Analyzing Turkey's data from TIMSS 2007 to investigate regional
disparities in eighth grade science achievement. In the Impact of International
Achievement Studies on National Education Policymaking (pp. 119-142). Emerald Group
Publishing Limited.
Int. J. Asst. Tools in Educ., Vol. 7, No. 1, (2020) pp. 30–42
41
Fairclough, N. (2000). New Labour, New Language? (London, Routledge).
Fredriksson, P., Öckert, B., & Oosterbeek, H. (2013). Long-term effects of class size. Quarterly
Journal of Economics, 128(1), 249–285.
Fryer, R. G. (2013). Teacher incentives and student achievement: Evidence from New York
City public schools. Journal of Labor Economics, 31(2), 373-407.
Grek, S. (2009). Governing by numbers: The PISA ‘effect’in Europe. Journal of education
policy, 24(1), 23-37.
Grodner, A., & Rupp, N. G. (2013). The role of homework in student learning outcomes:
Evidence from a field experiment. The Journal of Economic Education, 44(2), 93-109.
Gümüşeli, A. İ. (2004). Ailenin katılım ve desteğinin öğrenci başarısına etkisi. [The Family
Factor on the Student’s Success of School]. Özel okullar birliği bülteni, 2(6), 14-17.
Gür, B. S., Celik, Z., & Özoğlu, M. (2012). Policy options for Turkey: A critique of the
interpretation and utilization of PISA results in Turkey. Journal of Education
Policy, 27(1), 1-21.
Güvendir, M. A. (2014). Öğrenci başarılarının belirlenmesi sınavında öğrenci ve okul
özelliklerinin Türkçe başarısı ile ilişkisi [Student and School Characteristics' Relation to
Turkish Achievement in Student Achievement Determination Exam]. Eğitim ve
Bilim, Education and Science, 39(172), 20-26.
Hofmann, D. A., Griffin, M., A., & Gavin, M. B. (2000). The application of hierarchical linear
modeling to organizational research. In K. J. Klein & S. W. J. Kozlowski (Eds.),
Multilevel theory, research, and methods in organizations (pp. 467-511).
Hox, J. (2002). Quantitative methodology series. Multilevel analysis techniques and
applications. Mahwah, NJ, US: Lawrence Erlbaum Associates Publishers.
Kahraman, Ü., & Çelik, K. (2017). Analysis of PISA 2012 results in terms of some variables.
Journal of Human Sciences, 14(4), 4797-4808.
Kaldan, E. S. (2007). İlköğretim 3. Sınıf Öğrencilerinin Türkçe Dersinde Okuduğunu Anlama
Becerilerini Etkileyen Ekonomik ve Demografik Faktörler [Economic and demografic
factors that affect the 3rd grade primary school students'reading comprehension skill in
Turkish class]. Unpublished Master thesis, Gaziantep Üniversitesi.
Kapıkıran, Ş., & Kıran, H. (1999). Ev ödevinin öğrencinin akademik başarısına etkisi. [The
effect of homework on student's academic achievement]. Pamukkale University Faculty
of Education Journal, 5(5), 54-60.
Kotte, D., Lietz, P., & Lopez, M. M. (2005). Factors Influencing Reading Achievement in
Germany and Spain: Evidence from PISA 2000. International Education Journal, 6(1),
113-124.
Leithwood, K., & Jantzi, D. (2009). A review of empirical evidence about school size effects:
A policy perspective. Review of educational research, 79(1), 464-490.
Lietz, P., & Kotte, D. (2004). Factors influencing reading achievement in Germany and Finland:
Evidence from PISA 2000. The Seeker, 215-228.
Lingard, B. & Rawolle, S. (2004) Mediatizing educational policy: the journalistic field, science
policy, and cross-field effects, Journal of Education Policy, 19(3), 361-380.
Linnakyla, P., Malin, A., & Taube, K. (2004). Factors behind low reading literacy
achievement. Scandinavian Journal of Educational Research, 48(3), 231-249.
Nonoyama, Y. (2006). A cross-national, multi-level study of family background and school
resource effects on student achievement. Unpublished doctoral dissertation. Columbia
University. Retrieved 6 July, 2007 from UMI.
Organization for Economic Cooperation and Development (OECD). (1999). Measuring Student
Knowledge and Skills: A New Framework for Assessment. Paris: Author.
OECD. (2000). Measuring student knowledge and skills: The PISA 2000 assessment of reading,
mathematics and science literacy. Paris: OECD

Çelik & Yurdakul
42
OECD, P. (2014). Results: What Students Know and Can Do Student Performance in
Mathematics, Reading and Science (Volume I, Revised edition, February 2014).
Organization for Economic Cooperation and Development (OECD). (2006). Assessing
Scientific, Reading and Mathematical Literacy: A Framework for PISA 2006. Paris:
Özdemir, C. (2017). OECD PISA Türkiye Verisi Kullanılarak Yapılan Araştırmaların
Metodolojik Taraması. [A Methodological Review of Research Using OECD PISA
Turkey Data] Eğitim Bilim Toplum, 14(56), 10-27.
Öztürk, P. (2010). İlköğretim II. kademe Türkçe dersi performans görevi başarı puanları ile
akademik başarı ve derse yönelik tutum arasındaki ilişkinin değerlendirilmesi [The
evaluation of relation between success grades of Turkish lesson performance task and
academic success and attitude to lesson in primary education school level]. Unpublished
Master thesis, Karadeniz Teknik Üniversitesi, Trabzon.
Raudenbush, S. W., & Bryk, A. S. (2002). Hierarchical linear models: Applications and data
analysis methods (Vol. 1). Sage Publishing.
Reinikainen, P. (2012). Amazing PISA results in Finnish comprehensive schools. In Miracle of
education (pp. 3-18). Sense Publishers.
Rindermann, H. (2007). The g‐factor of international cognitive ability comparisons: The
homogeneity of results in PISA, TIMSS, PIRLS and IQ‐tests across nations. European
Journal of Personality, 21(5), 667-706.
Ringarp, J., & Rothland, M. (2010). Is the grass always greener? The effect of the PISA results
on education debates in Sweden and Germany. European Educational Research
Journal, 9(3), 422-430.
Schleicher, A. (2007). Can competencies assessed by PISA be considered the fundamental
school knowledge 15-year-olds should possess? Journal of Educational Change, 8(4),
349-357.
Swap, S. M. (1993). Developing Home-School Partnerships: From Concepts to Practice.
Teachers' College Press, Columbia University, 1234 Amsterdam Avenue, New York, NY
10027 (cloth--ISBN-0-8077-3231-1).
Taş, U. E., Arıcı, Ö., Ozarkan, H. B., & Özgürlük, B. (2016). PISA 2015 Ulusal Raporu. [PISA
2015 National Report]. Ankara: Milli Eğitim Bakanlığı.
Thomson, S., De Bortoli, L., Nicholas, M., Hillman, K., & Buckley, S. (2010). PISA in brief:
highlights from the full Australian report: challenges for Australian education: results
from PISA 2009: the PISA 2009 assessment of students' reading, mathematical and
scientific literacy.
Wellington, J., & Osborne, J. (2001). Language and literacy in science education. McGraw-
Hill Education (UK).
Yıldırım, K. (2012). The main factors determining the quality of education in Turkey according
to the PISA 2006 data. The Journal of Turkish Educational Sciences, 10(2), 229-255.
Yore, L. D., Anderson, J. O., & Chiu, M. H. (2010). Moving PISA results into the policy arena:
Perspectives on knowledge transfer for future considerations and preparations. Internati
onal Journal of Science and Mathematics Education, 8(3), 593-609.