
INVESTIGATION INTO REHEATER DRYING DURING...
104
INVESTIGATION INTO REHEATER DRYING DURING BOILER SHUT DOWN Mohammed Aboobaker Bhamjee (0400416X) A research report submitted to the Faculty of Engineering and the Built Environment, University of the Witwatersrand, Johannesburg, in partial fulfilment of the requirements for the degree of Master of Science in Engineering Johannesburg, May 2015
-
Upload
trinhtuyen -
Category
Documents
-
view
219 -
download
0
Transcript of INVESTIGATION INTO REHEATER DRYING DURING...
INVESTIGATION INTO REHEATER DRYING
DURING BOILER SHUT DOWN
Mohammed Aboobaker Bhamjee (0400416X)
A research report submitted to the Faculty of Engineering and the Built Environment,
University of the Witwatersrand, Johannesburg, in partial fulfilment of the requirements
for the degree of Master of Science in Engineering
Johannesburg, May 2015

i
DECLARATION
I declare that this research report is my own unaided work. It is being submitted for the
Degree of Master of Science in Engineering to the University of the Witwatersrand,
Johannesburg. It has not been submitted before for any degree or examination to any other
university
_______________________________
Mohammed Aboobaker Bhamjee
12 May 2015
ii
ABSTRACT
Boiler tube failures (BTF) are the leading cause of plant downtime and can cost utilities tens
of millions of dollars. One of the mechanisms of BTF is pitting corrosion in the steam side of
tubes of reheater and superheater tubes. Pitting corrosion in these tubes is a result of poor
shut down and layup practices of the boiler leaving stagnant oxygen rich water in the tubes
during the outage period.
Three methods of drying reheater tubes during the shutdown process exist within the South
African environment. These are forced drying, vacuum drying and boil drying. This research
looked at determining which of the three methods is the most effective, by analysing the
moisture content of the fluid inside the reheater tubes at the end of the drying procedure. This
was achieved by measuring the relative humidity and dew point of the air/water mixture
within the reheater tubes at seven power stations.
It was found that forced drying is the most effective method as it produced a fluid within the
reheaters dryer than ambient air. The fluid remaining in the reheater at Power Station A had a
relative humidity of 13.7% at 31.5°C and a dew point of 0.9°C as compared to the ambient
air of 47% relative humidity at 25.8°C with a dew point of 17.3°C. Forced drying allows a
large volume flow of air through the reheaters effectively replacing the steam with dry air.
Vacuum and boil drying leaves a fluid with 100% humidity within the reheater, which will
cool and condense and will result in pitting corrosion. Vacuum and boil drying do not
effectively replace the steam with dry air. The power stations making use of vacuum as well
as the one making use of boil drying had a fluid in the reheaters with a relative humidity of
100%.
This research has shown that forced drying while the boiler is hot is an effective method of
drying. Further, offline corrosion can be prevented by keeping the boiler in low humidity
conditions. This is achieved by circulating dehumidified air through the boiler tubes.

iii
ACKNOWLEDGEMENTS
I would like to express my gratitude to the following institutions and people who have
supported and made it possible for me to complete this study.
Mr. Mike Lander from Eskom Research, Testing & Development who has helped
develop me as a young engineer, for the interesting conversations that we had, not
only technical but informal as well and has helped increase my understanding in the
field of Power Plant Engineering.
Professor Walter Schmitz from University of the Witwatersrand, Johannesburg, for
his supervision of the project.
Dr. Shehzaad Kauchali from University of the Witwatersrand, Johannesburg, for his
supervision of the project and guidance throughout my studies.
Mr. Bonny Nyangwa from Eskom Research, Testing and Development for his
guidance and support
Mr Pieter Swart for his help with conducting the tests.
Eskom Holdings SOC Ltd for their financial support

iv
LIST OF ABBREVIATIONS
BTF Boiler tube failure
EPRI Electric Power Research Institute
ESV Emergency stop valve
FD Forced draught
GV Governor valve
HP High pressure
ID Induced draught
IP Intermediary pressure
LP Low pressure
PA Primary air
RH Relative humidity
SA Secondary air
SCR Selective catalytic reduction
UCLF Unplanned capability loss factor

v
LIST OF SYMBOLS
aYi Instrument uncertainty with respect to
parameter Yi
Cl- Chloride anion
D Diameter of pipe
Ɛ Relative roughness of pipe
e- Electron
ƒ Fanning friction factor
ƒe Frictional losses for sudden enlargement
Fe3O4 Iron (II,III) oxide
H+ Hydrogen ion
Hvap Enthalpy of vaporisation
K Frictional losses through valve
L Length of pipe
M+ Metal cation
Na+ Sodium cation
Na2SO4 Sodium sulphate
NOx Oxides of Nitrogen
O2 Oxygen gas
OH- Hydroxide ion
ΔP Pressure drop
Re Reynolds number
RH Relative humidity
Rair Gas constant for dry air
Rw Gas constant for water vapour

vi
TABLE OF CONTENTS
DECLARATION..................................................................................................................... i
ABSTRACT ............................................................................................................................ ii
ACKNOWLEDGEMENTS ................................................................................................. iii
LIST OF ABBREVIATIONS .............................................................................................. iv
LIST OF SYMBOLS ............................................................................................................. v
TABLE OF CONTENTS ..................................................................................................... vi
LIST OF FIGURES ............................................................................................................ viii
LIST OF TABLES ................................................................................................................. x
CHAPTER 1: GENERAL INTRODUCTION ................................................................ - 1 -
1.1 Introduction ............................................................................................................ - 1 -
1.2 Research Problem ................................................................................................... - 2 -
1.3 Aims of the Study ................................................................................................... - 4 -
CHAPTER 2: LITERATURE REVIEW ........................................................................ - 6 -
2.1 Operations of a Coal Fired Power Plant ................................................................. - 6 -
2.2 Boiler Tube Failures ............................................................................................. - 11 -
2.3 Pitting Corrosion .................................................................................................. - 14 -
2.4 Boiler Shut Down and Lay-up ............................................................................. - 21 -
2.5 Conclusion to the Literature Review .................................................................... - 27 -
CHAPTER 3: EXPERIMENTAL PROGRAMME ..................................................... - 28 -
3.1 Introduction .......................................................................................................... - 28 -
3.2 Comparison of Power Stations ............................................................................. - 29 -
3.3 Reheater Drying Procedures................................................................................. - 31 -
3.4 Experimental Equipment, Set-up and Procedure ................................................. - 35 -
3.5 Relative Humidity Test Procedure ....................................................................... - 38 -
CHAPTER 4: RESULTS AND DISCUSSION ............................................................. - 41 -
4.1 Results .................................................................................................................. - 41 -
4.2 Uncertainty Analysis ............................................................................................ - 49 -
4.3 Discussion ............................................................................................................ - 50 -
4.3.1 Forced Drying ............................................................................................... - 52 -
4.3.2 Vacuum Drying ............................................................................................. - 54 -
4.3.3 Boil Drying ................................................................................................... - 55 -
4.3.4 Flow Comparison between Vacuum and Forced Drying .............................. - 55 -
4.3.5 Conclusion to Results and Discussion .......................................................... - 57 -
CHAPTER 5: CONCLUSION AND RECOMMENDATIONS .................................. - 58 -
5.1 Conclusion ............................................................................................................ - 58 -

vii
5.2 Recommendations ................................................................................................ - 59 -
REFERENCES ................................................................................................................. - 61 -
APPENDIX A: VACUUM PUMP PERFORMANCE CURVE .................................. - 65 -
APPENDIX B: INSTRUMENT CALIBRATION AND UNCERTAINTY
CALCULATIONS ........................................................................................................... - 66 -
APPENDIX C: TEST RESULTS ................................................................................... - 73 -
APPENDIX D: PSYCHROMETRIC CHART ............................................................. - 84 -
APPENDIX E: FLOW CALCULATIONS ................................................................... - 86 -

viii
LIST OF FIGURES
Figure 1-1: Internal of superheater tube subjected to pitting corrosion [9] .......................... - 2 - Figure 1-2: Drawing of typical boiler [11] ........................................................................... - 3 - Figure 1-3: Drawing of boiler convective pass [12] ............................................................. - 3 - Figure 2-1: Schematic of a typical coal fired power plant [16] ............................................ - 6 -
Figure 2-2: Typical coal fired utility boiler [22] ................................................................... - 8 - Figure 2-3: Steam flow diagram [23] .................................................................................... - 9 - Figure 2-4: Once through 2-pass boiler [16] ....................................................................... - 10 - Figure 2-5: Drum type tower boiler [16] ............................................................................ - 11 - Figure 2-7: Total number of boiler tube failures at Arnot Power Station [28] ................... - 14 -
Figure 2-8 : Pitting corrosion in boiler tube A [32] ............................................................ - 15 - Figure 2-9: Pitting corrosion in boiler tube B [32] ............................................................. - 15 -
Figure 2-10: Pitting corrosion in boiler tube C [32] ........................................................... - 16 - Figure 2-11: Fatigue crack initiated at the bottom of a pit [35] .......................................... - 16 - Figure 2-12: Schematic indicating the initiation phase as per the Point Defect Model [29] - 17
-
Figure 2-13: Autocatalytic processes occurring in corrosion pit [30] ................................ - 19 - Figure 2-14: Drawing of boiler convective pass [12] ......................................................... - 20 -
Figure 2-15: Internals of a superheater tube subjected to pitting corrosion [9] .................. - 21 - Figure 2-16: Primary reheater tube subjected to pitting corrosion [47].............................. - 21 - Figure 2-17: Corrosion rate of steel vs. relative humidity of air [48] ................................. - 25 -
Figure 2-18: Block diagram showing dehumidified air circulation in boiler steam/feed cycle
[48] ...................................................................................................................................... - 26 -
Figure 3-1 : Steam flow diagram ........................................................................................ - 31 - Figure 3-2: Forced drying flow diagram ............................................................................. - 32 - Figure 3-3: Vacuum drying flow diagram .......................................................................... - 34 -
Figure 3-4: Boil drying flow diagram ................................................................................. - 35 -
Figure 3-5: Schematic of equipment set-up ........................................................................ - 37 - Figure 3-6: Picture of equipment set-up ............................................................................. - 38 - Figure 3-7: Test point on cold reheat drain line at forced dried Power Station A .............. - 38 -
Figure 3-8: Pressure transducer test point at vacuum dried Power Station B ..................... - 39 - Figure 4-1: Force drying data from Power Station A ......................................................... - 41 - Figure 4-2: Force drying test results at Power Station A .................................................... - 43 -
Figure 4-3: Vacuum drying plant data at Power Station B ................................................. - 44 - Figure 4-4: Vacuum drying test 1 results at Power Station B............................................. - 45 - Figure 4-5: Plant data for Power Station B vacuum drying test 2 ...................................... - 46 - Figure 4-6 : Vacuum drying test 2 results at Power Station B............................................ - 47 - Figure 4-7: Plant data from boil drying test at Power Station C ......................................... - 48 -
Figure 4-8: Measured data from Power Station C 12 hours after drying............................ - 49 - Figure 4-9: Dew Point Temperature Comparison ............................................................... - 52 -
Figure A-1: Vacuum pump performance curve .................................................................. - 65 - Figure B-1: Temperature Calibration Curve ....................................................................... - 66 -
Figure B-2: Relative Humidity Calibration Curve ............................................................. - 67 - Figure C-1: Plant data for Power Station D forced drying test .......................................... - 75 - Figure C-2: Test data at Power Station D ........................................................................... - 76 - Figure C-3: Plant data for Power Station E forced drying test .......................................... - 78 - Figure C-4: Test Data for Power Station E ......................................................................... - 78 -

ix
Figure C-5: Plant data for Power Station F vacuum drying test ........................................ - 80 -
Figure C-6: Test data for Power Station F .......................................................................... - 80 - Figure C-7: Plant data for Power Station G vacuum drying test ........................................ - 82 - Figure C-8: Test data for Power Station G ......................................................................... - 82 - Figure D-1: Psychrometric chart [57] ................................................................................. - 85 -
Figure E-1: Flow Diagram for Power Stations B and E ..................................................... - 86 -
x
LIST OF TABLES
Table 2-1: Breakdown of corrosion failures [26] ............................................................... - 13 - Table 2-2: Shut down and layup alternatives showing advantages and disadvantages for each
alternative [9,48] ................................................................................................................. - 23 - Table 3-1: Comparison of power stations ........................................................................... - 29 -
Table 3-2: Estimated properties of fluid from test point..................................................... - 36 - Table 4-1: Operator logs for the forced drying test at Power Station A ............................. - 42 - Table 4-2: Operator logs during vacuum drying at Power Station B (test 1) ..................... - 45 - Table 4-3: Operator logs for vacuum drying test 2 at Power Station B .............................. - 47 - Table 4-4: Uncertainty Analysis ......................................................................................... - 50 -
Table 4-5: Comparison of results ........................................................................................ - 51 - Table 4-7: Flow rates calculated at average air density ...................................................... - 56 -
Table C-1: Station A: Forced drying measurements ........................................................... - 73 - Table C-2: Station B: Vacuum drying measurements test 1 ............................................... - 74 - Table C-3: Station B: Vacuum drying measurements test 2 ............................................... - 74 - Table C-4: Station C: Boil drying measurements ............................................................... - 75 -
Table C-5: Station D – Forced Drying Measurements ....................................................... - 77 - Table C-6: Station E – Forced Drying Measurements ........................................................ - 79 -
Table C-7: Station F – Vacuum Drying Measurements...................................................... - 81 - Table C-8: Station G – Vacuum Drying Measurements ..................................................... - 83 -

- 1 -
CHAPTER 1: GENERAL INTRODUCTION
1.1 Introduction
South Africa’s demand for electricity has increased in recent years, putting a strain on the
electricity supply system [1]. Any unplanned outages on the electricity generation side can
lead to load shedding, as the demand is greater than the supply. It is of utmost importance to
reduce the amount of any unplanned outages.
Africa’s major power producer, Eskom, reported that the Unplanned Capability Loss Factor
(UCLF) was 12.12% for the period ending 2013 [2,3]. According to Eskom’s financial report
[2], “UCLF is a measure of the lost energy due to unplanned production interruptions
resulting from equipment failures and other plant conditions”. The turbine failure at Duvha
Power Station contributed to 1.17% of the UCLF. However, 3.4% of the total UCLF was due
to emission control and short term outages amongst other boiler tube failures (BTF) [3],
leaving 7.55% due to energy losses from operations [2,3]. The total UCLF during 2013 is
greater than 7.97% and 6.14% for the periods ending March 2012 and March 2011,
respectively [2,3]. The North American annual average UCLF for fossil-fuelled power plants
between 2005 and 2009 was 7.93% [4]. BTF’s are the most significant contributors to UCLF
in Eskom power stations [5].
In the USA, more than 50% of forced outages in the power generation industry are related to
corrosion problems [6,7]. Financially this accounted for over $3 billion in additional
operating and maintenance costs [6] with $669.14 million in coal-fired power plants in the
USA [7] and can add up to almost 10% of the cost of electricity [6]. Reducing the amount of
forced outages and prevention of corrosion related problems in the power generation industry
can reduce the cost of electricity as well as, enable plant availability for longer periods.
One of the causes of unplanned outages at the power stations is boiler tube failures, whereby
the steam tubes rupture forcing the unit to shut down. Tubes can fail due to conditions on the
outside of the tube such as fly ash erosion or fireside corrosion [8]. Other failures include
those on the inside of the tube. One of the mechanisms by which tubes fail is due to ‘steam
side pitting corrosion’ within the reheater tubes especially during offline conditions. Pitting

- 2 -
corrosion is the result of insufficient drying during the shutdown of the boiler. Figure 1-1
depicts the internal of a steam side of a tube (steam-touched) subjected to pitting corrosion.
Figure 1-1: Internal of superheater tube subjected to pitting corrosion [9]
Pitting corrosion related problems in reheater tubes are the basis of this research project.
1.2 Research Problem
One of the mechanisms, which cause boiler tube failure in conventional boilers, is pitting
corrosion [9,10].
There are three main causes of pitting in steam-touched tubes [9]:
1. Oxygen-saturated stagnant water formed as a result of poor shut down practices;
2. Mechanical carryover of Na2SO4 in steam during operation which then combines with
condensate formed during shut down; and
3. Chemical cleaning damage.
The first cause of corrosion mentioned above is due to poor shut down practices causing
stagnant water to form in the low-lying areas of the steam tubes. These can be either
- 3 -
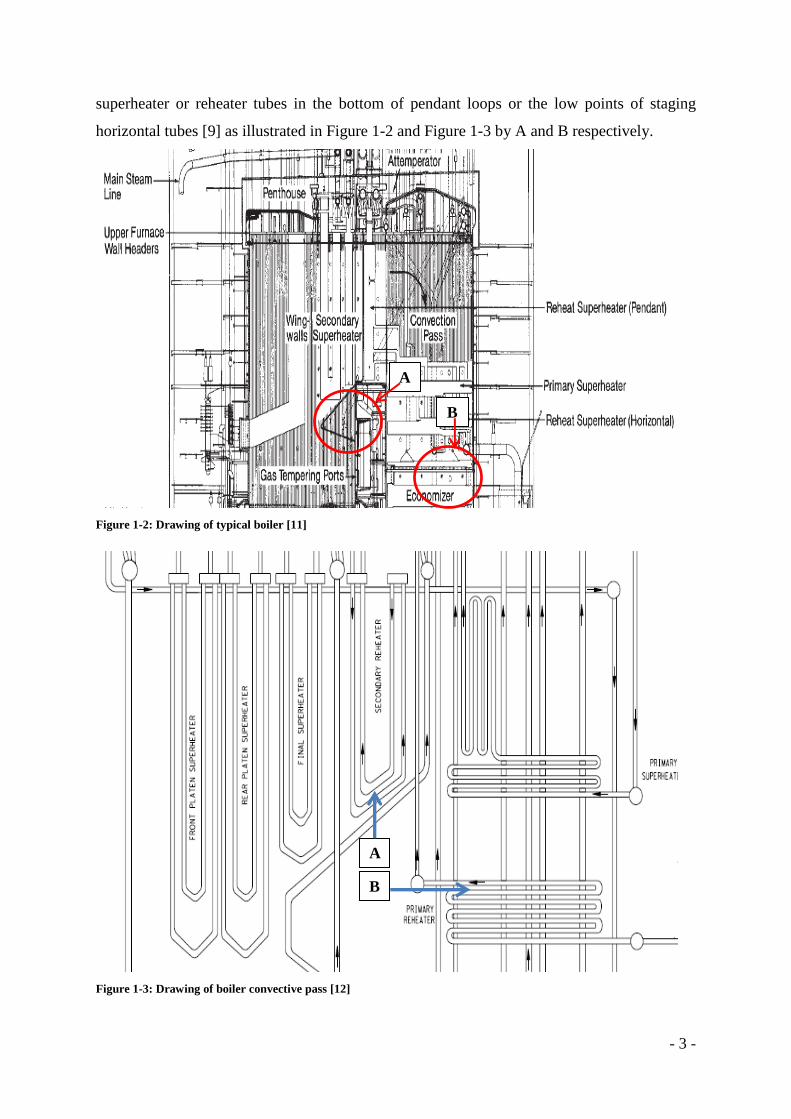
superheater or reheater tubes in the bottom of pendant loops or the low points of staging
horizontal tubes [9] as illustrated in Figure 1-2 and Figure 1-3 by A and B respectively.
Figure 1-2: Drawing of typical boiler [11]
Figure 1-3: Drawing of boiler convective pass [12]
A
B
A
B

- 4 -
During boiler shut down, there are procedures that are put in place for drying of the reheaters
to avoid pitting corrosion, however, pitting is still a problem.
1.3 Aims of the Study
This research aims to investigate which of the three reheater drying procedures used in the
South African environment is the most effective. Three methods of drying currently used for
reheater drying, these are forced, vacuum and boil drying. Other preventative methods
include procedures to store (lay-up) the boiler after drying which include wet and dry storage
of the boiler to prevent pitting corrosion during the non-operating period. The three methods
of drying are:
Forced drying which makes use of a fan/compressor to force air into the reheater
circuit and evacuate steam out the blow down vessel or steam vents [13].
Vacuum drying, which uses the condenser vacuum to draw air from the air inlet valve
through the reheaters and evacuate steam out of the condenser [14].
The boil method, which opens the reheater, vents and drains, while burning fuel oil in
the furnace attempting to boil out any moisture inside the reheaters [15].
This study thus determines which of the three methods is the most effective.
The structure of this research report is as follows:
Chapter 2 provides a literature review beginning with the basic principles, operations and
equipment used in a fossil-fuelled electricity generating plant. BTF’s are discussed with a
focus on tube failures associated with pitting corrosion. Guidelines for shut down and layup
of the plant with the aim of minimising off-line corrosion presented.
Chapter 3 describes the methodology used during the experimental testing of the
effectiveness of three shut down procedures used to dry boiler reheater tubes to prevent
pitting corrosion. The three shut down procedures and equipment set-up are also described.
Chapter 4 discusses the results obtained from the tests conducted at the three power stations.
The results, plus those from another four power station, are analysed to determine which of

- 5 -
the three shut down procedures are the most effective in preventing pitting corrosion of the
reheater tubes.
Chapter 5 concludes the research report based on the findings in the experimental testing and
corroborates the findings with the relevant literature.

- 6 -
CHAPTER 2: LITERATURE REVIEW
2.1 Operations of a Coal Fired Power Plant
Modern power stations make use of steam generators or boilers where a fuel is burnt and the
energy transferred as heat to water to produce steam [16-19]. The steam is used to drive a
turbo-generator to generate electricity. Figure 2-1 [16] depicts the schematic of a modern coal
fired power station.
Figure 2-1: Schematic of a typical coal fired power plant [16]
There are three main flows within a power station, these are coal/ash flow, water/steam flow
and air/gas flow. Coal from the stockpiles is conveyed to the boiler house where, via a mill
feeder, it is fed to the mills for grinding. Secondary air (SA) also known as combustion air is
supplied to the boiler with a forced draught (FD) fan. Primary air (PA) which is used to dry
the coal as well as transport the coal to the boiler is supplied by a primary air fan. Both the
SA and PA are heated in a regenerative air heater using flue gas as the heat source[16-20].
The pulverised coal is pneumatically transported using primary air into the boiler through the
burner. Secondary air enters the burner and provides the oxygen required for combustion.
Coarse ash falls to the ash hopper at the bottom of the boiler where it is disposed of in the ash

- 7 -
dams. The remaining products of combustion together with fly ash pass through the boiler
where heat energy in the hot flue gas is transferred to the water/steam via a network of heat
exchange tubes within the boiler. The remaining heat energy in the flue gas is used to heat up
the primary and secondary air in the air heater needed for conveying the pulverised coal to
the boiler (primary air) and air required for combustion (secondary air). The flue gas is then
cleaned using the SCR (selective catalytic reduction) for NOx reduction, the particulate
collector for fly ash and the SO2 scrubber before being discharged into the atmosphere
through the stack (chimney) by the induced draught (ID) fan [16-20]. South Africa’s power
utility Eskom currently does not make use of the SCR or the SO2 scrubber, however, there are
plans to include the SO2 scrubber in their new station currently under construction [21].
Demineralised water from the water treatment plant enters the boiler after a series of
preheating steps. The water is pumped into the boiler network of heat exchangers where it
evaporates and it ultimately forms superheated steam. The steam leaves the boiler and enters
the turbo-generator sets, which generate electricity. The steam leaves the turbines and is
condensed in the condenser where it is then recycled to the boiler [16,17,20].
Figure 2-2 depicts a typical utility boiler (drum type) identifying the major components and
heat exchangers in the boiler. Water from the feed heaters enters the economiser via the
feedwater pump at the back end of the boiler. Here heat energy in the cooler flue gas is
transferred to the water, which in a typical sub-critical utility boiler can be at pressures of
approximately 18MPa [16]. In a drum boiler as depicted in Figure 2-2, the water from the
economiser goes to the drum. From the drum, the water goes via the downcomers to the
bottom headers of the boiler.
- 8 -
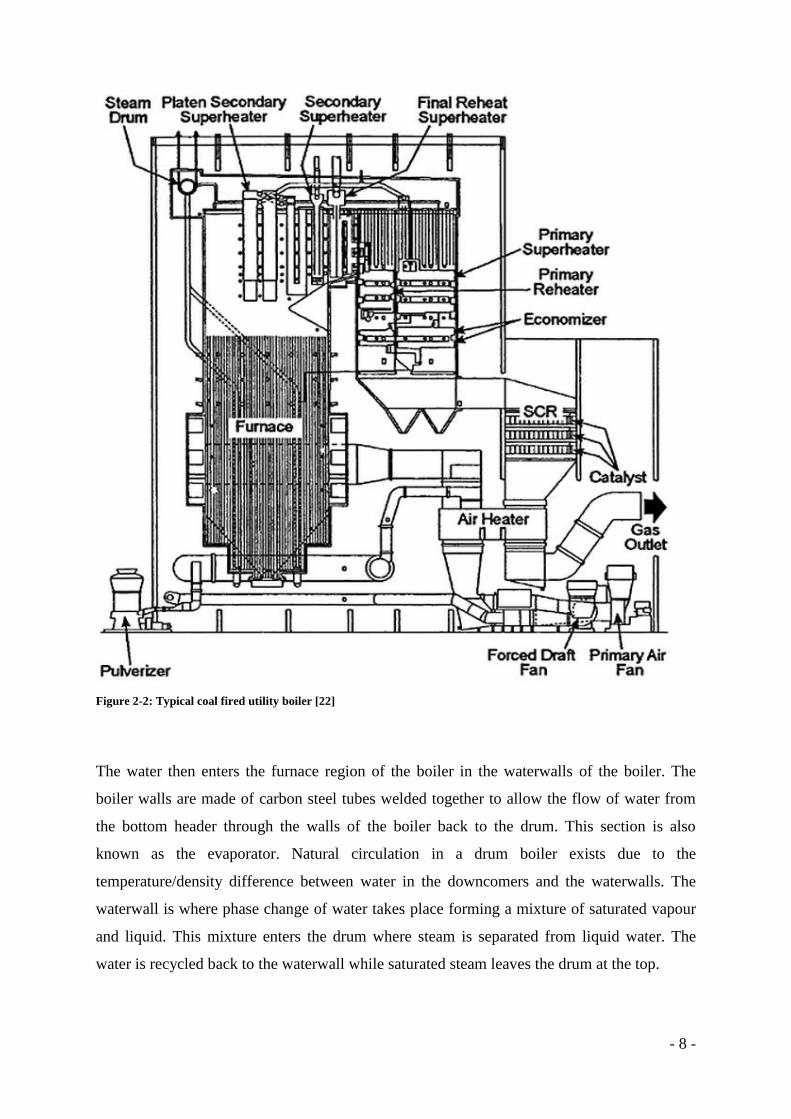
Figure 2-2: Typical coal fired utility boiler [22]
The water then enters the furnace region of the boiler in the waterwalls of the boiler. The
boiler walls are made of carbon steel tubes welded together to allow the flow of water from
the bottom header through the walls of the boiler back to the drum. This section is also
known as the evaporator. Natural circulation in a drum boiler exists due to the
temperature/density difference between water in the downcomers and the waterwalls. The
waterwall is where phase change of water takes place forming a mixture of saturated vapour
and liquid. This mixture enters the drum where steam is separated from liquid water. The
water is recycled back to the waterwall while saturated steam leaves the drum at the top.

- 9 -
The saturated steam then goes into the convective section of the boiler entering the primary
superheater where it gains additional heat energy to become superheated steam. The steam
then enters the secondary superheater section where the design temperature is attained. This
superheated steam (known as main steam) then leaves the boiler and goes to the high-
pressure (HP) turbine via the emergency stop valve (ESV) and governor valve (GV). The GV
is used to control the steam flow. The steam leaves the HP turbine at a lower temperature and
pressure (approximately 4MPa [16]) and is known as cold reheat. The cold reheat steam is
still superheated steam but at lower pressure and temperature. The cold reheat enters the
primary and secondary reheaters within the boiler gaining additional heat energy from the
flue gas to increase the temperature. The steam then leaves the reheaters as hot reheat and
passes through the intermediate pressure (IP) turbine. Losing additional pressure and
temperature, the steam leaves the IP turbine and enters two low-pressure (LP) turbines. The
steam is then condensed in the condenser and is recycled to the boiler via the feedwater
heaters. Figure 2-3 below depicts the entire steam/water circuit with typical mass and energy
values for a 360MW boiler [23]. Vessels 1 and 2 are the high-pressure (HP) heaters while 3-6
are the low-pressure (LP) heaters. Steam is tapped off from the turbines as indicated by A-G
as the heating medium in the HP and LP heaters.
Figure 2-3: Steam flow diagram [23]
- 10 -
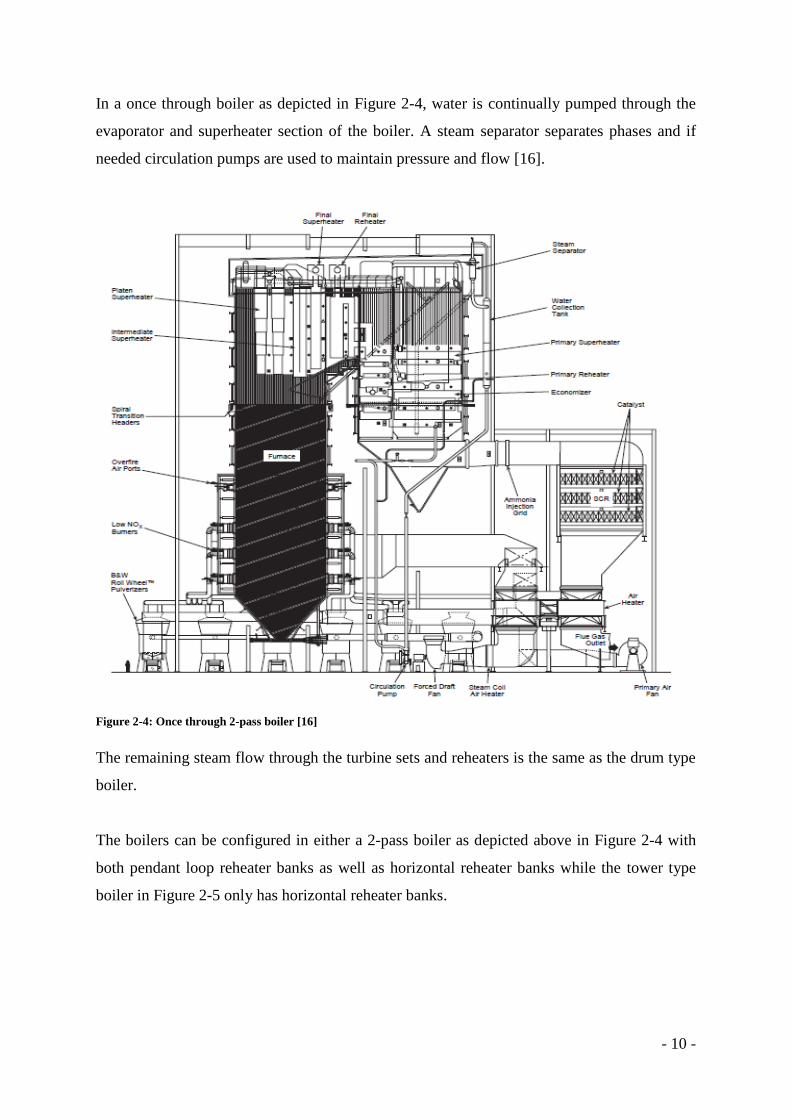
In a once through boiler as depicted in Figure 2-4, water is continually pumped through the
evaporator and superheater section of the boiler. A steam separator separates phases and if
needed circulation pumps are used to maintain pressure and flow [16].
Figure 2-4: Once through 2-pass boiler [16]
The remaining steam flow through the turbine sets and reheaters is the same as the drum type
boiler.
The boilers can be configured in either a 2-pass boiler as depicted above in Figure 2-4 with
both pendant loop reheater banks as well as horizontal reheater banks while the tower type
boiler in Figure 2-5 only has horizontal reheater banks.

- 11 -
Figure 2-5: Drum type tower boiler [16]
2.2 Boiler Tube Failures
In the power industry, boiler tube failures (BTF) account for 2-3% of the total lost availability
in the US [9]. Financially, these plant-generating outages account for in excess of $1 billion
as reported by EPRI [9]. From 88 utilities, 43% reported the BTF-related outages to be in
excess of $5 million/year while 17% reported the BTF caused outages to be in excess of $20
million/year [24]. All areas in the boiler have BTF with more than 80% of failures leading to
plant shut down [9,25]. Eskom reported that boiler tube failures are the leading contributor to
its UCLF (Unplanned Capability Loss Factor) [2,3,5].

- 12 -
The following are some of the mechanisms, which cause BTF [8-10,24,25]:
Corrosion fatigue in conventional boilers
Fly ash erosion
Acid phosphate corrosion
Caustic gouging
Waterwall fireside corrosion
Thermal fatigue in waterwalls
Thermal fatigue in economizer inlet headers
Thermal-mechanical fatigue and vibration-induced fatigue in water touched tubes
Water blower thermal fatigue
Flow-accelerated corrosion in economizer inlet headers of conventional boilers
Sootblower erosion (water-touched tubes)
Short-term overheating in waterwall tubing
Low temperature creep cracking
Chemical cleaning damage
Hydrogen damage
Weld failures
Pitting
Falling slag damage
Acid dew point corrosion
Mechanical failures account for 81% of failures whereas corrosion related incidents account
for the remaining 19% [26].
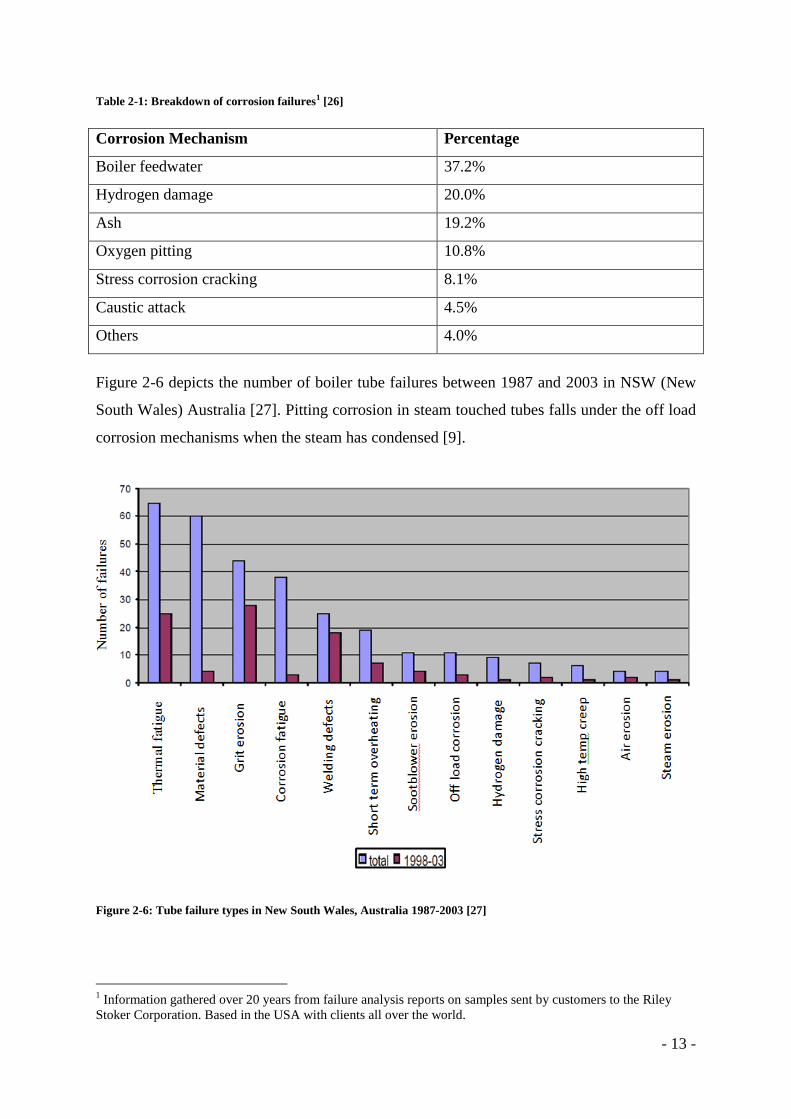
Table 2-1 provides a breakdown of the corrosion related failures and shows that oxygen
pitting accounts for 10.8% of the total corrosion related problems [26].
- 13 -
Table 2-1: Breakdown of corrosion failures1 [26]
Corrosion Mechanism Percentage
Boiler feedwater 37.2%
Hydrogen damage 20.0%
Ash 19.2%
Oxygen pitting 10.8%
Stress corrosion cracking 8.1%
Caustic attack 4.5%
Others 4.0%
Figure 2-6 depicts the number of boiler tube failures between 1987 and 2003 in NSW (New
South Wales) Australia [27]. Pitting corrosion in steam touched tubes falls under the off load
corrosion mechanisms when the steam has condensed [9].
Figure 2-6: Tube failure types in New South Wales, Australia 1987-2003 [27]
1 Information gathered over 20 years from failure analysis reports on samples sent by customers to the Riley
Stoker Corporation. Based in the USA with clients all over the world.

- 14 -
Figure 2-7 depicts the number of failures, which occurred at one power station at Eskom over
a 35-year period. The reduction in the tube leaks is due to the implementation of a tube
failure reduction programme. The increase in tube failures towards the end of the 35 years is
due to tubes coming to the end of their design life and failing [28].
Figure 2-7: Total number of boiler tube failures at Arnot Power Station [28]
As reported by Tarr [28] in the years 2007 - 2011 one of the emerging mechanisms of failures
is reheater pitting. The emergence of pitting in the latter stages of the plant life could be
because of the pit formation during the many outages, which is now leading to failures. The
time in which pits can initiate may be in order of days or years depending on the metal and
aggressiveness of the environment [22].
2.3 Pitting Corrosion
In the USA, more than 50% of forced outages in the power generation industry are related to
corrosion problems [6]. Corrosion related issues accounted for over $3 billion in additional
operating and maintenance costs [6].
Pitting corrosion is a localised corrosion mechanism forming pits or holes in the metal. The
damage is usually deep with the small area of the pit [9,29-31]. This is depicted in Figure 2-8
Num
ber
of
Fai
lure
s

- 15 -
to Figure 2-10 [32]. The pit sites can be filled with corrosion product or may be open
depending on the conditions when the pit was formed [29]. With just a small weight loss in
metal structure pitting can cause failure as the wall become thin and can also lead to through-
wall holes [29,30]. Detection of pits can be difficult as pits are generally small and can be
covered by a cap of the corrosion product [30].
Figure 2-8 : Pitting corrosion in boiler tube A [32]
Figure 2-9: Pitting corrosion in boiler tube B [32]

- 16 -
Figure 2-10: Pitting corrosion in boiler tube C [32]
Pitting corrosion can lead to more severe corrosion mechanisms such as intergranular
corrosion, stress corrosion cracking and fatigue corrosion [33,34]. Figure 2-11 depicts a
fatigue crack, which initiated at the bottom of a pit [35].
Figure 2-11: Fatigue crack initiated at the bottom of a pit [35]
- 17 -
Pitting corrosion comprises the initiation phase and the growth phase [9,36]. A surface
scratch or a defect in the metal can cause the initiation phase of the pit [30]. With pitting and
similar crevice corrosion the initiation phase involves the breakdown of the normal passive
film (Fe3O4) formed under normal operation on the metal surface [37]. The chloride ions
present (even in trace amounts) in the water causes the breakdown of the passive layer [38].
Dilute sulphate solution can also attack the passive layer to initiate the pit growth. During
normal operation of the boiler, steam flows through the tubes and pitting will not form under
normal operation. However, if the steam is not evacuated from the tubes and the tubes dried,
condensation will occur and the tubes will be wet. This provides the environment in which
pitting can be initiated. Other forms of passive film breakdown can be [29]:
Straining of the substrate metal
Differences in thermal expansion that cause thermal stresses
Fluid flow and cavitation
Transpassivity polarization
Chemically induced phenomena
Under passive conditions oxide layers form naturally on the surface of metals which reduce
the rate of corrosion of the metal [30,39]. The passive layer forms on the surface of the metal
and degrades into the environment. At steady state, the passive layer formation equals that of
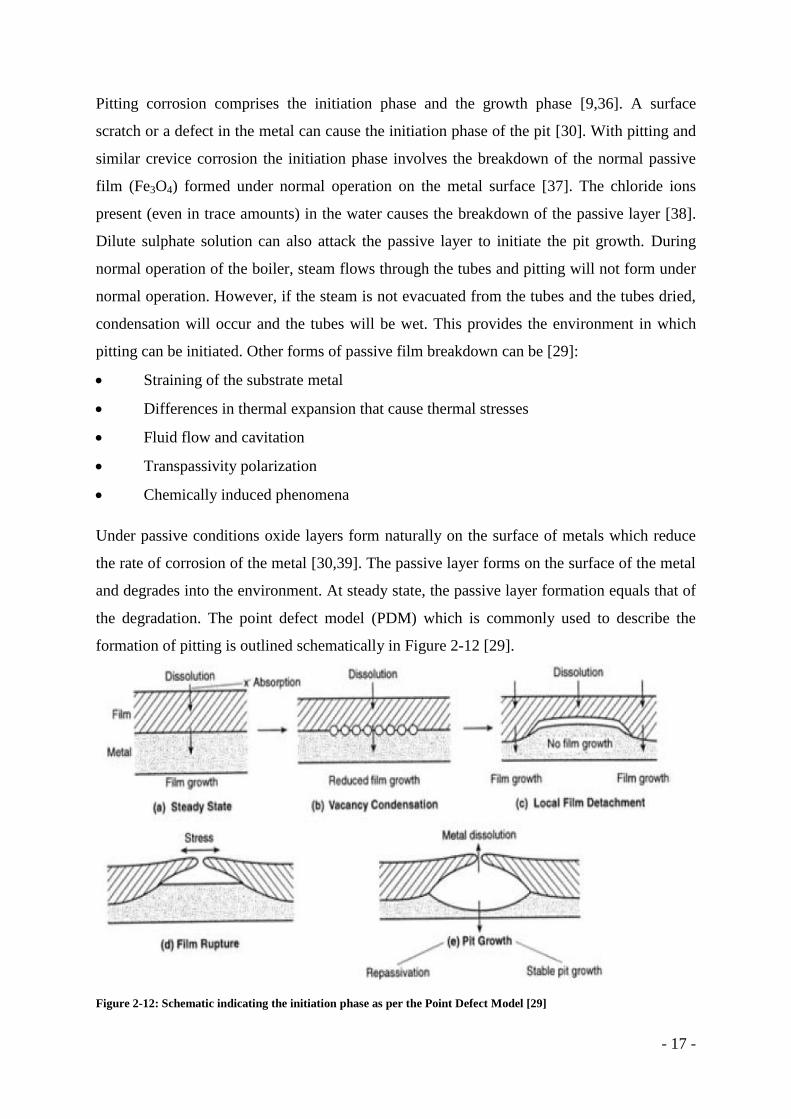
the degradation. The point defect model (PDM) which is commonly used to describe the
formation of pitting is outlined schematically in Figure 2-12 [29].
Figure 2-12: Schematic indicating the initiation phase as per the Point Defect Model [29]

- 18 -
The equilibrium of the metal and passive oxide layer is shown in Figure 2-12a. When one of
the mechanisms mentioned above disrupts the equilibrium, the rate of dissolution is higher
than the rate of formation resulting in a void forming between the metal and the passive oxide
layer (Figure 2-12b and Figure 2-12c). Once this void exists between the metal and the
passive layer, a further strain will lead to a rupture in this protective layer exposing the metal
surface (Figure 2-12d). The metal is now exposed to the aggressive environment for direct
corrosion and the growth of a pit. Metal dissolution will take place as the oxidation reaction,
while the reduction of oxygen to form OH- as the reducing reaction. These reactions are
shown below in Equation 1and Equation 2 [30,31].
Equation 1: Oxidation reaction of metal
eMM 1 ………………………………………………………………….[1]
Equation 2: Reduction reaction of oxygen
OHeHO 22 222
1 ……………………………………………………[2]
If the environment becomes less aggressive, the re-passivation of the metal surface can occur
(Figure 2-12e) [29,30]. Aerated moisture is a key to pit formation and the addition of salts
accelerates the corrosion [34]. Other models used to describe the pit initiation phase are the
Penetration Mechanism, Adsorption Mechanism and the Film Breakdown Mechanism [29]
and are discussed by Nuñez [40] and Frankel [39].
Those surfaces, which do not re-passivate will corrode and can be independent of the external
environment. The environment within the pit supports itself and corrosion becomes
autocatalytic [29]. Figure 2-13 depicts the autocatalytic process occurring in a corrosion pit
[30].

- 19 -
Figure 2-13: Autocatalytic processes occurring in corrosion pit [30]
It can be seen from Figure 2-13 that dissolution of metal M takes place within the pit while
oxygen reduction takes place at the adjacent surface. With the dissolution of the metal a high
concentration of positive ions exist, thus to maintain electro neutrality the chloride ions move
into the pit. The H+ ions from the hydrolysis and the Cl
- stimulate more metal dissolution thus
increasing the depth of the pit [30].
Pitting is a form of corrosion that can occur throughout the boiler because of stagnant oxygen
rich water within the tubes [41]. Pitting can occur on the outside of the tube when ash
particles fuse to the metal creating an environment for pits to form [42,43]. In steam touched
(Superheater and Reheater) tubes three causes of pitting can exist on the steam side of the
tube. The first is because of poor shut down practices. The steam from operation is not
evacuated sufficiently, resulting in the condensation of this steam, which forms pools of
oxygen rich water in the low-lying areas or pendant loops/U-bends of the tubes. The second
cause is from the mechanical carryover of Ca/Na2SO4 in the steam during operation, which
deposits onto reheater tubes and then combines with condensate from shut downs thus
leading to pitting. The third cause is from chemical cleaning damage in the superheater and
reheaters which can also lead to pitting [9,10,37, 44-46].
Key:
Cl- : Chloride anion
OH- : Hydroxide ion
M+ : Metal cation
Na+ : Sodium cation
H+ : Hydrogen ion
O2 : Dissolved oxygen
gas
e- : Electron

- 20 -
Figure 2-14 [12] depicts a typical fossil-fired boiler convective pass. The hanging pendant
tubes of the secondary reheater can be seen as well as the horizontal tubes of the primary
reheater. These are indicated by A and B respectively.
Figure 2-14: Drawing of boiler convective pass [12]
If during shut down the steam is not evacuated completely, it will condense and collect in the
loops of the pendant tubes and any low-lying areas of the horizontal tubes. As discussed,
above this oxygen rich stagnant water will cause pitting in these areas. Effective shut down
procedures are required to ensure the drying of the tubes, to avoid any condensation during
the outage [9]. Figure 2-15 and Figure 2-16 show boiler tubes subjected to pitting corrosion.
Figure 2-16 is by courtesy of Eskom Holdings SOC Ltd and shows through wall pitting
corrosion.
A
B

- 21 -
Figure 2-15: Internals of a superheater tube subjected to pitting corrosion [9]
Figure 2-16: Primary reheater tube subjected to pitting corrosion [47]
2.4 Boiler Shut Down and Lay-up
In order to protect the equipment, effective procedures are required for the shutdown of the
plant and for the lay-up or storage of the plant during the outage times. The aim of these
procedures is to protect the equipment from off-line corrosion thus reducing the number of
BTF’s [48]. If ineffective procedures are followed for the shut down and lay-up of the plant,
water can pool within the tubes, which will result in, pitted tubes. These pitted tubes can
become through wall corroded, resulting in leaks or can initiate more serious mechanisms of
tube failures as discussed earlier [34,48].

- 22 -
According to EPRI [34,48], shut downs can be classified into the following:
Short-term Shut down (Wet)
This is an overnight or weekend shut down where the boiler is kept within normal operating
temperature range.
Intermediate Shut down (Wet or Dry)
This shut down is for periods longer then a weekend and up to a week. This could be for
some equipment repair. In wet conditions, the boiler water chemistry is maintained as per
normal operating conditions. In dry conditions, the boiler is drained and tubes are purged.
Nitrogen can be used to blanket the tubes, however if work is to be done on the tubes the
nitrogen must be removed for safety reasons.
Long-term Shut down (Wet and Dry)
This is when the unit is out of service for more than a week and can be due to major
equipment repair and maintenance during a general overhaul (GO) or for mothballing of a
unit. In wet conditions, hydrazine concentrations are elevated and the pH is maintained above
9. Nitrogen is filled and pressurised to avoid air in leakage. In dry conditions, the boiler is
drained while still hot and pressurised nitrogen blanketing can be used, alternatively
dehumidified air can be circulated through the system.
Forced Shut down
A forced shut down can be due to a system failure or major equipment failure. System
failures generally result in short-term shut downs however, equipment failure results in a
rapid shutdown of the plant and the lay-up would generally be classified as long-term.
The dry layup of the plant requires the drainage of the boiler, during the shutdown process,
while the boiler is in a hot condition [9,34,48-50], i.e. to prevent the steam from condensing
inside the tubes. Thereafter, layup of the boiler with either an inert gas or the circulation of
dehumidified air is done to protect the surfaces from corrosion. EPRI [48] provides
guidelines for the shut down and layup of the boilers in long and short-term periods. Boilers
should be blanketed with steam or nitrogen during short-term layups. Table 2-2 extracted
from EPRI [9,48] shows the advantages and disadvantages of the alternate methods of
storing/preserving the boiler during layup conditions.

- 23 -
Table 2-2: Shut down and layup alternatives showing advantages and disadvantages for each alternative [9,48]
Layup Type Advantages Disadvantages
Wet Storage with
ammonia/hydrazine
solution*
1. No concern about
relative humidity
2. Easily maintained
3. Easily tested
4. With proper insulation,
leaks can be easily
detected
5. Superheaters and
reheaters can be
stored/preserved safely
6. If facilities are
installed, solution may be
reused
1. Possible pollution when
draining
2. Need to recirculate regularly
3. Hydrazine possible carcinogen
4. High water consumption prior
to start up: solution must be
drained and possibly rinsed
5. Regular monitoring
6. Excessive ammonia must not
be added if copper alloys are
present in the system
7. Tight isolations are prerequisite
8. Not recommended if freezing
may occur
9. Draining if work is to be
carried out
10. Pure water (demin) must
be used
Nitrogen
1. System need not be
completely dry
2. Completely
independent of climatic
conditions
3. May be used as a
capping of normal
operating fluid during
outages
1. Very dangerous asphyxiation of
workers if not properly vented
before access
2. Preferably to be carried out
while system is being drained
Dry air
1. Readily available basic
constituent
2. Maintenance on plant
1. Drying equipment and blowers
required
2. Climatic conditions may cause

- 24 -
* Requires nitrogen
performed without
problems
3. Easy monitoring
4. No risk to personnel
5. Whole plant may be
stored/preserved dry if
drainable or dryable
6. Independent of ambient
temperature if air dry
enough
7. Residual heat in boiler
steelwork utilised for
drying
rapid deterioration in storage
conditions
3. Hermetical sealing may be
required to prevent 2, above
4. System must be completely dry
5. Sediment may cause corrosion
if hygroscopic
6. SO2 and dust must be excluded
from the air
7. If work to be carried out on part
of dried system, that part of
system must be isolated and
redried afterwards
8. Even draining while hot and
under pressure does not ensure
complete water removal
(Table extracted from EPRI guidelines [9,48])
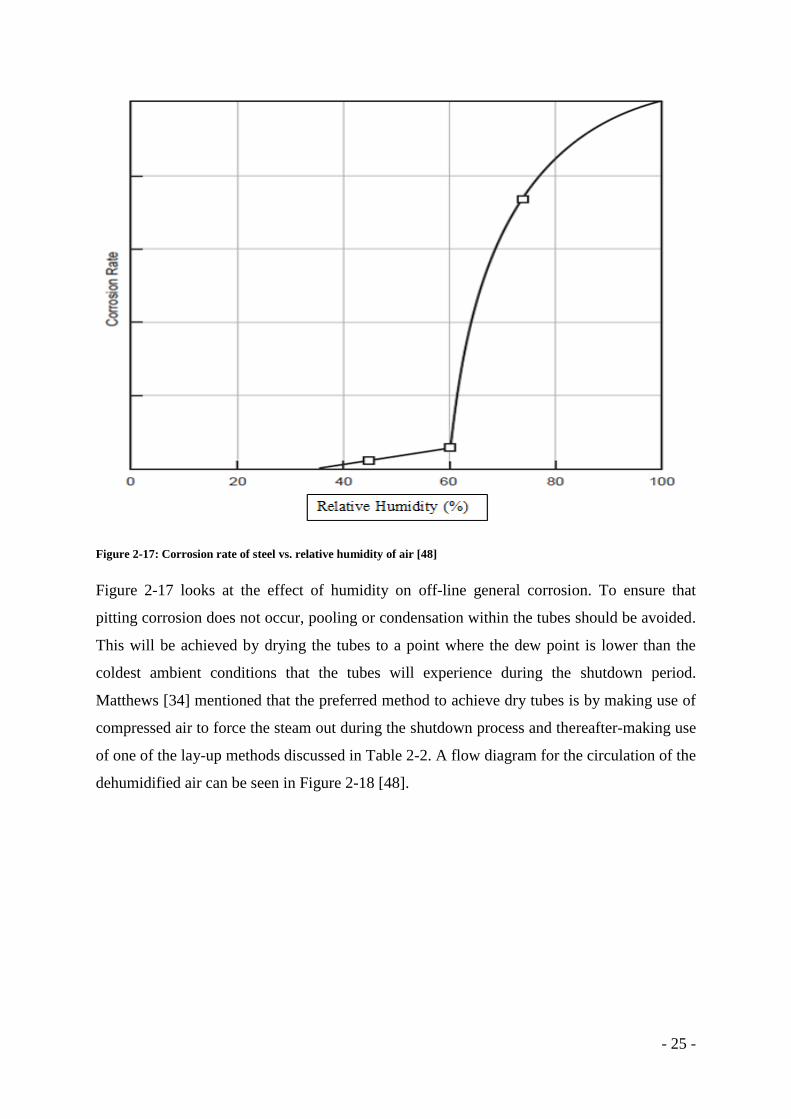
Dry storage using dehumidified air is growing in popularity in the USA for long- and short-
term layup periods [44,48]. Figure 2-17 is the justification behind storing the boiler in low
humidity conditions. The figure shows the corrosion rate of steel relative to the humidity of
the air. It is clear that if the humidity of the air is kept below 60% the corrosion rate is low
thus protecting the tubes from significant off-line corrosion. The units of corrosion rate were
not reported by the source, however emphasis is placed on the change in corrosion rate above
60% relative humidity.
- 25 -
Figure 2-17: Corrosion rate of steel vs. relative humidity of air [48]
Figure 2-17 looks at the effect of humidity on off-line general corrosion. To ensure that
pitting corrosion does not occur, pooling or condensation within the tubes should be avoided.
This will be achieved by drying the tubes to a point where the dew point is lower than the
coldest ambient conditions that the tubes will experience during the shutdown period.
Matthews [34] mentioned that the preferred method to achieve dry tubes is by making use of
compressed air to force the steam out during the shutdown process and thereafter-making use
of one of the lay-up methods discussed in Table 2-2. A flow diagram for the circulation of the
dehumidified air can be seen in Figure 2-18 [48].

- 26 -
Figure 2-18: Block diagram showing dehumidified air circulation in boiler steam/feed cycle [48]
Where:
LP: Low pressure
HP: High Pressure
As mentioned, the use of dehumidified air during the layup period requires the draining off
and drying of the system. This can be a difficult task especially for the hanging pendant loops
of superheaters and reheaters [48]. Drying is accomplished by either forcing the steam out
using pressurised air or sucking the steam out by making use of the condenser vacuum [11].
Vacuum drying takes 10 – 36 hours to reach completion [48]. The boiler needs to be flash
drained at 1.7MPa (corresponding to 204.31°C saturation temperature) drum pressure to
prevent condensation in the superheater and reheater U-bends and hanging pendant sections
[48].
Cargocaire [51] describes how one power plant effectively used dehumidified air from the
layup of the boiler. Best results are attained by effectively removing all liquid water from the
system. This was achieved by draining the boiler at 20.7MPa and then at 4.1MPa applying
nitrogen to prevent any oxygen ingress. After the water was drained, the oil burners were
fired to maintain the temperature at 232.2°C. The fire remained until there was no perceptible
- 27 -
vapour emerging. Each of the low points were vacuumed and mopped and in some cases,
pipe sections were removed to allow water to flow out. Thereafter, dryers were placed in
service, and dehumidified air circulated through the system maintaining low relative
humidity.
2.5 Conclusion to the Literature Review
The operations of a coal-fired power station were discussed with the major equipment being
shown and described. Boiler tube failures are the highest cause of plant UCLF. Pitting
corrosion is one of the mechanisms which lead to boiler tube failures. Pitting corrosion
occurs because of oxygen-saturated water laying in the pendant loops and low-lying areas of
superheaters and reheaters. Pitting corrosion can only occur when there is water present.
There are guidelines for the storage of the boiler and the literature has shown that the boiler
needs to be drained while still hot in order for the layup methods to be effective. The
literature surveyed from the EPRI reports has not given a guide on which method of draining
the boiler is most effective during the shutdown. This research will show from the three
methods of reheater drying which is the most effective. Chapter 3 describes at the
experimental set-up used for determining the effectiveness of the reheater drying during shut
down.

- 28 -
CHAPTER 3: EXPERIMENTAL PROGRAMME
3.1 Introduction
Chapter 2 discussed the operations of a fossil-fuelled power station and failures concerning
boiler tube leaks. The aspects of pitting corrosion were covered and guidelines for preventing
off line corrosion through effective shut down and layup procedures were discussed. This
chapter deals with testing the effectiveness of three reheater drying procedures.
The method of testing the effectiveness of the drying procedure is to determine the moisture
content at the end of the drying. Relative humidity and dry bulb temperature measurements
will be taken at the outlet flow of the drying process at seven different power stations using
one of the different methods. Dew point temperature is calculated using Equation 3 [52].
Equation 3: Dew point Temperature
⌈ (
)
⌉
Where:
Rw is the gas constant for water vapour (461.5JK-1kg-1)
Hvap is the enthalpy of vaporization
(Hvap = 2501 KJ.kg-1at T = 273.15 K and Hvap = 2257 KJ.kg-1 at T = 373.15 K)
Three methods of drying used at seven different power stations will be tested for its
effectiveness.
- 29 -
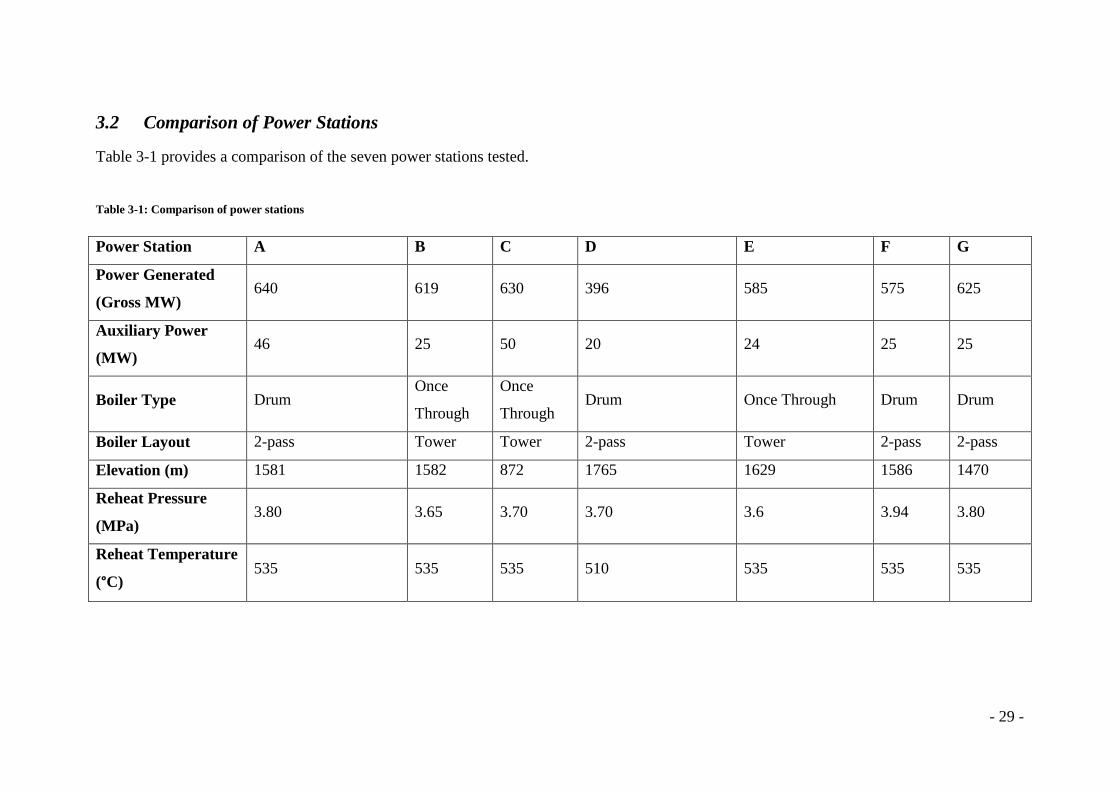
3.2 Comparison of Power Stations
Table 3-1 provides a comparison of the seven power stations tested.
Table 3-1: Comparison of power stations
Power Station A B C D E F G
Power Generated
(Gross MW) 640 619 630 396 585 575 625
Auxiliary Power
(MW) 46 25 50 20 24 25 25
Boiler Type Drum Once
Through
Once
Through Drum Once Through Drum Drum
Boiler Layout 2-pass Tower Tower 2-pass Tower 2-pass 2-pass
Elevation (m) 1581 1582 872 1765 1629 1586 1470
Reheat Pressure
(MPa) 3.80 3.65 3.70 3.70 3.6 3.94 3.80
Reheat Temperature
(°C) 535 535 535 510 535 535 535
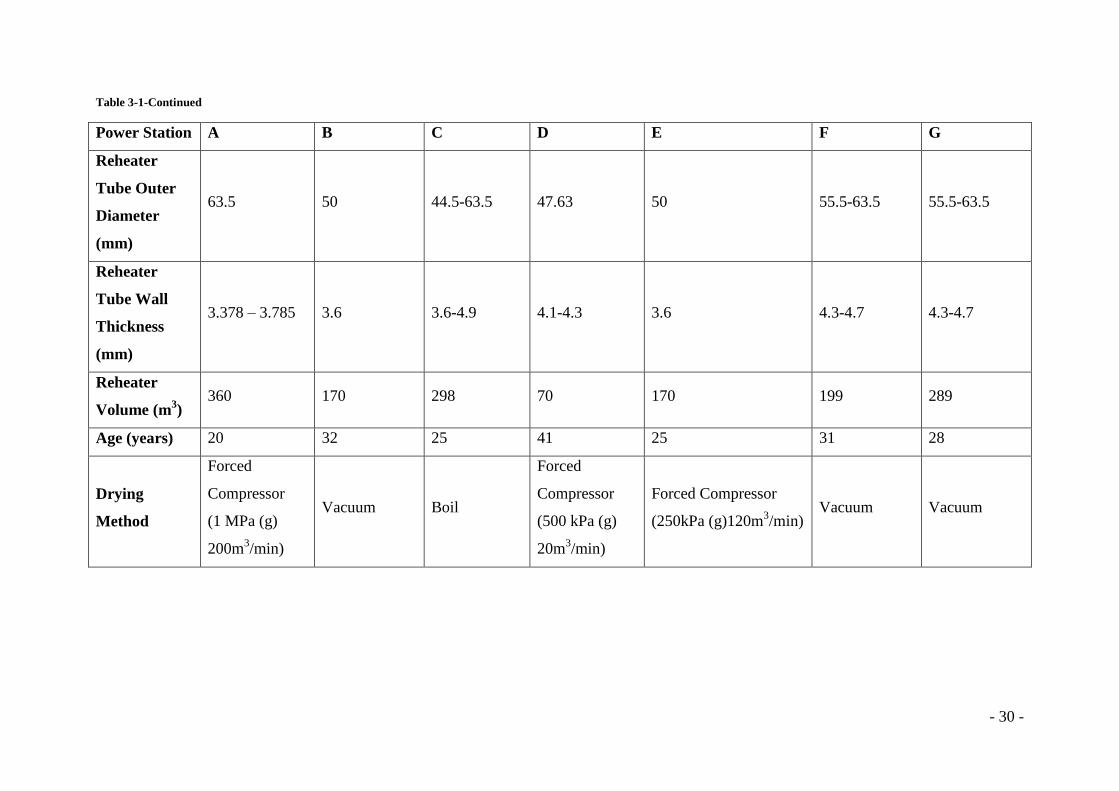
- 30 -
Table 3-1-Continued
Power Station A B C D E F G
Reheater
Tube Outer
Diameter
(mm)
63.5 50 44.5-63.5 47.63 50 55.5-63.5 55.5-63.5
Reheater
Tube Wall
Thickness
(mm)
3.378 – 3.785 3.6 3.6-4.9 4.1-4.3 3.6 4.3-4.7 4.3-4.7
Reheater
Volume (m3)
360 170 298 70 170 199 289
Age (years) 20 32 25 41 25 31 28
Drying
Method
Forced
Compressor
(1 MPa (g)
200m3/min)
Vacuum Boil
Forced
Compressor
(500 kPa (g)
20m3/min)
Forced Compressor
(250kPa (g)120m3/min)
Vacuum Vacuum
- 31 -
The power stations where testing was done are all over 20 years of age. There are two types
of boilers used namely once through tower boilers which have horizontal tube banks while
the drum 2-pass boiler type has horizontal tube banks as well pendant loops. Vacuum and
forced drying is used in both types of boilers while boil drying is only used in Power Station
C. All the stations are base load stations, which are similar in generating power with the
exception of Power D, which is 200MW below the rest. Power Station D is also the oldest
power station from the seven. Power Station D operates with a hot reheat temperature of
510°C while the rest of the stations operate at a temperature of 535°C. The hot reheat
pressures range from 3.6 – 3.94 MPa. For all power stations under normal boiler shut down,
the reheat pressure drops to 0 before reheater drying commences making the conditions
inside the reheater at the beginning of reheater drying the same. All power stations have
similar altitudes as they are in the Highveld of South Africa with the exception of Power
Station C situated in the Lowveld of South Africa.
Power Stations B and E have different generating power due but have the exact same boiler
design and layout. The boiler tube dimensions are exactly the same, however Power Station B
makes use of vacuum drying while Power Station E makes use of forced drying with a
compressor delivering 250kPa (gauge) maximum pressure with an air intake of 120 m3/min.
The three different drying procedures are discussed next.
3.3 Reheater Drying Procedures
Reheater Drying Procedures
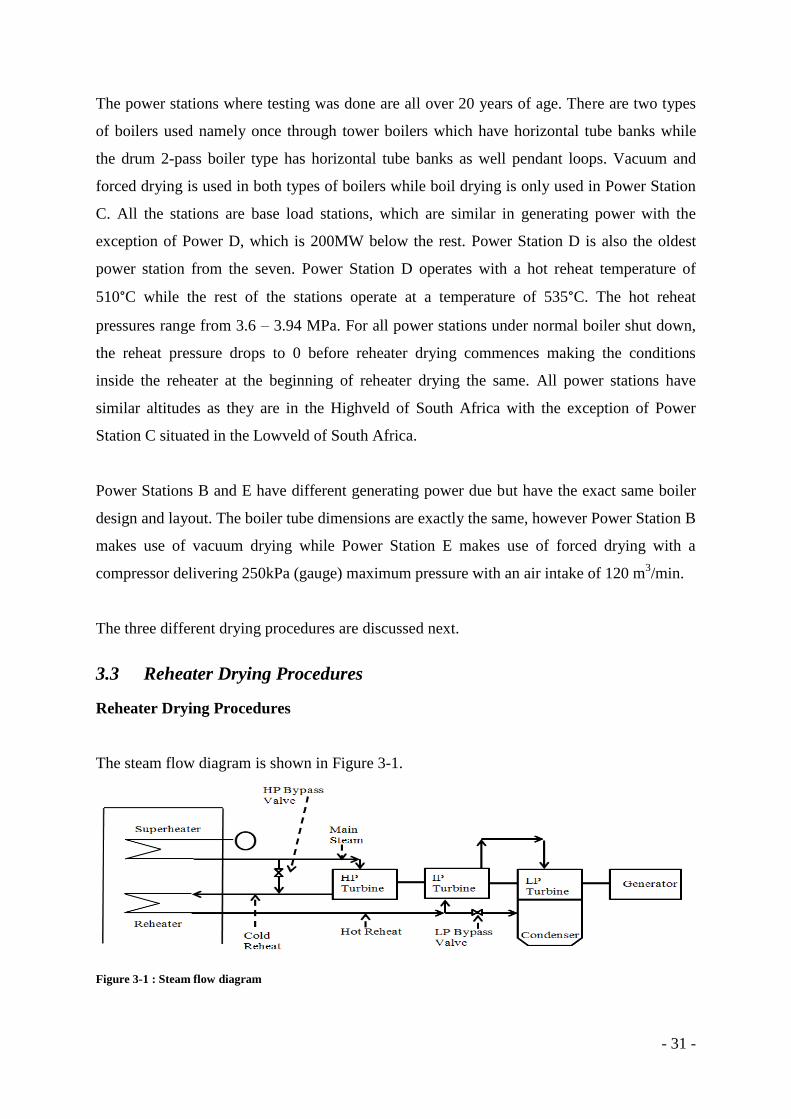
The steam flow diagram is shown in Figure 3-1.
Figure 3-1 : Steam flow diagram

- 32 -
Saturated steam from the evaporators enters into the superheater to form superheated steam.
The superheated steam called main steam goes to the HP turbine. Steam leaving the turbine
known as cold reheat enters the boiler reheat tubes and leaves the boiler as hot reheat. The
hot reheat enters the IP turbine. Steam leaving the IP turbine flows directly to the LP turbines.
It then leaves the LP turbine and flows into the condenser to be condensed. An HP bypass
valve allows the steam to be directed into the cold reheat pipes bypassing the HP turbine. The
LP bypass valve allows steam from the hot reheat pipe to bypass both the IP and LP turbine
and flow directly into the condenser.
The three methods of reheater drying are 1) forced, 2) vacuum and 3) boil drying. The three
methods are discussed below:
3.3.1 Forced Drying
Forced drying makes use of compressed air to force the steam within the reheaters out and
replace it with air, immediately after shut down. Figure 3-2 depicts the flow diagram of the
forced drying process. A summary of the procedure used at Power Station A is given below
[13].
Figure 3-2: Forced drying flow diagram
Prior to reheat drying the unit needs to be shut down according to the shutdown procedure
[13]. This includes:
1) Deloading of the boiler
2) Emptying of the mills,
3) Reducing steam pressure with HP and LP bypass valves open,
4) Opening of drain valves to drain into the blow down vessel,

- 33 -
5) Purging of the boiler once fires are out and
6) Boxing of the boiler.
Boxing of the boiler essentially closes the gas flow into and out of the boiler, once purging is
completed. This is to ensure that no cold air enters the boiler and the boiler tubes remain hot.
During the shutdown of the boiler, the forced air compressor is started and the common line
from the compressor to all the units is drained and dried. After 1 hour of drying the common
line, the drain valves are shut in preparation to dry the reheat and superheat tubes. This
particular power station is equipped with a 1MPa compressor which delivers a final output
pressure into the pipework of approximately 800kPa.
Reheater and superheater drying commences once the main steam pressure is at 200kPa.
Compressed air is supplied for drying of the reheaters and superheaters at the IP turbine side.
The HP and IP turbine governor valves and LP bypass valve remains shut so that no air flows
through the HP turbine, IP turbine and condenser. Air flows in the reverse direction compared
to normal steam operation. Air flows into the hot reheat pipe, into the reheaters, through the
HP bypass valve into the superheaters, and is exhausted out of the superheater drains to the
blowdown vessel. This is depicted by the red line in Figure 3-2.
Once the air flow rate is maintained at 190kg/min, measured by an installed flow meter, the
boiler can be forced-cooled by starting up the secondary air fans and opening the dampers to
allow cold air to enter the boiler and cool the boiler down. Approximately half the mass flow
enters the reheaters. Drying of the reheaters is terminated by shutting the air supply valves
when the air heater gas outlet temperature has cooled to 60°C. Boiler forced cooling
continues until the boiler has cooled to an acceptable temperature to continue with any
maintenance work required within the boiler.
The other power stations making use of forced drying have a similar procedure. The
compressor connection to the reheater are slightly different with Power Station D connecting
directly to the HP turbine casing (portable compressor) and air flows through the cold reheat
into the reheaters, out of the hot reheat pipe and exhausts out of a vent. Power Station E has a
dedicated compressor connecting between the ESV and GV. Air flows through the cold
reheat pipe, through the reheater circuit, out of the hot reheat pipe, through the LP bypass
valve and exhausts into the condenser.
- 34 -
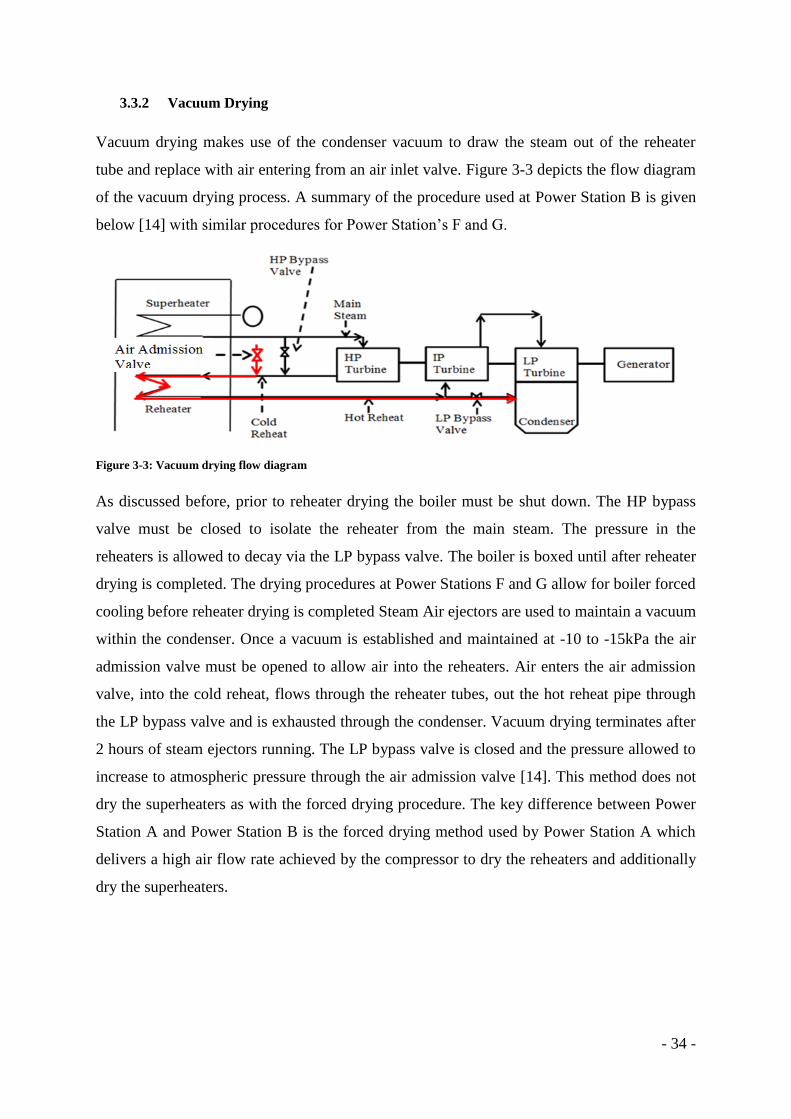
3.3.2 Vacuum Drying
Vacuum drying makes use of the condenser vacuum to draw the steam out of the reheater
tube and replace with air entering from an air inlet valve. Figure 3-3 depicts the flow diagram
of the vacuum drying process. A summary of the procedure used at Power Station B is given
below [14] with similar procedures for Power Station’s F and G.
Figure 3-3: Vacuum drying flow diagram
As discussed before, prior to reheater drying the boiler must be shut down. The HP bypass
valve must be closed to isolate the reheater from the main steam. The pressure in the
reheaters is allowed to decay via the LP bypass valve. The boiler is boxed until after reheater
drying is completed. The drying procedures at Power Stations F and G allow for boiler forced
cooling before reheater drying is completed Steam Air ejectors are used to maintain a vacuum
within the condenser. Once a vacuum is established and maintained at -10 to -15kPa the air
admission valve must be opened to allow air into the reheaters. Air enters the air admission
valve, into the cold reheat, flows through the reheater tubes, out the hot reheat pipe through
the LP bypass valve and is exhausted through the condenser. Vacuum drying terminates after
2 hours of steam ejectors running. The LP bypass valve is closed and the pressure allowed to
increase to atmospheric pressure through the air admission valve [14]. This method does not
dry the superheaters as with the forced drying procedure. The key difference between Power
Station A and Power Station B is the forced drying method used by Power Station A which
delivers a high air flow rate achieved by the compressor to dry the reheaters and additionally
dry the superheaters.
- 35 -
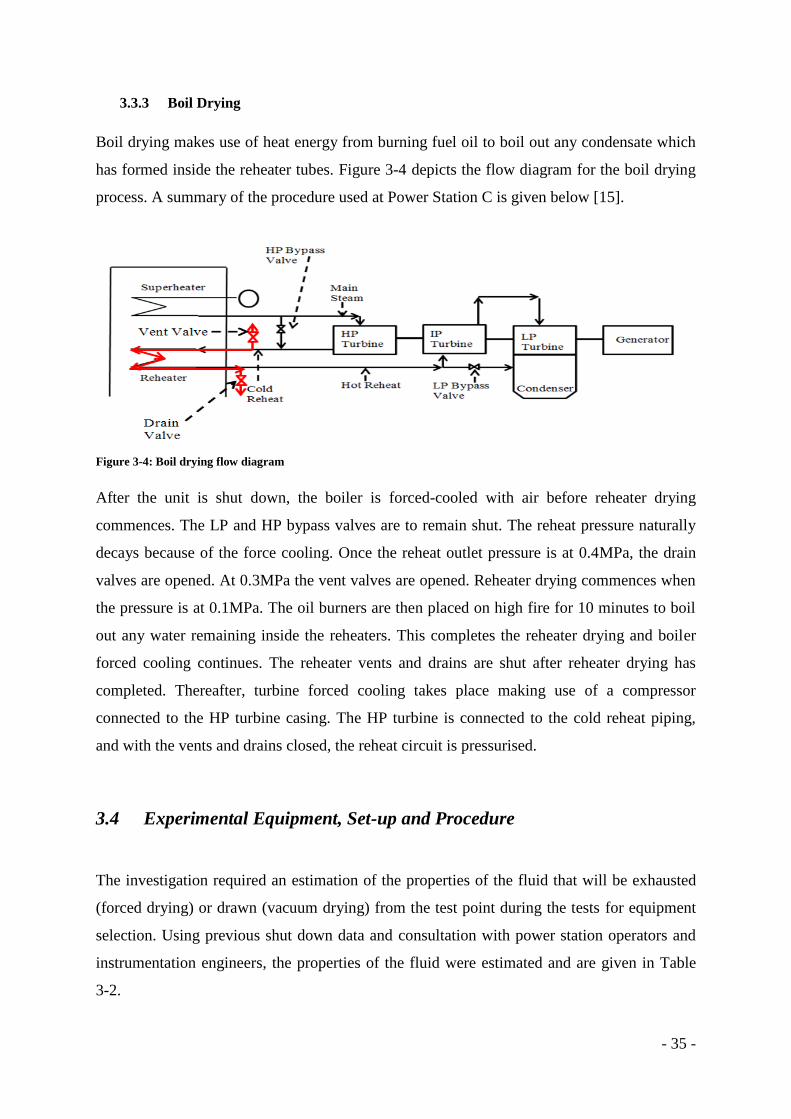
3.3.3 Boil Drying
Boil drying makes use of heat energy from burning fuel oil to boil out any condensate which
has formed inside the reheater tubes. Figure 3-4 depicts the flow diagram for the boil drying
process. A summary of the procedure used at Power Station C is given below [15].
Figure 3-4: Boil drying flow diagram
After the unit is shut down, the boiler is forced-cooled with air before reheater drying
commences. The LP and HP bypass valves are to remain shut. The reheat pressure naturally
decays because of the force cooling. Once the reheat outlet pressure is at 0.4MPa, the drain
valves are opened. At 0.3MPa the vent valves are opened. Reheater drying commences when
the pressure is at 0.1MPa. The oil burners are then placed on high fire for 10 minutes to boil
out any water remaining inside the reheaters. This completes the reheater drying and boiler
forced cooling continues. The reheater vents and drains are shut after reheater drying has
completed. Thereafter, turbine forced cooling takes place making use of a compressor
connected to the HP turbine casing. The HP turbine is connected to the cold reheat piping,
and with the vents and drains closed, the reheat circuit is pressurised.
3.4 Experimental Equipment, Set-up and Procedure
The investigation required an estimation of the properties of the fluid that will be exhausted
(forced drying) or drawn (vacuum drying) from the test point during the tests for equipment
selection. Using previous shut down data and consultation with power station operators and
instrumentation engineers, the properties of the fluid were estimated and are given in Table
3-2.

- 36 -
Table 3-2: Estimated properties of fluid from test point
Drying Method Pressure Temperature
Forced
200kPa (abs)
Based on compressor output
pressure and taking into
account pressure drop along
the flow path 60°C – 120°C (Estimated
Range) Based upon the
closest temperature
measurement and taking into
account cooling through the
pressure impulse line which
is not insulated
Vacuum
6kPa (abs)
Based upon the minimum
pressure in the condenser
Boil
200kPa (guage)
Based on turbine force-
cooling compressor output
which pressurises the
reheater
The vacuum pump required for testing, needed to be portable and have sufficient suction to
draw the fluid out of the reheater and deliver the fluid to the measuring (humidity) box. The
effectiveness of the procedure is tested once the drying of the reheater is completed. Testing
during the drying period indicates the rate of drying but is not a requirement. The
Vaccutronics DP 200H portable vacuum pump was used and it is capable of drawing out
fluid with temperatures within the required range. The performance curve for the vacuum
pump is given in Appendix A. The pump cannot draw against the vacuum created in the
condenser used during drying, but when reheater drying is completed, the vacuum in the
reheaters is broken as the condenser ejector pumps are switched off, the pump draws against
atmospheric pressure. During forced drying, the pressure at the test point should deliver
sufficient flow thus the pump will not be required. Rubber and copper piping which can
withstand the pressure and temperature was used. Pressure transducers connected to the
reheat circuit provides direct access to the reheater tubes and are close enough to
representatively measure the properties of the fluid therein and thus was chosen as the test
point without the need to modify the plant for a special test point. Therefore, half inch fittings
were used to connect the test equipment, as this was common to all power stations. Thread
tape was used to ensure connections are tightly sealed and that no air enters the system and
- 37 -
no reheater fluid leaks out. This was verified with a pressure test, pressuring with compressed
air to 300kPa and observing any pressure decay on pressure gauge. All connections were
checked for leaks with soap.
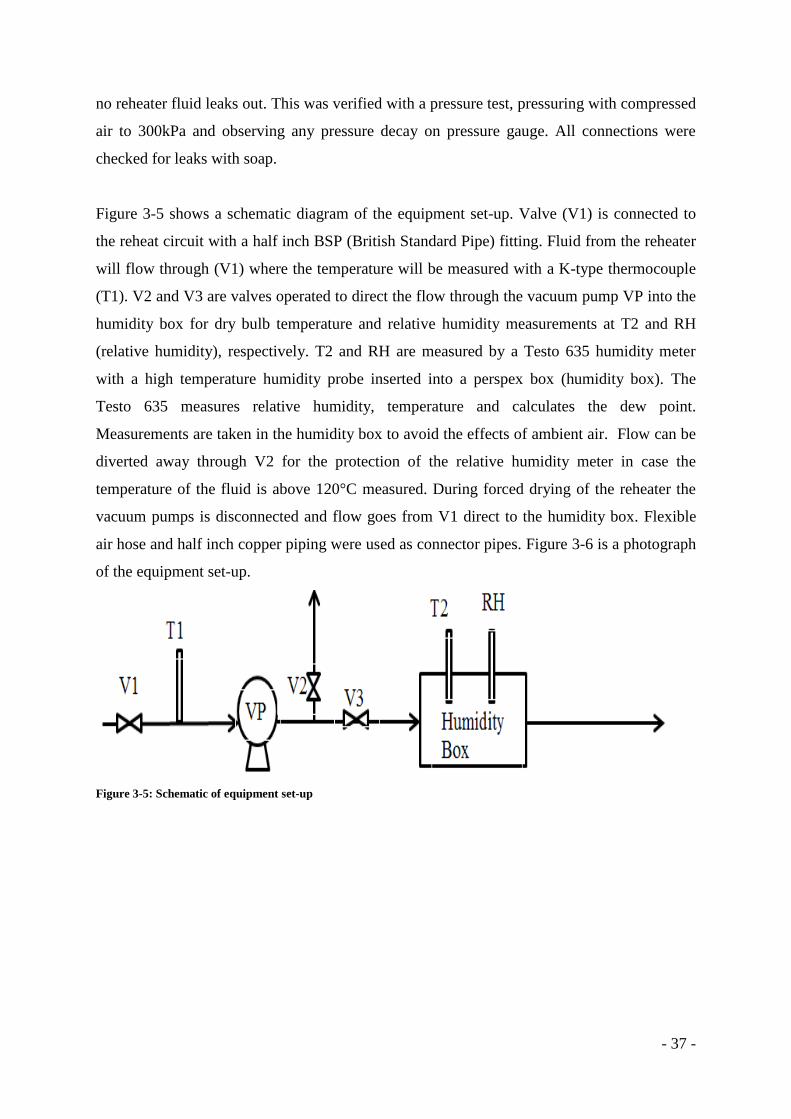
Figure 3-5 shows a schematic diagram of the equipment set-up. Valve (V1) is connected to
the reheat circuit with a half inch BSP (British Standard Pipe) fitting. Fluid from the reheater
will flow through (V1) where the temperature will be measured with a K-type thermocouple
(T1). V2 and V3 are valves operated to direct the flow through the vacuum pump VP into the
humidity box for dry bulb temperature and relative humidity measurements at T2 and RH
(relative humidity), respectively. T2 and RH are measured by a Testo 635 humidity meter
with a high temperature humidity probe inserted into a perspex box (humidity box). The
Testo 635 measures relative humidity, temperature and calculates the dew point.
Measurements are taken in the humidity box to avoid the effects of ambient air. Flow can be
diverted away through V2 for the protection of the relative humidity meter in case the
temperature of the fluid is above 120°C measured. During forced drying of the reheater the
vacuum pumps is disconnected and flow goes from V1 direct to the humidity box. Flexible
air hose and half inch copper piping were used as connector pipes. Figure 3-6 is a photograph
of the equipment set-up.
Figure 3-5: Schematic of equipment set-up

- 38 -
Figure 3-6: Picture of equipment set-up
3.5 Relative Humidity Test Procedure
At each of the power stations tested, a suitable test point was identified. The test points were
at the outlet flow of the drying process. With the forced drying Power Station A the test point
needed to be on the cold reheat pipe. The drain line from the cold reheat header had a test
point installed previously. The test point is shown in Figure 3-7
Figure 3-7: Test point on cold reheat drain line at forced dried Power Station A
V1
T1
Vacuum Pump V2 V3
Humidity Box
Relative Humidity
Meter and Dry
Bulb Temperature

- 39 -
This test point needed to be cut and welded with a half inch male fitting in order to connect
the humidity test equipment. The plant safety regulations required a permit to be issued in
order for the cutting and welding of the test point. The permit is issued when main steam
pressure is 0MPa(g) and there is no steam flow to the test point. This isolation is achieved by
shutting the valve before the test point. Once the fitting is welded on and the equipment set-
up the isolation valve is opened and steam allowed to flow to the test point.
The other six stations made use of pressure transducers as the test point. The pressure impulse
line provides direct access to the reheat line and the standard fitting for transducers is a half
inch BSP (British Standard Pipe) thread. Figure 3-8 shows the pressure transducer test point
at Power Station B with a similar set up at Power Station C.
Figure 3-8: Pressure transducer test point at vacuum dried Power Station B
If required, the test lines were purged of any liquid build up in the line while there was still
pressure in the impulse line or with compressed air from a nearby service line.
Temperature, relative humidity and the instruments calculated dew point are the three main
measurements which were recorded. Dew point temperature was recalculated using Equation
3 as mentioned in Section 4.1. The ambient measurements were taken at the inlet of the
Test point with half
inch fitting
- 40 -
processes, which is at the compressor inlet for forced drying and at the air inlet valve for
vacuum drying. Measurements of the fluid flowing out of the test point commenced as soon
as reheater drying started. This is termed a hot measurement. Measurements are taken while
conditions are hot to avoid any condensation occurring and reflecting incorrect humidity
measurements. Process data mentioned below were obtained from the station log books as
well as the operator shut down log books detailing the shutdown.
a. Hot reheat temperature (as close to the reheater as possible) – this indicates the
temperature of the hot reheat and monitors the temperature decay during the
shutdown, in particular the temperature decay during force cooling or boiler boxing.
b. Hot reheat pressure (as close to the reheater as possible) – this identifies how long
after the reheater is at 0 pressure does drying commence.
c. Condenser pressure – This provides information on the condenser vacuum.
d. Main steam pressure – Reheater drying commences when main steam pressure is 0.
e. Total Air Flow – This provides information relating to force cooling of the boiler.
f. Rotary Air Heater Gas inlet temperature – The air heater outlet temperature provides
an indication of the temperature within the boiler environment. The air heater is the
last piece of equipment inside the boiler and while cooling is taking place in the boiler
the air heater temperature would represent the hottest fluid temperature.
g. Total Fuel Flow – this is the fuel oil and coal flow and indicates when the fires are
out.
Chapter 4 provides the results obtained from three tests in detail. The results from the three
drying methods used at the seven power stations are presented, discussed and compared. The
remaining four power stations’ detailed results are presented in Appendix C
- 41 -
CHAPTER 4: RESULTS AND DISCUSSION
Chapter 3 discussed the experimental set-up used in determining the effectiveness of the three
drying procedures. The results obtained from the relative humidity testing conducted at three
of the seven power stations each using one of the three drying procedures are presented in
this chapter followed by a discussion comparing the seven power stations’ drying results.
Results for the remaining 4 power stations’ with measured data is available in Appendix C.
4.1 Results
4.1.1 Forced Drying Test Results at Power Station A
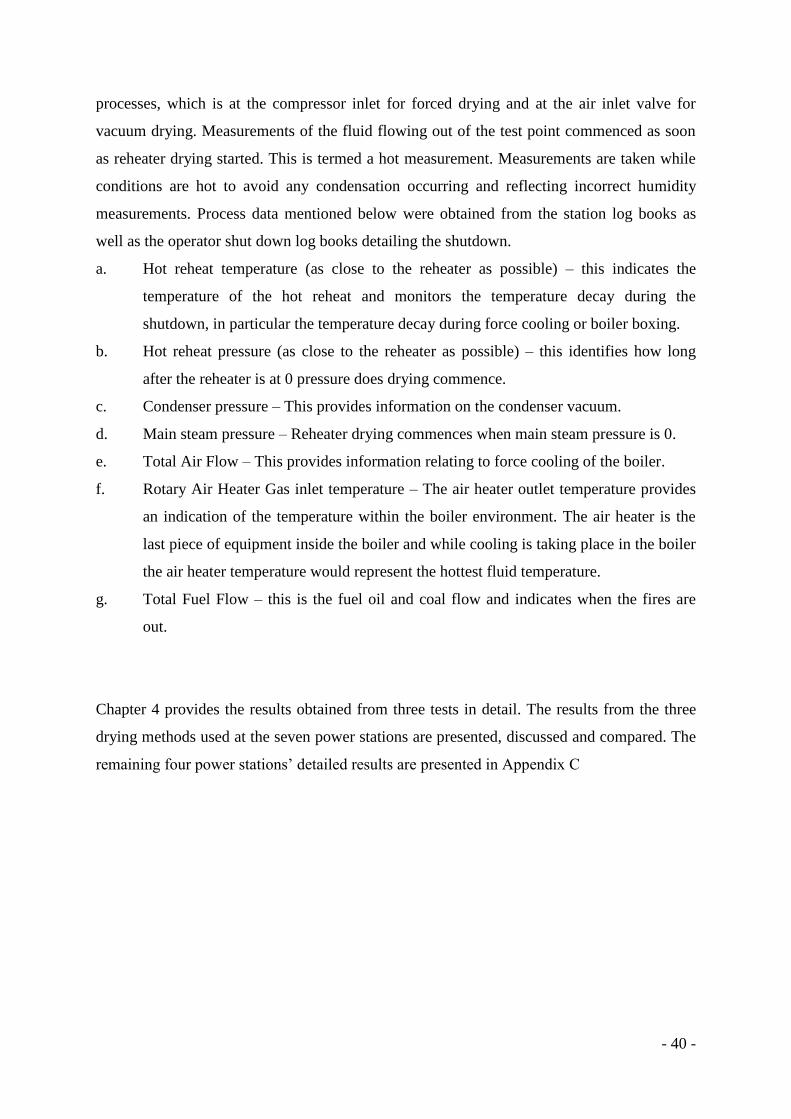
The plant data for the shutdown, collected from the station log books, are presented below in
Figure 4-1.
Figure 4-1: Force drying data from Power Station A
The blue shaded area in Figure 4-1 indicates the drying period which commences when main
steam pressure is at 0 with the force cooling compressor drains are shut. According to the
operator logs as shown on Table 4-1, this took place at 7:45am. At 8:30am the flow was
maintained at 190kg/min and boiler forced-cooling commenced. This is indicated by the line

- 42 -
marked A which represents the total air flow. During the drying period the hot reheater
temperature marked B remained above 200°C. Flue gas temperature was above 100°C until
10:45am marked C. As mentioned before the flue gas temperature is a more representative
indicator of the actual tube temperature in the boiler as compared to the hot and cold reheat
temperature. This is because the hot and cold reheat temperature measurements are taken
outside of the boiler, in the pipework close to the turbine which is insulated. The cooling
effect of the cold air is not taken into account. Tubes in the boiler are much cooler due to the
boiler cooling taking place.
Table 4-1: Operator logs for the forced drying test at Power Station A
No. Time Comment
1 7:30am All boiler superheater vents open (Indicating pressure
is zero)
2 7:38am Pressure part permit to work issued (Allowing fitting
to be welded to test point)
3 7:45am Forced cooling compressor drains shut
4 8:30am Force cooling in progress on boiler (Indicating drying
has started)
5 8:45am LH draught group in service, RH FD fan failed to start
6 10:30am RH FD fan started (Indicating boiler is being force
cooled)
The test commenced once the fitting was welded to the test point. This was approximately
one hour after drying had begun due to issuing of permits required for cutting and welding of
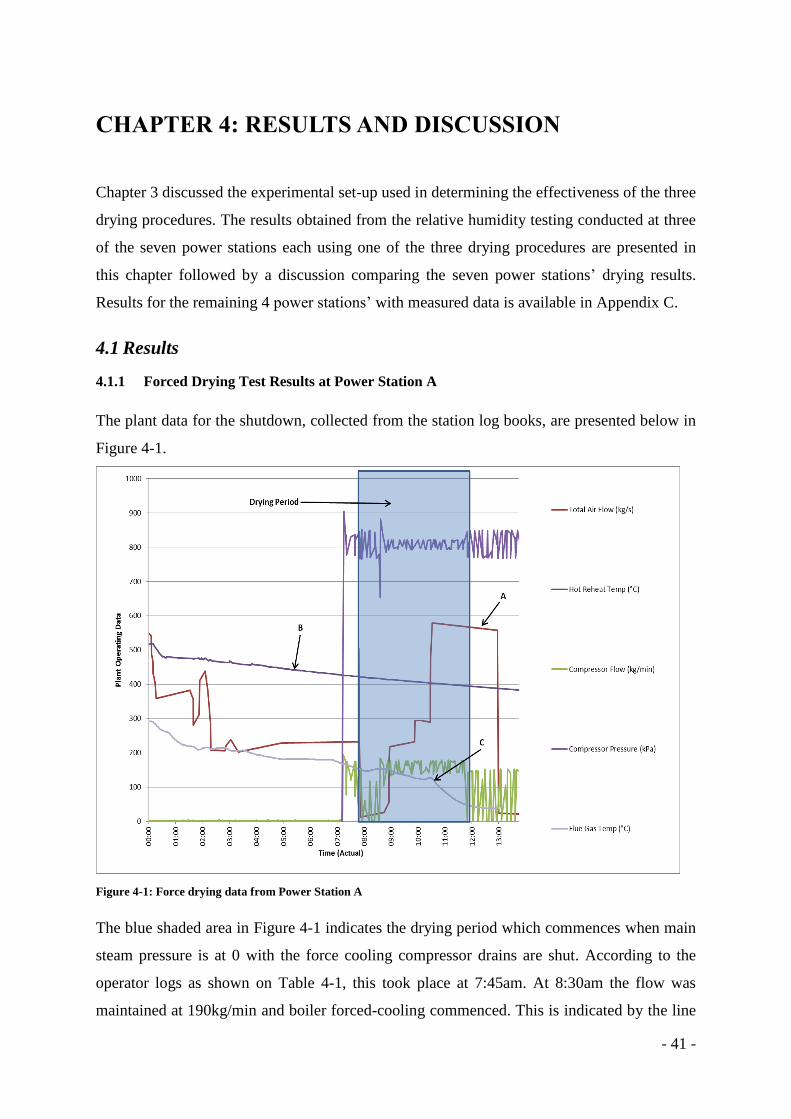
the test point. Results are shown in Figure 4-2.
- 43 -
Figure 4-2: Force drying test results at Power Station A
It can be seen that as drying progressed the relative humidity and dew point decreased. At
just over two hours of drying the relative humidity measured coming out of the test point was
13.7% at 31.5°C. The dew point calculated is 0.9°C. The ambient conditions were measured
to have a relative humidity of 47% at 29.2°C with a dew point of 17.3°C. The high pressure
air form the compressor removes some of the moisture in the air as liquid and discharges this
liquid. The air is then heated in the pipe network of the boiler before entering the reheater
thus increasing its moisture carrying capacity. There are two spikes in the relative humidity
and dew point measurements which will be discussed later in Section 4.3.1.

- 44 -
4.1.2 Vacuum Drying Test Results at Power Station B
The plant data for the shutdown, collected from the station logs, are presented below in
Figure 4-3.
Figure 4-3: Vacuum drying plant data at Power Station B
The blue shaded area in Figure 4-3 indicates the drying period with air flowing through the
reheater commencing at 18:25 when the air inlet valves were opened. Drying was completed
at 19:34 which is when the vacuum in the condenser was broken, indicated by A. This is 1
hour of ambient air flow through the reheaters. The line marked B in Figure 4-3 is the total
air flow which refers to the air flowing from the SA fan to force cool the boiler. The flow is
approximately 50kg/s. This is not according to the procedure which requires the boiler to be
boxed (no air flow) until reheater drying is completed. The operator logs (Table 4-2) show
that full boiler forced cooling starts at 19:30 which increases the air flow to approximately 80
kg/s. This step change can be seen on the line marked B. The 50kg/s flow is regarded by the
operators as a period of low air flow. During the low flow period the flue gas temperature
continues to decrease. By the time air was allowed into the reheater the flue gas temperature
was just above 100°C and soon dropped below. This is indicated by C which represents the
flue gas temperature leaving the reheaters. The remainder of the drying occurred with tube
temperatures below 100°C. This means that whatever moisture is within the tubes will

- 45 -
condense and humidity measurements will be affected and not give a true reflection of the
moisture content within the reheaters. The hot reheat steam temperature (D) levels off at
450°C which was an instrument error as advised by operating staff. This should steadily
decrease. Testing commenced at the end of reheater drying. Results are shown in Figure 4-4.
Table 4-2: Operator logs during vacuum drying at Power Station B (test 1)
No. Time Comment
1 15:19 Boiler Purge Completed
2 18:25 Air Inlet Valves opened for reheater drying
3 19:37 Force cooling in progress on boiler (80%)
Figure 4-4: Vacuum drying test 1 results at Power Station B
Testing only commenced after reheater drying was complete and the vacuum from the
condenser switch off and the reheaters were at ambient pressure. It can be seen that relative
humidity increased initially. This is due to the time taken to fill the humidity box with fluid
from the reheater. The box was larger than the one used during the forced drying testing as a
smaller box was reverted to during the forced drying test to speed up the time for
measurements to stabilise. Thereafter it stabilised and the final measurements were 68.9 % at
28.3°C with a dew point temperature of 22.2°C.
- 46 -
This shut down differed from the procedure. The procedure required 2 hours of drying with a
boxed boiler. This shut down had low air flow with only 1 hour of air flowing through the
reheaters. This is due to a temporary operating procedure in place allowing for the first hour
maintaining a vacuum in the reheaters and the second hour opening up the air inlet valves to
allow air to pass. In order to test the effectiveness of the procedure a second test was
conducted at the next shut down with a boxed boiler and with a full 2 hours of air flow
through the reheater.
Plant data for the second test shut down is shown in Figure 4-5.
Figure 4-5: Plant data for Power Station B vacuum drying test 2
In Figure 4-5 the blue shaded area indicates the 3 hours of drying with air flow through the
reheaters. The additional hour was due to an problem shutting down the ejector system
maintaining the vacuum in the condenser. Drying commenced at 02:10 AM and ended at
05:15 AM. The boiler was boxed static air in the boiler. This is not shown in the figure but
from operating logs (Table 4-3) the air flow was only increased once drying was completed.
This is evident from the flue gas temperature being above 100°C (marked A) for the full
duration of the drying. This means that no condensation took place and drying was carried
out while the fluid in the reheaters was in gaseous state. The blue line (condenser pressure)

- 47 -
indicates when vacuum drying stopped, i.e. when the vacuum in the condenser was broken
and allowed to increase to atmospheric pressure.
Relative humidity measurements were taken at the end of drying, once pressure in the
reheater was atmospheric, and found to be 100% at 42.6°C with a dew point of 42.6°C as can
be seen in Figure 4-6.
Figure 4-6 : Vacuum drying test 2 results at Power Station B
Once 100% humidity was measured the fluid coming into the humidity box started to
condense and the test was ended to protect the equipment. The relative humidity is higher in
the second test because all the fluid in the reheater is still in steam form. In the previous test,
boiler forced cooling commenced before reheater drying, cooling the boiler to a point where
condensation will occur resulting in lower humidity measurements.
Table 4-3: Operator logs for vacuum drying test 2 at Power Station B
No. Time Comment
1 01:30 Boiler Purge Completed
2 02:10 Start Reheater Evacuation as per procedure
3 03:44 Air admission valves open
4 05:15 Reheater Drying Completed
5 05:45 Vacuum Broken on Main Condenser
6 05:50 Air Flow increased to 50%

- 48 -
4.1.3 Boil Drying Test Results at Power Station C
The plant data for the shutdown, collected from the station logs, are presented below in
Figure 4-7.
Figure 4-7: Plant data from boil drying test at Power Station C
The blue shaded area indicates 10 minutes of drying. This procedure burns fuel oil at high
fire for 10 minutes while opening up the vents and drains on the reheater in order to boil out
any water collecting in the tubes. The flue gas temperature before the fuel oil was burnt was
already at 226°C, therefore, the fluid in the reheater is already in steam form. Increasing the
temperature will cause the steam to expand causing it to escape from the vents and drains.
After boiling is completed, the vents and drains are closed and forced cooling of the turbine
takes place. The compressed air cooling the turbine is allowed to enter the reheater but with
vents and drains closed the reheater is pressurised. Measurements were taken at the pressure
transducer on the hot reheat line. When the test point was opened, wet steam emitted and
continued to come out for a few hours. The temperature of the wet steam was 90°C. The
barometric pressure at the station was 90.7kPa thus steam will condense at a temperature of
96.9°C (steam tables) [53] at this power station. This wet steam started condensing on the
humidity meter and thus the test was stopped to protect the instrument.

- 49 -
Measurements were taken 12 hours later to determine the conditions inside the reheater after
it has cooled own. Figure 4-8 below depicts the results.
Figure 4-8: Measured data from Power Station C 12 hours after drying
As the boiler cooled down the steam in the reheaters condensed which results in lower
relative humidity values measured. However, even with this lower measured values the boiler
was left in a condition with high relative humidity of 93.7% at 38.8°C with a dew point of
37.6 °C.
4.2 Uncertainty Analysis
An uncertainty analysis was carried out to determine the uncertainty in results obtained from
measurement. The total uncertainty is quantified using partial differentiation of the derived
parameter (dew point). Table 4-4 gives the uncertainty for the three relative humidity at the
three temperatures used in calibration of the equipment. Details can be found in Appendix B.
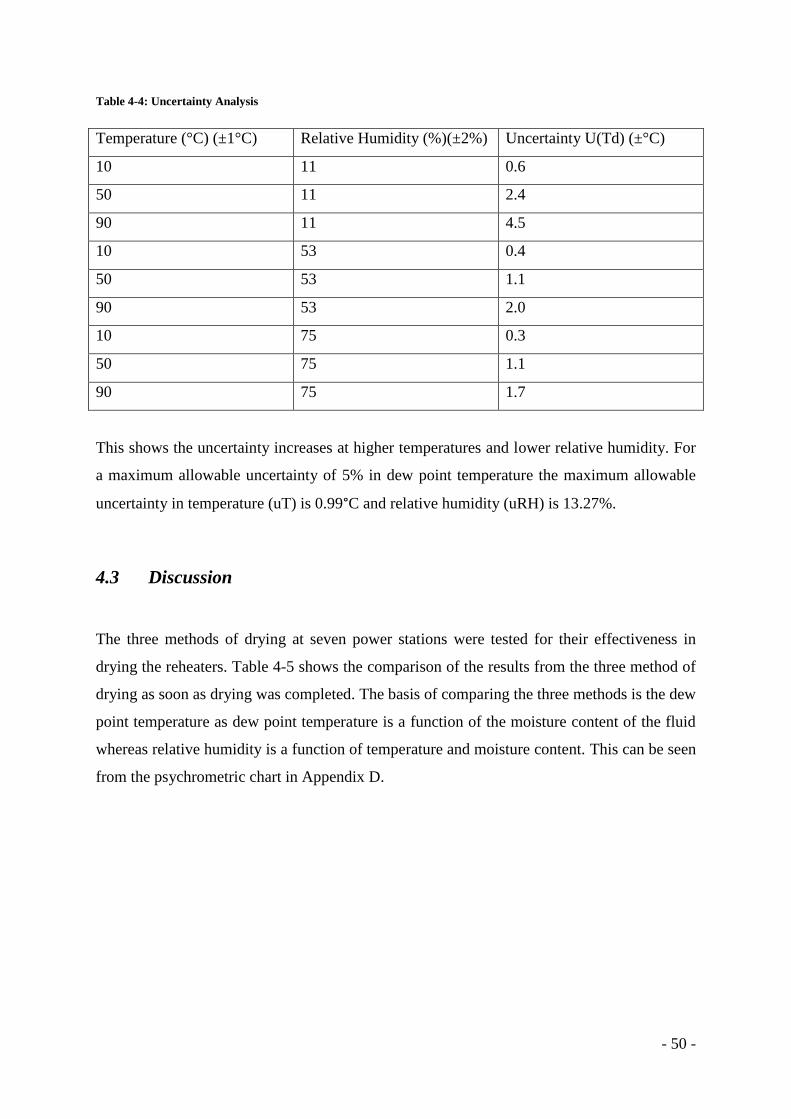
- 50 -
Table 4-4: Uncertainty Analysis
Temperature (°C) (±1°C) Relative Humidity (%)(±2%) Uncertainty U(Td) (±°C)
10 11 0.6
50 11 2.4
90 11 4.5
10 53 0.4
50 53 1.1
90 53 2.0
10 75 0.3
50 75 1.1
90 75 1.7
This shows the uncertainty increases at higher temperatures and lower relative humidity. For
a maximum allowable uncertainty of 5% in dew point temperature the maximum allowable
uncertainty in temperature (uT) is 0.99°C and relative humidity (uRH) is 13.27%.
4.3 Discussion
The three methods of drying at seven power stations were tested for their effectiveness in
drying the reheaters. Table 4-5 shows the comparison of the results from the three method of
drying as soon as drying was completed. The basis of comparing the three methods is the dew
point temperature as dew point temperature is a function of the moisture content of the fluid
whereas relative humidity is a function of temperature and moisture content. This can be seen
from the psychrometric chart in Appendix D.

- 51 -
Table 4-5: Comparison of results
Drying
Method
Power
Station
Measured Ambient
RH (%) T (°C) Td (°C) U(Td)
(±°C)
T (°C)
(±0.2°C)
Forced
A 13.7 31.5 0.9 2.7 25.8
D 40.4 27.5 13.1 1.5 21.7
E 49.9 23.9 13 1.2 18.3
Vacuum
B 100 42.6 42.6 1.5 22.6
F 100 14.8 14.8 0.7 13.7
G 100 36.2 36.2 1.3 36.2
Boil C 100
(Steam) 90 96.9 27.2
Figure 4-9 below further illustrates the comparison of the dew point temperature after drying
to the ambient temperature when at the specific time.

- 52 -
Figure 4-9: Dew Point Temperature Comparison
Figure 4-9 shows that all the forced drying stations leave the reheaters with a dew point
temperature lower than ambient temperature, which will ensure no condensation and thus no
pitting. However, all the vacuum drying power stations and the boil drying power station
leave the reheater with dew point temperatures equal or higher than ambient temperatures.
Condensation will occur and has been witnessed during testing.
4.3.1 Forced Drying
Power Station A had a dry fluid with a relative humidity of 13.7% at 31.5°C and a dew point
of 0.9°C. The ambient temperature was measured to be 25.8°C with a dew point calculated to
17.3°C. Taking into account the maximum uncertainty, the dew point temperature of 3.6°C is
still well below the ambient temperature of 25.6°C.
This power station makes use of a large compressor delivering approximately 100kg/min at
800kPa (g) air into the reheater. The compressor removes some of the moisture present in the
air and discharges it. The air is then heated in the pipework of the boiler allowing the air used
for drying to have a higher moisture holding capacity, which explains the low dew point
measured as compared to ambient air. The forcing of air out of the reheater and replacing
with air results in the low dew point and relative humidity measurements seen. The spikes in
the relative humidity and dew point during the forced drying can only be due to moisture
entering the system. The moisture entering is unknown at this point, but could be due to a

- 53 -
spray water valve passing or some water carried over from the compressor. However, this
will not result in condensation collecting the tubes as the tubes are still above the boiling
point as indicated by the high flue gas temperature throughout the drying period. This forced
drying station has not had any signs of pitting since force drying was implemented in 2000
indicating its effectiveness. Routine samples every outage (3 years) were checked for any
signs of pitting and no pitting has been identified since forced drying. The Eskom system for
analysing tubes involves visual examination, chemical analysis of corrosion product, wall
thickness measurements and metallographic examination that was performed on all tube
samples sent to the metallurgical department as per the EPRI guidelines [9].
Power Station D had a dry fluid with a relative humidity of 40.4% at 27.5°C and a dew point
of 13.1°C. The ambient temperature was measured be 21.7°C with a dew point calculated to -
0.4°C. Taking into account the maximum uncertainty, the dew point temperature of 14.6°C is
still well below the ambient temperature of 21.5°C.
This power station makes use of a compressor delivering air at an outlet pressure of 480kPa
air into the reheater. At maximum pressure, the inlet air at the compressor is 20m3/min. The
compressor delivers this air through the turbine, thus cooling the turbine as well. The lower
flow rate from this portable compressor ,compared to the compressors at Power Stations A
and E, adds to the required drying time.
Power Station E had a dry fluid with a relative humidity of 13.7% at 23.9°C and a dew point
of 13.0°C. The ambient temperature was measured to be 18.3°C with a dew point calculated
to 13.9°C. Taking into account the maximum uncertainty, the dew point temperature of
14.2°C is still well below the ambient temperature of 18.1°C.The reheater dew point being
only slightly lower than ambient dew point.
This power station makes use of a compressor delivering air with a maximum outlet pressure
of 250kPa (gauge) air into the reheater and an air inlet flow rate of 120m3/min. During
reheater drying the compressor deliverer pressure is 180kPa (g). This station delivers the air
through the HP turbine which also adds to the required reheater drying time as compared to
Power Station A but due to the higher air flow, the drying time is less compared to that of
Power Station D.

- 54 -
4.3.2 Vacuum Drying
Power Station B’s first test showed relative humidity measurements of 68.9% at 28.3°C with
a dew point temperature of 22.1°C. This is lower than the second test which had 100%
humidity, however, the first test measurements are not a true representation of the fluid
properties in the reheater. During this time even though the air flow was low, significant
cooling of the boiler tubes took place. By the time reheater drying started the flue gas
temperature was slightly over 100°C and shortly after reheater drying started the flue gas
temperature dropped below 100°C which will result in condensation taking place. Besides,
the literature review elaborated that boiler draining should take place when the boiler is hot to
avoid the condensation of fluid inside which will be almost impossible to drain without
cutting tubes.
During the second test flue gas temperatures remained well over 100°C ensuring that no
condensation took place and the fluid tested was a true representation of what was inside the
reheaters. The vacuum on the condensers and only one open air inlet valve does not allow a
large volume of air to replace the steam. Even though air does enter the system it was not
sufficient dry the reheaters and thus produced the result of 100% humidity and dew point of
42.6 °C. This means that as soon as the boiler temperature cools to 42.6°C the fluid in the
reheater will condense. The ambient conditions measured was a dry bulb temperature of
22.6°C with a dew point of 14.4°C. As the ambient dew point was lower than the fluid in the
reheater dew point, condensation will take place and this was witnessed during the test.
Condensate formed inside the humidity box as the fluid entered. When moisture condenses in
the tubes, pools form in the low lying areas of the boiler tubes which are rich in oxygen thus
the conditions for pitting are present. As the condensate forms on the boiler tubes the
deposited salts dissolve and collect in the pool in the low lying areas, thus high concentration
of salts in the pool aggravate pit formation.
Power Station F and G with the drum 2-pass type boiler had the same overall result as Power
Station B with the once through tower type boiler. All vacuum stations left the reheaters with
high dew point temperatures.
If vacuum drying was effective it would only replace the steam with the ambient air quality.
If this drying was done on a rainy day high moisture content air will enter the boiler tubes.

- 55 -
Having a vacuum on the reheater also allows for dust, flue gas and other foreign particles to
enter into the reheater which may lead to other problems. As part of the outage scope, routine
inspections are made to boiler tubes at corrosion prone areas. X-rays as well as tube samples
are taken are sent for metallurgical inspection to identify corrosion related problems. Samples
are sent if a failure occurs or when an outage takes place and the opportunity to cut tubes
arises. Power Station B and F has reported pitting as a problem in the past as it was noticed
on sampled tubes and failures have occurred which resulted from pitting corrosion. This is
evident from reports issued by Eskom’s Research, Testing and Development Department.
Power Station G has not had any failures due to pitting corrosion, however tube samples were
not taken in the past to confirm the presence of pitting or not. The major contributors to tube
failures were fly ash erosion and short term overheating. However, there is no certainty that
some failures did not initiate from pitting and the failure could have been attributed to
another mechanism.
4.3.3 Boil Drying
The boil drying procedure at Power Station C does not replace any steam with air. No boiling
of liquid actually takes place as the fluid in the reheaters are already above 200°C at
atmospheric pressure. This is evident from the high flue gas temperatures. The boiling only
expands the already present steam allowing some to escape out of the vents and drained. As
soon as this fluid cools during the force cooling of the boiler it will condense. Wet steam
exited the test point with 100% humidity measured at 90°C. The annual average dew point
calculated for this region is 11°C. The average annual temperature in this region is 27.2°C
[55]. Before the test Power Station C’s engineering department reported that no failures had
occurred due to pitting corrosion and hence pitting corrosion was never inspected for. Ten
samples were taken from the reheater tubes and sent for metallurgical analysis to Eskom’s
Research Testing & Development department which reported all ten samples had pitting
corrosion confirming implications of the test that boil drying is ineffective.
4.3.4 Flow Comparison between Vacuum and Forced Drying
Power Stations B and E have exactly the same design with regards to the boiler. Power
Station B makes use of vacuum drying while Power Station E makes use of forced drying.

- 56 -
Under normal operating shut down, the system temperatures and pressures are the same at the
time reheater drying commences. To compare the two different drying methods used, the
flow rate for the system is calculated. The assumption and detail calculations used can be
seen in Appendix E. An iterative process is followed by guessing a velocity value at the inlet
and computing the pressure drops along the system. Thereafter adjusting the inlet velocity
value until the sum of the pressure drop equates the total pressure drop. This was done for
each method of drying. The results are tabulated below in Table 4-6.
Table 4-6: Flow rates calculated at average air density
Vacuum Drying (Power
Station B)
Forced Drying (Power
Station E)
Inlet Velocity (m/s) 17.31 15.84
Volumetric Flow Rate
(m3/min)
18.35
16.79
Mass Flow Rate (kg/min) 10.24 33.94
As mentioned, both power stations have the exact same design with a total reheater volume
including the headers of 170m3. Both stations have a drying duration of 2 hours. Based on the
above flow calculations the Power Station B has one volume exchange in 9.26 minutes and
13 volume exchanges in the 2 hour drying period. Power Station E has one volume exchange
in 10.13 minutes and 11.85 volume exchanges in the 2 hour drying period. However, using a
compressor to force air into the system has a much higher mass flow rate compared to that of
vacuum drying. Under forced conditions the air density increases thus more steam is replaced
by air making forced drying more effective.
During normal shut down conditions, the flow rates will be less, as the system restrictions are
higher. The effect of mixing will also be present as the air will mix with the steam. The pipes
and tubes are filled with steam offering resistance as well as other piping restrictions not
taken into account, such as bends. The density of the air will change as it is heated up by the
hot pipework which will also reduce the flow rate, however, the calculated results prove what

- 57 -
has been observed during dew point testing. The air entering during normal conditions has
some moisture present. Some of this moisture will be removed during the compression. The
heating of the air in the pipework will also increase the moisture carrying capability of the
air.
Forced drying is a more effective means of drying the reheater to prevent pitting as, the
objective of replacing steam with air is obtained much faster as compared to vacuum drying.
Having higher ΔP values with larger compressor will increase the density and thus mass flow
as was observed with Power Station A. Drying will take place in a shorter time.
4.3.5 Conclusion to Results and Discussion
The results have shown that forced drying is the most effective method of drying as it has
replaced steam with dry air and left the reheater in a condition where no condensation which
will lead to pitting corrosion taking place. This was the case for both once through tower
boilers ( Power Station E) as well as drum 2-pass boilers (Power Stations A and D). Even
though the boiler types and design were different, results were consistent with the method of
drying used at the power stations. As mentioned in the literature review, making use of
compressed air to dry the boiler tubes is the preferred method to facilitate draining and drying
of steam tubes while the metal is still warm [34]. Vacuum and boil drying are ineffective
methods of drying as the reheaters were left in a state with 100% relative humidity which
when cooled will condense and lead to pitting corrosion. This was further proved by
calculations. The higher density air as a result of pressuring from the compressor results in a
higher density and thus more than 3 times higher mass flow through the reheaters as
compared to drawing a vacuum. The larger ΔP driver for flow from the forced drying
compared to vacuum drying results in steam evacuated quicker and thus better drying is
achieved.
Boxing of the boiler until reheater drying is completed is an essential part of boiler shut down
to ensure the drying is effective.

- 58 -
CHAPTER 5: CONCLUSION AND
RECOMMENDATIONS
5.1 Conclusion
Based upon the literature and results of this research the following conclusions have been
made:
As discussed in the literature review, pitting corrosion in boiler tubes can only occur
when oxygen rich stagnant water is present during the boiler outage time. This oxygen
rich stagnant water occurs because of poor shut down practices. Effectively drying the
tubes during the shutdown will prevent the formation of condensate thus preventing
pitting from occurring.
The plant data collected during the shutdown has shown that forced cooling of the
boiler before reheater drying allows the boiler tubes to be exposed to cold air. When
the metal temperature drops below the boiling point of the steam inside the tubes,
condensation will take place. Once condensation has formed, drying will be
ineffective. The boiler needs to be drained and dried while still hot. This is achieved
by boxing up the boiler, which ensures that the boiler internals remain hot until
reheater drying is complete.
Drying requires the replacement of steam with dry air. Forced drying with a
compressor delivering a large air mass flow rate is an effective method of drying.
Steam is effectively replaced with dry air thus ensuring no condensation will take
place once the tubes are cooled as discussed in section 4.2.1. This was not achieved
by vacuum drying as discussed in the results section 4.2.2. The air flow into the
reheater is not sufficient to replace the steam. Vacuum drying also allows for harmful
substances like dust and flue gas to enter into the boiler tubes which may lead to
further problems.
Boil drying is not an effective method of drying, as it does not replace any steam with
air. The steam inside the tubes is only allowed to expand with some escaping out the
vents as discussed in 4.2.3.
- 59 -
The literature guidelines have shown that to prevent offline corrosion, low-humidity
air needs to be circulated inside the boiler tubes during the storage period. This will
keep the relative humidity below 60% lowering the rate of corrosion of the steel.
It was observed that procedures are not always followed by the operators. Some
procedures specify that boiler forced cooling should be delayed until reheater drying
has completed but this is ignored with the intension to reduce the shutdown time.
Some shutdowns, certain valves which are specified to be shut during drying are left
open as a result of poor discipline.
Other maintenance issues also affect poor shut down practice such as spray water
valve passing, compressor trips and unavailability with no backup system in place.
5.2 Recommendations
It is recommended that forced drying of the boiler tubes be implemented at all power stations.
The power stations can make use of their turbine forced cooling compressor to dry the
reheaters. A common line to all units should be installed and the process automated. The
results from the forced drying Power Station A shows that using the 800 kPa compressor the
boiler tubes were dried to atmospheric conditions within an hour. It is recommended that all
stations should dry the reheater for a minimum of 2 hours depending on the size of the
available compressor. As soon as the reheat pressure is 0 reheater drying should commence.
Boxing of the boiler after boiler purge is completed is essential for ensuring the fluid inside
the tubes remains in gaseous form and can easily be forced out using the compressed air. If
possible the compressor should be fitted with a dryer to ensure dry air is used to dry the
reheater even during rainy and wet conditions. Some stations do not perform drying during
short outages (less than 3 days). Short outages sometimes tend to be longer as other
maintenance requirements emerge when the unit is off, therefore, and so it is recommended
that all shut downs requiring the draining of the boiler should have reheater drying.
As the literature has elaborated, boiler layup and storage to protect the boiler from offline
corrosion is important. The circulation of dehumidified air is the easiest solution in the South
African environment where tubes need to be worked on and the dry air can be switched off
and restarted when work is complete. If this cannot be achieved, once forced drying has been

- 60 -
completed and the steam replaced by air, control air from the power station which has
desiccant dryers can be supplied to the reheater to further dry the air inside the reheaters.
Boiler shut down procedures can only be effective if they are followed. The operator logs
should be checked at random to determine if operators are following the procedure. An online
dew point instrument can be installed to monitor the dew point during the shutdown. This
will help in tracking the effectiveness of all shut downs.
Spray water valves should be maintained such that they are not passing to ensure no water
enters the system during drying. Compressors should be well maintained and checked
regularly. When maintenance is required, backup compressors should be available in the
event of a shutdown requiring drying.
Further test work can be conducted at all power stations to determine if their turbine forced
cooling compressor is sufficient to perform the drying. The equipment used during this test
was effective for dew point and relative humidity testing. Modifications to the plant to install
dedicated dew point temperature test point which are close to the reheater tubes which have
no loops to prevent condensate build up with easy connection will assist in future tests.
- 61 -
REFERENCES
[1] I. N. Kessides, Z. Bogetic and L. Maurer, “Current and Forthcoming Issues in the
South African Sector,” World Bank Poilcy Research Working Paper, 2007.
[2] Eskom Holdings SOC Ltd, “Integrated Results Presentation for the year ended 31
March 2013,” Eskom Holdings SOC Ltd, 31 March 2013. [Online]. Available:
http://eskom.ensight-cdn.com/content/Results_presentation31March2013f.pdf.
[Accessed 08 August 2013].
[3] Eskom Holdings SOC Ltd, “Integrated Report 2013,” 31 March 2013. [Online].
Available:
http://overendstudio.co.za/online_reports/eskom_ar2013/financials/pdf/full.pdf.
[Accessed 8 August 2013].
[4] World Energy Council, “Performance of Generating Plant: New Metrics for Industry
in Transition,” World Energy Council, London, 2010.
[5] Eskom Holdings SOC Ltd, “Integrated Results Presentation for the year ended 31
March 2012,” 31 March 2012. [Online]. Available:
http://www.eskom.co.za/content/Eskomresults31Mar2012media_presFINAL~3.pdf..
[Accessed 22 February 2013].
[6] B. C. Syrett, “Corrosion Control in Electric Power Plants-Success Stories,”
Corrosion Science, vol. 35, no. 5-8, pp. 1189-1198, 1993.
[7] S. A. Noori and J. W. Price, “A risk approach to management of boiler tube
thinning,” Nuclear Engineering and Design, vol. 236, no. 4, pp. 405-414, 2006.
[8] J. N. Harb and E. E. Smith, “Fireside Corrosion in PC-Fired Boilers,” Progress in
Energy and Combustion Science, vol. 16, no. 3, pp. 169-190, 1990.
[9] R. B. Dooley and W. P. McNaughton, Boiler Tube Failures: Theory and Practice,
vol. III, California: Electric Power Research Institute, 1996.
[10] EPRI, “Boiler and Heat Recovery Steam Generator,” Palo Alto, CA, 2007.
[11] Babcock & Wilcox Power Generation Group, “Plant Service Bulletin: Reheaters:
Out of Service Corrosion,” [Online]. Available:
http://www.babcock.com/C7ABD731-B32B-4D29-962E-
9980D32FE6AE/FinalDownload/DownloadId-
26480F1128A8015EAFCC72DEC59A9FD6/C7ABD731-B32B-4D29-962E-
9980D32FE6AE/library/Documents/psb-37.pdf. [Accessed 13 January 2014].
[12] Eskom Holdings SOC Ltd, Lethabo Power Station: Process Flow Diagaram, 2001.
[13] Eskom Holdings SOC Ltd, Top 5: Unit Shutdown Procedures, 2011.
[14] Eskom Holdings SOC Ltd, Reheater Evacuation/Off Load Corrosion, 2010.
[15] Eskom Holdings SOC Ltd, Reheater Drying and Boiler Force Cooling, 2011.
[16] J. B. Kitto and S. C. Stultz, Steam its generation and use, Forty-first ed., Ohio: The
Babcock & Wilcox Company, 2005.
[17] A. Barrett, E. L. Brown, S. H. Dawson, G. Nicholson, J. Payton, L. Rowlands, J.
Stoton, A. Szold and F. R. Thompson, Modern Power Station Practice, Vols. 2:
Mechanical (Boilers, Fuel- And Ah Handling Plant), Oxford, New York, Toronto,
Australia: Pergamon Press Ltd, 1971.
[18] P. Kiamah, Power Generation Handbook: Selection, Applications, Operation, and

- 62 -
Maintenance, New York, Chicago, San Francisco, Lisbon, London, Madrid, Mexico
City, Milan, New Delhi, San Juan, Seoul, Singapore, Sydney, Toronto: McGRAW-
HILL, 2003.
[19] E. B. Woodruff, H. B. Lammers and T. F. Lammers, Steam Plant Operation, Ninth
ed., New York, Chicago, San Francisco, Lisbon, London, Madrid, Mexico City,
Milan, New Delhi, San Juan, Seoul, Singapore, Sydney, Toronto: McGraw-Hill,
2012.
[20] Eskom Holdings SOC Ltd, Introduction to Boilers (Training Manual), Midrand:
Eskom Academy of Learning, 2004.
[21] K. J. Galt, “Cycle Chemistry for Eskom's New 4800 MW Supercritical Stations,” in
Ninth International Conference on Cycle Chemistry in Fossil and Combined-Cycle
Plants with Heat Recovery Steam Generators, Boston, Massachusetts,USA, 2009.
[22] E. A. Avallone, T. Baumeister III and A. Sadegh, Marks' Standard Handbook for
Mechanical Engineers, Mcgraw-Hill Professional, 2006.
[23] E. Hu, Y. Yang and A. Nishimura, “Solar Aided Power Generation: Generating
“Green” Power from Conventional Fossil Fuelled Power Stations,” in Thermal
Power Plants, InTech, 2012.
[24] J. A. Mathews, “Challenges in Cycle Chemistry,” in Ninth International Conference
on Cycle Chemistry in Fossil and Combined-Cycle Plants with Heat Recovery Steam
Generators, Boston, Massachusetts, USA, 2009.
[25] A. U. Malik, I. Andijani, M. Mobin, F. Al-Muaili and M. Al-Hajri, “Corrosion of
Boiler Tubes Some Case Studies,” in 4th SWCC Acquired Experience Symposium,
Jeddah, 2005.
[26] D. French, Metallurgical failures in fossil fired boilers, John Wiley & Sons, 1993.
[27] R. F. Small and C. Wagner, “Economic Analysis of Boiler Tube Failures in NSW,”
OMMI, vol. 2, no. 2, 2003.
[28] R. Tarr, “Looking back 35 years on Boiler Tube Failures at Arnot Power Station,” in
EPRI BTFR Conference, Johannesburg, 2011.
[29] B. R. Dooley and P. W. McNaughton, “Boiler and Heat Recovery Steam Generator
Tube Failures: Theory and Practice: Volume 3: Steam Touched Tubes,” EPRI, Palo
Alto, CA, 2007.
[30] M. G. Fontana, Corrosion Engineering, Singapore: McGraw-Hill, 1987.
[31] The Corrosion Institute of Southern Africa, Corrosion Control in Southern Africa,
Kelvin: Corrosion Institue of Southern Africa, 2001.
[32] David N. French Metallurgists, “Pitting Corrosion,” David N. French Metallurgists,
[Online]. Available: http://davidnfrench.com/pitting-corrosion.html. [Accessed 24
02 2014].
[33] P. R. Roberge, Handbook of Corrosion Engineering, Second ed., New York,
Chicago, San Francisco, Lisbon, London, Madrid, Mexico City, Milan, New Delhi,
San Juan, Seoul, Singapore, Sydney, Toronto: McGraw-Hill Education, 2012.
[34] J. Matthews, “Layup Practices for Fossil Plants,” Power, vol. 157, no. 2, pp. 18-23,
2013.
[35] A. M. Heyes, “Oxygen pitting failure of a bagasse boiler tube,” Engineering Failure
Analysis, no. 8, pp. 123-131, 2001.
[36] A. Turnbull, L. N. McCartney and S. Zhou, “A model to predict the evolution of
pitting corrosion and the pit-to-crack transition incorporating statistically distributed

- 63 -
input parameters,” Corrosion Science, vol. 48, no. 8, pp. 2084-2105, 2006.
[37] K. Ranjbar, “Failure analysis of boiler cold and hot reheater tubes,” Engineering
Failure Analysis, no. 14, pp. 620-625, 2006.
[38] S. J. Green, “Methods of Preventing Steam Generator Failure or Degredation,”
International Journal of Pressure Vessels and Piping, vol. 25, no. 1-4, pp. 359-391,
1986.
[39] G. S. Frankel, “Pitting corrosion of metals a review of critical factors,” Journal of
the Electrochemical Society, vol. 145, no. 6, pp. 2186-2198, 1998.
[40] M. Nunez, Ed., Prevention of metal corrosion: new research, Nova Publishers, 2007.
[41] H. Qua, K. ChwinChieh, T. ChinSeong, W. Xin and O. JongBoon, “Fast
identification of O2 corrosion in economiser tubes,” Engineering Failure Analysis,
no. 18, pp. 2201-2210, 2011.
[42] S. Chaudhuri, “Some aspects of metallurgical assessment of boiler tube-Basic
principles and case studies,” Materials Science and Engineering A, vol. 432, pp. 90-
99, 2006.
[43] R. Singh, “Some case histories of failure of reheater tubes,” in National Workshop
on Boiler Corrosion, Jamshedpur, India, 1995.
[44] Innogy, “Technical Procedure: Management of Plant Modifications: Part 2: Long
Term Storage of Power Station Plant,” Innogy Olc, Wiltshire, 2001.
[45] P. Mayer, H. J. Westwood and A. V. Manolescu, “Corrosion related problems in
fossil fired boilers,” Journal or Materials for Energy Systems, vol. 2, no. 1, pp. 55-
64, 1980.
[46] F. E. Clarke, “The distinguishing characteristics of boiler tube failures,” Journal of
the American Society for Naval Engineers, vol. 64, no. 1, pp. 83-94, 1952.
[47] E. H. S. Ltd, Boiler Tube Failure Pictures, 2007.
[48] B. Dooley, “Cycling, Startup, Shutdown, and Layup Fossil Plant Cycle Chemistry
Guidelines for Operators and Chemists,” EPRI, Palo Alto, 1998.
[49] D. G. Daniels, “Innovative Lay-Up and Startup Methods,” in Ninth International
Conference on Cycle Chemistry in Fossil and Combined-Cycle Plants with Heat
Recovery Steam Generators, Boston, Massachusetts, USA, 2009.
[50] American Society of Mechanical Engineers, “Consensus of Current Practices for
Lay Up of Industrial and Utility Boilers,” ASME, New York, 1985.
[51] Munters Cargocaire, “Case Study: Dry Air Protection for a Scheduled Outage,”
[Online]. Available: http://webdh.munters.com/C7ABD731-B32B-4D29-962E-
9980D32FE6AE/FinalDownload/DownloadId-
DBA43BB5AB921024DBE5EF44221F82FE/C7ABD731-B32B-4D29-962E-
9980D32FE6AE/webdh/BrochureUploads/Case%20Study-
%20Scheduled%20Outages.pdf. [Accessed 13 January 2014].
[52] L. G. Mark, “The Relationship between Relative Humidity and the Dewpoint
Temperature in Moist Air: A Simple Conversion and Applications,” Bulletin of the
American Meteorological Society, vol. 86, no. 2, p. 225, 2005.
[53] D. W. Green, R. H. Perry and J. O. Maloney, Perry's Chemical Engineers'
Handbook, 7th ed., Chicago: McGraw-Hill, 1997.
[54] X. Lin and K. G. Hubbard, “Uncertainties of Derived Dewpoint Temperature and
Relative Humidity,” Journal of applied meteorology, vol. 43, no. 5, pp. 821-825,
2004.

- 64 -
[55] TuTiempo.net, [Online]. Available: http://www.tutiempo.net/en/Climate/Ellisras/10-
2012/681550.htm. [Accessed 12 February 2014].
[56] H. W. Coleman and W. G. Steele, Experimentation and Uncertainty Analysis for
Engineers, New York: John Wiley & Sons, 1999, p. 275.
[57] Carrier, [Online]. Available: www.alder.co. a psy 02.pdf . [Accessed 26 February
2014].

- 65 -
APPENDIX A: VACUUM PUMP PERFORMANCE
CURVE
Figure A-1 below is the pump performance curve for the Vacutronics DP-200H vacuum
pump supplied by Vac-Cent Services (Pty) Ltd
Figure A-1: Vacuum pump performance curve
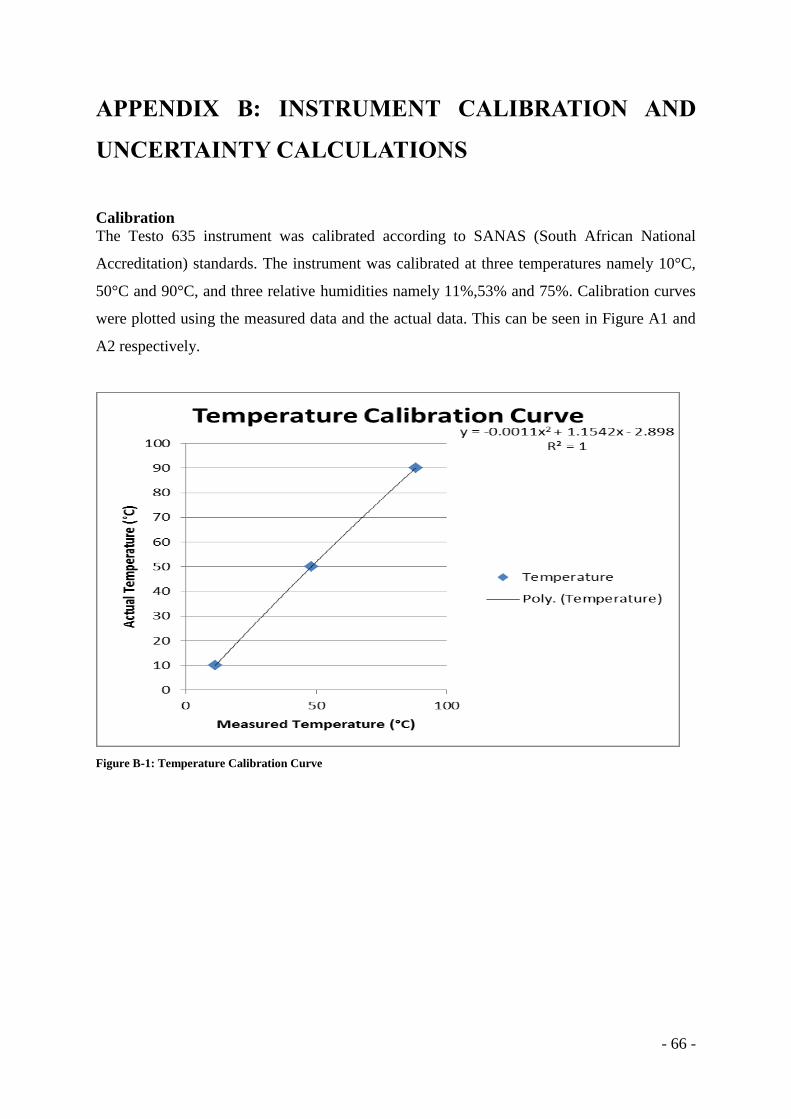
- 66 -
APPENDIX B: INSTRUMENT CALIBRATION AND
UNCERTAINTY CALCULATIONS
Calibration
The Testo 635 instrument was calibrated according to SANAS (South African National
Accreditation) standards. The instrument was calibrated at three temperatures namely 10°C,
50°C and 90°C, and three relative humidities namely 11%,53% and 75%. Calibration curves
were plotted using the measured data and the actual data. This can be seen in Figure A1 and
A2 respectively.
Figure B-1: Temperature Calibration Curve
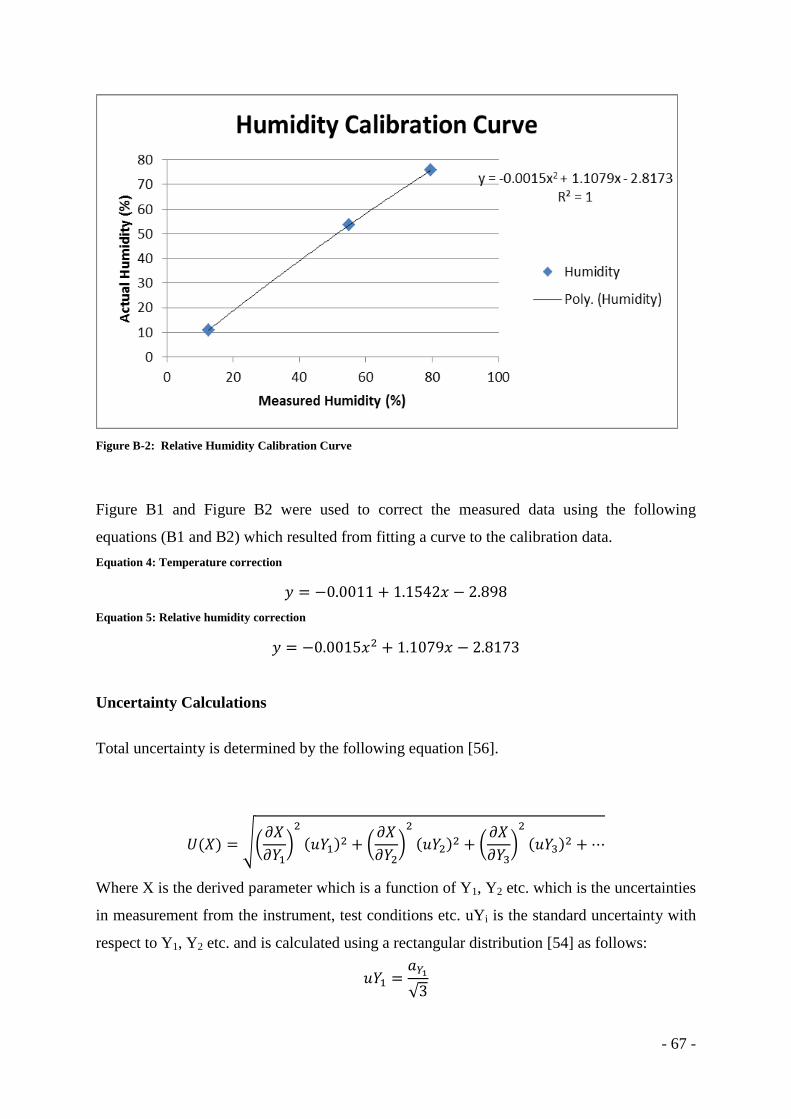
- 67 -
Figure B-2: Relative Humidity Calibration Curve
Figure B1 and Figure B2 were used to correct the measured data using the following
equations (B1 and B2) which resulted from fitting a curve to the calibration data.
Equation 4: Temperature correction
Equation 5: Relative humidity correction
Uncertainty Calculations
Total uncertainty is determined by the following equation [56].
√(
)
(
)
(
)
Where X is the derived parameter which is a function of Y1, Y2 etc. which is the uncertainties
in measurement from the instrument, test conditions etc. uYi is the standard uncertainty with
respect to Y1, Y2 etc. and is calculated using a rectangular distribution [54] as follows:
√

- 68 -
Dew point temperature (Td) is a function of relative humidity (RH) and dry bulb temperature
(T) and is expressed by the following equation.
⌈ (
)
⌉
Where:
Rw is the gas constant for water vapour (461.5JK-1kg-1)
Hvap is the enthalpy of vaporization
(Hvap = 2.501 x 10⁶ J.K-1at T = 273.15 K and Hvap = 2.257 x 10⁶ J.K-1 at T = 373.15 K)
Thus the uncertainty in dew point temperatures is expressed by Error! Reference source not
found..
Equation 6: Uncertainty in calculated dew point temperature (Td)
√(
)
(
)
The partials derivatives are as follows:
(
( )
⁄
)
⁄
(
( )
⁄
)
As per the Testo 635 manufacturer specification:
Uncertainty in temperature measurements aT = ±0.2°C for T = -10° - 50°C and ±0.5°C for
above 50°C
Uncertainty for relative humidity aRH = ±2% ( +2 to 98% RH)
The uncertainty can also be expressed by the following non-dimensional equation.
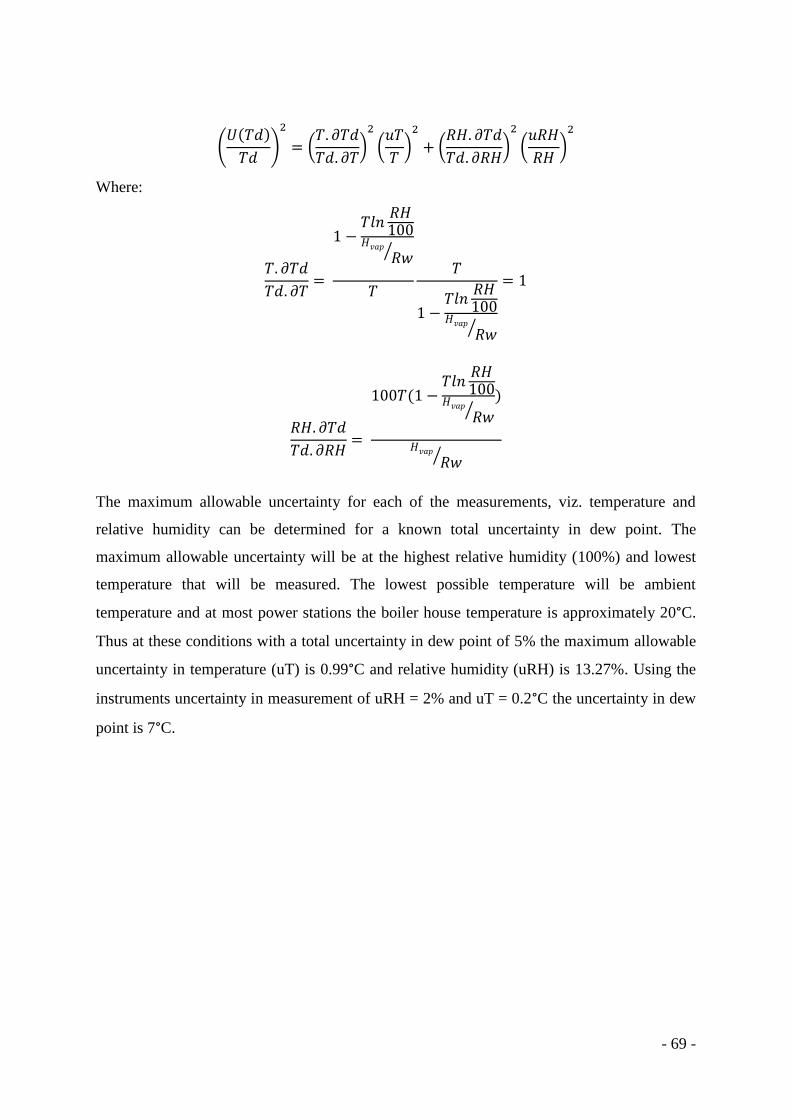
- 69 -
(
)
(
)
(
)
(
)
(
)
Where:
⁄
⁄
⁄
⁄
The maximum allowable uncertainty for each of the measurements, viz. temperature and
relative humidity can be determined for a known total uncertainty in dew point. The
maximum allowable uncertainty will be at the highest relative humidity (100%) and lowest
temperature that will be measured. The lowest possible temperature will be ambient
temperature and at most power stations the boiler house temperature is approximately 20°C.
Thus at these conditions with a total uncertainty in dew point of 5% the maximum allowable
uncertainty in temperature (uT) is 0.99°C and relative humidity (uRH) is 13.27%. Using the
instruments uncertainty in measurement of uRH = 2% and uT = 0.2°C the uncertainty in dew
point is 7°C.

- 70 -
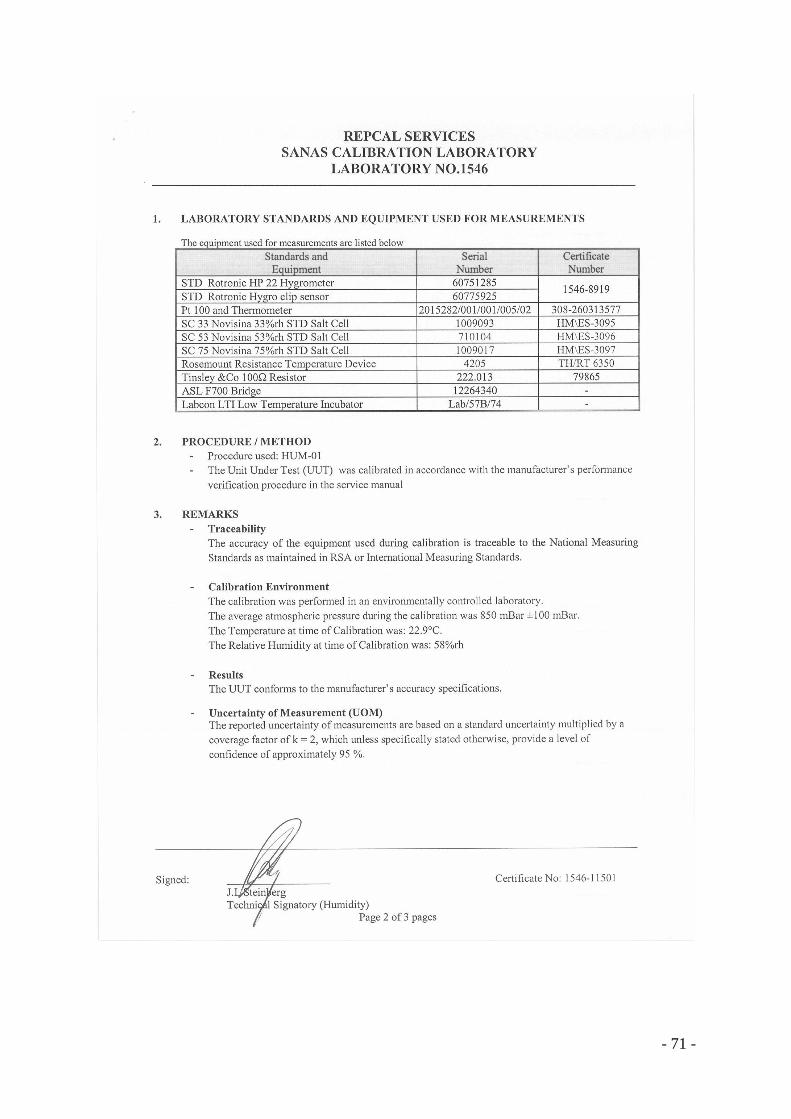
- 71 -

- 72 -
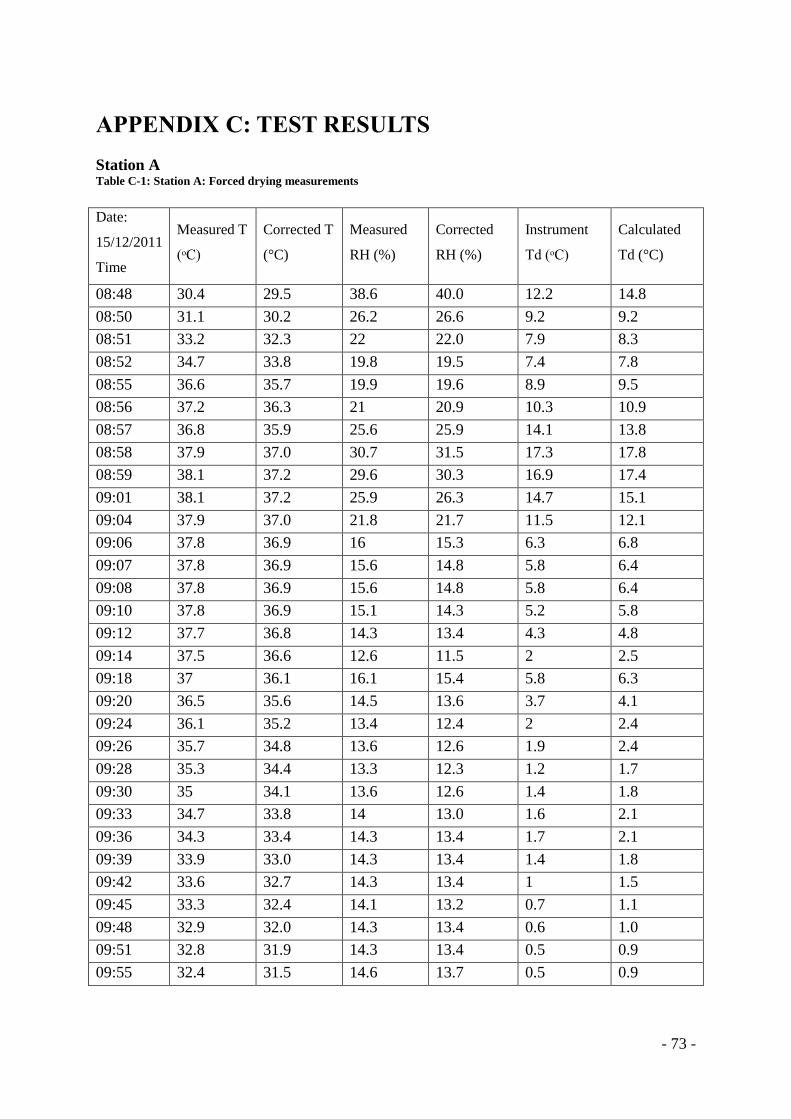
- 73 -
APPENDIX C: TEST RESULTS
Station A Table C-1: Station A: Forced drying measurements
Date:
15/12/2011
Time
Measured T
(ᵒC)
Corrected T
(°C)
Measured
RH (%)
Corrected
RH (%)
Instrument
Td (ᵒC)
Calculated
Td (°C)
08:48 30.4 29.5 38.6 40.0 12.2 14.8
08:50 31.1 30.2 26.2 26.6 9.2 9.2
08:51 33.2 32.3 22 22.0 7.9 8.3
08:52 34.7 33.8 19.8 19.5 7.4 7.8
08:55 36.6 35.7 19.9 19.6 8.9 9.5
08:56 37.2 36.3 21 20.9 10.3 10.9
08:57 36.8 35.9 25.6 25.9 14.1 13.8
08:58 37.9 37.0 30.7 31.5 17.3 17.8
08:59 38.1 37.2 29.6 30.3 16.9 17.4
09:01 38.1 37.2 25.9 26.3 14.7 15.1
09:04 37.9 37.0 21.8 21.7 11.5 12.1
09:06 37.8 36.9 16 15.3 6.3 6.8
09:07 37.8 36.9 15.6 14.8 5.8 6.4
09:08 37.8 36.9 15.6 14.8 5.8 6.4
09:10 37.8 36.9 15.1 14.3 5.2 5.8
09:12 37.7 36.8 14.3 13.4 4.3 4.8
09:14 37.5 36.6 12.6 11.5 2 2.5
09:18 37 36.1 16.1 15.4 5.8 6.3
09:20 36.5 35.6 14.5 13.6 3.7 4.1
09:24 36.1 35.2 13.4 12.4 2 2.4
09:26 35.7 34.8 13.6 12.6 1.9 2.4
09:28 35.3 34.4 13.3 12.3 1.2 1.7
09:30 35 34.1 13.6 12.6 1.4 1.8
09:33 34.7 33.8 14 13.0 1.6 2.1
09:36 34.3 33.4 14.3 13.4 1.7 2.1
09:39 33.9 33.0 14.3 13.4 1.4 1.8
09:42 33.6 32.7 14.3 13.4 1 1.5
09:45 33.3 32.4 14.1 13.2 0.7 1.1
09:48 32.9 32.0 14.3 13.4 0.6 1.0
09:51 32.8 31.9 14.3 13.4 0.5 0.9
09:55 32.4 31.5 14.6 13.7 0.5 0.9
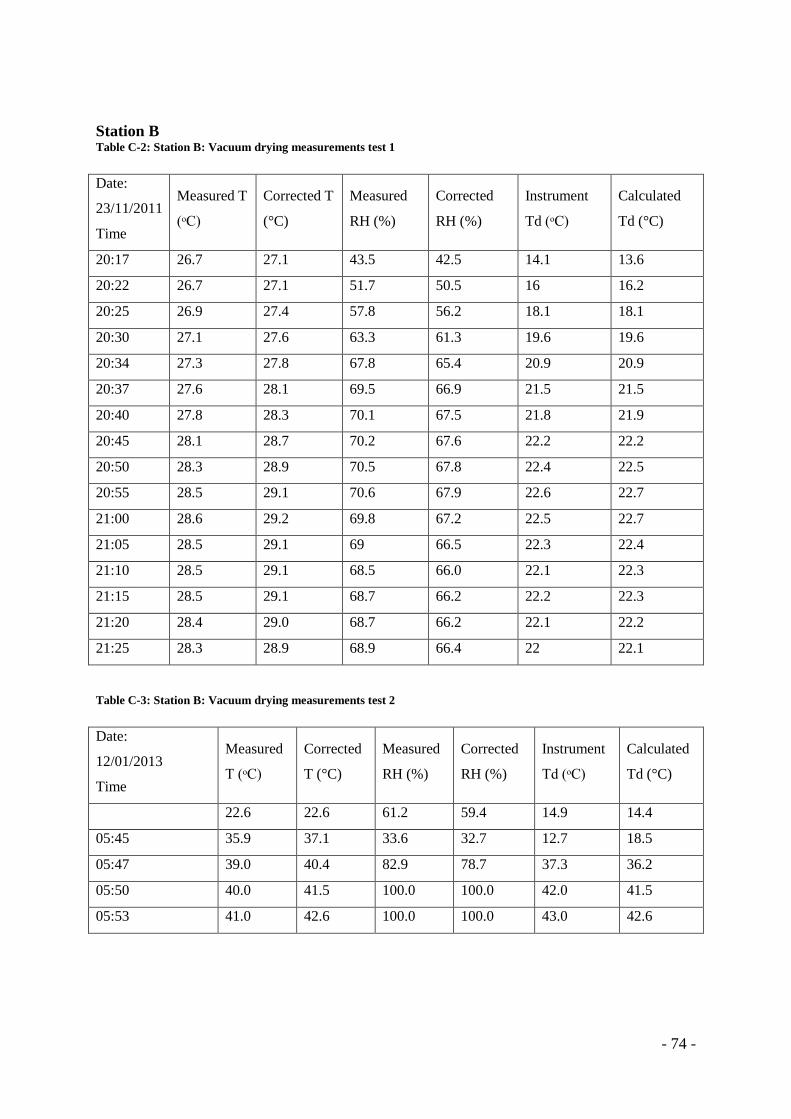
- 74 -
Station B Table C-2: Station B: Vacuum drying measurements test 1
Date:
23/11/2011
Time
Measured T
(ᵒC)
Corrected T
(°C)
Measured
RH (%)
Corrected
RH (%)
Instrument
Td (ᵒC)
Calculated
Td (°C)
20:17 26.7 27.1 43.5 42.5 14.1 13.6
20:22 26.7 27.1 51.7 50.5 16 16.2
20:25 26.9 27.4 57.8 56.2 18.1 18.1
20:30 27.1 27.6 63.3 61.3 19.6 19.6
20:34 27.3 27.8 67.8 65.4 20.9 20.9
20:37 27.6 28.1 69.5 66.9 21.5 21.5
20:40 27.8 28.3 70.1 67.5 21.8 21.9
20:45 28.1 28.7 70.2 67.6 22.2 22.2
20:50 28.3 28.9 70.5 67.8 22.4 22.5
20:55 28.5 29.1 70.6 67.9 22.6 22.7
21:00 28.6 29.2 69.8 67.2 22.5 22.7
21:05 28.5 29.1 69 66.5 22.3 22.4
21:10 28.5 29.1 68.5 66.0 22.1 22.3
21:15 28.5 29.1 68.7 66.2 22.2 22.3
21:20 28.4 29.0 68.7 66.2 22.1 22.2
21:25 28.3 28.9 68.9 66.4 22 22.1
Table C-3: Station B: Vacuum drying measurements test 2
Date:
12/01/2013
Time
Measured
T (ᵒC)
Corrected
T (°C)
Measured
RH (%)
Corrected
RH (%)
Instrument
Td (ᵒC)
Calculated
Td (°C)
22.6 22.6 61.2 59.4 14.9 14.4
05:45 35.9 37.1 33.6 32.7 12.7 18.5
05:47 39.0 40.4 82.9 78.7 37.3 36.2
05:50 40.0 41.5 100.0 100.0 42.0 41.5
05:53 41.0 42.6 100.0 100.0 43.0 42.6
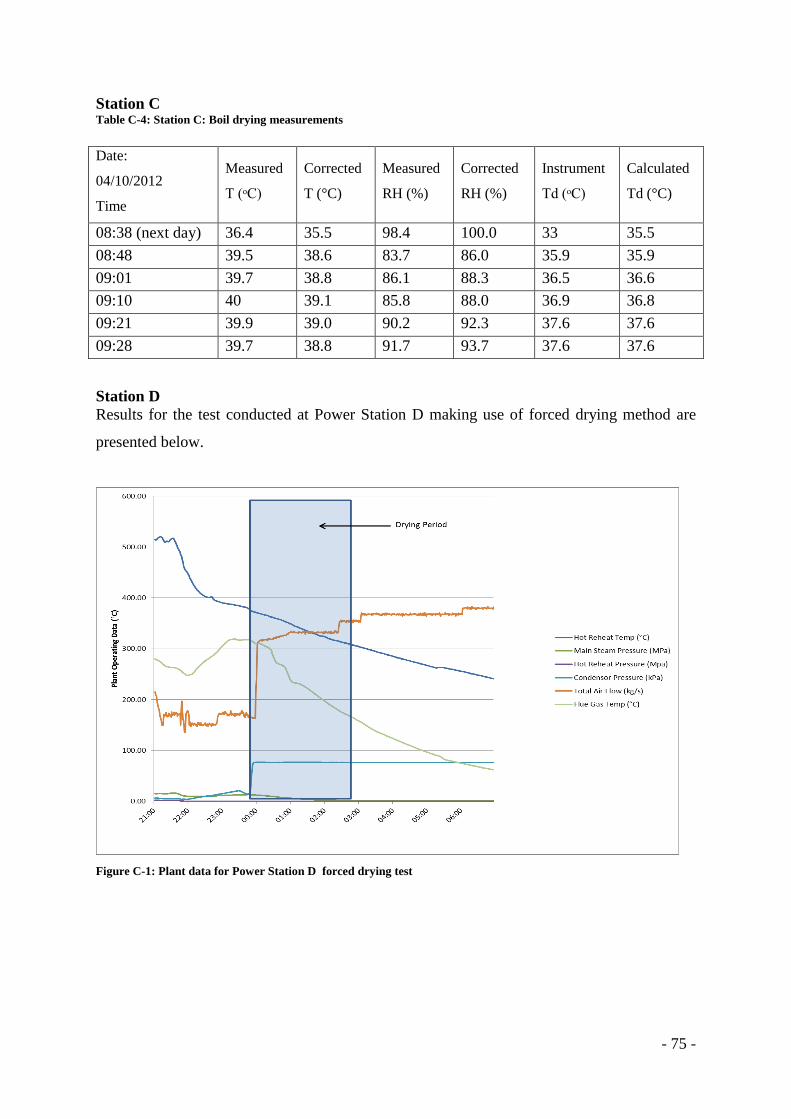
- 75 -
Station C Table C-4: Station C: Boil drying measurements
Date:
04/10/2012
Time
Measured
T (ᵒC)
Corrected
T (°C)
Measured
RH (%)
Corrected
RH (%)
Instrument
Td (ᵒC)
Calculated
Td (°C)
08:38 (next day) 36.4 35.5 98.4 100.0 33 35.5
08:48 39.5 38.6 83.7 86.0 35.9 35.9
09:01 39.7 38.8 86.1 88.3 36.5 36.6
09:10 40 39.1 85.8 88.0 36.9 36.8
09:21 39.9 39.0 90.2 92.3 37.6 37.6
09:28 39.7 38.8 91.7 93.7 37.6 37.6
Station D
Results for the test conducted at Power Station D making use of forced drying method are
presented below.
Figure C-1: Plant data for Power Station D forced drying test
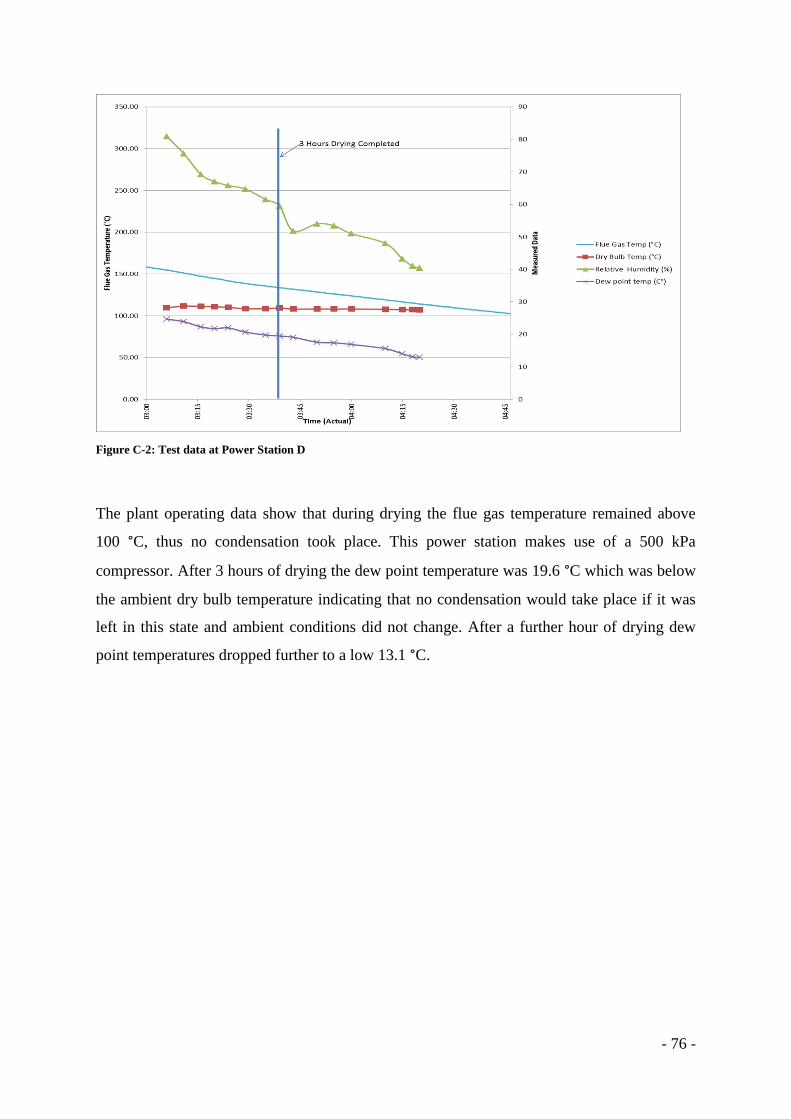
- 76 -
Figure C-2: Test data at Power Station D
The plant operating data show that during drying the flue gas temperature remained above
100 °C, thus no condensation took place. This power station makes use of a 500 kPa
compressor. After 3 hours of drying the dew point temperature was 19.6 °C which was below
the ambient dry bulb temperature indicating that no condensation would take place if it was
left in this state and ambient conditions did not change. After a further hour of drying dew
point temperatures dropped further to a low 13.1 °C.
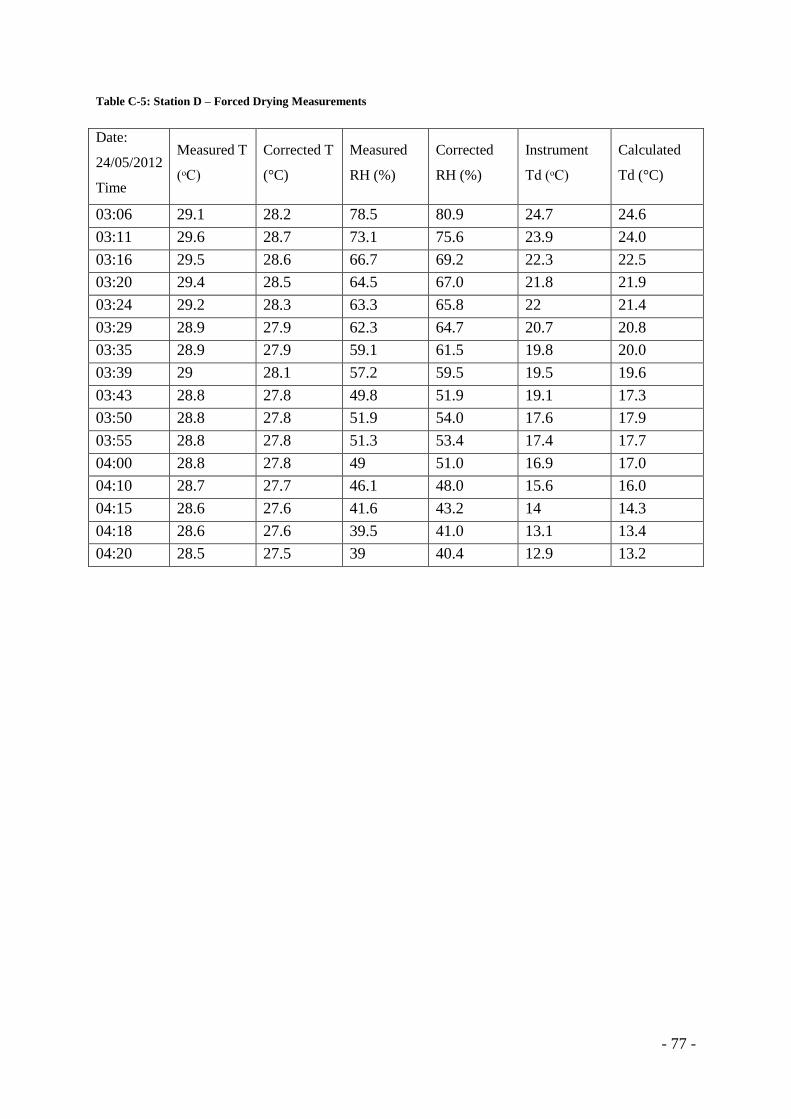
- 77 -
Table C-5: Station D – Forced Drying Measurements
Date:
24/05/2012
Time
Measured T
(ᵒC)
Corrected T
(°C)
Measured
RH (%)
Corrected
RH (%)
Instrument
Td (ᵒC)
Calculated
Td (°C)
03:06 29.1 28.2 78.5 80.9 24.7 24.6
03:11 29.6 28.7 73.1 75.6 23.9 24.0
03:16 29.5 28.6 66.7 69.2 22.3 22.5
03:20 29.4 28.5 64.5 67.0 21.8 21.9
03:24 29.2 28.3 63.3 65.8 22 21.4
03:29 28.9 27.9 62.3 64.7 20.7 20.8
03:35 28.9 27.9 59.1 61.5 19.8 20.0
03:39 29 28.1 57.2 59.5 19.5 19.6
03:43 28.8 27.8 49.8 51.9 19.1 17.3
03:50 28.8 27.8 51.9 54.0 17.6 17.9
03:55 28.8 27.8 51.3 53.4 17.4 17.7
04:00 28.8 27.8 49 51.0 16.9 17.0
04:10 28.7 27.7 46.1 48.0 15.6 16.0
04:15 28.6 27.6 41.6 43.2 14 14.3
04:18 28.6 27.6 39.5 41.0 13.1 13.4
04:20 28.5 27.5 39 40.4 12.9 13.2

- 78 -
Station E
Results for the test conducted at Power Station E making use of forced drying method are
presented below.
Figure C-3: Plant data for Power Station E forced drying test
Figure C-4: Test Data for Power Station E

- 79 -
The plant operating data show that during drying the flue gas temperature remained above
100 °C, thus no condensation took place. This power station makes use of a 180 kPa
compressor. After 2 hours of drying the dew point temperature was 13 °C which was below
the ambient dry bulb temperature indicating that no condensation would take place if it was
left in this state and ambient conditions did not change. The ambient dew point temperature
was 13.9 °C suggesting that the steam inside the reheaters was replaced with ambient air.
Table C-6: Station E – Forced Drying Measurements
Date:
14/12/2012
Time
Measured
T (ᵒC)
Corrected
T (°C)
Measured
RH (%)
Corrected
RH (%)
Instrument
Td (ᵒC)
Calculated
Td (°C)
Ambient 18.7 18.3 79.1 75.4 15 13.9
03:30 23.5 23.6 60.2 58.4 15.4 15.1
03:35 24 24.2 57.2 55.6 15.1 14.9
03:40 24.1 24.3 50.7 49.5 13.3 13.2
03:45 24.3 24.5 50.5 49.3 13.2 13.4
03:50 24.1 24.3 50.5 49.3 13.2 13.2
03:55 24 24.2 50.3 49.1 13 13.0
04:00 23.8 23.9 51.1 49.9 13.1 13.0

- 80 -
Station F
Results for the test conducted at Power Station F making use of vacuum drying method are
presented below.
Figure C-5: Plant data for Power Station F vacuum drying test
Figure C-6: Test data for Power Station F

- 81 -
The plant operating data show that during drying the flue gas temperature dropped below 100
°C because of boiler force cooling which is part of this power stations procedure. This power
station makes use of the condenser vacuum to draw out the steam in the reheaters and replace
with air entering from an air inlet valve. Initially while drying took place, the dew point and
humidity were decreasing but as soon as the condenser vacuum was broken, indicating drying
was completed, a representative sample of the fluid in the reheater was drawn out which had
a relative humidity of 100% and dew point of 14 °C indicating an ineffective drying. The
reason as to why the measurements initially dropped was that the small portable vacuum
pump could not significantly draw against the condenser vacuum.
Table C-7: Station F – Vacuum Drying Measurements
Date:
01/06/2012
Time
Measured
T (ᵒC)
Corrected
T (°C)
Measured
RH (%)
Corrected
RH (%)
Instrument
Td (ᵒC)
Calculated
Td (°C)
05:15:00 13.4 11.8 58.4 60.8 4.5 4.5
05:20:00 13.6 12.0 61.5 63.9 5.7 5.4
05:49:00 13.9 12.3 61.5 63.9 5.4 5.7
05:54:00 13.8 12.2 63.4 65.9 6.5 6.0
05:59:00 13.8 12.2 86.8 89.0 8.3 10.4
06:02:00 13.6 12.0 96.9 98.6 14.1 11.8
06:42:00 13.3 11.7 90.9 92.9 10.7 10.6
06:45:00 13.2 11.5 95.8 97.6 12.3 11.2
06:50:00 13.1 11.4 89.5 91.6 12.60 10.1
06:53:00 14.2 12.6 84.7 87.0 10.4 10.5
07:00:00 14.4 12.8 74.6 77.1 8.8 9.0
07:04:00 14.6 13.0 68.9 71.4 8 8.0
07:07:00 14.6 13.0 66.9 69.4 7.5 7.6
07:10:00 14.8 13.3 64.8 67.3 7.4 7.4
07:15:00 14.9 13.4 63.7 66.2 7.2 7.2
07:19:00 15.1 13.6 63 65.5 7.2 7.3
07:23:00 15.2 13.7 62.7 65.1 7.3 7.3
07:27:00 15.3 13.8 61.4 63.8 7 7.1
07:29:00 15.3 13.8 60.7 63.1 7 7.0
07:33:00 15.9 14.4 83.2 85.5 11.8 12.1
07:35:00 16.1 14.6 89.8 91.9 13.5 13.3
07:36:00 16.3 14.8 98.3 99.9 13.8 14.8

- 82 -
Station G
Results for the test conducted at Power Station G making use of vacuum drying method are
presented below.
Figure C-7: Plant data for Power Station G vacuum drying test
Figure C-8: Test data for Power Station G

- 83 -
The plant operating data show that during drying the flue gas temperature was above 100 °C
even though boiler force cooling took place. This power station makes use of the condenser
vacuum to draw out the steam in the reheaters and replace with air entering from an air inlet
valve. Measurements were only taken after the drying when the condenser vacuum was
broken, as the portable vacuum pump could not draw against the condenser. Soon after
measurements were taken, condensation took place in the test box and the test was terminated
to protect the equipment. The condensation in the box signifies that drying was ineffective.
Table C-8: Station G – Vacuum Drying Measurements
Date:
05/03/2013
Time
Measured T
(ᵒC)
Corrected T
(°C)
Measured
RH (%)
Corrected
RH (%)
Instrument
Td (ᵒC)
Calculated
Td (°C)
Ambient 35.0 36.2 21.8 20.6 10.1 10.6
05:46 AM 32.2 33.1 73.4 70.4 37.3 27.2
05:50 AM 34.9 36.0 63.7 61.7 42.0 27.7
05:55 AM 35.0 36.2 100.0 100.0 43.0 36.2

- 84 -
APPENDIX D: PSYCHROMETRIC CHART
A psychrometric chart is shown in Figure D-1. Taking a point on the graph on the 50%
relative humidity mark the dew point, wet bulb temperature, dry bulb temperature and
humidity ratio are shown for the specific point. It can be seen that if the point is moved along
a horizontal line the dew point temperature and humidity ratio do not change. These are
functions of water content only. The relative humidity is a function of the temperature and
will change as the point is moved in a horizontal plane. The basis of comparing the results is
thus chosen to be the dew point temperature and not just the relative humidity.
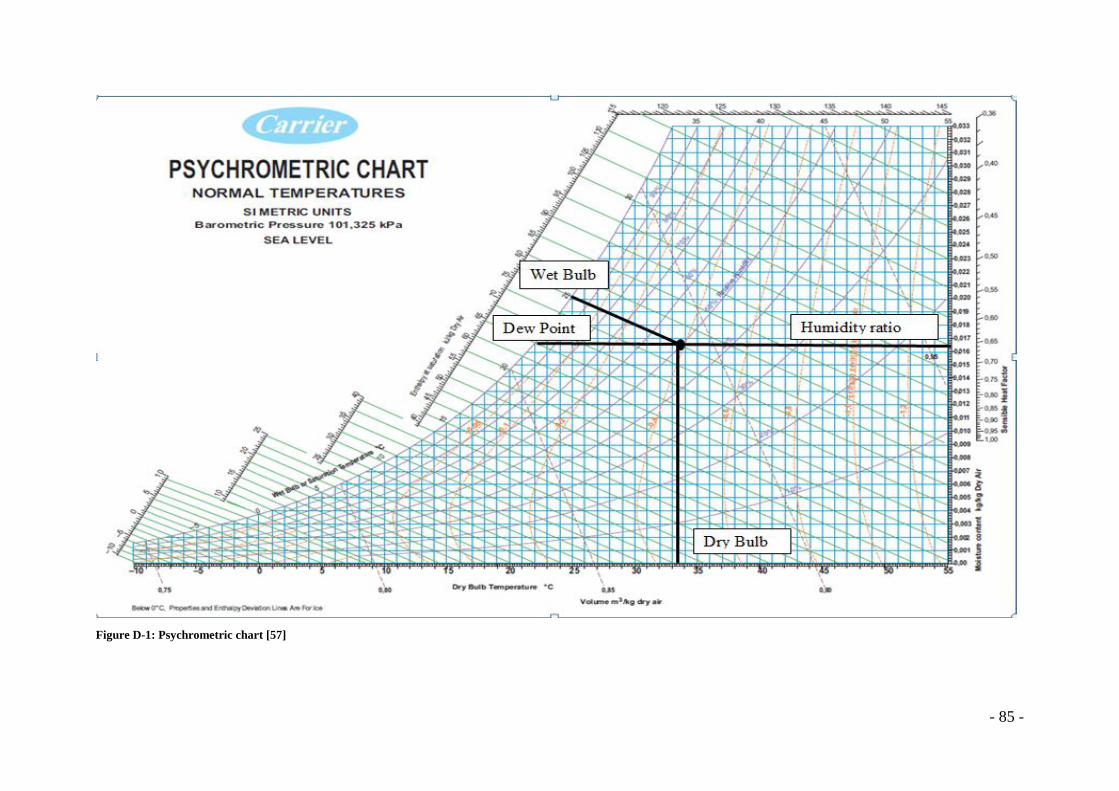
- 85 -
Figure D-1: Psychrometric chart [57]

- 86 -
APPENDIX E: FLOW CALCULATIONS
Volumetric and mass flow at Power Stations B and E are calculated below. Power Stations B
and E have exactly the same design with regards to the boiler. Power Station B makes use of
vacuum drying while Power Station E makes use of forced drying. Under normal operating
shut down, the system temperatures and pressures are the same at the time reheater drying
commences. To compare the two different drying methods used, the flow rate for the system
is calculated. The following assumptions are made for simplifying the calculation.
The flow rate is calculated in a steam free cold environment with the air inlet
temperature of 25°C. The 3 intercoolers within the compressor at Power Station E
also provides pressurised air at the same temperature as atmospheric temperature
The average density between the inlet and outlet is used
The effects of gravity are negligible as the inlet and outlet are close to the 15 m level
of the boiler house
Equal flow distribution through the reheater tubes
The fluid flowing through the system is dry air
Figure E-1 below depicts a simplified diagram of the system showing the major components
affecting the pressure drop.
Figure E-1: Flow Diagram for Power Stations B and E
The flow diagram shows that air flows from the atmosphere (under vacuum drying) or the
compressor (under forced drying) through the air inlet valve, into the reheater 1 header where
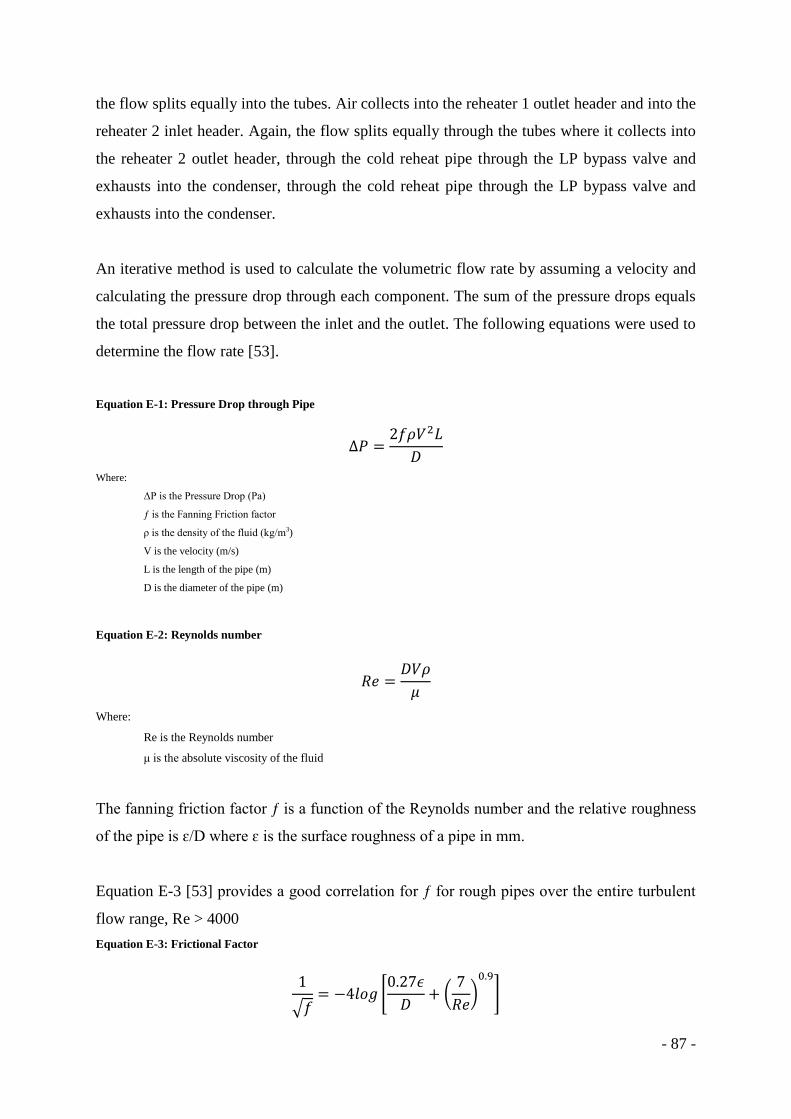
- 87 -
the flow splits equally into the tubes. Air collects into the reheater 1 outlet header and into the
reheater 2 inlet header. Again, the flow splits equally through the tubes where it collects into
the reheater 2 outlet header, through the cold reheat pipe through the LP bypass valve and
exhausts into the condenser, through the cold reheat pipe through the LP bypass valve and
exhausts into the condenser.
An iterative method is used to calculate the volumetric flow rate by assuming a velocity and
calculating the pressure drop through each component. The sum of the pressure drops equals
the total pressure drop between the inlet and the outlet. The following equations were used to
determine the flow rate [53].
Equation E-1: Pressure Drop through Pipe
Where:
ΔP is the Pressure Drop (Pa)
ƒ is the Fanning Friction factor
ρ is the density of the fluid (kg m3)
V is the velocity (m/s)
L is the length of the pipe (m)
D is the diameter of the pipe (m)
Equation E-2: Reynolds number
Where:
Re is the Reynolds number
μ is the absolute viscosity of the fluid
The fanning friction factor ƒ is a function of the Reynolds number and the relative roughness
of the pipe is ɛ D where ɛ is the surface roughness of a pipe in mm.
Equation E-3 [53] provides a good correlation for ƒ for rough pipes over the entire turbulent
flow range, Re > 4000
Equation E-3: Frictional Factor
√ [
(
)
]

- 88 -
The pressure drop when the fluid contracts into a smaller pipe or expands into a larger pipe is
given by Equation E-4.
Equation E-4: Pressure drop through expansion and contraction
Where:
K is the velocity head loss coefficient
The velocity head loss coefficient K is approximated for turbulent flow by Equation E-5 for
contraction.
Equation E-5: K for contraction
(
)
Where:
A1 is the area of the smaller pipe
A2 is the area of the larger pipe
The frictional losses ƒe for expansion is approximated for turbulent flow by Equation E-6.
Equation E-6: ƒ for expansion
(
)
The frictional losses ƒ for flow through a valve is given by a K value specific to the valve
type and position open of the valve. The pressure loss is calculated as mentioned above in
Equation E-1.

- 89 -
The density of the fluid is calculated by Equation E-7 below.
Equation E-7: Density of Air
Where:
P is the pressure of the fluid (Pa)
Rair is the gas constant for dry air (287.058 J/kg.K)
T is the temperature of the fluid (K)
Table E-1 below shows all the input data for calculating the fluid flow.
Table E-1: Input data for flow calculations
Atmospheric pressure 83000 Pa
Dry Air Temperature 25°C
Forced cooling pressure 263000 Pa(g)
Condenser pressure 12500 Pa(a) (Average condenser pressure
during drying)
Total ΔP (Forced) 180000 Pa
Total ΔP (Vacuum) 70500 Pa
Average air density (Forced) 2.02 kg/m3
Average air density (Vacuum) 0.56 kg/m3
Ɛ (Roughness of Commercial Steel) 0.0457
K (Air inlet gate valve ¾ open) [53] 0.9
K (LP Bypass gate valve ½ open) [53] 4.5
Air inlet pipe dimensions (L x ID) 90m x 0.15m
Cold Reheat pipe dimension (L x ID) 166.857m x 0.674
Reheater 1 tube dimensions (L x ID) 68m x 0.0428m
Number of reheater 1 tubes 1280
Reheater 2 tube dimensions (L x ID) 34.372m x 0.0438m
Number of reheater 2 tubes 800
RH1 Inlet/Outlet Header dimensions (L x ID) 22m x 0.67m
RH2 Inlet/Outlet Header dimensions (L x ID) 22.151m x 0.53m
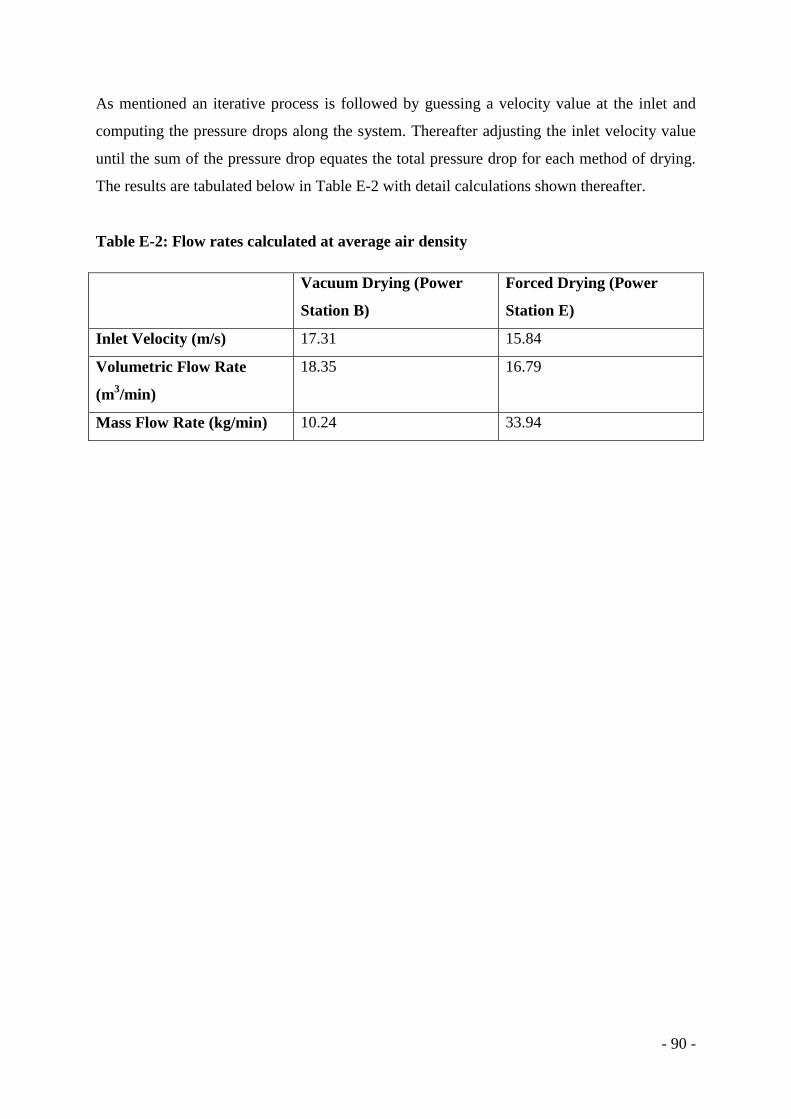
- 90 -
As mentioned an iterative process is followed by guessing a velocity value at the inlet and
computing the pressure drops along the system. Thereafter adjusting the inlet velocity value
until the sum of the pressure drop equates the total pressure drop for each method of drying.
The results are tabulated below in Table E-2 with detail calculations shown thereafter.
Table E-2: Flow rates calculated at average air density
Vacuum Drying (Power
Station B)
Forced Drying (Power
Station E)
Inlet Velocity (m/s) 17.31 15.84
Volumetric Flow Rate
(m3/min)
18.35
16.79
Mass Flow Rate (kg/min) 10.24 33.94

- 91 -
Forced Drying Calculations
Forced Drying
Input
Air Properties
Temperature (K) 298.15
Density (kg/m3) 2.02
Dynamic Viscosity (kg/m.s-1) 1.84E-05
Inlet Pressure (Compressor Pa) 263000
Outlet Pressure (Atmospheric Pa) 83000
R (J/kg.K) 287.058
Guess Velocity (m2/s) 15.84
Position 1 to 2 2 to 3 3 to 4 4 to 5 5 to 6 6 to 7 7 to 8 8 to 9 9 to 10 10 to 11 11 to 12 12 to 13 13 to 14 14 to 15 15 to 16 16 to 17
Description Straight Pipe Valve Straight Pipe
Expansion into
Header
Contraction
into Tubes Single Tube
Expansion
into Header Straight Pipe
Expansion
into Header
Contraction
into Tubes Single Tube
Expansion
into Header
Expansion
into Pipe Straight Pipe Valve Straight Pipe
Pipe Internal Diameter (m) 0.15 0.15 0.15 0.67 0.0428 0.0428 0.67 0.53 0.527 0.0428 0.0438 0.53 0.674 0.674 0.674 0.674
Pipe Length (m) 80 1 10 22 68 68 22.151 5 22.151 68 34.372 22.151 68 146.857 1 20
Area (m2) 0.02 0.02 0.02 0.35 0.00 0.00 0.35 0.22 0.22 0.00 0.00 0.22 0.36 0.36 0.36 0.36
P1 (Pa) 280000.00 277658.14 271575.90 271283.17 100130.36 100100.73 100097.87 100097.87 100097.57 100097.57 100022.09 100019.39 100019.38 100019.38 100016.67 100000.44
P2 (Pa) 277658.14 271575.90 271283.17 100130.36 100100.73 100097.87 100097.87 100097.57 100097.57 100022.09 100019.39 100019.38 100019.38 100016.67 100000.44 100000.08
ΔP (Pa) 2341.86 6082.24 292.73 171152.80 29.63 2.86 0.00 0.30 0.00 75.48 2.70 0.01 0.00 2.71 16.23 0.37
Velocity (m/s) 15.84 15.84 15.84 0.79 0.79 0.15 0.15 1.27 1.27 1.27 0.23 0.23 1.25 0.78 0.78 0.78
Re 261291.96 261291.96 261291.96 58498.20 3736.90 715.42 11199.40 73950.55 73531.97 5971.86 1105.92 13382.11 92981.16 57494.58 57494.58 57494.58
K 0.90 113.12 0.50 0.01 0.00 0.50 0.03 0.00 4.50
f 15.19 15.19 7.20 14.32 7.87 13.99 13.99
1/Sqrt f 0.00 0.00 0.02 0.00 0.02 0.01 0.01
Volumetric Flow (m3/s) 0.28 0.28 0.28 0.28 0.00 0.00 0.05 0.28 0.28 0.00 0.00 0.05 0.28 0.28 0.28 0.28
Volumetric Flow (m3/min) 16.79 16.78974696 0.000441901
Output
ΔP (Pa) Inlet to Outlet Calculated -180000.00
ΔP (Pa) Inlet to Outlet Set -180000.00
Mass Flow (kg/min) 33.94
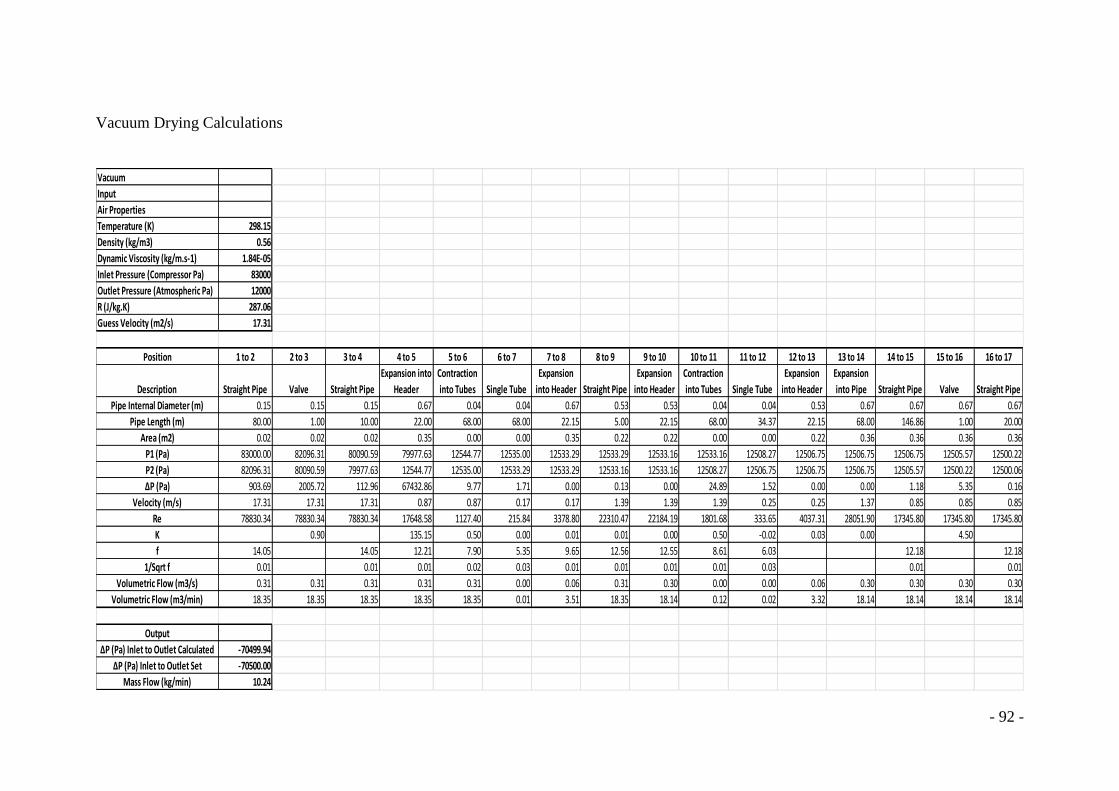
- 92 -
Vacuum Drying Calculations
Vacuum
Input
Air Properties
Temperature (K) 298.15
Density (kg/m3) 0.56
Dynamic Viscosity (kg/m.s-1) 1.84E-05
Inlet Pressure (Compressor Pa) 83000
Outlet Pressure (Atmospheric Pa) 12000
R (J/kg.K) 287.06
Guess Velocity (m2/s) 17.31
Position 1 to 2 2 to 3 3 to 4 4 to 5 5 to 6 6 to 7 7 to 8 8 to 9 9 to 10 10 to 11 11 to 12 12 to 13 13 to 14 14 to 15 15 to 16 16 to 17
Description Straight Pipe Valve Straight Pipe
Expansion into
Header
Contraction
into Tubes Single Tube
Expansion
into Header Straight Pipe
Expansion
into Header
Contraction
into Tubes Single Tube
Expansion
into Header
Expansion
into Pipe Straight Pipe Valve Straight Pipe
Pipe Internal Diameter (m) 0.15 0.15 0.15 0.67 0.04 0.04 0.67 0.53 0.53 0.04 0.04 0.53 0.67 0.67 0.67 0.67
Pipe Length (m) 80.00 1.00 10.00 22.00 68.00 68.00 22.15 5.00 22.15 68.00 34.37 22.15 68.00 146.86 1.00 20.00
Area (m2) 0.02 0.02 0.02 0.35 0.00 0.00 0.35 0.22 0.22 0.00 0.00 0.22 0.36 0.36 0.36 0.36
P1 (Pa) 83000.00 82096.31 80090.59 79977.63 12544.77 12535.00 12533.29 12533.29 12533.16 12533.16 12508.27 12506.75 12506.75 12506.75 12505.57 12500.22
P2 (Pa) 82096.31 80090.59 79977.63 12544.77 12535.00 12533.29 12533.29 12533.16 12533.16 12508.27 12506.75 12506.75 12506.75 12505.57 12500.22 12500.06
ΔP (Pa) 903.69 2005.72 112.96 67432.86 9.77 1.71 0.00 0.13 0.00 24.89 1.52 0.00 0.00 1.18 5.35 0.16
Velocity (m/s) 17.31 17.31 17.31 0.87 0.87 0.17 0.17 1.39 1.39 1.39 0.25 0.25 1.37 0.85 0.85 0.85
Re 78830.34 78830.34 78830.34 17648.58 1127.40 215.84 3378.80 22310.47 22184.19 1801.68 333.65 4037.31 28051.90 17345.80 17345.80 17345.80
K 0.90 135.15 0.50 0.00 0.01 0.01 0.00 0.50 -0.02 0.03 0.00 4.50
f 14.05 14.05 12.21 7.90 5.35 9.65 12.56 12.55 8.61 6.03 12.18 12.18
1/Sqrt f 0.01 0.01 0.01 0.02 0.03 0.01 0.01 0.01 0.01 0.03 0.01 0.01
Volumetric Flow (m3/s) 0.31 0.31 0.31 0.31 0.31 0.00 0.06 0.31 0.30 0.00 0.00 0.06 0.30 0.30 0.30 0.30
Volumetric Flow (m3/min) 18.35 18.35 18.35 18.35 18.35 0.01 3.51 18.35 18.14 0.12 0.02 3.32 18.14 18.14 18.14 18.14
Output
ΔP (Pa) Inlet to Outlet Calculated -70499.94
ΔP (Pa) Inlet to Outlet Set -70500.00
Mass Flow (kg/min) 10.24

- 93 -


![cg';'rL - kapurkotmun.gov.np · u pBf]u btf{ -% b]vL @) xif{ kfj/ ;Dd_ &)) 3 pBf]u btf{ -@) xif{ kfj/ eGbf dfly _ !%)) ª ;= ldn sf7 lr/fgL btf{ $))) r Kfmlg{r/ pBf]u btf{ @)))](https://static.fdocuments.net/doc/165x107/60d1e26f15786f23542e5502/cgrl-u-pbfu-btf-bvl-xif-kfj-dd-3-pbfu-btf-xif-kfj.jpg)
