A retrospective investigation of selectivity for Pacific halibut CAPAM Selectivity workshop

Investigating the selectivity of weed harrowing with new methods
J RASMUSSEN*, BM BIBBY† & AP SCHOU††
*Department of Agricultural Sciences, University of Copenhagen, Denmark, †Department of
Biostatistics, University of Aarhus, Denmark, ††Eco-Advice, Jyderup, Denmark.
Summary
In six field experiments it was investigated whether row spacing, timing, direction and orientation
of post-emergence weed harrowing in spring barley influenced the selectivity and whether it is
important that increasing intensities of harrowing are generated either by increasing number of
passes or increasing driving speed. Selectivity was defined as the relationship between crop burial
in soil immediately after treatment and weed control. To estimate crop burial, digital image analysis
was used in order to make the estimations objective. The study showed that narrow row spacing
decreased selectivity in a late growth stage (21) whereas row spacing in the range of 5.3 cm to 24
cm had no effects in an early growth stage (12). Harrowing across rows decreased selectivity in one
out of two experiments. Whether repeated passes with the harrowing were carried out in the same
orientation along the rows or in alternative orientations forth and back was unimportant. There were
indications that high driving speed decreases selectivity and that repeated passes with low driving
speed are better than single treatments with high driving speed. Impacts on selectivity, however,
were small and only significant at high degrees of weed control. Timing had no significant impact
on selectivity.
Correspondence: J Rasmussen, Department of Agricultural Sciences, Faculty of Life Sciences,
Copenhagen University, Højbakkegaard Allé 9, DK-2630 Taastrup, Denmark. Tel: (+45) 35 33 34
56; Fax (+45) 35 3333 84; E-mail: jer[a]life.ku.dk

2
Introduction
Mechanical weed control with an implement such as a weed harrow may control weeds, but also
damage crops. Therefore, selectivity defined as the ratio between weed control and crop damage is
a key parameter in post-emergence weed harrowing. Low selectivity generally limits weed control
because crop damage increases in proportion to weed control. This applies not only to broadcast
tillage in cereals and pulses with harrows and rotary hoes (Rasmussen, 1992; Kurstjens & Perdok,
2000; Lotjonen & Mikkola, 2000; Jensen et al., 2004) but also to intra-row tillage in row crops with
intra-row weeders (Fogelberg & Gustavsson, 1999; Melander et al., 2005).
Due to low selectivity, post-emergence weed harrowing may reduce crop yields, especially if weed
competition is low (Rasmussen, 2004), timing is unfavourable (Rasmussen & Nørremark, 2006) or
implement setting is inappropriate (Böhrnsen, 1993).
Studies show that the primary action with post-emergence harrowing is burying plants (Kurstjens &
Perdok, 2000) even if uprooting has been acknowledged to play an important role in relation to
weakly anchored plants (Kurstjens & Kropff, 2001). In strongly anchored crops such as cereals and
grain legumes, burying is the all-important crop damage (Jensen et al., 2004), which justifies the
original definition of selectivity as the ratio between weed control and crop damage in terms of crop
burial (Rasmussen, 1990; 1992). The percentage of crop burial makes up the so-called crop soil
cover, which until recently has been visually assessed immediately after treatment on a scale from
0-100 percent.
Digital image analysis, however, now offers the possibility to estimate leaf cover and leaf cover
changes as a result of harrowing (Hansen et al., 2007; Rasmussen et al., 2007). Hansen et al. (2007)
found that the leaf cover changes as a result of harrowing in barley (Hordeum vulgare L.) were
unaffected by the presence of weeds, and Rasmussen et al., (2007) made no attempt to discriminate
crop and weeds because they considered it unimportant. Weeds were deemed to make up less than a
few percentage of the total leaf cover in the early growth stages of spring barley.
Therefore, it is reasonable to calculate crop soil cover from changes in leaf cover as a result of
harrowing, based on the preconditions that weeds contribute insignificantly to leaf cover, and
uprooting and pulling of crop leaves are insignificant.

3
Absolute and objective estimates of crop soil cover calculated from leaf cover resolves two
important problems associated with visual assessments of crop soil cover. First, different
individuals assess crop soil cover differently and second, statistical analysis based on relative
quantities like crop soil cover and weed control, which are calculated relative to untreated plots are
problematic due to the interdependence on the reference plots. Furthermore, relative quantities fix
the reference value to 1 although the absolute measurement associated with the reference plots are
subject to experimental error comparable to that in the other plots.
After the introduction of digital image analysis in weed harrowing research, selectivity may now be
estimated on the basis of objective and absolute quantities, leaf cover and weed density. Leaf cover
is estimated on the basis of digital image analysis and weed density on the basis of weed counting in
the field. It is, however, not trivial to make statistical analysis of the selectivity based on leaf cover
and weed density data.
Rasmussen & Nørremark (2007) proposed a procedure but gave no details about the statistical
analysis. The proposed procedure implies two regression analyses and calculation of confidence
intervals using the delta-method, which at first sight appear unnecessarily complicated compared to
the simpler procedure used in earlier studies (Rasmussen, 1990; 1992; Jensen et al., 2004). The
proposed procedure, however, holds several advantages in terms of flexibility, precision, and
interpretability as outlined in this paper.
The main purpose of this study is to answer whether row spacing, timing, direction and orientation
of harrowing influence the selectivity of weed harrowing and to investigate if it is important
whether different intensities are generated by varying the number of passes or the driving speed.
Special attention is given to ensuring that this is done in a reliable way that takes the often complex
nature of the experimental design into account in the statistical analysis, when analysis is based on
leaf cover and weed density data.
Materials and methods
In order to investigate whether the operational factors (e.g., timing) influence the selectivity,
experiments were carried out with progressive series of harrowing intensities (aggressiveness) for
each factor or factor combination. Increasing intensity was either created by increasing the number

4
of consecutive passes on the same day (Expt 1-6) or by increasing the forward speed (Expt 5-6). In
each experiment, tine angle and working depth was adjusted to the soil conditions to make it
possible to create a range of crop soil cover from 0 to about 50% by increasing intensities.
Equidistant spacing between the intensity levels was aimed for. Decisions about implement settings
were based on visual assessments of crop soil cover in the field in order to achieve the target range
of crop soil cover.
Experiments
Four field experiments were carried out to investigate whether row spacing, timing, direction and
orientation of harrowing affect the selectivity of weed harrowing in spring barley, and two
experiments were carried out to investigate if it is important to selectivity whether ranges of
intensities are generated by varying the number of passes or the driving speed. All experiments
were carried outin spring 2006.
Experiments were carried out on an organic farm and a neighbouring conventional farm (Table 1).
Both farms are experimental farms owned by the Faculty of Life Science, Copenhagen University
and situated about 20 km west of Copenhagen (55°40' N, 12°18' E). The soil is a sandy clay loam
typical of Zealand. Plots were 3 × 14 m.
All experiments were carried out in spring barley without herbicide application. One crop density
(350 seeds m 2) and two varieties (Modena on the organic farm and Scandium on the conventional
farm) were used. Row spacing was 12 cm in Expt 2 to 6 but varied in Expt 1 (Table 1). Harrowing
was carried out with a 3 m wide flex tine harrow, Økostriglen (A T Hedebo, DK-7970 Redsted M,
Denmark). Driving speed was constant within each of the first four experiments but varied between
experiments in the range of 4 and 7 km h-1. In Expt 5 and 6 the driving speed was varied as an
alternative way to create a range of harrowing intensities.
Expt 1. To investigate the importance of row spacing and timing of harrowing, a three factorial
split-plot design with four replicate blocks was used. Row spacing (5.3, 12, 24 cm) was applied to
main plots due to practical considerations related to sowing, and timing and intensity of harrowing
as sub-plot treatments. The experiment consisted of 96 plots (3 row spacing x 2 timings x 4
intensities of harrowing x 4 replicate blocks). A standard seed drill was used to sow barley at 12 and

5
24 cm row spacing. A modified precision seed drill (Kverneland Accord Corporation, Soest,
Germany) was used to sow barley at 5.3 cm row spacing in a uniform grid pattern with distance
between rows similar to the distance between plants in the same row. The crop was harrowed in
growth stage (GS) 12 (Lancashire et al., 1991) and two weeks later in GS 21. The intensity of
harrowing was varied by the number of consecutive passes in the range of 0 to 3. All passes were in
the same orientation along crop rows. Implement settings and driving speed were adjusted to
timing.
Expt 2. To investigate the importance of direction of harrowing, a two factorial split-plot design
with four replicate blocks was used. Direction (along and across rows) was applied to main plots
due to practical considerations about harrowing, and intensity of harrowing as sub-plot treatments.
The experiment consisted of 32 plots (2 directions x 4 intensities x 4 replicate blocks). The intensity
of harrowing was varied by the number of consecutive passes in the range of 0 to 3. All passes were
in the same direction along or across the crop rows.
Expt 3. As Expt 2 but direction was substituted with orientation, either all passes along the rows in
the same orientation or passes in alternating orientations, back and forth along the rows. The
number of passes was 0, 2, 3 and 4.
Expt 4. As Expt 2 but in an earlier growth stage and with other weed species (another field).
Expt5. To investigate whether it is important in which way the range of intensities is generated, by
varying the number of passes or by varying the driving speed, a two factorial split-plot design with
four replicate blocks was used. Passes and speed (mode of intensity) were applied to main plots and
intensity as sub-plot treatments. Five intensity levels were used. The range of intensities was either
created by (0), 1, 2, 3 and 4 consecutive passes with 3 km h-1 or by one harrowing pass with (0), 3,
6, 9 and 12 km h-1. In the statistical analyses, intensities were transformed into a common intensity
scale ranging from 0 to 4 independently of mode as shown in Fig. 4. The experiment consisted of 40
plots (2 modes of intensity x 5 levels of intensity x 4 replicate blocks). All harrowing passes were in
the same orientation along crop rows.
6
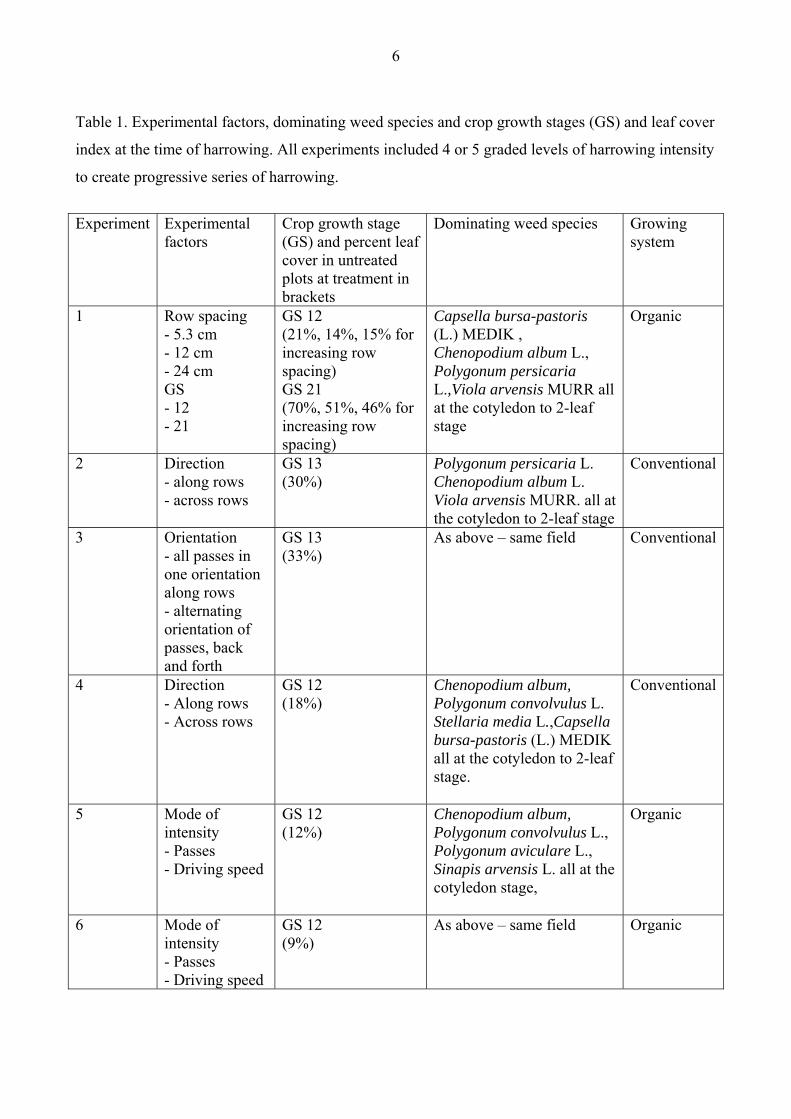
Table 1. Experimental factors, dominating weed species and crop growth stages (GS) and leaf cover
index at the time of harrowing. All experiments included 4 or 5 graded levels of harrowing intensity
to create progressive series of harrowing.
Experiment Experimental
factors Crop growth stage (GS) and percent leaf cover in untreated plots at treatment in brackets
Dominating weed species Growing system
1 Row spacing - 5.3 cm - 12 cm - 24 cm GS - 12 - 21
GS 12 (21%, 14%, 15% for increasing row spacing) GS 21 (70%, 51%, 46% for increasing row spacing)
Capsella bursa-pastoris (L.) MEDIK , Chenopodium album L., Polygonum persicaria L.,Viola arvensis MURR all at the cotyledon to 2-leaf stage
Organic
2 Direction - along rows - across rows
GS 13 (30%)
Polygonum persicaria L. Chenopodium album L. Viola arvensis MURR. all at the cotyledon to 2-leaf stage
Conventional
3 Orientation - all passes in one orientation along rows - alternating orientation of passes, back and forth
GS 13 (33%)
As above – same field Conventional
4 Direction - Along rows - Across rows
GS 12 (18%)
Chenopodium album, Polygonum convolvulus L. Stellaria media L.,Capsella bursa-pastoris (L.) MEDIK all at the cotyledon to 2-leaf stage.
Conventional
5 Mode of intensity - Passes - Driving speed
GS 12 (12%)
Chenopodium album, Polygonum convolvulus L., Polygonum aviculare L., Sinapis arvensis L. all at the cotyledon stage,
Organic
6 Mode of intensity - Passes - Driving speed
GS 12 (9%)
As above – same field Organic
7
Expt 6. As Expt 5, except that only 4 levels of intensities were used at lower driving speeds; 0, 1, 2,
and 3 consecutive passes with 2 km h-1 and one pass with 0, 2, 4, 6 km h-1. The experiment
consisted of 32 plots (2 modes of intensity x 4 levels of intensities x 4 replicate blocks).
Crop and weed assessments
Digital images were captured with two compact digital cameras, Canon Digital IXUS 55 Silver
(Canon INC, USA) (2592 X 1944 pixels) and Olympus C750UZ (Olympus Optical Co., Ltd.) (2288
X 1712 pixels) and within each experiment only one camera was used. Automatic white balancing,
shutter speed and aperture value were used and images were checked before digital image analysis
to secure correct focus and exposure. Four pictures each covering about 1 m2 (vertical projection)
were captured in each plot immediately after harrowing. Natural light conditions were used. Stable
light conditions were aimed at within each experiment but if light conditions were fluctuating due to
shifting cloud cover, at least one block replicate was photographed in stable light conditions. Digital
images were analysed with the automated procedure described in Rasmussen et al. (2007), which is
programmed in MATLAB (MathWorks, Inc, MA, USA) and later converted into a free web-based
software (www.imaging-crop.dk). The outcome of the analysis is a leaf cover index, which is the
proportion of pixels in the images determined to be green. There is no distinction between crop and
weeds and re-growth was not considered. It was evaluated that weeds contributed insignificantly to
the leaf cover index, and that uprooting and pulling of leaves of the crop plants was unimporatnt.
Weed density was assessed the same day as plots were harrowed. Within each plot, weed densities
in 4 random circles of 0.25 m-2 were counted. Re-growth of weeds and crop was not considered.
Models and statistics
We propose to use the two-step procedure outlined in Rasmussen & Nørremark (2007), which we
consider to be the best procedure from a statistical perspective because it (1) allows analysis of the
absolute crop and weed quantities, (2) uses the predetermined intensity as a covariate and not the
leaf cover index (which is subject to measurement error), and (3) allows the experimental design
(split-plot) to be reflected in the statistical analysis. The original analysis procedure proposed by
Rasmussen (1990) and later used by others (Melander, 1997; Jensen et al., 2004) does not have any
of these advantages.

8
In the first step, leaf cover index (L) and weed density (W) are analysed as funcbtions of the
intensity of weed harrowing (I) and in the second step, the relationship between weed control (=
percentage reduction of weed density in relation to untreated) and crop soil cover (=percentage
reduction of leaf cover index in relation to untreated) is estimated on the basis of parameter
estimates from the first step.
In all experiments leaf cover index (L) was described by a negative exponential equation
( )exp0L L b I= ⋅ − ⋅ (1)
where L0 is the leaf cover index in untreated reference plots, I is the intensity of harrowing and b is
the slope parameter. In general, I was the number of passes but in Expt 5 and 6, I also expressed
increasing driving speeds. The lowest driving speed in Expt 5 and 6, respectively, which was
identical to the driving speed used to create the series of intensities by increasing number of passes,
was given the value of 1.
Weed density (W) is described as a function of the intensity of harrowing. Depending on the actual
relationship between weed density and intensity, the following functions were used:
( )exp0W W c I= ⋅ − ⋅ (2)
( )( )exp ln 10W W c I= ⋅ − ⋅ + (3)
( )0.25exp0W W c I= ⋅ − ⋅ (4)
where W0 is the weed density in untreated plots, I is the intensity of harrowing and c is the slope
parameter. Eqn (2) to (4) express a progression in terms of curvature. In Eqn (2), the first harrowing
pass reduces weed density by the same percentage as each of the following passes. In Eqn (3) the
first pass is more efficient than the following passes and in Eqn (4) this trait is further intensified.
Simple regression models were compared to analysis of variance models to test for lack-of-fit. This
was done separately for the factors under investigation in each experiment based on Eqn (1) to (4)
on a logarithmic scale. The parameters L0, b, W0, and c were estimated using mixed linear models
with intensity of harrowing as a covariate and the investigated factors (and interactions) as fixed

9
effects, and block and the interaction between whole plot factors and block (whole plots) as random
effects. In order to omit non-significant factor or factor combination effects on parameters,
successive approximate F-tests were made to reduce the complexity of models. In all cases, it was
decided to analyse the logarithm of leaf cover index and weed density after inspecting the residuals.
In the second step, weed control was estimated relative to crop soil cover to reveal the selectivity
and to calculate the degree of crop soil cover that was associated with 80% weed control.
Approximate 95%-confidence (95%-CI) intervals were determined using the delta-method (the
method of approximating a non-linear expression in b and c by a linear) and a correlation between
estimates of b and c of 0.8 (based on what was found in the analysis of a single row spacing in Expt
1).
When Eqn (2) describes weed density, the relationship between weed control (WC=100(1-W/W0))
and crop soil cover (CSC=100(1-L/L0)) is deduced from Eqn (1) and (2)
100 1 exp ln 1100
c CSCWCb
⎛ ⎞⎛ ⎞⎛ ⎞= ⋅ − ⋅ −⎜ ⎟⎜ ⎟⎜ ⎟⎝ ⎠⎝ ⎠⎝ ⎠ (2a)
When Eqn (3) describes weed density, rearranging Eqn (1) and (3) gives
1100 1 1 ln 1100
cCSCWC
b
−⎛ ⎞⎛ ⎞⎛ ⎞= ⋅ − − −⎜ ⎟⎜ ⎟⎜ ⎟⎝ ⎠⎝ ⎠⎝ ⎠ (3a)
When Eqn (4) describes weed density, rearranging Eqn (1) and (4) gives
0.251100 1 exp ln 1
100CSCWC c
b
⎛ ⎞⎛ ⎞⎡ ⎤⎛ ⎞= ⋅ −⎜ ⎟− ⋅ − −⎜ ⎟⎜ ⎟⎢ ⎥⎜ ⎟⎝ ⎠⎣ ⎦⎝ ⎠⎝ ⎠ (4a)
At a first glance it might seem more natural to use expressions (2a) to (4a) directly in order to
estimate L0, b, W0, and c using non-linear regression. It is not obvious, however, how to include
fixed and random effects in a non-linear regression analysis and in all events it will lead to having
to rely on large-sample approximate tests. It also seems questionable to ignore the error associated

10
with the measurement of leaf cover index (and thereby the error in crop soil cover) which would be
implied by such an analysis.
Selectivity, calculated as the ratio between WC and CSC may easily be plotted against WC from the
above equations like in the early papers about selectivity (Rasmussen 1990; 1992) but we decided
to evaluate the selectivity from plots where WC is plotted against CSC as in more recent papers on
selectivity (Melander, 1997; Jensen et al., 2004; Melander et al. 2005)
All statistical analyses were performed with PROC MIXED in SAS (SAS version 9.1, SAS
Institute, Cary, USA).
Results
Lack-of-fit tests showed that Eqn (1) described the decline of the leaf cover index with increasing
intensity of harrowing well in all experiments (P > 0.05), which means that the leaf cover index
decreases exponentially with increasing intensity of harrowing. Parameter estimates of b, which
expresses the decline rate, varied within the range of 0.097 to 0.391 (Table 2), which corresponds to
9% to 32% relative decline in leaf cover index per unit of intensity.
As opposed to the leaf cover index, the weed density decreases with increasing intensity of
harrowing was not properly described by a simple exponential function in all experiments. Lack-of-
fit tests showed that Eqn (2) only gave appropriate description of the data in Expt 4. In Expt 1, 2
and 3, Eqn (3) provided better descriptions of the weed density responses and passed the lack-of-fit
test, and in Expt 5 and 6, Eqn (4) gave good descriptions.
Experiment 1
The rate of decline of the leaf cover index with increasing harrowing intensity (Parameter b) was
influenced by the row spacing in the late growth stage (P <0.05) (GS 21), whereas there was no
impact of row spacing in the early growth stage (P =0.23) (GS 12) (Fig. 1). Based on the parameter
estimates in Table 2, it was calculated from Eqn (1) that each pass reduced leaf cover index by 9%
(95%-CI: 1%-17%) at 24 cm row spacing, by 16% (95%-CI: 8%-24%) at 12 cm and by 25% (95%-
CI: 19%-31%) at 5.3 cm in the late GS 21. In the early GS 12, leaf cover index was reduced by 24%
(95%-CI: 16%-32%) independently of row spacing.
11
Weed density was well described by Eqn (3), which means that the relative efficacy of weed
harrowing declined by increasing intensities. Weed density decline was unaffected by row spacing
(P=0.53) but the decline has higher at the earliest timing (P<0.0001) (Table 2).
In the early growth stage (GS 12), the selectivity was unaffected by row distance (Fig. 1) due to
identical b and c parameters (Table 2). The selectivity, however, was improved by increasing row
spacing in GS 21 and 80% weed control was associated with almost three time higher crop soil
cover at 5.3 cm row spacing compared with 24 cm in GS 21 (Table 2).
In the early growth stage (GS 12) 80% weed control resulted in 17% (95%-CI: 15%-19%) crop soil
cover at all row spacings, showing that the selectivity declined over time for the 5.3 cm row spacing
whereas the was no statistical evidence of changes in selectivity for 12 cm and 24 cm row spacing
(Table 2).

12
Table 2. Parameter estimates with estimated standard errors and estimated crop soil cover corresponding to 80% weed control. Parameters b and c express the rate of decline of leaf cover index and weed density with increasing intensity of weed harrowing. Experiment
Factor
Decline of leaf cover index - Parameter b in Eqn (1) (standard error)
Decline of weed density - Parameter c (standard error)
Estimated crop soil cover (%) corresponding to 80% weed control (95%-CI)
1 GS 12 - 5.3 cm - 12 cm - 24 cm GS 21 - 5.3 cm - 12 cm - 24 cm
0.278 (0.0308) 0.278 (0.0308) 0.278 (0.0308) 0.282 (0.0533) 0.175 (0.0533) 0.097 (0.0533)
3.13 (0.144) ‡ 3.13 (0.144) ‡ 3.13 (0.144) ‡ 1.88 (0.144) ‡ 1.88 (0.144) ‡ 1.88 (0.144) ‡
17% (15%-19%) 17% (15%-19%) 17% (15%-19%) 32% (26%-38%) 21% (13%-29%) 12% (2%-22%)
2 Direction - along rows - across rows
0.187 (0.0193) 0.187 (0.0193)
1.47 (0.134) ‡ 1.47 (0.134) ‡
31% (27%-35%) 31% (27%-35%)
3 Orientation - all passes in one orientation along rows - alternating orientation of passes, back and forth
0.176 (0.0152) 0.176 (0.0152)
1.81 (0.228) ‡ 1.81 (0.228) ‡
22% (17%-27%) 22% (17%-27%)
4 Direction - Along rows - Across rows
0.241 (0.0451) 0.391 (0.0451)
1.13 (0.120) † 1.13 (0.120) †
29% (23%-35%) 43% (38%-47%)
5 Mode of intensity - Passes - Driving speed
0.312 (0.0198) 0.229 (0.0198)
3.26 (0.246) § 2.23 (0.246) §
2 % (1%-3%) 6% (2%-10%)
6 Mode of intensity - Passes - Driving speed
0.113 (0.0177) 0.113 (0.0177)
2.59 (0.216) § 1.88 (0.216) §
2% (1%-3%) 7% (2%-11%)
† in Eqn 2 ‡ in Eqn 3 § in Eqn 4
13
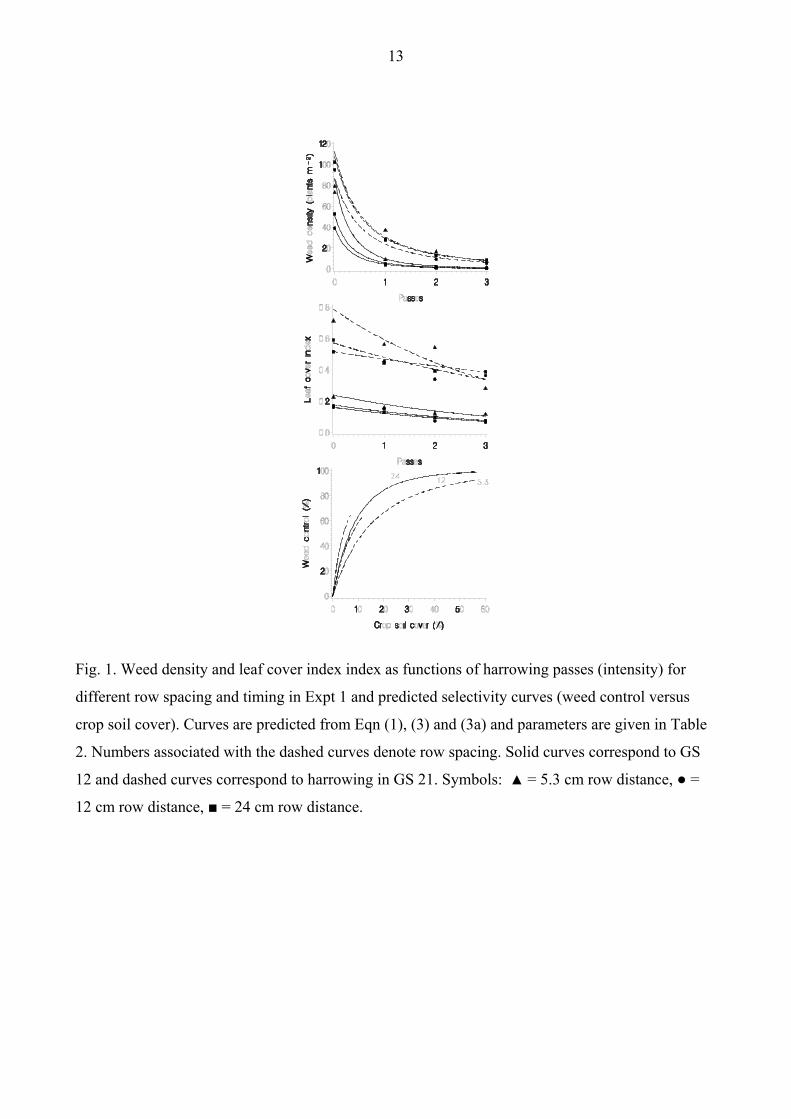
Fig. 1. Weed density and leaf cover index index as functions of harrowing passes (intensity) for
different row spacing and timing in Expt 1 and predicted selectivity curves (weed control versus
crop soil cover). Curves are predicted from Eqn (1), (3) and (3a) and parameters are given in Table
2. Numbers associated with the dashed curves denote row spacing. Solid curves correspond to GS
12 and dashed curves correspond to harrowing in GS 21. Symbols: ▲ = 5.3 cm row distance, ● =
12 cm row distance, ■ = 24 cm row distance.

14
Experiment 2 and 3
Increasing intensities of harrowing along and across the rows resulted in the same decline of leaf
cover index (P = 0.12) and weed density (P = 0.47) (Table 2), and it was unimportant whether
harrowing passes were repeated in the same orientation along the crop rows or in alternating
orientations (back and forth) with respect to leaf cover index (P = 0.54) and weed density (P =
Fig. 2. Weed density and leaf cover index as functions of harrowing passes (intensity) for different
directions (Expt 2) and orientations of harrowing (Expt 3) and predicted selectivity curves. Curves
are predicted from Eqn (1), (3) and (3a) and parameters are given in Table 2. Solid curves
correspond to Expt 2 and dashed curves to Expt 3. Symbols: ▲ = harrowing along the rows, ● =
harrowing across the rows, ○ = all passes in the same orientation along the rows, ∆ = passes in
alternating orientation back and forth along the rows.

15
0.64). In consequence, the predicted selectivity curves were unaffected by harrowing direction and
orientation (Fig. 2). The selectivity was higher in Expt 3 even if crop and weeds were in the same
growth stages.
Experiment 4
The rate of decline of the leaf cover index was higher when harrowing was carried out across the
rows (P = 0.006), whereas the impacts on weed density was unaffected by the direction of
harrowing (P = 0.51) (Table 2) giving lower selectivity across the rows (Fig. 6).
Experiment 5 and 6
Increasing the number of passes gave higher impacts on leaf cover index (P = 0.002) and weed
density (P = 0.001) than increasing the driving speed (Table 2). The very high percentage of weed
control achieved by the lowest intensity required Eqn (4) to give a good description of the weed
densities (Fig. 4). The experiment was repeated because the intensities were considered to be too
aggressive in terms of weed impacts. In Expt 6, however, the impacts on weeds were still high but
the crop impacts were lower due to lower driving speeds (Table 2).
In Expt 6, the impacts on weed densities were higher when the number of passes was increased (P
< 0.0001) compared to driving speed but there were no differences in the decline of leaf cover index
(P = 0.74).
Both experiments showed a tendency of higher selectivity when the intensity was increased through
increasing number of passes with a low driving speed but at 80% weed control there was no
statistical evidence of a difference due to overlapping confidence intervals in terms of crop soil
cover (Table 2).
16
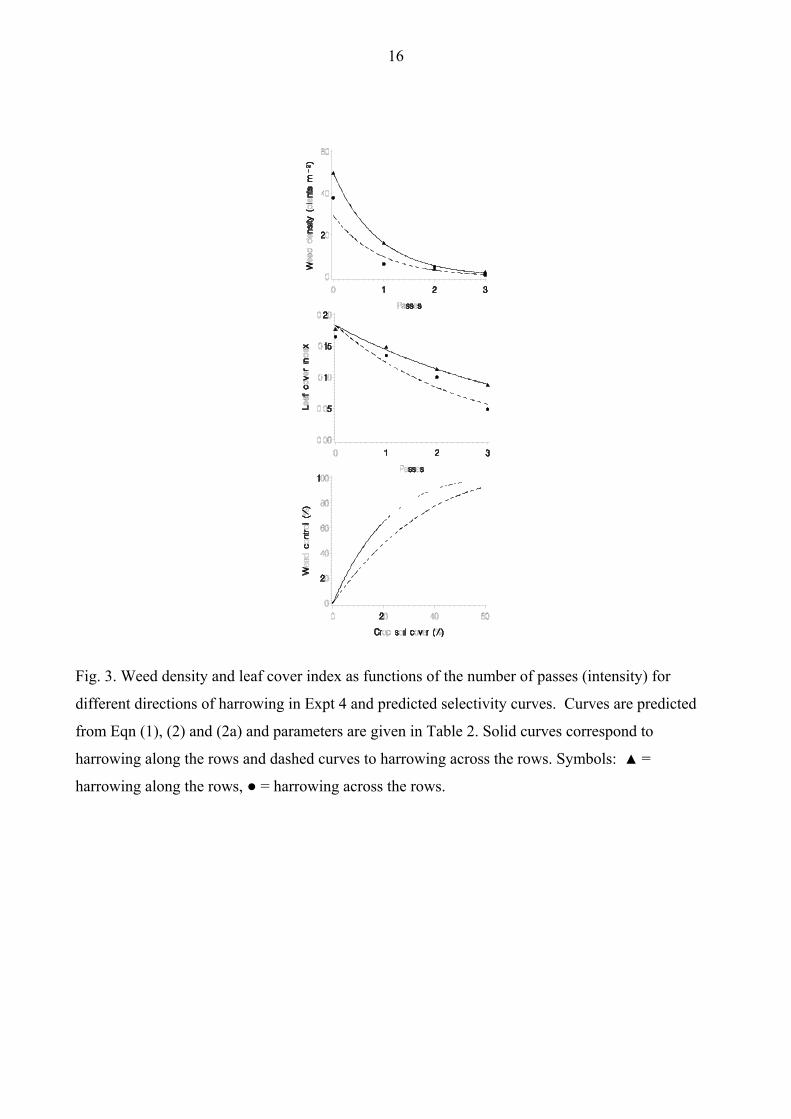
Fig. 3. Weed density and leaf cover index as functions of the number of passes (intensity) for
different directions of harrowing in Expt 4 and predicted selectivity curves. Curves are predicted
from Eqn (1), (2) and (2a) and parameters are given in Table 2. Solid curves correspond to
harrowing along the rows and dashed curves to harrowing across the rows. Symbols: ▲ =
harrowing along the rows, ● = harrowing across the rows.
17
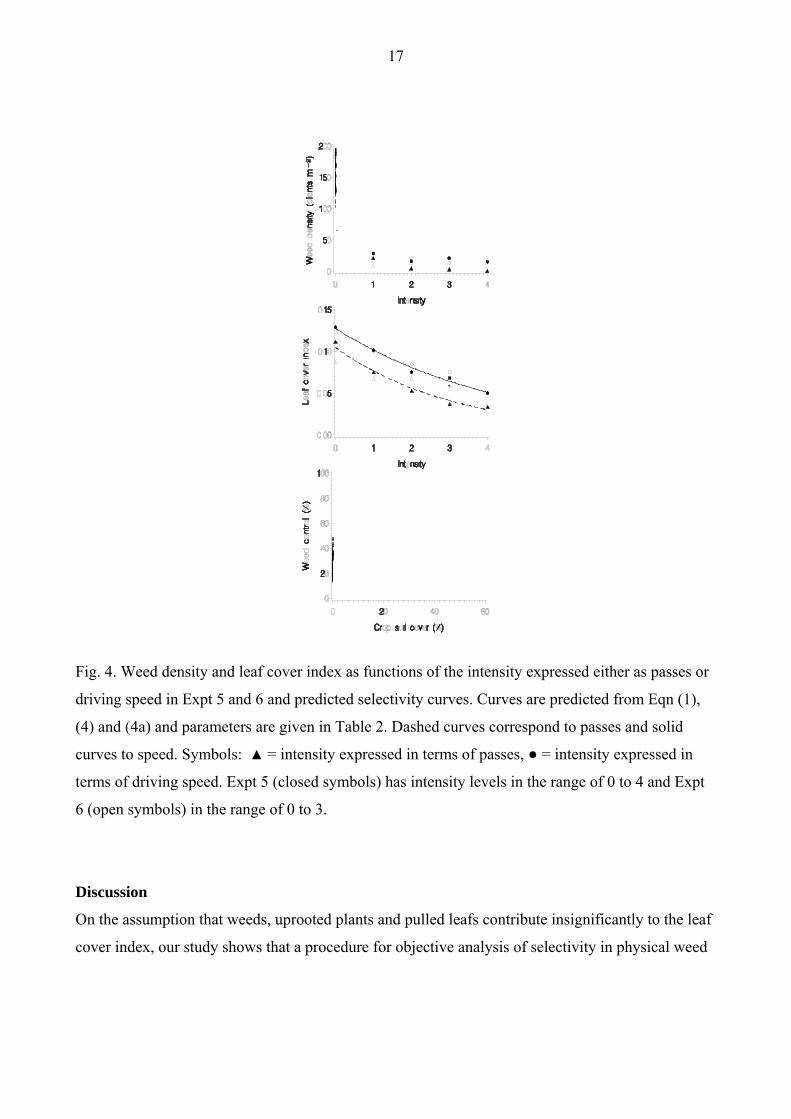
Fig. 4. Weed density and leaf cover index as functions of the intensity expressed either as passes or
driving speed in Expt 5 and 6 and predicted selectivity curves. Curves are predicted from Eqn (1),
(4) and (4a) and parameters are given in Table 2. Dashed curves correspond to passes and solid
curves to speed. Symbols: ▲ = intensity expressed in terms of passes, ● = intensity expressed in
terms of driving speed. Expt 5 (closed symbols) has intensity levels in the range of 0 to 4 and Expt
6 (open symbols) in the range of 0 to 3.
Discussion
On the assumption that weeds, uprooted plants and pulled leafs contribute insignificantly to the leaf
cover index, our study shows that a procedure for objective analysis of selectivity in physical weed

18
control is now available. The proposed procedure has similarities to the dose-response concept used
to assess herbicidal selectivity (Streibig, 1988; Ritz et al., 2006) but also important dissimilarities.
Assessment of herbicidal selectivity is based on comparisons of sigmoidal dose-response curves at
specific response levels. Our estimation procedure is also based on response curves and
comparisons of crop and weed responses. However, we found no evidence of sigmoidal
relationships between plant responses and intensity and we eliminated intensity in our models that
describe the selectivity (Eqn (2a-4a)).
Since our data could not be described with symmetric sigmoidal and parallel response curves,
selectivity could not be expressed relative to the intensity with a single parameter as for some
herbicides (Streibig, 1988). This is why we presented selectivity curves (weed control plotted
against crop soil cover) and calculated confidence intervals for the crop soil cover corresponding to
80% weed control. Other weed control levels can be used as well but 80% was chosen because it is
attainable in experiments with graded levels of intensities and because possible differences in
selectivity are more pronounced at higher levels of weed control than at lower levels.
We eliminated the intensity from our presentation of the selectivity, because there exists an
important difference between the dose concept used in herbicidal research and the intensity concept
used in mechanical weed control research. A dose is referring to a certain amount of an herbicide
but an intensity only expresses the tillage aggressiveness through driving speed or number of passes
without referring to the active ingredient, which is the soil and its dynamic properties. Therefore, an
intensity level is a more arbitrary and context dependent measure in terms of plant responses than a
herbicide dose due to strong interactions between tillage implement and soil (Duerinckx et al.,
2005).
This study showed higher selectivity in spring barley than previous studies (Rasmussen, 1990;
1992, Rasmussen & Svenningsen, 1995), but comparisons to earlier studies may be unreliable due
to visual assessments of the crop soil cover. In this study, crop soil cover associated with 80% weed
control at 12 cm row spacing and harrowing along crop rows was in the range of 2 to 31%
averaging 15%.

19
Expt 5 and 6 indicate that it may be of some importance to selectivity how increasing intensities are
created in the field. Increasing the number of passes with a low driving speed was marginally better
in terms of selectivity than increasing the driving speed of a single pass, even if the difference was
not statistical significant at 80% weed control (Table 2). Also Rasmussen (1990) found that high
driving speeds possibly may have negative impacts on the selectivity, even if the experimental
design was inadequate to test whether the intensity preferably should be increased through number
of passes instead of driving speed. However, Expt 5 and 6 were problematic, because the applied
intensities were too high to give good descriptions of the weed density decline relative to the graded
levels of intensities. The lowest level of intensity gave very high percentages of weed control that
approached the upper limit of weed control (Fig. 4). Furthermore, there was strong evidence, that
the factor under investigation (mode of intensity) was related to the general growth conditions in the
field, because the general level of leaf cover index was lower in plots where the intensity was varied
by number for passes (Fig 4). This may indicate that the crop and possibly also the weeds were in
an earlier growth stage, which challenges the conclusions from Expt 5 and 6. Leaf cover index
assessment before treatments used as a covariate to adjust for pre-treatment variation, a complete
randomized block design, and less aggressive treatments would all have improved the experiments.
If the lower selectivity associated with higher driving speed in Expt 5 and 6 is general, it challenges
the assumption that different intensities of harrowing carried out on the same site and day always
will give identical selectivity curves independently of the operational factors according to
harrowing (Rasmussen, 1992). Kurstjens and Perdok (2000) challenged this assumption in lab
experiments, but it has never been challenged in previous field experiments.
Expt 4 also challenged the assumption because harrowing across the rows resulted in lower
selectivity than harrowing along the rows (Fig 3). Rydberg’s (1994) results seem to support this
result but his results were not statistical significant. Expt 2, however, showed that harrowing across
rows do not always influence the selectivity (Fig 2).
Timing was only of minor importance in Expt 1 which is supported by Rydberg (1993), who found
minor differences in selectivity in growth stage 12 and 13. Rasmussen (1992) found that the
selectivity increased over time whereas Melander (1997) found dramatically negative effects of
delayed treatments in seeded onions. Jensen et al. (2004) found no effect of timing in lupin

20
(Lupinus luteus L. and Lupinus angustifolius L.), which underlines that the understanding of how
timing influences the selectivity is insufficient and results conflicting.
Based on previous experiments, it was expected that widening the row spacing in general would
result in higher selectivity (Rasmussen & Svenningsen, 1995), but this study showed that selectivity
only was affected by row spacing in the late GS 21, indicating that early post-emergence weed
harrowing may be used successfully in narrow rowed cropping systems like the spatial uniformity
system proposed by Weiner et al. (2001). It is generally accepted that the competitive ability of
crops increases when the row spacing are narrowed (Weiner et al., 2001) and crop yield decreases
by increasing row spacing (Kirkland, 1993; Neumann et al., 2006). In advanced growth stages,
however, there seems to be a trade-off between a lower selectivity and a higher competitive ability
of the crops in narrow rowed systems.
In conclusion, this study shows that narrow row spacing and harrowing across rows may decline
selectivity but the importance of row spacing was only significant in late growth stages (GS 21) and
the direction of harrow was only significant in one out of two experiments. There are indications
that high driving speed declines selectivity, but this issue needs further investigations. Whether
repeated harrowings are carried out in the same orientation along the rows or in alternative
orientations forth and back was unimportant. Timing had no significant impact on selectivity.
Acknowledgement
We thank Micahel Nørremark for assistance with the digital image analysis programme and two
anonymous referees for their contributions to the improvement of the manuscript.
Referencens
BÖHRNSEN A (1993) Several years results about mechanical weeding in cereals. Communications of
the 4th International Conference I.F.O.A.M. Non Chemical Weed Control, Dijon, France, 95-
101.
DUERINCKX K, MOUAZEN AM, ANTHONIS J & RAMON H (2005) Effects of spring-tine settings and
operational conditions on the mechanical performance of a weed harrow tine Biosystems
Engineering 91(1), 21-34.

21
FOGELBERG F & GUSTAVSSON AMD (1999) Mechanical damage to annual weeds and carrots by in-
row brush weeding. Weed Research 39, 469-479.
HANSEN PK, RASMUSSEN IA, HOLST N & ANDREASEN C (2007) Tolerance of four spring barley
(Hordeum vulgare) varieties to weed harrowing. Weed Research 47, 241–251.
JENSEN RK, RASMUSSEN J, & MELANDER B (2004) Selectivity of weed harrowing in lupin. Weed
Research, 44, 245-253.
KIRKLAND KJ (1993) Weed management in spring barley (Hordeum vulgare) in the absence of
herbicides. Journal of Sustainable Agriculture 3 (3-4), 95-104.
KURSTJENS DAG & KROPFF M J (2001) The impact of uprooting and soil-covering on the
effectiveness of weed harrowing. Weed Research 41, 211-228
KURSTJENS DAG & PERDOK UD (2000) The selective soil covering mechanism of weed harrows on
sandy soil. Soil & Tillage Research 55, 193-206.
Lancashire PD, Bleiholder H, Van Den Boom T et al. (1991) A uniform decimal code for the
growth stages of crops and weeds. Annals of Applied Biology 119, 561–601.
LOTJONEN T & MIKKOLA H (2000) Three mechanical weed control techniques in spring cereals.
Agricultural and Food Science in Finland 9(4) 269-278.
MELANDER B (1997) Optimization of the adjustment of a vertical axis rotary brush weeder for intra-
row weed control in row crops. Journal of Agricultural Engineering Research 68 (1), 39-50.
MELANDER B, RASMUSSEN IA & BARBERI P (2005) Integrating physical and cultural methods of
weed control - Examples from European research. Weed Science 53, 369-81.
NEUMANN H, LOGES R & TAUBE F (2006) Das System "weite Reihe" - Innovation für den
ökologischen Winterweizenanbau? (The wide row system - Innovation for organic winter
wheat cultivation?) Berichte über Landwirtschaft 84, 404-424.
RASMUSSEN IA (2004) The effect of sowing date, stale seedbed, row width and mechanical weed
control on weeds and yields of organic winter wheat. Weed Research 44, 12-20.
RASMUSSEN J (1990) Selectivity, an important parameter on establishing the optimum harrowing
technique for weed control in growing cereals. Proceedings of the 1990 European Weed
Research Society Symposium, Integrated weed management in cereals. Helskinki, Finland,
197-204.
RASMUSSEN J (1992) Testing harrows for mechanical control of annual weeds in agricultural crops.
Weed Research 32, 267-274.

22
RASMUSSEN J & NØRREMARK M (2006) Digital image analysis offers new possibilities in weed
harrowing research. Zemdirbyste/Agriculture. 93(4), 155-165.
RASMUSSEN J & NØRREMARK M (2007) Digital images for assessing soil cover of crop plants. In:
Proceedings 7th EWRS Workshop on Physical and Cultural Weed Control, Salem, Germany,
11-14 March, 123-129.
RASMUSSEN, J. & SVENNINGSEN T (1995): Selective weed harrowing in cereals. Biological
Agriculture and Horticulture 12: 29-46.
RASMUSSEN J, NØRREMARK M & BIBBY BM (2007) Assessment of leaf cover and crop soil cover in
weed harrowing research using digital images. Weed Research 47, 299-310.
RITZ C, CEDERGREEN N, JENSEN JE &T STREIBIG JC (2006) Relative potency in nonsimilar dose-
response curves. Weed Science 54, 407-412.
RYDBERG T (1993) Weed harrowing-driving speed at different stages of development. Swedish
Journal of Agricultural Research 23, 107-113.
RYDBERG T (1994) Weed Harrowing - the Influence of Driving Speed and Driving Direction on
Degree of Soil Covering and the Growth of Weed and Crop Plants. Biological Agriculture &
Horticulture 10, 197-205.
STREIBIG JC (1988) Herbicide bioassay. Weed Research 28, 479-484.
WEINER J, GRIEPENTROG HW & KRISTENSEN L (2001): Suppression of weeds by spring wheat
Triticum aestivum increases with crop density and spatial uniformity. Journal of Applied
Ecology 38, 784-790.


![9˛Z1# 6& $ % ˝ & ' () * + , - · 2020. 3. 17. · Arabic Original: English . FCCC/CP/2016/6 GE.16-14987 2 Blank page. FCCC/CP/2016/6 3 GE.16-14987 Annex [English only] Report of](https://static.fdocuments.net/doc/165x107/60c6fa9c5ddf917626020d08/9z1-6-2020-3-17-arabic-original-english.jpg)