Inundation Analysis Using GIS and Hydrodynamic Modeling
22
Inundation Analysis Using GIS and Hydrodynamic Modeling Conrad Blucher Institute for Surveying and Science Sergey K. Reid, Philippe Tissot and Deidre Williams
Transcript of Inundation Analysis Using GIS and Hydrodynamic Modeling

Inundation Analysis Using GIS and Hydrodynamic Modeling
Conrad Blucher Institute for Surveying and Science Sergey K. Reid, Philippe Tissot and Deidre Williams

Project Overview
– implement a hydrodynamic model (Coastal Modeling System - CMS) for the study area using available water level, wind and bathymetry data
– develop a methodology to quantify the accuracy of the model inundation predictions through the use of geospatial techniques (GPS, aerial and satellite imagery)
– if the model predicts inundation accurately, the method can be applied to predict present and future tidal flat inundation including shorebird habitat

Mollie Beattie and Packery Channel Area
Mollie Beattie Coastal Habitat Community is a tidal flats area located north of Packery Channel, off of TX 361 highway. This area was set aside by the Texas General Land Office for conservation of Piping Plover and other shorebirds. It serves as a great test area to see how well the Coastal Modeling System can predict flooding/drying due to the area’s gradual elevation change.
You are here
Texas

Friday (1/27/12)
flooding occurs during a cold
front (strong NW winds)
Saturday (1/28/12)
the water significantly
recedes

Data
– GPS elevation surveys to define the model’s bathymetry • collected in respect to NAVD 88 and NAD 83
State Plane Texas South (January 2012)
• additional elevation data acquired from the Packery Channel Monitoring Project
– Water level and wind data to define the model’s forcings • acquired from the Texas Coastal Ocean
Observation Network (TCOON)
– Aerial and Satellite Imagery • acquired from DigitalGlobe Inc., Texas Natural
Resources Information System (TNRIS) and Lanmon Aerial Photography Inc.

• hydrodynamic predictive model developed by the USACE, simulates water levels, currents, sediment transport and salinity
• previously implemented for the Coastal Bend, used to predict water levels
• provides vertical water level change in respect to a defined vertical datum
• provides prediction outputs with coordinates assigned to the centroid of each computation cell based on a defined horizontal reference frame
Coastal Modeling System (CMS)

Flooding / Drying Analysis Area
Gulf Forcing
Bay Forcing
Current Meter

Model Simulation: July 2008
Simulation Info
Run Date: 7/10/08 – 7/20/08 Simulation Time: 260 hours Image Taken: 6 pm on 7/20/08 Number of Cells: 377, 762
Model Input
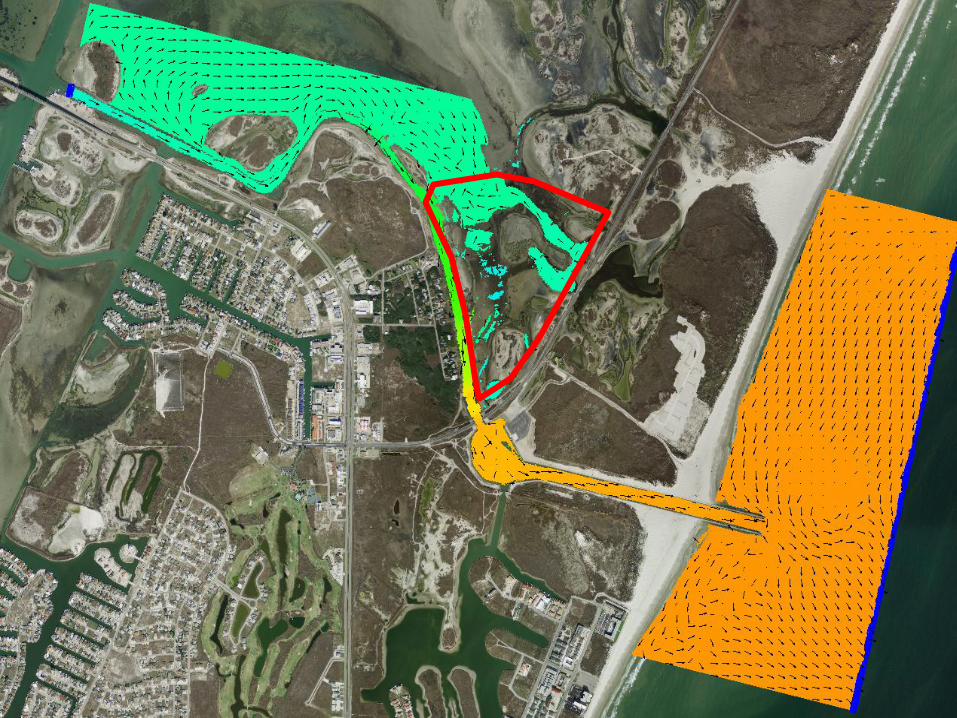
July 2008 - X Current Velocity Analysis

CMS Output to Binary (Wet/Dry)
Python Script
def Condition (water_level):
if water_level < -100: return 0 else: return 1
wet
dry

Aerial and Satellite Image Classification Classification Tool (ArcMap)

Manual Image Classification (ArcMap) DIGITIZE GEOREFERENCE

Binary (Wet/Dry) Rasters (July 08)
CMS Aerial Image

“First Glance” CMS Inundation Accuracy (Jul 08)
Accurate (both dry)
Error (one dry, other wet)
Accurate (both wet)
RASTER ADDITION:

Error Pattern: CMS is under-predicting (Jul 08) CMS predicting flooding where it’s actually dry land
CMS predicting dry land where It’s actually flooding

July 2008 Case - Contingency Table Analysis

Contingency Table Analysis
February 7, 2008
July 20, 2008
January 12, 2009
August 4, 2009
August 12, 2012
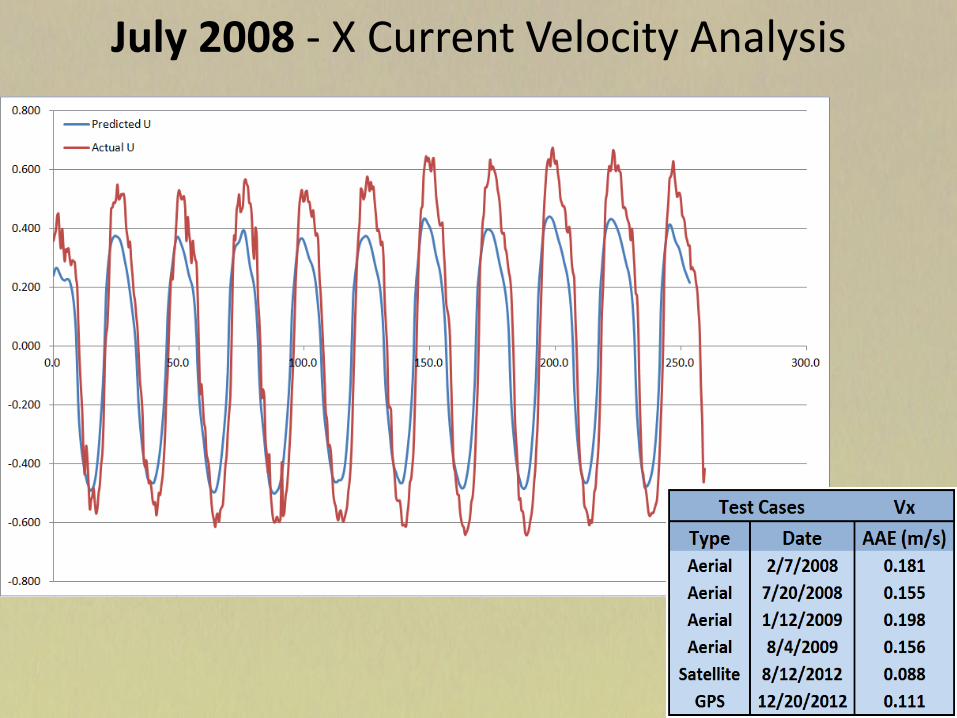
GPS Delineation Analysis

Date: 12/20/2012 ~11 am *Note: GPS Survey was conducted during a cold front Error Area: 24.97m2
Total Study Area: 941.92m2
Avg GPS Elevation: -.34m (NAVD 88)
CMS Prediction GPS Inundation Error Area
GP
S S
urv
ey

Conclusions
– CMS model optimization and verification
• currents and water levels
– multiple test cases in various seasonal conditions
• 5 test cases with accuracies of 86% - 91%
– extend implementation for other coastal areas and more test cases
– sea level rise flooding delineation
– seasonal and extreme weather flooding delineation
– shoreline habitat reduction

Questions? Comments? Concerns?