INTRODUCTION - Bangladesh Bank · 2016-05-08 · INTRODUCTION After liberation, the banks operating...
29
i INTRODUCTION After liberation, the banks operating in Bangladesh (except those incorporated abroad) were nationalised. These banks were merged and grouped into six commercial banks. Of the total six commercial banks, Pubali Bank Ltd. and Uttara Bank Ltd. were subsequently transferred to the private sector with effect from January 1985. Rupali Bank was transferred as public limited company from December 1986. The rest three State Owned Banks were operating as public limited company from the quarter October-December, 2007. The two Govt. owned specialised banks were renamed as Bangladesh Krishi Bank and Bangladesh Shilpa Bank. In March 1987 Bangladesh Krishi Bank was bifurcated and another specialised bank emerged as Rajshahi Krishi Unnayan Bank (RAKUB) for Rajshahi and Rangpur Division. Bank of Small Industries & Commerce Bangladesh Ltd. (BASIC) started its operation as a private bank from September 1988. Later on BASIC was brought under direct control of the Government and was reckoned to as a specialised bank with effect from June 1993. From July 1995 again the BASIC was categorised as a private bank and from 1997 Government decided to treat this bank as a Specialised bank again. But from January 2015 Government decided to treat this bank as a State Owned Bank. So in this booklet, from January‐March, 2015 the BASIC has been treated as a State Owned Bank. Bangladesh Shilpa Bank (BSB) & Bangladesh Shilpa Rin Sangstha (BSRS) merged and renamed as Bangladesh development Bank Limited (BDBL) from the quarter January‐March, 2010 treated as specialized bank. But from this quarter (April‐June’15) according to Government decision BDBL is being treated as State Owned Bank. Standard Chartered Grindlays Bank was merged with Standard Chartered Bank during the Quarter January-March, 2003. American Express Bank also merged with Standard Chartered Bank during the quarter October-December, 2005. The Oriental Bank Ltd. an Islamic private bank was renamed as ICB Islamic Bank Ltd. from the quarter April-June, 2008. Credit Agricole Indosuez, a foreign private bank is renamed as Commercial Bank of Ceylon Ltd. from the quarter October-December, 2003. Shamil Bank is renamed as Bank Al-Falah Ltd. from the quarter April-June, 2005. Arab Bangladesh Bank Ltd. is renamed as AB Bank Ltd. from the quarter January-March, 2008 and Social Investment Bank Ltd. is renamed as Social Islami Bank Ltd. from the quarter April-June, 2009. It is mentioned that First Security Bank Ltd. has started its operation according to Islamic Sariah from the quarter January-March, 2009, Shahjalal Bank Ltd. has started its operation according to Islamic Sariah from the quarter April-June, 2001 and it is renamed as Shahjalal Islami Bank Ltd. from the quarter April- June, 2004 and EXIM Bank Ltd. has also started its operation according to Islamic Sariah from the quarter July-September, 2004. The branches of foreign banks operating in Bangladesh are being treated as foreign private banks. Among all fourth generation Scheduled Banks “NRB Commercial Bank Ltd.”, “South Bangla Agriculture and Commerce Bank Ltd.”, “Meghna Bank Ltd.”, “The Farmers Bank Ltd.”, and “Union Bank Ltd.” have started their operation from the quarter April-June, 2013. “Midland Bank Ltd.”, “Modhumoti Bank Ltd.”, “NRB Bank Ltd.” have started their operation from the quarter July- September, 2013 and “NRB Global Bank Ltd” has started their operation from the quarter October- December, 2013. It is mentioned that Union Bank Ltd. based on Islamic Sariah. All such banks operating in Bangladesh with different paid-up capital and reserves having a minimum of an aggregate value of Tk. 50 lac and conducting their affairs to the satisfaction of the Bangladesh Bank have been declared as scheduled banks in terms of section 37(2) of Bangladesh Bank Order 1972. In terms of section 13 of Bank Company Act, 1991, the minimum aggregate value
Transcript of INTRODUCTION - Bangladesh Bank · 2016-05-08 · INTRODUCTION After liberation, the banks operating...
i
INTRODUCTION
After liberation, the banks operating in
Bangladesh (except those incorporated abroad)
were nationalised. These banks were merged and
grouped into six commercial banks. Of the total six
commercial banks, Pubali Bank Ltd. and Uttara Bank
Ltd. were subsequently transferred to the private
sector with effect from January 1985. Rupali Bank
was transferred as public limited company from
December 1986. The rest three State Owned Banks
were operating as public limited company from the
quarter October-December, 2007. The two Govt.
owned specialised banks were renamed as
Bangladesh Krishi Bank and Bangladesh Shilpa Bank.
In March 1987 Bangladesh Krishi Bank was
bifurcated and another specialised bank emerged as
Rajshahi Krishi Unnayan Bank (RAKUB) for Rajshahi
and Rangpur Division. Bank of Small Industries &
Commerce Bangladesh Ltd. (BASIC) started its
operation as a private bank from September 1988.
Later on BASIC was brought under direct control of
the Government and was reckoned to as a
specialised bank with effect from June 1993. From
July 1995 again the BASIC was categorised as a
private bank and from 1997 Government decided to
treat this bank as a Specialised bank again. But from
January 2015 Government decided to treat this
bank as a State Owned Bank. So in this booklet,
from January‐March, 2015 the BASIC has been
treated as a State Owned Bank. Bangladesh Shilpa
Bank (BSB) & Bangladesh Shilpa Rin Sangstha (BSRS)
merged and renamed as Bangladesh development
Bank Limited (BDBL) from the quarter
January‐March, 2010 treated as specialized bank.
But from this quarter (April‐June’15) according to
Government decision BDBL is being treated as State
Owned Bank. Standard Chartered Grindlays Bank
was merged with Standard Chartered Bank during
the Quarter January-March, 2003. American Express
Bank also merged with Standard Chartered Bank
during the quarter October-December, 2005. The
Oriental Bank Ltd. an Islamic private bank was
renamed as ICB Islamic Bank Ltd. from the quarter
April-June, 2008. Credit Agricole Indosuez, a foreign
private bank is renamed as Commercial Bank of
Ceylon Ltd. from the quarter October-December,
2003. Shamil Bank is renamed as Bank Al-Falah Ltd.
from the quarter April-June, 2005. Arab Bangladesh
Bank Ltd. is renamed as AB Bank Ltd. from the
quarter January-March, 2008 and Social Investment
Bank Ltd. is renamed as Social Islami Bank Ltd. from
the quarter April-June, 2009. It is mentioned that
First Security Bank Ltd. has started its operation
according to Islamic Sariah from the quarter
January-March, 2009, Shahjalal Bank Ltd. has
started its operation according to Islamic Sariah
from the quarter April-June, 2001 and it is renamed
as Shahjalal Islami Bank Ltd. from the quarter April-
June, 2004 and EXIM Bank Ltd. has also started its
operation according to Islamic Sariah from the
quarter July-September, 2004. The branches of
foreign banks operating in Bangladesh are being
treated as foreign private banks.
Among all fourth generation Scheduled Banks
“NRB Commercial Bank Ltd.”, “South Bangla
Agriculture and Commerce Bank Ltd.”, “Meghna
Bank Ltd.”, “The Farmers Bank Ltd.”, and “Union
Bank Ltd.” have started their operation from the
quarter April-June, 2013. “Midland Bank Ltd.”,
“Modhumoti Bank Ltd.”, “NRB Bank Ltd.” have
started their operation from the quarter July-
September, 2013 and “NRB Global Bank Ltd” has
started their operation from the quarter October-
December, 2013. It is mentioned that Union Bank
Ltd. based on Islamic Sariah.
All such banks operating in Bangladesh with
different paid-up capital and reserves having a
minimum of an aggregate value of Tk. 50 lac and
conducting their affairs to the satisfaction of the
Bangladesh Bank have been declared as scheduled
banks in terms of section 37(2) of Bangladesh Bank
Order 1972. In terms of section 13 of Bank
Company Act, 1991, the minimum aggregate value
ii
was Tk. 20 crore. From 30 March 2003 it was Tk.
100 crore. From 08 October 2007 it was Tk. 200
crore. From 11 August 2011 it has been raised at
the minimum of Tk. 400 crore (as per Circular Letter
No. BRPD(R-1)717/2008-511 dated August 12,
2008).
The names of the Scheduled Banks whose operations are recorded in this volume are as below:
A. STATE OWNED BANKS:
1. Agrani Bank Limited.
2. Janata Bank Limited.
3. Rupali Bank Limited.
4. Sonali Bank Limited.
5. Bank of Small Industries and Commerce
Bangladesh Ltd.
6. Bangladesh Development Bank Limited.
B. SPECIALSED BANKS:
1. Bangladesh Krishi Bank.
2. Rajshahi Krishi Unnayan Bank.
C. PRIVATE BANKS:
a) Foreign Banks:
1. Standard Chartered Bank
2. State Bank of India
3. Habib Bank Ltd.
4. Citi Bank, N.A.
5. Commercial Bank of Ceylon Ltd.
6. National Bank of Pakistan
7. Woori Bank
8. The Hong Kong & Shanghai Banking
Corporation Ltd.
9. Bank Al-Falah Ltd.
b) Private Banks (Incorporated in
Bangladesh excluding Islamic Banks):
1. AB Bank Ltd.
2. National Bank Ltd.
3. The City Bank Ltd.
4. International Finance Investment and
Commerce Bank Ltd.
5. United Commercial Bank Ltd.
6. Pubali Bank Ltd.
7. Uttara Bank Ltd.
8. Eastern Bank Ltd.
9. National Credit and Commerce Bank Ltd.
10. Prime Bank Ltd.
11. Southeast Bank Ltd.
12. Dhaka Bank Ltd.
13. Dutch Bangla Bank Ltd.
14. Mercantile Bank Ltd.
15. Standard Bank Ltd.
16. One Bank Ltd.
17. Bangladesh Commerce Bank Ltd.
18. Mutual Trust Bank Ltd.
19. Premier Bank Ltd.
20. Bank Asia Ltd.
21. Trust Bank Ltd.
22. Jamuna Bank Ltd.
23. BRAC Bank Ltd.
24. NRB Commercial Bank Ltd.
25. South Bangla Agriculture and Commerce
Bank Ltd.
26. Meghna Bank Ltd.
27. Midland Bank Ltd.
28. The Farmers Bank Ltd.
29. NRB Bank Ltd.
30. Modhumoti Bank Ltd.
31. NRB Global Bank Ltd.
c) Islamic Banks
1. Islami Bank Bangladesh Ltd.
2. ICB Islamic Bank Ltd.
3. Al-Arafah Islami Bank Ltd.
4. Social Islami Bank Ltd.
5. EXIM Bank Ltd.
6. First Security Islami Bank Ltd.
7. Shahjalal Islami Bank Ltd.
8. Union Bank Ltd
The banks play an important role in the
economy of the country. Bangladesh Bank has
been collecting, compiling and publishing statistics
on scheduled banks for the use of researchers,
planners and policy makers.
The statistical tables contained in this issue
have been prepared from the returns submitted
by the individual bank branches of scheduled
banks as on the last day of the quarter ending
December 31, 2015. At the end of the period
under study the total number of reported bank
branches including Head Offices, Islamic Windows
and SME service centers stood at 9,397, which
contains only 76 branches of foreign banks.
iii
For useful presentation of data, banks have
been classified into several groups viz. ‘All Banks’,
‘State owned Banks’, ‘Specialised Banks’, ‘Foreign
Banks’, and ‘Private Banks’ (Including Islamic
Banks). A separate subgroup named as ‘Islamic
Banks’ has been introduced consisting of seven
banks (Incorporated in Bangladesh), run on the
basis of Islamic Sariah with effect from quarter
January-March 1998. These banks are 1) Islamic
Bank Bangladesh Ltd. 2) ICB Islamic Bank Ltd. 3)
Al-Arafah Islami Bank Ltd. 4) Social Islami Bank
Ltd. 5) EXIM Bank Ltd. 6) Shahjalal Islami Bank Ltd.
7) First Security Islami Bank Ltd. and 8) Union
Bank Ltd.
The publication provides a detailed analysis
of bank deposits (excluding inter-bank) mainly in
the form of ‘by Types & Sectors’, ‘by Rates of
Interest & Types’, ‘by Types of Account’;
outstanding advances (excluding inter-bank
transactions) mainly in the form of ‘by Rates of
Interest & Securities’, ‘by Securities’, ‘by Size of
Account’, ‘by Economic Purposes’ etc. and bills
mainly in the form of ‘by Sectors’.
From the very inception, the ‘Scheduled
Banks Statistics’ were being collected and
published on quarterly basis. Later on since
December, 1988 the data had been collected on
half yearly basis and published on annual basis
ending December every year. Subsequently, from
December 1990 the data were collected on
quarterly basis but published on annual basis.
Then it was decided to publish again on quarterly
basis from June 1992 and the present publication
follows as a sequel to the change in the policy
decision.
The role of agricultural credit in fostering the
economy of the country has gained importance
nowadays. To this end in mind agricultural credit
statistics time series data were collected and
presented pertaining to the period from 1984-85
to 2014-15 (up to December 31, 2015).
The figures published in this booklet may
differ from those contained in the statement of
position of Scheduled Banks released each week
by the Bangladesh Bank due to difference in
timing and coverage.
From the quarter July-September, 2013 the
Scheduled Banks were instructed to follow the
‘Guidelines to Fill in the Banking Statistics
Returns SBS-1, SBS-2 & SBS-3’ fifth edition,
published in July 2013. In this brochure, all
statistical tables have been prepared on the basis
of returns, submitted by the scheduled banks as
per the booklet, published in July 2013.
For taking into account, the remittances (in
Foreign Currency) by the Wage earners abroad,
two types of deposits: 1) Wage Earners’ Deposits
& 2) Resident Foreign Currency Deposits have
been introduced from the quarter ending on
December, 2001.
After implementing Enterprise Data Warehouse
(EDW), while preparing tables from “Business
Intelligence - Production Database” of EDW for
the booklet, figures of ‘amount’ were rounded
off into lac at the individual entry level i.e.
amount less than 50 thousand turned into zero
and amount between 50-99 thousand turned
into 1 lac. As a result, a huge difference
between published and actual total amount in
the October-December’14 quarter was observed
in the tables due to the fact that 85% of deposit
and 71% of advance accounts are less than Taka
50 thousand, whereas 5.5% (deposit) and 12%
(advance) accounts are between taka 50-99
thousand and rest 9.5% (deposit) and 17%
(advance) accounts are greater than taka 1 lac.
For this reason, in this quarter the difference
between published and actual total amount in
Deposit and Advance are respectively 12251
crore and 2998 crore taka.
To overcome this problem, from
January-March’15 quarter, unit figures of
‘amount’ are considered while preparing the
tables from EDW and then in the booklet figures
are presented in lac.
iv
EXPLANATORY NOTES TO THE TABLES
Table-1: Divisions/Districts wise distribution of
per capita Deposits/Advances on the basis of
population: The table furnishes the
division/district wise distribution of population,
number of reporting bank branches, per capita
deposits and per capita advances.
Table-2 to 7: Deposits Distributed by Types of
Accounts: These tables show the classification of
total demand and time liabilities of scheduled
banks (excluding inter-bank) into fourteen broad
types such as (a) Current and Cash Credit Account
(credit balances) Deposits, (b) Deposits
withdrawable on Sight, (c) Savings Deposits, (d)
Convertible Taka Accounts of Foreigners, (e)
Foreign Currency Accounts, (f) Wage Earners’
Deposits, (g) Resident Foreign Currency Deposits,
(h) SpecialNotice Deposits, (i) Fixed Deposits, (j)
Recurring Deposits, (k) Margin Deposits (Foreign
Currency/Taka), (l) Special Purpose Deposits, (m)
Negotiable Certificates of Deposits& Promissory
Notes and (n) Restricted (Blocked) Deposits.
a) Current and Cash Credit Accounts Deposits:
These are of the nature of demand deposits
and comprise current accounts and credit
balances of cash credit accounts. Generally
no interest is allowed on these deposits.
These deposits are to be reported in code
no.-100 as usual but from the quarter,
October-December, 2005 some banks have
started paying interest on this type of
account. This later type is to be reported in
code no.-105. These accounts have chequing
facilities and balances are transferable.
b) Deposits Withdrawable on Sight: This item
includes all deposits which cannot be
transferred through cheques but are
withdrawable on demand such as overdue
Fixed Deposits Accounts, unclaimed
balances, payment orders, telephonic
transfers, mail transfers, demand drafts,
unclaimed dividends and draft payable
accounts, Earnest Money of
Tenders/Quotations etc.
c) Saving Deposits Account: Deposit on these
accounts are self-explanatory and generally
emanates from the individuals. A portion,
varying from time to time, of savings
deposits constitutes demand deposits. From
1st July, 1996 11% of savings deposits was
regarded as demand deposits and from 1st
July 1997, it was 10%. At present from 24th
June, 2007, 9% of savings deposits has been
being regarded as demand deposits.
d) Convertible Taka Account of Foreigners:
Convertible Taka account of foreigners are
deposits of foreign individuals, embassies,
foreign Governments and international
agencies, all of which have non-resident
status under foreign exchange regulations.
e) Foreign Currency Accounts: Foreign
currency accounts consist of the deposits (in
foreign currency) of the foreigners (residing
abroad or in Bangladesh) and foreign
missions & their expatriate employees.
f) Wage Earners’ Deposits: The depositors of
these accounts are the Bangladeshi
nationals, who work abroad. These accounts
are fed by the remittances (in foreign
currency) from these persons. Deposits in
NFCD accounts along with interest thereon
are also reported in these accounts.
g) Resident Foreign Currency Deposits:
Persons ordinarily residing in Bangladesh
may open this account with foreign
exchanges brought in at the time of their
return from travel abroad. Deposits or
remittances from persons, working in
Bangladesh missions abroad and Retention
quota deposits by the exporters are also
included in these deposits.
h) Special Notice Deposits: This item includes
the deposits that are deposited for a period
ranging from 7 days to 89 days. These types
of liabilities are payable on Special notice or
after a specified period other than the fixed
deposits. Some of these types of deposits
are of the nature of time deposits.
i) Fixed Deposits: These are reclassified by
period of maturity and are exclusively time
deposits.
v
j) Recurring Deposits: According to this
scheme the investors would be required to
deposit their money limited to maximum of
Tk. 500 per month for a period of 10 years
and 20 years. Interest on the invested
amount will be compounded at the rate of
15% and calculated on yearly basis. Deposits
Pension schemes are of the nature of time
deposits and it was introduced in 1983.
Later on Deposits Scheme e.g. APS, SDPS,
SPS, PDS, PSS etc. and Hajj Deposits
Schemes have been introduced by the
various Banks with various interests.
k) Margin Deposits (Foreign Currency/
Taka) : Equivalent Taka of margin on letters
of Credit and margins on guarantee (in Taka
& Foreign Currency) are included in this
item.
l) Special Purpose Deposits: This item
comprises employees’ provident
funds/pension Accounts, contribution
towards insurance funds, Hajj Deposits, Staff
guarantee/Security funds, Security Deposits,
Gift Certificate Deposits, Sundry deposits,
Surcharge and Development charge etc.
m) Negotiable Certificates of Deposits and
Promissory Notes: Negotiable certificates of
deposits are bearer certificate deposits and
are of nature of time deposits.
n) Restricted (Blocked) Deposits: The balances
of restricted (blocked) deposits are reported
in this item against Private Sector. According
to Special Law, the competent authority
blocks these accounts. In blocked period,
the depositors cannot withdraw their
deposits.
Table 8 to 13. Deposits Distributed by Divisions/
Districts and Areas (Urban & Rural): These tables
show the district-wise distribution of deposits of
urban and rural regions of the country. It is
mentioned that the transaction of the branches
in municipal area is treated as urban area
transaction (deposits or advances as the case
may be) while the transaction of the branches
located out-side the municipal area is regarded as
rural area transaction (deposits or advances).
Table 14 to 19: Deposits Distributed by Sectors
and Types: These Tables provide a break up of
deposits by different sectors of deposits
mentioned in the paragraph number two.
Table 20 to 25: Deposits Distributed by Rates of
Interest/Profit and Types: These tables show the
rates of interest allowed by the scheduled banks
on different types of deposits. No interest is
allowed on current deposits (without interest,
Code no.-100)and deposits withdrawable on sight
while interest is allowed on current deposits
(with interest, Code no.-105), savings deposits,
fixed deposits, pension scheme deposits and
foreign currency accounts of non-residents and
residents. The rate of interest varies from time to
time. The amount of deposits against “Zero” rate
of interest under “Deposits Withdrawable on
Sight” represents mainly the bills payables such
as MT, DD, TT, outstanding drafts etc. Depositors
will have the option for withdrawing interest
accumulated every twelve months or can have
the interest with the principal to be compounded
in case of maturity exceeding one year.
Profit/Loss is applicable in the cases of Islamic
Banks (Islami Bank Bangladesh Ltd., ICB Islamic
Bank Ltd., Al-Arafah Islami Bank Ltd., Social Islami
Bank Ltd., EXIM Bank Ltd, First Security Islami
Bank Ltd., Shahjalal Islami Bank Ltd. and Union
Bank Ltd.).
Table 26 to 31: Deposits Distributed by Size of
Accounts: The Statistics of number of Accounts
and corresponding amount falling within
specified groups are not based exclusively on
individual accounts. As the number of accounts is
considerably large, the respondents have the
option to combine the accounts and amount in
such cases when the types of deposits, the
category of depositors and the rates of interest
allowed thereon are the same. In such cases it is
not the actual size of components but the
average size of the group that determines the
class to which it belongs. Notwithstanding the
existence of an element of statistical errors, it is
believed that the estimates would not differ
significantly from the actual position.
vi
Table 32: Deposits Distributed by Size of
Accounts and Sectors: The Tables provide a break
up of deposits by size of accounts and sector.
Table 33: Deposits Distributed by Selected
Thanas: The statistics show the distribution of
deposits in the leading thanas of the country and
those have been presented in the descending
order of magnitude of deposits.
Table 34: Debits to Deposits Accounts and
Turnover: The table shows debits to various
types of deposit accounts during the period
under review. This also includes co-efficient of
turnover by relating debits to average amounts of
deposits.
Table 35 to 40: Advances Classified by Securities:
These tables show the break-up of scheduled
banks advances (excluding interbank) by types of
securities pledged or hypothecated.
Table 41 to 46: Advances Classified by Economic
Purposes: These tables show the advances made
by scheduled banks to different economic
purposes for which the borrowers borrow. If a
borrower pursues more than one profession the
classification is done in accordance with his major
calling.
Table 47 to 52: Advances Classified by Rates of
Interest and Securities: These tables give the
rates of interest charged by the scheduled banks
on various types of securities as well as clean
advances. Advances to “Zero” rate of interest
mostly represent (a) Advances to bank’s own
employees (b) Classified advances (Bad/ Loss) (c)
Advances associated with clearing disputes etc.
Table 53: Advances Classified by Selected
Thanas: This table shows the classification of
advances in the leading thanas of the country and
those have been presented in the descending
order of magnitude of advances.
Table 54: Advances Classified by Size of
Accounts and Economic Groups: The table
provides statistics on advances classified by size
of accounts and economic groups. The
respondents can group those accounts together
where the securities, the economic purpose, the
category of borrowers and the rates of interest
are the same. As a result the size of distribution
suffers from a similar limitation as its analogy in
deposits.
Table 55 to 60: Advances Classified by Size of
Accounts: These tables provides statistics on
advances classified by size of accounts.
Table 61: Advances Classified by Major
Economic Purposes and Sectors: The table
provides a break-up of advances classified by
major economic purposes to public and private
sectors.
Table 62 to 67: Advances Classified by Division /
Districts and Areas (Urban / Rural): These tables
show the district-wise classification of advances
of urban and rural regions of the country.
Table 68: Advances Classified by Size of
Accounts and Sectors: The table provides
statistics on advances classified by size of
accounts and sector.
Table 69 to 74: Advances Classified by Rates of
Interest and Major Economic Purposes: These
tables provide rates of interest charged by the
scheduled banks on advances for different
economic purposes.
Table 75 to 80: Agricultural Credits Statistics.
Table 81: Disbursement, Overdue & Recovery of
Agricultural and Non-Farm Rural Credit Position.
Table 82: SME Credit Position.
Table 83 to 88: Classification of Bills purchased
and discounted: The statement provides an
account of bills purchased and discounted by
major economic purposes of drawees. Along with
the corresponding statement on advances the
statistics provide information on the structure of
bank credit.
Table 89: Classification of Bills by Sectors.
Table 90: Disbursement, Overdue & Recovery of
Advances by Sectors.
Table 91: Disbursement, Overdue & Recovery of
Advances by Economic Purposes.
vii
A Review on Deposits and Advances of Scheduled Banks (As on end December, 2015)
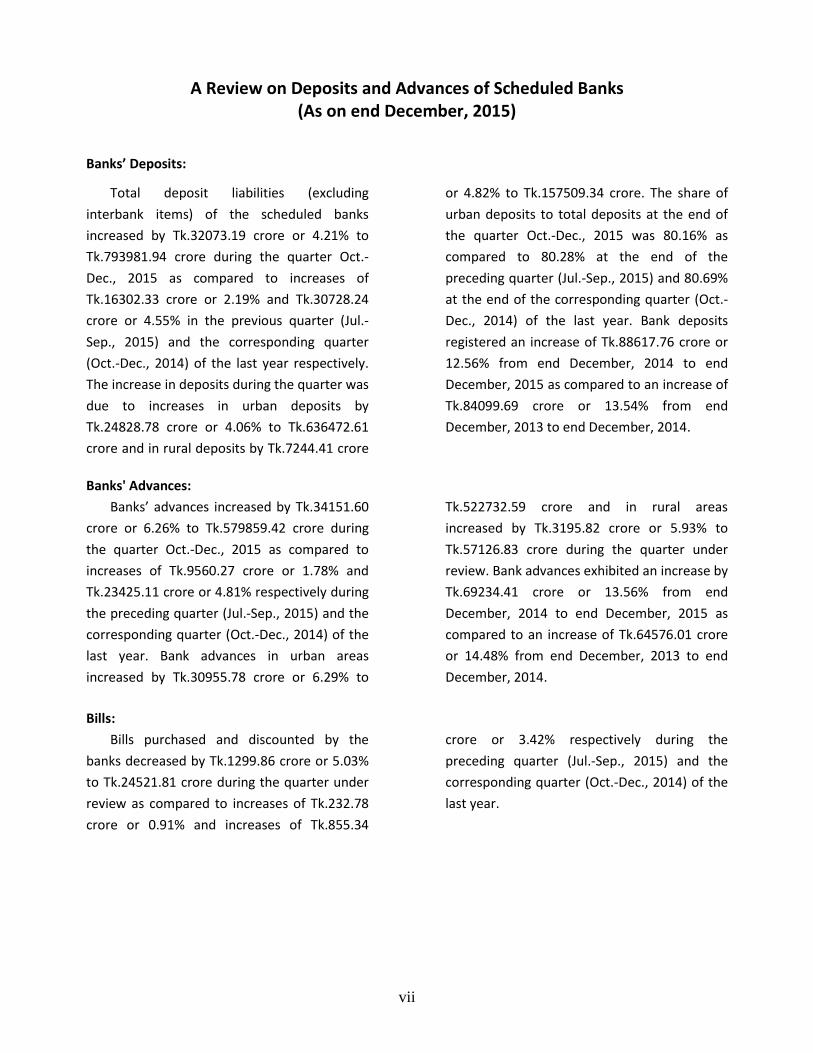
Banks’ Deposits:
Total deposit liabilities (excluding
interbank items) of the scheduled banks
increased by Tk.32073.19 crore or 4.21% to
Tk.793981.94 crore during the quarter Oct.-
Dec., 2015 as compared to increases of
Tk.16302.33 crore or 2.19% and Tk.30728.24
crore or 4.55% in the previous quarter (Jul.-
Sep., 2015) and the corresponding quarter
(Oct.-Dec., 2014) of the last year respectively.
The increase in deposits during the quarter was
due to increases in urban deposits by
Tk.24828.78 crore or 4.06% to Tk.636472.61
crore and in rural deposits by Tk.7244.41 crore
or 4.82% to Tk.157509.34 crore. The share of
urban deposits to total deposits at the end of
the quarter Oct.-Dec., 2015 was 80.16% as
compared to 80.28% at the end of the
preceding quarter (Jul.-Sep., 2015) and 80.69%
at the end of the corresponding quarter (Oct.-
Dec., 2014) of the last year. Bank deposits
registered an increase of Tk.88617.76 crore or
12.56% from end December, 2014 to end
December, 2015 as compared to an increase of
Tk.84099.69 crore or 13.54% from end
December, 2013 to end December, 2014.
Banks' Advances:
Banks’ advances increased by Tk.34151.60
crore or 6.26% to Tk.579859.42 crore during
the quarter Oct.-Dec., 2015 as compared to
increases of Tk.9560.27 crore or 1.78% and
Tk.23425.11 crore or 4.81% respectively during
the preceding quarter (Jul.-Sep., 2015) and the
corresponding quarter (Oct.-Dec., 2014) of the
last year. Bank advances in urban areas
increased by Tk.30955.78 crore or 6.29% to
Tk.522732.59 crore and in rural areas
increased by Tk.3195.82 crore or 5.93% to
Tk.57126.83 crore during the quarter under
review. Bank advances exhibited an increase by
Tk.69234.41 crore or 13.56% from end
December, 2014 to end December, 2015 as
compared to an increase of Tk.64576.01 crore
or 14.48% from end December, 2013 to end
December, 2014.
Bills:
Bills purchased and discounted by the
banks decreased by Tk.1299.86 crore or 5.03%
to Tk.24521.81 crore during the quarter under
review as compared to increases of Tk.232.78
crore or 0.91% and increases of Tk.855.34
crore or 3.42% respectively during the
preceding quarter (Jul.-Sep., 2015) and the
corresponding quarter (Oct.-Dec., 2014) of the
last year.
viii
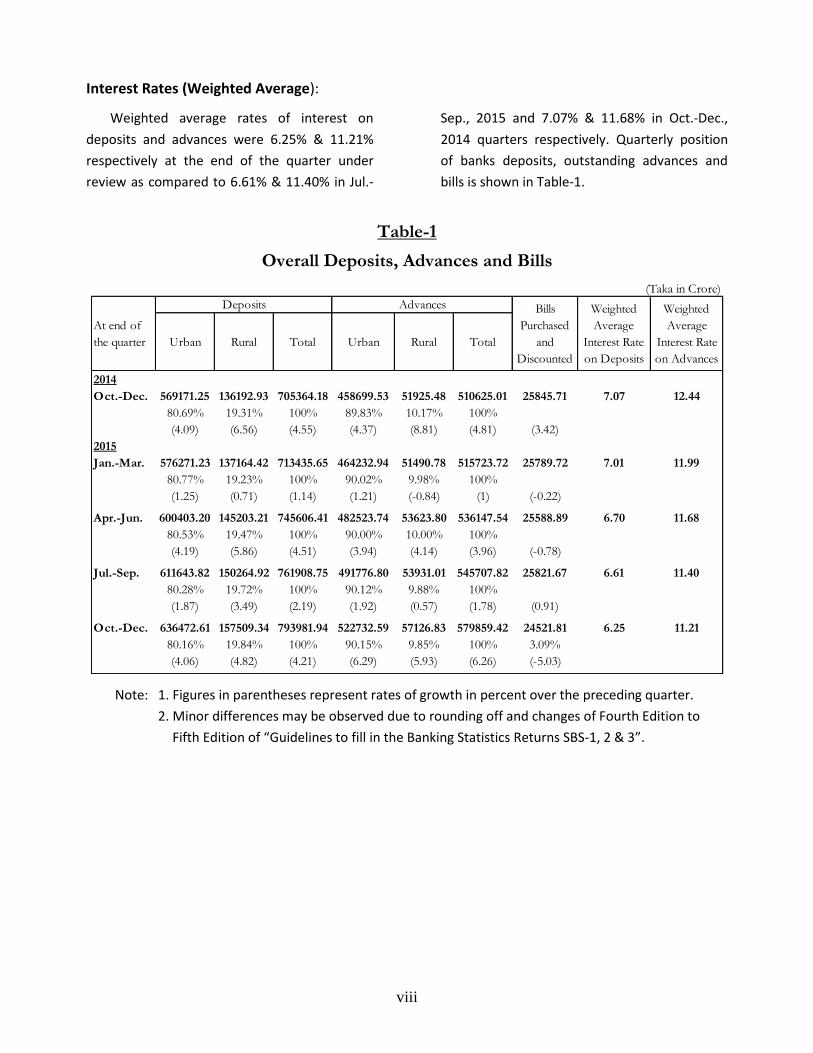
Interest Rates (Weighted Average):
Weighted average rates of interest on
deposits and advances were 6.25% & 11.21%
respectively at the end of the quarter under
review as compared to 6.61% & 11.40% in Jul.-
Sep., 2015 and 7.07% & 11.68% in Oct.-Dec.,
2014 quarters respectively. Quarterly position
of banks deposits, outstanding advances and
bills is shown in Table-1.
Table-1
Overall Deposits, Advances and Bills
(Taka in Crore)
Urban Rural Total Urban Rural Total
2014
Oct.-Dec. 569171.25 136192.93 705364.18 458699.53 51925.48 510625.01 25845.71 7.07 12.44
80.69% 19.31% 100% 89.83% 10.17% 100%
(4.09) (6.56) (4.55) (4.37) (8.81) (4.81) (3.42)
2015
Jan.-Mar. 576271.23 137164.42 713435.65 464232.94 51490.78 515723.72 25789.72 7.01 11.99
80.77% 19.23% 100% 90.02% 9.98% 100%
(1.25) (0.71) (1.14) (1.21) (-0.84) (1) (-0.22)
Apr.-Jun. 600403.20 145203.21 745606.41 482523.74 53623.80 536147.54 25588.89 6.70 11.68
80.53% 19.47% 100% 90.00% 10.00% 100%
(4.19) (5.86) (4.51) (3.94) (4.14) (3.96) (-0.78)
Jul.-Sep. 611643.82 150264.92 761908.75 491776.80 53931.01 545707.82 25821.67 6.61 11.40
80.28% 19.72% 100% 90.12% 9.88% 100%
(1.87) (3.49) (2.19) (1.92) (0.57) (1.78) (0.91)
Oct.-Dec. 636472.61 157509.34 793981.94 522732.59 57126.83 579859.42 24521.81 6.25 11.21
80.16% 19.84% 100% 90.15% 9.85% 100% 3.09%
(4.06) (4.82) (4.21) (6.29) (5.93) (6.26) (-5.03)
Weighted
Average
Interest Rate
on Advances
At end of
the quarter
Deposits Advances Bills
Purchased
and
Discounted
Weighted
Average
Interest Rate
on Deposits
Note: 1. Figures in parentheses represent rates of growth in percent over the preceding quarter.
2. Minor differences may be observed due to rounding off and changes of Fourth Edition to
Fifth Edition of “Guidelines to fill in the Banking Statistics Returns SBS-1, 2 & 3”.
ix
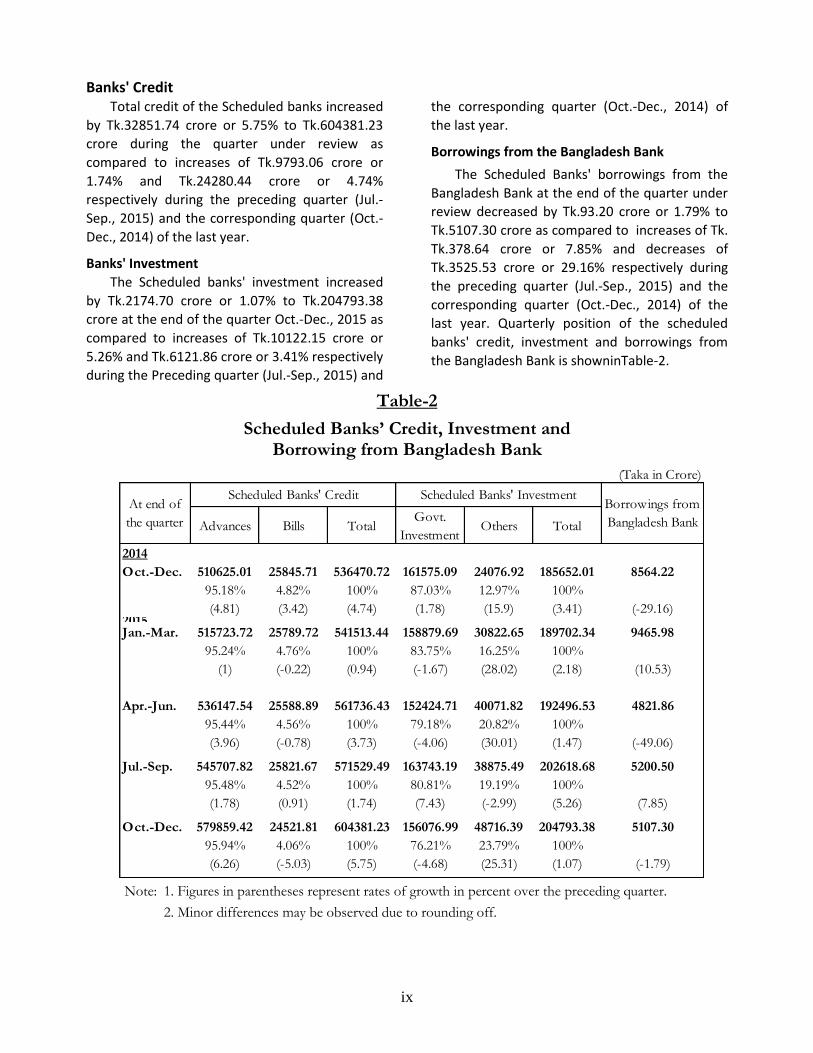
Banks' CreditTotal credit of the Scheduled banks increased
by Tk.32851.74 crore or 5.75% to Tk.604381.23
crore during the quarter under review as
compared to increases of Tk.9793.06 crore or
1.74% and Tk.24280.44 crore or 4.74%
respectively during the preceding quarter (Jul.-
Sep., 2015) and the corresponding quarter (Oct.-
Dec., 2014) of the last year.
Banks' Investment
The Scheduled banks' investment increased
by Tk.2174.70 crore or 1.07% to Tk.204793.38
crore at the end of the quarter Oct.-Dec., 2015 as
compared to increases of Tk.10122.15 crore or
5.26% and Tk.6121.86 crore or 3.41% respectively
during the Preceding quarter (Jul.-Sep., 2015) and
the corresponding quarter (Oct.-Dec., 2014) of
the last year.
Borrowings from the Bangladesh Bank
The Scheduled Banks' borrowings from the
Bangladesh Bank at the end of the quarter under
review decreased by Tk.93.20 crore or 1.79% to
Tk.5107.30 crore as compared to increases of Tk.
Tk.378.64 crore or 7.85% and decreases of
Tk.3525.53 crore or 29.16% respectively during
the preceding quarter (Jul.-Sep., 2015) and the
corresponding quarter (Oct.-Dec., 2014) of the
last year. Quarterly position of the scheduled
banks' credit, investment and borrowings from
the Bangladesh Bank is showninTable-2.
Table-2
Scheduled Banks’ Credit, Investment and Borrowing from Bangladesh Bank
(Taka in Crore)
Advances Bills TotalGovt.
InvestmentOthers Total
2014
Oct.-Dec. 510625.01 25845.71 536470.72 161575.09 24076.92 185652.01 8564.22
95.18% 4.82% 100% 87.03% 12.97% 100%
(4.81) (3.42) (4.74) (1.78) (15.9) (3.41) (-29.16)2015Jan.-Mar. 515723.72 25789.72 541513.44 158879.69 30822.65 189702.34 9465.98
95.24% 4.76% 100% 83.75% 16.25% 100%
(1) (-0.22) (0.94) (-1.67) (28.02) (2.18) (10.53)
Apr.-Jun. 536147.54 25588.89 561736.43 152424.71 40071.82 192496.53 4821.86
95.44% 4.56% 100% 79.18% 20.82% 100%
(3.96) (-0.78) (3.73) (-4.06) (30.01) (1.47) (-49.06)
Jul.-Sep. 545707.82 25821.67 571529.49 163743.19 38875.49 202618.68 5200.50
95.48% 4.52% 100% 80.81% 19.19% 100%
(1.78) (0.91) (1.74) (7.43) (-2.99) (5.26) (7.85)
Oct.-Dec. 579859.42 24521.81 604381.23 156076.99 48716.39 204793.38 5107.30
95.94% 4.06% 100% 76.21% 23.79% 100%
(6.26) (-5.03) (5.75) (-4.68) (25.31) (1.07) (-1.79)
At end of
the quarter
Scheduled Banks' Credit Scheduled Banks' InvestmentBorrowings from
Bangladesh Bank
Note: 1. Figures in parentheses represent rates of growth in percent over the preceding quarter.
2. Minor differences may be observed due to rounding off.
x
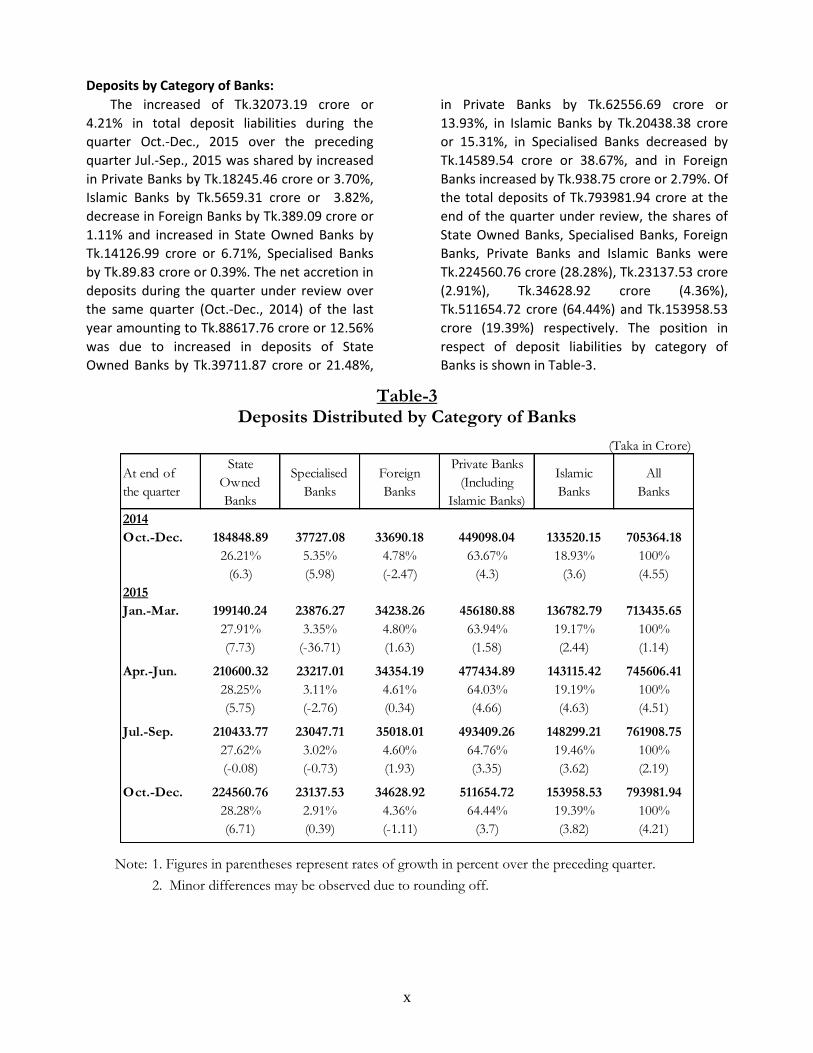
Deposits by Category of Banks:
The increased of Tk.32073.19 crore or
4.21% in total deposit liabilities during the
quarter Oct.-Dec., 2015 over the preceding
quarter Jul.-Sep., 2015 was shared by increased
in Private Banks by Tk.18245.46 crore or 3.70%,
Islamic Banks by Tk.5659.31 crore or 3.82%,
decrease in Foreign Banks by Tk.389.09 crore or
1.11% and increased in State Owned Banks by
Tk.14126.99 crore or 6.71%, Specialised Banks
by Tk.89.83 crore or 0.39%. The net accretion in
deposits during the quarter under review over
the same quarter (Oct.-Dec., 2014) of the last
year amounting to Tk.88617.76 crore or 12.56%
was due to increased in deposits of State
Owned Banks by Tk.39711.87 crore or 21.48%,
in Private Banks by Tk.62556.69 crore or
13.93%, in Islamic Banks by Tk.20438.38 crore
or 15.31%, in Specialised Banks decreased by
Tk.14589.54 crore or 38.67%, and in Foreign
Banks increased by Tk.938.75 crore or 2.79%. Of
the total deposits of Tk.793981.94 crore at the
end of the quarter under review, the shares of
State Owned Banks, Specialised Banks, Foreign
Banks, Private Banks and Islamic Banks were
Tk.224560.76 crore (28.28%), Tk.23137.53 crore
(2.91%), Tk.34628.92 crore (4.36%),
Tk.511654.72 crore (64.44%) and Tk.153958.53
crore (19.39%) respectively. The position in
respect of deposit liabilities by category of
Banks is shown in Table-3.
Table-3 Deposits Distributed by Category of Banks
(Taka in Crore)
At end of
the quarter
State
Owned
Banks
Specialised
Banks
Foreign
Banks
Private Banks
(Including
Islamic Banks)
Islamic
Banks
All
Banks
2014
Oct.-Dec. 184848.89 37727.08 33690.18 449098.04 133520.15 705364.18
26.21% 5.35% 4.78% 63.67% 18.93% 100%
(6.3) (5.98) (-2.47) (4.3) (3.6) (4.55)
2015
Jan.-Mar. 199140.24 23876.27 34238.26 456180.88 136782.79 713435.65
27.91% 3.35% 4.80% 63.94% 19.17% 100%
(7.73) (-36.71) (1.63) (1.58) (2.44) (1.14)
Apr.-Jun. 210600.32 23217.01 34354.19 477434.89 143115.42 745606.41
28.25% 3.11% 4.61% 64.03% 19.19% 100%
(5.75) (-2.76) (0.34) (4.66) (4.63) (4.51)
Jul.-Sep. 210433.77 23047.71 35018.01 493409.26 148299.21 761908.75
27.62% 3.02% 4.60% 64.76% 19.46% 100%
(-0.08) (-0.73) (1.93) (3.35) (3.62) (2.19)
Oct.-Dec. 224560.76 23137.53 34628.92 511654.72 153958.53 793981.94
28.28% 2.91% 4.36% 64.44% 19.39% 100%
(6.71) (0.39) (-1.11) (3.7) (3.82) (4.21)
Note: 1. Figures in parentheses represent rates of growth in percent over the preceding quarter.
2. Minor differences may be observed due to rounding off.
xi
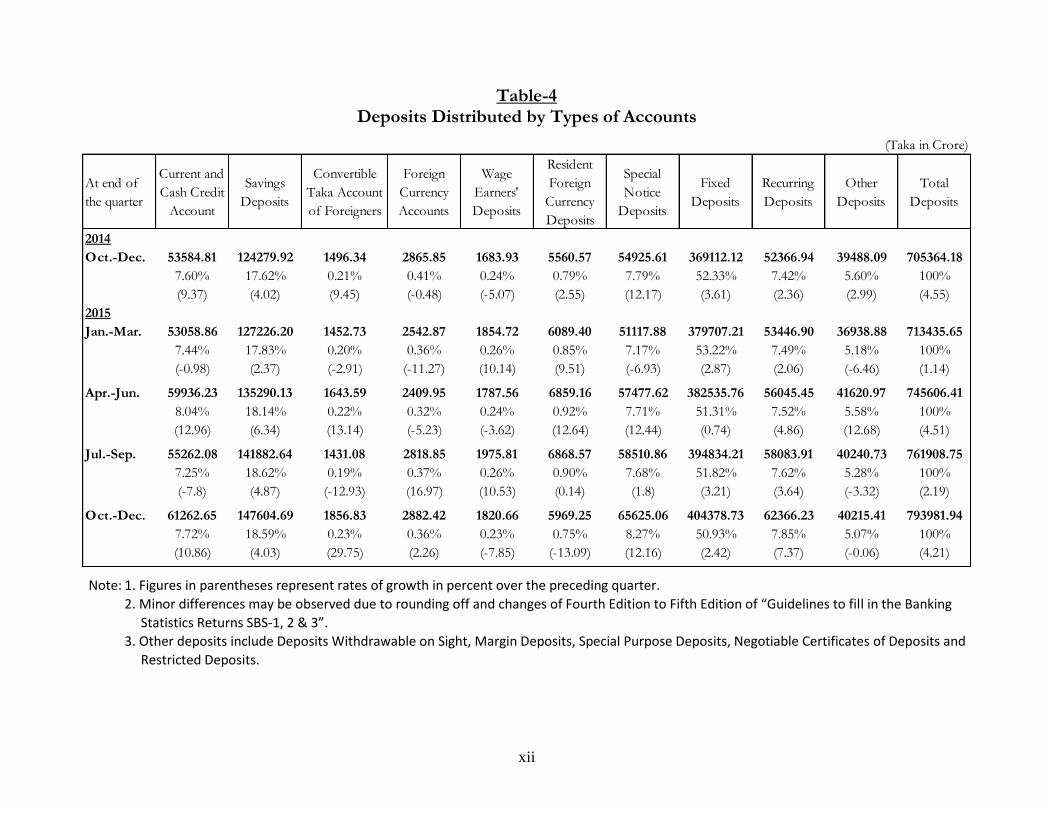
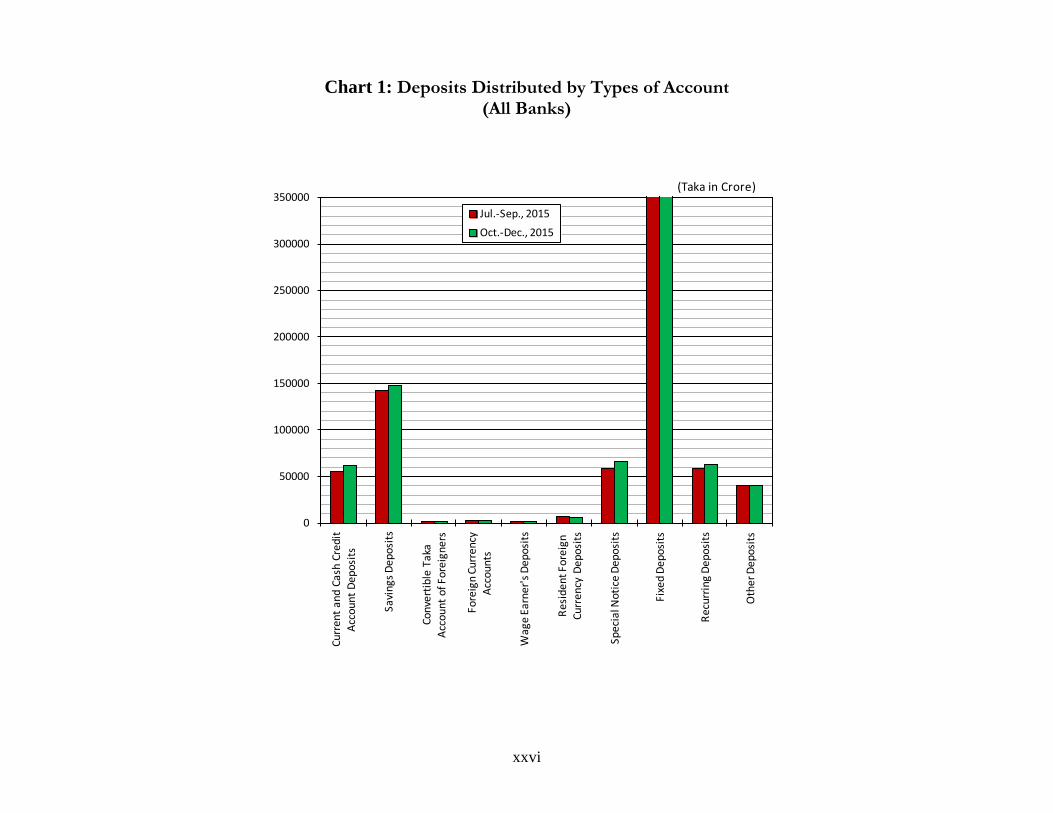
Deposits by Types of Accounts:
Breakdown by types of deposits accounts
revealed that the share of fixed deposits from
51.82% at the end of the quarter Jul.-Sep., 2015
to 50.93% at the end of quarter Oct.-Dec., 2015.
The amount of fixed deposits increased by
Tk.9544.52 crore or 2.42% to Tk.404378.73
crore at the end of the quarter under review as
or compared to increases of Tk.12298.45 crore
or 3.21% and Tk.12857.41 crore or 3.61% at the
end of the preceding quarter (Jul.-Sep., 2015)
and the corresponding quarter (Oct.-Dec., 2014)
of the last year respectively. The share of
savings deposits to total deposits from 18.62%
on the September 30, 2015 to 18.59% on the
December 31, 2015. Deposits distributed by
types of accounts are shown in Table-4.
xii
Table-4 Deposits Distributed by Types of Accounts
At end of
the quarter
Current and
Cash Credit
Account
Savings
Deposits
Convertible
Taka Account
of Foreigners
Foreign
Currency
Accounts
Wage
Earners'
Deposits
Resident
Foreign
Currency
Deposits
Special
Notice
Deposits
Fixed
Deposits
Recurring
Deposits
Other
Deposits
Total
Deposits
2014
Oct.-Dec. 53584.81 124279.92 1496.34 2865.85 1683.93 5560.57 54925.61 369112.12 52366.94 39488.09 705364.18
7.60% 17.62% 0.21% 0.41% 0.24% 0.79% 7.79% 52.33% 7.42% 5.60% 100%
(9.37) (4.02) (9.45) (-0.48) (-5.07) (2.55) (12.17) (3.61) (2.36) (2.99) (4.55)
2015
Jan.-Mar. 53058.86 127226.20 1452.73 2542.87 1854.72 6089.40 51117.88 379707.21 53446.90 36938.88 713435.65
7.44% 17.83% 0.20% 0.36% 0.26% 0.85% 7.17% 53.22% 7.49% 5.18% 100%
(-0.98) (2.37) (-2.91) (-11.27) (10.14) (9.51) (-6.93) (2.87) (2.06) (-6.46) (1.14)
Apr.-Jun. 59936.23 135290.13 1643.59 2409.95 1787.56 6859.16 57477.62 382535.76 56045.45 41620.97 745606.41
8.04% 18.14% 0.22% 0.32% 0.24% 0.92% 7.71% 51.31% 7.52% 5.58% 100%
(12.96) (6.34) (13.14) (-5.23) (-3.62) (12.64) (12.44) (0.74) (4.86) (12.68) (4.51)
Jul.-Sep. 55262.08 141882.64 1431.08 2818.85 1975.81 6868.57 58510.86 394834.21 58083.91 40240.73 761908.75
7.25% 18.62% 0.19% 0.37% 0.26% 0.90% 7.68% 51.82% 7.62% 5.28% 100%
(-7.8) (4.87) (-12.93) (16.97) (10.53) (0.14) (1.8) (3.21) (3.64) (-3.32) (2.19)
Oct.-Dec. 61262.65 147604.69 1856.83 2882.42 1820.66 5969.25 65625.06 404378.73 62366.23 40215.41 793981.94
7.72% 18.59% 0.23% 0.36% 0.23% 0.75% 8.27% 50.93% 7.85% 5.07% 100%
(10.86) (4.03) (29.75) (2.26) (-7.85) (-13.09) (12.16) (2.42) (7.37) (-0.06) (4.21)
(Taka in Crore)
Note: 1. Figures in parentheses represent rates of growth in percent over the preceding quarter.
2. Minor differences may be observed due to rounding off and changes of Fourth Edition to Fifth Edition of “Guidelines to fill in the Banking
Statistics Returns SBS-1, 2 & 3”.
3. Other deposits include Deposits Withdrawable on Sight, Margin Deposits, Special Purpose Deposits, Negotiable Certificates of Deposits and
Restricted Deposits.
xiii
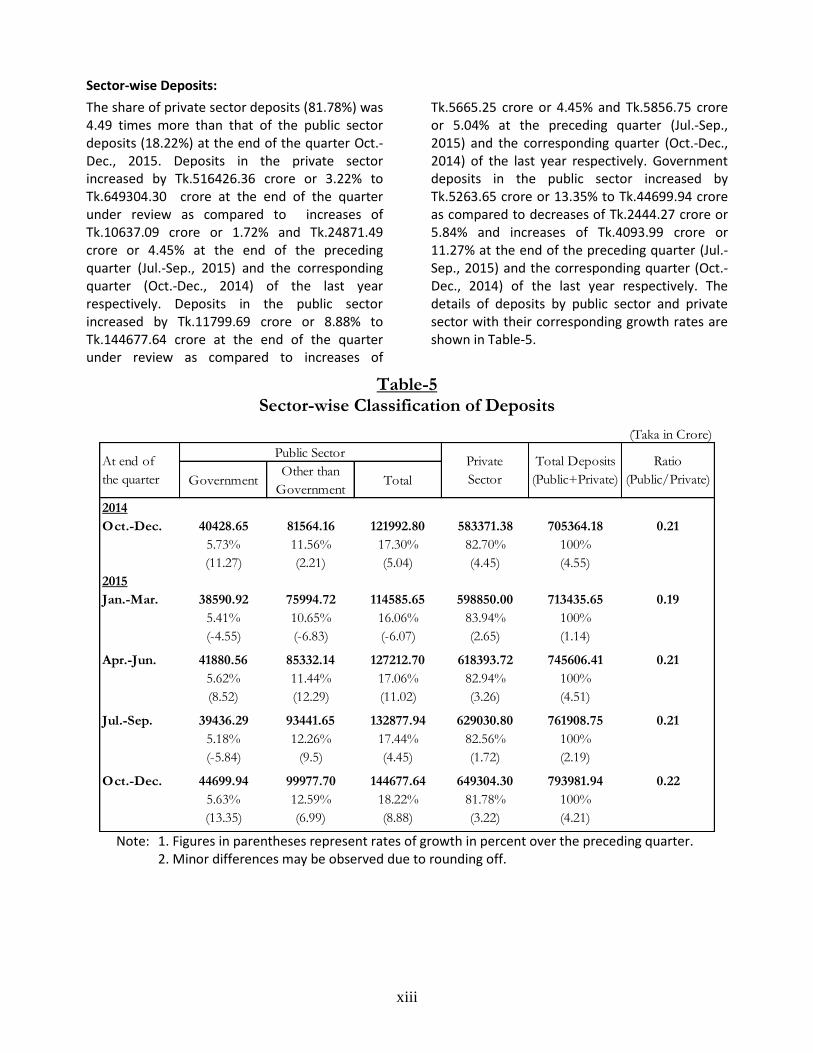
Sector-wise Deposits:
The share of private sector deposits (81.78%) was 4.49 times more than that of the public sector deposits (18.22%) at the end of the quarter Oct.-Dec., 2015. Deposits in the private sector increased by Tk.516426.36 crore or 3.22% to Tk.649304.30 crore at the end of the quarter under review as compared to increases of Tk.10637.09 crore or 1.72% and Tk.24871.49 crore or 4.45% at the end of the preceding quarter (Jul.-Sep., 2015) and the corresponding quarter (Oct.-Dec., 2014) of the last year respectively. Deposits in the public sector increased by Tk.11799.69 crore or 8.88% to Tk.144677.64 crore at the end of the quarter under review as compared to increases of
Tk.5665.25 crore or 4.45% and Tk.5856.75 crore or 5.04% at the preceding quarter (Jul.-Sep., 2015) and the corresponding quarter (Oct.-Dec., 2014) of the last year respectively. Government deposits in the public sector increased by Tk.5263.65 crore or 13.35% to Tk.44699.94 crore as compared to decreases of Tk.2444.27 crore or 5.84% and increases of Tk.4093.99 crore or 11.27% at the end of the preceding quarter (Jul.-Sep., 2015) and the corresponding quarter (Oct.-Dec., 2014) of the last year respectively. The details of deposits by public sector and private sector with their corresponding growth rates are shown in Table-5.
Table-5 Sector-wise Classification of Deposits
(Taka in Crore)
GovernmentOther than
GovernmentTotal
2014
Oct.-Dec. 40428.65 81564.16 121992.80 583371.38 705364.18 0.21
5.73% 11.56% 17.30% 82.70% 100%
(11.27) (2.21) (5.04) (4.45) (4.55)
2015
Jan.-Mar. 38590.92 75994.72 114585.65 598850.00 713435.65 0.19
5.41% 10.65% 16.06% 83.94% 100%
(-4.55) (-6.83) (-6.07) (2.65) (1.14)
Apr.-Jun. 41880.56 85332.14 127212.70 618393.72 745606.41 0.21
5.62% 11.44% 17.06% 82.94% 100%
(8.52) (12.29) (11.02) (3.26) (4.51)
Jul.-Sep. 39436.29 93441.65 132877.94 629030.80 761908.75 0.21
5.18% 12.26% 17.44% 82.56% 100%
(-5.84) (9.5) (4.45) (1.72) (2.19)
Oct.-Dec. 44699.94 99977.70 144677.64 649304.30 793981.94 0.22
5.63% 12.59% 18.22% 81.78% 100%
(13.35) (6.99) (8.88) (3.22) (4.21)
At end of
the quarter
Public Sector Private
Sector
Total Deposits
(Public+Private)
Ratio
(Public/Private)
Note: 1. Figures in parentheses represent rates of growth in percent over the preceding quarter.
2. Minor differences may be observed due to rounding off.
xiv
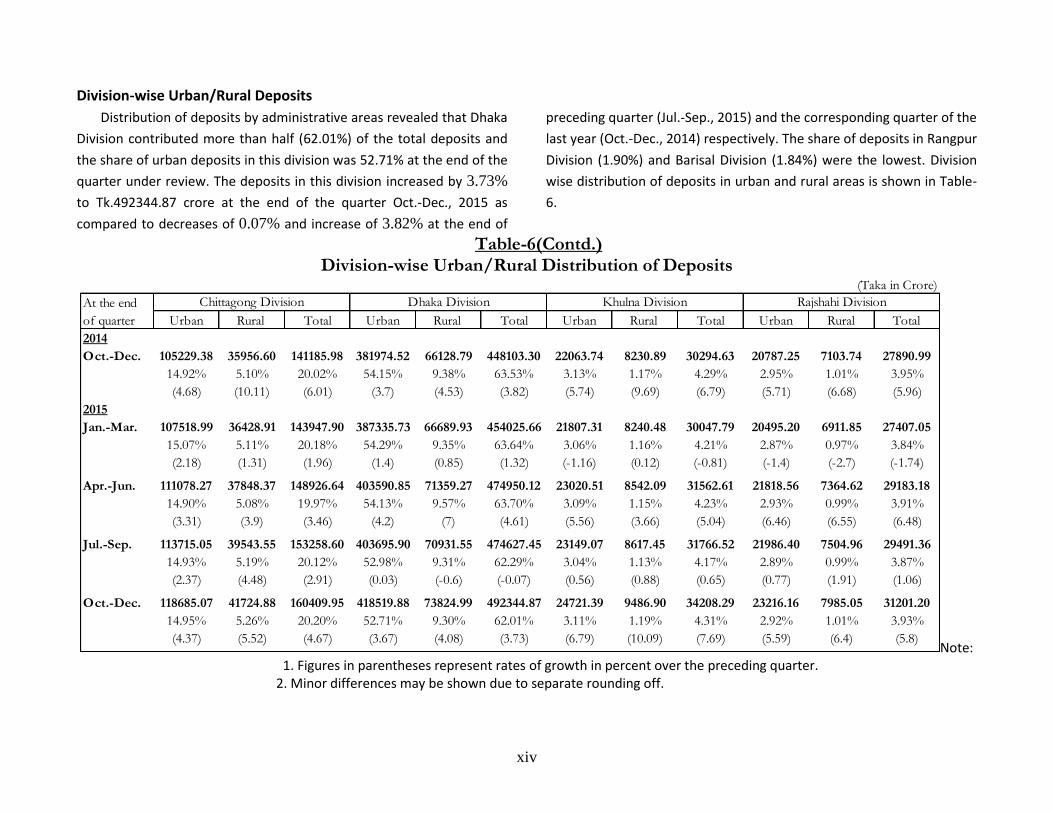
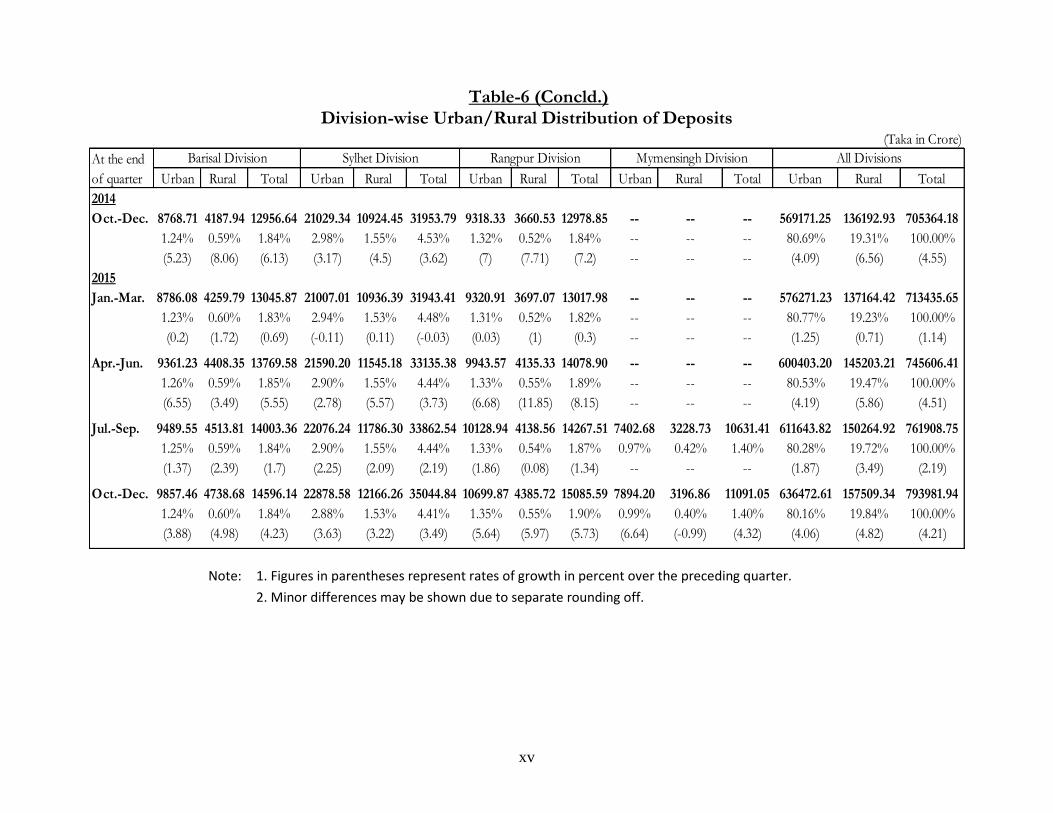
Division-wise Urban/Rural Deposits
Distribution of deposits by administrative areas revealed that Dhaka
Division contributed more than half (62.01%) of the total deposits and
the share of urban deposits in this division was 52.71% at the end of the
quarter under review. The deposits in this division increased by 3.73%
to Tk.492344.87 crore at the end of the quarter Oct.-Dec., 2015 as
compared to decreases of 0.07% and increase of 3.82% at the end of
preceding quarter (Jul.-Sep., 2015) and the corresponding quarter of the
last year (Oct.-Dec., 2014) respectively. The share of deposits in Rangpur
Division (1.90%) and Barisal Division (1.84%) were the lowest. Division
wise distribution of deposits in urban and rural areas is shown in Table-
6.
Table-6(Contd.) Division-wise Urban/Rural Distribution of Deposits
(Taka in Crore)
Urban Rural Total Urban Rural Total Urban Rural Total Urban Rural Total
2014
Oct.-Dec. 105229.38 35956.60 141185.98 381974.52 66128.79 448103.30 22063.74 8230.89 30294.63 20787.25 7103.74 27890.99
14.92% 5.10% 20.02% 54.15% 9.38% 63.53% 3.13% 1.17% 4.29% 2.95% 1.01% 3.95%
(4.68) (10.11) (6.01) (3.7) (4.53) (3.82) (5.74) (9.69) (6.79) (5.71) (6.68) (5.96)
2015
Jan.-Mar. 107518.99 36428.91 143947.90 387335.73 66689.93 454025.66 21807.31 8240.48 30047.79 20495.20 6911.85 27407.05
15.07% 5.11% 20.18% 54.29% 9.35% 63.64% 3.06% 1.16% 4.21% 2.87% 0.97% 3.84%
(2.18) (1.31) (1.96) (1.4) (0.85) (1.32) (-1.16) (0.12) (-0.81) (-1.4) (-2.7) (-1.74)
Apr.-Jun. 111078.27 37848.37 148926.64 403590.85 71359.27 474950.12 23020.51 8542.09 31562.61 21818.56 7364.62 29183.18
14.90% 5.08% 19.97% 54.13% 9.57% 63.70% 3.09% 1.15% 4.23% 2.93% 0.99% 3.91%
(3.31) (3.9) (3.46) (4.2) (7) (4.61) (5.56) (3.66) (5.04) (6.46) (6.55) (6.48)
Jul.-Sep. 113715.05 39543.55 153258.60 403695.90 70931.55 474627.45 23149.07 8617.45 31766.52 21986.40 7504.96 29491.36
14.93% 5.19% 20.12% 52.98% 9.31% 62.29% 3.04% 1.13% 4.17% 2.89% 0.99% 3.87%
(2.37) (4.48) (2.91) (0.03) (-0.6) (-0.07) (0.56) (0.88) (0.65) (0.77) (1.91) (1.06)
Oct.-Dec. 118685.07 41724.88 160409.95 418519.88 73824.99 492344.87 24721.39 9486.90 34208.29 23216.16 7985.05 31201.20
14.95% 5.26% 20.20% 52.71% 9.30% 62.01% 3.11% 1.19% 4.31% 2.92% 1.01% 3.93%
(4.37) (5.52) (4.67) (3.67) (4.08) (3.73) (6.79) (10.09) (7.69) (5.59) (6.4) (5.8)
At the end
of quarter
Chittagong Division Dhaka Division Khulna Division Rajshahi Division
Note: 1. Figures in parentheses represent rates of growth in percent over the preceding quarter.
2. Minor differences may be shown due to separate rounding off.
xv
Table-6 (Concld.) Division-wise Urban/Rural Distribution of Deposits
(Taka in Crore)
Urban Rural Total Urban Rural Total Urban Rural Total Urban Rural Total Urban Rural Total
2014
Oct.-Dec. 8768.71 4187.94 12956.64 21029.34 10924.45 31953.79 9318.33 3660.53 12978.85 -- -- -- 569171.25 136192.93 705364.18
1.24% 0.59% 1.84% 2.98% 1.55% 4.53% 1.32% 0.52% 1.84% -- -- -- 80.69% 19.31% 100.00%
(5.23) (8.06) (6.13) (3.17) (4.5) (3.62) (7) (7.71) (7.2) -- -- -- (4.09) (6.56) (4.55)
2015
Jan.-Mar. 8786.08 4259.79 13045.87 21007.01 10936.39 31943.41 9320.91 3697.07 13017.98 -- -- -- 576271.23 137164.42 713435.65
1.23% 0.60% 1.83% 2.94% 1.53% 4.48% 1.31% 0.52% 1.82% -- -- -- 80.77% 19.23% 100.00%
(0.2) (1.72) (0.69) (-0.11) (0.11) (-0.03) (0.03) (1) (0.3) -- -- -- (1.25) (0.71) (1.14)
Apr.-Jun. 9361.23 4408.35 13769.58 21590.20 11545.18 33135.38 9943.57 4135.33 14078.90 -- -- -- 600403.20 145203.21 745606.41
1.26% 0.59% 1.85% 2.90% 1.55% 4.44% 1.33% 0.55% 1.89% -- -- -- 80.53% 19.47% 100.00%
(6.55) (3.49) (5.55) (2.78) (5.57) (3.73) (6.68) (11.85) (8.15) -- -- -- (4.19) (5.86) (4.51)
Jul.-Sep. 9489.55 4513.81 14003.36 22076.24 11786.30 33862.54 10128.94 4138.56 14267.51 7402.68 3228.73 10631.41 611643.82 150264.92 761908.75
1.25% 0.59% 1.84% 2.90% 1.55% 4.44% 1.33% 0.54% 1.87% 0.97% 0.42% 1.40% 80.28% 19.72% 100.00%
(1.37) (2.39) (1.7) (2.25) (2.09) (2.19) (1.86) (0.08) (1.34) -- -- -- (1.87) (3.49) (2.19)
Oct.-Dec. 9857.46 4738.68 14596.14 22878.58 12166.26 35044.84 10699.87 4385.72 15085.59 7894.20 3196.86 11091.05 636472.61 157509.34 793981.94
1.24% 0.60% 1.84% 2.88% 1.53% 4.41% 1.35% 0.55% 1.90% 0.99% 0.40% 1.40% 80.16% 19.84% 100.00%
(3.88) (4.98) (4.23) (3.63) (3.22) (3.49) (5.64) (5.97) (5.73) (6.64) (-0.99) (4.32) (4.06) (4.82) (4.21)
At the end
of quarter
Barisal Division Sylhet Division Rangpur Division All DivisionsMymensingh Division
Note: 1. Figures in parentheses represent rates of growth in percent over the preceding quarter.
2. Minor differences may be shown due to separate rounding off.
xvi
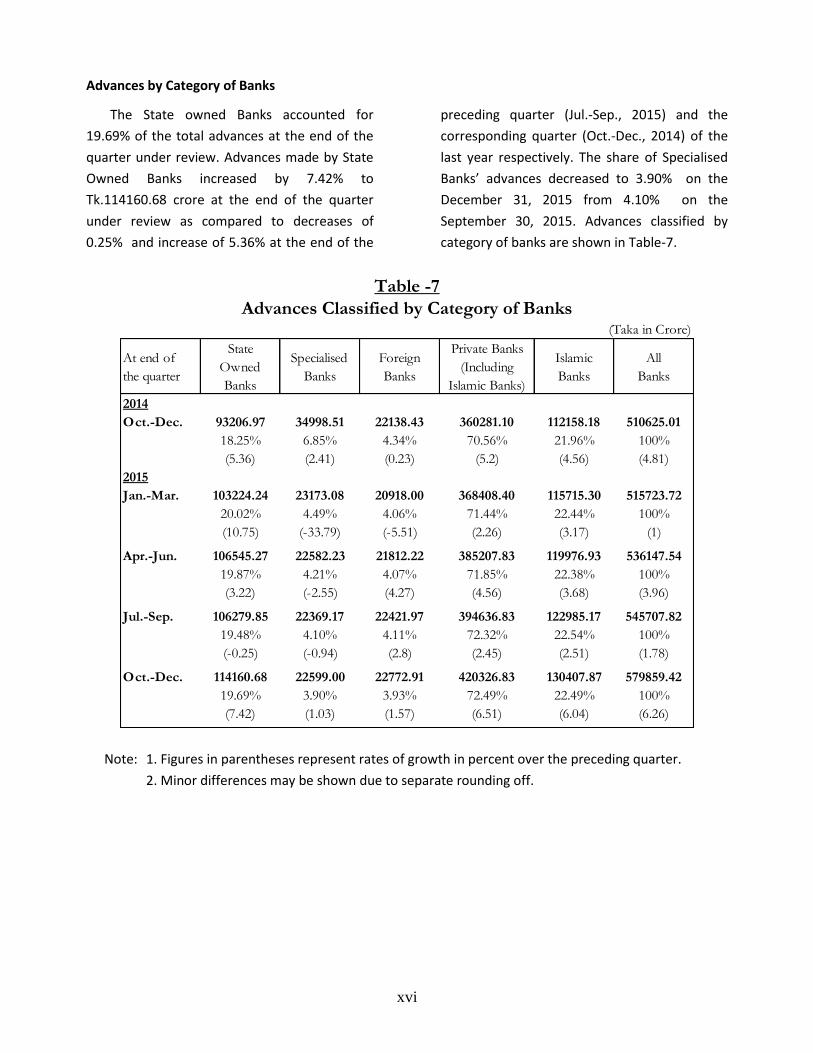
Advances by Category of Banks
The State owned Banks accounted for
19.69% of the total advances at the end of the
quarter under review. Advances made by State
Owned Banks increased by 7.42% to
Tk.114160.68 crore at the end of the quarter
under review as compared to decreases of
0.25% and increase of 5.36% at the end of the
preceding quarter (Jul.-Sep., 2015) and the
corresponding quarter (Oct.-Dec., 2014) of the
last year respectively. The share of Specialised
Banks’ advances decreased to 3.90% on the
December 31, 2015 from 4.10% on the
September 30, 2015. Advances classified by
category of banks are shown in Table-7.
Table -7
Advances Classified by Category of Banks(Taka in Crore)
At end of
the quarter
State
Owned
Banks
Specialised
Banks
Foreign
Banks
Private Banks
(Including
Islamic Banks)
Islamic
Banks
All
Banks
2014
Oct.-Dec. 93206.97 34998.51 22138.43 360281.10 112158.18 510625.01
18.25% 6.85% 4.34% 70.56% 21.96% 100%
(5.36) (2.41) (0.23) (5.2) (4.56) (4.81)
2015
Jan.-Mar. 103224.24 23173.08 20918.00 368408.40 115715.30 515723.72
20.02% 4.49% 4.06% 71.44% 22.44% 100%
(10.75) (-33.79) (-5.51) (2.26) (3.17) (1)
Apr.-Jun. 106545.27 22582.23 21812.22 385207.83 119976.93 536147.54
19.87% 4.21% 4.07% 71.85% 22.38% 100%
(3.22) (-2.55) (4.27) (4.56) (3.68) (3.96)
Jul.-Sep. 106279.85 22369.17 22421.97 394636.83 122985.17 545707.82
19.48% 4.10% 4.11% 72.32% 22.54% 100%
(-0.25) (-0.94) (2.8) (2.45) (2.51) (1.78)
Oct.-Dec. 114160.68 22599.00 22772.91 420326.83 130407.87 579859.42
19.69% 3.90% 3.93% 72.49% 22.49% 100%
(7.42) (1.03) (1.57) (6.51) (6.04) (6.26)
Note: 1. Figures in parentheses represent rates of growth in percent over the preceding quarter.
2. Minor differences may be shown due to separate rounding off.
xvii
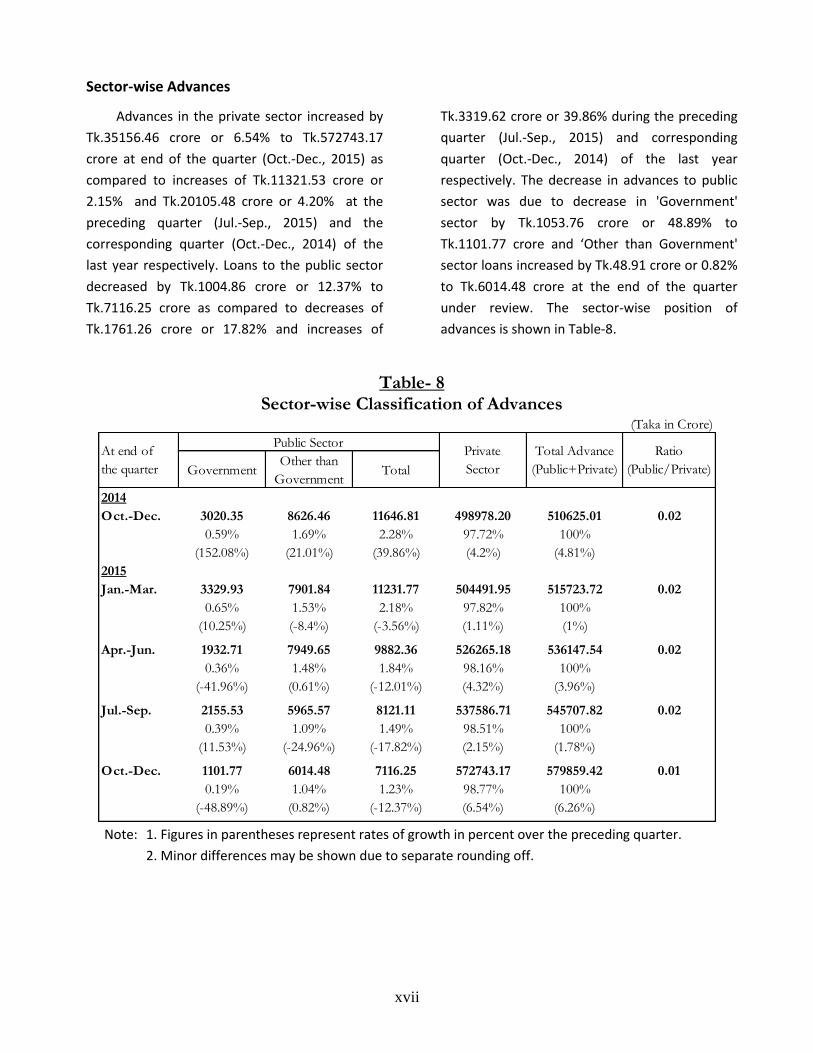
Sector-wise Advances
Advances in the private sector increased by
Tk.35156.46 crore or 6.54% to Tk.572743.17
crore at end of the quarter (Oct.-Dec., 2015) as
compared to increases of Tk.11321.53 crore or
2.15% and Tk.20105.48 crore or 4.20% at the
preceding quarter (Jul.-Sep., 2015) and the
corresponding quarter (Oct.-Dec., 2014) of the
last year respectively. Loans to the public sector
decreased by Tk.1004.86 crore or 12.37% to
Tk.7116.25 crore as compared to decreases of
Tk.1761.26 crore or 17.82% and increases of
Tk.3319.62 crore or 39.86% during the preceding
quarter (Jul.-Sep., 2015) and corresponding
quarter (Oct.-Dec., 2014) of the last year
respectively. The decrease in advances to public
sector was due to decrease in 'Government'
sector by Tk.1053.76 crore or 48.89% to
Tk.1101.77 crore and ‘Other than Government'
sector loans increased by Tk.48.91 crore or 0.82%
to Tk.6014.48 crore at the end of the quarter
under review. The sector-wise position of
advances is shown in Table-8.
Table- 8
Sector-wise Classification of Advances (Taka in Crore)
GovernmentOther than
GovernmentTotal
2014
Oct.-Dec. 3020.35 8626.46 11646.81 498978.20 510625.01 0.02
0.59% 1.69% 2.28% 97.72% 100%
(152.08%) (21.01%) (39.86%) (4.2%) (4.81%)
2015
Jan.-Mar. 3329.93 7901.84 11231.77 504491.95 515723.72 0.02
0.65% 1.53% 2.18% 97.82% 100%
(10.25%) (-8.4%) (-3.56%) (1.11%) (1%)
Apr.-Jun. 1932.71 7949.65 9882.36 526265.18 536147.54 0.02
0.36% 1.48% 1.84% 98.16% 100%
(-41.96%) (0.61%) (-12.01%) (4.32%) (3.96%)
Jul.-Sep. 2155.53 5965.57 8121.11 537586.71 545707.82 0.02
0.39% 1.09% 1.49% 98.51% 100%
(11.53%) (-24.96%) (-17.82%) (2.15%) (1.78%)
Oct.-Dec. 1101.77 6014.48 7116.25 572743.17 579859.42 0.01
0.19% 1.04% 1.23% 98.77% 100%
(-48.89%) (0.82%) (-12.37%) (6.54%) (6.26%)
At end of
the quarter
Public Sector Private
Sector
Total Advance
(Public+Private)
Ratio
(Public/Private)
Note: 1. Figures in parentheses represent rates of growth in percent over the preceding quarter.
2. Minor differences may be shown due to separate rounding off.
xviii
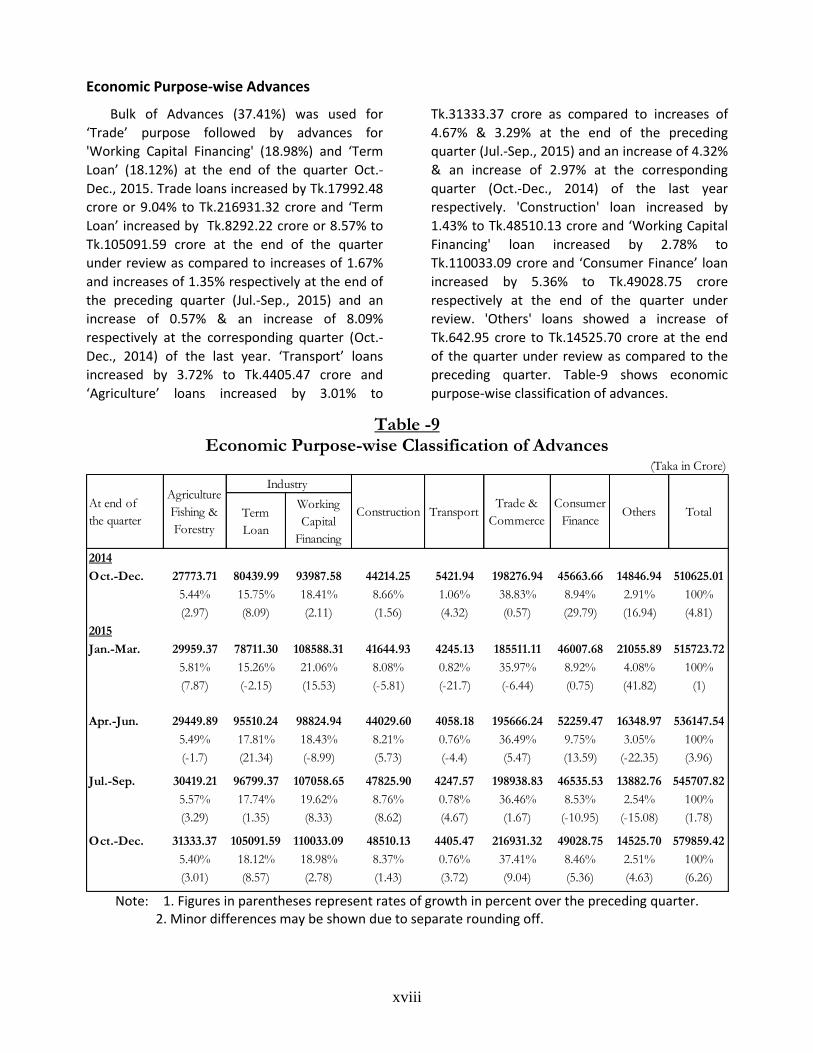
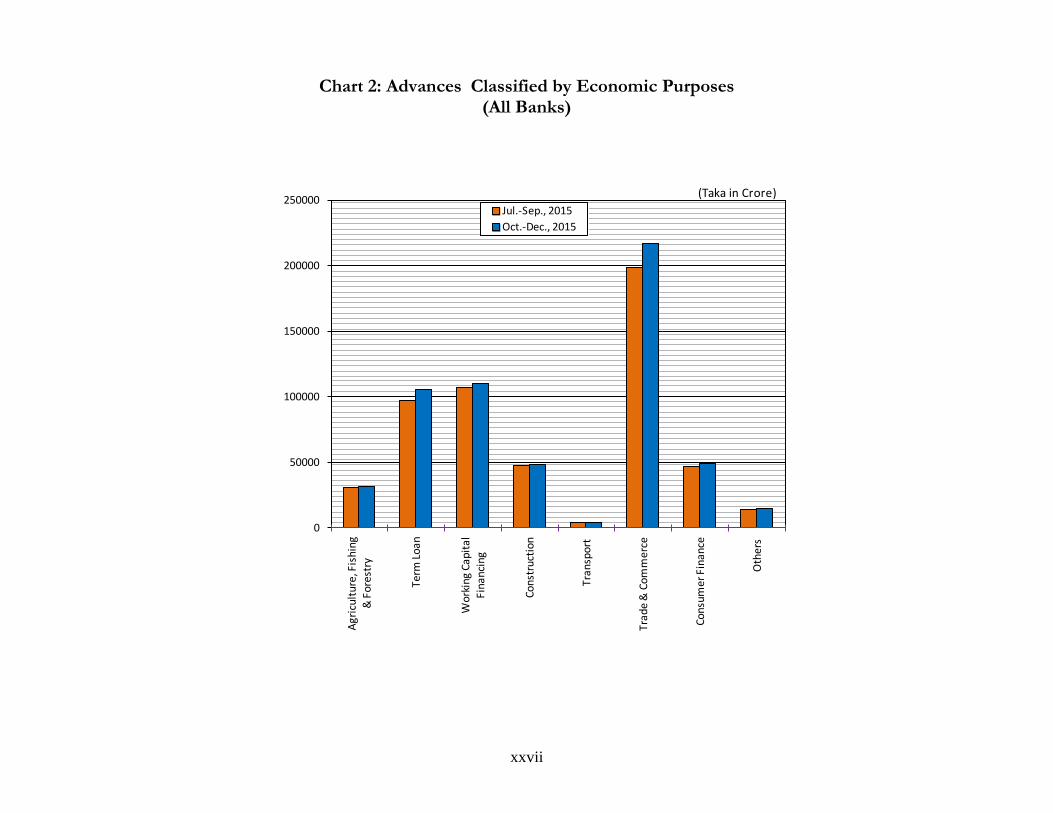
Economic Purpose-wise Advances
Bulk of Advances (37.41%) was used for
‘Trade’ purpose followed by advances for
'Working Capital Financing' (18.98%) and ‘Term
Loan’ (18.12%) at the end of the quarter Oct.-
Dec., 2015. Trade loans increased by Tk.17992.48
crore or 9.04% to Tk.216931.32 crore and ‘Term
Loan’ increased by Tk.8292.22 crore or 8.57% to
Tk.105091.59 crore at the end of the quarter
under review as compared to increases of 1.67%
and increases of 1.35% respectively at the end of
the preceding quarter (Jul.-Sep., 2015) and an
increase of 0.57% & an increase of 8.09%
respectively at the corresponding quarter (Oct.-
Dec., 2014) of the last year. ‘Transport’ loans
increased by 3.72% to Tk.4405.47 crore and
‘Agriculture’ loans increased by 3.01% to
Tk.31333.37 crore as compared to increases of
4.67% & 3.29% at the end of the preceding
quarter (Jul.-Sep., 2015) and an increase of 4.32%
& an increase of 2.97% at the corresponding
quarter (Oct.-Dec., 2014) of the last year
respectively. 'Construction' loan increased by
1.43% to Tk.48510.13 crore and ‘Working Capital
Financing' loan increased by 2.78% to
Tk.110033.09 crore and ‘Consumer Finance’ loan
increased by 5.36% to Tk.49028.75 crore
respectively at the end of the quarter under
review. 'Others' loans showed a increase of
Tk.642.95 crore to Tk.14525.70 crore at the end
of the quarter under review as compared to the
preceding quarter. Table-9 shows economic
purpose-wise classification of advances.
Table -9
Economic Purpose-wise Classification of Advances (Taka in Crore)
Term
Loan
Working
Capital
Financing
2014
Oct.-Dec. 27773.71 80439.99 93987.58 44214.25 5421.94 198276.94 45663.66 14846.94 510625.01
5.44% 15.75% 18.41% 8.66% 1.06% 38.83% 8.94% 2.91% 100%
(2.97) (8.09) (2.11) (1.56) (4.32) (0.57) (29.79) (16.94) (4.81)
2015
Jan.-Mar. 29959.37 78711.30 108588.31 41644.93 4245.13 185511.11 46007.68 21055.89 515723.72
5.81% 15.26% 21.06% 8.08% 0.82% 35.97% 8.92% 4.08% 100%
(7.87) (-2.15) (15.53) (-5.81) (-21.7) (-6.44) (0.75) (41.82) (1)
Apr.-Jun. 29449.89 95510.24 98824.94 44029.60 4058.18 195666.24 52259.47 16348.97 536147.54
5.49% 17.81% 18.43% 8.21% 0.76% 36.49% 9.75% 3.05% 100%
(-1.7) (21.34) (-8.99) (5.73) (-4.4) (5.47) (13.59) (-22.35) (3.96)
Jul.-Sep. 30419.21 96799.37 107058.65 47825.90 4247.57 198938.83 46535.53 13882.76 545707.82
5.57% 17.74% 19.62% 8.76% 0.78% 36.46% 8.53% 2.54% 100%
(3.29) (1.35) (8.33) (8.62) (4.67) (1.67) (-10.95) (-15.08) (1.78)
Oct.-Dec. 31333.37 105091.59 110033.09 48510.13 4405.47 216931.32 49028.75 14525.70 579859.42
5.40% 18.12% 18.98% 8.37% 0.76% 37.41% 8.46% 2.51% 100%
(3.01) (8.57) (2.78) (1.43) (3.72) (9.04) (5.36) (4.63) (6.26)
At end of
the quarterConstruction Transport Others Total
Industry
Trade &
Commerce
Consumer
Finance
Agriculture
Fishing &
Forestry
Note: 1. Figures in parentheses represent rates of growth in percent over the preceding quarter. 2. Minor differences may be shown due to separate rounding off.
xix
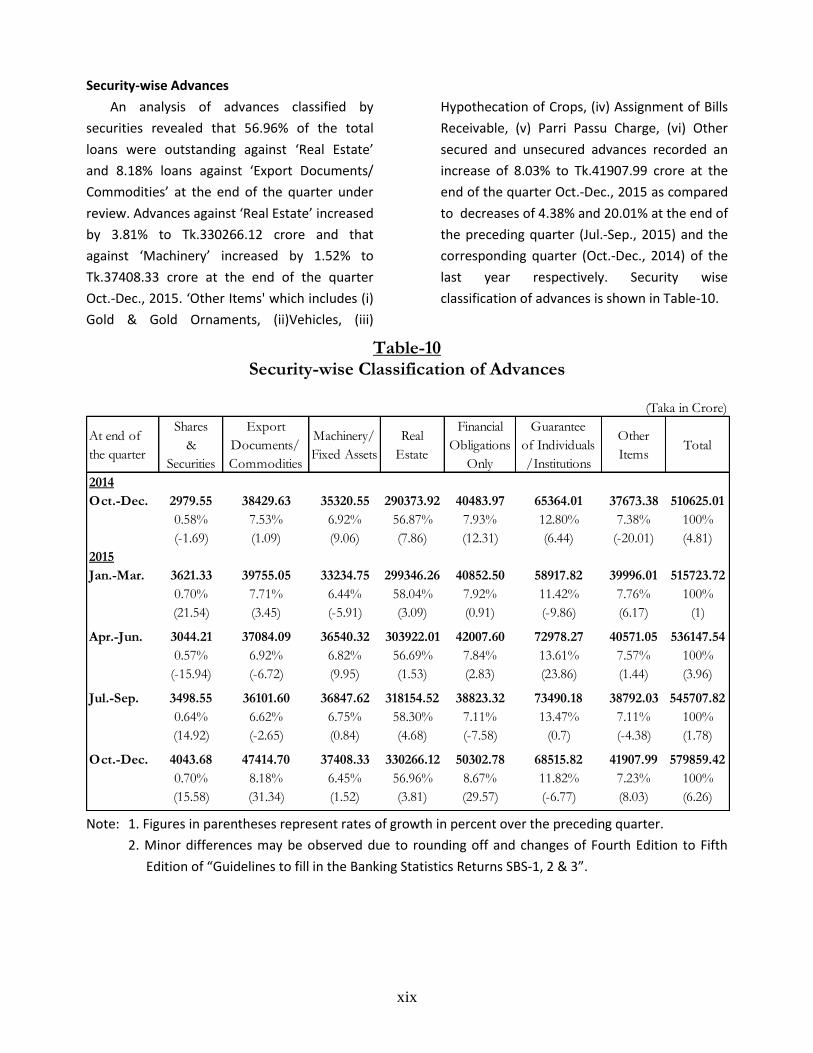
Security-wise Advances
An analysis of advances classified by
securities revealed that 56.96% of the total
loans were outstanding against ‘Real Estate’
and 8.18% loans against ‘Export Documents/
Commodities’ at the end of the quarter under
review. Advances against ‘Real Estate’ increased
by 3.81% to Tk.330266.12 crore and that
against ‘Machinery’ increased by 1.52% to
Tk.37408.33 crore at the end of the quarter
Oct.-Dec., 2015. ‘Other Items' which includes (i)
Gold & Gold Ornaments, (ii)Vehicles, (iii)
Hypothecation of Crops, (iv) Assignment of Bills
Receivable, (v) Parri Passu Charge, (vi) Other
secured and unsecured advances recorded an
increase of 8.03% to Tk.41907.99 crore at the
end of the quarter Oct.-Dec., 2015 as compared
to decreases of 4.38% and 20.01% at the end of
the preceding quarter (Jul.-Sep., 2015) and the
corresponding quarter (Oct.-Dec., 2014) of the
last year respectively. Security wise
classification of advances is shown in Table-10.
Table-10 Security-wise Classification of Advances
(Taka in Crore)
At end of
the quarter
Shares
&
Securities
Export
Documents/
Commodities
Machinery/
Fixed Assets
Real
Estate
Financial
Obligations
Only
Guarantee
of Individuals
/Institutions
Other
ItemsTotal
2014
Oct.-Dec. 2979.55 38429.63 35320.55 290373.92 40483.97 65364.01 37673.38 510625.01
0.58% 7.53% 6.92% 56.87% 7.93% 12.80% 7.38% 100%
(-1.69) (1.09) (9.06) (7.86) (12.31) (6.44) (-20.01) (4.81)
2015
Jan.-Mar. 3621.33 39755.05 33234.75 299346.26 40852.50 58917.82 39996.01 515723.72
0.70% 7.71% 6.44% 58.04% 7.92% 11.42% 7.76% 100%
(21.54) (3.45) (-5.91) (3.09) (0.91) (-9.86) (6.17) (1)
Apr.-Jun. 3044.21 37084.09 36540.32 303922.01 42007.60 72978.27 40571.05 536147.54
0.57% 6.92% 6.82% 56.69% 7.84% 13.61% 7.57% 100%
(-15.94) (-6.72) (9.95) (1.53) (2.83) (23.86) (1.44) (3.96)
Jul.-Sep. 3498.55 36101.60 36847.62 318154.52 38823.32 73490.18 38792.03 545707.82
0.64% 6.62% 6.75% 58.30% 7.11% 13.47% 7.11% 100%
(14.92) (-2.65) (0.84) (4.68) (-7.58) (0.7) (-4.38) (1.78)
Oct.-Dec. 4043.68 47414.70 37408.33 330266.12 50302.78 68515.82 41907.99 579859.42
0.70% 8.18% 6.45% 56.96% 8.67% 11.82% 7.23% 100%
(15.58) (31.34) (1.52) (3.81) (29.57) (-6.77) (8.03) (6.26)
Note: 1. Figures in parentheses represent rates of growth in percent over the preceding quarter.
2. Minor differences may be observed due to rounding off and changes of Fourth Edition to Fifth
Edition of “Guidelines to fill in the Banking Statistics Returns SBS-1, 2 & 3”.
xx
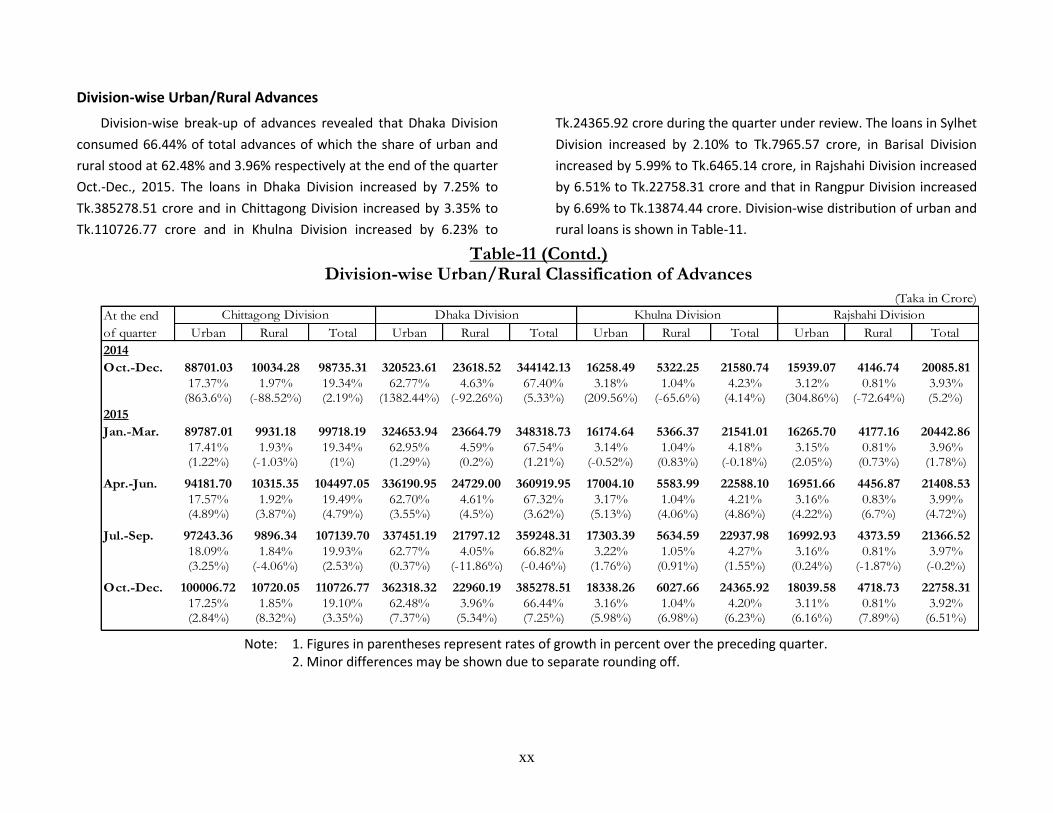
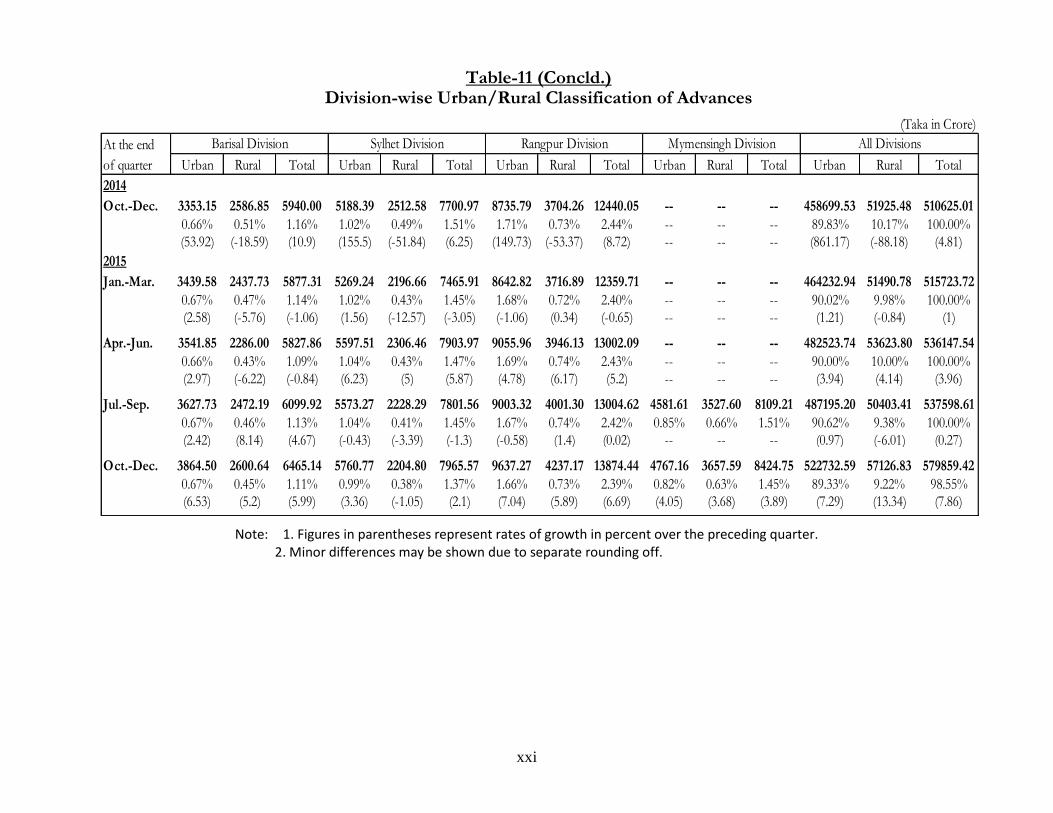
Division-wise Urban/Rural Advances
Division-wise break-up of advances revealed that Dhaka Division
consumed 66.44% of total advances of which the share of urban and
rural stood at 62.48% and 3.96% respectively at the end of the quarter
Oct.-Dec., 2015. The loans in Dhaka Division increased by 7.25% to
Tk.385278.51 crore and in Chittagong Division increased by 3.35% to
Tk.110726.77 crore and in Khulna Division increased by 6.23% to
Tk.24365.92 crore during the quarter under review. The loans in Sylhet
Division increased by 2.10% to Tk.7965.57 crore, in Barisal Division
increased by 5.99% to Tk.6465.14 crore, in Rajshahi Division increased
by 6.51% to Tk.22758.31 crore and that in Rangpur Division increased
by 6.69% to Tk.13874.44 crore. Division-wise distribution of urban and
rural loans is shown in Table-11.
Table-11 (Contd.) Division-wise Urban/Rural Classification of Advances
(Taka in Crore)
Urban Rural Total Urban Rural Total Urban Rural Total Urban Rural Total
2014
Oct.-Dec. 88701.03 10034.28 98735.31 320523.61 23618.52 344142.13 16258.49 5322.25 21580.74 15939.07 4146.74 20085.81
17.37% 1.97% 19.34% 62.77% 4.63% 67.40% 3.18% 1.04% 4.23% 3.12% 0.81% 3.93%(863.6%) (-88.52%) (2.19%) (1382.44%) (-92.26%) (5.33%) (209.56%) (-65.6%) (4.14%) (304.86%) (-72.64%) (5.2%)
2015
Jan.-Mar. 89787.01 9931.18 99718.19 324653.94 23664.79 348318.73 16174.64 5366.37 21541.01 16265.70 4177.16 20442.86
17.41% 1.93% 19.34% 62.95% 4.59% 67.54% 3.14% 1.04% 4.18% 3.15% 0.81% 3.96%(1.22%) (-1.03%) (1%) (1.29%) (0.2%) (1.21%) (-0.52%) (0.83%) (-0.18%) (2.05%) (0.73%) (1.78%)
Apr.-Jun. 94181.70 10315.35 104497.05 336190.95 24729.00 360919.95 17004.10 5583.99 22588.10 16951.66 4456.87 21408.53
17.57% 1.92% 19.49% 62.70% 4.61% 67.32% 3.17% 1.04% 4.21% 3.16% 0.83% 3.99%(4.89%) (3.87%) (4.79%) (3.55%) (4.5%) (3.62%) (5.13%) (4.06%) (4.86%) (4.22%) (6.7%) (4.72%)
Jul.-Sep. 97243.36 9896.34 107139.70 337451.19 21797.12 359248.31 17303.39 5634.59 22937.98 16992.93 4373.59 21366.52
18.09% 1.84% 19.93% 62.77% 4.05% 66.82% 3.22% 1.05% 4.27% 3.16% 0.81% 3.97%(3.25%) (-4.06%) (2.53%) (0.37%) (-11.86%) (-0.46%) (1.76%) (0.91%) (1.55%) (0.24%) (-1.87%) (-0.2%)
Oct.-Dec. 100006.72 10720.05 110726.77 362318.32 22960.19 385278.51 18338.26 6027.66 24365.92 18039.58 4718.73 22758.31
17.25% 1.85% 19.10% 62.48% 3.96% 66.44% 3.16% 1.04% 4.20% 3.11% 0.81% 3.92%(2.84%) (8.32%) (3.35%) (7.37%) (5.34%) (7.25%) (5.98%) (6.98%) (6.23%) (6.16%) (7.89%) (6.51%)
At the end
of quarter
Chittagong Division Dhaka Division Khulna Division Rajshahi Division
Note: 1. Figures in parentheses represent rates of growth in percent over the preceding quarter. 2. Minor differences may be shown due to separate rounding off.
xxi
Table-11 (Concld.) Division-wise Urban/Rural Classification of Advances
(Taka in Crore)
Urban Rural Total Urban Rural Total Urban Rural Total Urban Rural Total Urban Rural Total
2014
Oct.-Dec. 3353.15 2586.85 5940.00 5188.39 2512.58 7700.97 8735.79 3704.26 12440.05 -- -- -- 458699.53 51925.48 510625.01
0.66% 0.51% 1.16% 1.02% 0.49% 1.51% 1.71% 0.73% 2.44% -- -- -- 89.83% 10.17% 100.00%(53.92) (-18.59) (10.9) (155.5) (-51.84) (6.25) (149.73) (-53.37) (8.72) -- -- -- (861.17) (-88.18) (4.81)
2015
Jan.-Mar. 3439.58 2437.73 5877.31 5269.24 2196.66 7465.91 8642.82 3716.89 12359.71 -- -- -- 464232.94 51490.78 515723.72
0.67% 0.47% 1.14% 1.02% 0.43% 1.45% 1.68% 0.72% 2.40% -- -- -- 90.02% 9.98% 100.00%(2.58) (-5.76) (-1.06) (1.56) (-12.57) (-3.05) (-1.06) (0.34) (-0.65) -- -- -- (1.21) (-0.84) (1)
Apr.-Jun. 3541.85 2286.00 5827.86 5597.51 2306.46 7903.97 9055.96 3946.13 13002.09 -- -- -- 482523.74 53623.80 536147.54
0.66% 0.43% 1.09% 1.04% 0.43% 1.47% 1.69% 0.74% 2.43% -- -- -- 90.00% 10.00% 100.00%(2.97) (-6.22) (-0.84) (6.23) (5) (5.87) (4.78) (6.17) (5.2) -- -- -- (3.94) (4.14) (3.96)
Jul.-Sep. 3627.73 2472.19 6099.92 5573.27 2228.29 7801.56 9003.32 4001.30 13004.62 4581.61 3527.60 8109.21 487195.20 50403.41 537598.61
0.67% 0.46% 1.13% 1.04% 0.41% 1.45% 1.67% 0.74% 2.42% 0.85% 0.66% 1.51% 90.62% 9.38% 100.00%(2.42) (8.14) (4.67) (-0.43) (-3.39) (-1.3) (-0.58) (1.4) (0.02) -- -- -- (0.97) (-6.01) (0.27)
Oct.-Dec. 3864.50 2600.64 6465.14 5760.77 2204.80 7965.57 9637.27 4237.17 13874.44 4767.16 3657.59 8424.75 522732.59 57126.83 579859.42
0.67% 0.45% 1.11% 0.99% 0.38% 1.37% 1.66% 0.73% 2.39% 0.82% 0.63% 1.45% 89.33% 9.22% 98.55%(6.53) (5.2) (5.99) (3.36) (-1.05) (2.1) (7.04) (5.89) (6.69) (4.05) (3.68) (3.89) (7.29) (13.34) (7.86)
At the end
of quarter
Barisal Division Sylhet Division Rangpur Division All DivisionsMymensingh Division
Note: 1. Figures in parentheses represent rates of growth in percent over the preceding quarter. 2. Minor differences may be shown due to separate rounding off.
xxii
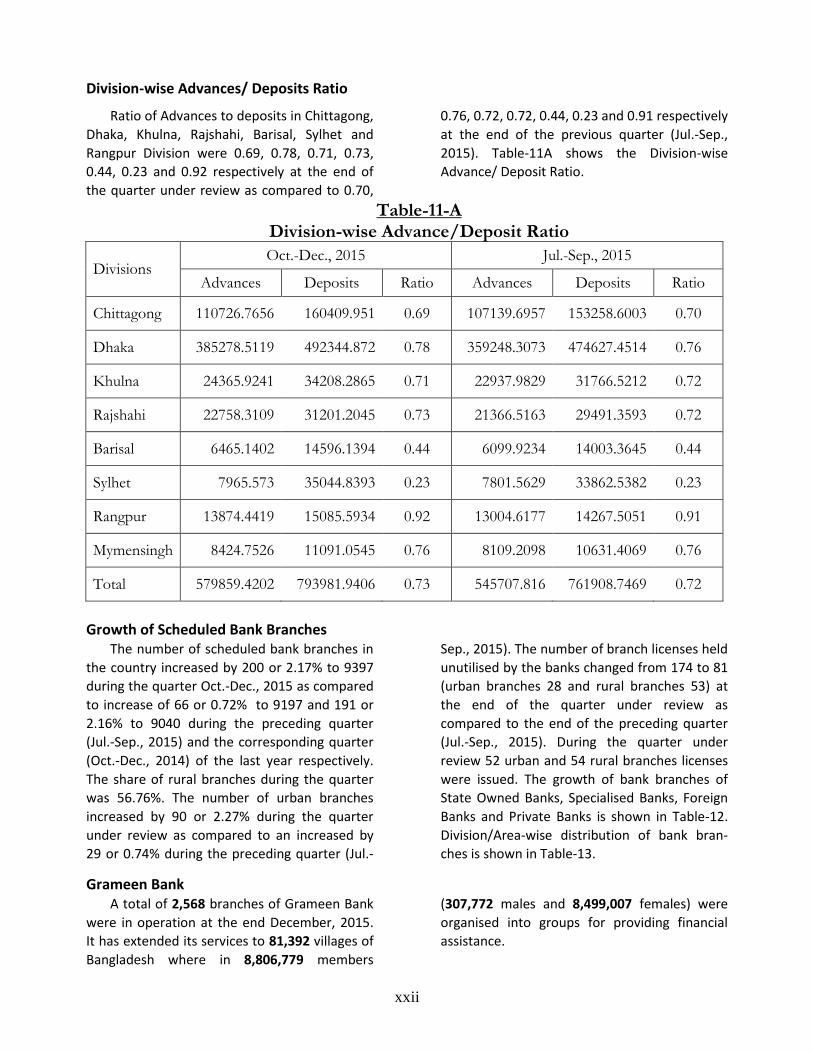
Division-wise Advances/ Deposits Ratio
Ratio of Advances to deposits in Chittagong,
Dhaka, Khulna, Rajshahi, Barisal, Sylhet and
Rangpur Division were 0.69, 0.78, 0.71, 0.73,
0.44, 0.23 and 0.92 respectively at the end of
the quarter under review as compared to 0.70,
0.76, 0.72, 0.72, 0.44, 0.23 and 0.91 respectively
at the end of the previous quarter (Jul.-Sep.,
2015). Table-11A shows the Division-wise
Advance/ Deposit Ratio.
Table-11-A Division-wise Advance/Deposit Ratio
Divisions Oct.-Dec., 2015 Jul.-Sep., 2015
Advances Deposits Ratio Advances Deposits Ratio
Chittagong 110726.7656 160409.951 0.69 107139.6957 153258.6003 0.70
Dhaka 385278.5119 492344.872 0.78 359248.3073 474627.4514 0.76
Khulna 24365.9241 34208.2865 0.71 22937.9829 31766.5212 0.72
Rajshahi 22758.3109 31201.2045 0.73 21366.5163 29491.3593 0.72
Barisal 6465.1402 14596.1394 0.44 6099.9234 14003.3645 0.44
Sylhet 7965.573 35044.8393 0.23 7801.5629 33862.5382 0.23
Rangpur 13874.4419 15085.5934 0.92 13004.6177 14267.5051 0.91
Mymensingh 8424.7526 11091.0545 0.76 8109.2098 10631.4069 0.76
Total 579859.4202 793981.9406 0.73 545707.816 761908.7469 0.72
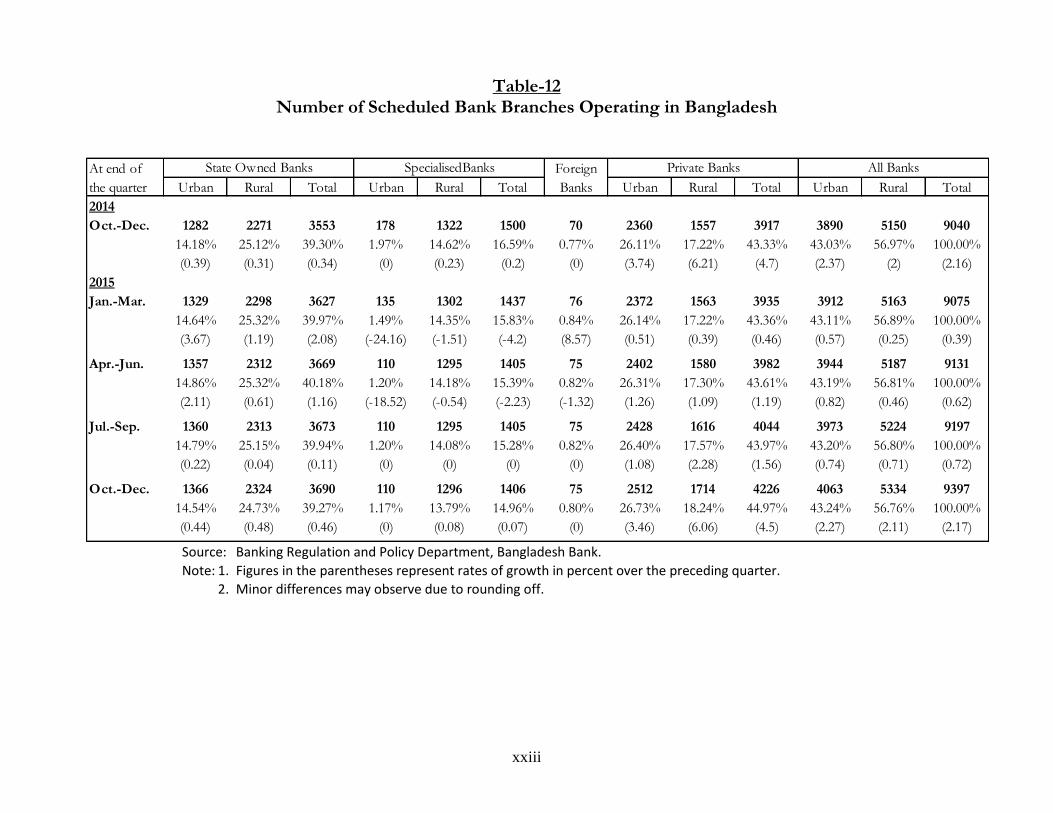
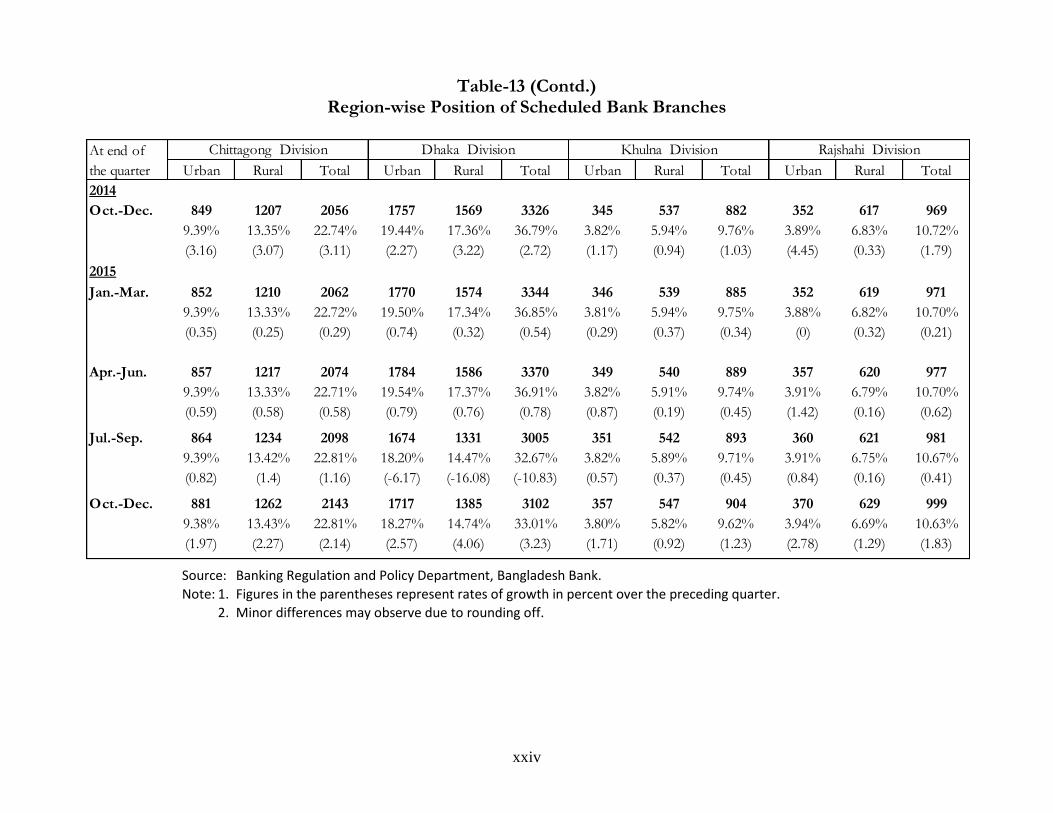
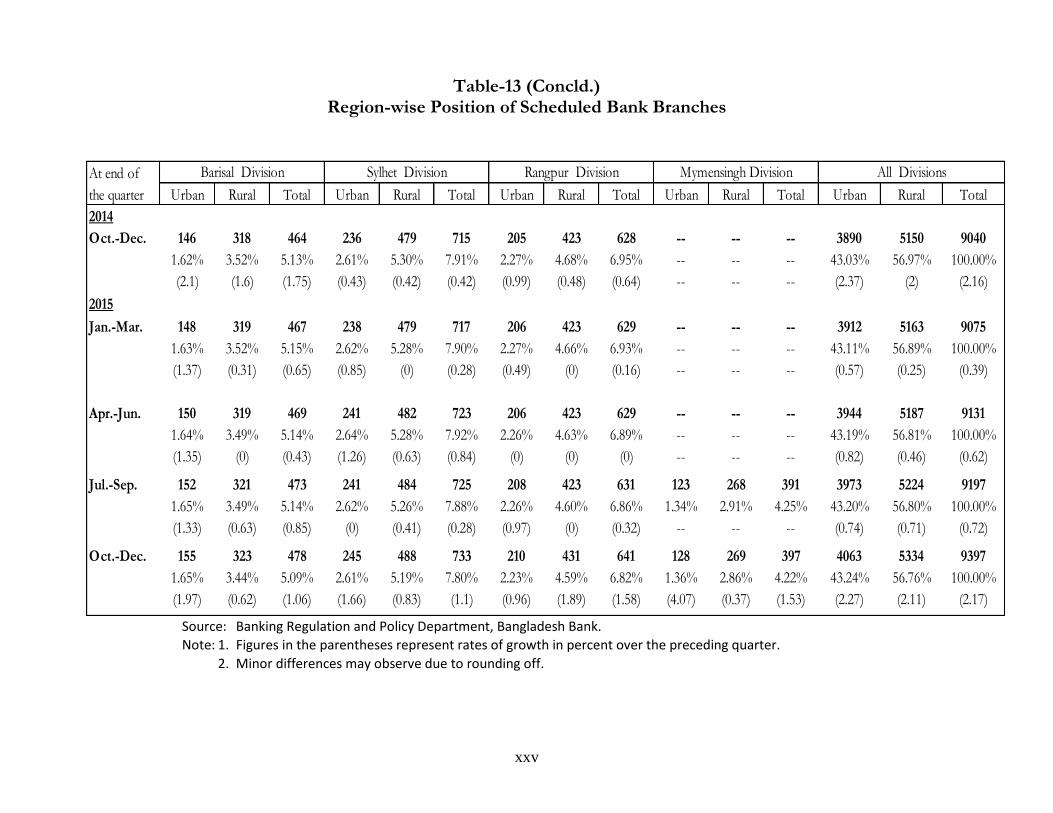
Growth of Scheduled Bank Branches The number of scheduled bank branches in
the country increased by 200 or 2.17% to 9397
during the quarter Oct.-Dec., 2015 as compared
to increase of 66 or 0.72% to 9197 and 191 or
2.16% to 9040 during the preceding quarter
(Jul.-Sep., 2015) and the corresponding quarter
(Oct.-Dec., 2014) of the last year respectively.
The share of rural branches during the quarter
was 56.76%. The number of urban branches
increased by 90 or 2.27% during the quarter
under review as compared to an increased by
29 or 0.74% during the preceding quarter (Jul.-
Sep., 2015). The number of branch licenses held
unutilised by the banks changed from 174 to 81
(urban branches 28 and rural branches 53) at
the end of the quarter under review as
compared to the end of the preceding quarter
(Jul.-Sep., 2015). During the quarter under
review 52 urban and 54 rural branches licenses
were issued. The growth of bank branches of
State Owned Banks, Specialised Banks, Foreign
Banks and Private Banks is shown in Table-12.
Division/Area-wise distribution of bank bran-
ches is shown in Table-13.
Grameen Bank A total of 2,568 branches of Grameen Bank
were in operation at the end December, 2015.
It has extended its services to 81,392 villages of
Bangladesh where in 8,806,779 members
(307,772 males and 8,499,007 females) were
organised into groups for providing financial
assistance.
xxiii
Table-12 Number of Scheduled Bank Branches Operating in Bangladesh
Urban Rural Total Urban Rural Total Urban Rural Total Urban Rural Total
2014
Oct.-Dec. 1282 2271 3553 178 1322 1500 70 2360 1557 3917 3890 5150 9040
14.18% 25.12% 39.30% 1.97% 14.62% 16.59% 0.77% 26.11% 17.22% 43.33% 43.03% 56.97% 100.00%
(0.39) (0.31) (0.34) (0) (0.23) (0.2) (0) (3.74) (6.21) (4.7) (2.37) (2) (2.16)
2015
Jan.-Mar. 1329 2298 3627 135 1302 1437 76 2372 1563 3935 3912 5163 9075
14.64% 25.32% 39.97% 1.49% 14.35% 15.83% 0.84% 26.14% 17.22% 43.36% 43.11% 56.89% 100.00%
(3.67) (1.19) (2.08) (-24.16) (-1.51) (-4.2) (8.57) (0.51) (0.39) (0.46) (0.57) (0.25) (0.39)
Apr.-Jun. 1357 2312 3669 110 1295 1405 75 2402 1580 3982 3944 5187 9131
14.86% 25.32% 40.18% 1.20% 14.18% 15.39% 0.82% 26.31% 17.30% 43.61% 43.19% 56.81% 100.00%
(2.11) (0.61) (1.16) (-18.52) (-0.54) (-2.23) (-1.32) (1.26) (1.09) (1.19) (0.82) (0.46) (0.62)
Jul.-Sep. 1360 2313 3673 110 1295 1405 75 2428 1616 4044 3973 5224 9197
14.79% 25.15% 39.94% 1.20% 14.08% 15.28% 0.82% 26.40% 17.57% 43.97% 43.20% 56.80% 100.00%
(0.22) (0.04) (0.11) (0) (0) (0) (0) (1.08) (2.28) (1.56) (0.74) (0.71) (0.72)
Oct.-Dec. 1366 2324 3690 110 1296 1406 75 2512 1714 4226 4063 5334 9397
14.54% 24.73% 39.27% 1.17% 13.79% 14.96% 0.80% 26.73% 18.24% 44.97% 43.24% 56.76% 100.00%
(0.44) (0.48) (0.46) (0) (0.08) (0.07) (0) (3.46) (6.06) (4.5) (2.27) (2.11) (2.17)
At end of
the quarter
State Owned Banks SpecialisedBanks Private BanksForeign
Banks
All Banks
Source: Banking Regulation and Policy Department, Bangladesh Bank.
Note: 1. Figures in the parentheses represent rates of growth in percent over the preceding quarter.
2. Minor differences may observe due to rounding off.
xxiv
Table-13 (Contd.) Region-wise Position of Scheduled Bank Branches
Urban Rural Total Urban Rural Total Urban Rural Total Urban Rural Total
2014
Oct.-Dec. 849 1207 2056 1757 1569 3326 345 537 882 352 617 969
9.39% 13.35% 22.74% 19.44% 17.36% 36.79% 3.82% 5.94% 9.76% 3.89% 6.83% 10.72%
(3.16) (3.07) (3.11) (2.27) (3.22) (2.72) (1.17) (0.94) (1.03) (4.45) (0.33) (1.79)
2015
Jan.-Mar. 852 1210 2062 1770 1574 3344 346 539 885 352 619 971
9.39% 13.33% 22.72% 19.50% 17.34% 36.85% 3.81% 5.94% 9.75% 3.88% 6.82% 10.70%
(0.35) (0.25) (0.29) (0.74) (0.32) (0.54) (0.29) (0.37) (0.34) (0) (0.32) (0.21)
Apr.-Jun. 857 1217 2074 1784 1586 3370 349 540 889 357 620 977
9.39% 13.33% 22.71% 19.54% 17.37% 36.91% 3.82% 5.91% 9.74% 3.91% 6.79% 10.70%
(0.59) (0.58) (0.58) (0.79) (0.76) (0.78) (0.87) (0.19) (0.45) (1.42) (0.16) (0.62)
Jul.-Sep. 864 1234 2098 1674 1331 3005 351 542 893 360 621 981
9.39% 13.42% 22.81% 18.20% 14.47% 32.67% 3.82% 5.89% 9.71% 3.91% 6.75% 10.67%
(0.82) (1.4) (1.16) (-6.17) (-16.08) (-10.83) (0.57) (0.37) (0.45) (0.84) (0.16) (0.41)
Oct.-Dec. 881 1262 2143 1717 1385 3102 357 547 904 370 629 999
9.38% 13.43% 22.81% 18.27% 14.74% 33.01% 3.80% 5.82% 9.62% 3.94% 6.69% 10.63%
(1.97) (2.27) (2.14) (2.57) (4.06) (3.23) (1.71) (0.92) (1.23) (2.78) (1.29) (1.83)
Chittagong Division Dhaka Division Khulna Division Rajshahi DivisionAt end of
the quarter
Source: Banking Regulation and Policy Department, Bangladesh Bank.
Note: 1. Figures in the parentheses represent rates of growth in percent over the preceding quarter.
2. Minor differences may observe due to rounding off.
xxv
Table-13 (Concld.) Region-wise Position of Scheduled Bank Branches
Urban Rural Total Urban Rural Total Urban Rural Total Urban Rural Total Urban Rural Total
2014
Oct.-Dec. 146 318 464 236 479 715 205 423 628 -- -- -- 3890 5150 9040
1.62% 3.52% 5.13% 2.61% 5.30% 7.91% 2.27% 4.68% 6.95% -- -- -- 43.03% 56.97% 100.00%
(2.1) (1.6) (1.75) (0.43) (0.42) (0.42) (0.99) (0.48) (0.64) -- -- -- (2.37) (2) (2.16)
2015
Jan.-Mar. 148 319 467 238 479 717 206 423 629 -- -- -- 3912 5163 9075
1.63% 3.52% 5.15% 2.62% 5.28% 7.90% 2.27% 4.66% 6.93% -- -- -- 43.11% 56.89% 100.00%
(1.37) (0.31) (0.65) (0.85) (0) (0.28) (0.49) (0) (0.16) -- -- -- (0.57) (0.25) (0.39)
Apr.-Jun. 150 319 469 241 482 723 206 423 629 -- -- -- 3944 5187 9131
1.64% 3.49% 5.14% 2.64% 5.28% 7.92% 2.26% 4.63% 6.89% -- -- -- 43.19% 56.81% 100.00%
(1.35) (0) (0.43) (1.26) (0.63) (0.84) (0) (0) (0) -- -- -- (0.82) (0.46) (0.62)
Jul.-Sep. 152 321 473 241 484 725 208 423 631 123 268 391 3973 5224 9197
1.65% 3.49% 5.14% 2.62% 5.26% 7.88% 2.26% 4.60% 6.86% 1.34% 2.91% 4.25% 43.20% 56.80% 100.00%
(1.33) (0.63) (0.85) (0) (0.41) (0.28) (0.97) (0) (0.32) -- -- -- (0.74) (0.71) (0.72)
Oct.-Dec. 155 323 478 245 488 733 210 431 641 128 269 397 4063 5334 9397
1.65% 3.44% 5.09% 2.61% 5.19% 7.80% 2.23% 4.59% 6.82% 1.36% 2.86% 4.22% 43.24% 56.76% 100.00%
(1.97) (0.62) (1.06) (1.66) (0.83) (1.1) (0.96) (1.89) (1.58) (4.07) (0.37) (1.53) (2.27) (2.11) (2.17)
Barisal Division Sylhet Division Rangpur Division All DivisionsAt end of
the quarter
Mymensingh Division
Source: Banking Regulation and Policy Department, Bangladesh Bank.
Note: 1. Figures in the parentheses represent rates of growth in percent over the preceding quarter.
2. Minor differences may observe due to rounding off.
xxvi
Chart 1: Deposits Distributed by Types of Account (All Banks)
0
50000
100000
150000
200000
250000
300000
350000
Cu
rren
t an
d C
ash
Cre
dit
A
cco
un
t D
ep
osi
ts
Savi
ngs
Dep
osi
ts
Co
nve
rtib
le T
aka
Acc
ou
nt
of F
ore
ign
ers
Fore
ign
Curr
ency
A
ccou
nts
Wag
e Ea
rner
's D
epos
its
Res
iden
t Fo
reig
n
Cu
rre
ncy
De
po
sits
Spec
ial N
otic
e D
epos
its
Fixe
d D
epos
its
Rec
urri
ng D
epos
its
Oth
er D
epo
sits
(Taka in Crore)
Jul.-Sep., 2015
Oct.-Dec., 2015
xxvii
Chart 2: Advances Classified by Economic Purposes (All Banks)
0
50000
100000
150000
200000
250000
Agr
icu
ltu
re, F
ish
ing
& F
ore
stry
Term
Loa
n
Wor
king
Cap
ital
Fina
ncin
g
Cons
truc
tion
Tra
nsp
ort
Trad
e &
Co
mm
erce
Cons
umer
Fin
ance
Oth
ers
(Taka in Crore)
Jul.-Sep., 2015
Oct.-Dec., 2015
xxviii
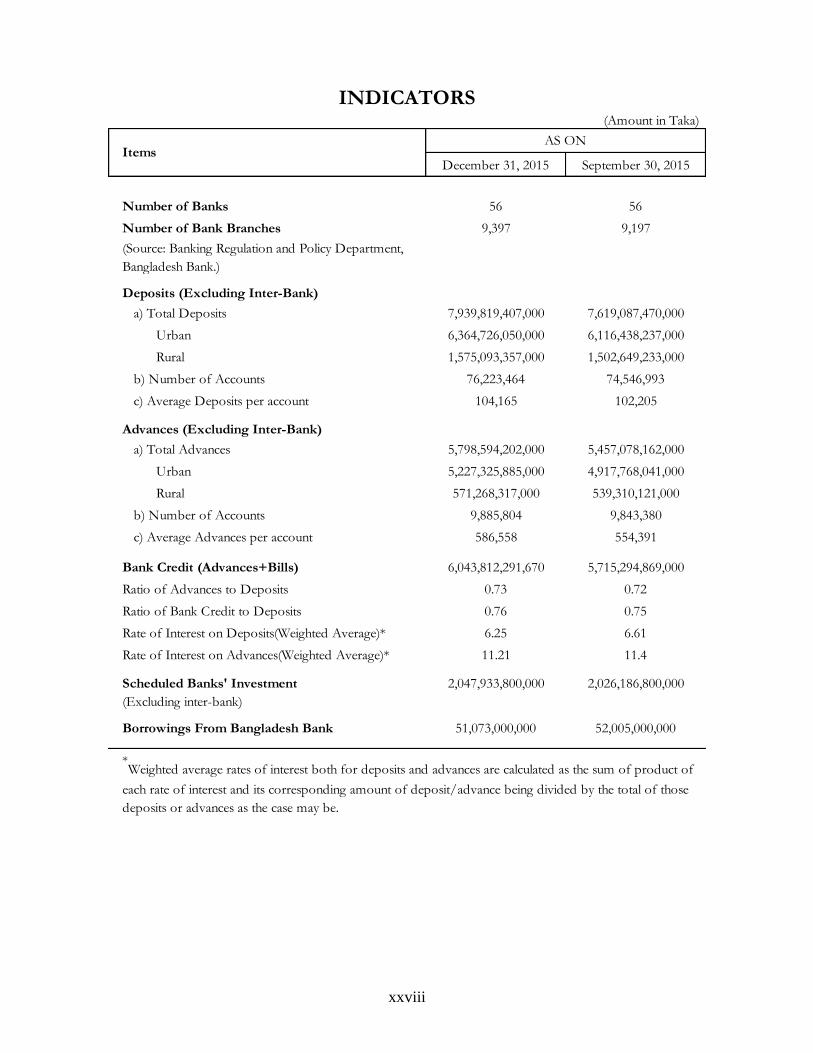
INDICATORS (Amount in Taka)
December 31, 2015 September 30, 2015
Number of Banks 56 56
Number of Bank Branches 9,397 9,197
(Source: Banking Regulation and Policy Department,
Bangladesh Bank.)
Deposits (Excluding Inter-Bank)
a) Total Deposits 7,939,819,407,000 7,619,087,470,000
Urban 6,364,726,050,000 6,116,438,237,000
Rural 1,575,093,357,000 1,502,649,233,000
b) Number of Accounts 76,223,464 74,546,993
c) Average Deposits per account 104,165 102,205
Advances (Excluding Inter-Bank)
a) Total Advances 5,798,594,202,000 5,457,078,162,000
Urban 5,227,325,885,000 4,917,768,041,000
Rural 571,268,317,000 539,310,121,000
b) Number of Accounts 9,885,804 9,843,380
c) Average Advances per account 586,558 554,391
Bank Credit (Advances+Bills) 6,043,812,291,670 5,715,294,869,000
Ratio of Advances to Deposits 0.73 0.72
Ratio of Bank Credit to Deposits 0.76 0.75
Rate of Interest on Deposits(Weighted Average)* 6.25 6.61
Rate of Interest on Advances(Weighted Average)* 11.21 11.4
Scheduled Banks' Investment 2,047,933,800,000 2,026,186,800,000
(Excluding inter-bank)
Borrowings From Bangladesh Bank 51,073,000,000 52,005,000,000
*Weighted average rates of interest both for deposits and advances are calculated as the sum of product of
each rate of interest and its corresponding amount of deposit/advance being divided by the total of those
deposits or advances as the case may be.
AS ON Items
xxix
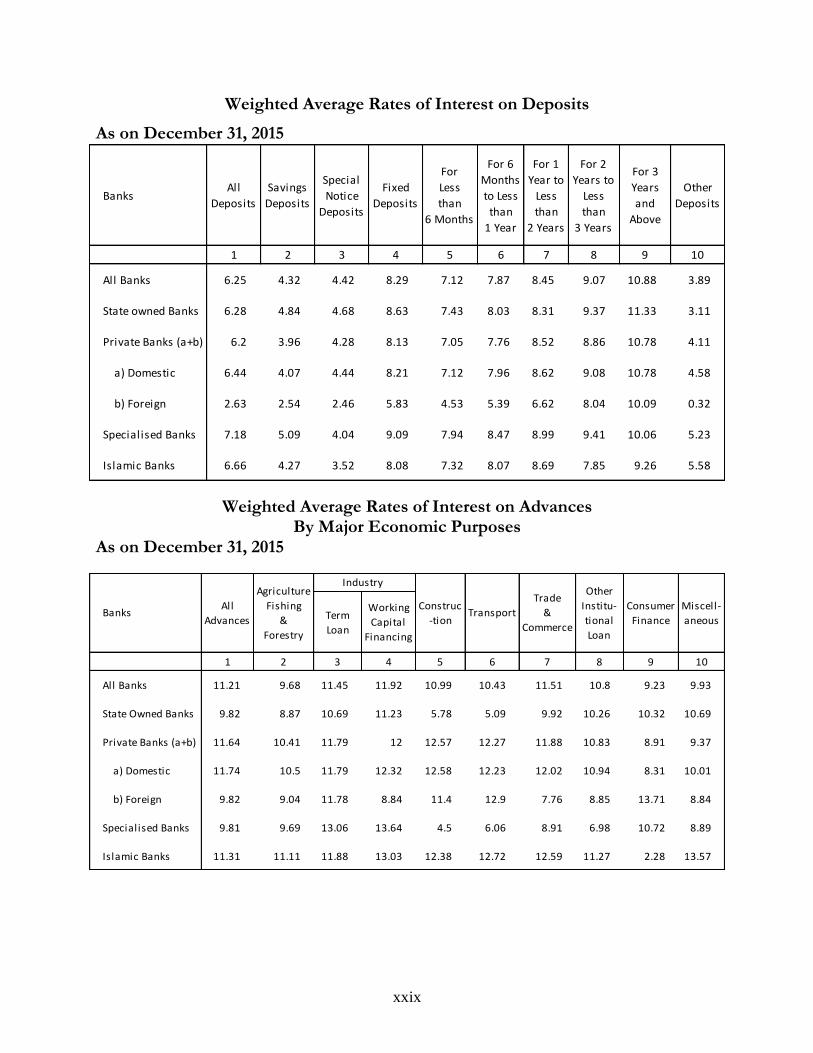
Weighted Average Rates of Interest on Deposits
As on December 31, 2015
BanksAll
Deposits
Savings
Deposits
Special
Notice
Deposits
Fixed
Deposits
For
Less
than
6 Months
For 6
Months
to Less
than
1 Year
For 1
Year to
Less
than
2 Years
For 2
Years to
Less
than
3 Years
For 3
Years
and
Above
Other
Deposits
1 2 3 4 5 6 7 8 9 10
All Banks 6.25 4.32 4.42 8.29 7.12 7.87 8.45 9.07 10.88 3.89
State owned Banks 6.28 4.84 4.68 8.63 7.43 8.03 8.31 9.37 11.33 3.11
Private Banks (a+b) 6.2 3.96 4.28 8.13 7.05 7.76 8.52 8.86 10.78 4.11
a) Domestic 6.44 4.07 4.44 8.21 7.12 7.96 8.62 9.08 10.78 4.58
b) Foreign 2.63 2.54 2.46 5.83 4.53 5.39 6.62 8.04 10.09 0.32
Specialised Banks 7.18 5.09 4.04 9.09 7.94 8.47 8.99 9.41 10.06 5.23
Islamic Banks 6.66 4.27 3.52 8.08 7.32 8.07 8.69 7.85 9.26 5.58
Weighted Average Rates of Interest on Advances By Major Economic Purposes
As on December 31, 2015
Term
Loan
Working
Capital
Financing
1 2 3 4 5 6 7 8 9 10
All Banks 11.21 9.68 11.45 11.92 10.99 10.43 11.51 10.8 9.23 9.93
State Owned Banks 9.82 8.87 10.69 11.23 5.78 5.09 9.92 10.26 10.32 10.69
Private Banks (a+b) 11.64 10.41 11.79 12 12.57 12.27 11.88 10.83 8.91 9.37
a) Domestic 11.74 10.5 11.79 12.32 12.58 12.23 12.02 10.94 8.31 10.01
b) Foreign 9.82 9.04 11.78 8.84 11.4 12.9 7.76 8.85 13.71 8.84
Specialised Banks 9.81 9.69 13.06 13.64 4.5 6.06 8.91 6.98 10.72 8.89
Islamic Banks 11.31 11.11 11.88 13.03 12.38 12.72 12.59 11.27 2.28 13.57
Consumer
Finance
Miscell-
aneousBanks
Other
Institu-
tional
Loan
All
Advances
Agriculture
Fishing
&
Forestry
Industry
Construc
-tionTransport
Trade
&
Commerce


![… · ltd/ Islami Bank Bangladesh I-tci/Jamuna Bank Lid/ Trust Bank Ltd/AB Bank Ltd/ Dhaka Bank Ltd/ Pubali Bank Ltd/Basic Bank I-Ic]/South East, Bank Ltd/ Dutch Bangla Bank Ltd](https://static.fdocuments.net/doc/165x107/5eaae1285617c3695347ef52/-ltd-islami-bank-bangladesh-i-tcijamuna-bank-lid-trust-bank-ltdab-bank-ltd.jpg)