INTRODUCTION - Bangladesh Bank · Dutch Bangla Bank Ltd. 14. Mercantile Bank Ltd. ... bills mainly...
31
i INTRODUCTION After liberation, the banks operating in Bangladesh (except those incorporated abroad) were nationalised. These banks were merged and grouped into six commercial banks. Of the total six commercial banks, Pubali Bank Ltd. and Uttara Bank Ltd. were subsequently transferred to the private sector with effect from January 1985. Rupali Bank was transferred as public limited company from December1986. The rest three State Owned Banks were operating as public limited company from the quarter October- Govt. owned specialised banks were renamed as Bangladesh Krishi Bank and Bangladesh Shilpa Bank. In March 1987 Bangladesh Krishi Bank was bifurcated and another specialised bank emerged as Rajshahi Krishi Unnayan Bank (RAKUB) for Rajshahi Division. Bank of Small Industries & Commerce Bangladesh Ltd. (BASIC) started its operation as a private bank from September 1988. Later on BASIC was brought under direct control of the Government and was reckoned to as a specialised bank with effect from June 1993. From July 1995 again the BASIC was categorised as a private bank. In 1997, Government decided to treat this bank as a Specialised bank again. So in this booklet, the BASIC has been treated as a Specialised bank. Bangladesh Shilpa Bank(BSB) & Bangladesh Shilpa Rin Sangstha(BSRS) merged and renamed as Bangladesh development Bank Limited(BDBL) from the quarter January- Standard Chartered Grindlays Bank was merged with Standard Chartered Bank during the Quarter (January-March, 2003). American Express Bank also merged with Standard Chartered Bank during the quarter (October-December, 2005).The Oriental Bank Ltd. an Islamic private bank was renamed as ICB Islamic Bank Ltd. from the quarter (April-June, 2008). Credit Agricole Indosuez, a foreign private bank is renamed as Commercial Bank of Ceylon Ltd. from the quarter (October- December, 2003). Shamil Bank is renamed as Bank Al-Falah Ltd. from the quarter (April- June, 2005). Arab Bangladesh Bank Ltd is renamed as AB Bank Ltd from the quarter (January-March, 2008) and Social Investment Bank Ltd is renamed as Social Islami Bank Ltd from the quarter (April-June, 2009). It is mentioned that First Security Bank Ltd has started its operation according to Islamic Sariah from the quarter (January- Shahjalal Bank Ltd. has started its operation according to Islamic Sariah from the quarter April-June - and EXIM Bank Ltd has also started its operation according to Islamic Sariah from the quarter (July-September, 2004). The branches of foreign banks operating in Bangladesh are being treated as foreign private banks. Among all fourth generation Scheduled ICULTURE AND started their operation from the quarter April- June, 2013. MODHUMOTI BANK om the quarter July-September, 2013 have started their operation from the quarter October-December, 2013. It is mentioned that Union Bank Ltd. based on Islamic Sariah. All such banks operating in Bangladesh with different paid-up capital and reserves having a minimum of an aggregate value of Tk. 50 lacs and conducting their affairs to the satisfaction of the Bangladesh Bank have been declared as scheduled banks in terms of section 37(2) of Bangladesh Bank Order 1972. In terms of section 13 of Bank Company Act, 1991, the minimum aggregate value was Tk. 20 crores. From 30 th 2003 it was Tk 100 crores. From 8 th 2007 it was Tk. 200 crores . From 11 th 2011, it has been raised at the minimum of Tk. 400 crores ( as per Circular Letter No. BRPD (R-1) 717/ 2008 - 511 dated August 12, 2008).
Transcript of INTRODUCTION - Bangladesh Bank · Dutch Bangla Bank Ltd. 14. Mercantile Bank Ltd. ... bills mainly...
i
INTRODUCTION
After liberation, the banks operating in
Bangladesh (except those incorporated abroad)
were nationalised. These banks were merged
and grouped into six commercial banks. Of the
total six commercial banks, Pubali Bank Ltd.
and Uttara Bank Ltd. were subsequently
transferred to the private sector with effect from
January 1985. Rupali Bank was transferred as
public limited company from December1986.
The rest three State Owned Banks were
operating as public limited company from the
quarter October-
Govt. owned specialised banks were renamed as
Bangladesh Krishi Bank and Bangladesh Shilpa
Bank. In March 1987 Bangladesh Krishi Bank
was bifurcated and another specialised bank
emerged as Rajshahi Krishi Unnayan Bank
(RAKUB) for Rajshahi Division. Bank of Small
Industries & Commerce Bangladesh Ltd.
(BASIC) started its operation as a private bank
from September 1988. Later on BASIC was
brought under direct control of the Government
and was reckoned to as a specialised bank with
effect from June 1993. From July 1995 again
the BASIC was categorised as a private bank. In
1997, Government decided to treat this bank as
a Specialised bank again. So in this booklet, the
BASIC has been treated as a Specialised bank.
Bangladesh Shilpa Bank(BSB) & Bangladesh
Shilpa Rin Sangstha(BSRS) merged and
renamed as Bangladesh development Bank
Limited(BDBL) from the quarter January-
Standard Chartered Grindlays
Bank was merged with Standard Chartered
Bank during the Quarter (January-March,
2003). American Express Bank also merged
with Standard Chartered Bank during the
quarter (October-December, 2005).The Oriental
Bank Ltd. an Islamic private bank was renamed
as ICB Islamic Bank Ltd. from the quarter
(April-June, 2008). Credit Agricole Indosuez, a
foreign private bank is renamed as Commercial
Bank of Ceylon Ltd. from the quarter (October-
December, 2003). Shamil Bank is renamed as
Bank Al-Falah Ltd. from the quarter (April-
June, 2005). Arab Bangladesh Bank Ltd is
renamed as AB Bank Ltd from the quarter
(January-March, 2008) and Social Investment
Bank Ltd is renamed as Social Islami Bank Ltd
from the quarter (April-June, 2009). It is
mentioned that First Security Bank Ltd has
started its operation according to Islamic Sariah
from the quarter (January-
Shahjalal Bank Ltd. has started its operation
according to Islamic Sariah from the quarter
April-June
-
and EXIM Bank Ltd has also started
its operation according to Islamic Sariah from
the quarter (July-September, 2004). The
branches of foreign banks operating in
Bangladesh are being treated as foreign private
banks.
Among all fourth generation Scheduled
ICULTURE AND
started their operation from the quarter April-
June, 2013.
MODHUMOTI BANK
om the
quarter July-September, 2013
have started their
operation from the quarter October-December,
2013. It is mentioned that Union Bank Ltd.
based on Islamic Sariah.
All such banks operating in Bangladesh
with different paid-up capital and reserves
having a minimum of an aggregate value of Tk.
50 lacs and conducting their affairs to the
satisfaction of the Bangladesh Bank have been
declared as scheduled banks in terms of section
37(2) of Bangladesh Bank Order 1972. In terms
of section 13 of Bank Company Act, 1991, the
minimum aggregate value was Tk. 20 crores.
From 30th 2003 it was Tk 100 crores.
From 8th 2007 it was Tk. 200 crores .
From 11th 2011, it has been raised at
the minimum of Tk. 400 crores ( as per Circular Letter No. BRPD (R-1) 717/ 2008 - 511 dated
August 12, 2008).

ii
The names of the scheduled banks
whose operations are recorded in this
volume are as below:
A. STATE OWNED BANKS:
1. Agrani Bank Limited.
2. Janata Bank Limited.
3. Rupali Bank Limited.
4. Sonali Bank Limited.
B. SPECIALSED BANKS:
1. Bangladesh Krishi Bank.
2. Rajshahi Krishi Unnayan Bank.
3. Bank of Small Industries and
Commerce Bangladesh Ltd.
4. Bangladesh Development
Bank Limited.
C. PRIVATE BANKS:
a) Foreign Banks:
1. Standard Chartered Bank
2. State Bank of India
3. Habib Bank Ltd.
4. Citi Bank, N.A.
5. Commercial Bank of Ceylon Ltd.
6. National Bank of Pakistan
7. Woori Bank
8. The Hong Kong & Shanghai Banking
Corporation Ltd.
9. Bank Al-Falah Ltd.
b) Private Banks (Incorporated in
Bangladesh excluding Islamic
Banks):
1. AB Bank Ltd.
2. National Bank Ltd.
3. The City Bank Ltd.
4. International Finance Investment and
Commerce Bank Ltd.
5. United Commercial Bank Ltd.
6. Pubali Bank Ltd.
7. Uttara Bank Ltd.
8. Eastern Bank Ltd.
9. National Credit and Commerce Bank
Ltd.
10. Prime Bank Ltd.
11. Southeast Bank Ltd.
12. Dhaka Bank Ltd.
13. Dutch Bangla Bank Ltd.
14. Mercantile Bank Ltd.
15. Standard Bank Ltd.
16. One Bank Ltd.
17. Bangladesh Commerce Bank Ltd.
18. Mutual Trust Bank Ltd.
19. Premier Bank Ltd.
20. Bank Asia Ltd.
21. Trust Bank Ltd.
22. Jamuna Bank Ltd.
23. BRAC Bank Ltd.
24. NRB Commercial Bank Ltd.
25. South Bangla Agriculture and
Commerce Bank Ltd.
26. Meghna Bank Ltd.
27. Midland Bank Ltd.
28. The Farmers Bank Ltd.
29. NRB Bank Ltd.
30. Modhumoti Bank Ltd.
31. NRB Global Bank Ltd.
c) Islamic Banks
1. Islami Bank Bangladesh Ltd.
2. ICB Islamic Bank Ltd.
3. Al-Arafah Islami Bank Ltd.
4. Social Islami Bank Ltd.
5. EXIM Bank Ltd.
6. First Security Islami Bank Ltd.
7. Shahjalal Islami Bank Ltd.
8. Union Bank Ltd.

iii
The banks play an important role in the
economy of the country. Bangladesh Bank
has been collecting, compiling and publishing
statistics on scheduled banks for the use of
researchers, planners and policy makers.
The statistical tables contained in this
issue have been prepared from the returns
submitted by the individual bank branches of
scheduled banks as on the last day of the
quarter ending 30th
June 2014. At the end of
the period under study the total number of
reported bank branches including Head
Offices, Islamic Windows and SME service
centers stood at 8886, which contains only 76
branches of foreign banks.
For useful presentation of data, banks
have been classified into several groups viz.
All Banks
Specialised Banks Foreign Banks
(Including Islamic Banks). A
has been introduced consisting of seven banks
(Incorporated in Bangladesh), run on the basis
of Islamic Sariah with effect from quarter
January-March 1998. These banks are 1)
Islami Bank Bangladesh Ltd. 2) ICB Islamic
Bank Ltd. 3) Al-Arafah Islami Bank Ltd. 4)
Social Islami Bank Ltd. 5) EXIM Bank Ltd.
6) Shahjalal Islami Bank Ltd. 7) First Security
Islami Bank Ltd. and 8) Union Bank Ltd. The
publication provides a detailed analysis of
bank deposits (excluding inter-bank)
by Rates of Interest & Types ,
; outstanding advances
(excluding inter-bank transactions) mainly
by Rates of Interest &
Securities by Size of
Account etc. and
bills mainly in the form of by .
From the very inception, the
were being
collected and published on quarterly basis.
Later on since December, 1988 the data had
been collected on half yearly basis and
published on annual basis ending December
every year. Subsequently, from December
1990 the data were collected on quarterly
basis but published on annual basis. Then it
was decided to publish again on quarterly
basis from June 1992 and the present
publication follows as a sequel to the change
in the policy decision.
The role of agricultural credit in
fostering the economy of the country has
gained importance nowadays. To this end in
mind agricultural credit statistics time series
data were collected and presented pertaining
to the period from 1984-85 to 2013-14.
The figures published in this booklet
may differ from those contained in the
statement of position of Scheduled Banks
released each week by the Bangladesh Bank
due to difference in timing and coverage.
From the quarter July-September,
2013, the Scheduled Banks were instructed
to follow the Guidelines to Fill in the
Banking Statistics Returns SBS-1, SBS-2 &
SBS-3 fifth edition, published in July 2013.
In this brochure, all statistical tables have
been prepared on the basis of returns,
submitted by the scheduled banks as per the
booklet, published in July 2013.
For taking into account, the
remittances (in Foreign Currency) by the
Wage earners abroad, two types of deposits:
Foreign Currency Deposits have been
introduced from the quarter ending on
December, 2001.

iv
EXPLANATORY NOTES TO THE TABLES
Table-1: Divisions/Districts wise
distribution of per capita
Deposits/Advances on the basis of
population: The table furnishes the
division/district wise distribution of
population, number of reporting bank
branches, per capita deposits and per capita
advances.
Table-2 to 7: Deposits Distributed by Types
of Accounts: These tables show the
classification of total demand and time
liabilities of scheduled banks (excluding inter-
bank) into fourteen broad types such as (a)
Current and Cash Credit Account (credit
balances) Deposits, (b) Deposits
withdrawable on Sight, (c) Savings Deposits,
(d) Convertible Taka Accounts of Foreigners,
(e) Foreign Currency Accounts, (f) Wage
Currency Deposits, (h) Special Notice
Deposits, (i) Fixed Deposits, (j) Recurring
Deposits, (k) Margin Deposits (Foreign
Currency/Taka), (l) Special Purpose Deposits,
(m) Negotiable Certificates of Deposits &
Promissory Notes and (n) Restricted
(Blocked) Deposits.
a) Current and Cash Credit Accounts
Deposits: These are of the nature of
demand deposits and comprise current
accounts and credit balances of cash
credit accounts. Generally no interest is
allowed on these deposits. These deposits
are to be reported in code no.-100 as
usual but from the quarter, October-
December, 2005 some banks have started
paying interest on this type of account.
This later type is to be reported in code
no.-105. These accounts have chequing
facilities and balances are transferable.
b) Deposits Withdrawable on Sight: This
item includes all deposits which cannot
be transferred through cheques but are
withdrawable on demand such as
overdue Fixed Deposits Accounts,
unclaimed balances, payment orders,
telephonic transfers, mail transfers,
demand drafts, unclaimed dividends and
draft payable accounts, Earnest Money of
Tenders/Quotations etc.
c) Saving Deposits Account: Deposit on
these accounts is self-explanatory and
generally emanates from the individuals.
A portion, varying from time to time, of
savings deposits constitutes demand
deposits. From 1st July, 1996 11% of
savings deposits was regarded as demand
deposits and from 1st July 1997, it was
10%. At present from 24th
June, 2007,
9% of savings deposits has been being
regarded as demand deposits.
d) Convertible Taka Account of
Foreigners: Convertible Taka account of
foreigners is deposits of foreign
individuals, embassies, foreign
Governments and international agencies,
all of which have non-resident status
under foreign exchange regulations.
e) Foreign Currency Accounts: Foreign
currency accounts consist of the deposits
(in foreign currency) of the foreigners
(residing abroad or in Bangladesh) and
foreign missions & their expatriate
employees.
f) The
depositors of these accounts are the
Bangladeshi nationals, who work abroad.
These accounts are fed by the remittances
(in foreign currency) from these persons.
Deposits in NFCD accounts along with
interest thereon are also reported in these
accounts. .
g) Resident Foreign Currency Deposits: Persons ordinarily residing in Bangladesh
may open this account with foreign

v
exchanges brought in at the time of their
return from travel abroad. Deposits or
remittances from persons, working in
Bangladesh missions abroad and
Retention quota deposits by the exporters
are also included in these deposits.
h) Special Notice Deposits: This item
includes the deposits that are deposited
for a period ranging from 7 days to 89
days. These types of liabilities are
payable on Special notice or after a
specified period other than the fixed
deposits. Some of these types of deposits
are of the nature of time deposits.
i) Fixed Deposits: These are reclassified
by period of maturity and are exclusively
time deposits.
j) Recurring Deposits: According to this
scheme the investors would be required
to deposit their money limited to
maximum of Tk. 500 per month for a
period of 10 years and 20 years. Interest
on the invested amount will be
compounded at the rate of 15% and
calculated on yearly basis. Deposits
Pension schemes are of the nature of time
deposits and it was introduced in 1983.
Later on Deposits Scheme e.g. APS,
SDPS, SPS, PDS, PSS etc. and Hajj
Deposits Schemes have been introduced
by the various Banks with various
interest.
k) Margin Deposits (Foreign
Currency/Taka): Equivalent Taka of
margin on letters of Credit and margins
on guarantee (in Taka & Foreign
Currency) are included in this item.
l) Special Purpose Deposits: This item
comprises employee
funds/pension Accounts, contribution
towards insurance funds, Hajj Deposits,
Staff guarantee/Security funds, Security
Deposits, Gift Certificate Deposits,
Sundry deposits, Surcharge and
Development charge etc.
m) Negotiable Certificates of Deposits and
Promissory Notes:
Negotiable certificates of deposits are
bearer certificate deposits and are of
nature of time deposits.
n) Restricted (Blocked) Deposits: The
balances of restricted (blocked) deposits
are reported in this item against Private
Sector. According to Special Law, the
competent authority blocks these
accounts. In blocked period, the
depositors cannot withdraw their
deposits.
Table 8 to 13. Deposits Distributed by
Divisions/Districts and Areas (Urban &
Rural): These tables show the district-wise
distribution of deposits of urban and rural
regions of the country. It is mentioned that the
transaction of the branches in municipal area
is treated as urban area transaction (deposits
or advances as the case may be) while the
transaction of the branches located out-side
the municipal area is regarded as rural area
transaction (deposits or advances).
Table 14 to 19: Deposits Distributed by
Sectors and Types: These Tables provide a
break up of deposits by different sectors of
deposits mentioned in the paragraph number
two.

vi
Table 20 to 25: Deposits Distributed by
Rates of Interest/Profit and Types: These
tables show the rates of interest allowed by
the scheduled banks on different types of
deposits. No interest is allowed on current
deposits (without interest, Code no.-100) and
deposits withdrawable on sight while interest
is allowed on current deposits (with interest,
Code no.-105), savings deposits, fixed
deposits, pension scheme deposits and foreign
currency accounts of non-residents and
residents. The rate of interest varies from time
to time. The amount of deposits against
bills payables such as MT, DD, TT,
outstanding drafts etc. Depositors will have
the option for withdrawing interest
accumulated every twelve months or can have
the interest with the principal to be
compounded in case of maturity exceeding
one year. Profit/Loss is applicable in the cases
of Islamic Banks (Islami Bank Bangladesh
Ltd., ICB Islamic Bank Ltd., Al-Arafah
Islami Bank Ltd., Social Islami Bank Ltd.,
EXIM Bank Ltd, First Security Islami Bank
Ltd., Shahjalal Islami Bank Ltd. and Union
Bank Ltd.).
Table 26 to 31: Deposits Distributed by
Size of Accounts: The Statistics of number of
Accounts and corresponding amount falling
within specified groups are not based
exclusively on individual accounts. As the
number of accounts is considerably large, the
respondents have the option to combine the
accounts and amount in such cases when the
types of deposits, the category of depositors
and the rates of interest allowed thereon are
the same. In such cases it is not the actual size
of components but the average size of the
group that determines the class to which it
belongs. Notwithstanding the existence of an
element of statistical errors, it is believed that
the estimates would not differ significantly
from the actual position.
Table 32: Deposits Distributed by Size of
Accounts and Sectors: The Tables provide a
break up of deposits by size of accounts and
sector.
Table 33: Deposits Distributed by Selected
Thanas: The statistics show the distribution
of deposits in the leading thanas of the
country and those have been presented in the
descending order of magnitude of deposits.
Table 34: Debits to Deposits Accounts and
Turnover: The table shows debits to various
types of deposit accounts during the period
under review. This also includes co-efficient
of turnover by relating debits to average
amounts of deposits.
Table 35 to 40: Advances Classified by
Securities: These tables show the break-up of
scheduled banks advances (excluding
interbank) by types of securities pledged or
hypothecated.
Table 41 to 46: Advances Classified by
Economic Purposes: These tables show the
advances made by scheduled banks to
different economic purposes for which the
borrowers borrow. If a borrower pursues more
than one profession the classification is done
in accordance with his major calling.
Table 47 to 52: Advances Classified by
Rates of Interest and Securities: These
tables give the rates of interest charged by the
scheduled banks on various types of securities
as well as clean advances. Advances to
Classified advances (Bad/ Loss) (c) Advances
associated with clearing disputes etc.
Table 53: Advances Classified by Selected
Thanas: This table shows the classification of
advances in the leading thanas of the country
and those have been presented in the
descending order of magnitude of advances.

vii
Table 54: Advances Classified by Size of
Accounts and Economic Groups: The table
provides statistics on advances classified by
size of accounts and economic groups. The
respondents can group those accounts
together where the securities, the economic
purpose, the category of borrowers and the
rates of interest are the same. As a result the
size of distribution suffers from a similar
limitation as its analogy in deposits.
Table 55 to 60: Advances Classified by Size
of Accounts: These tables provides statistics
on advances classified by size of accounts.
Table 61: Advances Classified by Major
Economic Purposes and Sectors: The table
provides a break-up of advances classified by
major economic purposes to public and
private sectors.
Table 62 to 67: Advances Classified by
Division / Districts and Areas (Urban /
Rural): These tables show the district-wise
classification of advances of urban and rural
regions of the country.
Table 68: Advances Classified by Size of
Accounts and Sectors: The table provides
statistics on advances classified by size of
accounts and sector.
Table 69 to 74: Advances Classified by
Rates of Interest and Major Economic
Purposes: These tables provide rates of
interest charged by the scheduled banks on
advances for different economic purposes.
Table 75 to 80: Agricultural Credits
Statistics.
Table 81 to 86: Classification of Bills
purchased and discounted: The statement
provides an account of bills purchased and
discounted by major economic purposes of
drawees. Along with the corresponding
statement on advances the statistics provide
information on the structure of bank credit.
Table 87: Classification of Bills by sectors.

viii
A REVIEW ON DEPOSITS AND ADVANCES OF SCHEDULED BANKS
(AS ON END JUNE, 2014)
Total deposit liabilities (excluding
interbank items) of the scheduled banks increased
by Tk.27172.79 crores or 4.37% to Tk. 649440.02
crores during the quarter April-June, 2014 as
compared to increases of Tk. 11736.69 crores or
1.92% and Tk. 27220.01 crores or 5.00 % in the
previous quarter (January-March, 2014) and the
corresponding quarter (April-June, 2013) of the
last year respectively. The increase in deposits
during the quarter was due to increases in urban
deposits by Tk. 19346.91 crores or 3.80% to Tk.
528490.05 crores and in rural deposits by
Tk. 7825.88 crores or 6.92% to Tk. 120949.97
crores. The share of urban deposits to total
deposits at the end of the quarter April-June, 2014
was 81.38% as compared to 81.82% at the end of
the preceding quarter (January-March, 2014) and
81.98% at the end of the corresponding quarter
(April-June, 2013) of the last year. Bank deposits
registered an increase of Tk. 77332.34 crores or
13.52% from end June, 2013 to June, 2014 as
compared to an increase of Tk. 85700.47 crores or
17.62% from end June, 2012 to end June, 2013.
Banks' Advances:
advances increased by Tk.
18686.71crores or 4.14% to Tk. 469583.21 crores
during the quarter April-June, 2014 as compared
to increases of Tk. 7052.09 crores or 1.59% and
Tk. 10755.89 crores or 2.60% respectively during
the preceding quarter (January-March, 2014) and
the corresponding quarter (April-June, 2013) of
the last year. Bank advances in urban areas
increased by Tk. 17001.41 crores or 4.19%
to Tk. 423226.68 crores and in rural areas
increased by Tk. 1685.30 crores or 3.77% to Tk
46356.53 crores during the quarter under review.
Bank advances exhibited an increase by Tk.
44778.74 crores or 10.54% from end June, 2013
to end June, 2014 as compared to an increase of
Tk. 38871.33 crores or 10.07% from end June,
2012 to end June, 2013.
ix
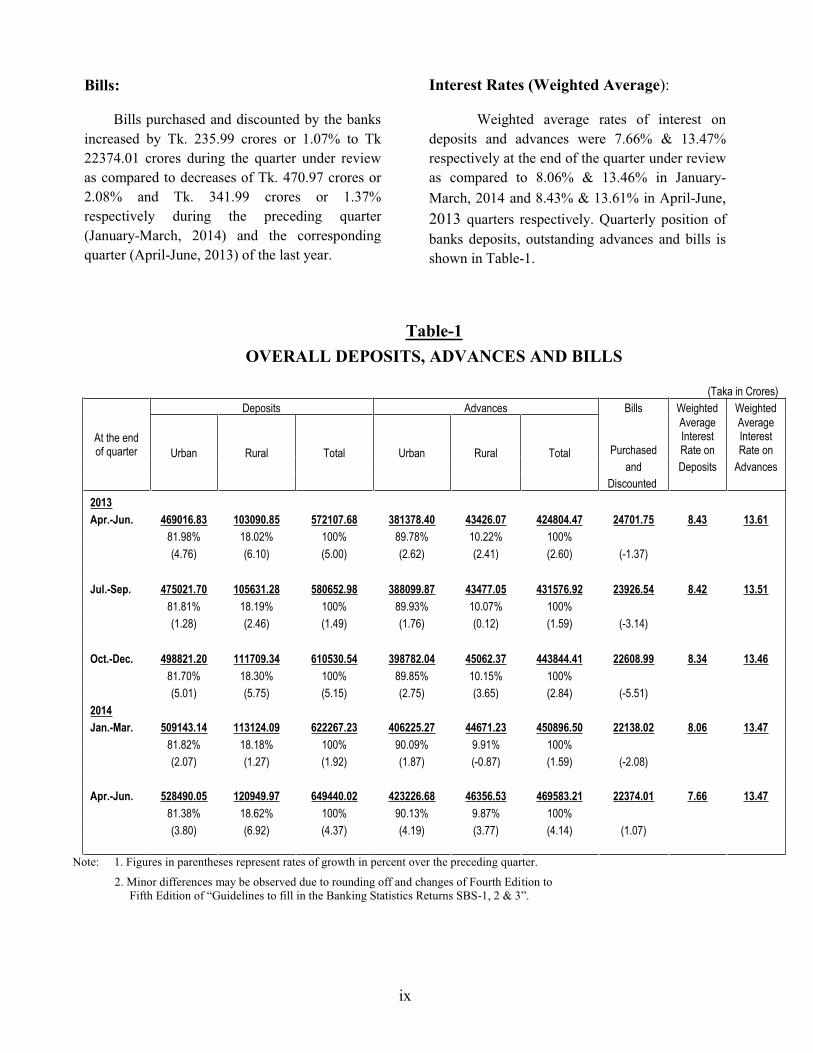
Bills:
Bills purchased and discounted by the banks
increased by Tk. 235.99 crores or 1.07% to Tk
22374.01 crores during the quarter under review
as compared to decreases of Tk. 470.97 crores or
2.08% and Tk. 341.99 crores or 1.37%
respectively during the preceding quarter
(January-March, 2014) and the corresponding
quarter (April-June, 2013) of the last year.
Interest Rates (Weighted Average):
Weighted average rates of interest on
deposits and advances were 7.66% & 13.47%
respectively at the end of the quarter under review
as compared to 8.06% & 13.46% in January-
March, 2014 and 8.43% & 13.61% in April-June,
2013 quarters respectively. Quarterly position of
banks deposits, outstanding advances and bills is
shown in Table-1.
Table-1
OVERALL DEPOSITS, ADVANCES AND BILLS
(Taka in Crores)
At the end of quarter
Deposits Advances Bills Weighted Weighted
Urban Rural Total Urban Rural Total Purchased
Average Interest Rate on
Average Interest Rate on
and Deposits Advances
Discounted
2013
Apr.-Jun. 469016.83 103090.85 572107.68 381378.40 43426.07 424804.47 24701.75 8.43 13.61
81.98% 18.02% 100% 89.78% 10.22% 100%
(4.76) (6.10) (5.00) (2.62) (2.41) (2.60) (-1.37)
Jul.-Sep. 475021.70 105631.28 580652.98 388099.87 43477.05 431576.92 23926.54 8.42 13.51
81.81% 18.19% 100% 89.93% 10.07% 100%
(1.28) (2.46) (1.49) (1.76) (0.12) (1.59) (-3.14)
Oct.-Dec. 498821.20 111709.34 610530.54 398782.04 45062.37 443844.41 22608.99 8.34 13.46
81.70% 18.30% 100% 89.85% 10.15% 100%
(5.01) (5.75) (5.15) (2.75) (3.65) (2.84) (-5.51)
2014
Jan.-Mar. 509143.14 113124.09 622267.23 406225.27 44671.23 450896.50 22138.02 8.06 13.47
81.82% 18.18% 100% 90.09% 9.91% 100%
(2.07) (1.27) (1.92) (1.87) (-0.87) (1.59) (-2.08)
Apr.-Jun. 528490.05 120949.97 649440.02 423226.68 46356.53 469583.21 22374.01 7.66 13.47
81.38% 18.62% 100% 90.13% 9.87% 100%
(3.80) (6.92) (4.37) (4.19) (3.77) (4.14) (1.07)
Note: 1. Figures in parentheses represent rates of growth in percent over the preceding quarter.
2. Minor differences may be observed due to rounding off and changes of Fourth Edition to
-

x
Banks' Credit:
Total credit of the Scheduled banks
increased by Tk 18922.72 crores or 4.00% to Tk.
491957.22 crores during the quarter under review
as compared to increases of Tk. 6581.10 crores or
1.41% and Tk. 10413.90 crores or 2.37%
respectively during the preceding quarter
(January-March, 2014) and the corresponding
quarter (April-June, 2013) of the last year.
Banks' Investment:
The Scheduled banks' investment
increased by Tk. 8940.34 crores or 5.36% to Tk.
175707.05 crores at the end of the quarter April-
June, 2014 as compared to increases of Tk.
5049.41 crores or 3.12% and Tk. 21156.59 crores
or 17.44% respectively during the
Preceding quarter (January-March, 2014) and
the corresponding quarter (April-June, 2013) of
the last year.
Borrowings from the Bangladesh Bank:
The Scheduled Banks' borrowings from
the Bangladesh Bank at the end of the quarter
under review decreased by Tk. 1059.25 crores or
16.09% to Tk. 5523.19 crores as compared to a
decrease of Tk. 62.47 crores or 0.94% and a
decrease of Tk. 369.20 crores or 3.77%
respectively during the preceding quarter
(January-March, 2014) and the corresponding
quarter (April-June, 2013) of the last year.
Quarterly position of the scheduled banks' credit,
investment and borrowings from the Bangladesh
Bank is shown in Table-2.
TABLE-2
BORROWING FROM BANGLADESH BANK
(Taka in Crores)
At the end Scheduled Banks' Credit Scheduled Banks' Investment Borrowings from
of quarter Advances Bills Total Govt. Others Total Bangladesh
Investment Bank
2013
Apr.-Jun 424804.47 24701.75 449506.22 120808.55 21651.34 142459.89 9436.81
94.50% 5.63% 100% 84.80% 15.20% 100%
(2.60) (-1.37) (2.37) (16.75) (21.44) (17.44) (-3.77)
Jul.-Sep. 431576.92 23926.54 455503.46 124799.82 22629.18 147429.00 8569.40
94.75% 5.25% 100% 84.65% 15.35% 100%
(1.59) (-3.14) (1.33) (3.30) (4.52) (3.49) (-9.19)
Oct.-Dec. 443844.41 22608.99 466453.40 133433.83 28283.47 161717.30 6644.91
95.15% 4.85% 100% 82.51% 17.49% 100%
(2.84) (-5.51) (2.40) (6.92) (24.99) (9.69) (-22.46)
2014
Jan.-Mar. 450896.50 22138.02 473034.50 142942.39 23824.32 166766.71 6582.44
95.32% 4.68% 100% 85.71% 14.29% 100%
(1.59) (-2.08) (1.41) (7.13) (-15.77) (3.12) (-0.94)
Apr.-Jun. 469583.21 22374.01 491957.22 149325.16 26381.89 175707.05 5523.19
95.45% 4.55% 100% 84.99% 15.01% 100%
(4.14) (1.07) (4.00) (4.47) (10.74) (5.36) (-16.09)
Note: 1. Figures in parentheses represent rates of growth in percent over the preceding quarter.
2. Minor differences may be observed due to rounding off.

xi
Deposits by Category of Banks:
The increase of Tk. 27172.79 crores
or 4.37% in total deposit liabilities during the
quarter April-June, 2014 over the preceding
quarter January-March, 2014 was shared by
increases in Private banks by Tk. 18722.90 crores
or 4.76%, Specialised banks by Tk. 692.81 crores
or 2.03%, Islamic banks by Tk. 7033.55 crores or
6.20%, State Owned banks by Tk. 10392.48
crores or 6.53% and decrease in Foreign banks by
Tk.2635.40 crores or 7.35%. The net accretion in
deposits during the quarter under review over the
same quarter (April-June, 2013) of the last year
amounting to Tk. 77332.34 crores or 14.19% was
due to increase in deposits of State Owned banks
by Tk. 16920.80 crores or 11.95%, in
Private banks by 54642.05 crores or 15.93%, in
Specialised banks by Tk. 4487.30 crores or
16.38%, in Islamic banks by Tk. 19275.78 crores
or 20.11% and in Foreign banks by Tk. 1282.19
crores or 3.89%. Of the total deposits of Tk.
649440.02 crores at the end of the quarter under
review, the shares of State Owned banks,
Specialised banks, Foreign banks, Private banks
and Islamic banks were Tk. 169487.81 crores
(26.10%), Tk. 34873.63 crores (5.37%), Tk.
33198.09 crores (5.11%), Tk. 411880.49 crores
(63.42%) and Tk. 120477.36 crores (6.20%)
respectively. The position in respect of deposit
liabilities by category of banks is shown in Table-
3.
TABLE-3
DEPOSITS DISTRIBUTED BY CATEGORY OF BANKS
(Taka in Crores)
At the end State Specialised Foreign Private Banks Islamic All
of quarter owned Banks Banks (Including Banks Banks
Banks (Islamic Banks)
2013
Apr.-Jun. 152567.01 30386.33 31915.90 357238.44 101201.58 572107.68
26.67% 5.31% 5.58% 62.44% 17.69% 100%
(7.77) (10.94) (-3.25) (4.17) (5.60) (5.00)
Jul.-Sep. 153915.71 31206.72 33632.02 361898.53 102296.84 580652.98
26.51% 5.37% 5.79% 62.33% 17.62% 100%
(0.88) (2.70) (5.38) (1.30) (1.08) (1.49)
Oct.-Dec. 161039.92 33961.60 33997.10 381531.92 107821.65 610530.54
26.38% 5.56% 5.57% 62.49% 17.66% 100%
(4.63) (8.83) (1.09) (5.43) (5.40) (5.15)
2014
Jan.-Mar. 159095.33 34180.82 35833.49 393157.59 113443.81 622267.23
25.57% 5.49% 5.76% 63.18% 17.66% 100%
(-1.21) (0.65) (5.40) (3.05) (5.21) (1.92)
Apr.-Jun. 169487.81 34873.63 33198.09 411880.49 120477.36 649440.02
6.53% 2.03% -7.35% 63.42% 18.55% 100%
(26.10) (5.37) (5.11) (4.76) (6.20) (4.37)
Note: 1. Figures in parentheses represent rates of growth in percent over the preceding quarter.
2. Minor differences may be observed due to rounding off.

xii
Deposits by Types of Accounts:
Breakdown by types of deposits
accounts revealed that the share of fixed
deposits decreased from 54.30% at the end of
the quarter January-March, 2014 to 53.81% at
the end of quarter April-June, 2014. The
amount of fixed deposits increased by Tk.
11567.57 crores or 3.42% to Tk. 349474.28
crores at the end of the quarter under review
as or compared to increases of Tk. 11738.55
crores or 3.60% and Tk. 14212.80 crores or
5.01% at the end of the preceding quarter
(January-March, 2014) and the corresponding
quarter (April-June, 2013) of the last year
respectively. The share of savings deposits to
total deposits increased from 16.28% on the
31st March, 2014 to 16.66% on the 30
th June,
2014. Deposits distributed by types of
accounts are shown in Table-4.

x
iii
TA
BL
E-4
DE
PO
SIT
S D
IST
RIB
UT
ED
BY
TY
PE
S O
F A
CC
OU
NT
S
(T
aka in
Cro
res)
At th
e end
C
urren
t S
avin
gs
Co
nvertib
le
Tak
a
Acco
unt o
f
Fo
reigners
Fo
reign
Curren
cy
Acco
unts
Wag
e
Earn
ers'
Dep
osits
Resid
ent
Fo
reign
Curren
cy
Dep
osits
Sp
ecial
No
tice
Dep
osits
Fix
ed
Recu
rring
O
ther
To
tal
of q
uarter
and
Cash
D
epo
sits D
epo
sits D
epo
sits D
epo
sits D
epo
sits
C
redit
Acco
unt
D
epo
sits
20
13
Ap
r.-J
un
. 4
54
68
.39
99
316
.22
12
43
.13
30
91
.41
13
56
.48
56
51
.48
45
796
.84
29
806
1.8
1
40
941
.78
3
11
80
.14
57
210
7.6
8
7
.95
%
17
.36
%
0.2
2%
0
.54
%
0.2
4%
0
.99
%
8.0
0%
5
2.1
0%
7
.16
%
5.4
5%
1
00
%
(8
.78)
(-0.9
1)
(10
.93
) (1
7.3
6)
(-16
.34
) (2
7.0
6)
(13
.04
) (5
.01)
(9.9
3)
(-0.7
9)
(5.0
0)
Ju
l.-Sep
. 4
26
18
.89
97
899
.42
10
63
.90
31
91
.14
95
9.9
2
52
04
.98
46
359
.41
31
158
0.3
7
39
380
.93
32
394
.02
58
065
2.9
8
7
.34
%
16
.86
%
0.1
8%
0
.55
%
0.1
7%
0
.90
%
7.9
8%
5
3.6
6%
6
.78
%
5.5
8%
1
00
%
(-6
.27
) (-1
.43
) (-1
4.4
2)
(3.2
3)
(-29
.23
) (-7
.90
) (1
.23)
(4.5
4)
(-3.8
1)
(3.8
9)
(1.4
9)
Oct.-D
ec.
46
315
.71
10
052
3.8
0
10
46
.16
38
74
.19
14
43
.38
51
73
.91
49
991
.07
32
616
8.1
6
43
133
.17
3
28
60
.99
61
053
0.5
4
7
.59
%
16
.46
%
0.1
7%
0
.63
%
0.2
4%
0
.85
%
8.1
9%
5
3.4
2%
7
.06
%
5.3
8%
1
00
%
(8
.67)
(2.6
8)
(-1.6
7)
(21
.40
) (5
0.3
6)
(-0.6
0)
(7.8
3)
(4.6
8)
(9.5
3)
(1.4
4)
(5.1
5)
20
14
Ja
n.-M
ar.
47
854
.05
10
130
3.7
2
10
99
.04
46
56
.93
20
32
.58
54
53
.34
45
772
.69
33
790
6.7
1
42
857
.67
3
33
30
.50
62
226
7.2
3
7
.69
%
16
.28
%
0.1
8%
0
.75
%
0.3
3%
0
.88
%
7.3
6%
5
4.3
0%
6
.89
%
5.3
6%
1
00
%
(3
.32)
(0.7
8)
(5.0
5)
(20
.20
) (4
0.8
2)
(5.4
0)
(-8.4
4)
(3.6
0)
(-0.6
4)
(1.4
3)
(1.9
2)
Ap
r.-J
un
. 5
04
17
.80
10
820
3.9
3
13
24
.76
25
67
.99
18
69
.85
49
88
.00
51
157
.00
34
947
4.2
8
42
714
.55
3
67
21
.86
64
944
0.0
2
7
.76
%
16
.66
%
0.2
0%
0
.40
%
0.2
9%
0
.77
%
7.8
8%
5
3.8
1%
6
.58
%
5.6
5%
1
00
%
(5
.36)
(6.8
1)
(20
.54
) (-4
4.8
6)
(-8.0
1)
(-8.5
3)
(11
.76
) (3
.42)
(-0.3
3)
(10
.17
) (4
.37)
No
te: 1. F
igu
res in p
arenth
eses represen
t rates of g
row
th in
percen
t over th
e preced
ing q
uarter.
2. M
ino
r differen
ces may
be o
bserv
ed d
ue to
roun
din
g o
ff and
chan
ges o
f Fou
rth E
ditio
n to
Fift
-
3. O
ther d
epo
sits inclu
de D
epo
sits With
draw
able o
n S
igh
t, Marg
in D
epo
sits, Sp
ecial Pu
rpo
se Dep
osits, N
ego
tiable C
ertificates of D
epo
sits & R
estricted D
epo
sits.
xiv
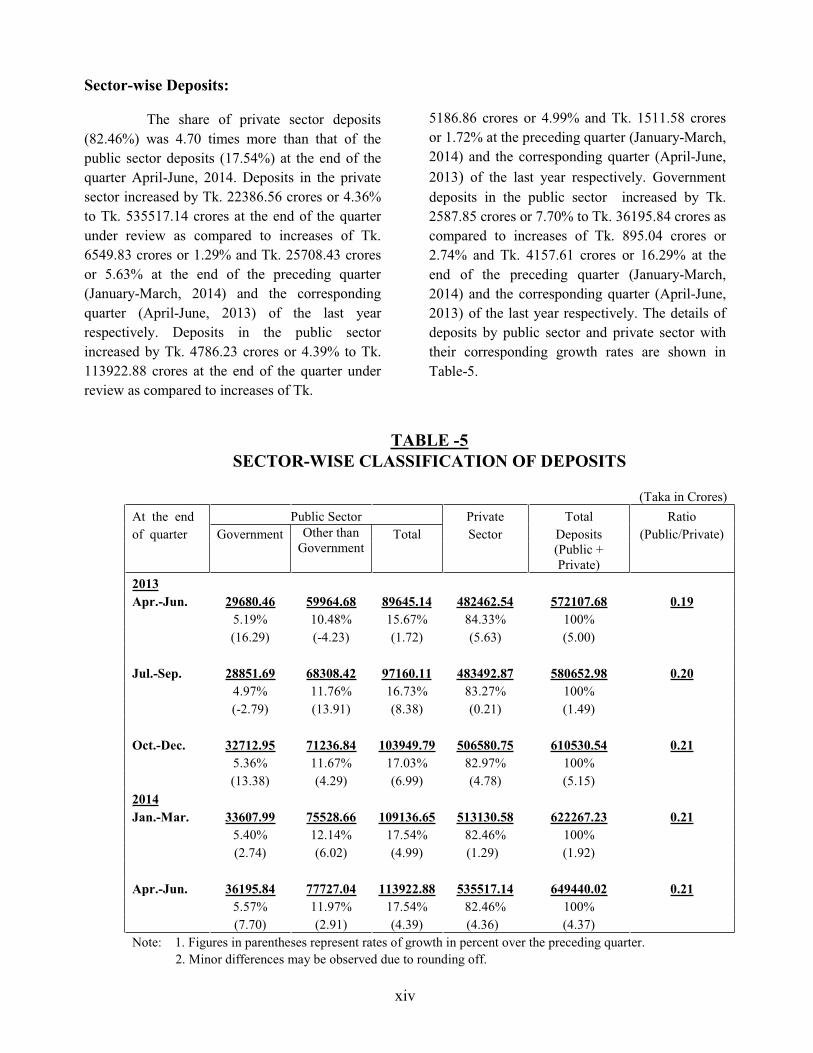
Sector-wise Deposits:
The share of private sector deposits
(82.46%) was 4.70 times more than that of the
public sector deposits (17.54%) at the end of the
quarter April-June, 2014. Deposits in the private
sector increased by Tk. 22386.56 crores or 4.36%
to Tk. 535517.14 crores at the end of the quarter
under review as compared to increases of Tk.
6549.83 crores or 1.29% and Tk. 25708.43 crores
or 5.63% at the end of the preceding quarter
(January-March, 2014) and the corresponding
quarter (April-June, 2013) of the last year
respectively. Deposits in the public sector
increased by Tk. 4786.23 crores or 4.39% to Tk.
113922.88 crores at the end of the quarter under
review as compared to increases of Tk.
5186.86 crores or 4.99% and Tk. 1511.58 crores
or 1.72% at the preceding quarter (January-March,
2014) and the corresponding quarter (April-June,
2013) of the last year respectively. Government
deposits in the public sector increased by Tk.
2587.85 crores or 7.70% to Tk. 36195.84 crores as
compared to increases of Tk. 895.04 crores or
2.74% and Tk. 4157.61 crores or 16.29% at the
end of the preceding quarter (January-March,
2014) and the corresponding quarter (April-June,
2013) of the last year respectively. The details of
deposits by public sector and private sector with
their corresponding growth rates are shown in
Table-5.
TABLE -5
SECTOR-WISE CLASSIFICATION OF DEPOSITS
(Taka in Crores)
At the end Public Sector Private Total Ratio
of quarter Government Other than
Government Total Sector Deposits (Public/Private)
(Public +
Private)
2013
Apr.-Jun. 29680.46 59964.68 89645.14 482462.54 572107.68 0.19
5.19% 10.48% 15.67% 84.33% 100%
(16.29) (-4.23) (1.72) (5.63) (5.00)
Jul.-Sep. 28851.69 68308.42 97160.11 483492.87 580652.98 0.20
4.97% 11.76% 16.73% 83.27% 100%
(-2.79) (13.91) (8.38) (0.21) (1.49)
Oct.-Dec. 32712.95 71236.84 103949.79 506580.75 610530.54 0.21
5.36% 11.67% 17.03% 82.97% 100%
(13.38) (4.29) (6.99) (4.78) (5.15)
2014
Jan.-Mar. 33607.99 75528.66 109136.65 513130.58 622267.23 0.21
5.40% 12.14% 17.54% 82.46% 100%
(2.74) (6.02) (4.99) (1.29) (1.92)
Apr.-Jun. 36195.84 77727.04 113922.88 535517.14 649440.02 0.21
5.57% 11.97% 17.54% 82.46% 100%
(7.70) (2.91) (4.39) (4.36) (4.37)
Note: 1. Figures in parentheses represent rates of growth in percent over the preceding quarter.
2. Minor differences may be observed due to rounding off.

x
v
Div
ision
-wise U
rba
n/R
ura
l Dep
osits:
Distrib
utio
n of
dep
osits
by ad
min
istrative
areas rev
ealed th
at
Dh
aka
Div
ision
co
ntrib
uted
m
ore
than
h
alf (6
4.0
2%
) of
the
total
dep
osits an
d th
e share o
f urb
an d
eposits in
this d
ivisio
n w
as 54
.98%
at
the
end
o
f th
e q
uarter
un
der
review
. T
he
dep
osits
in
this
div
ision
increased
by 3
.91%
to T
k. 4
15
79
7.1
5 cro
res at the en
d o
f the q
uarter
Ap
ril-Jun
e, 20
14
as com
pared
to in
creases of 1
.81
% an
d 6
.25%
at the
end
of p
recedin
g q
uarter Jan
uary
-March
, 201
4 an
d th
e corresp
on
din
g
qu
arter of th
e last year (A
pril-Ju
ne, 2
01
3) resp
ectively
. Th
e share o
f
dep
osits
in R
angp
ur
Div
ision
(1
.78%
) an
d B
arisal D
ivisio
n (1
.78
%)
were
the
low
est. D
ivisio
n w
ise d
istributio
n o
f dep
osits
in urb
an an
d
rural areas is sh
ow
n in
Tab
le-6.
TA
BL
E-6
(Con
td.)
DIV
ISIO
N-W
ISE
UR
BA
N/R
UR
AL
DIS
TR
IBU
TIO
N O
F D
EP
OS
ITS
(T
aka in
Cro
res)
At th
e end
C
hittag
ong D
ivisio
n
Dh
aka D
ivisio
n
Kh
uln
a Div
ision
R
ajshah
i Div
ision
of q
uarter
Urb
an
Rural
To
tal U
rban
R
ural
To
tal U
rban
R
ural
To
tal U
rban
R
ural
To
tal
20
13
Ap
r.-J
un
. 8
45
67
.22
26
560
.48
11
112
7.7
0
31
884
8.4
6
50
028
.23
36
887
6.6
9
17
581
.55
61
51
.11
23
732
.66
16
639
.73
5
43
6.2
2
22
075
.95
1
4.7
8%
4
.64
%
19
.42
%
55
.73
%
8.7
4%
6
4.4
8%
3
.07
%
1.0
8%
4
.15
%
2.9
1%
0
.95
%
3.8
6%
(0
.87
) (5
.59
) (1
.96
) (6
.30
) (5
.90
) (6
.25
) (6
.51
) (7
.80
) (6
.84
) (6
.54
) (8
.11
) (6
.92
)
Ju
l.-Sep
. 8
69
92
.24
28
167
.36
11
515
9.6
0
32
342
1.5
6
51
195
.53
37
461
7.0
9
17
038
.92
58
78
.12
22
917
.04
16
450
.85
5
60
0.9
1
22
051
.76
1
4.9
8%
4
.85
%
19
.83
%
55
.70
%
8.8
2%
6
4.5
2%
2
.93
%
1.0
1%
3
.95
%
2.8
3%
0
.96
%
3.8
0%
(2
.87
) (6
.05
) (3
.63
) (1
.43
) (2
.33
) (1
.56
) (-3
.09
) (-4
.44
) (-3
.44
) (-1
.14
) (3
.03
) (-0
.11
)
Oct.-D
ec.
91
839
.44
28
571
.80
12
041
1.2
4
33
787
9.2
7
55
167
.82
39
304
7.0
9
18
565
.90
64
13
.70
24
979
.60
17
437
.84
5
87
1.6
2
23
309
.46
1
5.0
4%
4
.68
%
19
.72
%
55
.34
%
9.0
4%
6
4.3
8%
3
.04
%
1.0
5%
4
.09
%
2.8
6%
0
.96
%
3.8
2%
(5
.57
) (1
.44
) (4
.56
) (4
.47
) (7
.76
) (4
.92
) (8
.96
) (9
.11
) (9
.00
) (6
.00
) (4
.83
) (5
.70
)
20
14
Ja
n.-M
ar.
94
421
.82
29
169
.50
12
359
1.3
2
34
470
6.6
7
55
435
.28
40
014
1.9
5
18
752
.47
66
65
.69
25
418
.16
17
462
.52
5
82
8.5
6
23
291
.08
1
5.1
7%
4
.69
%
19
.86
%
55
.40
%
8.9
1%
6
4.3
1%
3
.01
%
1.0
7%
4
.08
%
2.8
1%
0
.94
%
3.7
5%
(2
.81)
(2.0
9)
(2.6
4)
(2.0
2)
(0.4
8)
(1.8
1)
(1.0
0)
(3.9
3)
(1.7
6)
(0.1
6)
(-0.7
3)
(-0.0
7)
Ap
r.-J
un
. 9
72
06
.04
31
226
.20
12
843
2.2
4
35
707
2.2
2
58
724
.93
41
579
7.1
5
19
778
.03
76
94
.94
27
472
.97
18
727
.99
6
26
2.5
1
24
990
.50
1
4.9
7%
4
.81
%
19
.78
%
54
.98
%
9.0
4%
6
4.0
2%
3
.05
%
1.1
8%
4
.23
%
2.8
8%
0
.96
%
3.8
5%
(2
.95)
(7.0
5)
(3.9
2)
(3.5
9)
(5.9
3)
(3.9
1)
(5.4
7)
(15
.44
) (8
.08
) (7
.23
) (7
.45)
(7.2
8)
Note: 1
. Fig
ures in
paren
theses rep
resent rates o
f gro
wth
in p
ercent o
ver th
e preced
ing q
uarter.
2. M
inor d
ifferences m
ay b
e show
n d
ue to
roun
din
g o
ff.

x
vi
TA
BL
E-6
(Con
cld
.)
DIV
ISIO
N-W
ISE
UR
BA
N/R
UR
AL
DIS
TR
IBU
TIO
N O
F D
EP
OS
ITS
(Tak
a in C
rores)
At th
e end
B
arisal Div
ision
S
ylh
et Div
ision
R
angp
ur D
ivisio
n
All D
ivisio
ns
of q
uarter
Urb
an
Rural
To
tal U
rban
R
ural
To
tal U
rban
R
ural
To
tal U
rban
R
ural
To
tal
20
13
Ap
r.-J
un
. 6
94
2.7
9
31
05
.95
10
048
.74
1
69
33
.76
89
37
.20
25
870
.96
75
03
.32
2
87
1.6
6
10
374
.98
46
901
6.8
3
10
309
0.8
5
57
210
7.6
8
1
.21
%
0.5
4%
1
.76
%
2.9
6%
1
.56
%
4.5
2%
1
.31
%
0.5
0%
1
.81
%
81
.98
%
18
.02
%
10
0%
(7
.99)
(6.8
1)
(7.6
2)
(3.6
9)
(4.4
9)
(3.9
6)
(-17
.03
) (1
1.5
4)
(-10
.70
) (4
.76)
(6.1
0)
(5.0
0)
Ju
l.-Sep
. 6
80
7.7
3
31
58
.50
99
66
.23
1
71
58
.72
89
19
.58
26
078
.30
71
51
.68
2
71
1.2
8
98
62
.96
47
502
1.7
0
10
563
1.2
8
58
065
2.9
8
1
.17
%
0.5
4%
1
.72
%
2.9
6%
1
.54
%
4.4
9%
1
.23
%
0.4
7%
1
.70
%
81
.81
%
18
.19
%
10
0%
(-1
.95
) (1
.69)
(-0.8
2)
(1.3
3)
(-0.2
0)
(0.8
0)
(-4.6
9)
(-5.5
8)
(-4.9
4)
(1.2
8)
(2.4
6)
(1.4
9)
Oct.-D
ec.
73
36
.36
33
40
.93
10
677
.29
1
80
45
.92
93
87
.72
27
433
.64
77
16
.47
2
95
5.7
5
10
672
.22
49
882
1.2
0
11
170
9.3
4
61
053
0.5
4
1
.20
%
0.5
5%
1
.75
%
2.9
6%
1
.54
%
4.4
9%
1
.26
%
0.4
8%
1
.75
%
81
.70
%
18
.30
%
10
0%
(7
.77)
(5.7
8)
(7.1
3)
(5.1
7)
(5.2
5)
(5.2
0)
(7.9
0)
(9.0
2)
(8.2
1)
(5.0
1)
(5.7
5)
(5.1
5)
20
14
Ja
n.-M
ar.
73
80
.56
34
55
.80
10
836
.36
1
86
05
.49
96
12
.55
28
218
.04
78
13
.61
2
95
6.7
1
10
770
.32
50
914
3.1
4
11
312
4.0
9
62
226
7.2
3
1
.19
%
0.5
6%
1
.74
%
2.9
9%
1
.54
%
4.5
3%
1
.26
%
0.4
8%
1
.73
%
81
.82
%
18
.18
%
10
0%
(0
.60)
(3.4
4)
(1.4
9)
(3.1
0)
(2.3
9)
(2.8
6)
(1.2
6)
(0.0
3)
(0.9
2)
(2.0
7)
(1.2
7)
(1.9
2)
Ap
r.-J
un
. 7
91
8.9
9
36
62
.05
11
581
.04
1
94
67
.08
10
110
.23
29
577
.31
83
19
.70
3
26
9.1
1
11
588
.81
52
849
0.0
5
12
094
9.9
7
64
944
0.0
2
1
.22
%
0.5
6%
1
.78
%
3.0
0%
1
.56
%
4.5
5%
1
.28
%
0.5
0%
1
.78
%
81
.38
%
18
.62
%
10
0%
(7
.30)
(5.9
7)
(6.8
7)
(4.6
3)
(5.1
8)
(4.8
2)
(6.4
8)
(10
.57
) (7
.60)
(3.8
0)
(6.9
2)
(4.3
7)
No
te: 1. F
igures in
paren
theses rep
resent rates o
f gro
wth
in p
ercent o
ver th
e preced
ing q
uarter.
2. M
ino
r differen
ces m
ay b
e sho
wn d
ue to
separate ro
und
ing o
ff.

xvii
Advances by Category of Banks: The State owned Banks accounted
for 17.86% of the total advances at the end of the
quarter under review. Advances made by State
owned banks decreased by 0.55% to Tk.83851.57
crores at the end of the quarter under review as
compared to an increase of 1.21% and a decrease
(January-March, 2014) and the corresponding
quarter (April-June, 2013) of the last year
advances increased to 7.11% on the 30th
from 7.04% on the 31st March 2014.
Advances classified by category of banks are
shown in Table-7.
of 1.23% at the end of the preceding quarter
TABLE -7 ADVANCES CLASSIFIED BY CATEGORY OF BANKS
(Taka in Crores) At the end State Specialised Foreign Private Banks Islamic All
of quarter Owned Banks Banks (including Banks Banks
Banks Islamic Banks)
2013
Apr.-Jun. 86166.38 29685.57 21302.08 287650.44 89217.98 424804.47
20.28% 6.99% 5.01% 67.71% 21.00% 100%
(-1.23) (6.19) (3.36) (3.38) (1.05) (2.60)
Jul.-Sep. 82093.56 29987.02 22301.43 297194.91 91984.17 431576.92
19.02% 6.95% 5.17% 68.86% 21.31% 100%
(-4.73) (1.02) (4.69) (3.32) (3.10) (1.59)
Oct.-Dec. 83303.22 31424.94 22185.89 306930.36 94649.88 443844.41
18.77% 7.08% 5.00% 69.15% 21.33% 100%
(1.47) (4.80) (-0.52) (3.28) (2.90) (2.84)
2014
Jan.-Mar. 84312.69 31726.29 21774.69 313082.83 99112.59 450896.50
18.70% 7.04% 4.83% 69.44% 21.98% 100.00%
(1.21) (0.96) (-1.85) (2.00) (4.71) (1.59)
Apr.-Jun. 83851.57 33410.80 21787.86 330532.98 103848.25 469583.21
17.86% 7.11% 4.64% 70.39% 22.11% 100.00%
(-0.55) (5.31) (0.06) (5.57) (4.78) (4.14)
Note: 1. Figures in parentheses represent rates of growth in percent over the preceding quarter.
2. Minor differences may be observed due to rounding off.

xviii
Sector-wise Advances: Advances in the private sector increased by
Tk. 19748.52 crores or 4.47% to Tk. 461201.77
crores at end of the quarter (April-June, 2014) as
compared to increases of Tk. 6107.00 crores or
1.40% and Tk. 11320.43 crores or 2.81% at the
preceding quarter (January-March, 2014) and the
corresponding quarter (April-June, 2013) of the last
year respectively. Loans to the public sector
decreased by Tk. 1061.81 crores or 11.24% to
Tk.8381.44 crores as compared to an increase of
Tk. 945.09 crores or 11.12% and a decrease of
Tk. 564.54 crores or 4.79% during the preceding
quarter (January-March, 2014) and corresponding
quarter of the last year respectively. The decrease
in advances to public sector was due to decrease
in 'Government' sector by Tk. 713.76 crores or
29.95% to Tk. 1669.39 than
Government' sector loans decreased by Tk. 348.05
crores or 4.93% to Tk. 6712.05 crores at the end
of the quarter under review. The sector-wise
position of advances is shown in Table-8.
TABLE- 8 SECTOR-WISE CLASSIFICATION OF ADVANCES
(Taka in Crores)
At the end Public Sector Private Total Ratio
of quarter Government Other than Total Sector Advances (Public/Private)
Government (Public + Private)
2013
Apr.-Jun. 2892.29 8339.23 11231.52 413572.95 424804.47 0.03
0.68% 1.96% 2.64% 97.36% 100%
(-13.65) (-1.27) (-4.79) (2.81) (2.60)
Jul.-Sep. 2117.43 5639.96 7757.39 423819.53 431576.92 0.02
0.49% 1.31% 1.80% 98.20% 100%
(-26.79) (-32.37) (-30.93) (2.48) (1.59)
Oct.-Dec. 1613.62 6884.54 8498.16 435346.25 443844.41 0.02
0.36% 1.55% 1.91% 98.09% 100%
(-23.79) (22.07) (9.55) (2.72) (2.84)
2014
Jan.-Mar. 2383.15 7060.10 9443.25 441453.25 450896.50 0.02
0.53% 1.57% 2.09% 97.91% 100.00%
(47.69) (2.55) (11.12) (1.40) (1.59)
Apr.-Jun. 1669.39 6712.05 8381.44 461201.77 469583.21 0.02
0.36% 1.43% 1.78% 98.22% 100.00%
(-29.95) (-4.93) (-11.24) (4.47) (4.14)
Note: 1. Figures in parentheses represent rates of growth in percent over the preceding quarter.
2. Minor differences may be observed due to rounding off.

xix
Economic Purpose-wise Advances:
Bulk of Advances (39.38%) was used
f the April-June,
2014. Trade loans increased by Tk. 2224.73 crores
or 1.22% to Tk. 184921.74 crores and 'Term Loan'
increased by Tk. 6605.46 crores or 9.08% to Tk.
79392.81 crores at the end of the quarter under
review as compared to an increase of 4.88% and a
decrease of 4.77% respectively at the end of the
preceding quarter (January-March, 2014) and
increases of 1.19% & 7.25% respectively at the
corresponding quarter (April-June, 2013) of the
Tk. 5312.
increased by 3.09% to Tk. 25951.90 crores as
compared to increases of 2.64% & 1.44% at the
end of the preceding quarter (January-March,
2014) and a decrease of 4.42% & an increase
3.03% at the corresponding quarter (April-June,
2013) of the last year respectively. 'Construction'
loan decreased by 1.00% to Tk. 40728.98 crores
28731.00 crores respectively at the end of the
quarter under review. 'Others' loans showed an
increase of Tk. 890.45 crores to Tk. 18571.62
crores at the end of the quarter under review as
compared to the preceding quarter. Table-9 shows
economic purpose-wise classification of advances.
TABLE -9 ECONOMIC PURPOSE-WISE CLASSIFICATION OF ADVANCES
(Taka in Crores)
At the end
of quarter
Agriculture,
Fishing &
Forestry
Industry Constru-
ction Transport Trade &
Commerce
Consumer
Finance Others Total
Term
Loan
Working
Capital
Financing
2013
Apr.-Jun. 22971.10 96137.10 57047.66 38705.45 5852.84 156336.84 28021.55 19731.93 424804.47
5.41% 22.63% 13.43% 9.11% 1.38% 36.80% 6.60% 4.64% 100%
(3.03) (7.25) (3.41) (1.23) (-4.42) (1.19) (10.48) (-13.21) (2.60)
Jul.-Sep. 24656.89 84941.63 62419.86 36299.08 5297.35 165991.69 33140.78 18829.64 431576.92
5.71% 19.68% 14.46% 8.41% 1.23% 38.46% 7.68% 4.36% 100%
(7.34) (-11.65) (9.42) (-6.22) (-9.49) (6.18) (18.27) (-4.57) (1.59)
Oct.-Dec. 24817.19 76433.39 72889.24 39657.89 5101.02 174201.72 29595.58 21148.38 443844.41
5.59% 17.22% 16.42% 8.94% 1.15% 39.35% 6.67% 4.76% 100%
(0.65) (-10.02) (16.77) (9.25) (-3.71) (4.95) (-10.70) (12.31) (2.84)
2014
Jan.-Mar. 25174.18 72787.35 78669.85 41139.24 5235.81 182697.01 27511.89 17681.17 450896.50
5.58% 16.14% 17.45% 9.12% 1.16% 40.52% 6.10% 3.92% 100.00%
(1.44) (-4.77) (7.93) (3.74) (2.64) (4.88) (-7.04) (-16.39) (1.59)
Apr.-Jun. 25951.90 79392.81 85973.11 40728.98 5312.05 184921.74 28731.00 18571.62 469583.21
5.53% 16.91% 18.31% 8.67% 1.13% 39.38% 6.12% 3.95% 100.00%
(3.09) (9.08) (9.28) (-1.00) (1.46) (1.22) (4.43) (5.04) (4.14)
Note: 1. Figures in parentheses represent rates of growth in percent over the preceding quarter. Minor differences may be observed due to
-1,2 & 3 .
2. Other purposes include Other Institutional Loan & miscellaneous.

xx
Security-wise Advances: An analysis of advances classified by
securities revealed that 56.67% of the total loans
Rea
port Documents/
the end of the quarter under review. Advances
266102.62 crores y
increased by 6.34% to Tk. 35935.80 crores at the
end of the quarter April-June, 2014. Other
Items' which includes (i) Gold & Gold Ornaments,
(ii)Vehicles, (iii) Hypothecation of Crops, (iv)
Assignment of Bills Receivable, (v) Parri Passu
Charge, (vi) Other secured and unsecured
advances recorded an decrease of 15.39% to Tk.
36303.28 crores at the end of the quarter April-
June, 2014 as compared to an increase of 2.62%
and a decrease of 10.39% at the end of the
preceding quarter (January-March, 2014)) and the
corresponding quarter April-June, 2013 of the last
year respectively. Security wise classification of
advances is shown in Table-10.
TABLE - 10
SECURITY-WISE CLASSIFICATION OF ADVANCES
(Taka in Crores)
At the end
of quarter
Shares &
Securities
Export
Documents/
Commodities
Machinery
/
Fixed
Assets
Real
Estate
Financial
Obligations
Only
Guarantee of
Individuals/
Institutions
Other
Items
Total
2013
Apr.-Jun. 2100.09 34330.06 30566.87 227427.18 30131.40 55198.69 45050.18 424804.47
0.49% 8.08% 7.20% 53.54% 7.09% 12.99% 10.60% 100%
(30.59) (-16.20) (-0.64) (9.23) (26.83) (-5.58) (-10.39) (2.60)
Jul.-Sep. 1817.58 31201.18 32716.87 235516.95 33080.80 64375.93 32867.61 431576.92
0.42% 7.23% 7.58% 54.57% 7.67% 14.92% 7.62% 100%
(-13.45) (-9.11) (7.03) (3.56) (9.79) (16.63) (-27.04) (1.59)
Oct.-Dec. 1942.17 34707.42 31923.45 240499.04 30061.24 62901.05 41810.04 443844.41
0.44% 7.82% 7.19% 54.19% 6.77% 14.17% 9.42% 100%
(6.85) (11.24) (-2.43) (2.12) (-9.13) (-2.29) (27.21) (2.84)
2014
Jan.-Mar. 2565.75 36399.15 33792.73 256498.42 31352.61 47382.45 42905.39 450896.50
0.57% 8.07% 7.49% 56.89% 6.95% 10.51% 9.52% 100.00%
(32.11) (4.87) (5.86) (6.65) (4.30) (-24.67) (2.62) (1.59)
Apr.-Jun. 3074.42 35458.93 35935.80 266102.62 39765.79 52942.37 36303.28 469583.21
0.65% 7.55% 7.65% 56.67% 8.47% 11.27% 7.73% 100.00%
(19.83) (-2.58) (6.34) (3.74) (26.83) (11.73) (-15.39) (4.14)
Note: 1. Figures in parentheses represent rates of growth in percent over the preceding quarter.
2. Minor differences may be observed due to rounding off and changes of Fourth Edition to
n the Banking Statistics Returns SBS-1,

xx
i
Div
ision
-wise U
rba
n/R
ura
l Ad
va
nces:
Div
ision
-wise b
reak-u
p o
f advan
ces revealed
that D
hak
a Div
ision
con
sum
ed 6
7.4
1%
of to
tal advan
ces of w
hich
the sh
are of u
rban
and
rural sto
od
at 62
.88%
and
4.5
2%
respectiv
ely at th
e end
of th
e qu
arter
Ap
ril- Jun
e, 201
4. T
he lo
ans in
Dhak
a Div
ision
increased
by 4
.25%
to
Tk. 3
16
52
9.8
3 cro
res and
in C
hittag
on
g D
ivisio
n in
creased b
y 2
.05
% to
Tk. 9
06
10
.05
crores an
d in
Kh
uln
a Div
ision
increased
by 8
.82
% to
Tk.
20382.9
7
crores
durin
g
the
qu
arter un
der
review
. T
he
loan
s in
Sylh
et Div
ision
increased
by 1
.72
% to
Tk. 7
03
5.5
2 cro
res, in B
arisal
Div
ision in
creased b
y 3
.96%
to T
k. 5
10
7.1
2cro
res, in R
ajshah
i Div
ision
increased
by 6
.96
% to
Tk. 1
88
73
.72 cro
res and
that in
Ran
gp
ur D
ivisio
n
increased
by 7
.36%
to T
k. 1
10
44
.00
Div
ision
-wise d
istribu
tion
of u
rban
and
rural lo
ans is sh
ow
n in
Tab
le-11
.
TA
BL
E-11(C
on
td.)
DIV
ISIO
N-W
ISE
UR
BA
N/
RU
RA
L C
LA
SS
IFIC
AT
ION
OF
AD
VA
NC
ES
(Tak
a in C
rores)
At th
e end
of q
uarter
Chittag
on
g D
ivisio
n
Dh
aka D
ivisio
n
Kh
uln
a Div
ision
R
ajshah
i Div
ision
Urb
an
Rural
To
tal U
rban
R
ural
To
tal U
rban
R
ural
To
tal U
rban
R
ural
To
tal
20
13
Ap
r.-Ju
n.
75
661
.36
89
69
.41
84
630
.77
2
65
09
7.3
4
19
938
.45
28
503
5.7
9
13
648
.28
44
79
.58
18
127
.86
13
046
.08
3
36
3.3
4
16
409
.42
1
7.8
1%
2
.11
%
19
.92
%
62
.40
%
4.6
9%
6
7.1
0%
3
.21
%
1.0
5%
4
.27
%
3.0
7%
0
.79
%
3.8
6%
(2
.38)
(1.3
0)
(2.2
6)
(2.8
3)
(2.6
1)
(2.8
2)
(-1.6
7)
(1.7
6)
(-0.8
4)
(3.7
0)
(5.8
5)
(4.1
3)
Ju
l.-Sep
. 7
79
35
.07
88
38
.38
86
773
.45
2
68
81
9.3
4
20
066
.32
28
888
5.6
6
13
913
.89
46
53
.31
18
567
.20
13
303
.40
3
26
4.1
1
16
567
.51
1
8.0
6%
2
.05
%
20
.11
%
62
.29
%
4.6
5%
6
6.9
4%
3
.22
%
1.0
8%
4
.30
%
3.0
8%
0
.76
%
3.8
4%
(3
.01)
(-1.4
6)
(2.5
3)
(1.4
0)
(0.6
4)
(1.3
5)
(1.9
5)
(3.8
8)
(2.4
2)
(1.9
7)
(-2.9
5)
(0.9
6)
Oct.-D
ec. 7
84
68
.23
94
28
.89
87
897
.12
2
77
90
0.4
4
20
507
.46
29
840
7.9
0
14
042
.94
45
94
.61
18
637
.55
13
529
.34
3
55
4.3
6
17
083
.70
1
7.6
8%
2
.12
%
19
.80
%
62
.61
%
4.6
2%
6
7.2
3%
3
.16
%
1.0
4%
4
.20
%
3.0
5%
0
.80
%
3.8
5%
(0
.68)
(6.6
8)
(1.2
9)
(3.3
8)
(2.2
0)
(3.3
0)
(0.9
3)
(-1.2
6)
(0.3
8)
(1.7
0)
(8.8
9)
(3.1
2)
20
14
Ja
n.-M
ar.
80
122
.08
86
65
.00
88
787
.08
2
82
84
2.7
1
20
774
.08
30
361
6.7
9
14
143
.25
45
88
.09
18
731
.34
14
054
.30
3
59
0.8
1
17
645
.11
1
7.7
7%
1
.92
%
19
.69
%
62
.73
%
4.6
1%
6
7.3
4%
3
.14
%
1.0
2%
4
.15
%
3.1
2%
0
.80
%
3.9
1%
(2
.11)
(-8.1
0)
(1.0
1)
(1.7
8)
(1.3
0)
(1.7
5)
(0.7
1)
(-0.1
4)
(0.5
0)
(3.8
8)
(1.0
3)
(3.2
9)
Ap
r.-Ju
n.
81
783
.10
88
26
.95
90
610
.05
2
95
28
3.6
6
21
246
.17
31
652
9.8
3
15
250
.69
51
32
.28
20
382
.97
15
073
.04
3
80
0.6
8
18
873
.72
1
7.4
2%
1
.88
%
19
.30
%
62
.88
%
4.5
2%
6
7.4
1%
3
.25
%
1.0
9%
4
.34
%
3.2
1%
0
.81
%
4.0
2%
(2
.07)
(1.8
7)
(2.0
5)
(4.4
0)
(2.2
7)
(4.2
5)
(7.8
3)
(11
.86
) (8
.82
) (7
.25
) (5
.84
) (6
.96
)
No
te: 1. F
igu
res in p
arenth
eses represen
t rates of g
row
th in
percen
t over th
e preced
ing q
uarter.
2. M
ino
r differen
ces may
be o
bserv
ed d
ue to
rou
nd
ing o
ff.

xx
ii TA
BL
E-11(C
on
cld
.)
DIV
ISIO
N-W
ISE
UR
BA
N/
RU
RA
L C
LA
SS
IFIC
AT
ION
OF
AD
VA
NC
ES
(T
aka in
Cro
res)
At th
e end
B
arisal Div
ision
S
ylh
et Div
ision
R
angp
ur D
ivisio
n
All D
ivisio
ns
of q
uarter
Urb
an
Rural
To
tal U
rban
R
ural
To
tal U
rban
R
ural
To
tal U
rban
R
ural
To
tal
20
13
Ap
r.-Ju
n.
27
47
.36
18
45
.50
45
92
.86
45
13
.57
18
18
.59
63
32
.16
66
64
.41
3
01
1.2
0
96
75
.61
38
137
8.4
0
43
426
.07
42
480
4.4
7
0
.65
%
0.4
3%
1
.08
%
1.0
6%
0
.43
%
1.4
9%
1
.57
%
0.7
1%
2
.28
%
89
.78
%
10
.22
%
10
0%
(2
.70)
(1.6
3)
(2.2
7)
(-1.3
1)
(2.1
8)
(-0.3
3)
(6.9
0)
(2.3
4)
(5.4
4)
(2.6
2)
(2.4
1)
(2.6
0)
Ju
l.-Sep
. 2
73
9.6
3
18
52
.58
45
92
.21
46
48
.72
18
84
.96
65
33
.68
67
39
.82
2
91
7.3
9
96
57
.21
38
809
9.8
7
43
477
.05
43
157
6.9
2
0
.63
%
0.4
3%
1
.06
%
1.0
8%
0
.44
%
1.5
1%
1
.56
%
0.6
8%
2
.24
%
89
.93
%
10
.07
%
10
0%
(-0
.28
) (0
.38)
(-0.0
1)
(2.9
9)
(3.6
5)
(3.1
8)
(1.1
3)
(-3.1
2)
(-0.1
9)
(1.7
6)
(0.1
2)
(1.5
9)
Oct.-D
ec.
29
27
.66
19
33
.68
48
61
.34
48
25
.77
19
05
.04
67
30
.81
70
87
.66
3
13
8.3
3
10
225
.99
39
878
2.0
4
45
062
.37
44
384
4.4
1
0
.66
%
0.4
4%
1
.10
%
1.0
9%
0
.43
%
1.5
2%
1
.60
%
0.7
1%
2
.30
%
89
.85
%
10
.15
%
10
0%
(6
.86
) (4
.38
) (5
.86
) (3
.81)
(1.0
7)
(3.0
2)
(5.1
6)
(7.5
7)
(5.8
9)
(2.7
5)
(3.6
5)
(2.8
4)
20
14
Ja
n.-M
ar.
29
29
.27
19
83
.41
49
12
.68
49
63
.47
19
53
.31
69
16
.78
71
70
.19
3
11
6.5
3
10
286
.72
40
622
5.2
7
44
671
.23
45
089
6.5
0
0
.65
%
0.4
4%
1
.09
%
1.1
0%
0
.43
%
1.5
3%
1
.59
%
0.6
9%
2
.28
%
90
.09
%
9.9
1%
1
00
.00
%
(0
.05
) (2
.57
) (1
.06
) (2
.85)
(2.5
3)
(2.7
6)
(1.1
6)
(-0.6
9)
(0.5
9)
(1.8
7)
(-0.8
7)
(1.5
9)
Ap
r.-Ju
n.
30
49
.12
20
58
.00
51
07
.12
50
54
.00
19
81
.52
70
35
.52
7
73
3.0
7
33
10
.93
11
044
.00
42
322
6.6
8
46
356
.53
46
958
3.2
1
0
.65
%
0.4
4%
1
.09
%
1.0
8%
0
.42
%
1.5
0%
1
.65
%
0.7
1%
2
.35
%
90
.13
%
9.8
7%
1
00
.00
%
(4
.09
) (3
.76
) (3
.96
) (1
.82)
(1.4
4)
(1.7
2)
(7.8
5)
(6.2
4)
(7.3
6)
(4.1
9)
(3.7
7)
(4.1
4)
No
te: 1. F
igures in
paren
theses rep
resent rates o
f gro
wth
in p
ercent o
ver th
e preced
ing q
uarter.
2. M
ino
r differen
ces m
ay b
e ob
served
due to
round
ing o
ff.
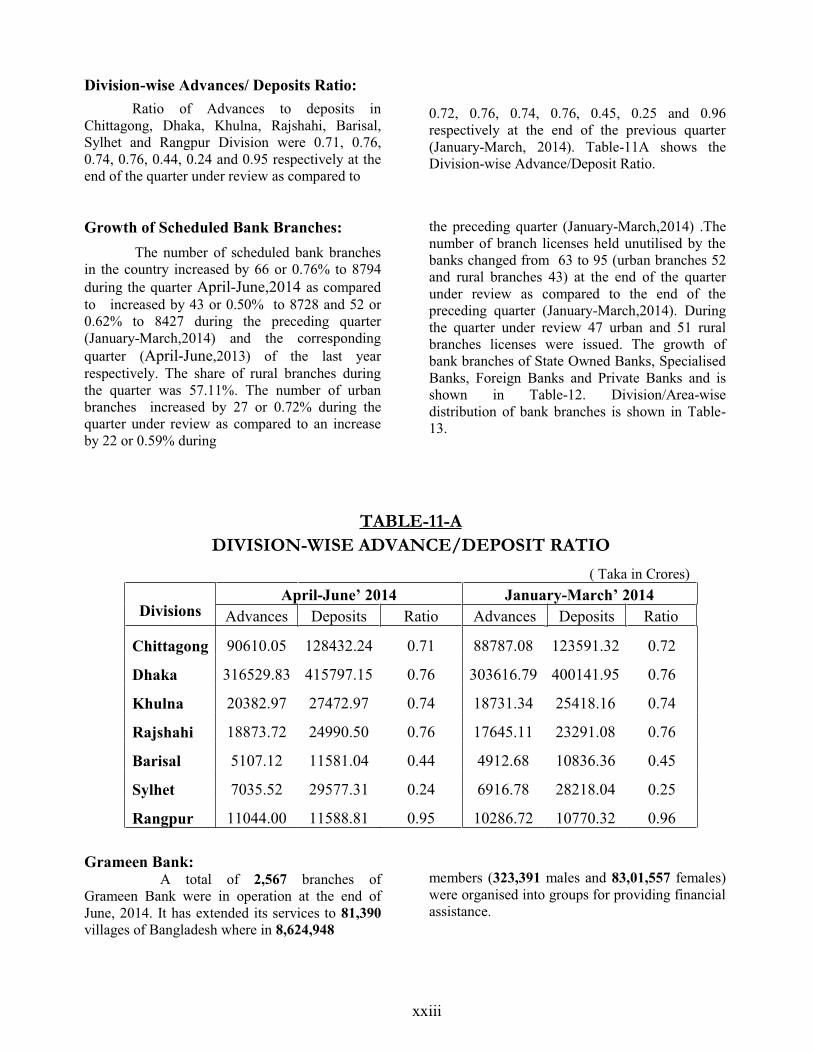
xxiii
Division-wise Advances/ Deposits Ratio:
Ratio of Advances to deposits in
Chittagong, Dhaka, Khulna, Rajshahi, Barisal,
Sylhet and Rangpur Division were 0.71, 0.76,
0.74, 0.76, 0.44, 0.24 and 0.95 respectively at the
end of the quarter under review as compared to
0.72, 0.76, 0.74, 0.76, 0.45, 0.25 and 0.96
respectively at the end of the previous quarter
(January-March, 2014). Table-11A shows the
Division-wise Advance/Deposit Ratio.
Growth of Scheduled Bank Branches:
The number of scheduled bank branches
in the country increased by 66 or 0.76% to 8794
during the quarter April-June,2014 as compared
to increased by 43 or 0.50% to 8728 and 52 or
0.62% to 8427 during the preceding quarter
(January-March,2014) and the corresponding
quarter (April-June,2013) of the last year
respectively. The share of rural branches during
the quarter was 57.11%. The number of urban
branches increased by 27 or 0.72% during the
quarter under review as compared to an increase
by 22 or 0.59% during
the preceding quarter (January-March,2014) .The
number of branch licenses held unutilised by the
banks changed from 63 to 95 (urban branches 52
and rural branches 43) at the end of the quarter
under review as compared to the end of the
preceding quarter (January-March,2014). During
the quarter under review 47 urban and 51 rural
branches licenses were issued. The growth of
bank branches of State Owned Banks, Specialised
Banks, Foreign Banks and Private Banks and is
shown in Table-12. Division/Area-wise
distribution of bank branches is shown in Table-
13.
TABLE-11-A
DIVISION-WISE ADVANCE/DEPOSIT RATIO
( Taka in Crores)
Divisions April- 2014 January- 2014
Advances Deposits Ratio Advances Deposits Ratio
Chittagong 90610.05 128432.24 0.71 88787.08 123591.32 0.72
Dhaka 316529.83 415797.15 0.76 303616.79 400141.95 0.76
Khulna 20382.97 27472.97 0.74 18731.34 25418.16 0.74
Rajshahi 18873.72 24990.50 0.76 17645.11 23291.08 0.76
Barisal 5107.12 11581.04 0.44 4912.68 10836.36 0.45
Sylhet 7035.52 29577.31 0.24 6916.78 28218.04 0.25
Rangpur 11044.00 11588.81 0.95 10286.72 10770.32 0.96
Grameen Bank: A total of 2,567 branches of
Grameen Bank were in operation at the end of
June, 2014. It has extended its services to 81,390
villages of Bangladesh where in 8,624,948
members (323,391 males and 83,01,557 females)
were organised into groups for providing financial
assistance.

xx
iv
TA
BL
E-12
NU
MB
ER
OF
SC
HE
DU
LE
D B
AN
K B
RA
NC
HE
S O
PE
RA
TIN
G IN
BA
NG
LA
DE
SH
At th
e end
of q
uarter
State
Ow
ned
Ban
ks
Sp
ecialised
Ban
ks
Fo
reign
Ban
ks
Priv
ate
Ban
ks
All
Ban
ks
Urb
an
Rural
To
tal U
rban
R
ural
To
tal T
otal
Urb
an
Rural
To
tal U
rban
R
ural
To
tal
20
13
Ap
r.-J
un
. 1
26
2
22
37
34
99
17
6
13
00
14
76
66
20
96
12
90
33
86
36
00
48
27
84
27
1
4.9
8%
2
6.5
5%
4
1.5
2%
2
.09
%
15
.43
%
17
.52
%
0.7
8%
2
4.8
7%
1
5.3
1%
4
0.1
8%
4
2.7
2%
5
7.2
8%
1
00
%
(0
.16)
(0.2
2)
(0.2
0)
(0.0
0)
(1.2
5)
(1.1
0)
(0.0
0)
(0.8
2)
(0.9
4)
(0.8
6)
(0.5
3)
(0.6
9)
(0.6
2)
Ju
l.-Sep
. 1
26
5
22
38
35
03
17
7
13
08
14
85
66
21
22
13
06
34
28
36
30
48
52
84
82
1
4.9
1%
2
6.3
9%
4
1.3
0%
2
.09
%
15
.42
%
17
.51
%
0.7
8%
2
5.0
2%
1
5.4
0%
4
0.4
1%
4
2.8
0%
5
7.2
0%
1
00
%
(0
.24)
(0.0
4)
(0.1
1)
(0.5
7)
(0.6
2)
(0.6
1)
(0.0
0)
(1.2
4)
(1.2
4)
(1.2
4)
(0.8
3)
(0.5
2)
(0.6
5)
Oct.-D
ec.
12
68
22
52
35
20
17
8
13
16
14
94
69
22
08
13
94
36
02
37
23
49
62
86
85
1
4.6
0%
2
5.9
3%
4
0.5
3%
2
.05
%
15
.15
%
17
.20
%
0.7
9%
2
5.4
2%
1
6.0
5%
4
1.4
7%
4
2.8
7%
5
7.1
3%
1
00
%
(0
.24)
(0.6
3)
(0.4
9)
(0.5
6)
(0.6
1)
(0.6
1)
(4.5
5)
(4.0
5)
(6.7
4)
(5.0
8)
(2.5
6)
(2.2
7)
(2.3
9)
20
14
Ja
n.-M
ar.
1274
2258
3532
177
1317
1494
69
2225
1408
3633
3745
4983
8728
1
4.6
0%
2
5.8
7%
4
0.4
7%
2
.03
%
15
.09
%
17
.12
%
0.7
9%
2
5.4
9%
1
6.1
3%
4
1.6
2%
4
2.9
1%
5
7.0
9%
1
00
%
(0
.47)
(0.2
7)
(0.3
4)
(-0.5
6)
(0.0
8)
(0.0
0)
(0.0
0)
(0.7
7)
(1.0
0)
(0.8
6)
(0.5
9)
(0.4
2)
(0.5
0)
Ap
r.-Ju
n.
1276
2260
3536
177
1319
1496
70
2249
1443
3692
3772
5022
8794
1
4.5
1%
2
5.7
0%
4
0.2
1%
2
.01
%
15
.00
%
17
.01
%
0.8
0%
2
5.5
7%
1
6.4
1%
4
1.9
8%
4
2.8
9%
5
7.1
1%
1
00
%
(0
.16)
(0.0
9)
(0.1
1)
(0.0
0)
(0.1
5)
(0.1
3)
(1.4
5)
(1.0
8)
(2.4
9)
(1.6
2)
(0.7
2)
(0.7
8)
(0.7
6)
So
urce: B
ankin
g R
egu
lation a
nd
Po
licy D
epartm
ent, B
angla
desh
Ban
k.
No
te: 1. F
igures in
the p
arenth
eses represen
t rates of g
row
th in
percen
t over th
e preced
ing q
uarter.
2. M
ino
r differen
ces m
ay o
bserv
e due to
round
ing o
ff.

xx
v
TA
BL
E-13
(Co
ntd
.)
RE
GIO
N-W
ISE
PO
SIT
ION
OF
SC
HE
DU
LE
D B
AN
K B
RA
NC
HE
S
At th
e end
of q
uarter
Chittag
ong D
ivisio
n
Dh
aka D
ivisio
n
Kh
uln
a Div
ision
R
ajshah
i Div
ision
Urb
an
Rural
To
tal U
rban
R
ural
To
tal U
rban
R
ural
To
tal U
rban
R
ural
To
tal
20
13
Ap
r.-Ju
n.
78
8
11
12
19
00
16
12
14
19
30
31
32
5
51
6
84
1
32
3
60
5
92
8
9
.35
%
13
.20
%
22
.55
%
19
.13
%
16
.84
%
35
.97
%
3.8
6%
6
.12
%
9.9
8%
3
.83
%
7.1
8%
1
1.0
1%
(0
.77)
(1.0
0)
(0.9
0)
(0.6
9)
(1.0
7)
(0.8
7)
(0.0
0)
(0.9
8)
(0.6
0)
(0.0
0)
(0.0
0)
(0.0
0)
Ju
l.-Sep
. 7
94
11
16
19
10
16
28
14
27
30
55
32
9
51
9
84
8
32
3
60
6
92
9
9
.36
%
13
.16
%
22
.52
%
19
.19
%
16
.82
%
36
.02
%
3.8
8%
6
.12
%
10
.00
%
3.8
1%
7
.14
%
10
.95
%
(0
.76
) (0
.36)
(0.5
3)
(0.9
9)
(0.5
6)
(0.7
9)
(1.2
3)
(0.5
8)
(0.8
3)
(0.0
0)
(0.1
7)
(0.1
1)
Oct.-D
ec. 8
15
11
46
19
61
16
75
14
82
31
57
33
3
52
4
85
7
33
1
61
1
94
2
9
.38
%
13
.20
%
22
.58
%
19
.29
%
17
.06
%
36
.35
%
3.8
3%
6
.03
%
9.8
7%
3
.81
%
7.0
4%
1
0.8
5%
(2
.64)
(2.6
9)
(2.6
7)
(2.8
9)
(3.8
5)
(3.3
4)
(1.2
2)
(0.9
6)
(1.0
6)
(2.4
8)
(0.8
3)
(1.4
0)
20
14
Ja
n.-M
ar.
816
1151
1967
1688
1492
3180
335
525
860
334
612
946
9
.35
%
13
.19
%
22
.54
%
19
.33
%
17
.11
%
36
.43
%
3.8
4%
6
.02
%
9.8
5%
3
.83
%
7.0
1%
1
0.8
4%
(0
.12)
(0.4
4)
(0.3
1)
(0.7
2)
(0.7
4)
(0.7
3)
(0.6
0)
(0.1
9)
(0.3
5)
(0.9
1)
(0.1
6)
(0.4
2)
Ap
r.-Ju
n.
819
1164
1983
1704
1507
3211
337
530
867
336
612
948
9
.31
%
13
.24
%
22
.55
%
19
.38
%
17
.14
%
36
.51
%
3.8
3%
6
.03
%
9.8
6%
3
.82
%
6.9
6%
1
0.7
8%
(0
.37)
(1.1
3)
(0.8
1)
(1.0
1)
(0.9
4)
(0.9
7)
(0.6
0)
(0.9
5)
(0.8
1)
(0.6
0)
(0.0
0)
(0.2
1)
S
ource: B
ankin
g R
egu
lation a
nd
Po
licy D
epartm
ent, B
angla
desh
Ban
k.
No
te: 1. F
igures in
the p
arenth
eses represen
t rates of g
row
th in
percen
t over th
e preced
ing q
uarter
2. M
ino
r differen
ces m
ay o
bserv
e due to
round
ing o
ff.

xx
vi
TA
BL
E-13
(Co
ncld
.)
RE
GIO
N-W
ISE
PO
SIT
ION
OF
SC
HE
DU
LE
D B
AN
K B
RA
NC
HE
S
At th
e end
of q
uarter
Barisal D
ivisio
n
Sylh
et Div
ision
R
angp
ur D
ivisio
n
All D
ivisio
ns
Urb
an
Rural
To
tal U
rban
R
ural
To
tal U
rban
R
ural
To
tal U
rban
R
ural
To
tal
20
13
Ap
r.-Ju
n.
13
2
29
8
43
0
22
2
46
5
68
7
19
8
41
2
61
0
36
00
48
27
84
27
1
.57
%
3.5
4%
5
.10
%
2.6
3%
5
.52
%
8.1
5%
2
.35
%
4.8
9%
7
.24
%
42
.72
%
57
.28
%
10
0%
(1
.54)
(0.6
8)
(0.9
4)
(0.0
0)
(0.0
0)
(0.0
0)
(0.0
0)
(0.0
0)
(0.0
0)
(0.5
3)
(0.6
9)
(0.6
2)
Ju
l.-Sep
. 1
33
30
2
43
5
22
4
46
6
69
0
19
9
41
6
61
5
36
30
48
52
84
82
1
.57
%
3.5
6%
5
.13
%
2.6
4%
5
.49
%
8.1
3%
2
.35
%
4.9
0%
7
.25
%
42
.80
%
57
.20
%
10
0%
(0
.76)
(1.3
4)
(1.1
6)
(0.9
0)
(0.2
2)
(0.4
4)
(0.5
1)
(0.9
7)
(0.8
2)
(0.8
3)
(0.5
2)
(0.6
5)
Oct.-D
ec. 1
37
30
7
44
4
23
1
47
2
70
3
20
1
42
0
62
1
37
23
49
62
86
85
1
.58
%
3.5
3%
5
.11
%
2.6
6%
5
.43
%
8.0
9%
2
.31
%
4.8
4%
7
.15
%
42
.87
%
57
.13
%
10
0%
(3
.01)
(1.6
6)
(2.0
7)
(3.1
3)
(1.2
9)
(1.8
8)
(1.0
1)
(0.9
6)
(0.9
8)
(2.5
6)
(2.2
7)
(2.3
9)
20
14
Ja
n.-M
ar.
14
0
31
0
45
0
23
1
47
3
70
4
20
1
42
0
62
1
37
45
49
83
87
28
1
.60
%
3.5
5%
5
.16
%
2.6
5%
5
.42
%
8.0
7%
2
.30
%
4.8
1%
7
.12
%
42
.90
%
57
.10
%
10
0.%
(2
.19
) (0
.98
) (1
.35
) (0
.00)
(0.2
1)
(0.1
4)
(0.0
0)
(0.0
0)
(0.0
0)
(0.5
9)
(0.4
2)
(0.5
0)
Ap
r.-Ju
n.
141
311
452
233
477
710
202
421
623
3772
5022
8794
1
.60
%
3.5
4%
5
.14
%
2.6
5%
5
.42
%
8.0
7%
2
.30
%
4.7
9%
7
.08
%
42
.89
%
57
.11
%
10
0%
(0
.71)
(0.3
2)
(0.4
4)
(0.8
7)
(0.8
5)
(0.8
5)
(0.5
0)
(0.2
4)
(0.3
2)
(0.7
2)
(0.7
8)
(0.7
6)
S
ource: B
ankin
g R
egu
lation a
nd
Po
licy D
epartm
ent, B
angla
desh
Ban
k.
No
te: 1. F
igures in
the p
arenth
eses rep
resent rates o
f gro
wth
in p
ercent o
ver th
e preced
ing q
uarter
2. M
ino
r differen
ces may o
bserv
e due to
round
ing o
ff.

xx
vii
DE
PO
SIT
S D
IST
RIB
UT
ED
BY
TY
PE
S (A
LL
BA
NK
S)

xx
viii
AD
VA
NC
ES
CL
AS
SIF
IED
BY
EC
ON
OM
IC P
UR
PO
SE
S
(AL
L B
AN
KS
)

xxix
INDICATORS
(Amount in Taka)
ITEMS AS ON
30-06-2014 31-03-2014
Number of Banks 56 56
Number of Reporting Bank Branches
(including Head office, Islamic Windows and
SME Service Centre) 8,886 8,820
DEPOSITS (Excluding inter-bank)
a) Total Deposits 6,494,400,200,000 6,222,672,300,000
Urban 5,284,900,500,000 5,091,431,400,000
Rural 1,209,499,700,000 1,131,240,900,000
b) Number of Accounts 66,682,973 65,331,376
c) Average Deposits per account 97,392 95,248
ADVANCES (Excluding inter- bank)
a) Total Advances 4,695,832,100,000 4,508,965,000,000
Urban 4,232,266,800,000 4,062,252,700,000
Rural 463,565,300,000 446,712,300,000
b) Number of Accounts 9,637,907 9,620,223
c) Average Advances per account 487,225 468,697
BANK CREDIT (Advances + Bills) 4,919,572,200,000 4,730,345,200,000
Ratio of Advances to Deposits 0.72 0.72
Ratio of Bank Credit to Deposits 0.76 0.76
Rate of Interest on Deposits(Weighted Average)* 7.66 8.06
Rate of Interest on Advances(Weighted Average)* 13.06 13.47
SCHEDULED BANKS' INVESTMENT
(Excluding inter-bank) 1,757,070,500,000 1,667,667,100,000
BORROWINGS FROM BANGLADESH BANK 55,231,900,000 65,824,400,000
* Weighted average rates of interest both for deposits and advances are calculated as the
sum of product of each rate of interest and its corresponding amount of deposit/advance
being divided by the total of those deposits or advances as the case may be.
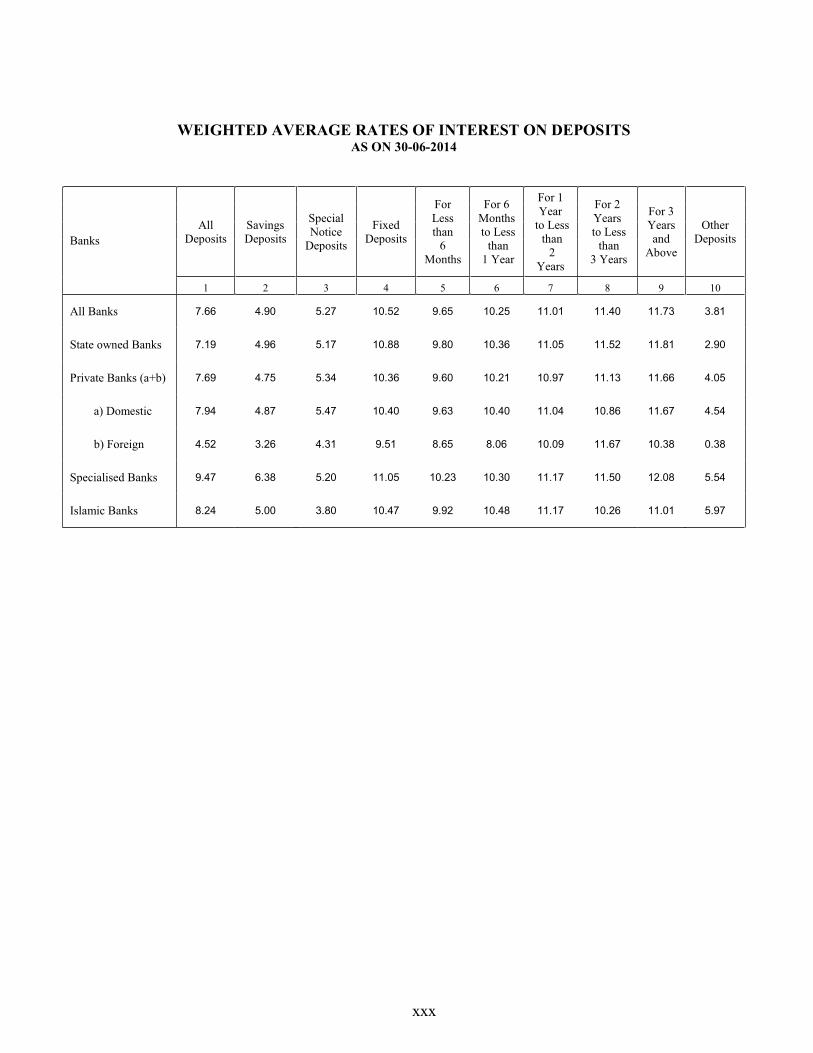
xxx
WEIGHTED AVERAGE RATES OF INTEREST ON DEPOSITS AS ON 30-06-2014
Banks
All
Deposits
Savings
Deposits
Special
Notice
Deposits
Fixed
Deposits
For
Less
than
6
Months
For 6
Months
to Less
than
1 Year
For 1
Year
to Less
than
2
Years
For 2
Years
to Less
than
3 Years
For 3
Years
and
Above
Other
Deposits
1 2 3 4 5 6 7 8 9 10
All Banks 7.66 4.90 5.27 10.52 9.65 10.25 11.01 11.40 11.73 3.81
State owned Banks 7.19 4.96 5.17 10.88 9.80 10.36 11.05 11.52 11.81 2.90
Private Banks (a+b) 7.69 4.75 5.34 10.36 9.60 10.21 10.97 11.13 11.66 4.05
a) Domestic 7.94 4.87 5.47 10.40 9.63 10.40 11.04 10.86 11.67 4.54
b) Foreign 4.52 3.26 4.31 9.51 8.65 8.06 10.09 11.67 10.38 0.38
Specialised Banks 9.47 6.38 5.20 11.05 10.23 10.30 11.17 11.50 12.08 5.54
Islamic Banks 8.24 5.00 3.80 10.47 9.92 10.48 11.17 10.26 11.01 5.97

xxxi
WEIGHTED AVERAGE RATES OF INTEREST ON ADVANCES
BY MAJOR ECONOMIC PURPOSES AS ON 30-06-2014
Banks
All
Adva
nces
Agriculture
Fishing
and
Forestry
Industry
Construction Transport Trade &
Commerce
Other
Institutional
Loan
Consumer
Finance
Miscell-
aneous Term
Loan
Working
Capital
Financing
1 2 3 4 5 6 7 8 9 10
All Banks 13.06 10.52 13.16 13.55 12.57 13.33 13.49 12.80 13.66 7.94
State owned Banks 10.79 8.98 11.38 13.31 6.07 12.14 11.50 11.61 10.33 10.57
Private Banks (a+b) 13.79 12.76 13.95 13.57 14.61 14.37 14.00 12.94 14.72 7.28
a) Domestic 13.88 12.78 13.95 13.73 14.61 14.36 14.15 12.98 14.62 7.05
b) Foreign 12.44 12.68 13.99 12.17 14.01 14.53 10.05 11.53 15.06 10.34
Specialised Banks 11.15 10.10 12.74 13.77 10.04 8.29 11.91 7.58 12.36 9.12
Islamic Banks 13.05 12.19 13.50 12.69 14.17 14.45 14.13 12.51 11.04 4.13