Introduction 2 - University at Buffalo
32
Introduction .................................................................................................................................... 2 Survey Highlights............................................................................................................................. 2 Demographics ................................................................................................................................. 3 Students’ Hardware and Operating System Choices ...................................................................... 5 How Students Access Technology at UB ......................................................................................... 8 Students’ Use and Preferences for Software................................................................................ 10 Security Awareness and Practices ................................................................................................ 11 IT in Residence Halls and Apartments .......................................................................................... 13 Messaging at UB ........................................................................................................................... 19 Public Sites and Printing................................................................................................................ 22 Learning Resources ....................................................................................................................... 24 Satisfaction with IT Services and Recommendations ................................................................... 26 Qualitative Responses –Suggestions and Critical Feedback ......................................................... 26 MyUB....................................................................................................................................................... 27 Email ....................................................................................................................................................... 27 Technology Classrooms ........................................................................................................................... 28 UBlearns .................................................................................................................................................. 29 Efficiency and Waste Reduction .............................................................................................................. 30 Additional Suggestions to Administration .............................................................................................. 31 Conclusions ................................................................................................................................... 32 1| Page
Transcript of Introduction 2 - University at Buffalo

Introduction .................................................................................................................................... 2
Survey Highlights ............................................................................................................................. 2
Demographics ................................................................................................................................. 3
Students’ Hardware and Operating System Choices ...................................................................... 5
How Students Access Technology at UB ......................................................................................... 8
Students’ Use and Preferences for Software ................................................................................ 10
Security Awareness and Practices ................................................................................................ 11
IT in Residence Halls and Apartments .......................................................................................... 13
Messaging at UB ........................................................................................................................... 19
Public Sites and Printing................................................................................................................ 22
Learning Resources ....................................................................................................................... 24
Satisfaction with IT Services and Recommendations ................................................................... 26
Qualitative Responses –Suggestions and Critical Feedback ......................................................... 26
MyUB ....................................................................................................................................................... 27
Email ....................................................................................................................................................... 27
Technology Classrooms ........................................................................................................................... 28
UBlearns .................................................................................................................................................. 29
Efficiency and Waste Reduction .............................................................................................................. 30
Additional Suggestions to Administration .............................................................................................. 31
Conclusions ................................................................................................................................... 32
1 | P a g e

Introduction The twelfth “Student Information Technology ” Survey for students was made available from November 12‐20, 2008. Data were collected using Vovici™ software. The instrument contained 58 questions and was designed by a team of IT support staff representing each technology area probed and in consultation with University Residence Halls and Apartment staff and other campus academic and service stakeholders. 3,221 total valid responses were received. This report and the survey questions with raw frequency responses are available at http://ubit.buffalo.edu/scoreboard/surveys/.
The purpose of this survey was to re‐examine students’ technology experiences, validate trends, and to explore the introduction of new (or modification of existing) technology services. Students were encouraged to participate in the survey through the University web portal (MyUB), and by screen “pop‐ups” in the CIO/University Libraries public computing sites, School of Management and Law School computing labs as part of regular academic use. Twenty gift cards were donated by Tim Horton’s and UB Campus Dining to also encourage participation in this year’s survey.
This report is organized into nine sections:
• Students’ hardware and operating system choices
• How students access technology at UB
• Students’ use and preferences for software
• Security awareness and practices
• IT in Residence Halls and Apartments
• Messaging at UB
• Public sites and printing
• Learning resources and technology classrooms
• Satisfaction with IT services and recommendations
Survey Highlights • Fewer freshmen (and sophomores) are using public computing sites compared to juniors and
seniors. Future surveys efforts will require more effective targeting of increasingly mobile students (Figure 1).
• Of freshmen who responded, fewer reported using public computing labs (69%) than any previous classes or graduate students. Of those who do use public computing sites, there is no
2 | P a g e

change from last year in the amount of time spent per week and very little change in the wait time to access a workstation from 2006.
• Survey “pop‐ups” are effective in increasing departmental survey representation. Feedback from the Law School more than doubled this year.
• Convenience continues to be the most important feature desired for public computing areas: in hours, location, and printing services.
• There is a small increase in the percentage of students who have signed up for UB Alert, but the same percentage report no intention of signing up. There is an increase in percentage of students who report wanting only emergency notices on UB Alert.
• There is an increase of 10% in the percentage of students who use some form of anti‐virus software over last year.
• Nearly 50% of respondents reported using the same password they were initially given.
• In Residence Halls and Apartments, 76% of students do not use the University telephone service and this percentage is even higher (82%) for freshmen.
• The use of instant messaging in teaching and learning dropped; 90% of respondents reported never using it for classes this year compared to 70% last year.
• Finally, nearly 80% of all returning students are satisfied to some extent with IT services compared to last year.
Demographics The total number of respondents (N=3,221) was comparable to the previous year (Table 1). Respondents to the survey represented all schools and class levels at the University (Figures 1 and 2). Most respondents reside in New York State; international students were represented at slightly higher than enrollment (Table 2). Both residential and commuter students were proportional to the actual composition at UB (Figure 3).
Figure 1: Class Standing of Respondents
Table 1: Number of Survey Respondents
Year N 2008-2009 3,221 2007-2008 3,434 2006-2007 1,943 2005-2006 5,548 2004-2005 2,600 2003-2004 3,262 2002-2003 2,838 2001-2002 1,315 2000-2001 1,360 1999-2000 1,101 1998-1999 670 1997-1998 371
Freshman10%
Soph15%
Junior25%
Senior24%
Grad or Profession
24%
Non Matric1%
DK/NA1%
3 | P a g e

Significant boosts in student participation were noted by School. Law, Medicine and Pharmacy concerns are better represented in this survey than in the past (Figure 2).
Figure 2: Survey Participation as Percentage of Enrollment
0%
10%
20%
30%
40%
Architecture &
Planning
Arts &
Sciences
Dental M
edicine
Education
Engineering &
Applied Sciences
Law
Managem
ent
Medicine &
Biom
edical …
Nursing
Pharmacy &
Pharm
aceutical …
Public Health &
Health …
Social Work
Undecided
Percen
tage
Participa
tion
School2007 % of School 2008 % of School
A student’s choice of residence may impact his or her access to quality resources, as on‐campus housing has direct access to the UB network and robust bandwidth. This survey included several questions that were exposed only to students who live in UB housing to explore the role of residential lab support, and how future services may be considered and configured (Figure 3).
4 | P a g e

Figure 3: Primary Residence at UB Table 1: Residency Status of Respondents
Response Percent New York State 77.8%Out of State (US) 5.0%International 16.9%DK/NA 20.0%
Residence Hall27.9%
On Campus Apt9.2%
Home25.6% Off Campus
UB0.6%
Apt Complex6.9%
Other rental28.9%
UB Housing29.7%
Students’ Hardware and Operating System Choices Student use of laptops continues to rise, however there was little or no difference in the primary usage of laptops by incoming undergraduates compared to the total. Looking at the computers used primarily by school, The Graduate School of Education and School of Social Work lags behind others by at least 10% in primary usage of laptops (Figure 4).
Table 2: Types of Hardware Owned by Students
Hardware Count Percent
Laptop/notebook 2689 84%
Desktop 1158 36% Smartphone (cell phone with computing features) 261 8%
PDA/handheld (computing features without cell phone) 109 3%
Tablet 33 1%
I don’t own a computer 59 1%
UB clearly continues to migrate toward an increasingly mobile environment, which will need to be taken into consideration with current Master Planning efforts. Over 80% of all students now rely on laptops, though not all choose to bring them to class, instead enjoying the convenience of a laptop when moving back and forth from a primary residence to a campus residence (Table 2).
5 | P a g e

Figure 4: Comparative Ownership of Laptop and Desktop Computers
02-0379.5%
02-0331.8%
08-0936.0%
08-0983.5%
0%
20%
40%
60%
80%
100%
Desktop Laptop
02-03 03-04 04-05 05-06 06-07 07-08 08-09
Table 3: Preferred Computer Use by Respondents from each School
School
Total from
School
% Desktop % Laptop %
Tablet % Text/Web Cell Phone
% PDA
Architecture & Planning 59 15% (9) 83% (49) 0% (0) 2% (1) 0% (0)
Arts & Sciences 861 27% (231) 71% (610) 0% (1) 2% (18) 10% (1) Dental Medicine 20 10% (2) 75% (15) 15% (3) 0% (0) 0% (0) Education 164 36% (59) 62% (101) 1% (1) 1% (2) 1% (1) Engineering & Ap Sci 415 28% (117) 70% (292) 0.5% (2) 0.5% (2) 0.5% (2) Law 91 13% (12) 86% (78) 0% (0) 1% (1) 0% (0)
Management 551 18% (99) 79% (434) 1% (5) 2% (11) 0.3% (2)
Medicine & Bio Sci 217 17% (37) 81% (175) 2% (4) 0.5% (1) 0% (0)
Nursing 95 20% (19) 78% (74) 1% (1) 1% (1) 0% (0)
Pharmacy 150 13% (20) 85% (127) 1% (2) 1% (1) 0% (0)
PHHP 239 22% (53) 76% (182) 0% (0) 2% (4) 0% (0)
Social Work 78 35% (27) 64% (50) 0% (0) 1% (1) 0% (0) Undecided 193 22% (43) 74% (143) 0% (0) 3% (5) 1% (2) Total Counts 3,133 23% (728) 74% (2,330) 1% (19) 2% (48) 0.2% (8)
The above table must be considered in relation to the total hardware reported by students (Table 3). For example, 33 students report owning tablet PC’s, but when observed on the whole, only 19 tablets are preferred for academic use. This table does, however, give some indication by school of how students are selecting hardware, therefore assisting in prioritization of mobile support (Table 4).
6 | P a g e

Operating system choice is influenced heavily by the timeframe in which hardware was purchased (newer hardware comes packaged with Vista when purchased for personal use). The popularity of Macintosh laptops continues to grow. OSX 10.5 (Leopard) was released shortly before the survey last year, reporting a 4% adoption rate. This year, OSX 10.5 stands at 62% of Macs. UB Micro continues to report steady increases and strong sales of Macintosh computers over the past several years (Figures 5, 7).
The University made a strategic decision to not rollout Vista at this time, continuing with the stable and well‐supported Windows XP. New Windows computers are sold with Vista, with the majority of students (77%) using Vista “home” version (Figure 6). Among those who choose to use Linux OS, Ubuntu is the preferred operating system (Figure 8)...
When asked if their computer contained a 64‐bit operating system, less than 24% indicated “yes.” The overwhelming majority of students either declined to answer, or reported “not knowing” whether their system was 64‐bit capable.
Figure 5: Operating Systems in Use
Figure 6: Versions of Windows operating systems
Figure 7: Versions of Macintosh operating systems Figure 8: Linux operating systems used
Windows Vista40%
Windows XP43%
Mac12% Linux
3%
Don't know1%Other1%
Home77%
Ultimate15%
Business8%
7 | P a g e

Leopard62%
Tiger or earlier38%
Ubuntu70.8%
UBLinux4.2%
RedHat2.1%
Fedora9.4%
Other7.3%
SuSE4.2%
Gentoo2.1%
Other27.1%
How Students Access Technology at UB Two categories probing how students connect to UB IT resources were eliminated from longitudinal tracking this year ‐ shared wireless and satellite dish (because the nature of landlord provided access is not always known to students). FiOS, the new fiber‐based delivery service from Verizon was added as an option, and a broader category to which students could report ‐ “landlord provided.”
Slight “upticks” were noted in broadband services (DSL, Cable Modem) as well as a very slight rise in use of the shared dial‐up modem pool. Slightly less than 3% of students are now reporting primary connection via a mobile broadband device of some type (Figure 9).
Students connecting via these mobile devices for University business are primarily interested in access to email, and UBlearns. What is highly significant is that nearly three‐quarters of all students responding last year expressed no interest in mobile access, and the exact inverse of this is now the case, with over 75% expressing some type of mobile device access to University services (Table 5).
8 | P a g e

Figure 9: How Students Connect to UBs IT Resources
Table 4: UB Sites Accessed using PDAs or Smartphones
2007 2008 UB webmail 9% 36% UBlearns 9% 26% None 70% 21% Dept sites 4% 8% Library sites 3% 6% Student Resource Center Website - 4%
9 | P a g e

10 | P a g e
Students’ Use and Preferences for Software The UB2020 Hardware and Software standards committee continues to monitor the use of various software and distribution methods across campus. It is not clear why there was a slight “uptick” in those electing not to take advantage of initially provided UB software. Firefox remains the Internet browser of choice (Table 6).
Table 5: Browsers used by Students
Response Count Percent Firefox 2,121 45% Internet Explorer 1,664 36% Safari 452 10% Google Chrome 282 6% Opera 82 2% Not sure 23 .5% AOL explorer 7 .1% Maxthon 5 .1% Flock 4 .1% Avant 3 .1% Yahoo 3 .1% Other 40 .9%
Students continue to prefer download as the means for receiving their initial software at UB, this year in larger numbers than last year.
Table 6: Method Received Initial Software
Response 2007 2008 Download 30% 30% CD (UBMicro) 32% 27% CD (orientation) 23% 19% Do not use 12% 15% Friend 1% 1% Other 1% 1% CD (Burned) .4% .3% Pre-installed at UBMicro .3%
Table 7: Preference for Initial Software
Response Count Pct
Download at no additional cost
2,729 87%
CD for purchase at UBMicro 347 11%Other 41 1%CD free 16 .5%Both CD & download 9 .3%Mailed CD 6 .2%
Table 8: Comparative Preferences for Initial Software 2007 and 2008
Response 2007 2008Download 62% 87%CD 37% 11%
Students were probed on how they use productivity software for academic use. The majority report use of UB‐provided Microsoft Office to be the primary productivity tool used, followed by the same software provided through another source (30%), or use of open source software (Table 10).

Table 9: Office Productivity Software used by Students
Response Count Pct
MS Office software provided by UB 2,007 64%
MS Office software provided by another source 938 30%
Open Office or another freeware source 99 3%
No productivity software installed on my computer 54 2%
Doesn't have a computer 15 .5%
Tools built in to OS 11 .3%
Other 17 .5%
Google docs 2 .1%
Figure 10: Importance that UB Provides MS Office for Installation on their Computers
68.5% 16.7% 9.1%
0% 20% 40% 60% 80% 100%
Very Important Important NeutralNot Very Important Not Important At All Not sure
85% of surveyed students report that it’s “Important” or “Very Important” that UB provides productivity software (Figure 10). When probing more deeply into the types of applications used within the Microsoft Campus Agreement, slightly less than half report using MS Access in course work. This is higher than expected, and may be an artifact or misunderstanding of the term “access” vs. MS Access as an application (Table 11).
Table 10: Students Required to use MS Access for Coursework
Response Count Pct Yes 1,504 47% No 1,448 45% Not this semester, but at least one class last year. 259 8%
Security Awareness and Practices Security and privacy are ongoing challenges in the University environment. UB continues to proactively inform students of security “best practices” and how to protect their data and hardware from malicious attacks.
11 | P a g e

The usage of UB Virtual Private Network (VPN) software has changed slightly from last year, but a slight “uptick” in reports of not understanding what VPN is, or how it’s used, may indicate a need to re‐examine education efforts so students understand the importance of using a VPN client.
Table 11: Students who used UB VPN to Connect from Home or from Off‐Campus
Response 2007 2008 Yes 28% 27% No 35% 33% I don't know what UB VPN is 38% 41%
Use of anti‐virus software and firewalls remains relatively stable and unchanged from 2007. Slightly more students use anti‐virus software than a personal firewall (Figures 11 and 12).
Figure 11: Use of Anti‐Virus Software
Anti‐virus (UB)42%
Anti‐virus (Other)38%
Don't Use8%
Not sure9%Other3%
Students are encouraged to maintain anti‐virus and firewall software through use of automatic updates, and approximately three‐quarters of those surveyed do. When asked to indicate methods used for security, the responses about automatic vs. manual updates total the exact percentages as last year, but a few more students now use automatic updates (Table 13).
Fortunately, less than 5% of students report not updating their system, with slightly more (6%) reporting being unsure of how to maintain their computer(s) security software.
Figure 12: Use of a Firewall
Firewall (UB Symantec)39.3%
Firewall from
another source37.0%
Not sure15.3%
Choose not to use a firewall6.9%
Other1.7%
Other23.9%
12 | P a g e
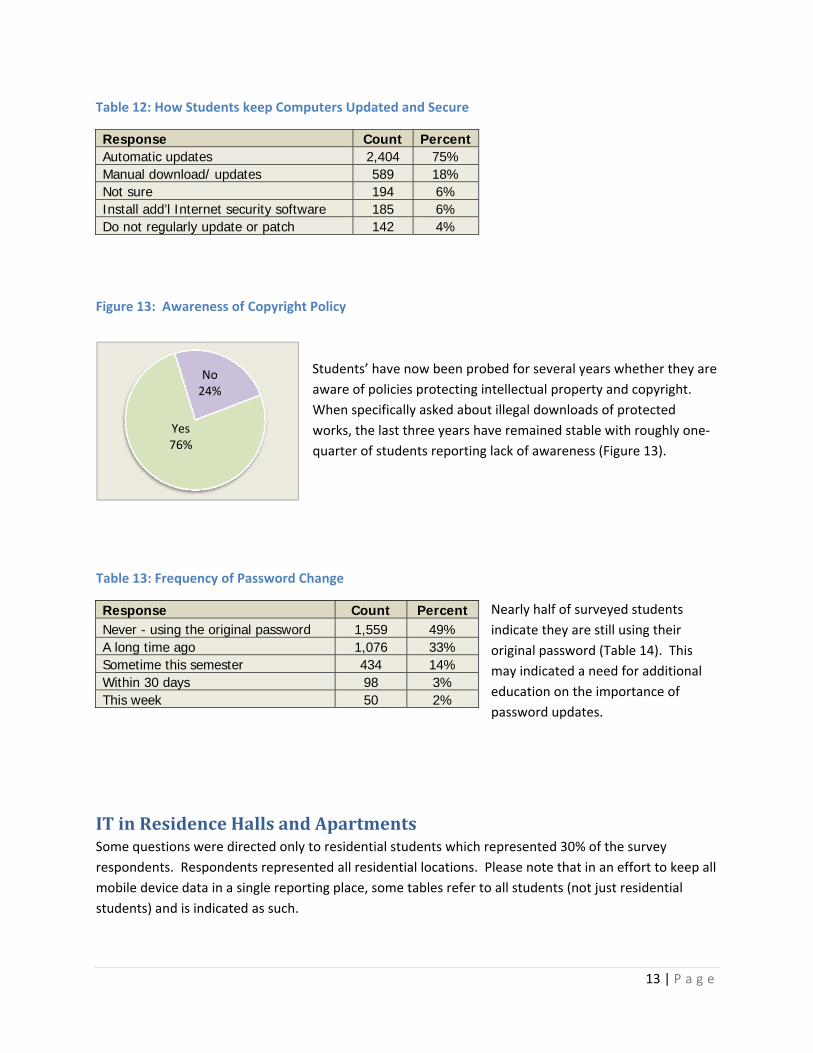
Table 12: How Students keep Computers Updated and Secure
Response Count PercentAutomatic updates 2,404 75% Manual download/ updates 589 18% Not sure 194 6% Install add’l Internet security software 185 6% Do not regularly update or patch 142 4%
Figure 13: Awareness of Copyright Policy
Yes76%
No24%
Students’ have now been probed for several years whether they are aware of policies protecting intellectual property and copyright. When specifically asked about illegal downloads of protected works, the last three years have remained stable with roughly one‐quarter of students reporting lack of awareness (Figure 13).
Table 13: Frequency of Password Change
13 | P a g e
Nearly half of surveyed students indicate they are still using their original password (Table 14). This may indicated a need for additional education on the importance of password updates.
Response Count Percent Never - using the original password 1,559 49% A long time ago 1,076 33% Sometime this semester 434 14% Within 30 days 98 3% This week 50 2%
IT in Residence Halls and Apartments Some questions were directed only to residential students which represented 30% of the survey respondents. Respondents represented all residential locations. Please note that in an effort to keep all mobile device data in a single reporting place, some tables refer to all students (not just residential students) and is indicated as such.

Figure 14: Residence of Survey Respondents
Off campus ‐privately rented
apartment36% Off campus ‐
home28%
UB residence hall20%
UB on‐campus apartment
9%
Off campus ‐apartment
complex (e.g. University Village at
Sweet Home, The Villas)
6%
Off campus ‐UB housing (Flickinger Court)1%
Other69%
Table 14: Residences of UB residents
14 | P a g e
Of the students surveyed, Figure 14 and Table 15 describe distribution of 30% (n=953) of the student respondents who live within UB Residence Halls & Apartments.
Response Count Percent Clement 86 9% Clinton 41 4% Creekside Village 23 2% Dewey 19 2% Fargo 64 7% Flickinger Court 29 3% Flint Village 73 8% Goodyear 47 5% Hadley Village 105 11% Lehman 30 3% MacDonald 15 2% Michael Hall 4 .4% Porter 63 .6% Pritchard 8 .8% Red Jacket 78 8% Richmond 66 7% Roosevelt 28 3% Schoellkopf 23 2% South Lake Villa 80 8% Spaulding 37 4% Wilkeson 38 4%
The majority of residential students do not use the University phone service (Tables 16‐18). A reasonable assumption would be that younger students have greater access to mobile phones, and of those who do use Residence Hall telephones, it is primarily for incoming or local calls.
2% of the students surveyed indicate that they do not own a cell phone, and 7% indicate they can not receive a cell phone signal in their residence hall or apartment. Wireless network coverage in general has been installed according to the priorities identified by students in previous surveys: Goodyear, Richmond and Red Jacket.
Increased adoption of mobile devices is evident through class standing, as fewer students are relying on traditional “hard wired” telephone service in residence halls (Tables 16, 17 and 18).

15 | P a g e
Table 15: Use of University Phone Service by Residents
Response Count Percent No 729 76% Yes 228 24%
Table 16: Use of University Phone Service by Class Standing
Response Freshman Sophomore Junior Senior Graduate student
Non-matric Not sure
No 82% (183) 84% (205) 73% (166) 67% (124) 65% (45) 50% (2) 33% (1) Yes 18% (40) 16% (38) 27% (61) 33% (60) 35% (24) 50% (2) 67% (2) Totals 223 243 227 184 69 4 3
Table 17: Type of University Phone Service Use
Response Count Percent Incoming calls 159 70% Local calls 129 57% On-campus calls 93 41% Calling card calls 31 14% Long distance calls 25 11% Other 6 3% RA job 3 1%
In order to provide consistent, reliable access to mobile devices, the University has been surveying and monitoring quality of cell phone reception. Although the quality of reception varies depending on the choice of service provider it is encouraging that 92% of respondents report usable reception (Table 19).
Table 18: Cell Phone Reception in Residence Hall or Apartment
Response Count Percent
Yes 879 92% No 63 7% I don't have a cell phone 15 2%
Nearly half of all students surveyed indicate they subscribe to Verizon Wireless for mobile device services, with another quarter (26%) using AT&T. The remainder use T‐Mobile, Sprint‐NexTel and other, non‐specified providers (Table 20).

Table 19: Cell Phone Providers
Response Count Percent Verizon Wireless 1,516 47.1%AT&T 826 25.6%T-Mobile 426 13.2%Sprint-NexTel 281 8.7%Other (please specify) 73 2.3%Cricket 44 1.3%
It appears that overall, regardless of the mobile service provider of choice, students are satisfied with the quality of service and features they are receiving (Figure 15):
Figure 15: Satisfaction with Cell Phone Providers
Very satisfied Somewhat satisfied
0% 20% 40% 60% 80% 100%
Very satisfied Somewhat satisfied Neither satisfied nor dissatisfied
Somewhat dissatisfied Very dissatisfied
All students surveyed ranked priorities for where they would like improved cell phone reception (Table 21). Many lecture hall entries are located within interior halls, along with food courts and library commons areas that may require some type of signal boosting or repeaters to provide reliable mobile device services.
Table 20: Top Preferences for Cell Phone Reception
Rank Item Rank Weighted Responses
Campus hallways outside large lecture halls 1 7,985
Indoor areas in food and cafe courts 2 6,556
Library commons areas 3 6,548
Campus bus stops 4 4,911
Student gathering spaces and meeting rooms 5 4,877
Outdoor areas near food courts 6 4,198
Residence hall room 7 3,726
Residence hall common area/lounges 8 1,950
Not sure 9 1,385
Residence hall eating establishments 10 1,074
Residence hall hallways/laundry facilities 11 991
16 | P a g e

17 | P a g e
Some students (whether living in residence halls or other locations) access phone service through computer networks, also known as voice‐over‐IP (VoIP) or Softphones. Over half of students surveyed report not using VoIP, but of those who do, Skype is the clear telephone software of choice (Table 22).
Table 21: Softphone (Voice over IP) Services Used
Response Count Percent None 1,863 57.8%Skype 822 25.5%Not sure 407 12.6%Other (please specify) 88 2.7%Vonage 84 2.6%Gizmo 28 0.9%
As students become increasingly mobile in general, they appreciate the convenience of not being tethered to a traditional hard‐wired port. Respondents from several recent surveys indicate that they enjoy and find value in working in small groups, and that wireless connectivity is critical in meeting these objectives. It is therefore important to understand whether students in residence halls report access to UB wireless, and if not, whether they have access to a non‐UB wireless network (Table 23).
Table 22: How Residential Students Receive a Wireless Connection
Response Count Percent UB provided 382 40% I can't get a wireless connection 270 28%
I don't need a wireless connection 103 11%
My own wireless router 95 10%
Someone else's router 76 8%
Not sure 27 3%
Although students residing in Goodyear, Richmond and Red Jacket residence halls received UB wireless access within the past year, the following table (Table 24) reflects how students’ identify their access to a wireless signal in a variety of ways.

18 | P a g e
Table 23: Wireless Access by Residential Unit
UB Unit UB
provided
My own wireless router
Someone else's router
Can't get a wireless
connection
Don't need a wireless connection
Not sure
Clement 10% (37) 5% (5) 7% (5) 11% (30) 5% (5) 7% (2) Clinton 4% (16) 1% (1) 0% (0) 6% (16) 7% (7) 4% (1) Creekside Village .5% (2) 6% (6) 4% (3) 3% (8) 2% (2) 7% (2) Dewey 2% (7) 2% (2) 1% (1) 3% (7) 2% (2) 0% (0) Fargo 5% (19) 7% (7) 7% (5) 7% (20) 9% (9) 15% (4) Flickinger Court 3% (11) 3% (3) 7% (5) 2% (6) 3% (3) 4% (1) Flint Village 5% (18) 7% (7) 7% (5) 10% (28) 14% (14) 4% (1) Goodyear 10% (39) 5% (5) 1% (1) 0% (0) 2% (2) 0% (0) Hadley Village 4% (16) 22% (21) 24% (18) 14% (39) 7% (7) 15% (4) Lehman 2% (7) 1% (1) 7% (5) 3% (9) 5% (5) 11% (3) MacDonald .5% (2) 1% (1) 3% (2) 2% (6) 3% (3) 4% (1) Michael Hall .5% (2) 1% (1) 0% (0) .4% (1) 0% (0) 0% (0) Porter 7% (25) 6% (6) 4% (3) 7% (18) 8% (8) 11% (3) Pritchard .8% (3) 0% (0) 0% (0) 2% (4) 1% (1) 0% (0) Red Jacket 16% (61) 5% (5) 1% (1) .4% (1) 10% (10) 0% (0) Richmond 15% (57) 5% (5) 0% (0) .7% (2) 2% (2) 0% (0) Roosevelt 1% (4) 3% (3) 13% (10) 4% (11) 0% (0) 0% (0) Schoellkopf 2% (8) 0% (0) 1% (1) 4% (12) 1% (1) 4% (1) South Lake Villa 5% (18) 12% (11) 5% (4) 11% (30) 14% (14) 7% (2) Spaulding 4% (14) 1% (1) 7% (5) 4% (11) 5% (5) 4% (1) Wilkeson 4% (16) 4% (4) 3% (2) 4% (11) 3% (3) 4% (1) Total Counts 382 95 76 270 103 27
The cost of providing technology related services in residence halls is constantly rising. It is therefore useful to have a measure of how students value various services by hypothetically breaking them out as subscription services independent of a service package. Residence hall students clearly indicate they are willing to pay for premium network bandwidth, followed by premium and regional television access (Table 25).
Table 24: Services to which Students would Subscribe
Response Count Percent Wired Internet access (high speed) 697 22% TV (premium channels) 237 7% TV (regional channels) 197 6% TV (UB channels) 180 6% Wired internet access (basic speed) 122 4% None 105 3% Telephone (traditional) 62 2% VoIP service (Voice over IP telephone) 25 .8%

Only 4% of residence hall students would find value in “basic” vs. “high speed” Internet access. It is well known that students require high capacity bandwidth for graphics intensive work, computational analysis and large file transfer ‐ but the network is also highly valued for recreational use (e.g., interactive gaming). Less than 2% would subscribe to traditional telephone service, and less than 1% indicates they would be willing to subscribe to VoIP telephone service, presumably because they would use readily available software (e.g., Skype) across existing network availability.
Students living in areas where computer labs are located report a negative impact on the removal of student assistant consultants from these public labs (Figure 17). Of those who made use of the on‐site consultants, 18% reported that it made their tasks “somewhat” to “very” difficult, with an equal number reporting that it was “less convenient.” Approximately one‐third reported no impact, and 12% were not sure of the impact the loss of consultants had on their academic work in public computing labs within residence halls (Figure 16).
Figure 17: Impact of Removing Consultants from Residence Halls
0% 20% 40% 60% 80% 100%
Clement
Clinton
Red Jacket
All Units Very difficult
Somewhat difficultLess convenientNo impact at all
Messaging at UB As many universities consider using externally hosted services to manage student email, It is useful to understand what applications students use as their preferred email application. Over one‐third (35%) indicate use of “UB Mail” as their primary client, followed closely by use of Google (Gmail), Yahoo and Hotmail accounts for an aggregate of 84% (Table 26). 4% indicted using Outlook, 3% Thunderbird ‐ with others (Outlook Express, AOL, Mulberry, Mac Mail, Entourage, Pine, Vista Mail and “other” each registering below a 2% threshold).
Two‐thirds (64%) indicate they use “@buffalo.edu” as their primary account, which is highly preferred by faculty seeking to identify students by their UB user names when receiving assignments (Table 27).
Instant Messaging (IM) remains a popular tool among students (Table 28). Over half prefer America Online AIM as the messenger of choice, followed by Windows Messenger (MSN).
19 | P a g e

Table 25: Websites or Clients used for Email
Response Count Percent UBmail 2,395 36% Gmail 1,243 19% Yahoo 1,156 17% Hotmail 827 12% Outlook 239 4%
Thunderbird 188 3% Outlook Express 152 2% AOL 130 2% Mulberry 105 2% Other (please specify) 94 2% Mac mail 94 2% Pine 37 .6% Entourage 34 .5% Vista Mail 20 .3% Not sure 10 .2%
Table 26: Use of “@buffalo.edu” as Primary Email
Response Count Percent Yes 2,050 64% No 1,171 36%
Table 27: Instant Messenger (IM) Tools Used
Response Count Percent GAIM/Pidgin 107 3% Adium 101 3% Trillian 77 2% Skype 39 0.8% Facebook 35 0.7% Jabber 10 0.3% Digsby 9 0.2% Pidgin 8 0.2% QQ 8 0.2% Blackberry 4 0.1%
Response Count Percent AIM 1,732 54% MSN IM (Windows Msgr) 657 20% Don’t use (IM) 526 16% Yahoo! 409 13% Google Talk 385 12% AIM Express 343 11% Meebo 290 9% iChat 188 6% Other (please specify) 28 4%
The University has invested in multiple methods for delivery of critical alert messages. The primary alert service is self‐selected as “opt‐in” by students to receive emergency information about school closings
20 | P a g e

or other immediate safety related concerns. At present, only 38% of those responding to the survey indicate they have elected to receive these messages (Figure 18). This represents a 10% increase over last year when the service was first introduced (Table 29). The number of students indicating they do not intend to “opt‐in” to the service remains the same at approximately 28%.
Figure 18: "Opt‐in" for UB Alert Service Table 28: UB Alert “Opt‐In” 2007‐2008
2007 2008 Yes 29% 38% Don't intend to 28% 28% Intend to 18% 16% Didn't know 11% 7% Phone not able 7% 5% Tried but didn't 5% 4% Other 1% 0.9%
Yes38%
Don't intend to28%
Intend to16%
Didn't know7%
Phone not able5%
Tried but didn't5% Other
1%
Of the 29 “other” responses received, the majority of comments indicated that texting was not compatible with “pay as you go” mobile service plans (Table 30).
Table 29: Other Responses for UB Alert Service
Response Count Not compatible with pay-as-you-go service plans 8 Don't have a cell phone 5 Don't remember/don't know 5 Get email alerts instead 3 Didn't know there was something like that 2 Not interested unless messages are free 2 It didn't work 2 Doesn't seem useful 2
Additional qualitative comments and data (Tables 31, 32) offer insight to the type of notification preferred by students. The majority prefers to limit UB Alert messages to emergency notification only. Other types of messages that students prefer deal with time‐critical information such as class cancellations or school closing.
Table 30: Comparative Responses for UB Alert 2007 ‐ 2008
21 | P a g e

22 | P a g e
2007 2008 Response Count Percent Count Percent
None ‐ I want emergency notifications only 1,372 31% 1,741 38%
Campus news & events 752 17% 736 16%
Shuttle bus schedule & tracking 827 19% 725 16%
Departmental text messages 629 14% 574 13%
Athletic news & scores 443 10% 412 9%
Assistance with library research 306 7% 239 5%
Other (please specify) 112 3% 109 2%
Total 4,441 100% 4,536 100%
Table 31: Other Message “Opt‐In” Requests
Response Count Class cancellations/school closing 16 Traffic advisory 2 Email 2 Fire Drill 1
Respondents were asked to rank the top five ways in which they prefer to receive official university communications (Table 33). Email and MyUB consistently rank as the top preferred ways in which to receive official messages, but texting is now the third most preferred method. It also appears that students are paying less attention to traditional broadcast media for message dissemination.
Table 32: Top Rankings of Official UB Communication Preferences
2006 2007 2008 Email 1 1 1 MyUB 2 2 2 Text messaging 8 3 3 Paper mail 4 4 Instant Messaging 5 5 TV 3 UB Web Site 4 Radio 5 Cell phone 6 645-NEWS 7
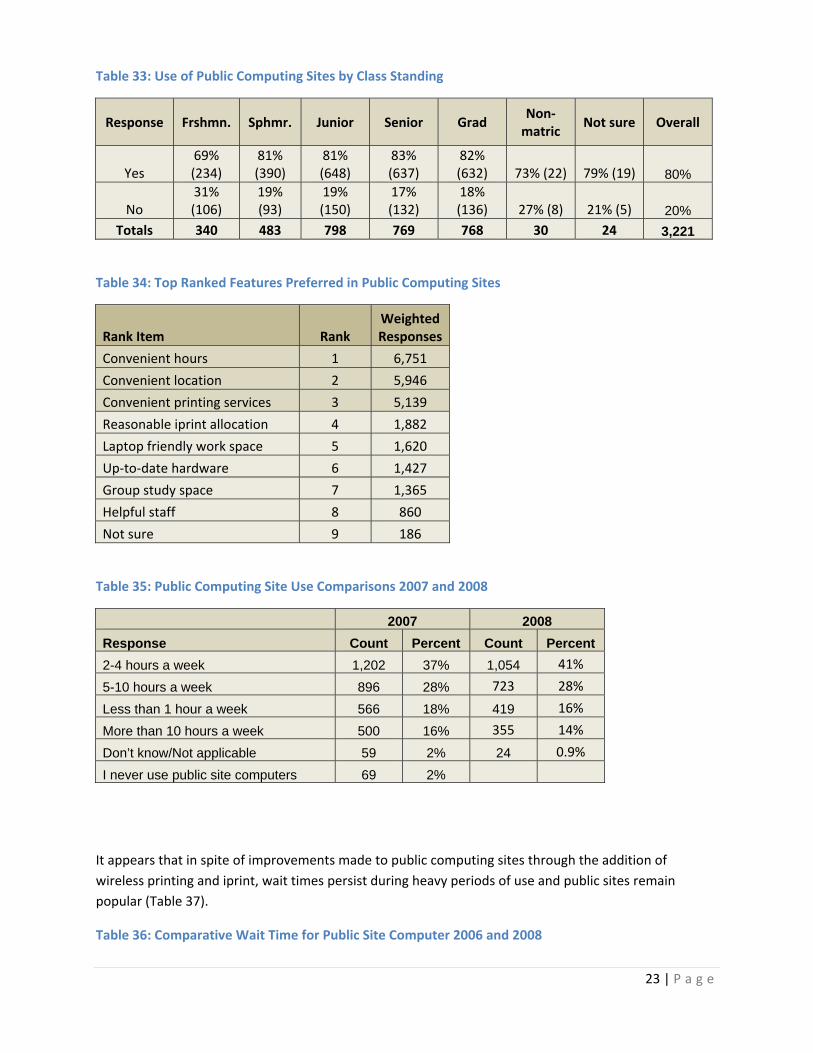
Public Sites and Printing When viewed according to class rank, freshmen report using the public computing sites less than other classes (Table 34). Features ranked in order of preference and the amount of hours used from last year to present are described below (Tables 35, 36).
23 | P a g e
Table 33: Use of Public Computing Sites by Class Standing
Response Frshmn. Sphmr. Junior Senior Grad Non‐matric
Not sure Overall
Yes 69% (234)
81% (390)
81% (648)
83% (637)
82% (632) 73% (22) 79% (19) 80%
No 31% (106)
19% (93)
19% (150)
17% (132)
18% (136) 27% (8) 21% (5) 20%
Totals 340 483 798 769 768 30 24 3,221
Table 34: Top Ranked Features Preferred in Public Computing Sites
Rank Item Rank Weighted Responses
Convenient hours 1 6,751
Convenient location 2 5,946
Convenient printing services 3 5,139
Reasonable iprint allocation 4 1,882
Laptop friendly work space 5 1,620
Up‐to‐date hardware 6 1,427
Group study space 7 1,365
Helpful staff 8 860
Not sure 9 186
Table 35: Public Computing Site Use Comparisons 2007 and 2008
2007 2008 Response Count Percent Count Percent 2-4 hours a week 1,202 37% 1,054 41%
5-10 hours a week 896 28% 723 28%
Less than 1 hour a week 566 18% 419 16%
More than 10 hours a week 500 16% 355 14%
Don’t know/Not applicable 59 2% 24 0.9%
I never use public site computers 69 2%
It appears that in spite of improvements made to public computing sites through the addition of wireless printing and iprint, wait times persist during heavy periods of use and public sites remain popular (Table 37).
Table 36: Comparative Wait Time for Public Site Computer 2006 and 2008

2006 2008 Response Count Percent Count Percent No wait 336 18% 328 13%
Less than 10 minutes 932 50% 1200 47%
10-20 minutes 423 23% 712 28%
20-30 minutes 101 5% 182 7%
Between 1/2 hour and an hour 46 3% 72 3%
More than an hour 18 1% 28 1%
I never use public sites 13 0.5%Not sure 42 2%
When asked how students would prefer to pay for color printing if it were made available, there was fairly even distribution among those who had no interest in color printing, campus cash, or print copy cards (Figure 19).
Figure 19: Preferred Payment Method for Color Printing
Campus Cash28%
Print Copy Card25%
No Interest29%
Not sure18%
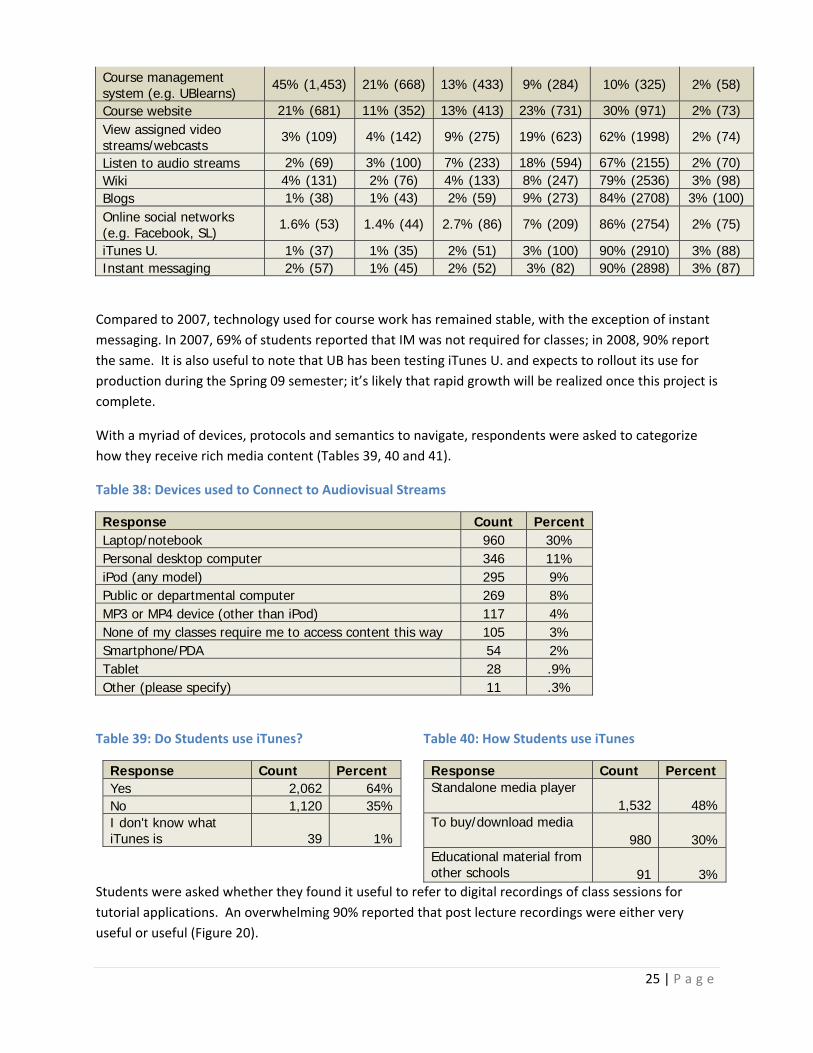
Learning Resources Although this survey is primarily concerned with the hardware and systems that support Information technology (infrastructure), it is important to understand how much of that infrastructure is directly supporting learning technologies. The 2007 Student “Learning with Technologies” survey probed these issues at greater depth, in part to prepare for learning spaces as part of Master Planning efforts. Of particular interest are Web 2.0 technologies and the demand for “anytime/anywhere” learning. Respondents were asked about the number of courses requiring use of popular learning technologies (Table 38).
Table 37: Number of Courses Requiring use of Various Learning Technologies
Technology Four or more Three Two One None Not sure
Email 56% (1,786) 17% (555) 11% (361) 7% (210) 8% (251) 2% (57)
24 | P a g e
25 | P a g e
Course management system (e.g. UBlearns)
45% (1,453) 21% (668) 13% (433) 9% (284) 10% (325) 2% (58)
Course website 21% (681) 11% (352) 13% (413) 23% (731) 30% (971) 2% (73) View assigned video streams/webcasts
3% (109) 4% (142) 9% (275) 19% (623) 62% (1998) 2% (74)
Listen to audio streams 2% (69) 3% (100) 7% (233) 18% (594) 67% (2155) 2% (70) Wiki 4% (131) 2% (76) 4% (133) 8% (247) 79% (2536) 3% (98) Blogs 1% (38) 1% (43) 2% (59) 9% (273) 84% (2708) 3% (100) Online social networks (e.g. Facebook, SL)
1.6% (53) 1.4% (44) 2.7% (86) 7% (209) 86% (2754) 2% (75)
iTunes U. 1% (37) 1% (35) 2% (51) 3% (100) 90% (2910) 3% (88) Instant messaging 2% (57) 1% (45) 2% (52) 3% (82) 90% (2898) 3% (87)
Compared to 2007, technology used for course work has remained stable, with the exception of instant messaging. In 2007, 69% of students reported that IM was not required for classes; in 2008, 90% report the same. It is also useful to note that UB has been testing iTunes U. and expects to rollout its use for production during the Spring 09 semester; it’s likely that rapid growth will be realized once this project is complete.
With a myriad of devices, protocols and semantics to navigate, respondents were asked to categorize how they receive rich media content (Tables 39, 40 and 41).
Table 38: Devices used to Connect to Audiovisual Streams
Response Count Percent Laptop/notebook 960 30% Personal desktop computer 346 11% iPod (any model) 295 9% Public or departmental computer 269 8% MP3 or MP4 device (other than iPod) 117 4% None of my classes require me to access content this way 105 3% Smartphone/PDA 54 2% Tablet 28 .9% Other (please specify) 11 .3%
Table 39: Do Students use iTunes?
Response Count Percent Yes 2,062 64%No 1,120 35%I don't know what iTunes is 39 1%
Table 40: How Students use iTunes
Response Count Percent Standalone media player
1,532 48%To buy/download media
980 30%Educational material from other schools 91 3%
Students were asked whether they found it useful to refer to digital recordings of class sessions for tutorial applications. An overwhelming 90% reported that post lecture recordings were either very useful or useful (Figure 20).

Figure 20: Usefulness of Digital Lecture Recording
0% 20% 40% 60% 80% 100%
Very useful Useful Not useful Not sure
Satisfaction with IT Services and Recommendations Overall it appears that students are generally satisfied with the IT services they receive from the University, with nearly one‐third reporting “very” satisfied (Figure 21). Only 2‐3% report being “very” dissatisfied. Responses from class to class were comparable. It is significant that those reporting “very” satisfied jumped from 12% in 2007 to 22% in 2008.
Figure 21: Compared to last year how satisfied are you with IT services?
Very satisfiedSomewhat satisfied
0% 20% 40% 60% 80% 100%Very satisfied Somewhat satisfiedNeither satisfied nor dissatisfied Somewhat dissatisfiedVery dissatisfied
Qualitative Responses –Suggestions and Critical Feedback Six questions were included in this year’s survey to investigate use of the University portal (MyUB), whether respondents preferred email clients other than UBmail, how they felt about the quality of technology classrooms, UBlearns and general feedback on how UB could improve services and be more efficient with resources.
The initial theme analysis for each of these probes was divided into positive, negative or neutral/ irrelevant responses. Positive responses were then set‐aside so a deeper analysis could be done regarding critical responses. The survey design team held concern that grouping many open ended questions toward the end of the survey instrument would result in a low response rate, but when compared to previous surveys, the response rate is similar.
A separate file is posted with this report on the UBIT Scoreboard website which contains the complete thematic sort of unedited comments.
26 | P a g e
27 | P a g e
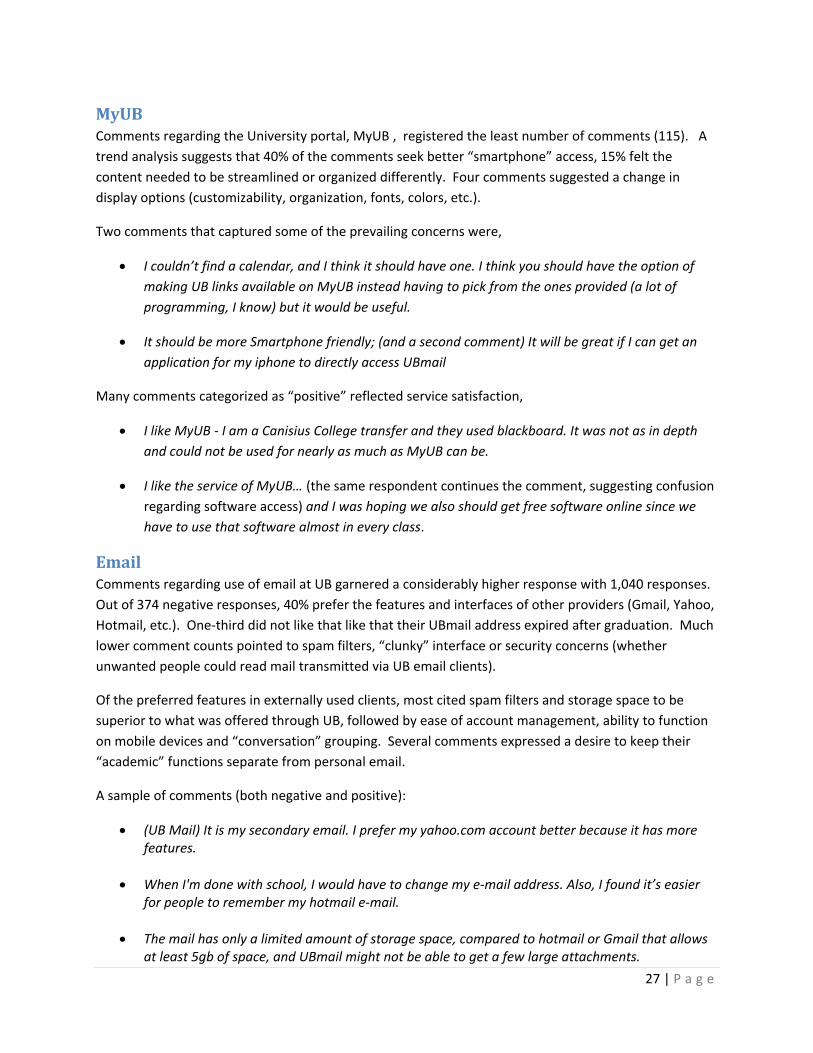
MyUB Comments regarding the University portal, MyUB , registered the least number of comments (115). A trend analysis suggests that 40% of the comments seek better “smartphone” access, 15% felt the content needed to be streamlined or organized differently. Four comments suggested a change in display options (customizability, organization, fonts, colors, etc.).
Two comments that captured some of the prevailing concerns were,
• I couldn’t find a calendar, and I think it should have one. I think you should have the option of making UB links available on MyUB instead having to pick from the ones provided (a lot of programming, I know) but it would be useful.
• It should be more Smartphone friendly; (and a second comment) It will be great if I can get an application for my iphone to directly access UBmail
Many comments categorized as “positive” reflected service satisfaction,
• I like MyUB ‐ I am a Canisius College transfer and they used blackboard. It was not as in depth and could not be used for nearly as much as MyUB can be.
• I like the service of MyUB… (the same respondent continues the comment, suggesting confusion regarding software access) and I was hoping we also should get free software online since we have to use that software almost in every class.
Email Comments regarding use of email at UB garnered a considerably higher response with 1,040 responses. Out of 374 negative responses, 40% prefer the features and interfaces of other providers (Gmail, Yahoo, Hotmail, etc.). One‐third did not like that like that their UBmail address expired after graduation. Much lower comment counts pointed to spam filters, “clunky” interface or security concerns (whether unwanted people could read mail transmitted via UB email clients).
Of the preferred features in externally used clients, most cited spam filters and storage space to be superior to what was offered through UB, followed by ease of account management, ability to function on mobile devices and “conversation” grouping. Several comments expressed a desire to keep their “academic” functions separate from personal email.
A sample of comments (both negative and positive):
• (UB Mail) It is my secondary email. I prefer my yahoo.com account better because it has more features.
• When I'm done with school, I would have to change my e‐mail address. Also, I found it’s easier
for people to remember my hotmail e‐mail.
• The mail has only a limited amount of storage space, compared to hotmail or Gmail that allows at least 5gb of space, and UBmail might not be able to get a few large attachments.

28 | P a g e
• I use (UB Mail) primarily for school related purposes and want to keep it separated from my
other mail
• Currently, I receive so many advertisements from all kinds of retail stores, (that) I want those ads to be separated from emails from school
• I am returning to UB after a two‐year break between undergrad and grad, and find that the
changes in the system are confusing and are not accessible everywhere. I don't like the UB mail at all.
• Too small. Gmail way better. Switch (from) UBmail to Gmail.
• I don't want to fill my inbox up with needless emails about offers, coupons, (and other)
information. I prefer to leave it for school usage.
Technology Classrooms Technology in classrooms and learning spaces was far and away the most commented upon. Over 2,354 responses were received, with positive comments outnumbering negative feedback by a ratio of over 2:1 (1211 positive responses to 507 negative).
• I have no complaints about UB's technology classrooms except for two things: 1) it is a problem when classes that require these technologies are placed in classrooms that are not up‐to‐date, and 2) although the school provides seminars to teach professors how to use the technology, there should be a level of proficiency with something simple like the Internet required of the professors so that when they are carrying a tech‐heavy class, they are able to move forward without fumbling.
Out of the 507 comments of concern (coded “negative”), the greatest concern was that of audio quality in large lecture halls, and that for a variety of reasons, students have a difficult time consistently hearing content.
• I can hear the instructors better on the recordings than I can over the speakers while in class. Sometimes this is the only way I know what they said.
• In big lecture rooms, I can’t hear the professor very well and I can’t write the notes (from what) he says ‐ and sometimes the mic doesn’t work and he just speaks loud in front of 300 students.
A nearly equal number of the 507 comments of concern surrounded digital course capture. Students have increasingly been requesting access to courses “anytime – anywhere” for review and tutorial applications. Many comments point to issues of consistency in how classes are recorded and delivered.
• Sometimes, I cannot rewind or fast‐forward the sessions. The video gets stuck and I have to begin all over again. Downloading would be a much better option than streaming.

29 | P a g e
• I wish the camera would focus on what the teacher is writing on the board or teaching on power point instead of on him walking back and forth to the computer. It would be nice to stop pausing and rewinding because they spent 2 seconds focusing on the board. The picture is not very clear as well.
Several students pointed out that professors seem to have difficulty understanding and using the technology available to them.
• I am all around happy with the aforementioned. Never encountered any problems in my five years here. Good job guys. Though a lot of professors seem baffled by whatever is going on under those glass podium casings. Maybe a mandatory tech course for anyone who wants to use it in his or her class? It's obnoxious to sit there and wait and wait and wait while somebody fumbles around without even a clue what they're looking for let alone how to get it... just my opinion.
Video projection and lighting were also considered by a number of students.
• We (should) have the projector machines with HD VISIBILITY not the poor quality ones we currently have.
• It seems that the color and sharpness of a lot of the classroom projectors could be better
• It would be nice if professors had more control over the lighting instead of just turning off every other row of lights.
UBlearns The ratio of positive (866) to critical feedback (346) was closer to 3:1 for UBlearns. A total of 1439 comments were offered, the overwhelming majority concentrating on how all classes should use it to some extent (replacing individual course websites) and that both instructors and students need to better understand how it functions in order to maximize it’s effectiveness as a course management tool.
At the time of this survey, the new blog and web tools had not yet been released. Many comments expressed concern about the ability to use interactive tools for group work and other types of assignments. Other concerns focused on the user interface issues and ability to reach material quickly.
• One of the best tools at UB. I wish ALL of my professors would use it. It allows me to stay more organized in my classes.
• Please offer color coding options for each class or order the classes through alphabetization to make it easier to find material.
• Please require all teachers to use it. I don't want to use course web sites. I want everything in one place. My main beef is with (my class) where his site can only be accessed on campus.
• Require professors to learn how to use it optimally and how to manipulate it to their desires. Maybe a help center for them?
30 | P a g e
• All professors need to learn how to properly use UB Learns. It's a great tool when documents are uploaded and labeled correctly‐‐otherwise it becomes more of a hassle than anything else. UB Learns classes ought to be mandatory for all instructors.
Efficiency and Waste Reduction 1415 comments were received and categorized as: eliminating waste (209), Improving Efficiency (446) or Neutral/irrelevant responses (760). Three themes emerged for waste elimination: 1) Recycling of the print job cover sheets at the public computing sites; 2) A means to allow multiple print jobs to be released under a single cover sheet; and 3) additional recycling bins strategically placed around campus to make it easier to recycle waste.
• Don't drop the prices for the printouts. I know (people) might complain, but making it cheaper would make students feel like they can print anything all the time
• Are all the blue papers needed? I know it makes it easy and fast, but if I print 5 things in a row, I don't need 5 blue sheets. Could come out all at the same time under 1 sheet?
• Don't give out software CDs to incoming students unless they request it‐ have it as a free download from the website instead.
Several suggestions were made regarding improved efficiency, though it’s not always clear from which perspective. A major theme was to make more public computers available to improve apparent student use efficiency.
• I would say that there should be more computers in Capen and Lockwood. Besides that, everything is great!
• Could be more resources at peak times of printing. It would be helpful if I just needed to print something before class there were more short term use computers available.
• Occasional monitoring of computer resources to assure that occupied seats are actually being used. I often see people sitting at a terminal, reading the paper with no applications open on the desktop. Having had to wait for access to a machine, this is often a very frustrating thing to see.
• Eliminate waste? Make sure the printers in the clement computer lounge are working properly so I don't have to reprint my copies and throw out my messed up copies. Make sure there is ink and paper in printers.
• Make sure all computers are actually functioning. It's hard enough to find an open one during peak hours, we don't need to get disappointed when we think there is an open one and it's really broken.
31 | P a g e
Additional Suggestions to Administration Slightly more than 1,000 respondents took the opportunity to provide additional comments to IT administrators. Not surprisingly, by the nature of the question, more negative than positive comments were received. Other than comments regarding email, it is noteworthy that this is the only category in which negative feedback outweighed positive comments. The overwhelming majority of comments were directed to resource issues, and a desire for increased services (printers, computers, iprint quotas, color printing, wireless penetration, more and better staffing, and increased Mac support).
• I think you guys do a great job, keep going with the updates and such that really makes computing a college experience, you know the latest technology, and fast computers.
• Anti virus software is great, but more updates/help about that type of stuff would be useful. More recommendations/suggestions with how to keep your computer running efficiently would be good to hear from the IT staff.
• Being able to print wirelessly through a Mac!
• Color printing would be very helpful when printing charts and graphs that are difficult to read with plain black and white. Making more computers available would be very helpful in giving students the opportunity to get work done. For example, I'm currently at Capen 3rd floor and I can honestly count about 15‐20 people waiting for computers.
• I have a lot to say because I live off campus with a new desktop but no Internet service, so UB is my place to go always to use a computer. I do not like that not all of the computers have MS WORD. I do not like that I have to wait so long to get a computer, and most of all more than anything in the entire world I HATE that people talk out loud and on their cell phones when I'm trying to write my papers. UB is where I come to write papers and although I would prefer a silent place to use my computer, not having internet at home means I have to come to UB and sit with other kids talking and with multiple people at one computer, chatting on their phones and being rude. There should be a SILENT computer area so that it doesn't take me SO long to write papers at this school. Thanks for the survey. Thanks for the opportunity to give feedback.
• I ran out of printing money VERY early in the semester but I really don't feel like I used an exorbitant amount ‐ definitely much less than last semester, but in Spring 08 my print quota lasted me until the final week of school. This made it extremely difficult to get my notes because I do not have a printer available to me at my apartment.
• I'm pretty satisfied, however I don't like that I cannot use certain computers for certain applications. I don't like the Cybraries usually because they're too loud and I lose focus.
• It would be great if an assistant was available at least some of the time in public printing areas (esp. governors) to fix printers when they break down; color printing would also be great and should come out of iprint.
• Make it so that everyone can print from home and release it when they get to an iprint station.

32 | P a g e
Conclusions Longitudinal data suggests that overall, the breadth and quality of IT services at UB are increasing, as is reported student satisfaction. Areas in which UB may need to consider further investment, not surprisingly are those coupled with adoption of newer technologies, and meeting the demands for ever‐increasing bandwidth and service convenience.
Respondents remind us however, that convenience should not necessarily be considered a luxury. Seemingly equating convenience with efficiency in their busy lives, students offer insight into an increasingly competitive environment, they express how it’s critical to provide them the tools necessary to achieve success in their academic careers.
This survey was a cooperative effort among The Office of the Provost, University Residence Halls, Office of the CIO, Academic Services, CIT and other UB stakeholders seeking to better understand the needs of UB students. Questions regarding this survey may be directed to Dr. Richard Lesniak, Director of Academic Services, Computing and Information Technology ([email protected]).