University at Buffalo Climate Action Plan · University at Buffalo Climate Action Plan August 27,...
107
University at Buffalo Climate Action Plan August 27, 2009 Prepared by: The University at Buffalo Environmental Stewardship Committee in collaboration with ECOLOGY AND ENVIRONMENT, INC. 368 Pleasant View Drive Lancaster, New York 14086
Transcript of University at Buffalo Climate Action Plan · University at Buffalo Climate Action Plan August 27,...
University at Buffalo Climate Action Plan
August 27, 2009
Prepared by:
The University at Buffalo Environmental Stewardship Committee
in collaboration with
ECOLOGY AND ENVIRONMENT, INC. 368 Pleasant View Drive
Lancaster, New York 14086
27:00 iii UB_CAP_FINAL_September15.doc-09/15/09
able of Contents T Section Page
Acknowledgements .................................................................................. xi
Executive Summary ................................................................................... 1
1 Introduction ............................................................................... 1-1 1.1 UB, the ACUPCC and Climate Change ........................................................... 1-2 1.2 ACUPCC Requirements ................................................................................... 1-2 1.3 The Climate Action Plan (CAP) ....................................................................... 1-5
2 UB’s Greenhouse Gas Footprint .............................................. 2-1 2.1 Technical Concepts and Approach: Baseline Inventory .................................. 2-1 2.2 Emissions by Source ........................................................................................ 2-5 2.3 Opportunities for Improving UB’s GHG Inventory ......................................... 2-9 2.4 The Impact of Campus Growth on UB’s GHG Footprint .............................. 2-11
3 Actions to Mitigate Greenhouse Gas Emissions ................... 3-1 3.1 Key Terms and Concepts ................................................................................. 3-2 3.2 Buildings and Land Use ................................................................................... 3-4 3.3 Transportation ................................................................................................ 3-15 3.4 Materials ......................................................................................................... 3-26 3.5 Cumulative Reduction in UB’s Carbon Footprint .......................................... 3-32
4 Achieving Climate Neutrality: The Role of Research, Teaching, and the Community ................................................. 4-1 4.1 Climate Change and Sustainability in Education ............................................. 4-6 4.2 Climate Change and Sustainability Research at UB ........................................ 4-9 4.3 UB and Western New York: Connecting to Address Climate Change .......... 4-11 4.4 Communications, Outreach, and Behavioral Change for Climate
Neutrality ........................................................................................................ 4-12
5 Financing Climate Neutrality .................................................... 5-1 5.1 Maximizing Climate Impact with Existing Funding Streams .......................... 5-2 5.2 Creating New Internal Sources for Funding .................................................... 5-5 5.3 Capitalizing on External Sources of Funding .................................................. 5-8 5.4 Non-Economic Resources for Achieving Climate Neutrality ........................ 5-10
Table of Contents (cont.) Section Page
02:000 iv UB_CAP_FINAL_September15.doc-09/15/09
6 Plan Implementation: Allocating Responsibility and Tracking Progress ..................................................................... 6-1 6.1 Implementation: Who Is Responsible? ............................................................ 6-1 6.2 UB: Climate Neutral by 2030 ........................................................................... 6-6 6.3 Adapting to a Changing Climate at UB ........................................................... 6-7
A APPENDICES ................................................................................ 1 A. UB’s GHG Inventory and Emissions Projections: Methods and
Approach ..............................................................................................................1 B: Offsets and RECs .................................................................................................5 C: Major ESCO Projects at UB .................................................................................7
27:00 v UB_CAP_FINAL_September15.doc-09/15/09
ist of Tables L Table Page Table 2-1: UB’s Emissions Compared to other ACUPCC Institutions ....................................... 2-6
Table 2-2: UB’s Grid Electricity Mix .......................................................................................... 2-8
Table 2-3: Full Master Plan Build-Out ...................................................................................... 2-11
Table 2-4: Worst-case vs. Business As Usual (MT CO2-e) ....................................................... 2-12
Table 3-1: Mitigation Actions – Buildings and Land Use ........................................................... 3-9
Table 3-2: Mitigation Actions – Transportation ........................................................................ 3-20
Table 3-3: Mitigation Actions – Materials ................................................................................. 3-28
Table 3-4: GHG Emission Reduction from Bundled Mitigation Strategies .............................. 3-35
Table 4-1: Strategies to Create a Culture of Sustainability at UB ............................................... 4-5
Table 4-2: UB Degree Programs with Considerable Environmental Content ............................. 4-7
Table 5-1: Overview of Financing Opportunities and Case Studies ............................................ 5-2
Table 5-2: Major UB Performance Contracting Projects ............................................................ 5-5
Table 6-1: Student Environmental Initiatives at UB .................................................................... 6-5
Table A-1: Building Energy Indexes (Energy per Square Foot of Space) ......................................2
Table A-2: Building Mitigation Actions and Assumed Improvement .............................................3
Table A-3: Estimated VMT Change ................................................................................................4
27:00 vii UB_CAP_FINAL_September15.doc-09/15/09
ist of Figures L
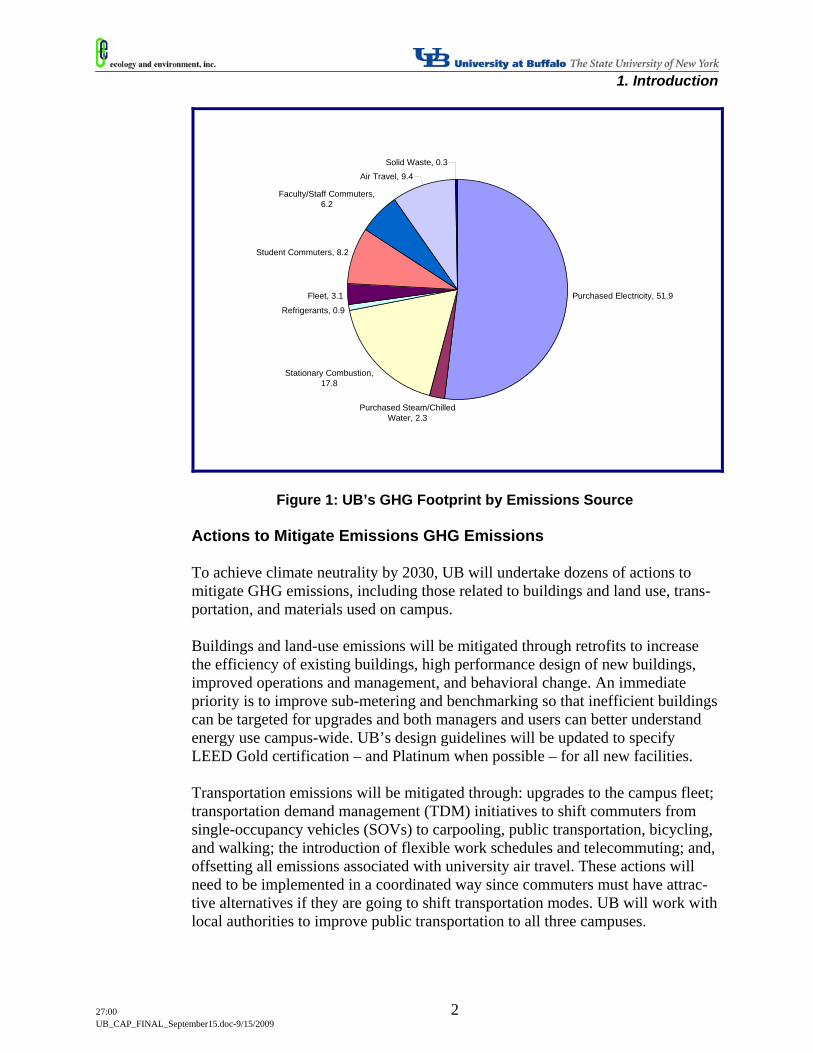
Figure Page Figure 1: UB’s GHG Footprint by Emissions Source .....................................................................2
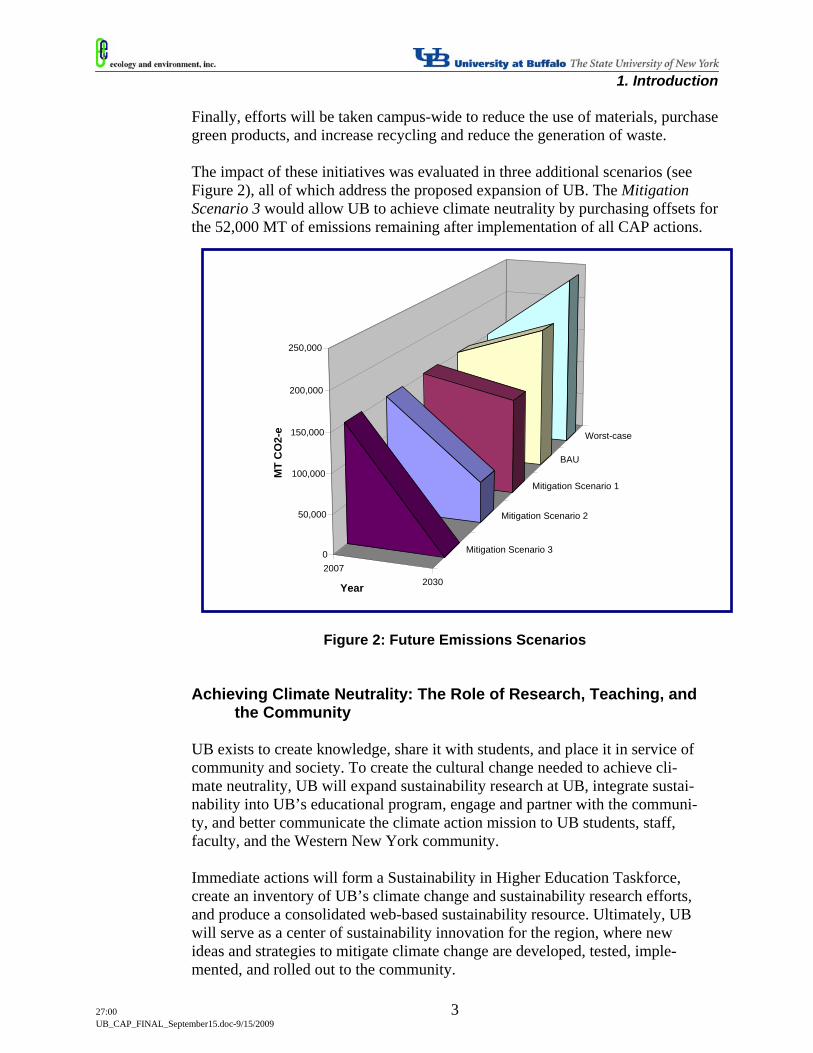
Figure 2: Future Emissions Scenarios ..............................................................................................3
Figure 1-1: UB’s Three Campuses .............................................................................................. 1-5
Figure 1-2: UB 2020 .................................................................................................................... 1-6
Figure 2-1: Secondary Climate Impacts of a Sustainability Initiative ......................................... 2-4
Figure 2-2: Total and Per Capita Emissions FY 1998-2007 ........................................................ 2-5
Figure 2-3: UB’s FY 2007 GHG Emissions (Source, Percentage of Total) ................................ 2-7
Figure 2-4: Worst-case and Business As Usual Scenarios ......................................................... 2-12
Figure 3-1: Energy Use at the Center for the Arts ..................................................................... 3-10
Figure 3-2: Reduced Printing Volume ....................................................................................... 3-29
Figure 3-3: Scenario Results ...................................................................................................... 3-33
Figure 3-4: Mitigation Scenario 1 Reductions by Emissions Source ........................................ 3-33
Figure 3-5: Mitigation Scenario 2 Reductions by Emissions Source ........................................ 3-34
27:00 ix UB_CAP_FINAL_September15.doc-09/15/09
ist of Acronyms and Abbreviations L AASHE Association for the Advancement of Sustainability in Higher Education ACUPCC American College and University Presidents Climate Commitment BAS Building Automation System BAU Business as Usual BTU British Thermal Unit CACP Clean Air-Cool Planet CAP Climate Action Plan CAR UB Green Climate Action Report CFL Compact Fluorescent Lightbulbs CNG Compressed Natural Gas CO2-e Carbon Dioxide Equivalent COE Center of Excellence CORE Community OutReach for Employees DOE United States Department of Energy EPA United States Environmental Protection Agency ESC Environmental Stewardship Committee ESCO Energy Services Company EUI Energy Use Index FY Fiscal Year GHG Greenhouse Gas LED Light-Emitting Diode LEED Leadership in Energy and Environmental Design MT Metric Ton MW Megawatt NFTA Niagara Frontier Transportation Authority NYPA New York Power Authority NYS New York State NYSERDA New York State Energy Research and Development Authority PV Photovoltaic REC Renewable Energy Certificate ROI Return on Investment RPS Renewable Portfolio Standard SUNY State University of New York TDM Transportation Demand Management UB University at Buffalo URH&A University Residence Halls and Apartments US United States VMT Vehicle Miles Traveled WBCSD World Business Council for Sustainable Development WNY Western New York WRI World Resources Institute
27:00 xi UB_CAP_FINAL_September15.doc-9/15/2009
Acknowledgements This plan is the collective accomplishment of hundreds of people across the uni-versity and beyond. Without their dedicated hard work its production would not have been possible. The preparation of the plan was led by the UB Environmental Stewardship Com-mittee (ESC), established by President Simpson and representing all those ele-ments of the university that have the capacity and the responsibility for imple-menting the recommendations herein. These include major academic units led by the Provost, the Vice President for Re-search, the Vice President for Health Sciences, the Associate Provost for Under-graduate Education, the Associate Provost for Strategic Initiatives, and the Dean of the Graduate School. They have worked hand in hand with administrative units of the university includ-ing those led by the Executive Vice President for University Support Services, Vice President for External Affairs, Vice President for Human Resources, Vice President for Student Affairs, Associate Vice President for Business Services, As-sociate Vice President for Information Technology, and Associate Vice President for University Facilities. Representatives of the Students Association and the Graduate Students Associa-tion have also been active and important participants in the work of the ESC. The work of the committee has been led by the Senior Advisor to the President for Campus Planning and Design, with support from the staff of Building UB: the Comprehensive Physical Plan and the university’s sustainability office, UB Green. Expert advice in the rapidly evolving field of climate action planning – including the drafting of this plan – has been provided by Ecology and Environment, Inc. with support from the master plan consultant team including Beyer Blinder Belle, Andropogon Associates landscape architects, BFJ Planning for transportation, and VFA facilities condition analysts, as well as SAP Carbon Impact, providers of carbon management software. Finally, the process of climate action planning – in our public forums and in sub-committee work – has benefited from crucial support and advice from hundreds of students, faculty, and staff.
1. Introduction
27:00 xii UB_CAP_FINAL_September15.doc-9/15/2009
Administrative sub-units of the university represented include Campus Dining and Shops, Community Relations, Facilities Planning and Design, Facilities Op-erations, Government Relations, Parking and Transportation, Special Events, Stu-dent Life, University Communications, University Residence Halls and Apart-ments, University at Buffalo Police Department, and more. Other organizations contributing to the work of the plan include the Professional Staff Senate and the Faculty Senate, as well as UB Climate Action Network, En-gineers for a Sustainable World, the Environmental Network, Environment and Society Institute, and the Environmental Task Force.
27:00 1 UB_CAP_FINAL_September15.doc-9/15/2009
Executive Summary The University at Buffalo, State University of New York, (UB) has committed itself to reduce its greenhouse gas (GHG) emissions and serve as a leader in the campaign to mitigate global climate change. President John B. Simpson signed the American College and University Presidents Climate Commitment (ACUPCC) on March 15th, 2007. This challenges the UB community not only to measure and reduce its GHG emissions, but to develop and implement measures to achieve climate neutrality by eliminating or offsetting those emissions. The UB Environmental Stewardship Committee (ESC), with support from Ecology and Environment, Inc. and continuing involvement of members of the campus com-munity, has prepared a Climate Action Plan (CAP) outlining a suite of strategic actions to achieve climate neutrality by 2030. The CAP is a living document. As action is taken on campus and technology evolves, new mitigation strategies will be developed and methods will be refined. The CAP will be updated regularly to reflect these changes, ideally allowing UB to achieve climate neutrality with the purchase of offsets and renewable energy credits as a last resort. UB’s GHG Footprint In FY 2007, UB emitted approximately 156,000 MT CO2-e. While this is up from a decade ago, it is down from the peak in 2003. Emissions on a per capita basis have declined ever more steeply, about 15 percent from 1998 to 2007. While the total campus population has grown, total building space has remained relatively constant, and energy conservation projects have cut consumption. The relative contribution from various emission sources is outlined in Figure 1 below. The UB GHG inventory is only a partial picture of UB’s contribution to global climate change. Many Scope 3 emissions (see page 2-2 for an explanation), nota-bly those over which the university does not have direct control, but may influ-ence through purchasing decisions or other activities, are considered outside the boundary of the emissions inventory. As outlined in the UB 2020 strategy, and accommodated in the campus master plan, UB is preparing to expand – in population and built space – by nearly 40 percent over the coming decades. Two different scenarios were developed to es-timate the potential impact of this growth on UB’s GHG emissions. A Worst-case scenario estimates that UB’s carbon footprint could increase to 240,000 MT CO2-e, while a Business As Usual scenario predicts an increase to nearly 200,000 MT CO2-e. Either scenario dramatizes how aggressively UB must address its pro-posed growth in order to achieve climate neutrality.
1. Introduction
27:00 2 UB_CAP_FINAL_September15.doc-9/15/2009
Purchased Electricity, 51.9
Purchased Steam/Chilled Water, 2.3
Stationary Combustion, 17.8
Refrigerants, 0.9
Fleet, 3.1
Student Commuters, 8.2
Faculty/Staff Commuters, 6.2
Air Travel, 9.4Solid Waste, 0.3
Figure 1: UB’s GHG Footprint by Emissions Source Actions to Mitigate Emissions GHG Emissions To achieve climate neutrality by 2030, UB will undertake dozens of actions to mitigate GHG emissions, including those related to buildings and land use, trans-portation, and materials used on campus. Buildings and land-use emissions will be mitigated through retrofits to increase the efficiency of existing buildings, high performance design of new buildings, improved operations and management, and behavioral change. An immediate priority is to improve sub-metering and benchmarking so that inefficient buildings can be targeted for upgrades and both managers and users can better understand energy use campus-wide. UB’s design guidelines will be updated to specify LEED Gold certification – and Platinum when possible – for all new facilities. Transportation emissions will be mitigated through: upgrades to the campus fleet; transportation demand management (TDM) initiatives to shift commuters from single-occupancy vehicles (SOVs) to carpooling, public transportation, bicycling, and walking; the introduction of flexible work schedules and telecommuting; and, offsetting all emissions associated with university air travel. These actions will need to be implemented in a coordinated way since commuters must have attrac-tive alternatives if they are going to shift transportation modes. UB will work with local authorities to improve public transportation to all three campuses.
1. Introduction
27:00 3 UB_CAP_FINAL_September15.doc-9/15/2009
Finally, efforts will be taken campus-wide to reduce the use of materials, purchase green products, and increase recycling and reduce the generation of waste. The impact of these initiatives was evaluated in three additional scenarios (see Figure 2), all of which address the proposed expansion of UB. The Mitigation Scenario 3 would allow UB to achieve climate neutrality by purchasing offsets for the 52,000 MT of emissions remaining after implementation of all CAP actions.
Figure 2: Future Emissions Scenarios
Achieving Climate Neutrality: The Role of Research, Teaching, and
the Community UB exists to create knowledge, share it with students, and place it in service of community and society. To create the cultural change needed to achieve cli-mate neutrality, UB will expand sustainability research at UB, integrate sustai-nability into UB’s educational program, engage and partner with the communi-ty, and better communicate the climate action mission to UB students, staff, faculty, and the Western New York community. Immediate actions will form a Sustainability in Higher Education Taskforce, create an inventory of UB’s climate change and sustainability research efforts, and produce a consolidated web-based sustainability resource. Ultimately, UB will serve as a center of sustainability innovation for the region, where new ideas and strategies to mitigate climate change are developed, tested, imple-mented, and rolled out to the community.
20072030
Mitigation Scenario 3
Mitigation Scenario 2
Mitigation Scenario 1
BAU
Worst-case
0
50,000
100,000
150,000
200,000
250,000
MT
CO
2-e
Year
1. Introduction
27:00 4 UB_CAP_FINAL_September15.doc-9/15/2009
Financing Climate Neutrality UB will invest significant time and money to achieve climate neutrality. But working toward climate neutrality also has potential to improve the University’s bottom-line as well as to benefit the environment. Efficiency efforts already save UB an estimated $9 million per year in energy costs. Future savings will be at least partially devoted to the climate neutrality program, either through the devel-opment of a revolving loan fund or an alternative mechanism. Additional funding for climate change mitigation projects will come from internal pools of capital, the creation of new funding streams, and through grant/loan pro-grams and partnerships with businesses and non-profits. As an immediate action, UB will dedicate a staff member to monitor and pursue opportunities to finance climate neutrality. Plan Implementation: Allocating Responsibility and Tracking
Progress All members of the UB community must play their part in achieving climate neu-trality. Climate change and sustainability awareness need to be woven into the fabric of the university, permeating all aspects of daily life. The CAP outlines specific roles and responsibilities for:
Senior leadership; UB’s senior sustainability officer; The Environmental Stewardship Committee; University Facilities; UB Green; Sustainability coordinators; Faculty; Staff; and Students.
An immediate priority is hiring (or designating) a senior sustainability officer. This individual will have both an operational and an academic role, connecting two major elements of the university structure. Staff will be identified to support the senior sustainability officer. Additionally, the development of a sustainability coordinators program will place implementers of the climate neutrality program in each business unit, department, and residence hall on campus. The ESC will evaluate and share UB’s progress in achieving neutrality with:
Regular surveys of the UB community to track awareness and engagement with climate neutrality and to understand drivers of environmental beha-vior;
1. Introduction
27:00 5 UB_CAP_FINAL_September15.doc-9/15/2009
Annual updates to the CAP, with an annual public meeting to review miti-gation measures and the results of the recent year’s inventory;
Accountability – holding responsible parties (identified in the mitigation tables) to interim targets outlined in each successive version of the CAP;
Regular reports to AASHE, outlining mitigation measures implemented and overall progress towards meeting interim and final targets; and
Participation in events organized by campus sustainability organizations, to compare progress with other institutions and share ideas.
UB’s commitment to climate neutrality will be achieved through resource-efficient growth, operational efficiency, and long-term planning and innovation. By reducing its resource needs, producing a greater share of energy on campus, and fostering a culture of innovation and sustainability, UB will become a leaner, fitter, and more adaptable organization. Achieving climate neutrality is a goal that will guide and shape UB as it strives to increase academic prominence in a rapidly changing world.
27:00 1-1 UB_CAP_FINAL_September15.doc-9/15/2009
In this Chapter: 1. Review of UB’s climate neutrality commitment, the ACUPCC process,
and UB’s progress to-date 2. Outline of UB’s Climate Action Plan (CAP) goals, structure, and content
Introduction
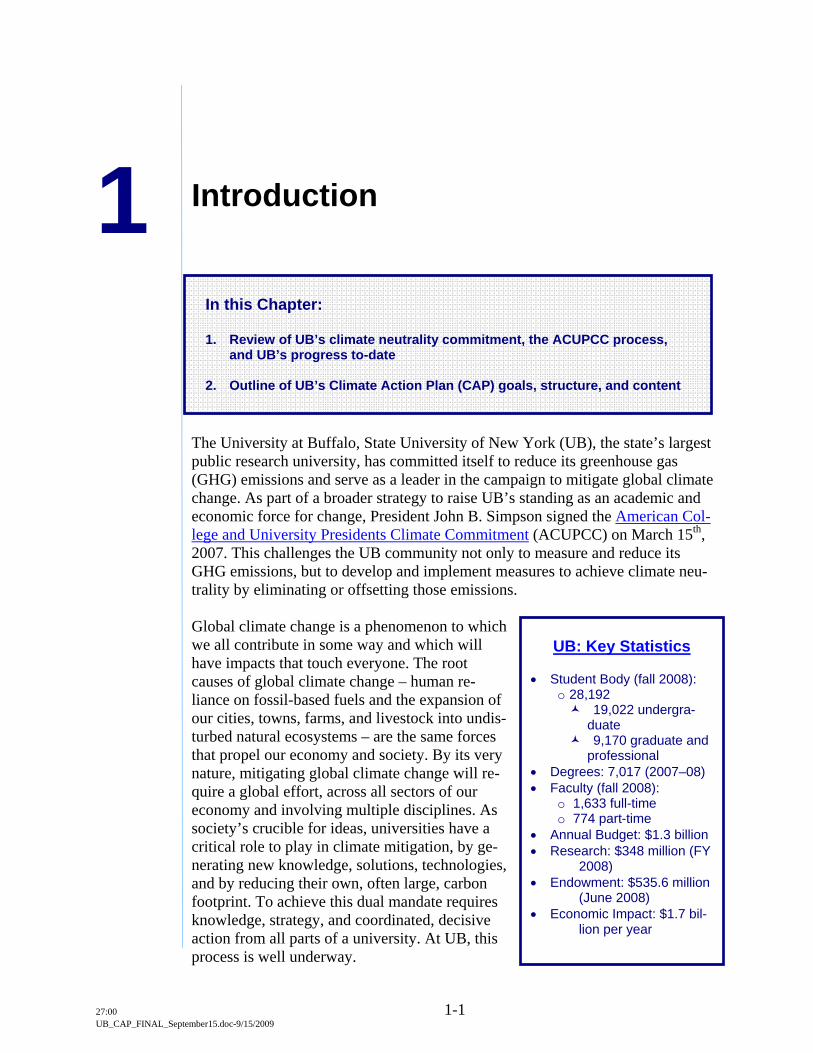
The University at Buffalo, State University of New York (UB), the state’s largest public research university, has committed itself to reduce its greenhouse gas (GHG) emissions and serve as a leader in the campaign to mitigate global climate change. As part of a broader strategy to raise UB’s standing as an academic and economic force for change, President John B. Simpson signed the American Col-lege and University Presidents Climate Commitment (ACUPCC) on March 15th, 2007. This challenges the UB community not only to measure and reduce its GHG emissions, but to develop and implement measures to achieve climate neu-trality by eliminating or offsetting those emissions. Global climate change is a phenomenon to which we all contribute in some way and which will have impacts that touch everyone. The root causes of global climate change – human re-liance on fossil-based fuels and the expansion of our cities, towns, farms, and livestock into undis-turbed natural ecosystems – are the same forces that propel our economy and society. By its very nature, mitigating global climate change will re-quire a global effort, across all sectors of our economy and involving multiple disciplines. As society’s crucible for ideas, universities have a critical role to play in climate mitigation, by ge-nerating new knowledge, solutions, technologies, and by reducing their own, often large, carbon footprint. To achieve this dual mandate requires knowledge, strategy, and coordinated, decisive action from all parts of a university. At UB, this process is well underway.
1
UB: Key Statistics
• Student Body (fall 2008):
o 28,192 19,022 undergra-duate
9,170 graduate and professional
• Degrees: 7,017 (2007–08) • Faculty (fall 2008):
o 1,633 full-time o 774 part-time
• Annual Budget: $1.3 billion • Research: $348 million (FY
2008) • Endowment: $535.6 million
(June 2008) • Economic Impact: $1.7 bil-
lion per year
1. Introduction
27:00 1-2 UB_CAP_FINAL_September15.doc-9/15/2009
1.1 UB, the ACUPCC and Climate Change UB can take pride in a long history of environmental stewardship. From early ef-forts to boost the energy efficiency of UB’s buildings through to the recent Greener Shade of Blue campaign, UB has established a reputation as an environ-mental leader in the already-progressive university sector. In addition to being a logical next step in UB’s ongoing work of environmental action, the CAP also arises from a multi-part process to which President Simpson committed the university when he signed the ACUPCC. The formal release of the CAP does not mark the end of the ACUPCC process, but rather serves an impor-tant milestone. The hard work – implementing sustained, structural change to achieve climate neutrality – is only beginning. 1.2 ACUPCC Requirements As a signatory to the ACUPCC, UB has committed to five objectives:
Creating institutional structures to guide the development and implementa-tion of a plan to achieve climate neutrality.
Immediately implementing at least two tangible actions (from a list of seven) aimed at reducing UB’s carbon footprint.
Completing a comprehensive baseline inventory of all GHG emissions, with bi-annual updates.
Developing an institutional action plan (CAP) to become climate neutral. Releasing the inventory, CAP, and periodic progress reports to the public
via the Association for the Advancement of Sustainability in Higher Edu-cation’s (AASHE’s) webpage.
The first three are complete, and the public release of this document on September 15th, 2009 constitutes the completion of the fourth. As the CAP is implemented over the coming years, periodic updates will be provided to AASHE, as outlined above in the final ACUPCC requirement. 1.2.1 Progress: The Environmental Stewardship Committee To accomplish the first objective – creating institutional structures to guide the climate neutrality process – UB formed the Environmental Stewardship Commit-tee (ESC) in November of 2007. The ESC is chaired by Robert G. Shibley, Senior Advisor to the President for Campus Planning and Design, and a professor of Ar-chitecture and planning. The committee is composed of faculty, staff, and stu-dents, each of whom represents one of a number of institutional units with the budgetary and operational capacity needed to help implement some element of the plan. In this way the ESC connected the development of the plan with the ability to put it into action.
1. Introduction
27:00 1-3 UB_CAP_FINAL_September15.doc-9/15/2009
The ESC, which meets on a monthly basis, is supported by a set of six subcom-mittees, each with responsibility for a functionally discrete area of university op-erations. These include subcommittees on:
Energy Transportation Materials Information Technology and Human Resources Outreach and Communication Research, Teaching, and Public Service
Typically, each subcommittee is chaired by a member of the full ESC. The sub-committees include other members of the full committee, but also involve addi-tional staff from campus units with operational impact on the climate neutrality mission, faculty with relevant expertise, and interested students. These subcommittees have done much of the work to develop the analysis and recommendations embedded in the plan. They have represented indispensable institu-tional knowledge relevant to meeting the cli-mate neutrality challenge. 1.2.2 Progress: Tangible Actions The second objective – immediately imple-menting two tangible actions to mitigate UB’s GHG emissions – has been achieved. Seven measures were identified by the ACUPCC:
Establish a policy that all new cam-pus construction will be built to at least the U.S. Green Building Council’s LEED Silver standard or equivalent.
Adopt an energy-efficient appliance purchasing policy requiring pur-chase of ENERGY STAR certified products in all areas for which such ratings exist.
Establish a policy to offset all greenhouse gas emissions generated by air travel paid for by the institution.
Encourage use of and provide access to public transportation for all fa-culty, staff, students and visitors at the institution.
Within one year of signing this document, begin purchasing or produc-ing at least 15 percent of the institution’s electricity consumption from renewable sources.
Establish a policy or a committee that supports climate and sustainabil-ity shareholder proposals at companies where the institution's endow-ment is invested.
Carbon or
Greenhouse Gas?
Not all ‘greenhouse gases’ (GHGs) contain carbon – how-ever, it is common practice to re-fer to different greenhouse gas-es in ‘carbon dioxide equiva-lents,’ to enable easy compari-son. For the purposes of the CAP, the terms ‘carbon’ and ‘GHG’ can be viewed as synonymous, unless otherwise specified.
1. Introduction
27:00 1-4 UB_CAP_FINAL_September15.doc-9/15/2009
Participate in the waste minimization component of the national Re-cycleMania competition, and adopt three or more associated measures to reduce waste.
To date, UB has implemented three of the seven identified priority measures, ex-ceeding the ACUPCC requirement. UB has committed to building all buildings to LEED Silver or higher, building on the development of UB’s High Performance Design Guidelines, published in 2004. The UB Stampede and shuttle system pro-vides free access to public transportation and provides for travel between and around UB’s three campuses (Figure 1-1). As part of meeting New York State Executive Order 111, UB purchases Renewable Energy Credits (RECs) for 15 percent of its annual electricity use, and will purchase RECs for 20 percent of its energy by 2010. UB is in the process of implementing two other priority measures. We have man-dated that all computers purchased by the university be Energy Star-labeled and will be followed by implementation of an appliance purchasing policy mandating purchase of Energy Star-labeled products wherever such labeling exists (in-line with Executive Order 111). In early 2009, UB participated in the RecycleMania program. New waste minimization efforts will be undertaken to meet the require-ments of this measure and are further discussed in Section 3.4 of the CAP. 1.2.3 Progress: Greenhouse Gas Inventory The third APUCCC requirement is to prepare an inventory of campus GHG emis-sions. In fact, UB Green, UB’s campus sustainability office, has been working for several years to develop a comprehensive GHG inventory, incorporating data from 1997 onward, with a baseline year of 2006. The inventory includes emis-sions from all three UB campuses (see Figure 1-1). The inventory was first pub-lished as part of the UB Green Climate Action Report, released in January 2008. This initial inventory effort, prepared per ACUPCC guidelines using the Clean Air-Cool Planet (CACP) Campus Carbon Calculator (v5.0), has been subsequent-ly updated to include data as recent as 2007. The details of this process, including the types of emissions included in the inventory and the methods employed, are discussed in Chapter 2. 1.2.4 Progress: The Climate Action Plan (CAP) This document – the CAP – is UB’s response to ACUPCC’s fourth requirement: developing and implementing a plan to achieve climate neutrality. As such, this plan represents a milestone, as well as a new point of departure for UB’s effort to dramatically reduce its campus carbon footprint. 1.2.5 Progress: Public Release of Information Regarding the fifth ACUPCC requirement, UB publishes its inventory on the AASHE site. The CAP and future progress reports will also be posted there.
1. Introduction
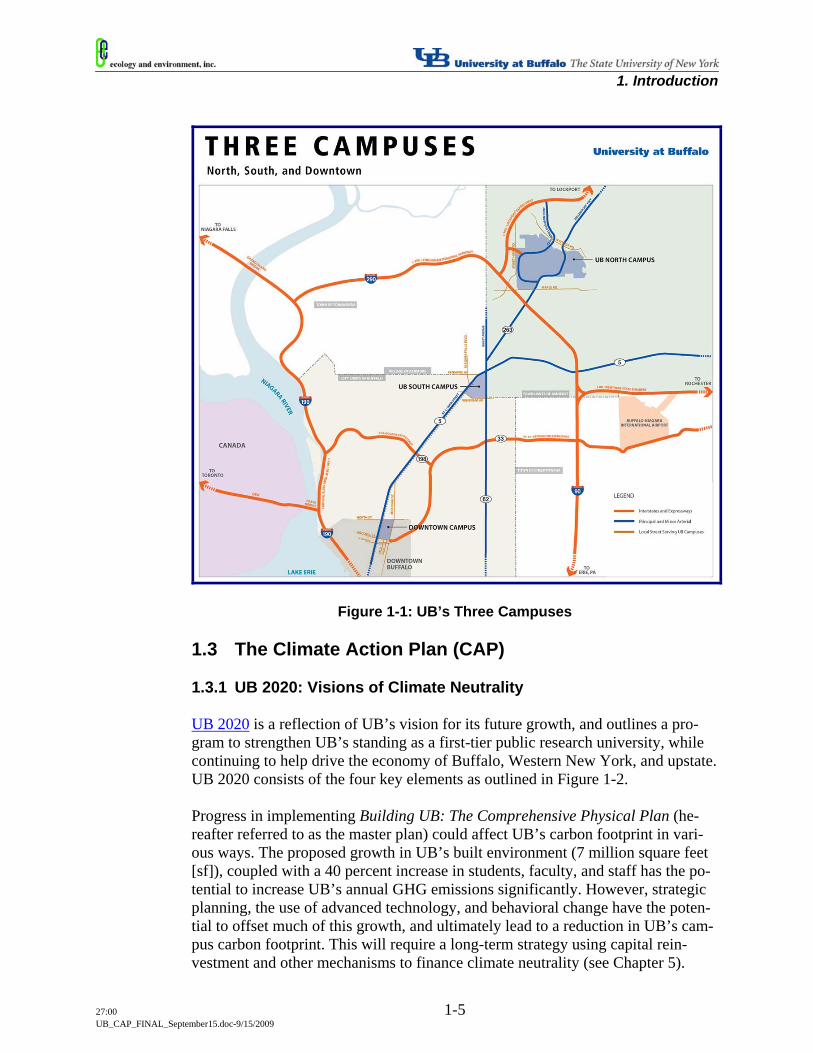
27:00 1-5 UB_CAP_FINAL_September15.doc-9/15/2009
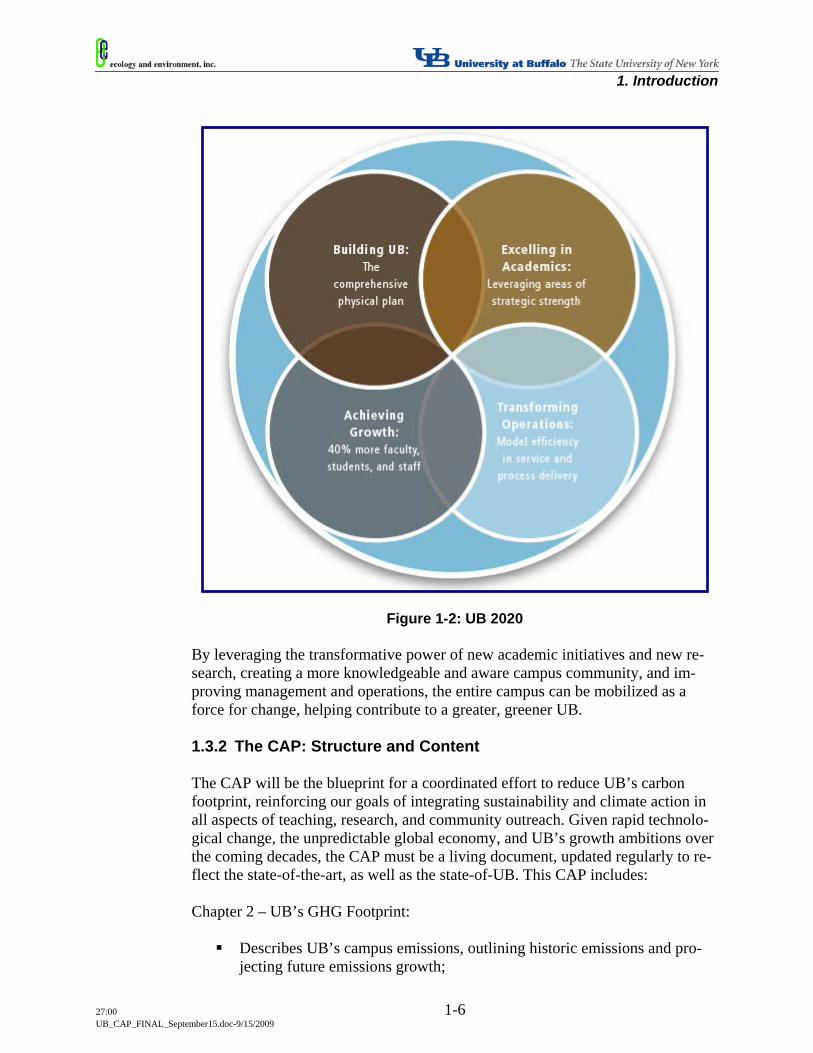
Figure 1-1: UB’s Three Campuses 1.3 The Climate Action Plan (CAP) 1.3.1 UB 2020: Visions of Climate Neutrality UB 2020 is a reflection of UB’s vision for its future growth, and outlines a pro-gram to strengthen UB’s standing as a first-tier public research university, while continuing to help drive the economy of Buffalo, Western New York, and upstate. UB 2020 consists of the four key elements as outlined in Figure 1-2. Progress in implementing Building UB: The Comprehensive Physical Plan (he-reafter referred to as the master plan) could affect UB’s carbon footprint in vari-ous ways. The proposed growth in UB’s built environment (7 million square feet [sf]), coupled with a 40 percent increase in students, faculty, and staff has the po-tential to increase UB’s annual GHG emissions significantly. However, strategic planning, the use of advanced technology, and behavioral change have the poten-tial to offset much of this growth, and ultimately lead to a reduction in UB’s cam-pus carbon footprint. This will require a long-term strategy using capital rein-vestment and other mechanisms to finance climate neutrality (see Chapter 5).
1. Introduction
27:00 1-6 UB_CAP_FINAL_September15.doc-9/15/2009
Figure 1-2: UB 2020
By leveraging the transformative power of new academic initiatives and new re-search, creating a more knowledgeable and aware campus community, and im-proving management and operations, the entire campus can be mobilized as a force for change, helping contribute to a greater, greener UB. 1.3.2 The CAP: Structure and Content The CAP will be the blueprint for a coordinated effort to reduce UB’s carbon footprint, reinforcing our goals of integrating sustainability and climate action in all aspects of teaching, research, and community outreach. Given rapid technolo-gical change, the unpredictable global economy, and UB’s growth ambitions over the coming decades, the CAP must be a living document, updated regularly to re-flect the state-of-the-art, as well as the state-of-UB. This CAP includes: Chapter 2 – UB’s GHG Footprint:
Describes UB’s campus emissions, outlining historic emissions and pro-jecting future emissions growth;
1. Introduction
27:00 1-7 UB_CAP_FINAL_September15.doc-9/15/2009
Identifies opportunities for improving the measurement and tracking of campus emissions;
Chapter 3 – Actions to Mitigate Emissions GHG Emissions:
Presents and evaluates a number of proposed mitigation actions in build-ings and land use, transportation, and materials;
Evaluates the potential impact of the initiatives, in comparison to UB’s projected emissions growth;
Chapter 4 – Achieving Climate Neutrality: The Role of Research, Teaching, and the Community:
Discusses opportunities to spur cultural change and establish UB as a re-gional climate leader;
Outlines and approach to integrating sustainability into education and re-search; and,
Strategizes ways to engage the community, improve communications and outreach, and promote behavioral change;
Chapter 5 – Financing Climate Neutrality:
Explores the types and potential sources of financing that UB can leverage to achieve climate neutrality; and
Chapter 6 – Plan Implementation: Allocating Responsibility and Tracking Progress:
Delineates responsibility for implementing change to achieve climate neu-trality by identifying key campus actors, tracking mechanisms, and interim targets.
While this first iteration of the CAP attempts to address the growth of the Univer-sity proposed in the UB 2020 master plan, subsequent updates will more accurate-ly reflect this growth and its impact on UB’s carbon footprint.
27:00 2-1 UB_CAP_FINAL_September15.doc-9/15/2009
In this Chapter: 1. UB’s greenhouse gas emissions inventory and the system boundaries
employed 2. Opportunities to improve UB’s inventory 3. Baseline emissions projections for the full master plan build-out
UB’s Greenhouse Gas Footprint
The first step in understanding the quantity and sources of GHG emissions at UB is to prepare a GHG inventory. An inventory quantifies where emissions are gen-erated on and off campus, and can help target efforts to reduce GHG emissions. UB Green invested considerable time and effort in preparing a baseline GHG in-ventory for UB. Since the public release of UB’s emissions inventory in the UB Green Climate Action Report (CAR) in January 2008, UB Green has refined the inventory and incorporated new and recently-updated data. Inventory updates are published on the AASHE website. 2.1 Technical Concepts and Approach: Baseline Inventory The UB GHG inventory follows standard ACUPCC guidelines by seeking to in-clude all direct (and some indirect) emissions of the six Kyoto gases:
Carbon dioxide (CO2); Methane (CH4); Nitrous oxide (N2O); Hydrofluorocarbons (HFCs); Perfluorocarbons (PFCs); and Sulphur hexafluoride (SF6).
Each of these gases contributes to global climate change, but not equally. or ex-ample, a molecule of methane has 25 times the climate forcing (or global warm-ing) impact of a molecule of carbon dioxide. Since carbon dioxide is emitted in much larger quantities that the other five Kyoto gases, GHG inventories frequent-ly report their emissions in units of carbon dioxide equivalents (also known as
2
2. UB’s Greenhouse Gas Footprint
27:00 2-2 UB_CAP_FINAL_September15.doc-9/15/2009
global warming potential), or CO2-e, which helps normalize the impacts of each gas into a common unit. In other words, one ton of methane would be equal to 25 tons of CO2-e. This terminology is used throughout the CAP to reduce confusion and simplify any quantitative comparisons. 2.1.1 Emissions Scopes and ACUPCC Requirements It is common inventory practice to place different sources of emissions into one of three categories, or scopes, based on the origin of the emissions and the degree of control an organization has over their production. To conform to standard GHG reporting practices, this approach is used throughout the CAP. As defined in the ACUPCC Implementation Guide: Scope 1: “…refers to direct GHG emissions occurring from sources that are owned or controlled by the institution, including: on-campus stationary combustion of fossil fuels; mobile combustion of fossil fuels by institution owned/controlled vehicles; and "fugitive" emis-sions. Fugitive emissions result from intentional or unintentional releases of GHGs, in-cluding the leakage of HFCs from refrigeration and air conditioning equipment as well as the release of CH4 from institution-owned farm animals.” Scope 2: “…refers to indirect emissions generated in the production of electricity consumed by the institution.” Scope 3: “…refers to all other indirect emissions - those that are a consequence of the activities of the institution, but occur from sources not owned or controlled by the institution.” All inventories prepared by ACUPCC signatories must include, at a minimum:
All Scope 1 emissions, including refrigerants; All Scope 2 emissions; Scope 3 emissions from faculty, staff, and student commuting; and Scope 3 emissions from air travel paid for by or through the university.
The ACUPCC encourages signatories to include additional Scope 3 emission sources (such as waste hauling and disposal, lifecycle product emissions, and tra-vel to and from the university for vacations, reunions, etc.) in their inventories wherever available data allow. Scope 3 emissions are often more difficult to quan-tify, as standard methods for quantification do not often exist.
2. UB’s Greenhouse Gas Footprint
27:00 2-3 UB_CAP_FINAL_September15.doc-9/15/2009
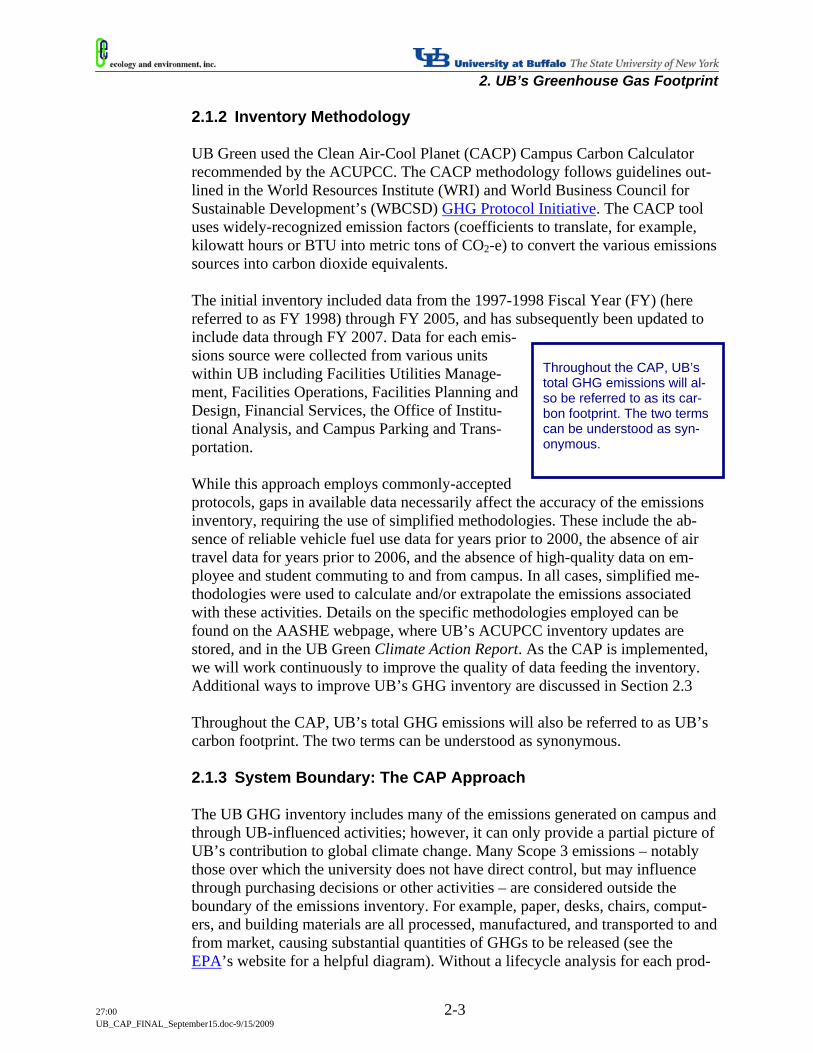
2.1.2 Inventory Methodology UB Green used the Clean Air-Cool Planet (CACP) Campus Carbon Calculator recommended by the ACUPCC. The CACP methodology follows guidelines out-lined in the World Resources Institute (WRI) and World Business Council for Sustainable Development’s (WBCSD) GHG Protocol Initiative. The CACP tool uses widely-recognized emission factors (coefficients to translate, for example, kilowatt hours or BTU into metric tons of CO2-e) to convert the various emissions sources into carbon dioxide equivalents. The initial inventory included data from the 1997-1998 Fiscal Year (FY) (here referred to as FY 1998) through FY 2005, and has subsequently been updated to include data through FY 2007. Data for each emis-sions source were collected from various units within UB including Facilities Utilities Manage-ment, Facilities Operations, Facilities Planning and Design, Financial Services, the Office of Institu-tional Analysis, and Campus Parking and Trans-portation. While this approach employs commonly-accepted protocols, gaps in available data necessarily affect the accuracy of the emissions inventory, requiring the use of simplified methodologies. These include the ab-sence of reliable vehicle fuel use data for years prior to 2000, the absence of air travel data for years prior to 2006, and the absence of high-quality data on em-ployee and student commuting to and from campus. In all cases, simplified me-thodologies were used to calculate and/or extrapolate the emissions associated with these activities. Details on the specific methodologies employed can be found on the AASHE webpage, where UB’s ACUPCC inventory updates are stored, and in the UB Green Climate Action Report. As the CAP is implemented, we will work continuously to improve the quality of data feeding the inventory. Additional ways to improve UB’s GHG inventory are discussed in Section 2.3 Throughout the CAP, UB’s total GHG emissions will also be referred to as UB’s carbon footprint. The two terms can be understood as synonymous. 2.1.3 System Boundary: The CAP Approach The UB GHG inventory includes many of the emissions generated on campus and through UB-influenced activities; however, it can only provide a partial picture of UB’s contribution to global climate change. Many Scope 3 emissions – notably those over which the university does not have direct control, but may influence through purchasing decisions or other activities – are considered outside the boundary of the emissions inventory. For example, paper, desks, chairs, comput-ers, and building materials are all processed, manufactured, and transported to and from market, causing substantial quantities of GHGs to be released (see the EPA’s website for a helpful diagram). Without a lifecycle analysis for each prod-
Throughout the CAP, UB’s total GHG emissions will al-so be referred to as its car-bon footprint. The two terms can be understood as syn-onymous.
2. UB’s Greenhouse Gas Footprint
27:00 2-4 UB_CAP_FINAL_September15.doc-9/15/2009
uct and the material used to produce it, it is difficult to accurately quantify this portion of UB’s carbon footprint. While many Scope 3 emissions are not quantified in UB’s GHG inventory, they are still considered when discussing UB’s overall sustainability and climate change mitigation objectives. Though we may not have operational control over the factory producing the paper we purchase for printing, we can select environ-mentally preferable paper and reduce our overall printing volume. This has a cor-responding impact on reducing overall global GHG emissions. Initiatives address-ing these Scope 3 emissions are described in Section 3.4.
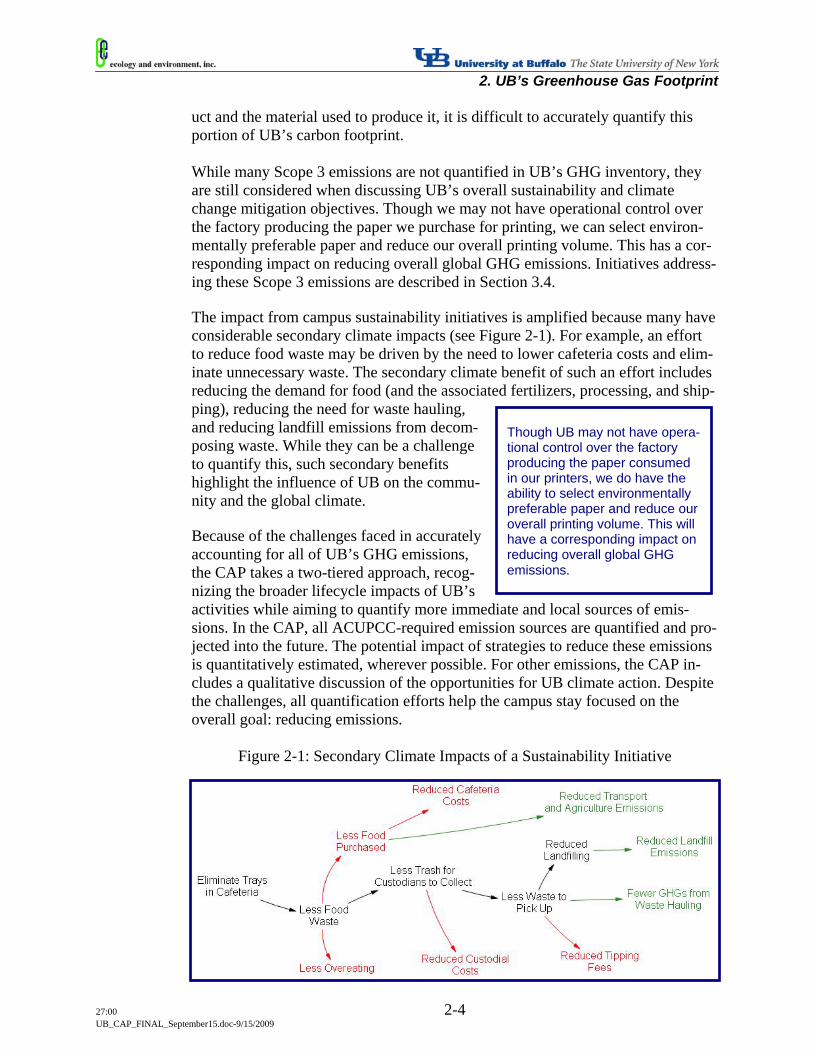
The impact from campus sustainability initiatives is amplified because many have considerable secondary climate impacts (see Figure 2-1). For example, an effort to reduce food waste may be driven by the need to lower cafeteria costs and elim-inate unnecessary waste. The secondary climate benefit of such an effort includes reducing the demand for food (and the associated fertilizers, processing, and ship-ping), reducing the need for waste hauling, and reducing landfill emissions from decom-posing waste. While they can be a challenge to quantify this, such secondary benefits highlight the influence of UB on the commu-nity and the global climate. Because of the challenges faced in accurately accounting for all of UB’s GHG emissions, the CAP takes a two-tiered approach, recog-nizing the broader lifecycle impacts of UB’s activities while aiming to quantify more immediate and local sources of emis-sions. In the CAP, all ACUPCC-required emission sources are quantified and pro-jected into the future. The potential impact of strategies to reduce these emissions is quantitatively estimated, wherever possible. For other emissions, the CAP in-cludes a qualitative discussion of the opportunities for UB climate action. Despite the challenges, all quantification efforts help the campus stay focused on the overall goal: reducing emissions.
Figure 2-1: Secondary Climate Impacts of a Sustainability Initiative
Though UB may not have opera-tional control over the factory producing the paper consumed in our printers, we do have the ability to select environmentally preferable paper and reduce our overall printing volume. This will have a corresponding impact on reducing overall global GHG emissions.
2. UB’s Greenhouse Gas Footprint
27:00 2-5 UB_CAP_FINAL_September15.doc-9/15/2009
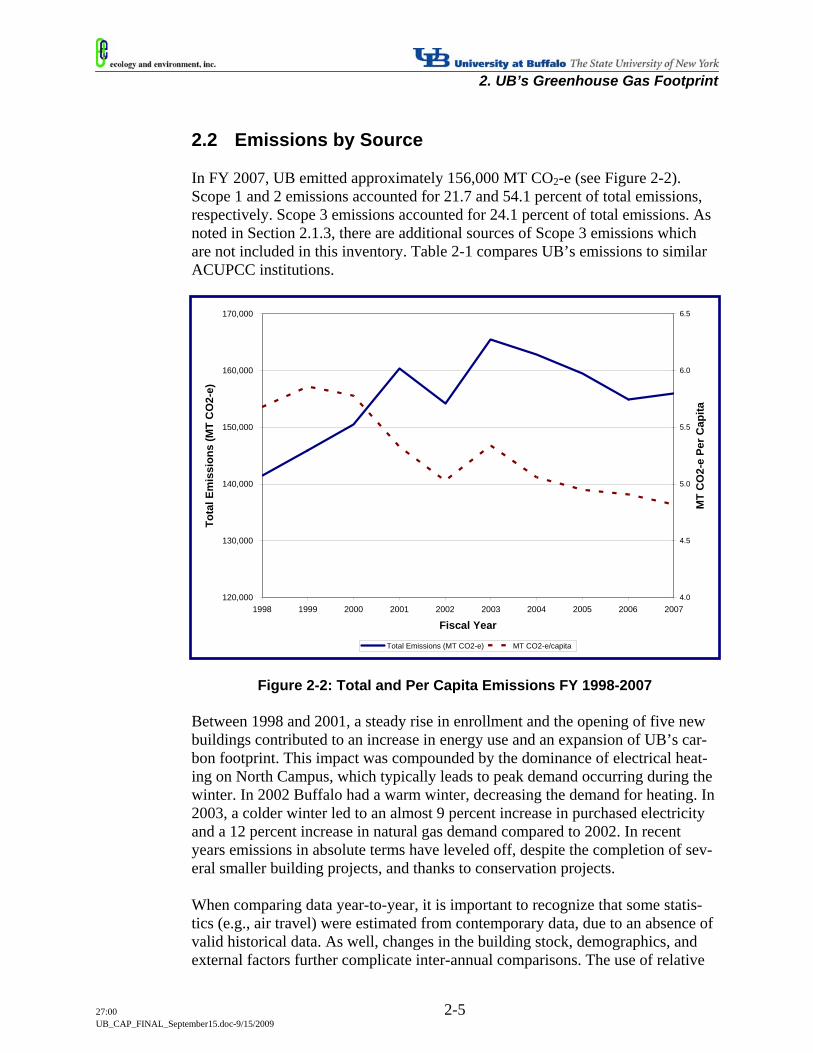
2.2 Emissions by Source In FY 2007, UB emitted approximately 156,000 MT CO2-e (see Figure 2-2). Scope 1 and 2 emissions accounted for 21.7 and 54.1 percent of total emissions, respectively. Scope 3 emissions accounted for 24.1 percent of total emissions. As noted in Section 2.1.3, there are additional sources of Scope 3 emissions which are not included in this inventory. Table 2-1 compares UB’s emissions to similar ACUPCC institutions.
Figure 2-2: Total and Per Capita Emissions FY 1998-2007
Between 1998 and 2001, a steady rise in enrollment and the opening of five new buildings contributed to an increase in energy use and an expansion of UB’s car-bon footprint. This impact was compounded by the dominance of electrical heat-ing on North Campus, which typically leads to peak demand occurring during the winter. In 2002 Buffalo had a warm winter, decreasing the demand for heating. In 2003, a colder winter led to an almost 9 percent increase in purchased electricity and a 12 percent increase in natural gas demand compared to 2002. In recent years emissions in absolute terms have leveled off, despite the completion of sev-eral smaller building projects, and thanks to conservation projects. When comparing data year-to-year, it is important to recognize that some statis-tics (e.g., air travel) were estimated from contemporary data, due to an absence of valid historical data. As well, changes in the building stock, demographics, and external factors further complicate inter-annual comparisons. The use of relative
120,000
130,000
140,000
150,000
160,000
170,000
1998 1999 2000 2001 2002 2003 2004 2005 2006 2007
Fiscal Year
Tota
l Em
issi
ons
(MT
CO
2-e)
4.0
4.5
5.0
5.5
6.0
6.5
MT
CO
2-e
Per C
apita
Total Emissions (MT CO2-e) MT CO2-e/capita
2. UB’s Greenhouse Gas Footprint
27:00 2-6 UB_CAP_FINAL_September15.doc-9/15/2009
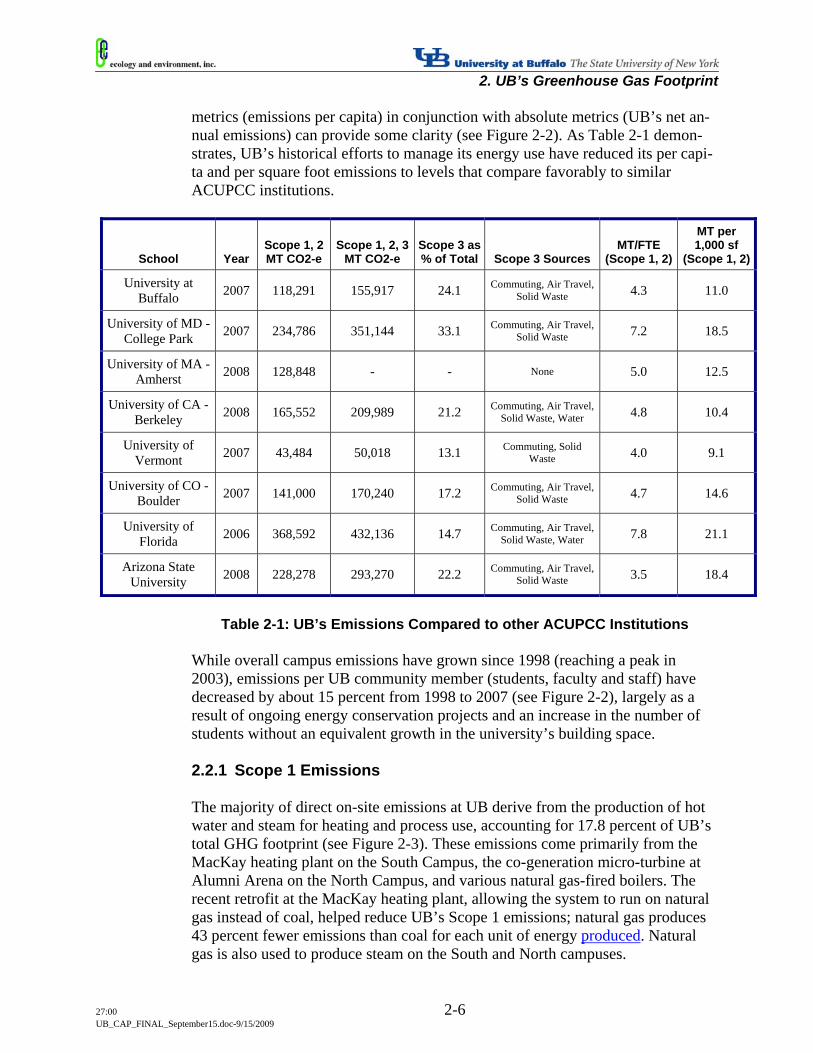
metrics (emissions per capita) in conjunction with absolute metrics (UB’s net an-nual emissions) can provide some clarity (see Figure 2-2). As Table 2-1 demon-strates, UB’s historical efforts to manage its energy use have reduced its per capi-ta and per square foot emissions to levels that compare favorably to similar ACUPCC institutions.
School Year Scope 1, 2 MT CO2-e
Scope 1, 2, 3 MT CO2-e
Scope 3 as % of Total Scope 3 Sources
MT/FTE (Scope 1, 2)
MT per 1,000 sf
(Scope 1, 2)
University at Buffalo 2007 118,291 155,917 24.1 Commuting, Air Travel,
Solid Waste 4.3 11.0
University of MD - College Park 2007 234,786 351,144 33.1 Commuting, Air Travel,
Solid Waste 7.2 18.5
University of MA - Amherst 2008 128,848 - - None 5.0 12.5
University of CA - Berkeley 2008 165,552 209,989 21.2 Commuting, Air Travel,
Solid Waste, Water 4.8 10.4
University of Vermont 2007 43,484 50,018 13.1 Commuting, Solid
Waste 4.0 9.1
University of CO - Boulder 2007 141,000 170,240 17.2 Commuting, Air Travel,
Solid Waste 4.7 14.6
University of Florida 2006 368,592 432,136 14.7 Commuting, Air Travel,
Solid Waste, Water 7.8 21.1
Arizona State University 2008 228,278 293,270 22.2 Commuting, Air Travel,
Solid Waste 3.5 18.4
Table 2-1: UB’s Emissions Compared to other ACUPCC Institutions
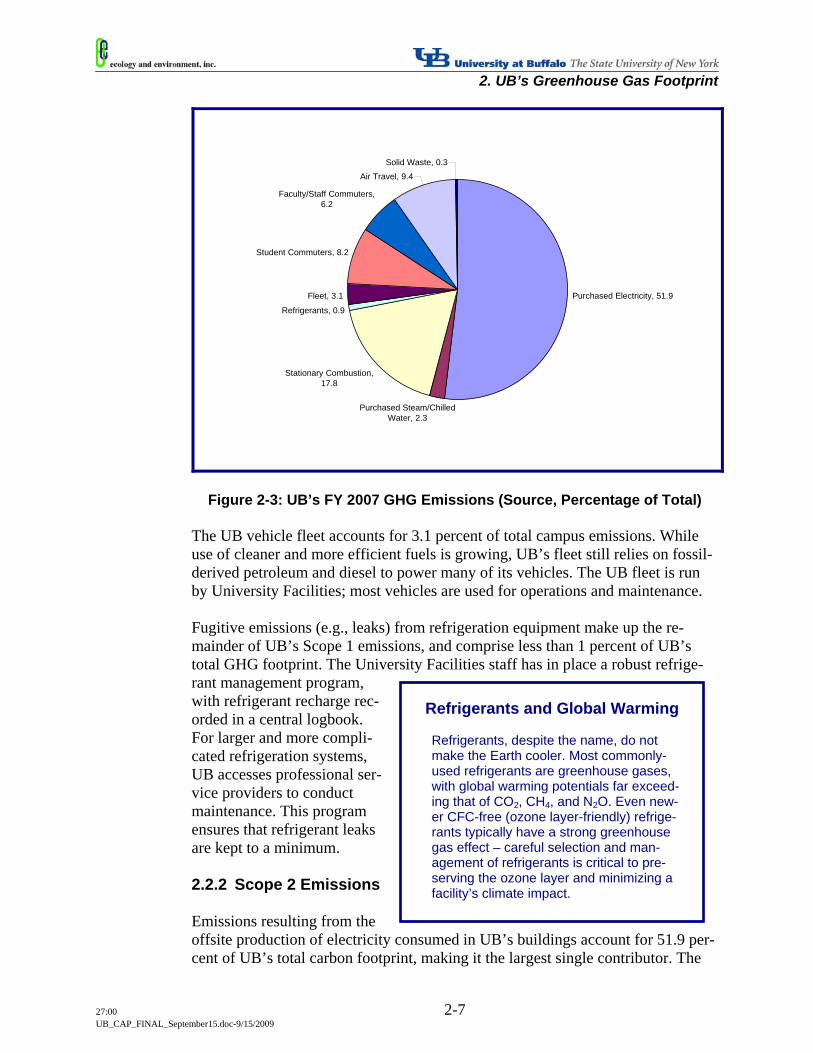
While overall campus emissions have grown since 1998 (reaching a peak in 2003), emissions per UB community member (students, faculty and staff) have decreased by about 15 percent from 1998 to 2007 (see Figure 2-2), largely as a result of ongoing energy conservation projects and an increase in the number of students without an equivalent growth in the university’s building space. 2.2.1 Scope 1 Emissions The majority of direct on-site emissions at UB derive from the production of hot water and steam for heating and process use, accounting for 17.8 percent of UB’s total GHG footprint (see Figure 2-3). These emissions come primarily from the MacKay heating plant on the South Campus, the co-generation micro-turbine at Alumni Arena on the North Campus, and various natural gas-fired boilers. The recent retrofit at the MacKay heating plant, allowing the system to run on natural gas instead of coal, helped reduce UB’s Scope 1 emissions; natural gas produces 43 percent fewer emissions than coal for each unit of energy produced. Natural gas is also used to produce steam on the South and North campuses.
2. UB’s Greenhouse Gas Footprint
27:00 2-7 UB_CAP_FINAL_September15.doc-9/15/2009
Purchased Electricity, 51.9
Purchased Steam/Chilled Water, 2.3
Stationary Combustion, 17.8
Refrigerants, 0.9
Fleet, 3.1
Student Commuters, 8.2
Faculty/Staff Commuters, 6.2
Air Travel, 9.4
Solid Waste, 0.3
Figure 2-3: UB’s FY 2007 GHG Emissions (Source, Percentage of Total) The UB vehicle fleet accounts for 3.1 percent of total campus emissions. While use of cleaner and more efficient fuels is growing, UB’s fleet still relies on fossil-derived petroleum and diesel to power many of its vehicles. The UB fleet is run by University Facilities; most vehicles are used for operations and maintenance. Fugitive emissions (e.g., leaks) from refrigeration equipment make up the re-mainder of UB’s Scope 1 emissions, and comprise less than 1 percent of UB’s total GHG footprint. The University Facilities staff has in place a robust refrige-rant management program, with refrigerant recharge rec-orded in a central logbook. For larger and more compli-cated refrigeration systems, UB accesses professional ser-vice providers to conduct maintenance. This program ensures that refrigerant leaks are kept to a minimum. 2.2.2 Scope 2 Emissions Emissions resulting from the offsite production of electricity consumed in UB’s buildings account for 51.9 per-cent of UB’s total carbon footprint, making it the largest single contributor. The
Refrigerants and Global Warming
Refrigerants, despite the name, do not make the Earth cooler. Most commonly-used refrigerants are greenhouse gases, with global warming potentials far exceed-ing that of CO2, CH4, and N2O. Even new-er CFC-free (ozone layer-friendly) refrige-rants typically have a strong greenhouse gas effect – careful selection and man-agement of refrigerants is critical to pre-serving the ozone layer and minimizing a facility’s climate impact.
2. UB’s Greenhouse Gas Footprint
27:00 2-8 UB_CAP_FINAL_September15.doc-9/15/2009
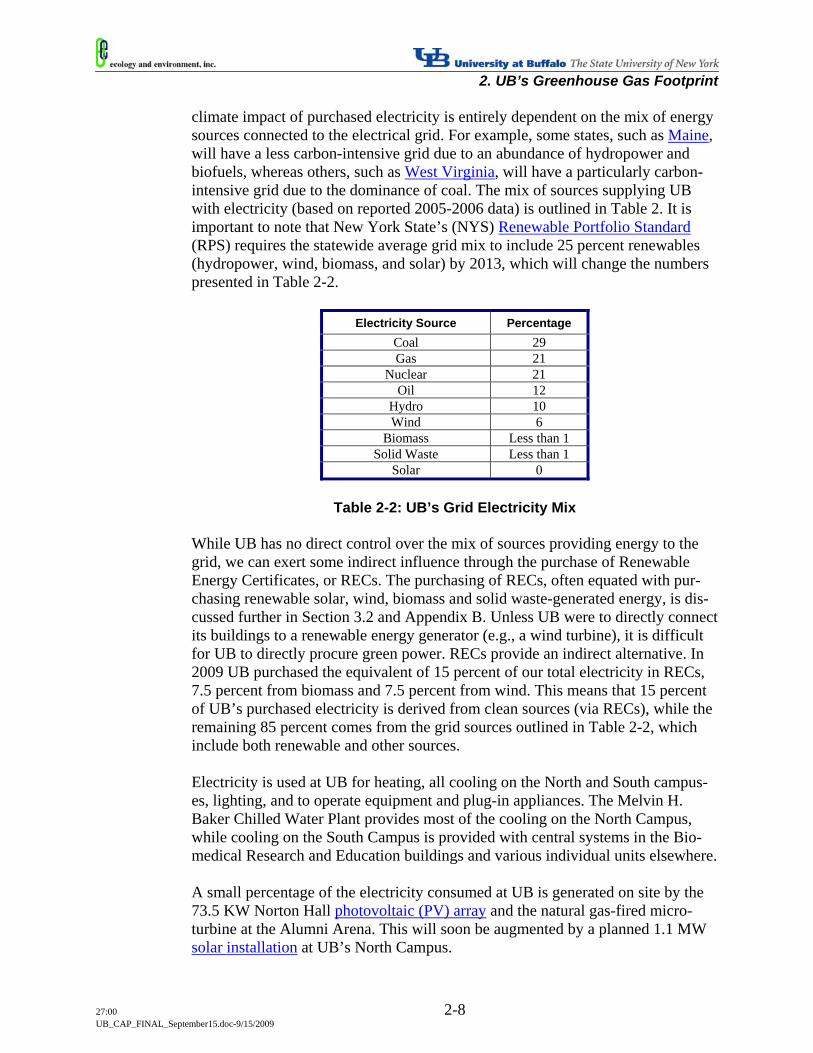
climate impact of purchased electricity is entirely dependent on the mix of energy sources connected to the electrical grid. For example, some states, such as Maine, will have a less carbon-intensive grid due to an abundance of hydropower and biofuels, whereas others, such as West Virginia, will have a particularly carbon-intensive grid due to the dominance of coal. The mix of sources supplying UB with electricity (based on reported 2005-2006 data) is outlined in Table 2. It is important to note that New York State’s (NYS) Renewable Portfolio Standard (RPS) requires the statewide average grid mix to include 25 percent renewables (hydropower, wind, biomass, and solar) by 2013, which will change the numbers presented in Table 2-2.
Electricity Source Percentage Coal 29 Gas 21
Nuclear 21 Oil 12
Hydro 10 Wind 6
Biomass Less than 1 Solid Waste Less than 1
Solar 0
Table 2-2: UB’s Grid Electricity Mix While UB has no direct control over the mix of sources providing energy to the grid, we can exert some indirect influence through the purchase of Renewable Energy Certificates, or RECs. The purchasing of RECs, often equated with pur-chasing renewable solar, wind, biomass and solid waste-generated energy, is dis-cussed further in Section 3.2 and Appendix B. Unless UB were to directly connect its buildings to a renewable energy generator (e.g., a wind turbine), it is difficult for UB to directly procure green power. RECs provide an indirect alternative. In 2009 UB purchased the equivalent of 15 percent of our total electricity in RECs, 7.5 percent from biomass and 7.5 percent from wind. This means that 15 percent of UB’s purchased electricity is derived from clean sources (via RECs), while the remaining 85 percent comes from the grid sources outlined in Table 2-2, which include both renewable and other sources. Electricity is used at UB for heating, all cooling on the North and South campus-es, lighting, and to operate equipment and plug-in appliances. The Melvin H. Baker Chilled Water Plant provides most of the cooling on the North Campus, while cooling on the South Campus is provided with central systems in the Bio-medical Research and Education buildings and various individual units elsewhere. A small percentage of the electricity consumed at UB is generated on site by the 73.5 KW Norton Hall photovoltaic (PV) array and the natural gas-fired micro-turbine at the Alumni Arena. This will soon be augmented by a planned 1.1 MW solar installation at UB’s North Campus.
2. UB’s Greenhouse Gas Footprint
27:00 2-9 UB_CAP_FINAL_September15.doc-9/15/2009
The remainder of UB’s Scope 2 emissions derive from purchased steam and chilled water for UB’s downtown medical campus. Purchased steam and chilled water is supplied by the Roswell Park Cancer Institute, and comprises 2.3 percent of UB’s GHG emissions. 2.2.3 Scope 3 Emissions As discussed in Section 2.1.1, the UB GHG inventory includes Scope 3 emissions from air travel paid for by (or booked through) the university, student and staff/faculty commuting, and the disposal of non-recycled municipal solid waste. There are many additional sources of Scope 3 emissions (e.g., transmission and distribution losses from natural gas and electricity delivery, embedded emissions in purchased goods, etc.) that are not included in the inventory. The largest source of Scope 3 emissions included in the inventory is air travel, accounting for 9.4 percent of UB’s total GHG footprint. This figure does not in-clude air travel for students traveling to and from Buffalo at the beginning and end of each semester, or during spring break and other holidays. The sheer size of this emissions source – more than 15,000 metric tons per year – highlights the in-fluence UB has on global climate change through its off-campus activities. Student and staff/faculty commuting (from home to campus) accounts for 8.2 per-cent and 6.2 percent of total emissions, respectively. The remainder of the quantified Scope 3 emissions derives from disposal of non-recycled municipal solid waste, and accounts for less than 1 percent of our total GHG footprint. This includes emissions from the decomposition of waste. UB’s waste is carted to a facility featuring methane capture for the production of elec-tricity, significantly reducing the climate impact of waste disposal. The waste emissions do not include the hauling and reprocessing of recycled materials. 2.3 Opportunities for Improving UB’s GHG Inventory There are a number of opportunities to improve UB’s GHG inventory by captur-ing new data and streamlining the data collection process. One major outcome of the CAP development process was generating awareness among key UB stake-holders of the need for improved data collection across campus. Many of the ac-tions required to reduce UB’s GHG footprint will need significant planning and investment. Taking steps to improve the quality and availability of GHG emis-sions data will facilitate the planning process and allow us to prioritize resources. 2.3.1 Scope 1 and 2 Emissions: Data Gaps and Opportunities Data availability and quality for Scope 1 and 2 emissions is acceptable, in that utility bills, metering data, fuel consumption records, and a refrigerants log pro-vide for campus-level quantification of emissions. However, increasing the granu-larity of the data collected – for example, implementing building-level utility me-
2. UB’s Greenhouse Gas Footprint
27:00 2-10 UB_CAP_FINAL_September15.doc-9/15/2009
tering – would help make the inventory more precise while allowing occupants and University Facilities staff to better understand the patterns of energy use in each building. This information can facilitate efforts to reduce campus emissions. 2.3.2 Scope 3 Emissions: Data Gaps and Opportunities For commuting and air travel emissions, data were extrapolated from administra-tive and accounting records, with assumptions made to translate these records into MT CO2-e. For air travel, only flights booked through UB’s central travel agency (predominantly flights paid for using state funds) were captured. Flights booked independently or paid for using non-state funds were not included, resulting in the underestimating of how much air travel contributed to UB’s GHG footprint. Con-ducting a survey of students, faculty, and staff on the frequency and distance of university-related air travel would provide a valuable cross-check on the method used in the UB GHG inventory. The preferred alternative would be to develop a centralized tracking system, through which all UB-related travel is recorded. Commuting emissions were calculated using data on the distance between home and office for all UB personnel who have parking hang-tags, combined with as-sumptions about how often each comes to campus. This was augmented by survey results regarding student, faculty, and staff commuting frequency, distance, and mode collected by UB Green. At present, there is no system in place to log com-muting mode and distance for faculty, staff, and students, nor is there any incen-tive system to encourage commuters to participate in such a system. Short of im-plementing a smart-tag system (digital parking tags linked to an address database, swiped to enter a parking lot), continuing the commuter survey program will pro-duce the best commuter data we have available. As discussed in Section 2.1.3, capturing additional data on Scope 3 emissions will help quantify the broader impact of UB’s operations. At present, emissions asso-ciated with the hauling and processing of recycled material are not captured, nor are those associated with pumping and treating water consumed on campus. While it may be difficult for UB to account for the lifecycle emissions associated with purchased goods, gathering and reporting data on the volume of materials consumed on campus would provide useful information that could be used to re-duce use and minimize waste. 2.3.3 Improving Emissions Tracking at UB: Clear Standards Over the coming months, UB Green will begin using the SAP Carbon Impact software suite to update and prepare the University’s GHG inventory. The SAP Carbon Impact software (previously known by name Clear Standards) will allow for automated data gathering from a variety of databases, and will enable more accurate reporting of GHG emissions. The tool also allows for tracking individual mitigation initiatives and (when data are available) the impacts of those initia-tives. Emission factors are automatically updated and baseline adjustments are
2. UB’s Greenhouse Gas Footprint
27:00 2-11 UB_CAP_FINAL_September15.doc-9/15/2009
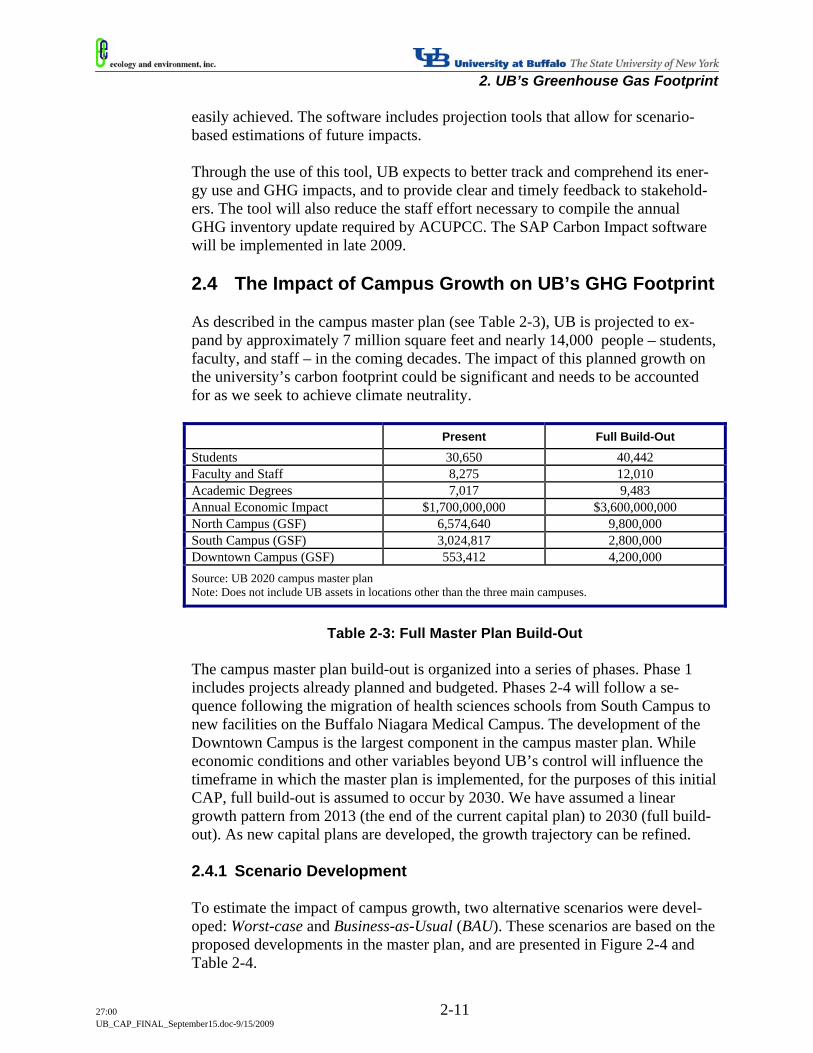
easily achieved. The software includes projection tools that allow for scenario-based estimations of future impacts. Through the use of this tool, UB expects to better track and comprehend its ener-gy use and GHG impacts, and to provide clear and timely feedback to stakehold-ers. The tool will also reduce the staff effort necessary to compile the annual GHG inventory update required by ACUPCC. The SAP Carbon Impact software will be implemented in late 2009. 2.4 The Impact of Campus Growth on UB’s GHG Footprint As described in the campus master plan (see Table 2-3), UB is projected to ex-pand by approximately 7 million square feet and nearly 14,000 people – students, faculty, and staff – in the coming decades. The impact of this planned growth on the university’s carbon footprint could be significant and needs to be accounted for as we seek to achieve climate neutrality.
Present Full Build-Out
Students 30,650 40,442 Faculty and Staff 8,275 12,010 Academic Degrees 7,017 9,483 Annual Economic Impact $1,700,000,000 $3,600,000,000 North Campus (GSF) 6,574,640 9,800,000 South Campus (GSF) 3,024,817 2,800,000 Downtown Campus (GSF) 553,412 4,200,000 Source: UB 2020 campus master plan Note: Does not include UB assets in locations other than the three main campuses.
Table 2-3: Full Master Plan Build-Out
The campus master plan build-out is organized into a series of phases. Phase 1 includes projects already planned and budgeted. Phases 2-4 will follow a se-quence following the migration of health sciences schools from South Campus to new facilities on the Buffalo Niagara Medical Campus. The development of the Downtown Campus is the largest component in the campus master plan. While economic conditions and other variables beyond UB’s control will influence the timeframe in which the master plan is implemented, for the purposes of this initial CAP, full build-out is assumed to occur by 2030. We have assumed a linear growth pattern from 2013 (the end of the current capital plan) to 2030 (full build-out). As new capital plans are developed, the growth trajectory can be refined. 2.4.1 Scenario Development To estimate the impact of campus growth, two alternative scenarios were devel-oped: Worst-case and Business-as-Usual (BAU). These scenarios are based on the proposed developments in the master plan, and are presented in Figure 2-4 and Table 2-4.
2. UB’s Greenhouse Gas Footprint
27:00 2-12 UB_CAP_FINAL_September15.doc-9/15/2009
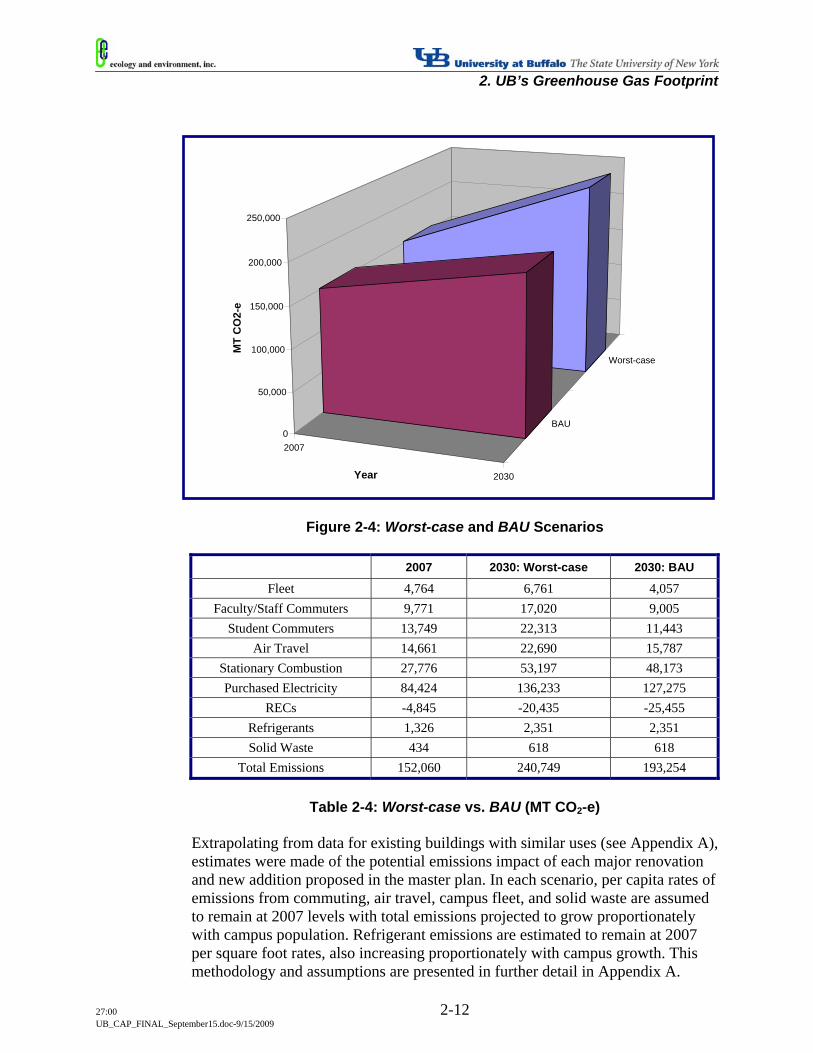
Figure 2-4: Worst-case and BAU Scenarios
2007 2030: Worst-case 2030: BAU
Fleet 4,764 6,761 4,057 Faculty/Staff Commuters 9,771 17,020 9,005
Student Commuters 13,749 22,313 11,443 Air Travel 14,661 22,690 15,787
Stationary Combustion 27,776 53,197 48,173 Purchased Electricity 84,424 136,233 127,275
RECs -4,845 -20,435 -25,455 Refrigerants 1,326 2,351 2,351 Solid Waste 434 618 618
Total Emissions 152,060 240,749 193,254
Table 2-4: Worst-case vs. BAU (MT CO2-e)
Extrapolating from data for existing buildings with similar uses (see Appendix A), estimates were made of the potential emissions impact of each major renovation and new addition proposed in the master plan. In each scenario, per capita rates of emissions from commuting, air travel, campus fleet, and solid waste are assumed to remain at 2007 levels with total emissions projected to grow proportionately with campus population. Refrigerant emissions are estimated to remain at 2007 per square foot rates, also increasing proportionately with campus growth. This methodology and assumptions are presented in further detail in Appendix A.
2007
2030
BAU
Worst-case
0
50,000
100,000
150,000
200,000
250,000
MT
CO
2-e
Year
2. UB’s Greenhouse Gas Footprint
27:00 2-13 UB_CAP_FINAL_September15.doc-9/15/2009
The Worst-case scenario assumes that existing campus commitments (increased purchasing of RECs to 20 percent, LEED Silver construction) will not be met, and we continue to purchase RECs for only 15 percent of our emissions, with no net improvement in energy performance. Further, it assumes that there are no external changes (a cleaner grid, more efficient vehicles) affecting UB’s carbon footprint. While this is very unlikely, it makes clear the importance of meeting existing commitments while continuing to use our lobbying power to support broader state, regional, and national environmental efforts. The BAU scenario assumes we will meet these commitments (with LEED Silver construction providing 15 per-cent better energy performance), while also factoring in the impact of external changes in the electrical grid and the U.S. vehicle fleet. There is considerable uncertainty regarding the potential changes in grid and ve-hicle efficiency, as well as numerous other external drivers that could influence UB’s future GHG emissions. It is likely that both the vehicle fleet and the grid will become less carbon intensive over the coming years. As these emission sce-narios are updated, better data will be incorporated into the models. The BAU scenario, featuring a baseline adjusted to include likely external effi-ciencies, may be subject to some uncertainty, but it will serve as the basis for es-timating the emission reduction impacts associated with UB’s effort to become climate neutral. By presenting the Worst-case and BAU scenarios side-by-side, the influence of different drivers on UB’s bid to become climate neutral becomes clearer. Table 2-4 shows the differences between the Worst-case and BAU scena-rios resulting from our assumptions about increasing vehicle, building, and elec-trical grid efficiency. The approach taken to making these emissions projections is conservative, and these scenarios should be viewed as preliminary; they are intended to frame the overall discussion in the CAP. The aim of creating Worst-case and BAU scenarios is to provide an upper boundary from which to begin planning a long-term mitiga-tion strategy.
27:00 3-1 UB_CAP_FINAL_September15.doc-9/15/2009
In this Chapter: 1. Actions to mitigate UB’s GHG emissions in:
a. Buildings and land use b. Transportation c. Materials
2. Analysis of the potential impact of these actions on UB’s future carbon
footprint.
Actions to Mitigate Greenhouse Gas Emissions
The ultimate goal of the CAP is to reduce UB’s contribution to global climate change to zero. Achieving this will require significant changes to the university’s infrastructure and operations. Fortunately, UB has an excellent tradition to build on. For more than three decades, UB staff, faculty, and students have imple-mented environmental initiatives aimed at reducing UB’s overall impact and streamlining operations (see Appendix C). Since 1982 efforts to reduce energy use have led to an annual savings of approximately $9 million (more than $100 million in total). This has allowed UB’s campus population and physical space to grow while stabilizing net emissions and reducing per capita emissions. Future efforts need to build on such successes while ramping up GHG mitigation efforts. One major hurdle: to date, most of the savings from energy reduction efforts have not been reinvested into efficiency projects (see Section 5.1.1). This chapter outlines actions that can be taken to reduce UB’s GHG emissions. The vast majority have been identified through the work of the Environmental Stewardship Committee (ESC), the institutional body charged with spearheading our climate neutrality efforts. Additional ideas were drawn from the experiences of campus climate leaders and conversations with external partners. In many cas-es, multiple ideas or strategies have been bundled into a single package – group-ing like with like, especially where implementation processes are similar. The actions presented in this chapter are grouped into three categories: buildings and land use, transportation, and materials. These categories were selected be-cause they correspond roughly to organizational boundaries at UB. Many of the proposed actions will require participation from multiple groups on campus.
3
3. Actions to Mitigate Greenhouse Gas Emissions
27:00 3-2 UB_CAP_FINAL_September15.doc-9/15/2009
Buildings and land use comprises:
Scope 1 emissions from the combustion of fossil fuels to produce steam, hot water, and heat for use in campus buildings;
Scope 1 refrigerant emissions; and Scope 2 emissions from purchased electricity.
Transportation comprises:
Scope 1 emissions from the use of fossil fuels in campus fleet vehicles; Scope 3 emissions from student, faculty, and staff commuting; and Scope 3 emissions from University-related air travel.
Materials comprise:
Scope 3 emissions (not quantified in the inventory) associated with the purchase of materials and goods for use on campus; and
Scope 3 emissions (quantified in the original inventory) from the disposal of solid waste.
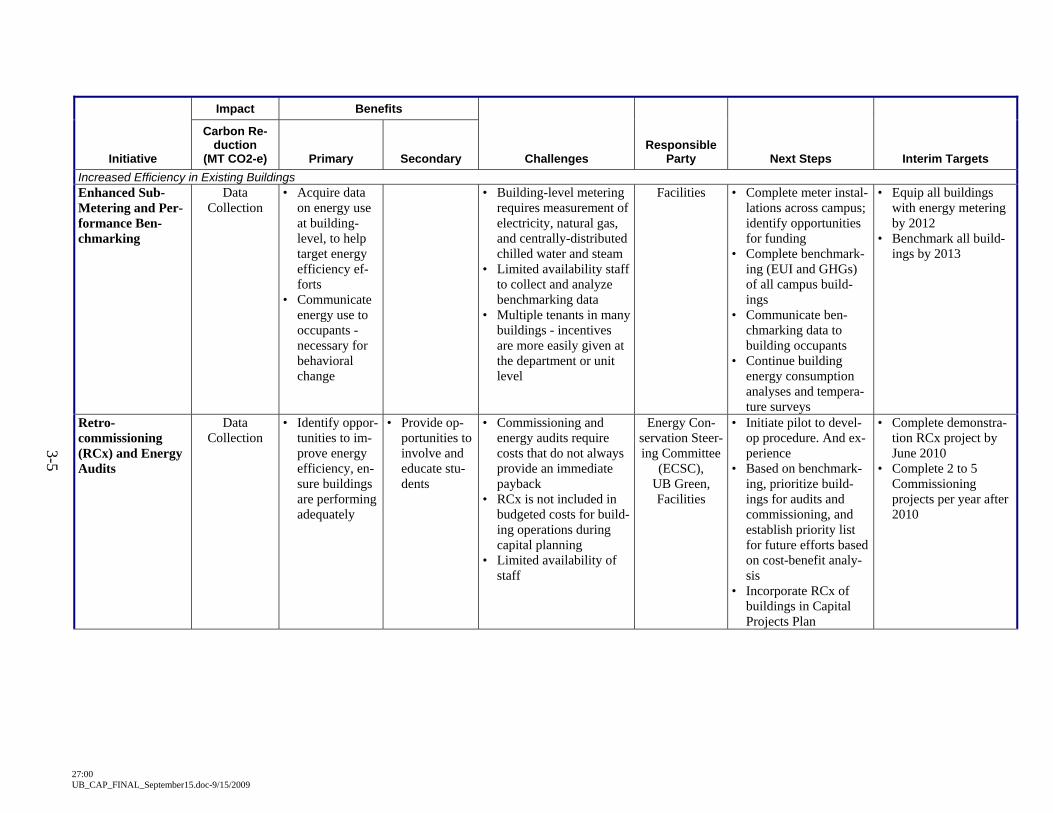
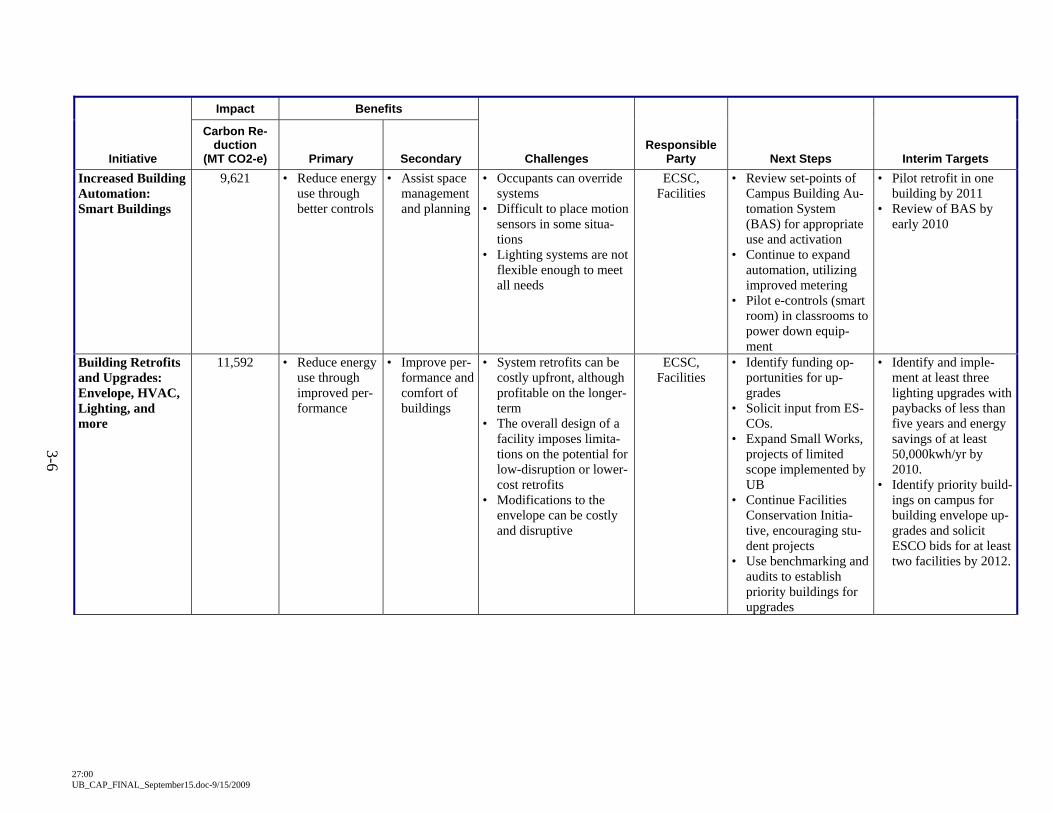
The only additional Scope 3 emissions addressed in this plan are those associated with the purchase of goods and materials used on campus (in Section 3.4). This discussion must remain qualitative, due to the absence of baseline data. However, it is the intention of the ESC to continually improve the CAP and GHG inventory, and should new methods and tools become available, this discussion will broaden. Chapter 3 concludes with an assessment of the quantitative impact of the pro-posed mitigation actions on UB’s carbon footprint. 3.1 Key Terms and Concepts The proposed mitigation actions are presented in a matrix format. Each matrix (one for each category) presents the:
Net emissions reduction; Primary and secondary benefits; Challenges; Responsible party; Next steps; and Interim targets.
These terms are defined below. Additionally, the matrices are accompanied by short narratives describing each proposed action in detail. As the actions are im-plemented, it is important to capture the full economic and climate impact of each initiative. At present, too little information is available to estimate the cost-benefit or potential return on investment (ROI) from many of them. However, we have included a limited discussion of potential costs for the offsets and RECs that may need to be purchased to achieve neutrality. As well, highlighting the non-
3. Actions to Mitigate Greenhouse Gas Emissions
27:00 3-3 UB_CAP_FINAL_September15.doc-9/15/2009
economic benefits of each initiative will create a more compelling case when ap-plying for funding, especially if the economic analysis suggests that project im-plementation will result in a net financial loss. Opportunities to combine climate action with research and learning are myriad (see Chapter 4). UB has established precedents for this, for example through the Impact Program, involving engineer-ing students in feasibility studies and design for renewable energy systems. 3.1.1 Net Emissions Reduction This is the estimated reduction in metric tons of carbon dioxide equivalents (MT CO2-e) resulting from a given action. Given the size and complexity of UB’s built and organizational environment, net emissions reduction estimates will necessari-ly need revision as the CAP is implemented. However, these estimates provide a useful starting point for discussion. In some cases, insufficient baseline informa-tion was available to estimate the potential impact of an initiative. For these ac-tions, the next steps and interim targets were designed to eliminate these data gaps in the short term. 3.1.2 Primary and Secondary Benefits Primary benefits can be understood as direct climate-related impacts of an initia-tive. Secondary benefits include cost savings, research/teaching opportunities, health benefits, and aesthetic improvements. Many initiatives have considerable secondary benefits. The benefits presented in the matrix are not comprehensive. 3.1.3 Challenges Challenges include organizational, physical, and economic barriers to implemen-tation. In many cases, obstacles may be easily surmounted with sufficient invest-ment of time or money. Acknowledging challenges in the matrices, however, adds credibility to the program. Also, some measures have pre-requisites. These are identified in the challenges column. 3.1.4 Responsible Party Responsible party designates the group or individual responsible for spearheading an initiative. Many other units on campus may need to be involved in project im-plementation, but the party identified is responsible for ensuring the initiative is explored in greater detail and implemented across campus. 3.1.5 Next Steps Next steps denotes the short-term actions that need to happen to either plan or im-plement (depending on its current status) the proposed initiative, and were devel-oped in consultation with the responsible party. As noted in Section 3.1.1, where baseline data are unavailable, the next steps are designed to gather the information needed for planning and implementation.
3. Actions to Mitigate Greenhouse Gas Emissions
27:00 3-4 UB_CAP_FINAL_September15.doc-9/15/2009
3.1.6 Interim Targets Interim targets help establish short-term goals on the way to long-term accom-plishments. Many measures also have pre-requisite actions that must be taken prior to, or concurrently with, full implementation. By establishing interim tar-gets, the implementation team helps reduce the likelihood of project fatigue and counters unrealistic expectations for short-term impact. Establishing interim tar-gets and performance metrics during implementation creates mechanisms for tracking progress, facilitates reporting, and helps establish a clear record for project success that can be communicated to the entire UB community. 3.2 Buildings and Land Use UB occupies about 10 million gross square feet of space at its three campuses. Not surprisingly, buildings account for more than two-thirds of UB’s quantified GHG emissions, making them the most important target for emission reductions. If UB is to grow as proposed in the master plan, it will be critical to include cli-mate considerations in the design of new facilities. In some cases, more efficient use of existing space may help offset the need for new development. UB’s exten-sive land holdings provide additional opportunities for GHG emission reductions. UB’s long and distinguished history of energy conservation includes a mixture of performance contracts (discussed in Section 5.1.3 and Appendix C) and a variety of internally-funded initiatives, including:
Conversion of the MacKay Heating Plant to natural gas in 2002, replacing the consumption of 2,000 tons of coal annually and eliminating the use of coal on campus.
Renovation of the building envelope at 220 Winspear in 2003, conserving 27,000 kWh and 21,000 MMBTU in natural gas per year.
Replacement of hundreds of windows and upgrading HVAC equipment at the Ellicott Complex.
Installation of a natural gas-fired micro-turbine co-generation unit at Alumni Arena to produce electric power and heat the swimming and di-ving pools, saving about 2,000 megawatt hours per year.
University Facilities and University Residence Halls and Apartments (URH&A) continue to implement conservation measures. Table 3-1, beginning on the next page, presents proposed buildings and land use actions, in these categories:
Increased efficiency in existing buildings Increased Datacenter and IT Equipment Efficiency High Performance Design Energy Production and Purchasing Land Use Management
3-5
27:00 UB_CAP_FINAL_September15.doc-9/15/2009
Initiative
Impact Benefits
Carbon Re-duction
(MT CO2-e) Primary Secondary Challenges Responsible
Party Next Steps Interim Targets Increased Efficiency in Existing Buildings Enhanced Sub-Metering and Per-formance Ben-chmarking
Data Collection
• Acquire data on energy use at building-level, to help target energy efficiency ef-forts
• Communicate energy use to occupants - necessary for behavioral change
• Building-level metering requires measurement of electricity, natural gas, and centrally-distributed chilled water and steam
• Limited availability staff to collect and analyze benchmarking data
• Multiple tenants in many buildings - incentives are more easily given at the department or unit level
Facilities • Complete meter instal-lations across campus; identify opportunities for funding
• Complete benchmark-ing (EUI and GHGs) of all campus build-ings
• Communicate ben-chmarking data to building occupants
• Continue building energy consumption analyses and tempera-ture surveys
• Equip all buildings with energy metering by 2012
• Benchmark all build-ings by 2013
Retro-commissioning (RCx) and Energy Audits
Data Collection
• Identify oppor-tunities to im-prove energy efficiency, en-sure buildings are performing adequately
• Provide op-portunities to involve and educate stu-dents
• Commissioning and energy audits require costs that do not always provide an immediate payback
• RCx is not included in budgeted costs for build-ing operations during capital planning
• Limited availability of staff
Energy Con-servation Steer-ing Committee
(ECSC), UB Green, Facilities
• Initiate pilot to devel-op procedure. And ex-perience
• Based on benchmark-ing, prioritize build-ings for audits and commissioning, and establish priority list for future efforts based on cost-benefit analy-sis
• Incorporate RCx of buildings in Capital Projects Plan
• Complete demonstra-tion RCx project by June 2010
• Complete 2 to 5 Commissioning projects per year after 2010
3-6
27:00 UB_CAP_FINAL_September15.doc-9/15/2009
Initiative
Impact Benefits
Carbon Re-duction
(MT CO2-e) Primary Secondary Challenges Responsible
Party Next Steps Interim Targets Increased Building Automation: Smart Buildings
9,621 • Reduce energy use through better controls
• Assist space management and planning
• Occupants can override systems
• Difficult to place motion sensors in some situa-tions
• Lighting systems are not flexible enough to meet all needs
ECSC, Facilities
• Review set-points of Campus Building Au-tomation System (BAS) for appropriate use and activation
• Continue to expand automation, utilizing improved metering
• Pilot e-controls (smart room) in classrooms to power down equip-ment
• Pilot retrofit in one building by 2011
• Review of BAS by early 2010
Building Retrofits and Upgrades: Envelope, HVAC, Lighting, and more
11,592 • Reduce energy use through improved per-formance
• Improve per-formance and comfort of buildings
• System retrofits can be costly upfront, although profitable on the longer-term
• The overall design of a facility imposes limita-tions on the potential for low-disruption or lower-cost retrofits
• Modifications to the envelope can be costly and disruptive
ECSC, Facilities
• Identify funding op-portunities for up-grades
• Solicit input from ES-COs.
• Expand Small Works, projects of limited scope implemented by UB
• Continue Facilities Conservation Initia-tive, encouraging stu-dent projects
• Use benchmarking and audits to establish priority buildings for upgrades
• Identify and imple-ment at least three lighting upgrades with paybacks of less than five years and energy savings of at least 50,000kwh/yr by 2010.
• Identify priority build-ings on campus for building envelope up-grades and solicit ESCO bids for at least two facilities by 2012.
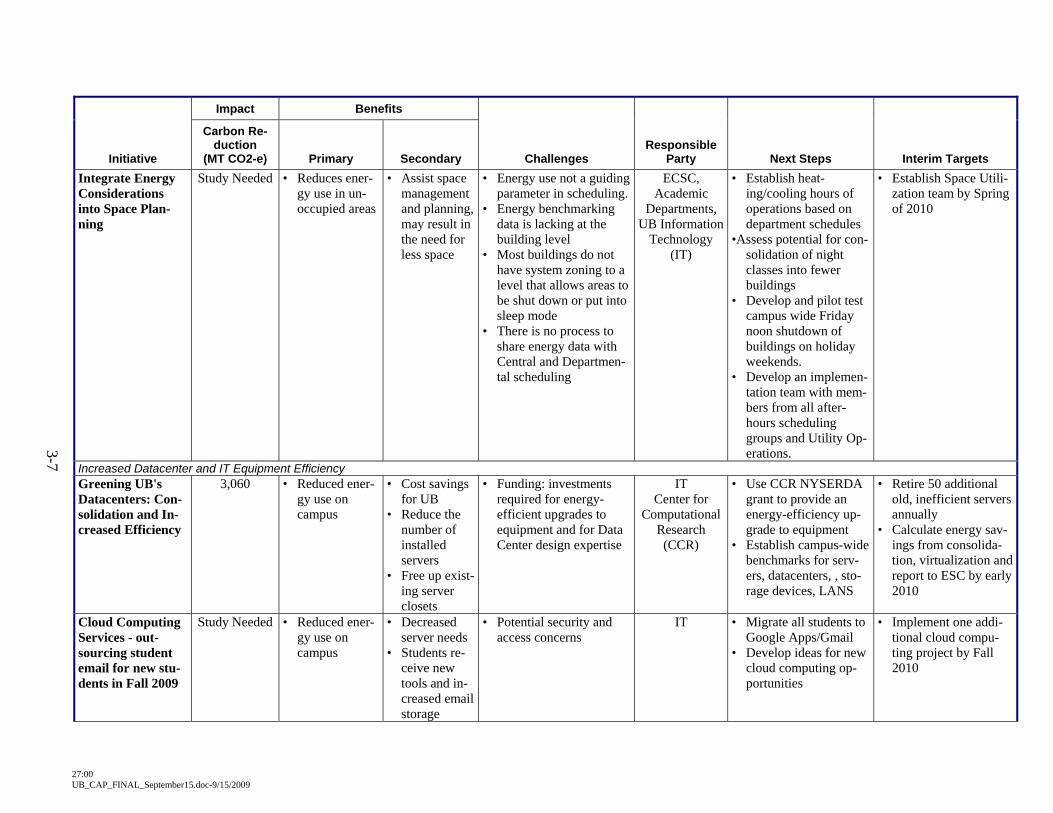
3-7
27:00 UB_CAP_FINAL_September15.doc-9/15/2009
Initiative
Impact Benefits
Carbon Re-duction
(MT CO2-e) Primary Secondary Challenges Responsible
Party Next Steps Interim Targets Integrate Energy Considerations into Space Plan-ning
Study Needed • Reduces ener-gy use in un-occupied areas
• Assist space management and planning, may result in the need for less space
• Energy use not a guiding parameter in scheduling.
• Energy benchmarking data is lacking at the building level
• Most buildings do not have system zoning to a level that allows areas to be shut down or put into sleep mode
• There is no process to share energy data with Central and Departmen-tal scheduling
ECSC, Academic
Departments, UB Information
Technology (IT)
• Establish heat-ing/cooling hours of operations based on department schedules
•Assess potential for con-solidation of night classes into fewer buildings
• Develop and pilot test campus wide Friday noon shutdown of buildings on holiday weekends.
• Develop an implemen-tation team with mem-bers from all after-hours scheduling groups and Utility Op-erations.
• Establish Space Utili-zation team by Spring of 2010
Increased Datacenter and IT Equipment Efficiency Greening UB's Datacenters: Con-solidation and In-creased Efficiency
3,060 • Reduced ener-gy use on campus
• Cost savings for UB
• Reduce the number of installed servers
• Free up exist-ing server closets
• Funding: investments required for energy-efficient upgrades to equipment and for Data Center design expertise
IT Center for
Computational Research (CCR)
• Use CCR NYSERDA grant to provide an energy-efficiency up-grade to equipment
• Establish campus-wide benchmarks for serv-ers, datacenters, , sto-rage devices, LANS
• Retire 50 additional old, inefficient servers annually
• Calculate energy sav-ings from consolida-tion, virtualization and report to ESC by early 2010
Cloud Computing Services - out-sourcing student email for new stu-dents in Fall 2009
Study Needed • Reduced ener-gy use on campus
• Decreased server needs
• Students re-ceive new tools and in-creased email storage
• Potential security and access concerns
IT • Migrate all students to Google Apps/Gmail
• Develop ideas for new cloud computing op-portunities
• Implement one addi-tional cloud compu-ting project by Fall 2010
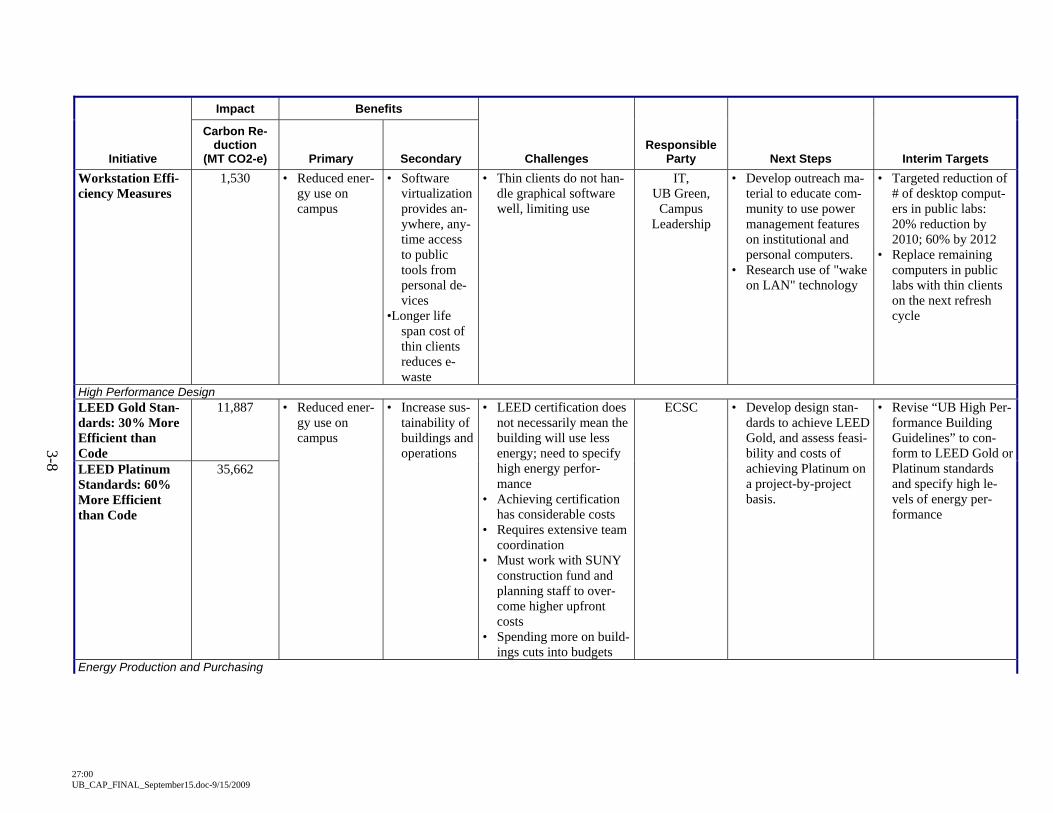
3-8
27:00 UB_CAP_FINAL_September15.doc-9/15/2009
Initiative
Impact Benefits
Carbon Re-duction
(MT CO2-e) Primary Secondary Challenges Responsible
Party Next Steps Interim Targets Workstation Effi-ciency Measures
1,530 • Reduced ener-gy use on campus
• Software virtualization provides an-ywhere, any-time access to public tools from personal de-vices
•Longer life span cost of thin clients reduces e-waste
• Thin clients do not han-dle graphical software well, limiting use
IT, UB Green,
Campus Leadership
• Develop outreach ma-terial to educate com-munity to use power management features on institutional and personal computers.
• Research use of "wake on LAN" technology
• Targeted reduction of # of desktop comput-ers in public labs: 20% reduction by 2010; 60% by 2012
• Replace remaining computers in public labs with thin clients on the next refresh cycle
High Performance Design LEED Gold Stan-dards: 30% More Efficient than Code
11,887 • Reduced ener-gy use on campus
• Increase sus-tainability of buildings and operations
• LEED certification does not necessarily mean the building will use less energy; need to specify high energy perfor-mance
• Achieving certification has considerable costs
• Requires extensive team coordination
• Must work with SUNY construction fund and planning staff to over-come higher upfront costs
• Spending more on build-ings cuts into budgets
ECSC • Develop design stan-dards to achieve LEED Gold, and assess feasi-bility and costs of achieving Platinum on a project-by-project basis.
• Revise “UB High Per-formance Building Guidelines” to con-form to LEED Gold or Platinum standards and specify high le-vels of energy per-formance
LEED Platinum Standards: 60% More Efficient than Code
35,662
Energy Production and Purchasing
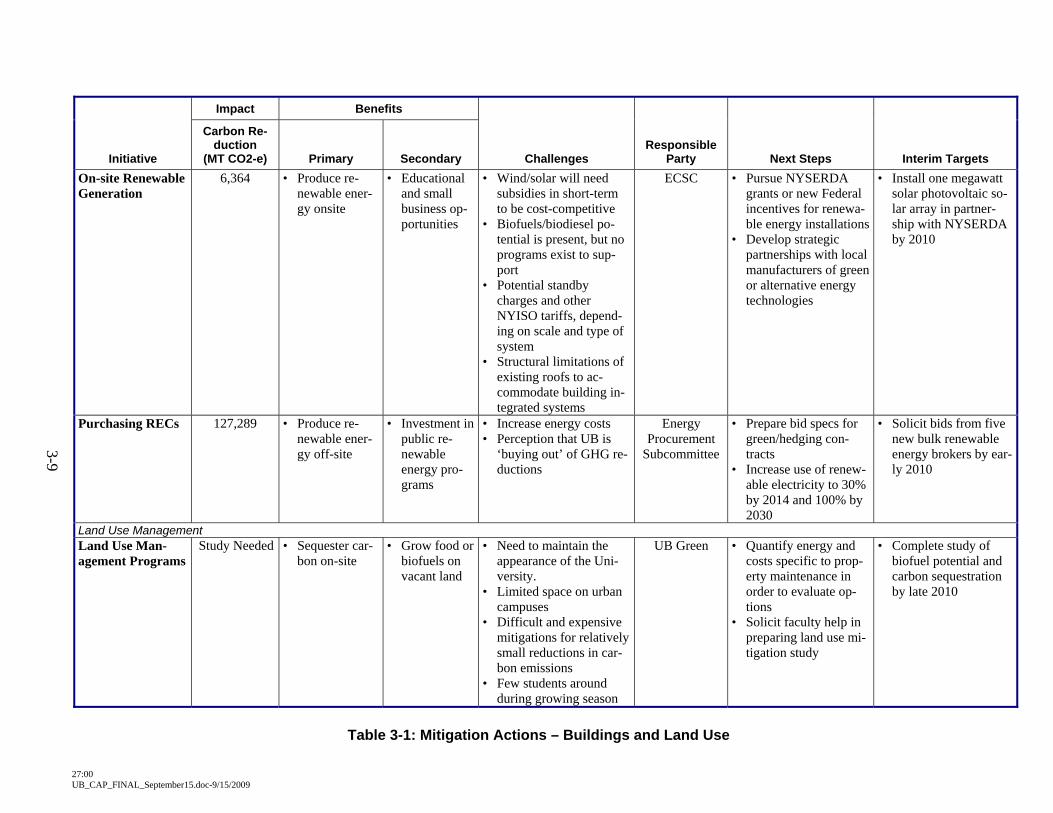
3-9
27:00 UB_CAP_FINAL_September15.doc-9/15/2009
Initiative
Impact Benefits
Carbon Re-duction
(MT CO2-e) Primary Secondary Challenges Responsible
Party Next Steps Interim Targets On-site Renewable Generation
6,364 • Produce re-newable ener-gy onsite
• Educational and small business op-portunities
• Wind/solar will need subsidies in short-term to be cost-competitive
• Biofuels/biodiesel po-tential is present, but no programs exist to sup-port
• Potential standby charges and other NYISO tariffs, depend-ing on scale and type of system
• Structural limitations of existing roofs to ac-commodate building in-tegrated systems
ECSC • Pursue NYSERDA grants or new Federal incentives for renewa-ble energy installations
• Develop strategic partnerships with local manufacturers of green or alternative energy technologies
• Install one megawatt solar photovoltaic so-lar array in partner-ship with NYSERDA by 2010
Purchasing RECs 127,289 • Produce re-newable ener-gy off-site
• Investment in public re-newable energy pro-grams
• Increase energy costs • Perception that UB is
‘buying out’ of GHG re-ductions
Energy Procurement
Subcommittee
• Prepare bid specs for green/hedging con-tracts
• Increase use of renew-able electricity to 30% by 2014 and 100% by 2030
• Solicit bids from five new bulk renewable energy brokers by ear-ly 2010
Land Use Management Land Use Man-agement Programs
Study Needed • Sequester car-bon on-site
• Grow food or biofuels on vacant land
• Need to maintain the appearance of the Uni-versity.
• Limited space on urban campuses
• Difficult and expensive mitigations for relatively small reductions in car-bon emissions
• Few students around during growing season
UB Green • Quantify energy and costs specific to prop-erty maintenance in order to evaluate op-tions
• Solicit faculty help in preparing land use mi-tigation study
• Complete study of biofuel potential and carbon sequestration by late 2010
Table 3-1: Mitigation Actions – Buildings and Land Use
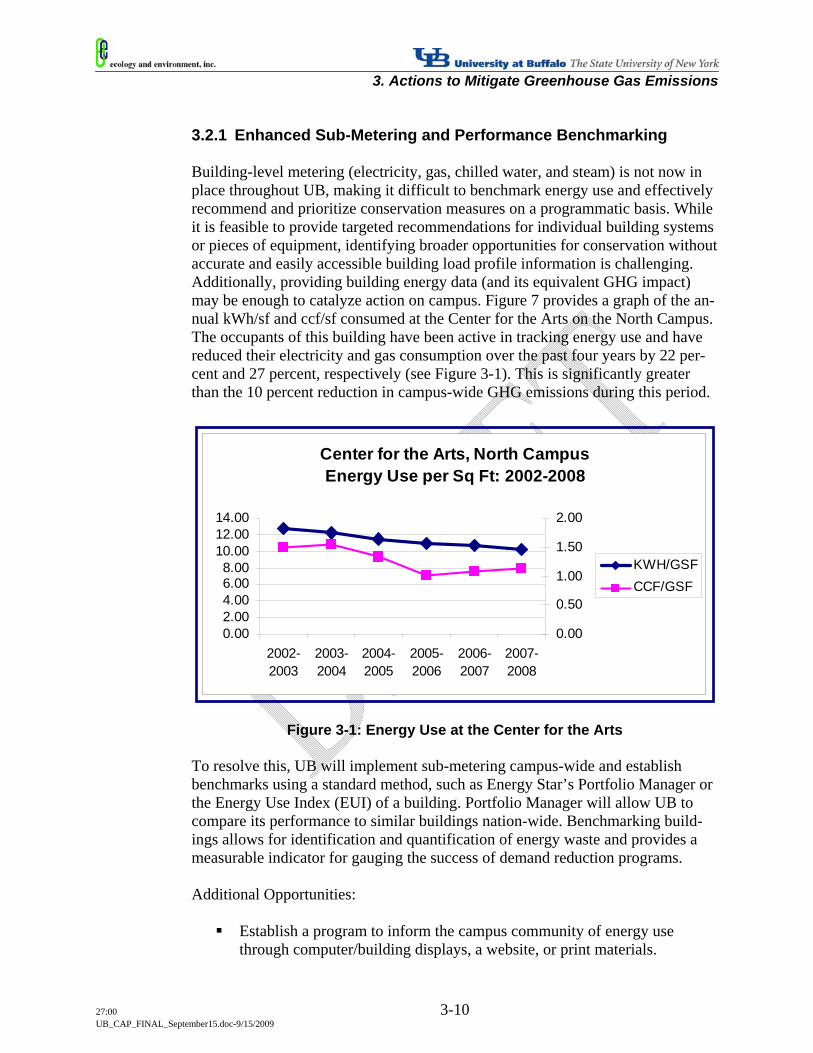
3. Actions to Mitigate Greenhouse Gas Emissions
27:00 3-10 UB_CAP_FINAL_September15.doc-9/15/2009
3.2.1 Enhanced Sub-Metering and Performance Benchmarking Building-level metering (electricity, gas, chilled water, and steam) is not now in place throughout UB, making it difficult to benchmark energy use and effectively recommend and prioritize conservation measures on a programmatic basis. While it is feasible to provide targeted recommendations for individual building systems or pieces of equipment, identifying broader opportunities for conservation without accurate and easily accessible building load profile information is challenging. Additionally, providing building energy data (and its equivalent GHG impact) may be enough to catalyze action on campus. Figure 7 provides a graph of the an-nual kWh/sf and ccf/sf consumed at the Center for the Arts on the North Campus. The occupants of this building have been active in tracking energy use and have reduced their electricity and gas consumption over the past four years by 22 per-cent and 27 percent, respectively (see Figure 3-1). This is significantly greater than the 10 percent reduction in campus-wide GHG emissions during this period.
Figure 3-1: Energy Use at the Center for the Arts
To resolve this, UB will implement sub-metering campus-wide and establish benchmarks using a standard method, such as Energy Star’s Portfolio Manager or the Energy Use Index (EUI) of a building. Portfolio Manager will allow UB to compare its performance to similar buildings nation-wide. Benchmarking build-ings allows for identification and quantification of energy waste and provides a measurable indicator for gauging the success of demand reduction programs. Additional Opportunities:
Establish a program to inform the campus community of energy use through computer/building displays, a website, or print materials.
Center for the Arts, North CampusEnergy Use per Sq Ft: 2002-2008
0.002.004.006.008.00
10.0012.0014.00
2002-2003
2003-2004
2004-2005
2005-2006
2006-2007
2007-2008
0.00
0.50
1.00
1.50
2.00
KWH/GSFCCF/GSF
3. Actions to Mitigate Greenhouse Gas Emissions
27:00 3-11 UB_CAP_FINAL_September15.doc-9/15/2009
Use energy data to educate building occupants and drive voluntary com-petitive programs to reduce energy (e.g., residence hall contests).
Establish a campus-wide goal as well as goals for individual buildings or departments to reduce energy based on metered data and benchmarking.
Link energy performance within the buildings or departments to incentives to help encourage energy conservation.
Create a weekly/monthly article on energy conservation using real num-bers: kWh saved, MT CO2-e reduced, dollars saved, etc.
3.2.2 Retro-commissioning and Energy Audits Retro-commissioning of buildings will ensure that all building systems are main-tained to high performance standards. Retro-commissioning entails testing the performance of building systems in comparison to the designed standard and making operational adjustments to correct any system imperfections. UB’s High Performance Design Guidelines mandate commissioning of all new buildings; to generate further energy and emission reductions, we will expand this to include commissioning of existing buildings. Energy audits are less costly and will also be used to identify new energy conservation measures and uses for new technolo-gy. University Facilities will use benchmarking data (see Section 3.2.1) to identify high-priority buildings for retro-commissioning or audits. Additional Opportunities:
Use students to expand resources available for energy auditing. Students can gain valuable job skills by assisting in this work.
3.2.3 Increased Building Automation: Smart Buildings Building Automation Systems (BAS) and other controls can be used to manage HVAC systems, lighting, plug-in equipment (e.g., computers), and other systems, by cycling down or turning off equipment not in use. These technologies are used extensively across our campuses, and are commonly integrated into new buildings and major renovations. UB will expand control systems in existing buildings to reduce energy use and emissions. Controls can range from simple technologies such as motion sensors to more complicated demand-controlled systems. Additional Opportunities:
Establish and enforce a campus-wide room temperature policy and set points. Educate occupants on the reasons behind the policy, and use BAS to control building conditions wherever possible.
3.2.4 Building Retrofits and Upgrades New projects to upgrade UB’s built infrastructure are always underway. New energy efficient technologies and innovative financing mechanisms allow for
3. Actions to Mitigate Greenhouse Gas Emissions
27:00 3-12 UB_CAP_FINAL_September15.doc-9/15/2009
profitable building retrofits and upgrades, even at campuses with a long history of energy conservation such as UB. University Facilities and URH&A will take ad-vantage of new and established funding opportunities (See Chapter 5) to continue upgrading building equipment, HVAC systems, boilers and pumps, lighting, and building envelopes. While we plan to demolish over 800,000 square feet of space and renovate 1.2 million square feet as part of the master plan, this leaves eight million square feet of space for renovation. The use of heat recovery technologies (particularly in fume hoods and central plants), high-efficiency motors, variable frequency drives, and other technologies can offer savings, as can upgrades to central steam and cooling plants. Weatheri-zation of buildings and window replacement can improve efficiency of building envelopes. New fluorescent systems and light emitting diodes (LEDs) can provide quick payback for lighting retrofits. For example, URH&A is upgrading lighting in residence halls to use compact fluorescent light bulbs (CFLs). A recent LED pilot at North Campus yielded good results. Additional Opportunities:
Use performance contracting to eliminate upfront costs of retrofits. Use projects as a learning opportunity for students. Assessing the feasibili-
ty of retrofits (e.g., as was done with the student-run fume hood study) can provide hands-on research experience for students.
3.2.5 Integrate Energy Considerations into Space Planning Space planning is critical to the successful operation of a university, and energy use should be considered in the initial design, annual scheduling, and daily as-signment of space. Classroom and office space may have highly variable occu-pancy rates (e.g. summer break vs. mid-semester), while research facilities may be mission-critical and constantly in operation. Some spaces on campus are de-partmentally-controlled, while others are managed centrally. To identify efficien-cies, UB will convene a taskforce on space planning and energy efficiency. Be-cause of the complexity of this issue, significant planning and discussion will likely be required before efficiencies can be realized. Additional Opportunities:
Consolidate research facilities for more efficient use. Cluster off-hours classes in one building or zone to set unused space in
sleep mode. Use more efficient spaces first, occupying less efficient spaces less often.
This prioritization could be based on energy benchmarking data. Integrate some departmentally-controlled space into the centrally-
scheduled system, to allow for more efficient space planning.
3. Actions to Mitigate Greenhouse Gas Emissions
27:00 3-13 UB_CAP_FINAL_September15.doc-9/15/2009
3.2.6 Greening UB’s Datacenters: Consolidation and Improved Efficiency
Datacenters are a major user of energy at UB, both for powering electrical equip-ment and for space cooling. The UB 2020 IT Transformation is consolidating campus services and servers, reducing the need for equipment and using centrali-zation to implement new efficiency measures and technologies. By the end of 2008, University Support Services had retired 63 of 97 servers. This project will move forward to other units to achieve comparable reductions. Server, storage, and LAN virtualization present additional opportunities for increased energy effi-ciency and are being explored. Efforts such as the proposed upgrade at the Center for Computational Research may allow UB to pilot new methods for reducing da-tacenter energy use. This effort is expected to save $150,000/year. Additional Opportunities:
Pursue funding to pilot new IT efficiency measures through collaboration between UB researchers and the UB 2020 IT Transformation team.
3.2.7 Cloud Computing Cloud computing, or outsourcing IT functions to off-campus datacenters and hosts, is currently being implemented for UB’s student email through a switch to GoogleApps. Where possible, additional campus IT services will use cloud com-puting, reducing the need for UB to maintain servers while taking advantage of larger, more efficient, centrally operated servers elsewhere. 3.2.8 Implement Workstation Efficiency Measures New technologies offer ample opportunity to increase the efficiency of computer workstations. At UB, these include virtualization in public computing labs and kiosks, the use of thin clients, and the increased use of power management fea-tures. The continued rollout of new energy efficiency technologies will help coun-ter the projected increase in demand for IT capacity at UB. 3.2.9 LEED Gold or Platinum Standards and Energy Performance
Targets Each new building constructed on campus adds to UB’s carbon footprint and to future utility costs. Minimizing the amount of energy each new building requires through high performance design will help UB manage carbon emissions while growing as a campus. It will often be easier and cheaper to incorporate metering, controls, day-lighting, PV and solar thermal, and other efficient technologies dur-ing the initial design and construction than via future retrofit. The LEED system provides a widely recognized standard for high performance buildings, assessing performance in sustainable sites, water efficiency, energy and
3. Actions to Mitigate Greenhouse Gas Emissions
27:00 3-14 UB_CAP_FINAL_September15.doc-9/15/2009
atmosphere, materials and resources, and indoor environmental quality, among others (see the USGBC webpage). Mandating LEED Gold or Platinum certifica-tion for new construction will ensure that new facilities are built to the highest standard of green design. This is not a new idea: the UB High Performance De-sign Guidelines, created in 2004, were developed in alignment with the LEED system. At present UB mandates LEED Silver certification for all major construc-tion projects. Going forward, UB will set a specific level of energy performance, as well as higher LEED certification requirements, to ensure that buildings achieve measurable reductions in energy use: the analysis used in the CAP as-sumes that Gold buildings achieve 30 percent better efficiency than present, and that Platinum buildings achieve 60 percent better than present. Funding to offset first costs can be pursued through NYSERDA and other sources (see Chapter 6). Additional Opportunities:
Develop a course to teach the LEED system (at UB or in partnership with a local community college). Encourage students to pursue LEED accredi-tation to give them an edge in competing for new green jobs.
3.2.10 On-site Renewable Energy Generation The occupation and use of building space requires the use of energy. On-site gen-eration of renewable energy provides the potential, in some cases, to reduce car-bon emissions from buildings to zero. Federal and state programs continue to support the use of renewable systems. At the fall 2008 Sustainability Forum, stu-dents and staff designated the installation of renewable on-site energy generation as a priority. UB is currently installing a 1 MW PV array at North Campus. UB will assess opportunities to use renewables and will install systems as feasi-ble. This could include solar systems in parking areas, bus shelters, vacant land, or new and existing buildings; stand-alone or building-integrated wind turbines; and bio-fuels for buildings or as transportation fuel for UB’s fleet. Additional Opportunities:
Develop student learning and/or research opportunities devoted to the use of new renewable energy sources on campus.
3.2.11 Purchase Additional Renewable Energy UB purchases RECs for 15 percent of its total electricity consumption. By 2013, the target will be 20 percent – and higher in subsequent years. Increasing our pur-chase of RECs is would be a simple but costly way to reduce the GHG emissions associated with our purchase and use of electricity. Using 2007 as a base year and assuming a premium of $0.016/kWh for renewable energy, it would have cost an additional $3.44 million on a total utility bill of nearly $25 million to buy RECs for all of UB’s electricity consumption that year. As a result there is some skeptic-
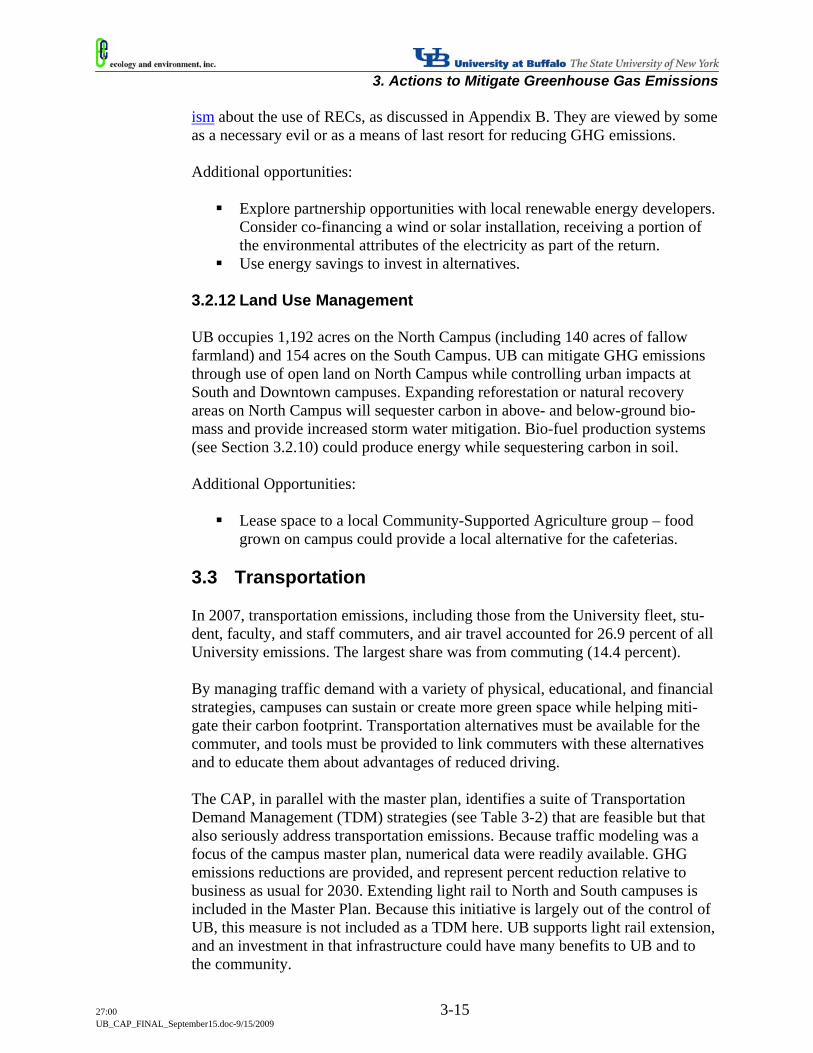
3. Actions to Mitigate Greenhouse Gas Emissions
27:00 3-15 UB_CAP_FINAL_September15.doc-9/15/2009
ism about the use of RECs, as discussed in Appendix B. They are viewed by some as a necessary evil or as a means of last resort for reducing GHG emissions. Additional opportunities:
Explore partnership opportunities with local renewable energy developers. Consider co-financing a wind or solar installation, receiving a portion of the environmental attributes of the electricity as part of the return.
Use energy savings to invest in alternatives. 3.2.12 Land Use Management UB occupies 1,192 acres on the North Campus (including 140 acres of fallow farmland) and 154 acres on the South Campus. UB can mitigate GHG emissions through use of open land on North Campus while controlling urban impacts at South and Downtown campuses. Expanding reforestation or natural recovery areas on North Campus will sequester carbon in above- and below-ground bio-mass and provide increased storm water mitigation. Bio-fuel production systems (see Section 3.2.10) could produce energy while sequestering carbon in soil. Additional Opportunities:
Lease space to a local Community-Supported Agriculture group – food grown on campus could provide a local alternative for the cafeterias.
3.3 Transportation In 2007, transportation emissions, including those from the University fleet, stu-dent, faculty, and staff commuters, and air travel accounted for 26.9 percent of all University emissions. The largest share was from commuting (14.4 percent). By managing traffic demand with a variety of physical, educational, and financial strategies, campuses can sustain or create more green space while helping miti-gate their carbon footprint. Transportation alternatives must be available for the commuter, and tools must be provided to link commuters with these alternatives and to educate them about advantages of reduced driving. The CAP, in parallel with the master plan, identifies a suite of Transportation Demand Management (TDM) strategies (see Table 3-2) that are feasible but that also seriously address transportation emissions. Because traffic modeling was a focus of the campus master plan, numerical data were readily available. GHG emissions reductions are provided, and represent percent reduction relative to business as usual for 2030. Extending light rail to North and South campuses is included in the Master Plan. Because this initiative is largely out of the control of UB, this measure is not included as a TDM here. UB supports light rail extension, and an investment in that infrastructure could have many benefits to UB and to the community.
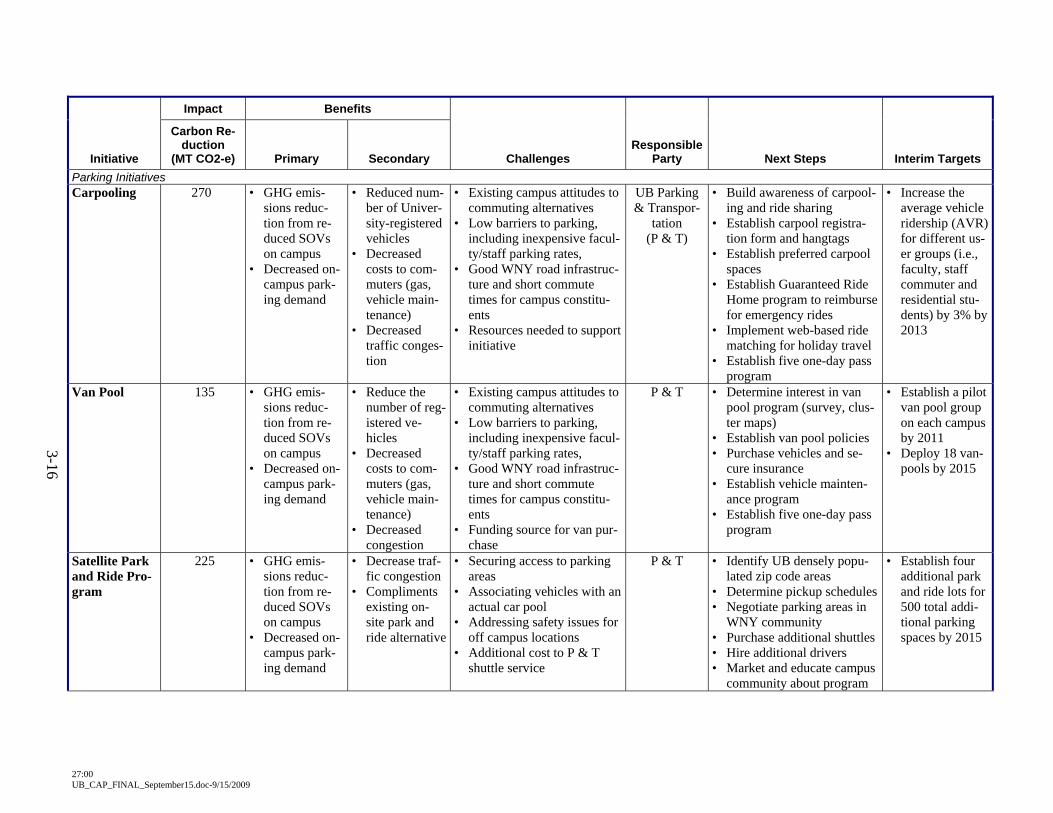
3-16
27:00 UB_CAP_FINAL_September15.doc-9/15/2009
Initiative
Impact Benefits
Carbon Re-duction
(MT CO2-e) Primary Secondary Challenges Responsible
Party Next Steps Interim Targets Parking Initiatives Carpooling 270 • GHG emis-
sions reduc-tion from re-duced SOVs on campus
• Decreased on-campus park-ing demand
• Reduced num-ber of Univer-sity-registered vehicles
• Decreased costs to com-muters (gas, vehicle main-tenance)
• Decreased traffic conges-tion
• Existing campus attitudes to commuting alternatives
• Low barriers to parking, including inexpensive facul-ty/staff parking rates,
• Good WNY road infrastruc-ture and short commute times for campus constitu-ents
• Resources needed to support initiative
UB Parking & Transpor-
tation (P & T)
• Build awareness of carpool-ing and ride sharing
• Establish carpool registra-tion form and hangtags
• Establish preferred carpool spaces
• Establish Guaranteed Ride Home program to reimburse for emergency rides
• Implement web-based ride matching for holiday travel
• Establish five one-day pass program
• Increase the average vehicle ridership (AVR) for different us-er groups (i.e., faculty, staff commuter and residential stu-dents) by 3% by 2013
Van Pool 135 • GHG emis-sions reduc-tion from re-duced SOVs on campus
• Decreased on-campus park-ing demand
• Reduce the number of reg-istered ve-hicles
• Decreased costs to com-muters (gas, vehicle main-tenance)
• Decreased congestion
• Existing campus attitudes to commuting alternatives
• Low barriers to parking, including inexpensive facul-ty/staff parking rates,
• Good WNY road infrastruc-ture and short commute times for campus constitu-ents
• Funding source for van pur-chase
P & T • Determine interest in van pool program (survey, clus-ter maps)
• Establish van pool policies • Purchase vehicles and se-
cure insurance • Establish vehicle mainten-
ance program • Establish five one-day pass
program
• Establish a pilot van pool group on each campus by 2011
• Deploy 18 van-pools by 2015
Satellite Park and Ride Pro-gram
225 • GHG emis-sions reduc-tion from re-duced SOVs on campus
• Decreased on-campus park-ing demand
• Decrease traf-fic congestion
• Compliments existing on-site park and ride alternative
• Securing access to parking areas
• Associating vehicles with an actual car pool
• Addressing safety issues for off campus locations
• Additional cost to P & T shuttle service
P & T • Identify UB densely popu-lated zip code areas
• Determine pickup schedules• Negotiate parking areas in
WNY community • Purchase additional shuttles • Hire additional drivers • Market and educate campus
community about program
• Establish four additional park and ride lots for 500 total addi-tional parking spaces by 2015
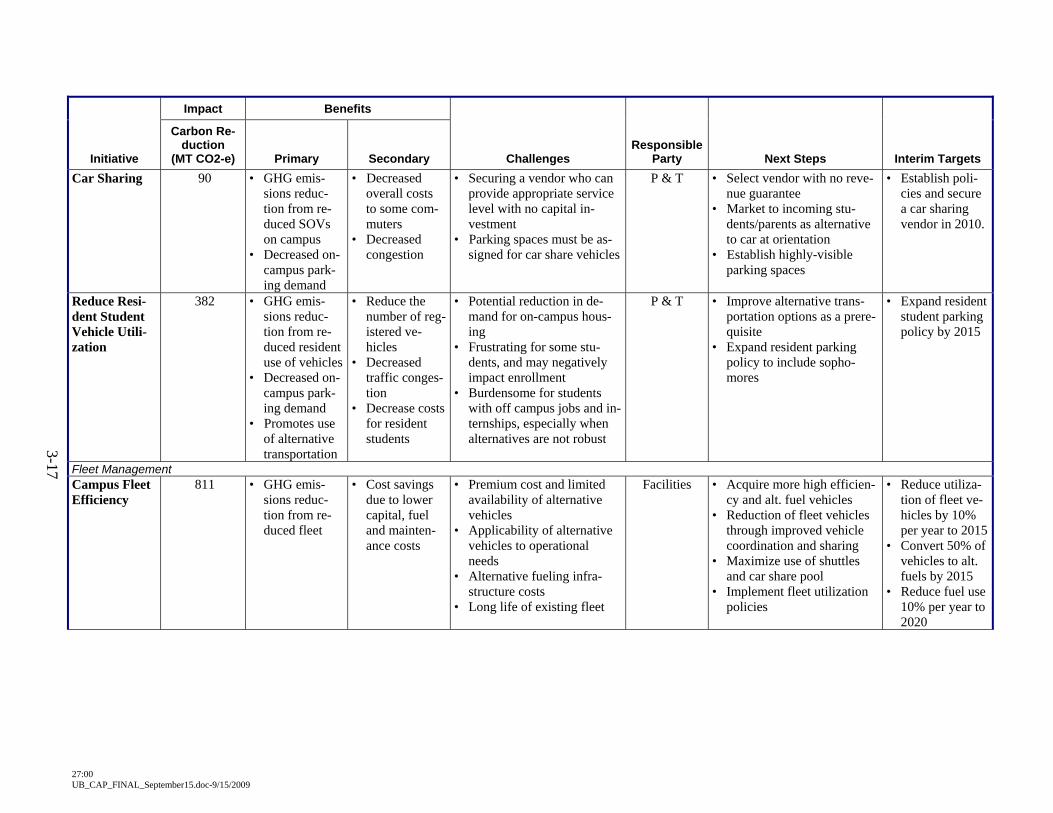
3-17
27:00 UB_CAP_FINAL_September15.doc-9/15/2009
Initiative
Impact Benefits
Carbon Re-duction
(MT CO2-e) Primary Secondary Challenges Responsible
Party Next Steps Interim Targets Car Sharing 90 • GHG emis-
sions reduc-tion from re-duced SOVs on campus
• Decreased on-campus park-ing demand
• Decreased overall costs to some com-muters
• Decreased congestion
• Securing a vendor who can provide appropriate service level with no capital in-vestment
• Parking spaces must be as-signed for car share vehicles
P & T • Select vendor with no reve-nue guarantee
• Market to incoming stu-dents/parents as alternative to car at orientation
• Establish highly-visible parking spaces
• Establish poli-cies and secure a car sharing vendor in 2010.
Reduce Resi-dent Student Vehicle Utili-zation
382 • GHG emis-sions reduc-tion from re-duced resident use of vehicles
• Decreased on-campus park-ing demand
• Promotes use of alternative transportation
• Reduce the number of reg-istered ve-hicles
• Decreased traffic conges-tion
• Decrease costs for resident students
• Potential reduction in de-mand for on-campus hous-ing
• Frustrating for some stu-dents, and may negatively impact enrollment
• Burdensome for students with off campus jobs and in-ternships, especially when alternatives are not robust
P & T • Improve alternative trans-portation options as a prere-quisite
• Expand resident parking policy to include sopho-mores
• Expand resident student parking policy by 2015
Fleet Management Campus Fleet Efficiency
811 • GHG emis-sions reduc-tion from re-duced fleet
• Cost savings due to lower capital, fuel and mainten-ance costs
• Premium cost and limited availability of alternative vehicles
• Applicability of alternative vehicles to operational needs
• Alternative fueling infra-structure costs
• Long life of existing fleet
Facilities • Acquire more high efficien-cy and alt. fuel vehicles
• Reduction of fleet vehicles through improved vehicle coordination and sharing
• Maximize use of shuttles and car share pool
• Implement fleet utilization policies
• Reduce utiliza-tion of fleet ve-hicles by 10% per year to 2015
• Convert 50% of vehicles to alt. fuels by 2015
• Reduce fuel use 10% per year to 2020
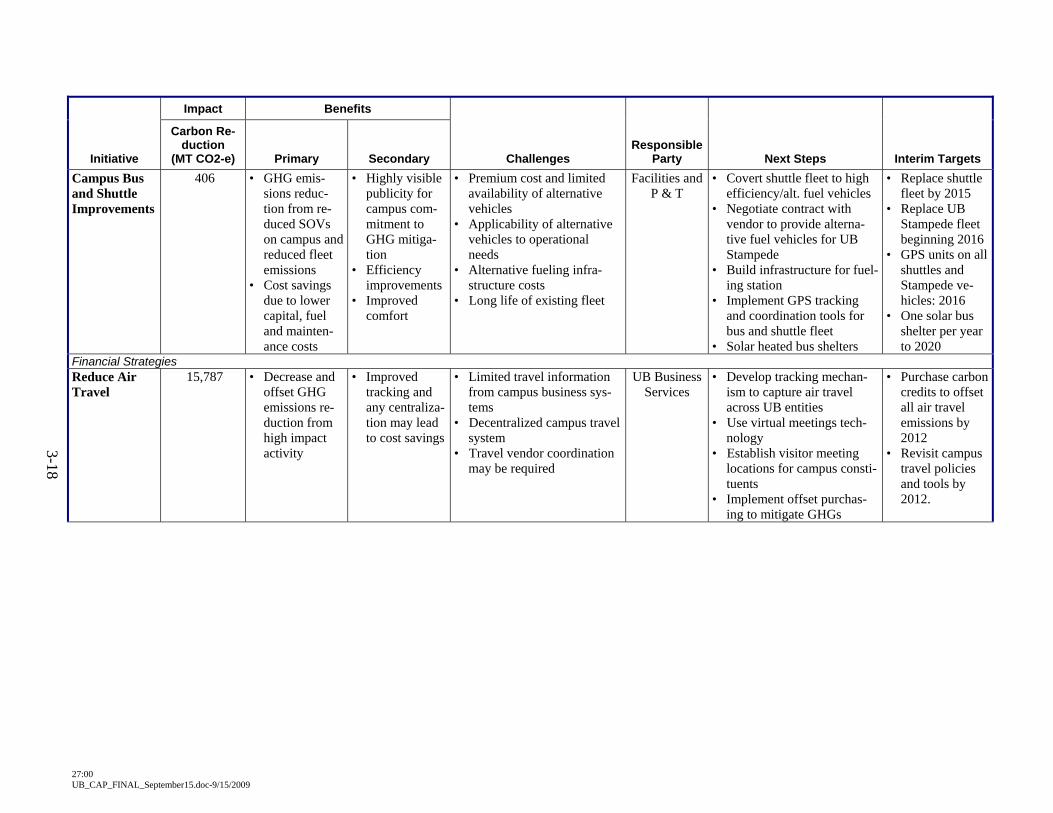
3-18
27:00 UB_CAP_FINAL_September15.doc-9/15/2009
Initiative
Impact Benefits
Carbon Re-duction
(MT CO2-e) Primary Secondary Challenges Responsible
Party Next Steps Interim Targets Campus Bus and Shuttle Improvements
406 • GHG emis-sions reduc-tion from re-duced SOVs on campus and reduced fleet emissions
• Cost savings due to lower capital, fuel and mainten-ance costs
• Highly visible publicity for campus com-mitment to GHG mitiga-tion
• Efficiency improvements
• Improved comfort
• Premium cost and limited availability of alternative vehicles
• Applicability of alternative vehicles to operational needs
• Alternative fueling infra-structure costs
• Long life of existing fleet
Facilities and P & T
• Covert shuttle fleet to high efficiency/alt. fuel vehicles
• Negotiate contract with vendor to provide alterna-tive fuel vehicles for UB Stampede
• Build infrastructure for fuel-ing station
• Implement GPS tracking and coordination tools for bus and shuttle fleet
• Solar heated bus shelters
• Replace shuttle fleet by 2015
• Replace UB Stampede fleet beginning 2016
• GPS units on all shuttles and Stampede ve-hicles: 2016
• One solar bus shelter per year to 2020
Financial Strategies Reduce Air Travel
15,787 • Decrease and offset GHG emissions re-duction from high impact activity
• Improved tracking and any centraliza-tion may lead to cost savings
• Limited travel information from campus business sys-tems
• Decentralized campus travel system
• Travel vendor coordination may be required
UB Business Services
• Develop tracking mechan-ism to capture air travel across UB entities
• Use virtual meetings tech-nology
• Establish visitor meeting locations for campus consti-tuents
• Implement offset purchas-ing to mitigate GHGs
• Purchase carbon credits to offset all air travel emissions by 2012
• Revisit campus travel policies and tools by 2012.
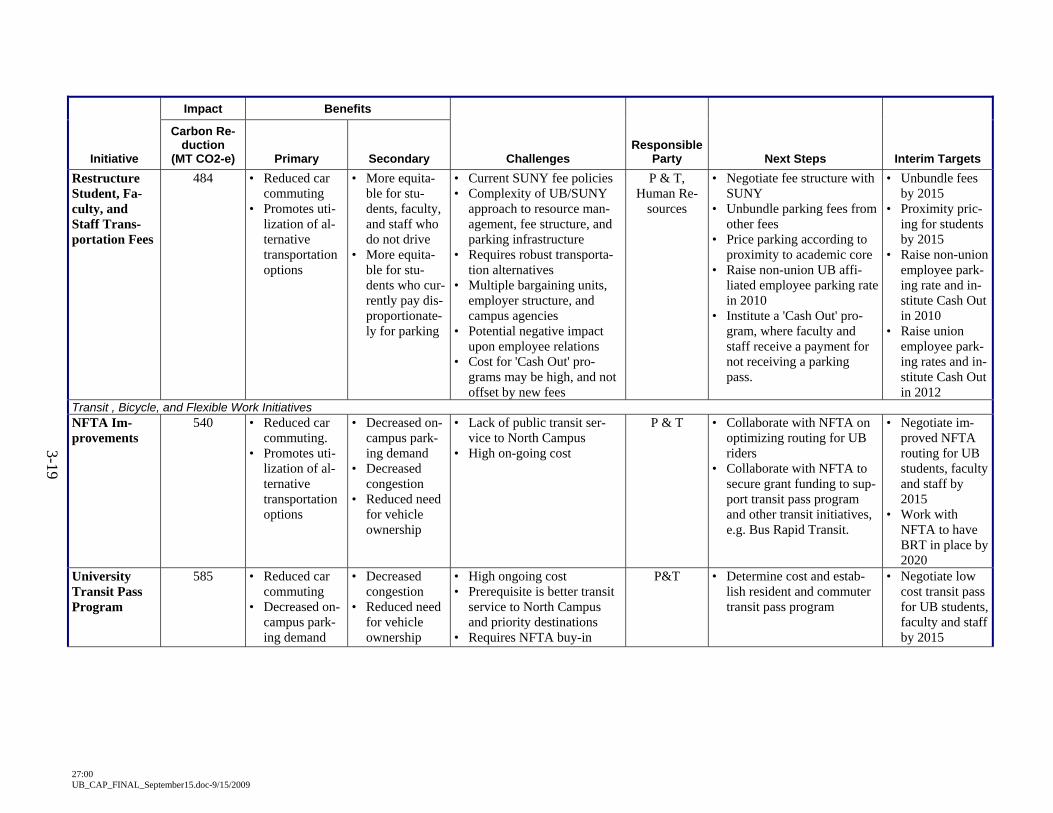
3-19
27:00 UB_CAP_FINAL_September15.doc-9/15/2009
Initiative
Impact Benefits
Carbon Re-duction
(MT CO2-e) Primary Secondary Challenges Responsible
Party Next Steps Interim Targets Restructure Student, Fa-culty, and Staff Trans-portation Fees
484 • Reduced car commuting
• Promotes uti-lization of al-ternative transportation options
• More equita-ble for stu-dents, faculty, and staff who do not drive
• More equita-ble for stu-dents who cur-rently pay dis-proportionate-ly for parking
• Current SUNY fee policies • Complexity of UB/SUNY
approach to resource man-agement, fee structure, and parking infrastructure
• Requires robust transporta-tion alternatives
• Multiple bargaining units, employer structure, and campus agencies
• Potential negative impact upon employee relations
• Cost for 'Cash Out' pro-grams may be high, and not offset by new fees
P & T, Human Re-
sources
• Negotiate fee structure with SUNY
• Unbundle parking fees from other fees
• Price parking according to proximity to academic core
• Raise non-union UB affi-liated employee parking rate in 2010
• Institute a 'Cash Out' pro-gram, where faculty and staff receive a payment for not receiving a parking pass.
• Unbundle fees by 2015
• Proximity pric-ing for students by 2015
• Raise non-union employee park-ing rate and in-stitute Cash Out in 2010
• Raise union employee park-ing rates and in-stitute Cash Out in 2012
Transit , Bicycle, and Flexible Work Initiatives NFTA Im-provements
540 • Reduced car commuting.
• Promotes uti-lization of al-ternative transportation options
• Decreased on-campus park-ing demand
• Decreased congestion
• Reduced need for vehicle ownership
• Lack of public transit ser-vice to North Campus
• High on-going cost
P & T • Collaborate with NFTA on optimizing routing for UB riders
• Collaborate with NFTA to secure grant funding to sup-port transit pass program and other transit initiatives, e.g. Bus Rapid Transit.
• Negotiate im-proved NFTA routing for UB students, faculty and staff by 2015
• Work with NFTA to have BRT in place by 2020
University Transit Pass Program
585 • Reduced car commuting
• Decreased on-campus park-ing demand
• Decreased congestion
• Reduced need for vehicle ownership
• High ongoing cost • Prerequisite is better transit
service to North Campus and priority destinations
• Requires NFTA buy-in
P&T • Determine cost and estab-lish resident and commuter transit pass program
• Negotiate low cost transit pass for UB students, faculty and staff by 2015
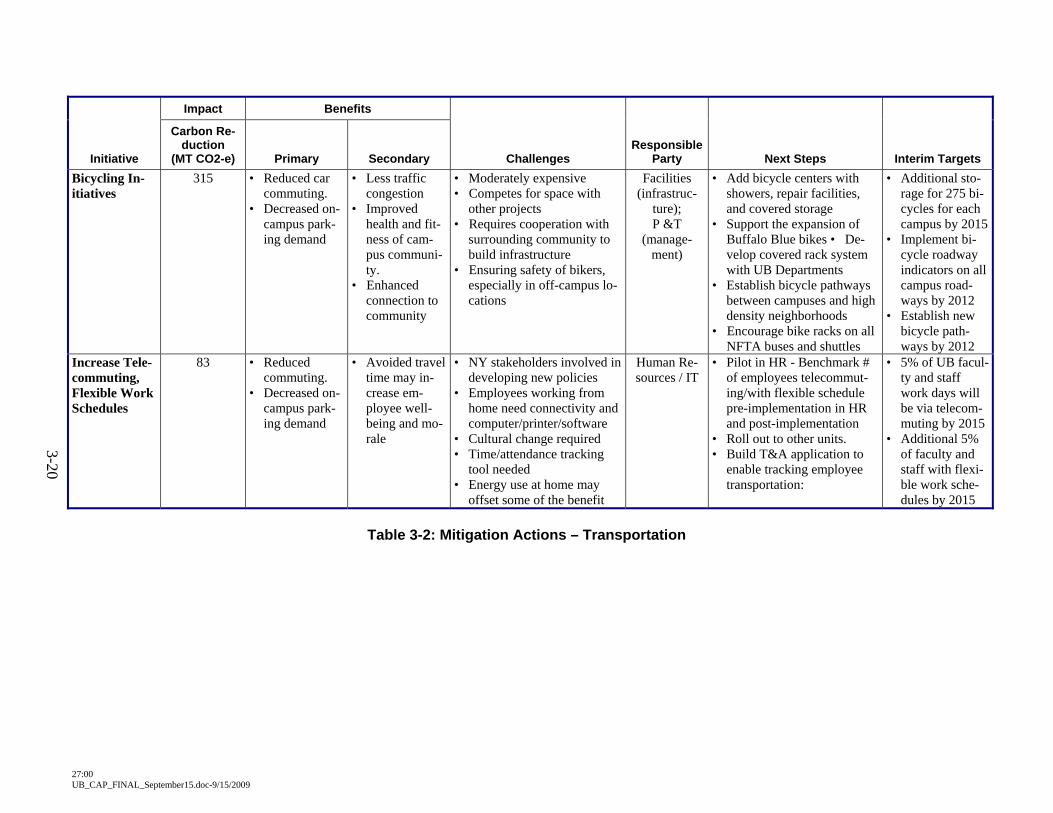
3-20
27:00 UB_CAP_FINAL_September15.doc-9/15/2009
Initiative
Impact Benefits
Carbon Re-duction
(MT CO2-e) Primary Secondary Challenges Responsible
Party Next Steps Interim Targets Bicycling In-itiatives
315
• Reduced car commuting.
• Decreased on-campus park-ing demand
• Less traffic congestion
• Improved health and fit-ness of cam-pus communi-ty.
• Enhanced connection to community
• Moderately expensive • Competes for space with
other projects • Requires cooperation with
surrounding community to build infrastructure
• Ensuring safety of bikers, especially in off-campus lo-cations
Facilities (infrastruc-
ture); P &T
(manage-ment)
• Add bicycle centers with showers, repair facilities, and covered storage
• Support the expansion of Buffalo Blue bikes • De-velop covered rack system with UB Departments
• Establish bicycle pathways between campuses and high density neighborhoods
• Encourage bike racks on all NFTA buses and shuttles
• Additional sto-rage for 275 bi-cycles for each campus by 2015
• Implement bi-cycle roadway indicators on all campus road-ways by 2012
• Establish new bicycle path-ways by 2012
Increase Tele-commuting, Flexible Work Schedules
83 • Reduced commuting.
• Decreased on-campus park-ing demand
• Avoided travel time may in-crease em-ployee well-being and mo-rale
• NY stakeholders involved in developing new policies
• Employees working from home need connectivity and computer/printer/software
• Cultural change required • Time/attendance tracking
tool needed • Energy use at home may
offset some of the benefit
Human Re-sources / IT
• Pilot in HR - Benchmark # of employees telecommut-ing/with flexible schedule pre-implementation in HR and post-implementation
• Roll out to other units. • Build T&A application to
enable tracking employee transportation:
• 5% of UB facul-ty and staff work days will be via telecom-muting by 2015
• Additional 5% of faculty and staff with flexi-ble work sche-dules by 2015
Table 3-2: Mitigation Actions – Transportation
3. Actions to Mitigate Greenhouse Gas Emissions
27:00 3-21 UB_CAP_FINAL_September15.doc-9/15/2009
3.3.1 Carpooling UB will capitalize on new and existing tools to encourage carpooling. The Good Going WNY web site provides GIS-based, dynamic ride matching, and this exist-ing resource can be adapted for University users. This site can match regular commuters or serve as a ride board to allow ride matching for long distance trips. As well, social networking sites such as Facebook™ can host rideshare applica-tions that allow commuters to identify trusted matches with similar transportation needs. Additional Opportunities:
Explore implementation of a guaranteed ride home program to provide taxi or other transportation for alternative commuters during personal emergencies or last-minute work schedule changes. This program could provide for a limited number of taxi trips per year.
Provide incentives for carpooling with raffles and prizes, which could be linked to campus sustainability events (see Section 4.4.3).
Use ride matching tools to accurately track carpooling, and to assess suc-cess for optimization initiatives.
3.3.2 Van Pool Programs Vanpools involve using UB-owned vans to provide commuting services to faculty and staff. This can be a very cost-effective option, with federal and state funding supporting the capital cost of the vans, and commuters sometimes paying modest fees to support operation of the program. A UB vanpool program will be set up to provide outreach and tools for identifying vanpool groups and designing routes. Additional Opportunities:
Provide incentives and outreach to faculty and staff to join vanpools. Deploy real time ride matching software to allow commuters to identify
spaces in existing vanpools. 3.3.3 Satellite Park and Ride Program Additional park and ride lots will be set up in outlying areas, and will be served by buses contracted to UB. The lots will be located strategically to best serve UB commuters. Cost savings may be obtained by using existing parking lots that have capacity during weekdays. Additional Opportunities:
Deploy GIS and mobile device tools to allow commuters to anticipate shuttles.
3. Actions to Mitigate Greenhouse Gas Emissions
27:00 3-22 UB_CAP_FINAL_September15.doc-9/15/2009
3.3.4 Car Sharing Program In this program, UB will set up a membership-based car sharing system for UB staff, faculty, and (potentially) students, in which individuals can reserve and use a vehicle as needed. Vehicles would be parked in specified parking spaces and web-based reservations and electric keying would facilitate control of vehicles. This program might be facilitated by a partnership with a non-profit entity or a company such as ZipCar. Currently, a community not-for-profit is organizing a program in the City of Buffalo that might be expanded to UB. Additional Opportunities:
Coordinate with carpool and vanpool to provide flexibility to users of these programs, including free pass programs.
3.3.5 Reduce Resident Student Vehicle Use Parking restrictions are a powerful tool to encourage alternative transportation. Under this TDM strategy, limits will be placed on parking for resident students, encouraging students to use other transportation modes. The campus master plan for UB includes many features that make the campuses more cohesive and walka-ble. Limiting parking for resident students will encourage a car-free lifestyle cen-tered on the campus community. Additional Opportunities:
Provide outreach to parents and students about transportation alternatives so they understand how students can function without a car on campus.
Evaluate the feasibility of restricting entire segments of the student body from parking on campus.
3.3.6 Campus Fleet Improvements Currently UB has state energy efficiency mandates for its fleet and has purchased alternative-fuel vehicles. These include 56 compressed natural gas (CNG) ve-hicles, five hybrid vehicles, and ten electric vehicles. Additionally, the UB diesel fleet is fueled with a blend of bio- and petroleum diesel. UB will continue to in-crease the use of higher efficiency and non-fossil fuel based vehicles. Additional Opportunities:
Expand infrastructure for fueling and electrification of campus fleet to serve faculty, student, and staff vehicles.
3. Actions to Mitigate Greenhouse Gas Emissions
27:00 3-23 UB_CAP_FINAL_September15.doc-9/15/2009
3.3.7 Campus Bus and Shuttle Improvements In addition to fleet conversion, UB will take advantage of opportunities to optim-ize the campus shuttle system to enhance rider experience and improve ridership, including installing GPS tracking software to optimize routing and provide notifi-cations via mobile devices to waiting riders. Outreach will be improved to better inform the UB community about availability of shuttle and buses. Engineering and architecture researchers at UB have won a federal grant to design a prototype solar heated all-weather bus shelter which will be installed on campus to protect riders during inclement weather. Additional Opportunities:
Use upgrades to bus and shuttle tracking as an opportunity for student re-search, particularly for GIS students.
3.3.8 Reduce Air Travel Emissions through Mandatory Offsets Air travel emissions account for more than 9 percent of emissions at UB, and this may increase as the university becomes a more prominent global institution. Air travel emissions will be reduced both by providing tools that allow faculty and staff to avoid traveling to meetings (see Section 3.3.13), and by purchasing carbon credits to offset air travel emissions. This action requires that all travel booked through the university be linked to a mandatory offset purchasing program, ensur-ing that emissions are mitigated while creating a new disincentive to unnecessary travel. Better tracking is needed to fully understand air travel at UB. Full centrali-zation of travel services might provide cost savings and will be investigated. Additional Opportunities:
Purchase/develop offsets for local projects such as home weatherization. Improve route selection to include consideration of a trip’s GHG impact.
3.3.9 Restructure Student, Faculty, and Staff Parking and
Transportation Fees At UB, students pay most of the costs for the parking system through a mandatory flat parking and transportation fee. Students pay a flat fee which permits them to park on campus and supports the operation of the UB Stampede and shuttle bus system. Annual faculty and staff parking fees are set at less than $10.00 per car per year. This is less than the fee (not adjusted for inflation) for parking in 1954. This TDM will unbundle the student parking and transportation fee, increasing the parking costs for those students choosing to purchase a parking pass and eliminat-ing the parking portion of the fee for those who do not drive to campus. Individu-als who drive would pay the cost of parking and transit.
3. Actions to Mitigate Greenhouse Gas Emissions
27:00 3-24 UB_CAP_FINAL_September15.doc-9/15/2009
A related TDM would also involve raising fees for faculty and staff parking through a “cash out” system. All personnel would receive a cash allowance equivalent to the new, higher cost of a parking permit, which they could choose to spend on a parking hang tag or a transit pass or keep for other purposes if they chose to get to campus by other means. These TDMs restructure parking fees (among others) in way that will allow indi-viduals to make informed decisions regarding resource use based on the actual cost of the good or service. It will also equitably realign parking costs across stu-dents, faculty, staff, and the university. Additional opportunities:
Use proximity pricing in which faculty and staff can park closer to the center of campus for a premium fee. This will also give choices to person-nel of how to allocate resources while it raises additional funds to finance climate neutrality initiatives. It also makes more efficient use of parking facilities, encourages use of alternative transportation, and promotes phys-ical exercise – all by making it more costly to use the most convenient parking.
3.3.10 Transit Bus Service Improvements While South Campus is home to a NFTA Metro Rail station and Metro Bus hub, only one bus line comes onto North Campus, effectively obliging most non-resident students, faculty, and staff to drive to campus. Our campus master plan calls for collaboration with NFTA to improve bus service by creating new routes that connect population centers in the vicinity with North Campus. The university will also work with NFTA make sure bus and rail service is aligned with on-campus transportation to promote ridership by UB personnel. We will also work with NFTA to create a Bus Rapid Transit (BRT) system be-tween North and South campuses as an interim step in the development of light rail to North Campus. This would involve improved shelters, signal preemptions, queue jumping, and partial rights of way for buses on this route. 3.3.11 University Transit Pass Program UB will assess the viability of providing students, faculty and with an unlimited-use bus pass without charge to individual participants. The university will try to use its scale to leverage an economical agreement with NFTA that will make this feasible. Additional Opportunities:
Tighter coordination among various UB initiatives and NFTA services may allow for a tool that could be deployed on mobile devices to allow
3. Actions to Mitigate Greenhouse Gas Emissions
27:00 3-25 UB_CAP_FINAL_September15.doc-9/15/2009
users to identify the best transportation option for a particular trip, includ-ing carpools, vanpools, car share, Stampede, and NFTA bus and rail.
3.3.12 Bicycle Initiatives UB will implement as part of our campus master plan a comprehensive package of initiatives to support the use of bicycles year round, including covered bicycle parking, showers and changing rooms for bike commuters, designation of bike paths and lanes on campus, provision of bike routes between campuses, and other bicycle infrastructure. Another program to be developed will loan students a bicycle free for any year for which they do not purchase a parking permit or use other transportation alterna-tives. Partnership with a private organization (e.g. Buffalo Blue Bikes) might faci-litate this initiative. Additional Opportunities:
Coordinate with NFTA to ensure that all buses serving UB are equipped with bicycle racks. Not all NFTA buses have racks, making this an unpre-dictable mode of transportation for bicycle riders.
Partner with Buffalo Blue Bikes and off-campus vendors for maintenance. 3.3.13 Increase Telecommuting and Use of Flexible Work Schedules Faculty and staff work patterns have an important impact on GHG emissions. UB will work to establish a flexible work program and better incorporate telecommut-ing and web conferencing capabilities into the university infrastructure to reduce travel, save energy, and avoid emissions. The Office of Human Resources is now testing the potential of flexible work arrangements to reduce emissions associated with commuting. UB currently includes webcams and microphones in the UB 2020-standard desk-tops and laptops that comprise 90 percent of UB’s institutional computer purchas-es. UB also uses web conferencing technologies for meetings, collaborative work, conferences, tele-working, and to create virtual classrooms. This allows em-ployees to work from home and avoid unnecessary business travel. It also enables faculty to establish e-learning programs that feature virtual classrooms. These so-lutions will have benefits for UB, but may actually increase an employee’s emis-sions at home, due to off-hours heating. This merits further study. Additional Opportunities:
Use high-end web meeting tools that allow participants to have the percep-tion of an in-person meeting, including eye contact.
3. Actions to Mitigate Greenhouse Gas Emissions
27:00 3-26 UB_CAP_FINAL_September15.doc-9/15/2009
3.4 Materials Many of the materials used at UB – food, building supplies and equipment, paper, computers, etc. – exert only a small part of their lifecycle carbon emissions at UB. The raw materials are extracted elsewhere, the products are manufactured else-where, and eventually they will be disposed of elsewhere. For UB, the bulk of the emissions associated with these products is considered Scope 3 – not under our direct control. Nevertheless, UB’s decisions on material use, purchasing, and dis-posal have a direct impact on the environment and global climate change. While the majority of these emissions may not appear in UB’s GHG inventory, they are considered in the CAP. Initiatives to reduce materials-related GHG emissions have been grouped into three categories, and are presented as such in Table 3-3:
Material use reduction programs Green purchasing Waste management
3.4.1 Campus-wide Material Use Reduction Policy and Taskforce At present, there is no centralized effort to reduce material use at UB. Efforts are taken on a unit-by-unit basis, with some coordination through the ESC and UB Green. Baseline data on material use on campus are unavailable or fragmented. There is no central mechanism or forum for dissemination and discussion of the results of pilot projects. To fill this gap, a priority action is to form a Material Use Reduction Taskforce. The taskforce will be charged with developing a campus-wide policy and with gathering baseline data on material flows through the cam-pus. These data will be a prerequisite for quantifying any Scope 3 emissions reduc-tions from improved material efficiency.
3.4.2 Material Reduction Programs There are many ongoing efforts to reduce material use through making processes more efficient on campus. These include efforts to digitize documents and admin-istrative processes, promote double-sided printing and copying, and reduce cafete-ria waste. The results have been signi-
At UB, digitalization of forms and other documents is well under-way. Programs include: • Print Management – Limited Al-
location and Metering for Stu-dent Printing (iPrint)
• Electronic Course Reserves • Online Academic and Business
Processes o eReq – electronic requisi-
tion system for procurement o ePay – e-commerce system
for payments o ePTF – electronic personnel
transaction form o UBJobs – online recruit-
ment and hiring system o COEUS – automated re-
search grant proposal and tracking system
o UBlearns – online course management system that reduces hardcopy distribu-tion of course materials
o WebReg – Web registra-tion, drop/add system for courses
o DARS, TAURUS – online advisement and course arti-culation system
o Digital Course Access – on-line courses
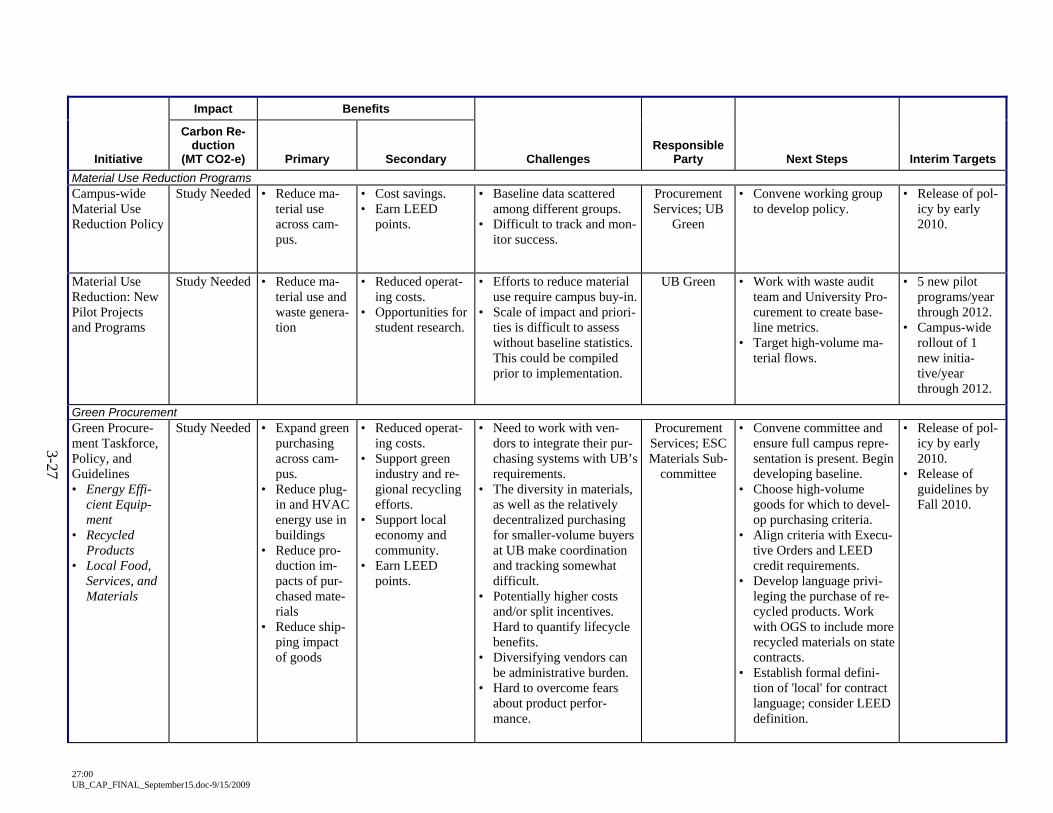
3-27
27:00 UB_CAP_FINAL_September15.doc-9/15/2009
Initiative
Impact Benefits
Carbon Re-duction
(MT CO2-e) Primary Secondary Challenges Responsible
Party Next Steps Interim Targets Material Use Reduction Programs Campus-wide Material Use Reduction Policy
Study Needed • Reduce ma-terial use across cam-pus.
• Cost savings. • Earn LEED
points.
• Baseline data scattered among different groups.
• Difficult to track and mon-itor success.
Procurement Services; UB
Green
• Convene working group to develop policy.
• Release of pol-icy by early 2010.
Material Use Reduction: New Pilot Projects and Programs
Study Needed • Reduce ma-terial use and waste genera-tion
• Reduced operat-ing costs.
• Opportunities for student research.
• Efforts to reduce material use require campus buy-in.
• Scale of impact and priori-ties is difficult to assess without baseline statistics. This could be compiled prior to implementation.
UB Green • Work with waste audit team and University Pro-curement to create base-line metrics.
• Target high-volume ma-terial flows.
• 5 new pilot programs/year through 2012.
• Campus-wide rollout of 1 new initia-tive/year through 2012.
Green Procurement Green Procure-ment Taskforce, Policy, and Guidelines • Energy Effi-
cient Equip-ment
• Recycled Products
• Local Food, Services, and Materials
Study Needed • Expand green purchasing across cam-pus.
• Reduce plug-in and HVAC energy use in buildings
• Reduce pro-duction im-pacts of pur-chased mate-rials
• Reduce ship-ping impact of goods
• Reduced operat-ing costs.
• Support green industry and re-gional recycling efforts.
• Support local economy and community.
• Earn LEED points.
• Need to work with ven-dors to integrate their pur-chasing systems with UB’s requirements.
• The diversity in materials, as well as the relatively decentralized purchasing for smaller-volume buyers at UB make coordination and tracking somewhat difficult.
• Potentially higher costs and/or split incentives. Hard to quantify lifecycle benefits.
• Diversifying vendors can be administrative burden.
• Hard to overcome fears about product perfor-mance.
Procurement Services; ESC Materials Sub-
committee
• Convene committee and ensure full campus repre-sentation is present. Begin developing baseline.
• Choose high-volume goods for which to devel-op purchasing criteria.
• Align criteria with Execu-tive Orders and LEED credit requirements.
• Develop language privi-leging the purchase of re-cycled products. Work with OGS to include more recycled materials on state contracts.
• Establish formal defini-tion of 'local' for contract language; consider LEED definition.
• Release of pol-icy by early 2010.
• Release of guidelines by Fall 2010.
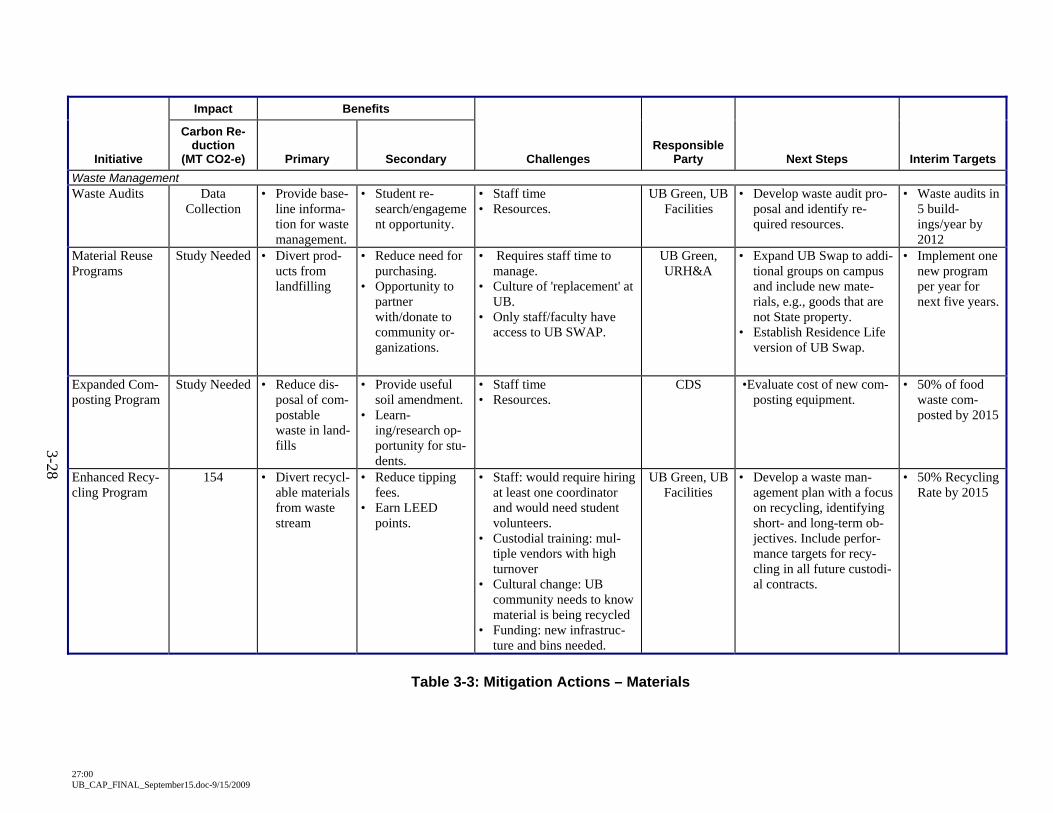
3-28
27:00 UB_CAP_FINAL_September15.doc-9/15/2009
Initiative
Impact Benefits
Carbon Re-duction
(MT CO2-e) Primary Secondary Challenges Responsible
Party Next Steps Interim Targets Waste Management Waste Audits Data
Collection • Provide base-
line informa-tion for waste management.
• Student re-search/engagement opportunity.
• Staff time • Resources.
UB Green, UB Facilities
• Develop waste audit pro-posal and identify re-quired resources.
• Waste audits in 5 build-ings/year by 2012
Material Reuse Programs
Study Needed • Divert prod-ucts from landfilling
• Reduce need for purchasing.
• Opportunity to partner with/donate to community or-ganizations.
• Requires staff time to manage.
• Culture of 'replacement' at UB.
• Only staff/faculty have access to UB SWAP.
UB Green, URH&A
• Expand UB Swap to addi-tional groups on campus and include new mate-rials, e.g., goods that are not State property.
• Establish Residence Life version of UB Swap.
• Implement one new program per year for next five years.
Expanded Com-posting Program
Study Needed • Reduce dis-posal of com-postable waste in land-fills
• Provide useful soil amendment.
• Learn-ing/research op-portunity for stu-dents.
• Staff time • Resources.
CDS •Evaluate cost of new com-posting equipment.
• 50% of food waste com-posted by 2015
Enhanced Recy-cling Program
154 • Divert recycl-able materials from waste stream
• Reduce tipping fees.
• Earn LEED points.
• Staff: would require hiring at least one coordinator and would need student volunteers.
• Custodial training: mul-tiple vendors with high turnover
• Cultural change: UB community needs to know material is being recycled
• Funding: new infrastruc-ture and bins needed.
UB Green, UB Facilities
• Develop a waste man-agement plan with a focus on recycling, identifying short- and long-term ob-jectives. Include perfor-mance targets for recy-cling in all future custodi-al contracts.
• 50% Recycling Rate by 2015
Table 3-3: Mitigation Actions – Materials
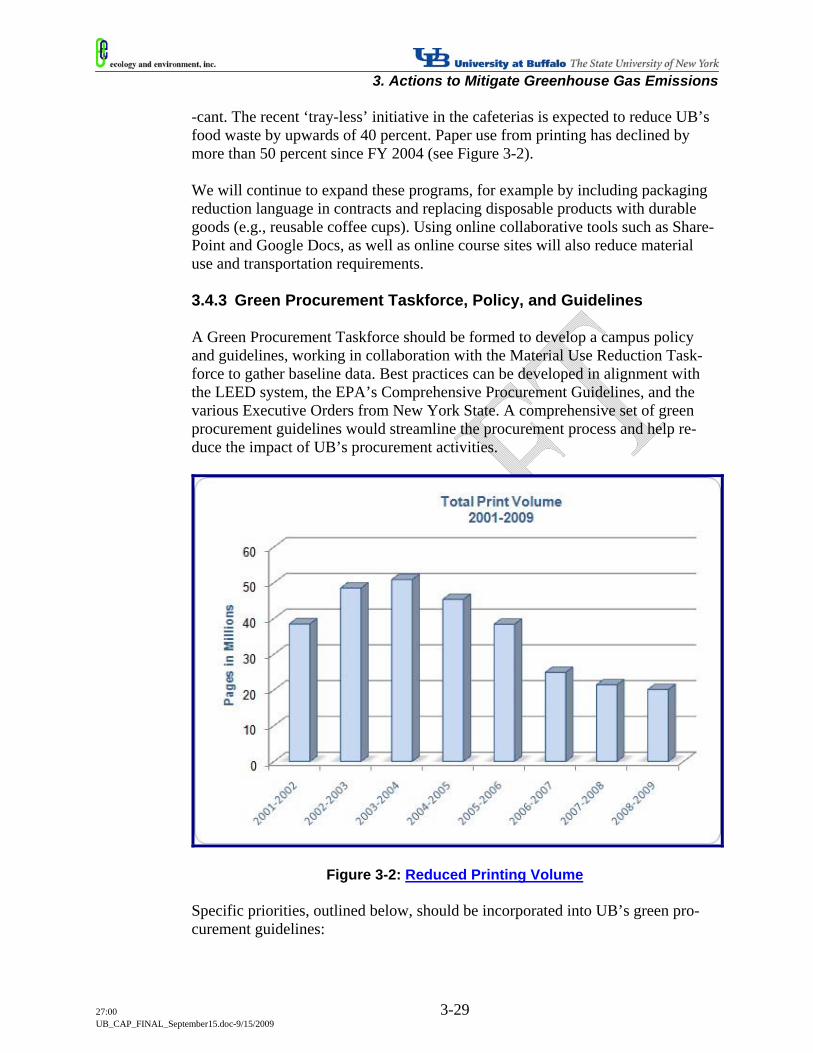
3. Actions to Mitigate Greenhouse Gas Emissions
27:00 3-29 UB_CAP_FINAL_September15.doc-9/15/2009
-cant. The recent ‘tray-less’ initiative in the cafeterias is expected to reduce UB’s food waste by upwards of 40 percent. Paper use from printing has declined by more than 50 percent since FY 2004 (see Figure 3-2). We will continue to expand these programs, for example by including packaging reduction language in contracts and replacing disposable products with durable goods (e.g., reusable coffee cups). Using online collaborative tools such as Share-Point and Google Docs, as well as online course sites will also reduce material use and transportation requirements. 3.4.3 Green Procurement Taskforce, Policy, and Guidelines A Green Procurement Taskforce should be formed to develop a campus policy and guidelines, working in collaboration with the Material Use Reduction Task-force to gather baseline data. Best practices can be developed in alignment with the LEED system, the EPA’s Comprehensive Procurement Guidelines, and the various Executive Orders from New York State. A comprehensive set of green procurement guidelines would streamline the procurement process and help re-duce the impact of UB’s procurement activities.
Figure 3-2: Reduced Printing Volume Specific priorities, outlined below, should be incorporated into UB’s green pro-curement guidelines:
3. Actions to Mitigate Greenhouse Gas Emissions
27:00 3-30 UB_CAP_FINAL_September15.doc-9/15/2009
Energy Efficient Equipment. Green procurement can impact Scope 1 and 2 emissions: powered equipment such as computers, fax machines, and copiers use substantial amounts of electricity and increase a building’s cooling load. UB has begun to take action to address this: at present, more than 90 percent of computers purchased at UB are Energy Star-labeled. We will require that all equipment (where available) be Energy Star or EPEAT-labeled. As well, the taskforce will work with research staff to prioritize high-efficiency tech-nical equipment. Equipment guidelines are outlined in the UB 2020 Worksta-tion Standards, and will be expanded.
Recycled Products. UB will increase the purchasing of recycled products to reduce emissions associated with extracting and processing raw materials. By leveraging its massive buying power, we will help to support green industry and shape the market. In December 2008, UB switched to 100 percent post-consumer recycled content paper, and at present, 92 percent of all copy paper consumed meets this criterion.
Local Foods, Services, and Materials. Shipping and distribution of products
and materials has a climate change impact that can sometimes be avoided through the use of local suppliers. Procuring materials locally can help stimu-late local business and earn LEED points. As evidenced by the fall 2008 Sus-tainability Forum, there is considerable support for local purchasing, especial-ly for food. State contracts and the alumni network can help identify potential local suppliers for goods. Campus Dining & Shops (CDS) purchases some lo-cal foods; expanding this program and incorporating new products and mate-rials will increase the impact.
Additional Opportunities:
Implement the ‘Pride of NY’ buy local program. 3.4.4 Waste Audits Good baseline data is critical to any effort to reduce the generation of waste and divert materials from landfills. UB will establish a program of waste audits, where every building is audited on a regular basis to provide baseline data for the devel-opment of new waste reduction programs and targeted education and outreach. Audits may be performed in-house, using students, or by an outside contractor. Additional opportunities:
Link waste audits to a service-learning or volunteer program to attract stu-dent volunteers and reduce costs.
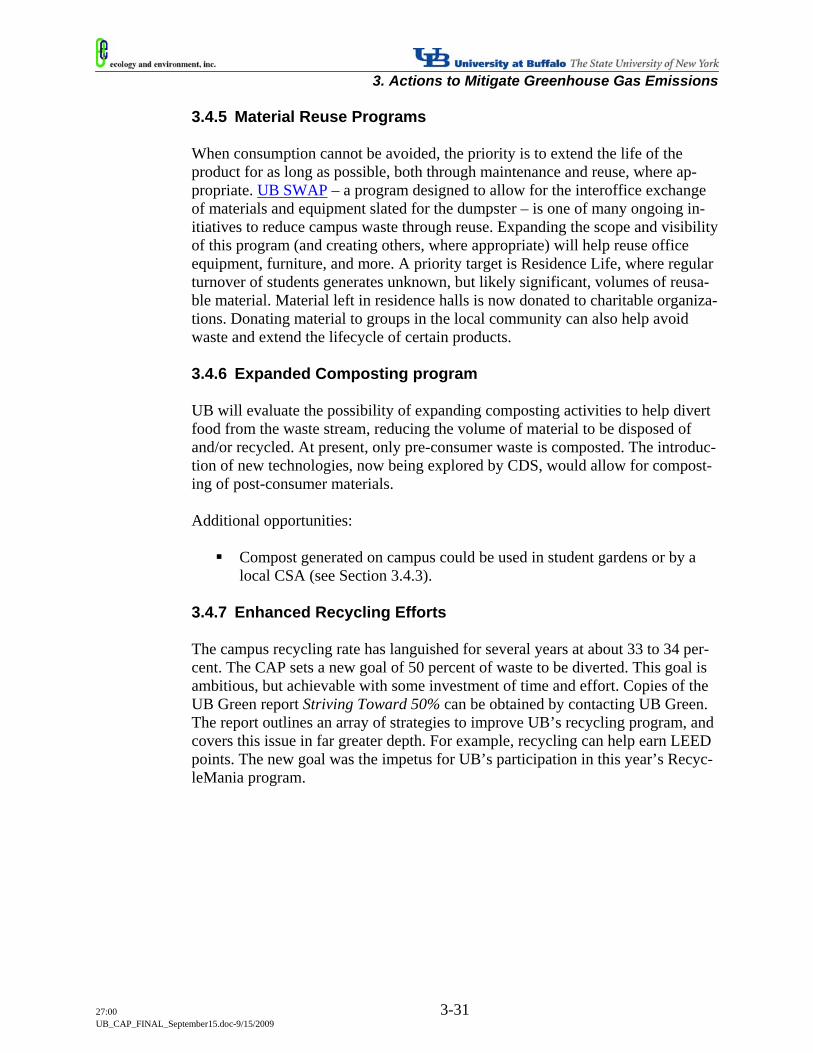
3. Actions to Mitigate Greenhouse Gas Emissions
27:00 3-31 UB_CAP_FINAL_September15.doc-9/15/2009
3.4.5 Material Reuse Programs When consumption cannot be avoided, the priority is to extend the life of the product for as long as possible, both through maintenance and reuse, where ap-propriate. UB SWAP – a program designed to allow for the interoffice exchange of materials and equipment slated for the dumpster – is one of many ongoing in-itiatives to reduce campus waste through reuse. Expanding the scope and visibility of this program (and creating others, where appropriate) will help reuse office equipment, furniture, and more. A priority target is Residence Life, where regular turnover of students generates unknown, but likely significant, volumes of reusa-ble material. Material left in residence halls is now donated to charitable organiza-tions. Donating material to groups in the local community can also help avoid waste and extend the lifecycle of certain products. 3.4.6 Expanded Composting program UB will evaluate the possibility of expanding composting activities to help divert food from the waste stream, reducing the volume of material to be disposed of and/or recycled. At present, only pre-consumer waste is composted. The introduc-tion of new technologies, now being explored by CDS, would allow for compost-ing of post-consumer materials. Additional opportunities:
Compost generated on campus could be used in student gardens or by a local CSA (see Section 3.4.3).
3.4.7 Enhanced Recycling Efforts The campus recycling rate has languished for several years at about 33 to 34 per-cent. The CAP sets a new goal of 50 percent of waste to be diverted. This goal is ambitious, but achievable with some investment of time and effort. Copies of the UB Green report Striving Toward 50% can be obtained by contacting UB Green. The report outlines an array of strategies to improve UB’s recycling program, and covers this issue in far greater depth. For example, recycling can help earn LEED points. The new goal was the impetus for UB’s participation in this year’s Recyc-leMania program.
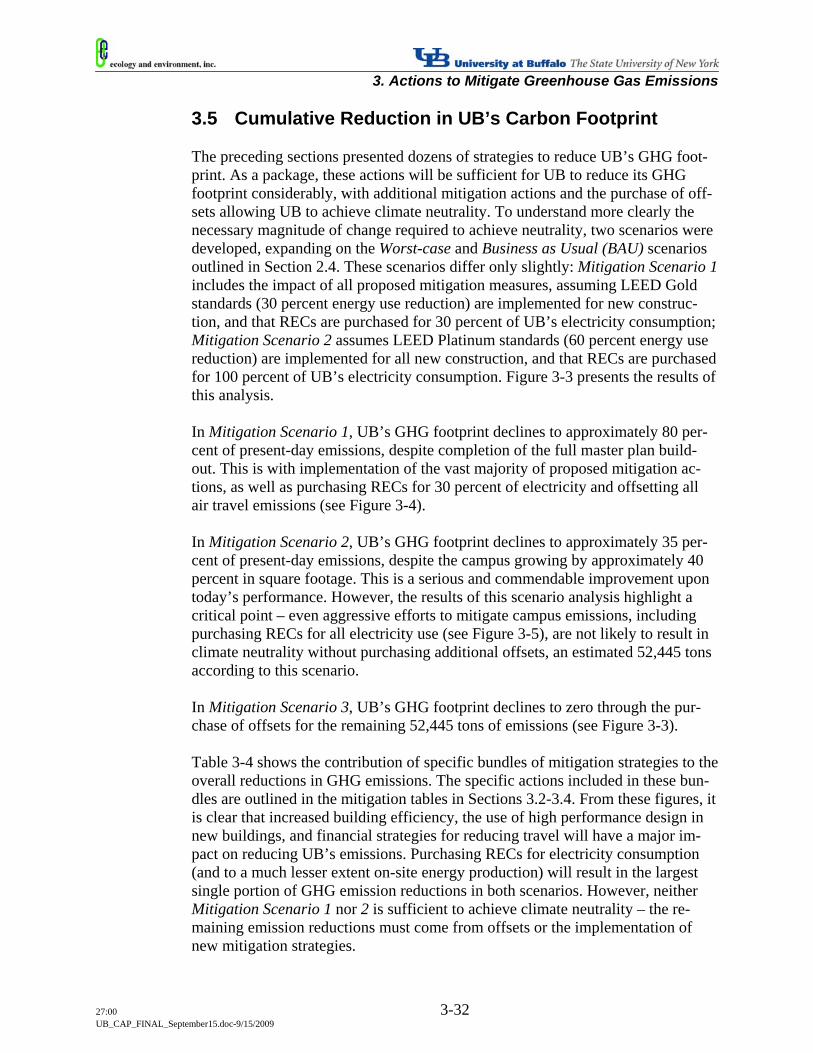
3. Actions to Mitigate Greenhouse Gas Emissions
27:00 3-32 UB_CAP_FINAL_September15.doc-9/15/2009
3.5 Cumulative Reduction in UB’s Carbon Footprint The preceding sections presented dozens of strategies to reduce UB’s GHG foot-print. As a package, these actions will be sufficient for UB to reduce its GHG footprint considerably, with additional mitigation actions and the purchase of off-sets allowing UB to achieve climate neutrality. To understand more clearly the necessary magnitude of change required to achieve neutrality, two scenarios were developed, expanding on the Worst-case and Business as Usual (BAU) scenarios outlined in Section 2.4. These scenarios differ only slightly: Mitigation Scenario 1 includes the impact of all proposed mitigation measures, assuming LEED Gold standards (30 percent energy use reduction) are implemented for new construc-tion, and that RECs are purchased for 30 percent of UB’s electricity consumption; Mitigation Scenario 2 assumes LEED Platinum standards (60 percent energy use reduction) are implemented for all new construction, and that RECs are purchased for 100 percent of UB’s electricity consumption. Figure 3-3 presents the results of this analysis. In Mitigation Scenario 1, UB’s GHG footprint declines to approximately 80 per-cent of present-day emissions, despite completion of the full master plan build-out. This is with implementation of the vast majority of proposed mitigation ac-tions, as well as purchasing RECs for 30 percent of electricity and offsetting all air travel emissions (see Figure 3-4). In Mitigation Scenario 2, UB’s GHG footprint declines to approximately 35 per-cent of present-day emissions, despite the campus growing by approximately 40 percent in square footage. This is a serious and commendable improvement upon today’s performance. However, the results of this scenario analysis highlight a critical point – even aggressive efforts to mitigate campus emissions, including purchasing RECs for all electricity use (see Figure 3-5), are not likely to result in climate neutrality without purchasing additional offsets, an estimated 52,445 tons according to this scenario. In Mitigation Scenario 3, UB’s GHG footprint declines to zero through the pur-chase of offsets for the remaining 52,445 tons of emissions (see Figure 3-3). Table 3-4 shows the contribution of specific bundles of mitigation strategies to the overall reductions in GHG emissions. The specific actions included in these bun-dles are outlined in the mitigation tables in Sections 3.2-3.4. From these figures, it is clear that increased building efficiency, the use of high performance design in new buildings, and financial strategies for reducing travel will have a major im-pact on reducing UB’s emissions. Purchasing RECs for electricity consumption (and to a much lesser extent on-site energy production) will result in the largest single portion of GHG emission reductions in both scenarios. However, neither Mitigation Scenario 1 nor 2 is sufficient to achieve climate neutrality – the re-maining emission reductions must come from offsets or the implementation of new mitigation strategies.
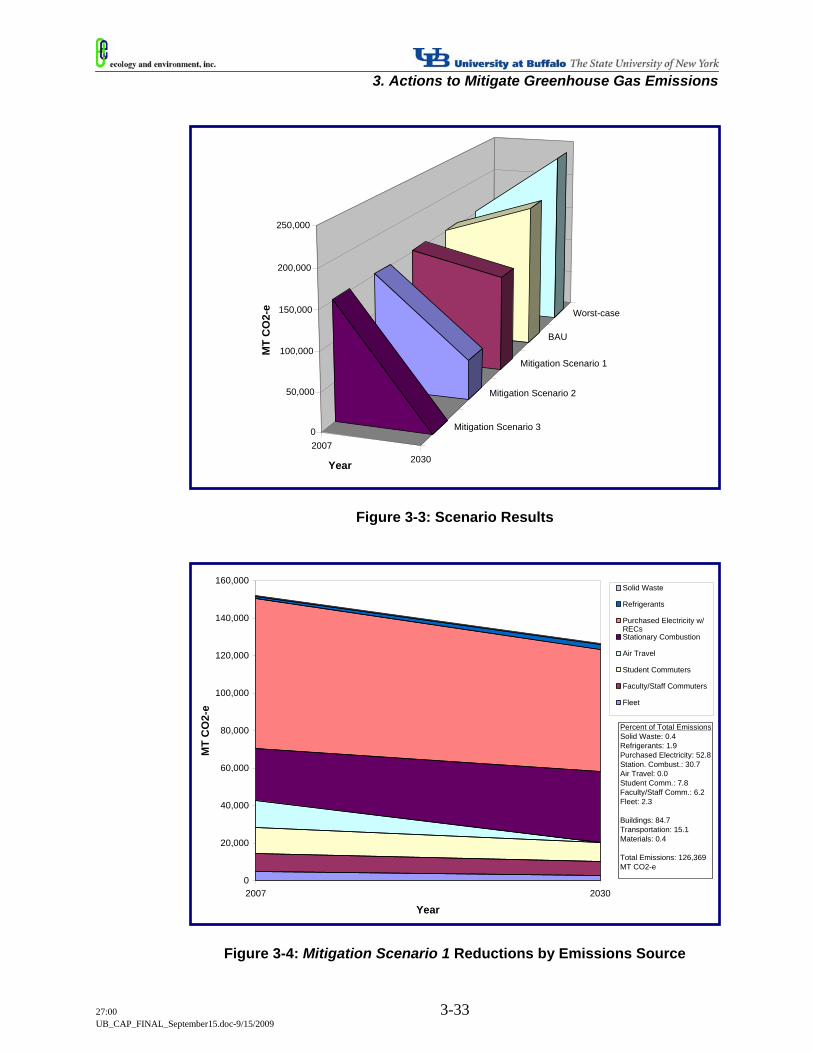
3. Actions to Mitigate Greenhouse Gas Emissions
27:00 3-33 UB_CAP_FINAL_September15.doc-9/15/2009
Figure 3-3: Scenario Results
Figure 3-4: Mitigation Scenario 1 Reductions by Emissions Source
20072030
Mitigation Scenario 3
Mitigation Scenario 2
Mitigation Scenario 1
BAU
Worst-case
0
50,000
100,000
150,000
200,000
250,000
MT
CO
2-e
Year
0
20,000
40,000
60,000
80,000
100,000
120,000
140,000
160,000
2007 2030
Year
MT
CO
2-e
Solid Waste
Refrigerants
Purchased Electricity w/RECsStationary Combustion
Air Travel
Student Commuters
Faculty/Staff Commuters
Fleet
Percent of Total EmissionsSolid Waste: 0.4Refrigerants: 1.9Purchased Electricity: 52.8Station. Combust.: 30.7Air Travel: 0.0Student Comm.: 7.8Faculty/Staff Comm.: 6.2Fleet: 2.3
Buildings: 84.7Transportation: 15.1Materials: 0.4
Total Emissions: 126,369 MT CO2-e
3. Actions to Mitigate Greenhouse Gas Emissions
27:00 3-34 UB_CAP_FINAL_September15.doc-9/15/2009
Figure 3-5: Mitigation Scenario 2 Reductions by Emissions Source
In Mitigation Scenario 3, (see Figure 3-3) 52,445 MT of offsets are purchased for UB’s remaining GHG emissions after Mitigation Scenario 2 has been fully im-plemented. This would allow UB to achieve climate neutrality in 2030. Given that the current offset market in North America is largely voluntary, and that the regu-latory environment is unpredictable (see Appendix B), it is hard to assign a cost to these offsets. Under the Regional Greenhouse Gas Initiative, purchasing allow-ances for these emissions would cost $169,397. At the recent peak price on the European Emissions Trading System, this would have cost $1,714,952. While the costs (and potential benefits) may be uncertain, Mitigation Scenario 3 shows that, through a combination of on-campus efficiency measures, renewable energy, and the purchase of RECs and offsets, UB can achieve climate neutrality by 2030. 3.5.1 Future Opportunities for Mitigating Emissions The next two decades are likely to usher in radical new ideas and technologies, providing new and significant opportunities for reducing GHG emissions on cam-pus. It is difficult to predict now the impact these technologies could have on, for example, the ability to produce renewable energy on site, to increase the efficien-cy of new and existing buildings, and to transport people. If next-generation solar technologies, compact fuel cell technology, large-scale carbon capture and storage technologies, or electrification of the vehicle fleet occurs, the projections dis-cussed in this CAP will quickly become out-of-date, allowing UB to achieve cli-mate neutrality more rapidly and with less recourse to RECs and offsets.
0
20,000
40,000
60,000
80,000
100,000
120,000
140,000
160,000
2007 2030
Year
MT
CO
2-e
Solid Waste
Refrigerants
Purchased Electricity w/RECsStationary Combustion
Air Travel
Student Commuters
Faculty/Staff Commuters
Fleet
Percent of Total EmissionsSolid Waste: 0.9Refrigerants: 4.6Purchased Electricity: 0.0Station. Combust.: 57.9Air Travel: 0.0Student Comm.: 19.0Faculty/Staff Comm.: 15.1Fleet: 5.6
Buildings: 62.5Transportation: 36.6Materials: 0.9
Total Emissions: 52,445 MT CO2-e
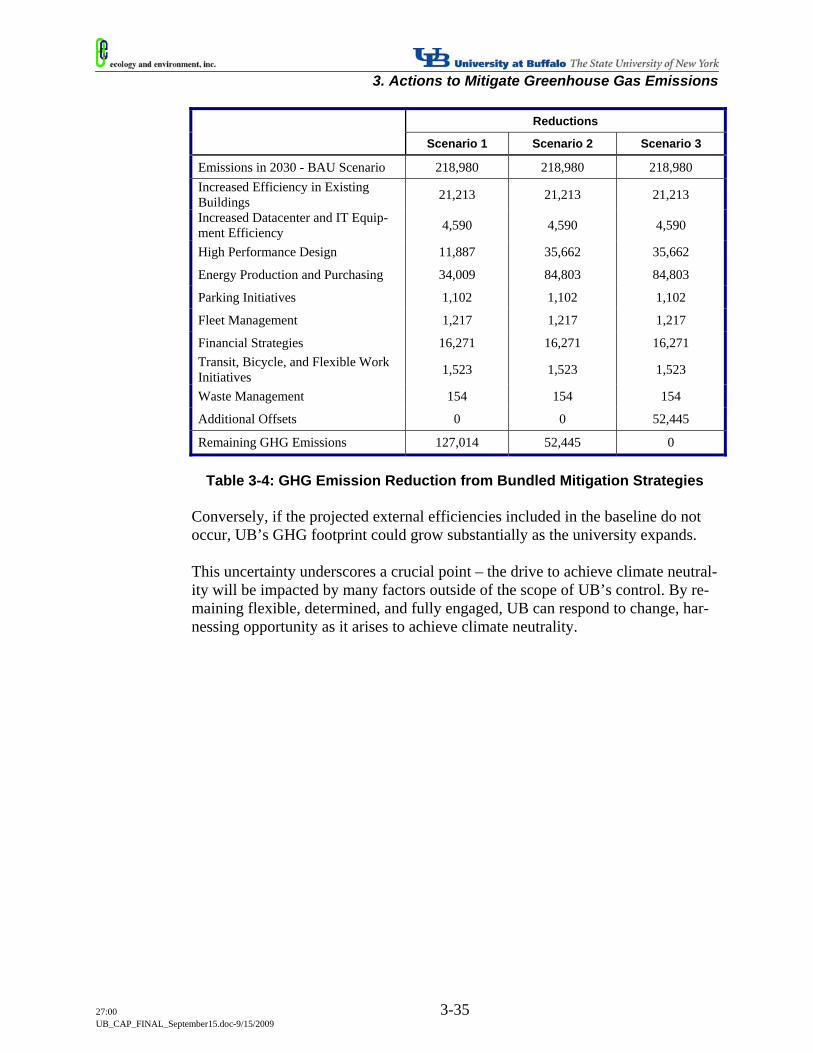
3. Actions to Mitigate Greenhouse Gas Emissions
27:00 3-35 UB_CAP_FINAL_September15.doc-9/15/2009
Reductions
Scenario 1 Scenario 2 Scenario 3
Emissions in 2030 - BAU Scenario 218,980 218,980 218,980 Increased Efficiency in Existing Buildings 21,213 21,213 21,213
Increased Datacenter and IT Equip-ment Efficiency 4,590 4,590 4,590
High Performance Design 11,887 35,662 35,662
Energy Production and Purchasing 34,009 84,803 84,803
Parking Initiatives 1,102 1,102 1,102
Fleet Management 1,217 1,217 1,217
Financial Strategies 16,271 16,271 16,271 Transit, Bicycle, and Flexible Work Initiatives 1,523 1,523 1,523
Waste Management 154 154 154
Additional Offsets 0 0 52,445
Remaining GHG Emissions 127,014 52,445 0
Table 3-4: GHG Emission Reduction from Bundled Mitigation Strategies
Conversely, if the projected external efficiencies included in the baseline do not occur, UB’s GHG footprint could grow substantially as the university expands. This uncertainty underscores a crucial point – the drive to achieve climate neutral-ity will be impacted by many factors outside of the scope of UB’s control. By re-maining flexible, determined, and fully engaged, UB can respond to change, har-nessing opportunity as it arises to achieve climate neutrality.
27:00 4-1 UB_CAP_FINAL_September15.doc-9/15/2009
In this Chapter: 1. Steps to create a campus culture of sustainability and establishing UB
as a regional climate leader through:
a. Climate change and sustainability research at UB; b. Integrating sustainability into UB’s educational program; c. Communication, outreach, and behavioral change opportunities; d. Engaging the community on climate change issues; and e. Raising awareness of UB’s role as a climate leader.
Achieving Climate Neutrality: The Role of Research, Teaching, and the Community
UB exists to create knowledge, share it with students, and place it in service of community and society. It is consistent with both our institutional mission and our climate neutrality goal, therefore, that this plan identifies actions to: promote re-search on issues of energy, environment, and climate; further integrate sustaina-bility in teaching and learning; and mobilize what we know in service to the broader community. This work, by itself, will not lead directly to reductions in GHG emissions. But it is indispensable in promoting the kind of cultural and be-havioral change needed to achieve the climate neutrality goal. As an institution and as a society, we are learning a new way of doing things, and the university has a central role to play in that process. Ultimately, we could serve as a center of sustainability innovation for the region, where new ideas and strategies to mitigate climate change could be developed, tested, implemented, and then rolled out to the broader community. This provides benefits to all involved. Students, faculty, and staff who seek a “green” university environment will more likely come here. While this is ambitious, our short-term efforts to achieve climate neutrality should be oriented toward this long-term goal. Table 4-1 outlines an array of strategies to help UB achieve these objectives.
4
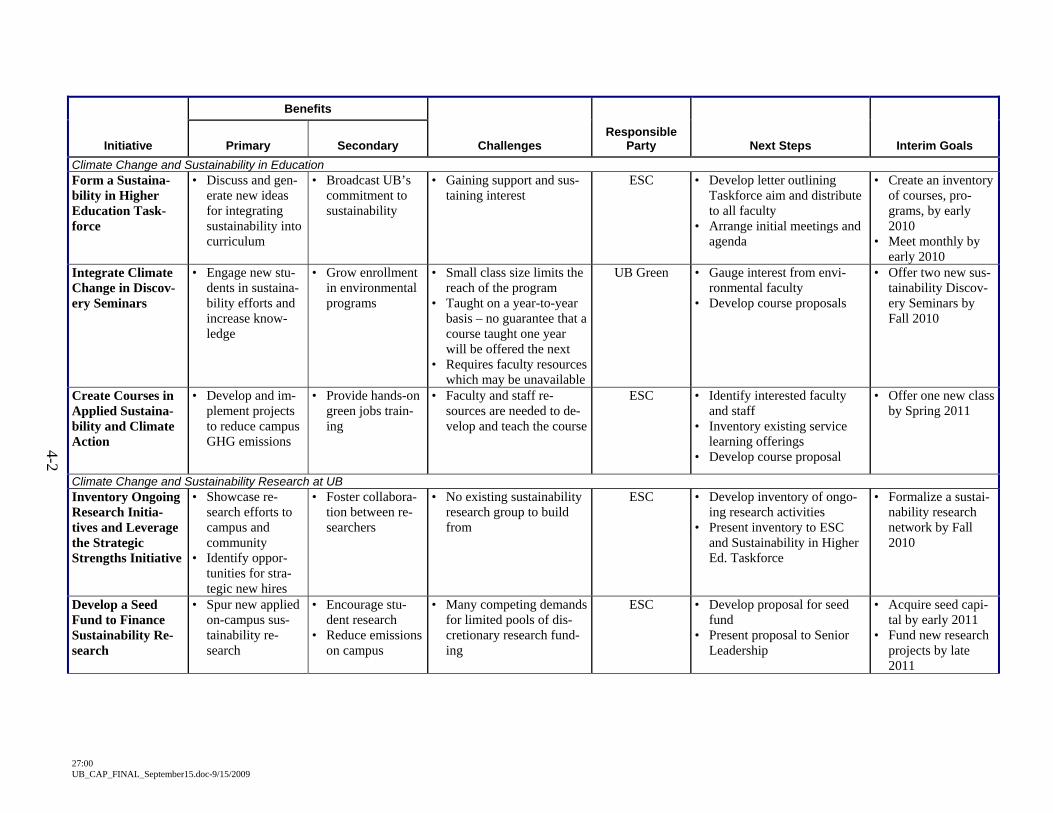
4-2
27:00 UB_CAP_FINAL_September15.doc-9/15/2009
Initiative
Benefits
Primary Secondary Challenges Responsible
Party Next Steps Interim Goals Climate Change and Sustainability in Education Form a Sustaina-bility in Higher Education Task-force
• Discuss and gen-erate new ideas for integrating sustainability into curriculum
• Broadcast UB’s commitment to sustainability
• Gaining support and sus-taining interest
ESC • Develop letter outlining Taskforce aim and distribute to all faculty
• Arrange initial meetings and agenda
• Create an inventory of courses, pro-grams, by early 2010
• Meet monthly by early 2010
Integrate Climate Change in Discov-ery Seminars
• Engage new stu-dents in sustaina-bility efforts and increase know-ledge
• Grow enrollment in environmental programs
• Small class size limits the reach of the program
• Taught on a year-to-year basis – no guarantee that a course taught one year will be offered the next
• Requires faculty resources which may be unavailable
UB Green • Gauge interest from envi-ronmental faculty
• Develop course proposals
• Offer two new sus-tainability Discov-ery Seminars by Fall 2010
Create Courses in Applied Sustaina-bility and Climate Action
• Develop and im-plement projects to reduce campus GHG emissions
• Provide hands-on green jobs train-ing
• Faculty and staff re-sources are needed to de-velop and teach the course
ESC • Identify interested faculty and staff
• Inventory existing service learning offerings
• Develop course proposal
• Offer one new class by Spring 2011
Climate Change and Sustainability Research at UB Inventory Ongoing Research Initia-tives and Leverage the Strategic Strengths Initiative
• Showcase re-search efforts to campus and community
• Identify oppor-tunities for stra-tegic new hires
• Foster collabora-tion between re-searchers
• No existing sustainability research group to build from
ESC • Develop inventory of ongo-ing research activities
• Present inventory to ESC and Sustainability in Higher Ed. Taskforce
• Formalize a sustai-nability research network by Fall 2010
Develop a Seed Fund to Finance Sustainability Re-search
• Spur new applied on-campus sus-tainability re-search
• Encourage stu-dent research
• Reduce emissions on campus
• Many competing demands for limited pools of dis-cretionary research fund-ing
ESC • Develop proposal for seed fund
• Present proposal to Senior Leadership
• Acquire seed capi-tal by early 2011
• Fund new research projects by late 2011
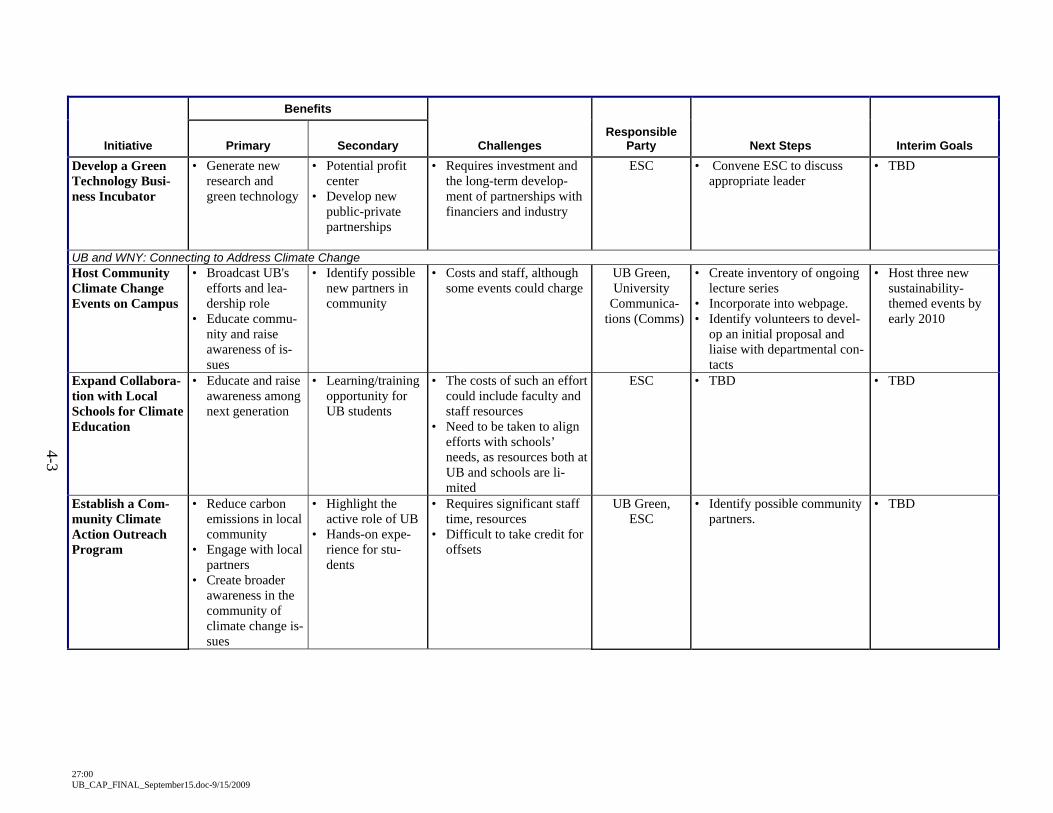
4-3
27:00 UB_CAP_FINAL_September15.doc-9/15/2009
Initiative
Benefits
Primary Secondary Challenges Responsible
Party Next Steps Interim Goals Develop a Green Technology Busi-ness Incubator
• Generate new research and green technology
• Potential profit center
• Develop new public-private partnerships
• Requires investment and the long-term develop-ment of partnerships with financiers and industry
ESC • Convene ESC to discuss appropriate leader
• TBD
UB and WNY: Connecting to Address Climate Change Host Community Climate Change Events on Campus
• Broadcast UB's efforts and lea-dership role
• Educate commu-nity and raise awareness of is-sues
• Identify possible new partners in community
• Costs and staff, although some events could charge
UB Green, University
Communica-tions (Comms)
• Create inventory of ongoing lecture series
• Incorporate into webpage. • Identify volunteers to devel-
op an initial proposal and liaise with departmental con-tacts
• Host three new sustainability-themed events by early 2010
Expand Collabora-tion with Local Schools for Climate Education
• Educate and raise awareness among next generation
• Learning/training opportunity for UB students
• The costs of such an effort could include faculty and staff resources
• Need to be taken to align efforts with schools’ needs, as resources both at UB and schools are li-mited
ESC • TBD • TBD
Establish a Com-munity Climate Action Outreach Program
• Reduce carbon emissions in local community
• Engage with local partners
• Create broader awareness in the community of climate change is-sues
• Highlight the active role of UB
• Hands-on expe-rience for stu-dents
• Requires significant staff time, resources
• Difficult to take credit for offsets
UB Green, ESC
• Identify possible community partners.
• TBD
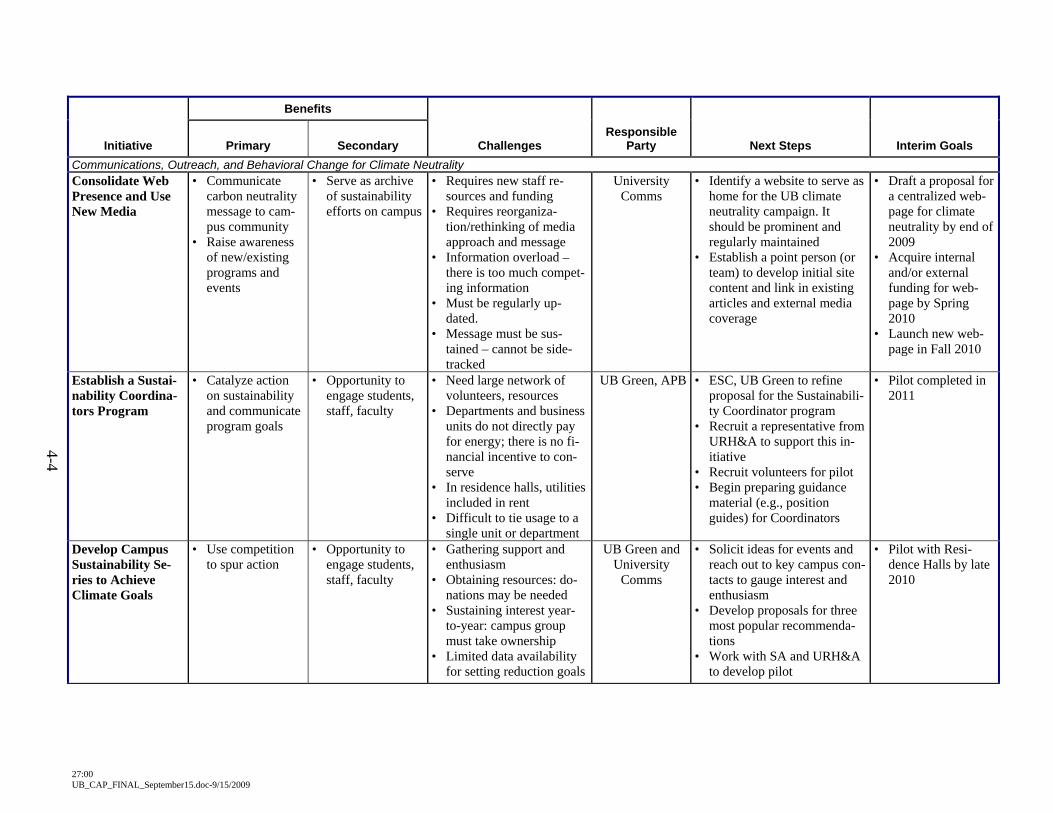
4-4
27:00 UB_CAP_FINAL_September15.doc-9/15/2009
Initiative
Benefits
Primary Secondary Challenges Responsible
Party Next Steps Interim Goals Communications, Outreach, and Behavioral Change for Climate Neutrality Consolidate Web Presence and Use New Media
• Communicate carbon neutrality message to cam-pus community
• Raise awareness of new/existing programs and events
• Serve as archive of sustainability efforts on campus
• Requires new staff re-sources and funding
• Requires reorganiza-tion/rethinking of media approach and message
• Information overload – there is too much compet-ing information
• Must be regularly up-dated.
• Message must be sus-tained – cannot be side-tracked
University Comms
• Identify a website to serve as home for the UB climate neutrality campaign. It should be prominent and regularly maintained
• Establish a point person (or team) to develop initial site content and link in existing articles and external media coverage
• Draft a proposal for a centralized web-page for climate neutrality by end of 2009
• Acquire internal and/or external funding for web-page by Spring 2010
• Launch new web-page in Fall 2010
Establish a Sustai-nability Coordina-tors Program
• Catalyze action on sustainability and communicate program goals
• Opportunity to engage students, staff, faculty
• Need large network of volunteers, resources
• Departments and business units do not directly pay for energy; there is no fi-nancial incentive to con-serve
• In residence halls, utilities included in rent
• Difficult to tie usage to a single unit or department
UB Green, APB • ESC, UB Green to refine proposal for the Sustainabili-ty Coordinator program
• Recruit a representative from URH&A to support this in-itiative
• Recruit volunteers for pilot • Begin preparing guidance
material (e.g., position guides) for Coordinators
• Pilot completed in 2011
Develop Campus Sustainability Se-ries to Achieve Climate Goals
• Use competition to spur action
• Opportunity to engage students, staff, faculty
• Gathering support and enthusiasm
• Obtaining resources: do-nations may be needed
• Sustaining interest year-to-year: campus group must take ownership
• Limited data availability for setting reduction goals
UB Green and University
Comms
• Solicit ideas for events and reach out to key campus con-tacts to gauge interest and enthusiasm
• Develop proposals for three most popular recommenda-tions
• Work with SA and URH&A to develop pilot
• Pilot with Resi-dence Halls by late 2010
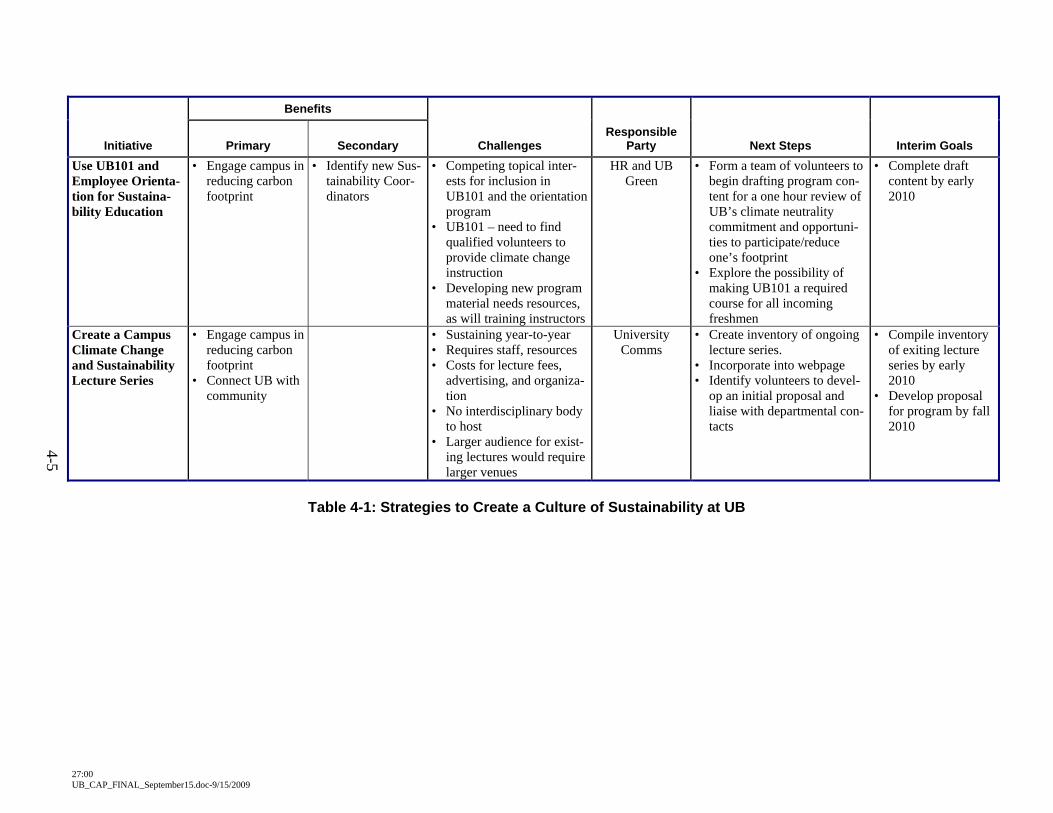
4-5
27:00 UB_CAP_FINAL_September15.doc-9/15/2009
Initiative
Benefits
Primary Secondary Challenges Responsible
Party Next Steps Interim Goals Use UB101 and Employee Orienta-tion for Sustaina-bility Education
• Engage campus in reducing carbon footprint
• Identify new Sus-tainability Coor-dinators
• Competing topical inter-ests for inclusion in UB101 and the orientation program
• UB101 – need to find qualified volunteers to provide climate change instruction
• Developing new program material needs resources, as will training instructors
HR and UB Green
• Form a team of volunteers to begin drafting program con-tent for a one hour review of UB’s climate neutrality commitment and opportuni-ties to participate/reduce one’s footprint
• Explore the possibility of making UB101 a required course for all incoming freshmen
• Complete draft content by early 2010
Create a Campus Climate Change and Sustainability Lecture Series
• Engage campus in reducing carbon footprint
• Connect UB with community
• Sustaining year-to-year • Requires staff, resources • Costs for lecture fees,
advertising, and organiza-tion
• No interdisciplinary body to host
• Larger audience for exist-ing lectures would require larger venues
University Comms
• Create inventory of ongoing lecture series.
• Incorporate into webpage • Identify volunteers to devel-
op an initial proposal and liaise with departmental con-tacts
• Compile inventory of exiting lecture series by early 2010
• Develop proposal for program by fall 2010
Table 4-1: Strategies to Create a Culture of Sustainability at UB
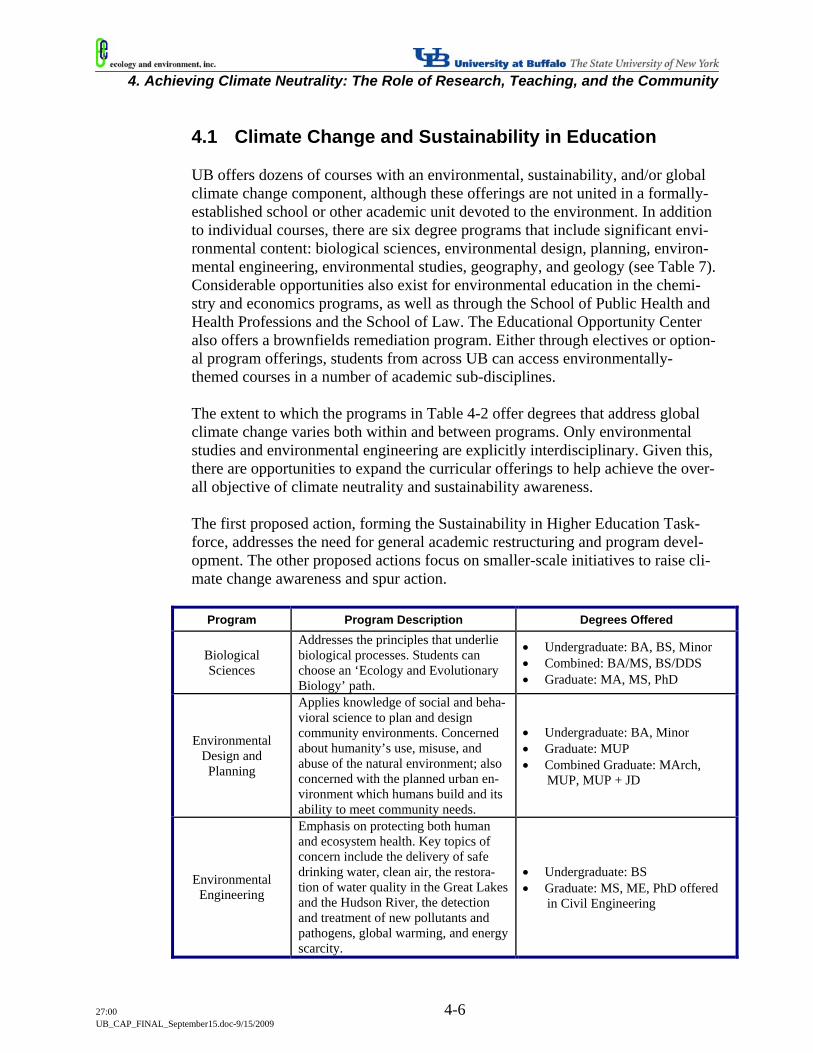
4. Achieving Climate Neutrality: The Role of Research, Teaching, and the Community
27:00 4-6 UB_CAP_FINAL_September15.doc-9/15/2009
4.1 Climate Change and Sustainability in Education UB offers dozens of courses with an environmental, sustainability, and/or global climate change component, although these offerings are not united in a formally-established school or other academic unit devoted to the environment. In addition to individual courses, there are six degree programs that include significant envi-ronmental content: biological sciences, environmental design, planning, environ-mental engineering, environmental studies, geography, and geology (see Table 7). Considerable opportunities also exist for environmental education in the chemi-stry and economics programs, as well as through the School of Public Health and Health Professions and the School of Law. The Educational Opportunity Center also offers a brownfields remediation program. Either through electives or option-al program offerings, students from across UB can access environmentally-themed courses in a number of academic sub-disciplines. The extent to which the programs in Table 4-2 offer degrees that address global climate change varies both within and between programs. Only environmental studies and environmental engineering are explicitly interdisciplinary. Given this, there are opportunities to expand the curricular offerings to help achieve the over-all objective of climate neutrality and sustainability awareness. The first proposed action, forming the Sustainability in Higher Education Task-force, addresses the need for general academic restructuring and program devel-opment. The other proposed actions focus on smaller-scale initiatives to raise cli-mate change awareness and spur action.
Program Program Description Degrees Offered
Biological Sciences
Addresses the principles that underlie biological processes. Students can choose an ‘Ecology and Evolutionary Biology’ path.
• Undergraduate: BA, BS, Minor • Combined: BA/MS, BS/DDS • Graduate: MA, MS, PhD
Environmental Design and Planning
Applies knowledge of social and beha-vioral science to plan and design community environments. Concerned about humanity’s use, misuse, and abuse of the natural environment; also concerned with the planned urban en-vironment which humans build and its ability to meet community needs.
• Undergraduate: BA, Minor • Graduate: MUP • Combined Graduate: MArch,
MUP, MUP + JD
Environmental Engineering
Emphasis on protecting both human and ecosystem health. Key topics of concern include the delivery of safe drinking water, clean air, the restora-tion of water quality in the Great Lakes and the Hudson River, the detection and treatment of new pollutants and pathogens, global warming, and energy scarcity.
• Undergraduate: BS • Graduate: MS, ME, PhD offered
in Civil Engineering
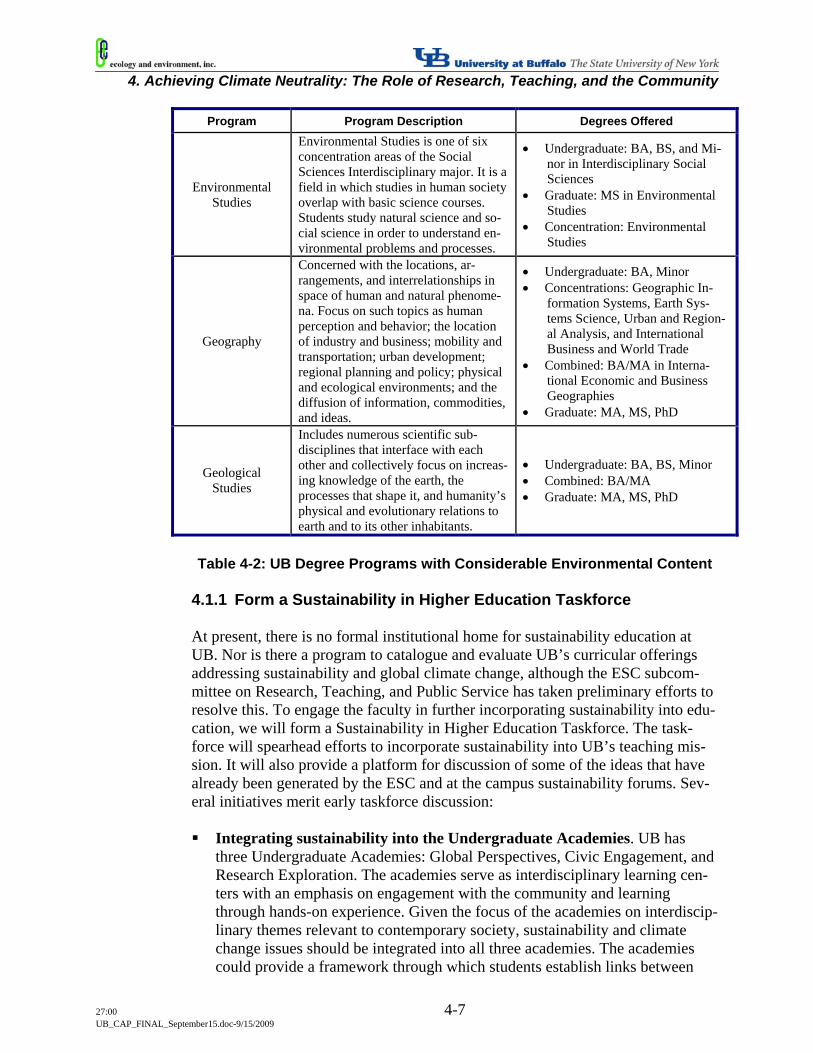
4. Achieving Climate Neutrality: The Role of Research, Teaching, and the Community
27:00 4-7 UB_CAP_FINAL_September15.doc-9/15/2009
Program Program Description Degrees Offered
Environmental Studies
Environmental Studies is one of six concentration areas of the Social Sciences Interdisciplinary major. It is a field in which studies in human society overlap with basic science courses. Students study natural science and so-cial science in order to understand en-vironmental problems and processes.
• Undergraduate: BA, BS, and Mi-nor in Interdisciplinary Social Sciences
• Graduate: MS in Environmental Studies
• Concentration: Environmental Studies
Geography
Concerned with the locations, ar-rangements, and interrelationships in space of human and natural phenome-na. Focus on such topics as human perception and behavior; the location of industry and business; mobility and transportation; urban development; regional planning and policy; physical and ecological environments; and the diffusion of information, commodities, and ideas.
• Undergraduate: BA, Minor • Concentrations: Geographic In-
formation Systems, Earth Sys-tems Science, Urban and Region-al Analysis, and International Business and World Trade
• Combined: BA/MA in Interna-tional Economic and Business Geographies
• Graduate: MA, MS, PhD
Geological Studies
Includes numerous scientific sub-disciplines that interface with each other and collectively focus on increas-ing knowledge of the earth, the processes that shape it, and humanity’s physical and evolutionary relations to earth and to its other inhabitants.
• Undergraduate: BA, BS, Minor • Combined: BA/MA • Graduate: MA, MS, PhD
Table 4-2: UB Degree Programs with Considerable Environmental Content
4.1.1 Form a Sustainability in Higher Education Taskforce At present, there is no formal institutional home for sustainability education at UB. Nor is there a program to catalogue and evaluate UB’s curricular offerings addressing sustainability and global climate change, although the ESC subcom-mittee on Research, Teaching, and Public Service has taken preliminary efforts to resolve this. To engage the faculty in further incorporating sustainability into edu-cation, we will form a Sustainability in Higher Education Taskforce. The task-force will spearhead efforts to incorporate sustainability into UB’s teaching mis-sion. It will also provide a platform for discussion of some of the ideas that have already been generated by the ESC and at the campus sustainability forums. Sev-eral initiatives merit early taskforce discussion: Integrating sustainability into the Undergraduate Academies. UB has
three Undergraduate Academies: Global Perspectives, Civic Engagement, and Research Exploration. The academies serve as interdisciplinary learning cen-ters with an emphasis on engagement with the community and learning through hands-on experience. Given the focus of the academies on interdiscip-linary themes relevant to contemporary society, sustainability and climate change issues should be integrated into all three academies. The academies could provide a framework through which students establish links between
4. Achieving Climate Neutrality: The Role of Research, Teaching, and the Community
27:00 4-8 UB_CAP_FINAL_September15.doc-9/15/2009
their chosen course of study and sustainability considerations. Academies provide an opportunity to cultivate sustained student commitment to mitigat-ing UB’s impact on global climate change.
Developing new environmental degree programs. UB may be able to gen-erate new knowledge and awareness of sustainability challenges, as well as at-tract new students and faculty through the development of new environmental degree programs (e.g. an environmental science undergraduate degree). At present, UB is engaged in an effort at the SUNY-level to create a new envi-ronmental degree program.
Adding environmental requirements to the General Education curricu-
lum. Incorporating sustainability and environment courses into the general curriculum for all our students would provide the entire UB population with basic knowledge of environmental issues. This would help prepare UB stu-dents to be more competitive in the labor market, where basic environmental literacy is increasingly required in many fields.
Using web-based learning to reduce UB’s carbon footprint. E-learning
presents important opportunities for reducing commuter travel and expanding enrollment without increasing the need for new classroom space.
Additional opportunities:
Use the Taskforce as a representative in academic programming discus-sion with SUNY-Central.
4.1.2 Integrate Climate Change into Discovery Seminars The UB Discovery Seminar series is a popular program, providing a small-class educational environment targeted at first- and second-year students. With faculty participation, UB will develop additional discovery seminar courses devoted to sustainability and global climate change. As UB’s faculty grows, new course of-ferings will become available. This will allow for immediate engagement with a small group of new students and help foster awareness of climate change. It could help cultivate potential student leaders who could take action on climate change. Additional opportunities:
Collaborate with local colleges and universities to co-teach discovery se-minars at multiple schools in the Buffalo area.
4.1.3 Create Courses in Applied Sustainability and Climate Action There is an opportunity for synergy among the teaching, research, and climate neutrality goals of UB: the creation of a course (or courses) devoted to applied sustainability or climate action. This will provide hands-on experience and skills
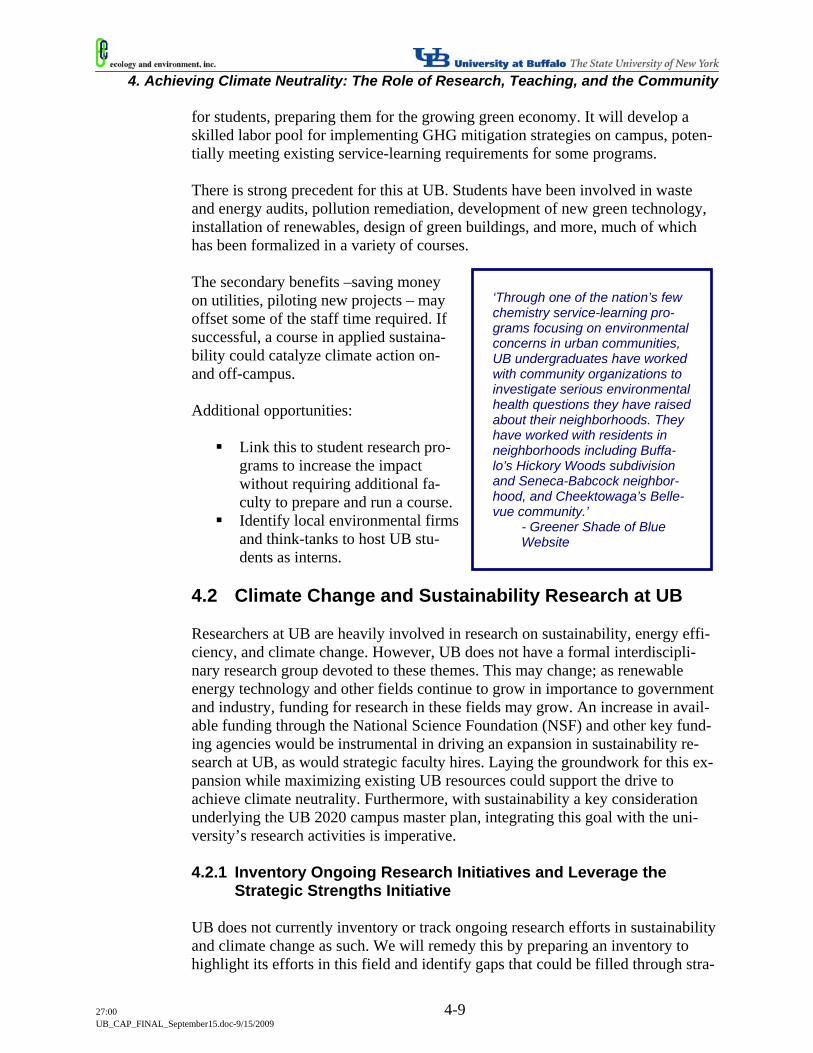
4. Achieving Climate Neutrality: The Role of Research, Teaching, and the Community
27:00 4-9 UB_CAP_FINAL_September15.doc-9/15/2009
for students, preparing them for the growing green economy. It will develop a skilled labor pool for implementing GHG mitigation strategies on campus, poten-tially meeting existing service-learning requirements for some programs. There is strong precedent for this at UB. Students have been involved in waste and energy audits, pollution remediation, development of new green technology, installation of renewables, design of green buildings, and more, much of which has been formalized in a variety of courses. The secondary benefits –saving money on utilities, piloting new projects – may offset some of the staff time required. If successful, a course in applied sustaina-bility could catalyze climate action on- and off-campus. Additional opportunities:
Link this to student research pro-grams to increase the impact without requiring additional fa-culty to prepare and run a course.
Identify local environmental firms and think-tanks to host UB stu-dents as interns.
4.2 Climate Change and Sustainability Research at UB Researchers at UB are heavily involved in research on sustainability, energy effi-ciency, and climate change. However, UB does not have a formal interdiscipli-nary research group devoted to these themes. This may change; as renewable energy technology and other fields continue to grow in importance to government and industry, funding for research in these fields may grow. An increase in avail-able funding through the National Science Foundation (NSF) and other key fund-ing agencies would be instrumental in driving an expansion in sustainability re-search at UB, as would strategic faculty hires. Laying the groundwork for this ex-pansion while maximizing existing UB resources could support the drive to achieve climate neutrality. Furthermore, with sustainability a key consideration underlying the UB 2020 campus master plan, integrating this goal with the uni-versity’s research activities is imperative. 4.2.1 Inventory Ongoing Research Initiatives and Leverage the
Strategic Strengths Initiative UB does not currently inventory or track ongoing research efforts in sustainability and climate change as such. We will remedy this by preparing an inventory to highlight its efforts in this field and identify gaps that could be filled through stra-
‘Through one of the nation’s few chemistry service-learning pro-grams focusing on environmental concerns in urban communities, UB undergraduates have worked with community organizations to investigate serious environmental health questions they have raised about their neighborhoods. They have worked with residents in neighborhoods including Buffa-lo’s Hickory Woods subdivision and Seneca-Babcock neighbor-hood, and Cheektowaga’s Belle-vue community.’
- Greener Shade of Blue Website
4. Achieving Climate Neutrality: The Role of Research, Teaching, and the Community
27:00 4-10 UB_CAP_FINAL_September15.doc-9/15/2009
tegic hires during the planned expansion process. While sustainability and climate change were not identified as strategic strengths, drawing a link between sustai-nability and existing strategic strengths will help facilitate the process of greening the university and increase expertise in this cross-cutting field. For example, stra-tegic strengths such as Extreme Events: Mitigation and Response have intimate links to climate adaptation research. Additional opportunities:
Use the results of the inventory to evaluate creating a center or institute on ‘Energy and the Environment’ or a similar topic. Such an entity would ca-pitalize on expertise in groups such as the Environment and Society Insti-tute, the Great Lakes Program, and the various strategic strengths.
4.2.2 Develop a Seed Fund to Finance Sustainability Research UB already directly funds a number of research initiatives on campus, comple-menting external funding brought in by principal investigators. By establishing a dedicated pool of funding for faculty, graduate student, and undergraduate sustai-nability research – particularly with an immediate on-campus application – UB will jumpstart the growth in its sustainability research program. Current efforts, such as the UB 2020 Interdisciplinary Research Fund, should be expanded to in-clude climate change issues. This will help foster innovation and allow UB a low-cost way to pilot new ideas and complement its research and teaching mission. Mandating a public outreach or education component for projects funded from this program will serve our community outreach objectives. Additional opportunities:
Hold a competition for students to submit proposals for research and pilot projects addressing sustainability issues at UB. The winners would be awarded funding for implementation of their study/project.
4.2.3 Develop a Green Technology Business Incubator Green technology (renewable energy systems, green IT, etc.) offers potential for new research and development investment, and potentially profitable patents and/or public-private partnerships. WNY is a major region for wind energy devel-opment; partnering with local and national investors to develop next-generation wind equipment may be a wise area for investment. UB will explore whether the creation of a green technology incubator is viable. An incubator could serve as a profit center and magnet for researchers and graduate students. Existing efforts in engineering, green chemistry, and computer science, among others, could be as-sociated in collaborative projects, and start-up funding could be sought from NYSERDA. Coordination with the Office of Science, Technology Transfer, and Economic Outreach will be critical.
4. Achieving Climate Neutrality: The Role of Research, Teaching, and the Community
27:00 4-11 UB_CAP_FINAL_September15.doc-9/15/2009
4.3 UB and Western New York: Connecting to Address Climate Change
As a primary engine of regional economic growth, a major employer, and a citi-zen of WNY, UB has the opportunity to be a catalyst for regional and national efforts to mitigate global climate change. UB’s stature will rise by demonstrating climate leadership and helping reduce the region’s GHG emissions. A climate neutrality outreach campaign will build on our long history of engage-ment with the community. Recent outreach efforts include the Greener Shade of Blue campaign, which brought 3,500 local students to the campus to hear Nobel Laureate Al Gore speak about global climate change. This was one piece in a much broader outreach campaign that extended far beyond UB’s campus gates and featured a wide array of prominent environmentalists as speakers. Incorporating our climate neutrality message and theme into its broader communi-ty outreach initiatives must be a priority as UB seeks to achieve climate neutrality. Crafting a strategy to communicate this message in pursuit of the on-campus cli-mate neutrality goal is the challenge that the ESC’s subcommittee on Communi-cation and Outreach, as well as others on campus, will address. 4.3.1 Host Community Climate Change Events on Campus UB will continue the tradition embodied in the Greener Shade of Blue campaign by hosting large, public sustainability-themed educational events. These events are an excellent mechanism to engage the broader community, as well as groups like the WNY Environmental Congress. Events may range from a major speaker series to smaller lectures and seminars highlighting UB’s research endeavors. Larger events, such as an Earth Day celebration or ‘Focus the Nation’-style confe-rence, will provide an opportunity to showcase the recent year’s sustainability ac-complishments and educate the public. UB will send the message that it is a lead-er and valuable resource on climate change mitigation. These efforts will be de-veloped in alignment with UB’s existing lectures series and campus events, poten-tially opening up such events to a wider audience (see Section 4.4.5). 4.3.2 Expand Collaboration with Local Schools for Climate Education In addition to UB’s project-oriented off-campus volunteer efforts, UB will strive to expand its educational efforts off-campus to raise climate awareness. President Simpson’s Center for Educational Collaboration and the UB/Buffalo Public School partnership provide excellent resources to leverage. UB students will gain experience in environmental education while helping to support the sustainability efforts of the local school system. This may also help community members reduce their own carbon footprint, providing a regional climate benefit. If integrated in the regular curriculum, as student teaching requirements already are, investing in this type of program would constitute a refocusing of resources, rather than the dedication of new resources.
4. Achieving Climate Neutrality: The Role of Research, Teaching, and the Community
27:00 4-12 UB_CAP_FINAL_September15.doc-9/15/2009
Additional opportunities:
Involve UB students in developing environmental curricula in support of teachers actively seeking such material for their classrooms.
4.3.3 Establish a Community Climate Action Outreach Program Many programs take UB volunteers into the community to conduct environmental outreach work. Some are formally organized as part of courses, through clubs, or for events, while many others remain informal. UB will expand the number of formal campus green volunteer programs, highlighting our active engagement in achieving climate neutrality. This expansion will strive to unite disparate pro-grams into a Community Climate Action Outreach Program. Existing outreach programs, such as the Community OutReach for Employees (CORE) program, should include more sustainability and climate change oppor-tunities. New opportunities for UB volunteers to participate, for example Re-Tree WNY, could help attract additional volunteers. UB students, staff, and faculty could help also reduce GHG emissions off-campus by providing technical assistance to organizations in WNY. This is being imple-mented at the Center for Sustainable Energy at Bronx Community College. Tech-nical support would include help with weatherization, equipment upgrades, light-ing retrofits, and other energy conversation measures. This would provide UB vo-lunteers with skills to prepare them for the green economy. Groups such as NYSERDA may provide financing to help offset administrative and personnel costs. As UB students, staff, and faculty become more adept at carbon manage-ment, formalizing an off-campus carbon reduction program could play a promi-nent part in UB’s strategy to establish itself as a climate leader. Additional opportunities:
Explore developing GHG offsets through community weatherization and energy efficiency efforts.
Develop strategic partnerships with local community organizations to place and organize volunteer initiatives.
4.4 Communications, Outreach, and Behavioral Change
for Climate Neutrality We have yet to tap the potential to reduce GHG emissions through leveraging communications and outreach initiatives to spur behavioral change. As discussed in Section 3.2.1, energy use at the Center for Fine Arts was reduced by more than 20 percent, in part through the active involvement of building users. Through education and outreach, the campus community can help mitigate climate change by making informed choices about the way they conduct their daily lives.
4. Achieving Climate Neutrality: The Role of Research, Teaching, and the Community
27:00 4-13 UB_CAP_FINAL_September15.doc-9/15/2009
Almost every mitigation measure described in the CAP features a behavioral change component. Building energy use is impacted by human decisions to plug in equipment and leave on lights and computers. The potential for reductions in GHG emissions by promoting behavioral change is unknown, but may be signifi-cant. Actions outlined below focus on using communications and outreach to in-form and engage our community to promote climate action on and off campus. 4.4.1 Consolidate Web Presence and Use New Media It is essential to simply and strongly communicate:
The climate neutrality goal; Progress in implementing the CAP; Opportunities to volunteer and contribute; and Available tools to reduce an individual’s GHG footprint.
A frequent complaint (aired during the fall 2008 Sustainability Forum) has been the fragmented nature of environmental communication on campus. Streamlining communication is a priority, and new resources must be allocated. Communica-tion can be via many media, although a central web presence is a priority. UB will develop a centralized and revitalized web platform (e.g., merging the Greener Shade of Blue site, the UB Green site, and the ESC site) to host the cli-mate neutrality campaign’s web content. Other sites (newspapers, the UB Report-er, etc.) may host content, but this will be linked back to our main site. The site would also host real-time energy data, updates to the GHG inventory, and more. By centralizing information, the UB community will be more easily able to track progress and learn about opportunities to contribute. Social media and traditional awareness-building tools will be used to drive late adopters to the centralized plat-form. Overhead for maintaining the site will be reduced by using a user-generated content model for sections of the site. 4.4.2 Establish a Sustainability Coordinators Program To facilitate CAP implementation, UB will deploy sustainability coordinators (or climate leaders) across the geographic and organizational landscape of the univer-sity. Sustainability coordinators will steer on-the-ground efforts to reduce energy, while educating building occupants about new programs to reduce their climate impact. Providing coordinators with tools to communicate best practices, ongoing programs, and new initiatives to reduce UB’s GHG footprint will help foster a campus-wide cultural shift towards sustainability. Pairing sustainability coordinators with resident advisors could help reduce emis-sions in our residence halls. Many universities have used behavioral change pro-grams to improve energy efficiency and recycling in student housing (e.g., Tufts University’s ‘Do It in the Dark’ campaign, later replicated at UB).
4. Achieving Climate Neutrality: The Role of Research, Teaching, and the Community
27:00 4-14 UB_CAP_FINAL_September15.doc-9/15/2009
4.4.3 Develop Campus Sustainability Series to Meet Climate Goals UB will engage the campus community with the climate neutrality initiative by organizing a series of campus events and competitions to help conserve energy and reduce GHG emissions. These annual (or one-off) events will help bring the campus community together and capitalize on competition among departments, business units, and residence halls to mitigate GHG emissions. Events like Recyc-leMania could be integrated into such a series. Providing incentives targeted to each audience will help increase participation. Additional opportunities:
Align campus efforts with national and international events such as Earth Hour and RecycleMania to further broadcast UB’s climate commitment.
4.4.4 Use UB101 and Employee Orientation for Sustainability
Education Employee orientation can be used to raise awareness of the climate neutrality campaign among new students, faculty, and staff, and to recruit sustainability coordinators. Employee orientation provides a range of information to new facul-ty and staff on UB culture, practices, policies, and campus infrastructure. By in-corporating information on climate neutrality, as well UB environmental pro-grams and services, incoming faculty and staff will begin their careers at UB with a strong awareness of the climate neutrality commitment. UB101 is an optional course offered to incoming freshmen. Participants (approx-imately 60 percent of all freshmen) receive one credit for the one-hour weekly course. The syllabus is designed to facilitate the transition from high school to university, focusing on life skills, UB culture and programming, and various other practical topics. Including content on UB’s environmental programs and climate commitment will foster stronger climate stewardship in the student body. 4.4.5 Create a Campus Climate Change/Sustainability Lecture Series Many departments (as well as UB Green) host lecture series. Combining these events in a sustainability series open to the entire campus (and even the communi-ty – see Section 4.3.1) will leverage these programs and foster inter-departmental dialogue. Webcasting lectures and archiving them at a central web location (see Section 4.4.1) will expand access to the series. Additional opportunities:
Integrate student research efforts on climate mitigation into the series, providing an opportunity for students to present research in public.
27:00 5-1 UB_CAP_FINAL_September15.doc-9/15/2009
In this Chapter:
1. Discussion of potential funding opportunities, with examples from other
higher education institutions, including:
a. Internal sources of funding; b. External sources of funding; and, c. Non-economic resources for achieving climate neutrality.
Financing Climate Neutrality
To achieve climate neutrality, we must invest significant time and money. Yet careful design of mitigation measures and the use of innovative financing me-chanisms may also provide a substantial financial return to UB, especially over the long term. Achieving climate neutrality will benefit the environment, but it can also improve the university’s bottom-line. Meeting the goal through efficien-cy measures and investment in new technology will be better and cheaper than purchasing offsets and RECs, expenditures which produce no financial return. Opportunities to finance GHG mitigation strategies and the climate neutrality program are outlined in Table 5-1. UB can make investments today that will pro-vide a return in the relatively near future; and when energy prices rise, emissions reduction initiatives that are now cost-prohibitive may become viable. A first priority is designating staff to identify and pursue funding opportunities. UB must ensure that full lifecycle costing methodologies are used to evaluate each potential project, whenever feasible. If initial calculations reflect the total potential project value (including climatic, economic, and other considerations) we can demonstrate a shorter payback time and better justify financing. Funding for climate change mitigation projects will come from existing internal streams of capital, the creation of new internal funding sources, and through ex-ternal grant/loan programs and partnerships with businesses and non-profits. Re-gardless of the source, there must be integration between the different budgets that cover startup costs, maintenance, and operations, and accrue the savings. Finally, because UB is part of the State University of New York (SUNY) system, some financing strategies will require coordination with entities in the SUNY sys-
5
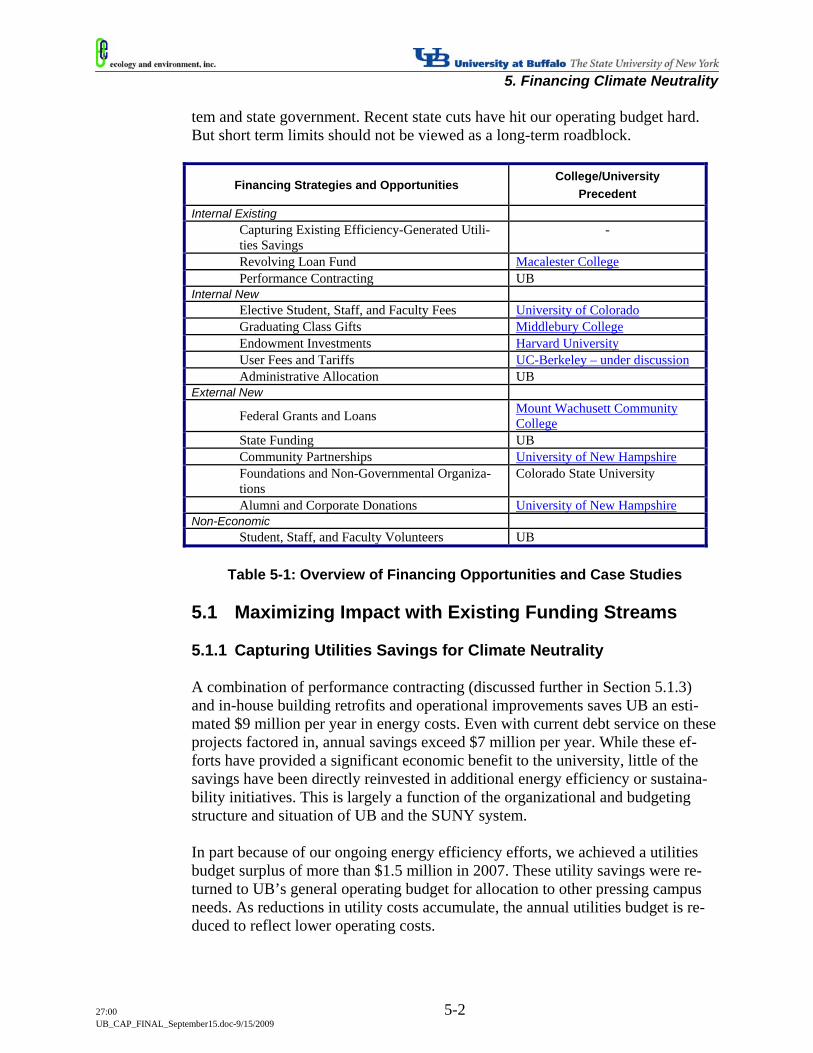
5. Financing Climate Neutrality
27:00 5-2 UB_CAP_FINAL_September15.doc-9/15/2009
tem and state government. Recent state cuts have hit our operating budget hard. But short term limits should not be viewed as a long-term roadblock.
Financing Strategies and Opportunities College/University
Precedent Internal Existing
Capturing Existing Efficiency-Generated Utili-ties Savings
-
Revolving Loan Fund Macalester College Performance Contracting UB
Internal New Elective Student, Staff, and Faculty Fees University of Colorado Graduating Class Gifts Middlebury College Endowment Investments Harvard University User Fees and Tariffs UC-Berkeley – under discussion Administrative Allocation UB
External New
Federal Grants and Loans Mount Wachusett Community College
State Funding UB Community Partnerships University of New Hampshire Foundations and Non-Governmental Organiza-tions
Colorado State University
Alumni and Corporate Donations University of New Hampshire Non-Economic
Student, Staff, and Faculty Volunteers UB
Table 5-1: Overview of Financing Opportunities and Case Studies 5.1 Maximizing Impact with Existing Funding Streams 5.1.1 Capturing Utilities Savings for Climate Neutrality A combination of performance contracting (discussed further in Section 5.1.3) and in-house building retrofits and operational improvements saves UB an esti-mated $9 million per year in energy costs. Even with current debt service on these projects factored in, annual savings exceed $7 million per year. While these ef-forts have provided a significant economic benefit to the university, little of the savings have been directly reinvested in additional energy efficiency or sustaina-bility initiatives. This is largely a function of the organizational and budgeting structure and situation of UB and the SUNY system. In part because of our ongoing energy efficiency efforts, we achieved a utilities budget surplus of more than $1.5 million in 2007. These utility savings were re-turned to UB’s general operating budget for allocation to other pressing campus needs. As reductions in utility costs accumulate, the annual utilities budget is re-duced to reflect lower operating costs.
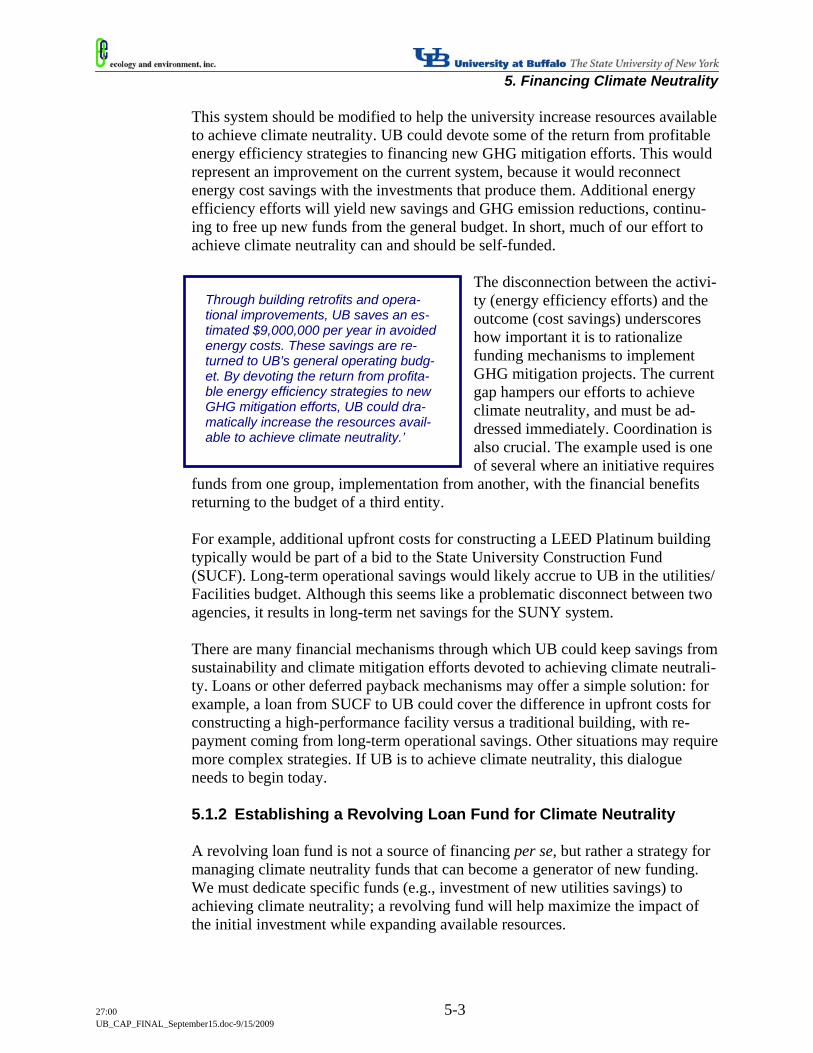
5. Financing Climate Neutrality
27:00 5-3 UB_CAP_FINAL_September15.doc-9/15/2009
This system should be modified to help the university increase resources available to achieve climate neutrality. UB could devote some of the return from profitable energy efficiency strategies to financing new GHG mitigation efforts. This would represent an improvement on the current system, because it would reconnect energy cost savings with the investments that produce them. Additional energy efficiency efforts will yield new savings and GHG emission reductions, continu-ing to free up new funds from the general budget. In short, much of our effort to achieve climate neutrality can and should be self-funded.
The disconnection between the activi-ty (energy efficiency efforts) and the outcome (cost savings) underscores how important it is to rationalize funding mechanisms to implement GHG mitigation projects. The current gap hampers our efforts to achieve climate neutrality, and must be ad-dressed immediately. Coordination is also crucial. The example used is one of several where an initiative requires
funds from one group, implementation from another, with the financial benefits returning to the budget of a third entity. For example, additional upfront costs for constructing a LEED Platinum building typically would be part of a bid to the State University Construction Fund (SUCF). Long-term operational savings would likely accrue to UB in the utilities/ Facilities budget. Although this seems like a problematic disconnect between two agencies, it results in long-term net savings for the SUNY system. There are many financial mechanisms through which UB could keep savings from sustainability and climate mitigation efforts devoted to achieving climate neutrali-ty. Loans or other deferred payback mechanisms may offer a simple solution: for example, a loan from SUCF to UB could cover the difference in upfront costs for constructing a high-performance facility versus a traditional building, with re-payment coming from long-term operational savings. Other situations may require more complex strategies. If UB is to achieve climate neutrality, this dialogue needs to begin today. 5.1.2 Establishing a Revolving Loan Fund for Climate Neutrality A revolving loan fund is not a source of financing per se, but rather a strategy for managing climate neutrality funds that can become a generator of new funding. We must dedicate specific funds (e.g., investment of new utilities savings) to achieving climate neutrality; a revolving fund will help maximize the impact of the initial investment while expanding available resources.
Through building retrofits and opera-tional improvements, UB saves an es-timated $9,000,000 per year in avoided energy costs. These savings are re-turned to UB’s general operating budg-et. By devoting the return from profita-ble energy efficiency strategies to new GHG mitigation efforts, UB could dra-matically increase the resources avail-able to achieve climate neutrality.’
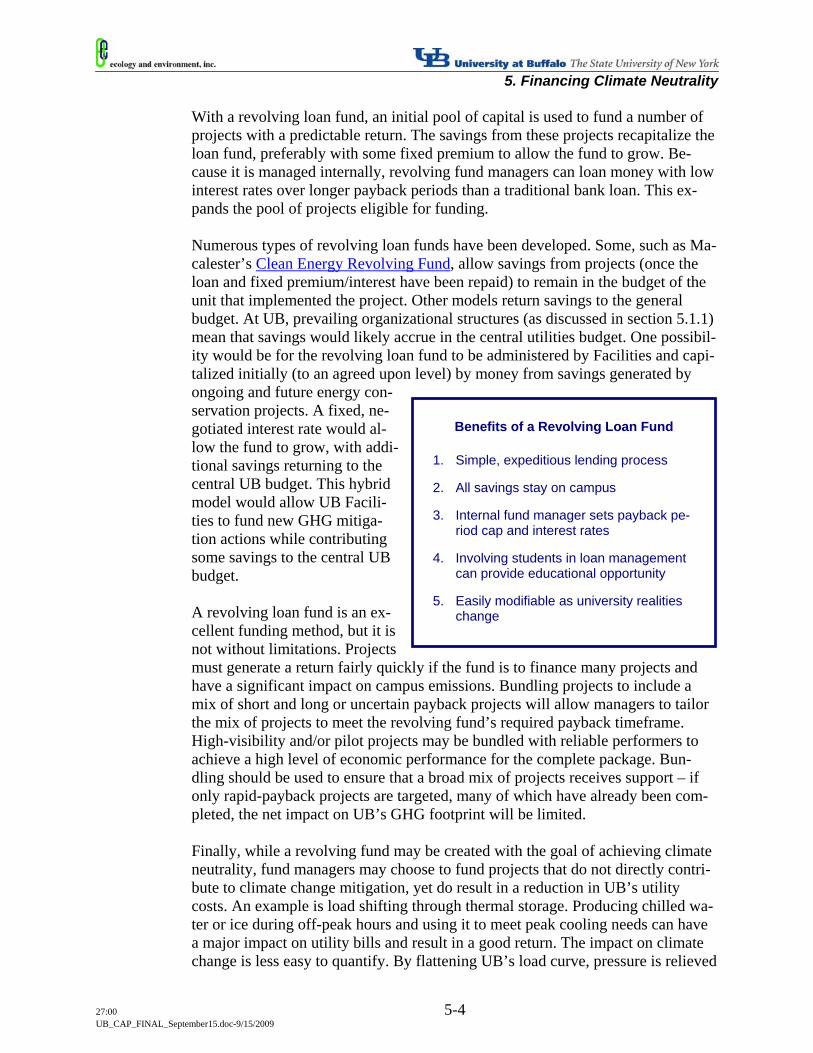
5. Financing Climate Neutrality
27:00 5-4 UB_CAP_FINAL_September15.doc-9/15/2009
With a revolving loan fund, an initial pool of capital is used to fund a number of projects with a predictable return. The savings from these projects recapitalize the loan fund, preferably with some fixed premium to allow the fund to grow. Be-cause it is managed internally, revolving fund managers can loan money with low interest rates over longer payback periods than a traditional bank loan. This ex-pands the pool of projects eligible for funding. Numerous types of revolving loan funds have been developed. Some, such as Ma-calester’s Clean Energy Revolving Fund, allow savings from projects (once the loan and fixed premium/interest have been repaid) to remain in the budget of the unit that implemented the project. Other models return savings to the general budget. At UB, prevailing organizational structures (as discussed in section 5.1.1) mean that savings would likely accrue in the central utilities budget. One possibil-ity would be for the revolving loan fund to be administered by Facilities and capi-talized initially (to an agreed upon level) by money from savings generated by ongoing and future energy con-servation projects. A fixed, ne-gotiated interest rate would al-low the fund to grow, with addi-tional savings returning to the central UB budget. This hybrid model would allow UB Facili-ties to fund new GHG mitiga-tion actions while contributing some savings to the central UB budget. A revolving loan fund is an ex-cellent funding method, but it is not without limitations. Projects must generate a return fairly quickly if the fund is to finance many projects and have a significant impact on campus emissions. Bundling projects to include a mix of short and long or uncertain payback projects will allow managers to tailor the mix of projects to meet the revolving fund’s required payback timeframe. High-visibility and/or pilot projects may be bundled with reliable performers to achieve a high level of economic performance for the complete package. Bun-dling should be used to ensure that a broad mix of projects receives support – if only rapid-payback projects are targeted, many of which have already been com-pleted, the net impact on UB’s GHG footprint will be limited. Finally, while a revolving fund may be created with the goal of achieving climate neutrality, fund managers may choose to fund projects that do not directly contri-bute to climate change mitigation, yet do result in a reduction in UB’s utility costs. An example is load shifting through thermal storage. Producing chilled wa-ter or ice during off-peak hours and using it to meet peak cooling needs can have a major impact on utility bills and result in a good return. The impact on climate change is less easy to quantify. By flattening UB’s load curve, pressure is relieved
Benefits of a Revolving Loan Fund
1. Simple, expeditious lending process 2. All savings stay on campus 3. Internal fund manager sets payback pe-
riod cap and interest rates 4. Involving students in loan management
can provide educational opportunity 5. Easily modifiable as university realities
change
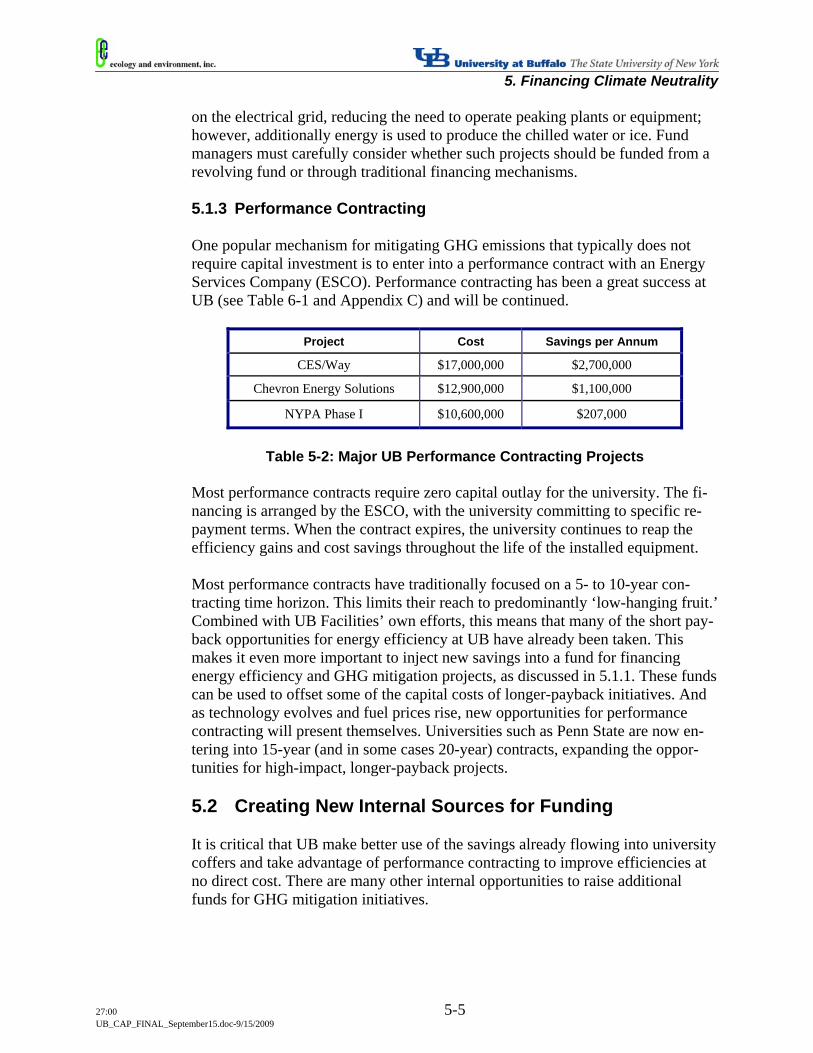
5. Financing Climate Neutrality
27:00 5-5 UB_CAP_FINAL_September15.doc-9/15/2009
on the electrical grid, reducing the need to operate peaking plants or equipment; however, additionally energy is used to produce the chilled water or ice. Fund managers must carefully consider whether such projects should be funded from a revolving fund or through traditional financing mechanisms. 5.1.3 Performance Contracting One popular mechanism for mitigating GHG emissions that typically does not require capital investment is to enter into a performance contract with an Energy Services Company (ESCO). Performance contracting has been a great success at UB (see Table 6-1 and Appendix C) and will be continued.
Project Cost Savings per Annum
CES/Way $17,000,000 $2,700,000
Chevron Energy Solutions $12,900,000 $1,100,000
NYPA Phase I $10,600,000 $207,000
Table 5-2: Major UB Performance Contracting Projects
Most performance contracts require zero capital outlay for the university. The fi-nancing is arranged by the ESCO, with the university committing to specific re-payment terms. When the contract expires, the university continues to reap the efficiency gains and cost savings throughout the life of the installed equipment. Most performance contracts have traditionally focused on a 5- to 10-year con-tracting time horizon. This limits their reach to predominantly ‘low-hanging fruit.’ Combined with UB Facilities’ own efforts, this means that many of the short pay-back opportunities for energy efficiency at UB have already been taken. This makes it even more important to inject new savings into a fund for financing energy efficiency and GHG mitigation projects, as discussed in 5.1.1. These funds can be used to offset some of the capital costs of longer-payback initiatives. And as technology evolves and fuel prices rise, new opportunities for performance contracting will present themselves. Universities such as Penn State are now en-tering into 15-year (and in some cases 20-year) contracts, expanding the oppor-tunities for high-impact, longer-payback projects. 5.2 Creating New Internal Sources for Funding It is critical that UB make better use of the savings already flowing into university coffers and take advantage of performance contracting to improve efficiencies at no direct cost. There are many other internal opportunities to raise additional funds for GHG mitigation initiatives.
5. Financing Climate Neutrality
27:00 5-6 UB_CAP_FINAL_September15.doc-9/15/2009
5.2.1 Elective Student, Staff, and Faculty Fees There are many recent precedents of students levying fees on themselves to sub-sidize environmental initiatives. In some cases, staff and faculty have also insti-tuted payroll deductions to support initiatives. In recent years, students at many universities across the country have voluntarily instituted new fees to pay for RECs to help offset their contribution to global climate change. For example, stu-dents at the University of Colorado have been paying an additional fee for the purchase of wind energy since 2000. With enough student, faculty, and staff support, voluntary fee programs can raise significant amounts of money to fund GHG mitigation measures and sustainabili-ty programs. We will work with student representatives, campus environmental groups, union representatives, and faculty groups to assess the support for impos-ing an annual levy to help fund the climate neutrality program. These fees could be included in tuition bills with other student fees and drawn from paychecks, po-tentially with an opt-out provision. There are a few existing programs (for exam-ple the UB faculty and staff University Development donation program) which use an opt-in payroll deduction model that could be easily adapted. Annual fees are particularly well-suited to pay for regular recurring costs, such as those associated with purchasing RECs. A one-time (or recurring) fee can also be used to capitalize a revolving loan fund. While student fees may be viewed as shifting the burden for climate neutrality to the ‘customers’, it presents an oppor-tunity for students to take action in ways that may otherwise be neglected. 5.2.2 Graduating Class Gifts Another opportunity for funding is through the Senior Class Challenge program, run by the UB Office of Annual Programs. Each year, graduating seniors are en-couraged to make a donation in support of a particular initiative or charitable fund. This program could pay for highly visible or novel ideas, such as has been done at many other schools around the country. For example, graduating seniors at Middlebury College purchased a biodiesel-powered bus as a low emissions al-ternative for use in the campus evening ride service program. In addition to the Senior Class Challenge, many UB graduate programs have simi-lar class gift traditions that present additional opportunities. As the climate neu-trality goal becomes entrenched in the UB culture and student commitment to the effort grows, graduating class gifts present may become an increasingly common opportunity for financing new climate change mitigation efforts. 5.2.3 Endowment Investments University endowments can serve as a source of financing for campus sustainabil-ity initiatives. The investment of endowment funds in on-campus climate mitiga-tion is not unprecedented. After seeing the returns from Harvard’s sustainability
5. Financing Climate Neutrality
27:00 5-7 UB_CAP_FINAL_September15.doc-9/15/2009
revolving loan fund, the university’s president chose to invest several million dol-lars of endowment money into it. The rationale was simple: the revolving fund was yielding higher returns (34 percent on average) than the high-yield accounts Harvard’s endowment funds were invested in (approximately 15 percent). This is remarkable, because the decision was made well before the recent downturn in the financial markets. In the present financial climate, the return from implementing cost-effective GHG mitigation measures with reasonable payback periods may exceed that of the market. However, UB’s mature energy conservation program may limit the potential of this source of financing, as many short-term or high-yield payback measures have already been implemented. 5.2.4 User Fees and Tariffs There has been considerable discussion in the CAP and the campus master plan about charging users for transportation services. The point is to reconnect users with the real costs of services and transform behavior. A homeowner has a strong incentive to conserve energy; they get a bill each month. Likewise, achieving cli-mate neutrality requires sending accurate price signals to the campus community. This model can be taken further. In addition to charging individuals and business units/departments directly to recover the partial or full costs of the parking servic-es or energy they use, a climate or carbon tax could steer behavior and raise funds for additional GHG reduction strategies. This is being considered at UC-Berkeley, as they discuss adjusting campus parking fees. Implementing such a mechanism could be complicated and politically difficult, and would require negotiating with campus bargaining units. However, as the campus grows and new buildings and parking facilities come online, incorporating systems (e.g., sub-metering) that al-low a ‘user fee’ model to be implemented presents real potential as a funding source and mechanism for behavioral change. 5.2.5 Administrative Allocation One obvious source for new, internally-generated financing for climate mitigation is through direct administrative allocation. Directly funding new GHG mitigation initiatives is a powerful means of reinforcing our climate neutrality commitment. This could be through a one-time grant to start a revolving loan fund, the hiring of additional staff, or financing specific opportunities. Ultimately, UB is a state insti-tution – hiring processes, budget allocations, and many other decisions are taken as part of a larger discussion at the state level. Furthermore, recent budget cuts seriously restrict UB’s ability to allocate additional funding to initiatives. Despite these challenges, with strong administrative support and a clear strategic vision, UB can argue for making mitigating climate change a central, funded priority in the SUNY system.
5. Financing Climate Neutrality
27:00 5-8 UB_CAP_FINAL_September15.doc-9/15/2009
5.3 Capitalizing on External Sources of Funding UB can increase available funds for achieving climate neutrality by securing ex-ternal funding through federal, state, local, and non-profit programs. By appealing to UB alumni, an already generous stream of funding can be increased to help achieve climate neutrality. To win external funding, a designated individual or team must regularly track a broad array of funding databases and websites. Identi-fying and/or hiring these staff should occur immediately. 5.3.1 Federal Funding Sources UB receives large amounts of research funding through federally-funded founda-tions such as NSF. In addition to research funding, UB may be able to capitalize on grants from agencies such as the US Department of Energy (DOE). For exam-ple, DOE’s Energy Efficiency and Renewable Energy office occasionally posts funding opportunities for innovative pilot programs, and also supports agencies such as NYSERDA and local-level governments through the State Energy Pro-gram and Smart Communities Network. UB’s status as a state entity may render it ineligible for many funding sources, but by working with US DOE representa-tives, opportunities for funding GHG reduction strategies can be identified. With tens of billions of dollars in the recent American Recovery and Reinvestment Act targeted at energy efficiency and renewable energy development, now may be a particularly critical opportunity. 5.3.2 State Opportunities for Financing Climate Neutrality There are opportunities for state-level climate neutrality financing. The vast ma-jority can be found through NYSERDA’s ‘Focus on Colleges and Universities’ program, which identifies programs and grants for higher education institutions to implement energy efficiency measures. These opportunities range from rebates for equipment upgrades to technical assistance and consulting grants. NYSERDA is a particularly promising source for funding, as it stands to benefit from two new pools of money: stimulus funding and the recent (and ongoing) auction of emissions allowances under the Regional Greenhouse Gas Initiative (RGGI) cap-and-trade system. RGGI is a cap-and-trade system among northeas-tern states. Under RGGI, utilities can bid on a certain volume of emissions allow-ances or permits, and the funds generated by the auction then go to individual states (in New York’s case, to NYSERDA) for energy efficiency activities. NYSERDA brought in nearly $525 million in funding as a result of a RGGI auc-tion, some of which may be available to UB. There are also opportunities through the New York Power Authority (NYPA) for project financing, often through a performance-contracting mechanism.
5. Financing Climate Neutrality
27:00 5-9 UB_CAP_FINAL_September15.doc-9/15/2009
5.3.3 Partnering with the Community Through collaboration with the City of Buffalo and other partners in WNY, we may be able to initiate climate-related partnerships that support the local econo-my. Leveraging our economic and research force in combination with the City’s political power may create interesting financial and environmentally beneficial partnerships. Partnerships created by the expansion of UB into downtown Buffalo could generate benefits for all. There may also be opportunities to work with large employers in the region. Pub-lic-private partnerships can be an effective approach to funding initiatives such as green technology incubators, clean energy research and development efforts, and student training programs. The recently announced public-private partnership with UB and Kaleida Health demonstrates this through the creation of a 10-story, $91 million project in downtown Buffalo that will save over $22 million because the building is shared. 5.3.4 Foundations and Non-Governmental Organizations (NGOs) There are many foundations and NGOs devoted to mitigating global climate change in higher education. Some of these, such as the National Wildlife Founda-tion’s Campus Ecology Program, provide technical assistance and grants to sup-port efforts to reduce GHG emissions. The Rocky Mountain Institute (RMI) works with campuses across the country, sometimes as full-cost consultants, other times providing low/no-cost technical assistance. Colorado State University re-cently benefited from RMI’s low/no-cost services. Other groups, such as AASHE, organize conferences and make tools, training, and resources available for little or no cost to members. The Clinton Climate Initiative has partnered with AASHE to support campus climate neutrality efforts. Philanthropies such as the Rockefeller Foundation occasionally finance domestic climate change initiatives, although these programs typically have a broader global outlook (e.g., the Rockefeller Foundation’s Climate Change Resilience program might have a link with UB’s Extreme Events Strategic Strength). 5.3.5 Alumni and Corporate Donations The UB alumni network is a potential source of funding for our climate neutrality program. UB should establish a specific alumni donation fund for climate action. Most importantly, especially during a financial downturn when donations are like-ly to decline, establishing a specific climate neutrality fund as part of the UB Uni-versity Development program could provide the impetus for donations from envi-ronmentally-conscious alumni. This would not only further the climate neutrality program, but also increase the volume of donations to the university. Finally, cor-porate donors are a potential source for climate neutrality funding, as they seek to donate funds as part of corporate social responsibility initiatives.
5. Financing Climate Neutrality
27:00 5-10 UB_CAP_FINAL_September15.doc-9/15/2009
5.4 Non-Economic Resources for Achieving Climate Neutrality
UB has a tremendous depth of non-economic resources at our disposal. There are many non-financial benefits associated with the proposed climate mitigation strat-egies such as hands-on learning, career skill development, community outreach, and more. There is also potential to capitalize on the enthusiastic, bright, and hardworking UB community as a source of labor. Volunteers are critical to run-ning many of our programs, presenting both an opportunity and a challenge; there are many competing demands for volunteers’ time. The UB Believers network can also be used to advocate for climate change mitigation on and off campus, helping pave the way for new public-private partnerships and programs. The challenge of achieving climate neutrality may motivate new volunteers and expand the pool of resources available to UB’s climate leaders. We can harness the full potential of its volunteer workforce by carefully tailoring climate neutrali-ty efforts to provide valuable career development and academic skills and oppor-tunities for meaningful engagement with the greater Buffalo community.
27:00 6-1 UB_CAP_FINAL_September15.doc-9/15/2009
In this Chapter: 1. A description of key roles and responsibilities for plan implementation 2. A review of metrics and tools for tracking progress
3. A discussion of interim targets and the timetable for achieving climate
neutrality
Plan Implementation: Allocating Responsibility and Tracking Progress
Achieving climate neutrality will involve sustained, coordinated effort over many years. For an endeavor of this magnitude, a strong foundation is needed upon which to frame and build the effort. Throughout this plan, key priorities for im-plementation have been highlighted. Taking these actions will involve individuals and groups from across the university, uniting students, faculty, and staff under a common banner. To facilitate this effort, the ESC will play a strong coordinating role. Roles and responsibilities for others are also outlined here. As the roles and responsibilities established in this chapter are adopted and the CAP is implemented, UB must track progress and establish interim targets. Im-proved tracking mechanisms will enable accountability and help identify road-blocks. By establishing interim targets, momentum is maintained and strategies can be updated to reflect changing realities. 6.1 Implementation: Who Is Responsible? All members of the UB community must play their part in achieving climate neu-trality. Climate change and sustainability awareness need to be woven into the fabric of the university, permeating all aspects of daily life. This has already been discussed extensively in Chapter 4, but merits reinforcement. Clearly delineated roles and responsibility are required as the CAP is imple-mented. Five broad roles have been identified:
6
6. Plan Implementation: Allocating Responsibility and Tracking Progress
27:00 6-2 UB_CAP_FINAL_September15.doc-9/15/2009
Leadership and Direction – framing and leading the climate neutrality ef-fort;
Coordination and Oversight – ensuring accountability, progress, campus-wide coordination, and phasing of initiatives;
Awareness and Outreach – creating a more knowledgeable and engaged campus and community;
Implementation – designing and making the operational changes needed to reduce GHG emissions; and
Research and Education – incorporating sustainability into UB’s mission. There are numerous additional roles and responsibilities that extend beyond these major themes, and some individuals and groups will shift between these broadly-defined roles. Cross-fertilization is key – global climate change is not effectively addressed from within a narrow box or silo. Nine entities have been identified to fill these roles:
Senior Leadership; UB’s Senior Sustainability Officer; The Environmental Stewardship Committee; University Facilities; UB Green; Sustainability coordinators; Faculty; Staff; and Students.
There is considerable overlap among these groups and roles. For example, the ESC features members of each group listed, and UB Green is housed in Universi-ty Facilities. As a result, many individuals will serve multiple roles with varying responsibilities. Roles must become more defined and specific relationships must develop between key actors; this is a short-term implementation priority. The fol-lowing discussion focuses on critical responsibilities requiring immediate fulfill-ment; however, additional roles and responsibilities will develop as implementa-tion progresses. 6.1.1 Senior Leadership: Leadership and Direction Signing the ACUPCC sent a powerful message from President Simpson that UB is committed to addressing climate change and achieving climate neutrality. Now this commitment needs to be continuously reinforced by action, which requires significant and sustained high-level support. UB’s senior leadership must provide the financial and human resources necessary to achieve climate neutrality. Strong leadership from the president’s office will set the tone for a successful climate neutrality campaign. The Provost is needed to help engage faculty. The president and the provost should lead by example, highlighting their own contributions to climate neutrality to set the tone and direction for the campus.
6. Plan Implementation: Allocating Responsibility and Tracking Progress
27:00 6-3 UB_CAP_FINAL_September15.doc-9/15/2009
6.1.2 UB’s Senior Sustainability Officer: Leadership and Direction To spearhead the climate neutrality campaign, UB must appoint a fully-dedicated senior administrator to oversee UB’s sustainability program. This position would integrate the operations and academic branches of the university. Many universi-ties have sustainability officers or coordinators who are typically assigned to op-erations, with limited involvement in decision-making pertaining to research and education. A senior officer with greater resources and a role in both academic and administrative elements of the university will integrate and lead the climate neu-trality process. Filling this position is an immediate priority for UB. The senior sustainability officer should oversee a staff adequate to run the climate neutrality campaign and its associated programs, potentially incorporating staff from UB Green and other campus groups. One priority is to assign an individual to track grant and funding opportunities. Another is to assign an individual to de-velop, collect, and analyze sustainability metrics for the university, to ensure that quantifiable data is collected on all the areas touched upon within this CAP. 6.1.3 The ESC: Coordination and Oversight The UB climate neutrality effort is currently spearheaded by the ESC, and the committee will need to continue its role as planning shifts to implementation. The ESC’s structure – integrating high-level staff with faculty and student representa-tives – positions it to provide effective oversight, coordination, and facilitation.
Oversight: The ESC’s monthly meetings should continue. This will allow for regular reports and updates from the members and subcommittee rep-resentatives, ensuring that work progresses and problems are identified.
Coordination: The ESC provides a central platform for representatives from nearly every major operating unit on campus. It is well-positioned to coordinate implementation across UB “silos.”
Facilitation: The ESC includes a number of high-ranking administrators who can remove or mitigate administrative barriers.
The ESC can also help fulfill resource requests, coordinating among groups when resources are housed in other departments or business units. The ESC can help ensure that business units and departments are including climate neutrality efforts in their budgets and strategic plans, and it can ensure that political roadblocks are brought to senior leadership for quick resolution. 6.1.4 University Facilities: Implementation University Facilities staff will play a critical role in implementing the many build-ing retrofits, renovations, and operational improvements required to achieve cli-mate neutrality. Facilities also plays a central role in new construction planning and in managing the university fleet.
6. Plan Implementation: Allocating Responsibility and Tracking Progress
27:00 6-4 UB_CAP_FINAL_September15.doc-9/15/2009
University Facilities has already generated tens of millions of dollars in energy savings. Continuing energy conservation efforts remain a top priority, and signifi-cant effort will be taken to improve building monitoring and benchmarking across campus. This will facilitate user-driven change and will identify additional oppor-tunities for improvement. Facilities will continue and expand its role as the im-plementation team for many of the university’s high-impact GHG mitigation measures. 6.1.5 UB Green: Implementation Few organizations at UB are as intimately involved in the daily ‘greening’ of the campus as UB Green. The baseline GHG inventory upon which the CAP is built, as well as the recently-published Climate Action Report originated in the efforts of UB Green. Many of the mitigation measures described in this plan were initial-ly developed by UB Green and its volunteer network. UB Green’s position within University Facilities, as well as its involvement with students across campus, enables it to access on-the-ground resources for planning and implementation of mitigation measures. In the short-term, UB Green should:
Continue to prepare regular updates to the GHG inventory; Develop proposals for climate change mitigation measures in collabora-
tion with Facilities and other units; Provide support to campus groups as they strive to implement new GHG
mitigation measures; and Continue to organize and run existing programs, such as RecycleMania,
the UB Green Library, etc. 6.1.6 Sustainability Coordinators: Awareness and Outreach The proposed sustainability coordinators program, described in Section 4.4.2, will be instrumental in raising awareness and engaging the UB community around climate neutrality. Collectively, sustainability coordinators will have access to all groups on campus, and will be a vehicle for transmitting information on progress, new programs, volunteer opportunities, competitions, and campus events. The establishment of this program is a short-term priority. 6.1.7 Faculty: Research and Education University faculty will help foster widespread and action-oriented innovation through their role as educators and researchers. Behavioral change among faculty members must be mandated and encouraged by the student body and sustainabili-ty coordinators. Conversely, behavioral change among students will occur by en-gaging their interest, involving them in research, and integrating teaching and re-search into the broader UB community. Faculty involvement will be critical in getting the Sustainability in Higher Education Taskforce off the ground. Further-
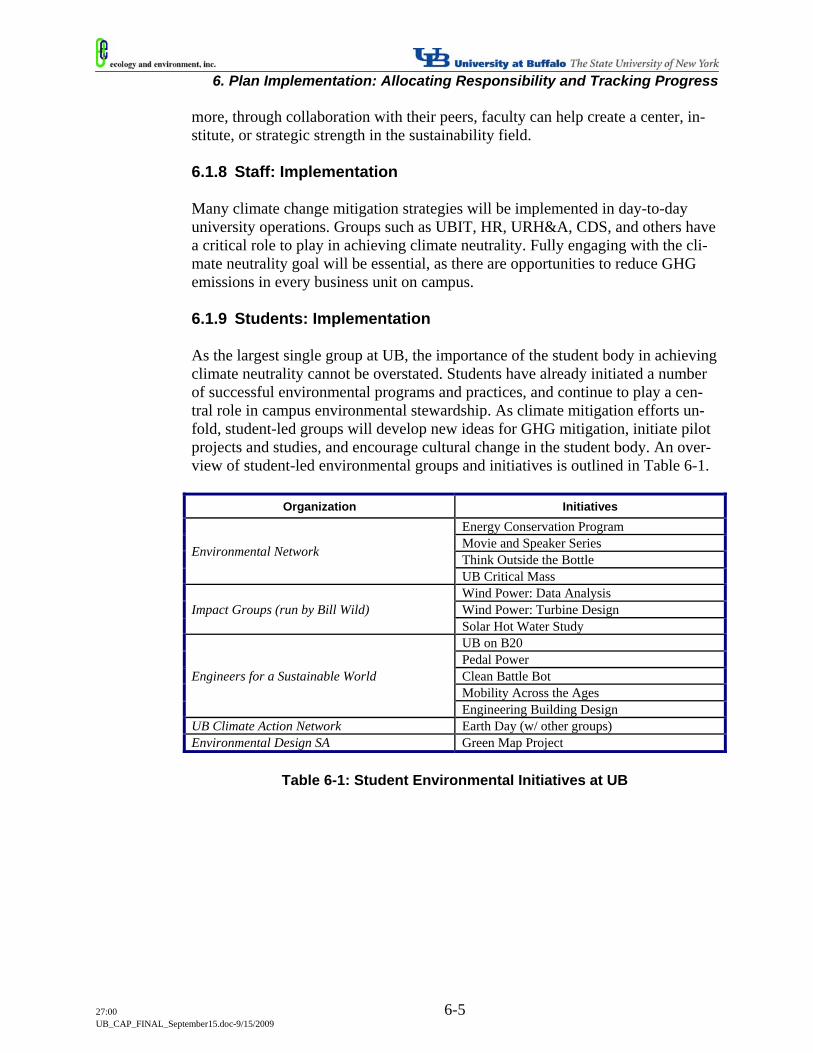
6. Plan Implementation: Allocating Responsibility and Tracking Progress
27:00 6-5 UB_CAP_FINAL_September15.doc-9/15/2009
more, through collaboration with their peers, faculty can help create a center, in-stitute, or strategic strength in the sustainability field. 6.1.8 Staff: Implementation Many climate change mitigation strategies will be implemented in day-to-day university operations. Groups such as UBIT, HR, URH&A, CDS, and others have a critical role to play in achieving climate neutrality. Fully engaging with the cli-mate neutrality goal will be essential, as there are opportunities to reduce GHG emissions in every business unit on campus. 6.1.9 Students: Implementation As the largest single group at UB, the importance of the student body in achieving climate neutrality cannot be overstated. Students have already initiated a number of successful environmental programs and practices, and continue to play a cen-tral role in campus environmental stewardship. As climate mitigation efforts un-fold, student-led groups will develop new ideas for GHG mitigation, initiate pilot projects and studies, and encourage cultural change in the student body. An over-view of student-led environmental groups and initiatives is outlined in Table 6-1.
Organization Initiatives
Environmental Network
Energy Conservation Program Movie and Speaker Series Think Outside the Bottle UB Critical Mass
Impact Groups (run by Bill Wild) Wind Power: Data Analysis Wind Power: Turbine Design Solar Hot Water Study
Engineers for a Sustainable World
UB on B20 Pedal Power Clean Battle Bot Mobility Across the Ages Engineering Building Design
UB Climate Action Network Earth Day (w/ other groups) Environmental Design SA Green Map Project
Table 6-1: Student Environmental Initiatives at UB
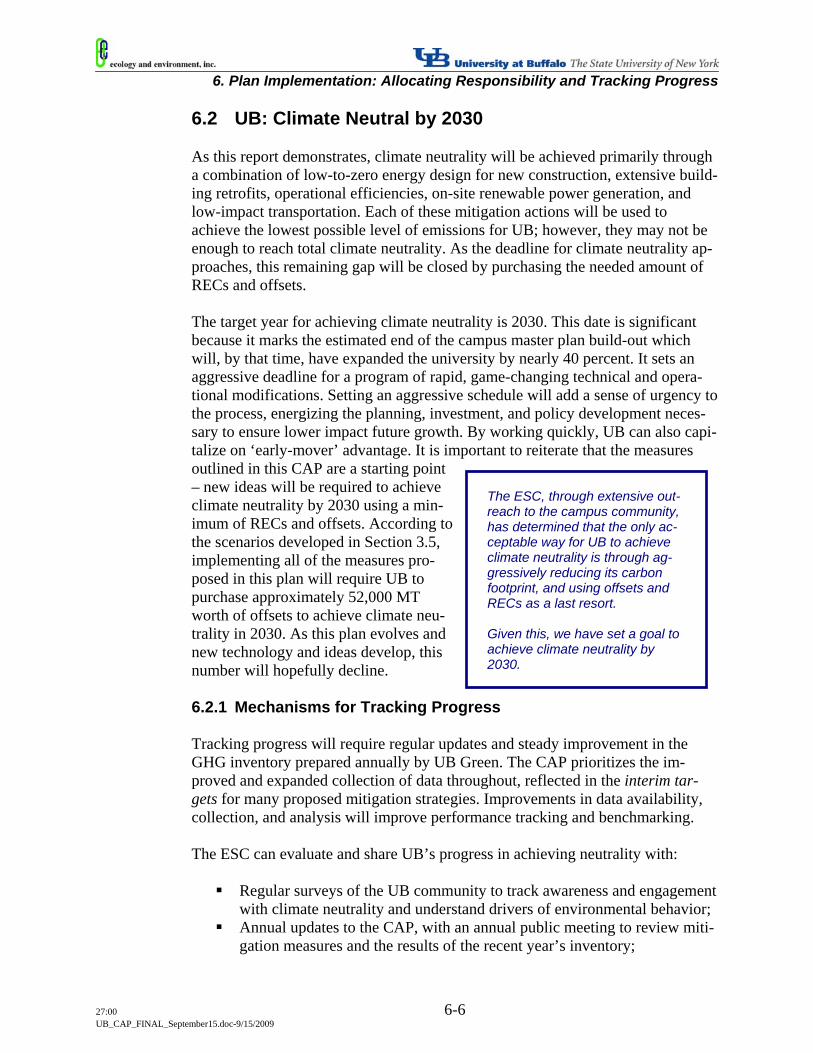
6. Plan Implementation: Allocating Responsibility and Tracking Progress
27:00 6-6 UB_CAP_FINAL_September15.doc-9/15/2009
6.2 UB: Climate Neutral by 2030 As this report demonstrates, climate neutrality will be achieved primarily through a combination of low-to-zero energy design for new construction, extensive build-ing retrofits, operational efficiencies, on-site renewable power generation, and low-impact transportation. Each of these mitigation actions will be used to achieve the lowest possible level of emissions for UB; however, they may not be enough to reach total climate neutrality. As the deadline for climate neutrality ap-proaches, this remaining gap will be closed by purchasing the needed amount of RECs and offsets. The target year for achieving climate neutrality is 2030. This date is significant because it marks the estimated end of the campus master plan build-out which will, by that time, have expanded the university by nearly 40 percent. It sets an aggressive deadline for a program of rapid, game-changing technical and opera-tional modifications. Setting an aggressive schedule will add a sense of urgency to the process, energizing the planning, investment, and policy development neces-sary to ensure lower impact future growth. By working quickly, UB can also capi-talize on ‘early-mover’ advantage. It is important to reiterate that the measures outlined in this CAP are a starting point – new ideas will be required to achieve climate neutrality by 2030 using a min-imum of RECs and offsets. According to the scenarios developed in Section 3.5, implementing all of the measures pro-posed in this plan will require UB to purchase approximately 52,000 MT worth of offsets to achieve climate neu-trality in 2030. As this plan evolves and new technology and ideas develop, this number will hopefully decline. 6.2.1 Mechanisms for Tracking Progress Tracking progress will require regular updates and steady improvement in the GHG inventory prepared annually by UB Green. The CAP prioritizes the im-proved and expanded collection of data throughout, reflected in the interim tar-gets for many proposed mitigation strategies. Improvements in data availability, collection, and analysis will improve performance tracking and benchmarking. The ESC can evaluate and share UB’s progress in achieving neutrality with:
Regular surveys of the UB community to track awareness and engagement with climate neutrality and understand drivers of environmental behavior;
Annual updates to the CAP, with an annual public meeting to review miti-gation measures and the results of the recent year’s inventory;
The ESC, through extensive out-reach to the campus community, has determined that the only ac-ceptable way for UB to achieve climate neutrality is through ag-gressively reducing its carbon footprint, and using offsets and RECs as a last resort. Given this, we have set a goal to achieve climate neutrality by 2030.
6. Plan Implementation: Allocating Responsibility and Tracking Progress
27:00 6-7 UB_CAP_FINAL_September15.doc-9/15/2009
Accountability: hold responsible parties (identified in the mitigation tables) to interim targets outlined in each successive version of the CAP;
Regular reports to AASHE, outlining mitigation measures implemented and overall progress towards meeting interim and final targets; and
Participation in events organized by campus sustainability organizations, to compare progress with other institutions and share ideas.
These mechanisms will allow UB to track its progress towards neutrality and to judge the extent to which the culture of sustainability has gained traction. 6.2.2 Interim Targets Given UB’s planned expansion, taking the common approach where universities aim to achieve a 2 percent reduction every year is inadequate. The process of es-tablishing interim targets will need to be negotiated and tied into plans for capital expansion, as well as the long-term phasing of the master plan. This version of the CAP contains interim targets for all proposed mitigation actions. These should be updated as progress is made in implementing the CAP. To the extent possible, UB’s interim targets should include both relative and abso-lute emissions targets. The University should strive for a constant, steady reduc-tion in emissions per capita, while allowing for brief periods where net emissions will climb, such as during periods of major construction and expansion. Linking the interim targets to the ESC oversight agenda will allow early identifi-cation of a failure to meet targets. A remedial action plan can then be prepared. 6.3 Adapting to a Changing Climate at UB Due to UB’s reliance on resources from across the country and around the world, it is exposed to risk from climate change. Factors such as fluctuating energy pric-es, rising costs in materials, conflicts in key manufacturing and industrial regions, and unpredictable changes in the regulatory environment may ultimately affect UB and our daily operations. By keeping abreast of the latest regional impact pre-dictions from climate scientists, ensuring a diverse and predominantly local supply chain, and building resilient infrastructure, UB is essentially creating its own climate adaption program. UB’s commitment to climate neutrality will be achieved through resource-efficient growth, operational efficiency, and long-term planning and innovation. By reducing its resource needs, producing a greater share of energy on campus, and fostering a culture of innovation and sustainability, UB will become a leaner, fitter, and more adaptable organization. Achieving climate neutrality is a goal that will guide and shape UB as it strives to increase academic prominence in a rapidly changing world.
27:00 1 UB_CAP_FINAL_September15.doc-9/15/2009
APPENDICES A. UB’s GHG Inventory and Emissions Projections:
Methods and Approach Estimating future emissions is critical, especially given UB’s proposed campus growth. However, it is very difficult to extrapolate trends in nationwide fleet effi-ciency, grid efficiency, and other trends beyond UB’s control; furthermore, the pattern and energy intensity of future growth at UB is partly determined by build-ing design, but also by research demand and occupant use. The numbers used in this plan are preliminary, and intended to provoke discussion and planning. The methods taken for estimating future emissions are presented below: Building Emissions Future energy use and GHG emissions incorporate the projected changes in ener-gy use resulting from implementation of the Master Plan.
Future Building Energy Use: Total 2007
Energy Use - Energy Use in Demolished
Buildings + Energy Use in
New Buildings = Total Annual Energy Use
Existing Buildings/Renovations: For all existing buildings slated to remain in use throughout the build-out, existing measurements of energy use were extrapolated to the future as a worst-case performance baseline. This provides a suitable upper boundary, while ongoing renovations, retrofits, and upgrades included in mitiga-tion strategies will improve efficiency of these facilities. Steam and chilled water currently purchased on the downtown campus is not included in this analysis. It is assumed that all future energy use in buildings will be electricity or natural gas. Demolition of Existing Building: For all buildings slated to be demolished during the build-out, existing measurements of energy use were extrapolated until the estimated demolition date, and then that energy use was eliminated from the base-line. In cases where demolition dates are uncertain we used dates from the campus master plan, understanding that they may change. Emissions associated with con-struction and demolition were not factored into the projections.
A
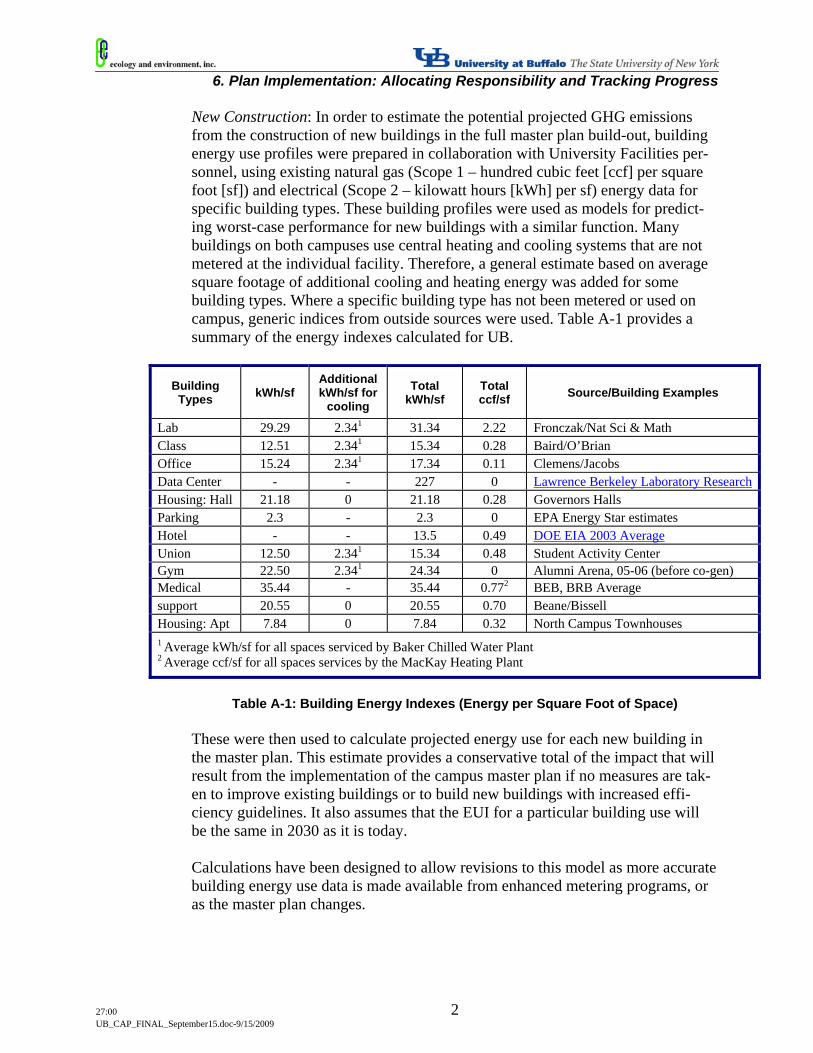
6. Plan Implementation: Allocating Responsibility and Tracking Progress
27:00 2 UB_CAP_FINAL_September15.doc-9/15/2009
New Construction: In order to estimate the potential projected GHG emissions from the construction of new buildings in the full master plan build-out, building energy use profiles were prepared in collaboration with University Facilities per-sonnel, using existing natural gas (Scope 1 – hundred cubic feet [ccf] per square foot [sf]) and electrical (Scope 2 – kilowatt hours [kWh] per sf) energy data for specific building types. These building profiles were used as models for predict-ing worst-case performance for new buildings with a similar function. Many buildings on both campuses use central heating and cooling systems that are not metered at the individual facility. Therefore, a general estimate based on average square footage of additional cooling and heating energy was added for some building types. Where a specific building type has not been metered or used on campus, generic indices from outside sources were used. Table A-1 provides a summary of the energy indexes calculated for UB.
Building Types kWh/sf
Additional kWh/sf for
cooling Total
kWh/sf Total ccf/sf Source/Building Examples
Lab 29.29 2.341 31.34 2.22 Fronczak/Nat Sci & Math Class 12.51 2.341 15.34 0.28 Baird/O’Brian Office 15.24 2.341 17.34 0.11 Clemens/Jacobs Data Center - - 227 0 Lawrence Berkeley Laboratory Research Housing: Hall 21.18 0 21.18 0.28 Governors Halls Parking 2.3 - 2.3 0 EPA Energy Star estimates Hotel - - 13.5 0.49 DOE EIA 2003 Average Union 12.50 2.341 15.34 0.48 Student Activity Center Gym 22.50 2.341 24.34 0 Alumni Arena, 05-06 (before co-gen) Medical 35.44 - 35.44 0.772 BEB, BRB Average support 20.55 0 20.55 0.70 Beane/Bissell Housing: Apt 7.84 0 7.84 0.32 North Campus Townhouses 1 Average kWh/sf for all spaces serviced by Baker Chilled Water Plant 2 Average ccf/sf for all spaces services by the MacKay Heating Plant
Table A-1: Building Energy Indexes (Energy per Square Foot of Space)
These were then used to calculate projected energy use for each new building in the master plan. This estimate provides a conservative total of the impact that will result from the implementation of the campus master plan if no measures are tak-en to improve existing buildings or to build new buildings with increased effi-ciency guidelines. It also assumes that the EUI for a particular building use will be the same in 2030 as it is today. Calculations have been designed to allow revisions to this model as more accurate building energy use data is made available from enhanced metering programs, or as the master plan changes.
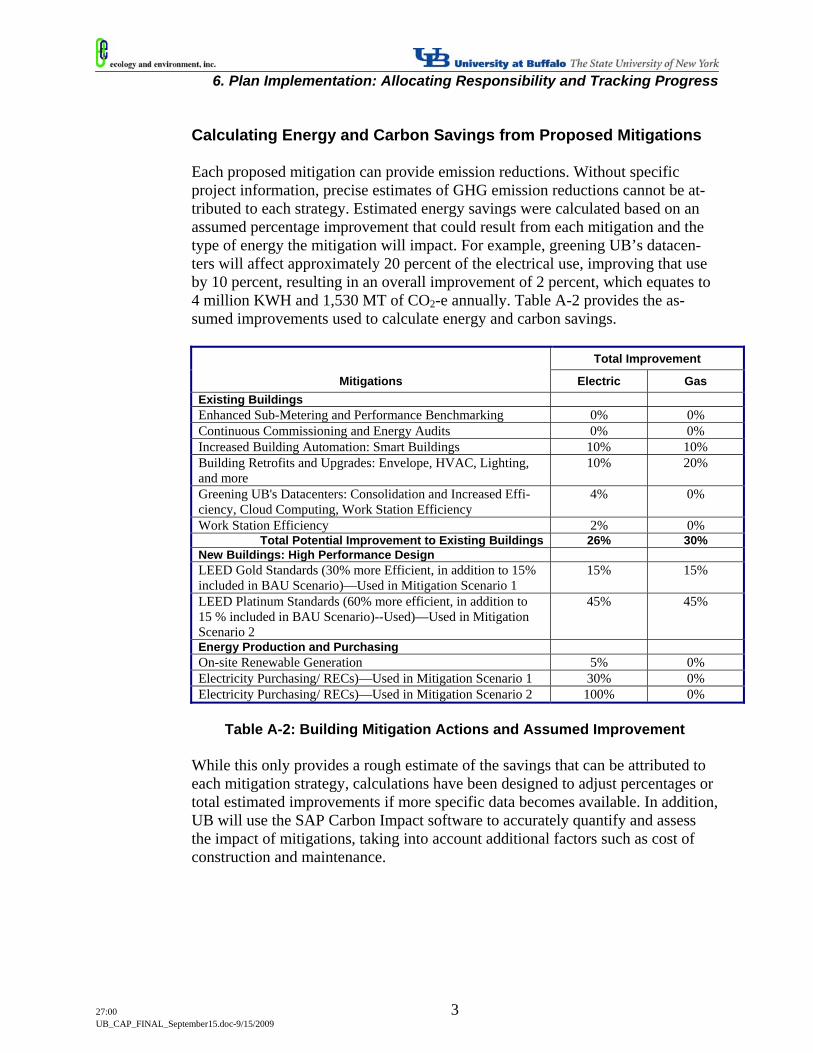
6. Plan Implementation: Allocating Responsibility and Tracking Progress
27:00 3 UB_CAP_FINAL_September15.doc-9/15/2009
Calculating Energy and Carbon Savings from Proposed Mitigations Each proposed mitigation can provide emission reductions. Without specific project information, precise estimates of GHG emission reductions cannot be at-tributed to each strategy. Estimated energy savings were calculated based on an assumed percentage improvement that could result from each mitigation and the type of energy the mitigation will impact. For example, greening UB’s datacen-ters will affect approximately 20 percent of the electrical use, improving that use by 10 percent, resulting in an overall improvement of 2 percent, which equates to 4 million KWH and 1,530 MT of CO2-e annually. Table A-2 provides the as-sumed improvements used to calculate energy and carbon savings.
Mitigations
Total Improvement
Electric Gas Existing Buildings Enhanced Sub-Metering and Performance Benchmarking 0% 0% Continuous Commissioning and Energy Audits 0% 0% Increased Building Automation: Smart Buildings 10% 10% Building Retrofits and Upgrades: Envelope, HVAC, Lighting, and more
10% 20%
Greening UB's Datacenters: Consolidation and Increased Effi-ciency, Cloud Computing, Work Station Efficiency
4% 0%
Work Station Efficiency 2% 0% Total Potential Improvement to Existing Buildings 26% 30%
New Buildings: High Performance DesignLEED Gold Standards (30% more Efficient, in addition to 15% included in BAU Scenario)—Used in Mitigation Scenario 1
15% 15%
LEED Platinum Standards (60% more efficient, in addition to 15 % included in BAU Scenario)--Used)—Used in Mitigation Scenario 2
45% 45%
Energy Production and PurchasingOn-site Renewable Generation 5% 0% Electricity Purchasing/ RECs)—Used in Mitigation Scenario 1 30% 0% Electricity Purchasing/ RECs)—Used in Mitigation Scenario 2 100% 0%
Table A-2: Building Mitigation Actions and Assumed Improvement
While this only provides a rough estimate of the savings that can be attributed to each mitigation strategy, calculations have been designed to adjust percentages or total estimated improvements if more specific data becomes available. In addition, UB will use the SAP Carbon Impact software to accurately quantify and assess the impact of mitigations, taking into account additional factors such as cost of construction and maintenance.
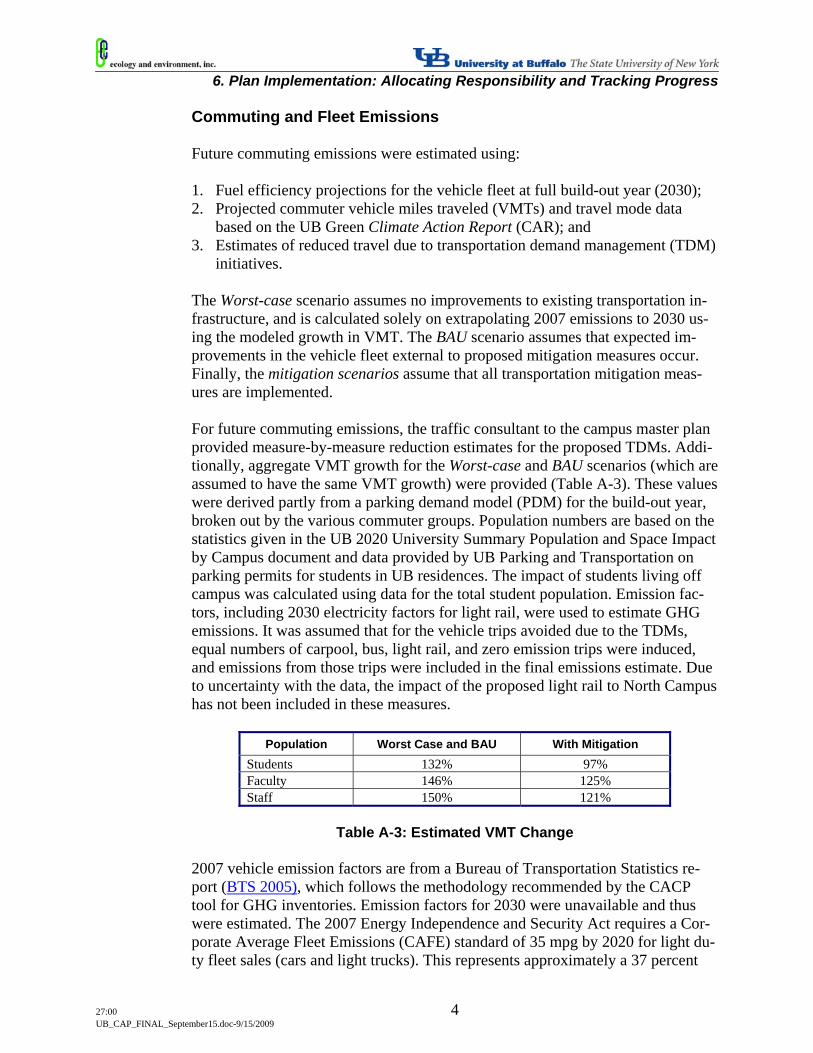
6. Plan Implementation: Allocating Responsibility and Tracking Progress
27:00 4 UB_CAP_FINAL_September15.doc-9/15/2009
Commuting and Fleet Emissions Future commuting emissions were estimated using: 1. Fuel efficiency projections for the vehicle fleet at full build-out year (2030); 2. Projected commuter vehicle miles traveled (VMTs) and travel mode data
based on the UB Green Climate Action Report (CAR); and 3. Estimates of reduced travel due to transportation demand management (TDM)
initiatives. The Worst-case scenario assumes no improvements to existing transportation in-frastructure, and is calculated solely on extrapolating 2007 emissions to 2030 us-ing the modeled growth in VMT. The BAU scenario assumes that expected im-provements in the vehicle fleet external to proposed mitigation measures occur. Finally, the mitigation scenarios assume that all transportation mitigation meas-ures are implemented. For future commuting emissions, the traffic consultant to the campus master plan provided measure-by-measure reduction estimates for the proposed TDMs. Addi-tionally, aggregate VMT growth for the Worst-case and BAU scenarios (which are assumed to have the same VMT growth) were provided (Table A-3). These values were derived partly from a parking demand model (PDM) for the build-out year, broken out by the various commuter groups. Population numbers are based on the statistics given in the UB 2020 University Summary Population and Space Impact by Campus document and data provided by UB Parking and Transportation on parking permits for students in UB residences. The impact of students living off campus was calculated using data for the total student population. Emission fac-tors, including 2030 electricity factors for light rail, were used to estimate GHG emissions. It was assumed that for the vehicle trips avoided due to the TDMs, equal numbers of carpool, bus, light rail, and zero emission trips were induced, and emissions from those trips were included in the final emissions estimate. Due to uncertainty with the data, the impact of the proposed light rail to North Campus has not been included in these measures.
Population Worst Case and BAU With Mitigation Students 132% 97% Faculty 146% 125% Staff 150% 121%
Table A-3: Estimated VMT Change
2007 vehicle emission factors are from a Bureau of Transportation Statistics re-port (BTS 2005), which follows the methodology recommended by the CACP tool for GHG inventories. Emission factors for 2030 were unavailable and thus were estimated. The 2007 Energy Independence and Security Act requires a Cor-porate Average Fleet Emissions (CAFE) standard of 35 mpg by 2020 for light du-ty fleet sales (cars and light trucks). This represents approximately a 37 percent
6. Plan Implementation: Allocating Responsibility and Tracking Progress
27:00 5 UB_CAP_FINAL_September15.doc-9/15/2009
increase in new vehicle fuel efficiency relative to 2007 fleet average. For this study it is assumed that the nationwide fleet becomes 20 percent more efficient relative to the 2020 CAFE standard by 2030, averaging 42 mpg. Increases in na-tional transportation efficiency beyond the 2020 CAFE standard will likely be supported by measures in addition to vehicle improvements, for example the use of bio-fuels. Air Travel, Waste Generation, and Fugitive Emissions The approach taken to estimating a baseline for future air travel, waste generation, and fugitive refrigerant emissions was very simple – existing per capita (for waste and air travel) and per square foot (for refrigerants) figures were extrapolated to the full build-out population and square footage. Given the fact that methods for easily estimating the impact of air travel on global climate change are still in their nascence (SEI 2008) and no forecasted travel growth statistics exist at UB, this method is crude but appropriate, although it may underestimate growth trends in UB air travel. For the Worst-case scenario, it was assumed that air fleet emissions per passenger mile are constant. For the BAU case, it is assumed that air travel becomes 1.5 percent less GHG intensive per year, through 2030 (GAO 2009). For waste disposal, UB uses an operator that applies industry best practices (me-thane capture for energy generation), so short term opportunities for improving this sector’s impact are limited, beyond efforts to boost recycling and reduce net waste generation. Fugitive refrigerant emissions are dependent on three factors – the global warming potential of the refrigerants in use, the quantity in use, and their leakage rates. UB has a robust refrigerant management program, and thus present-day figures are appropriate as a baseline, provided no major changes in building design result in decreased refrigerant use. B: Offsets and RECs Carbon offsets and renewable energy certificates (RECs) (also known as Green Tags) can be used to purchase reductions in GHG emissions through off-site GHG mitigation projects. As demonstrated in Section 3.3, they are likely to play a key role in helping UB achieve climate neutrality, although our intent is to rely on RECs and offsets as little as possible. At present, UB purchases RECs to cover 15 percent of its electricity purchases, with the target being 20 percent by 2013, per Executive Order 111. If UB reduces its overall electricity demand substantially, the costs associated with complying with Executive Order 111 will decrease, as fewer offsets or RECs will need to be purchased to reach the 20 percent threshold. Offsets sold in the voluntary carbon market are known as Verified Emissions Re-ductions, and a single offset typically represents one metric ton of avoided emis-sions, while RECs represent a quantity of generated electricity. Carbon offsets can be purchased that represent avoided GHG emissions resulting from renewable electricity generation, although a REC and a carbon offset cannot be sold for the same electricity.
6. Plan Implementation: Allocating Responsibility and Tracking Progress
27:00 6 UB_CAP_FINAL_September15.doc-9/15/2009
Offsets and RECs have varying levels of quality, and it is important that UB has procedures in place to assure high quality purchases. A key concept is additionali-ty, which is a measure of whether an offset or REC is from a project that is in ad-dition to business as usual practices. Other quality issues with offsets include li-miting environmental or social impacts associated with the project, avoiding double counting, and assuring that implementation of the project does not induce a carbon impact at another location (known as ‘leakage’). Generally, offsets programs tend to have better quality assurance than RECs, with more stringent additionality tests. On an MT CO2-e basis, offsets tend to be less commoditized and cost more than RECs, and cost of offsets tends to vary depend-ing on both the assurance of a true GHG reduction, and other attributes of the project. For example, offsets resulting from avoided deforestation within a tropi-cal rain forest will tend to cost more than offsets resulting from the destruction of methane from a coal mine, as offset purchasers may view multiple positive out-comes resulting from the project. Offsets that are located near to the purchaser, keeping revenue within a local economy, may also command a higher price. A common critique of RECs is that they are not additional, and that many RECs re-sult from projects that actually occur because of existing government support pol-icies. Although there are certification schemes for RECs that attempt to address these issues, such as Green-e, concerns remain. There are many offset and REC programs, and until recently little standardization or assurance of quality. Recently, independent verification of offsets to a third-party standard has become common. An important development is that three car-bon offset programs in the U.S., the Chicago Climate Exchange (CCX), the Vo-luntary Carbon Standard (VCS) and the Climate Action Reserve (CAR), have be-gun to require third-party validation and verification of projects conducted by ac-credited verifiers in accordance with international standards. These programs re-quire verifiers to be accredited by the American National Standards Institute (ANSI) to an international standard, ISO 14064-2. Offsets purchased from these programs are likely to be of high quality and represent projects that have demon-strated additionality and industry best practices. For UB it is desirable to fund offset projects that are local, have a social benefit, and have a research and educational component, and thereby achieve multiple ob-jectives. This plan proposes that UB identify local projects that are allied with its research and educational goals. Projects could be developed directly by UB, or could be developed with a carbon offset developer or marketer. It is common practice for large organizations to work with a carbon offset developer to secure projects specific to its needs. Projects might include:
Energy efficiency projects for local schools or community centers; Implementation of carbon mitigation or capture technologies resulting
from UB research;
6. Plan Implementation: Allocating Responsibility and Tracking Progress
27:00 7 UB_CAP_FINAL_September15.doc-9/15/2009
Projects implementing next generation energy generation technologies re-lated to the Great Lakes and the Niagara River, such as in-river hydroki-netics projects.
There may be financial benefits to securing long-term agreements for carbon off-sets and RECs while there is no federal GHG compliance scheme in the U.S. A mandatory federal cap and trade program is expected in the near future, and based on bills currently under debate in the U.S. Congress, it is likely to include a large domestic and international carbon offset component. As compliance emissions limits are lowered over time, demand for offsets will increase. Therefore, it may be in UB’s interest to secure long term carbon offset or REC contracts in order to hedge financial risk associated with carbon market uncertainty, and to assure that carbon neutrality goals can be met. C: Major ESCO Projects at UB CES/Way International From 1994-1997, UB worked with CES/Way International (now Honeywell Building Solutions), to implement a $17 million comprehensive energy project primarily on the North Campus. This project reduced UB’s annual use by over 25 million kilowatt hours and energy costs by over $2.7 million and won the Associ-ation of Energy Engineers’ “Energy Project of the Year” award in 1997. The scope of work included:
Chiller optimizations Conversion of electric to gas heat Heat recovery Retrofit of lighting systems Installation of energy efficient motors and variable speed drives
Chevron ESCO Contract Chevron Energy Solutions implemented an $11.8 million comprehensive energy conservation project at UB South campus in the academic buildings. The project will produce a conservatively estimated savings of $1.2 million annually. The scope of work included:
Heat recovery improvements at several buildings, Retrofit to high efficiency lighting at over 25,000 fixtures (all buildings), Energy efficient motors and variable speed drives (several buildings) Energy management system upgrades (most buildings), Steam system upgrades (several buildings), Chiller replacements at four buildings, Lab fume hood system upgrades at two buildings, Central fan system upgrades at several buildings, 73.5 kW photovoltaic power generation system at Norton Hall
6. Plan Implementation: Allocating Responsibility and Tracking Progress
27:00 8 UB_CAP_FINAL_September15.doc-9/15/2009
New York Power Authority (NYPA) Project The NYPA project implemented energy conservation projects at UB North and South campuses and downtown facilities. The lead contractor supervising the project design, construction and commissioning was Wendel Duchscherer, a local engineering firm. The project will cost an estimated $10.6M with annual savings estimated at $207K.
Exterior lighting upgrades; Security cameras and blue light safety phones at South; Improvements as the Baker Central chiller plant; Heat recovery at North; AC upgrades at the Research Institute on Addictions downtown; Hot water heater replacements at several locations.