Intro to GEOSTAT to GEOSTAT (course overview ... ' A Practical Guide to Geostatistical Mapping' ......
92
Intro to GEOSTAT (course overview, software installation and some examples) Tomislav Hengl & Dylan E. Beaudette ISRIC — World Soil Information, Wageningen University USDA-NRCS Soil Scientist, California Soil Resource Lab GEOSTAT course, 11-17 April 2011, Canberra
-
Upload
vuongnguyet -
Category
Documents
-
view
221 -
download
2
Transcript of Intro to GEOSTAT to GEOSTAT (course overview ... ' A Practical Guide to Geostatistical Mapping' ......

Intro to GEOSTAT(course overview, software installation and
some examples)
Tomislav Hengl & Dylan E. BeaudetteISRIC — World Soil Information, Wageningen University
USDA-NRCS Soil Scientist, California Soil Resource Lab
GEOSTAT course, 11-17 April 2011, Canberra
Who is who
I Organizers:
1. Augusto Sanabria, Geospatial & Earth Monitoring DivisionGeoscience Australia
2. Alan Welsh, Centre for Mathematics & Its Applications.Australian National University
I Lecturers:
I Tomislav (Tom) Hengl, senior researcher (ISRIC, Wageningen,NL)
I Dylan E.Beaudette, post-doctoral researcher (NRCS, USA)
I Guest lectures:
1. John Maindonald, Centre for Mathematics & Its Applications(Australian National University, Canberra)
2. Graham Williams, Senior director and Chief Data Miner(Australian Taxation Office, Canberra)
GEOSTAT course, 11-17 April 2011, Canberra

Who is who
I Organizers:
1. Augusto Sanabria, Geospatial & Earth Monitoring DivisionGeoscience Australia
2. Alan Welsh, Centre for Mathematics & Its Applications.Australian National University
I Lecturers:I Tomislav (Tom) Hengl, senior researcher (ISRIC, Wageningen,
NL)
I Dylan E.Beaudette, post-doctoral researcher (NRCS, USA)
I Guest lectures:
1. John Maindonald, Centre for Mathematics & Its Applications(Australian National University, Canberra)
2. Graham Williams, Senior director and Chief Data Miner(Australian Taxation Office, Canberra)
GEOSTAT course, 11-17 April 2011, Canberra
Who is who
I Organizers:
1. Augusto Sanabria, Geospatial & Earth Monitoring DivisionGeoscience Australia
2. Alan Welsh, Centre for Mathematics & Its Applications.Australian National University
I Lecturers:I Tomislav (Tom) Hengl, senior researcher (ISRIC, Wageningen,
NL)I Dylan E.Beaudette, post-doctoral researcher (NRCS, USA)
I Guest lectures:
1. John Maindonald, Centre for Mathematics & Its Applications(Australian National University, Canberra)
2. Graham Williams, Senior director and Chief Data Miner(Australian Taxation Office, Canberra)
GEOSTAT course, 11-17 April 2011, Canberra

How it all got started I
-------- Original Message --------
Subject: GEOSTAT course [SEC=UNCLASSIFIED]
Date: Fri, 8 Oct 2010 06:57:50 +0200
From: [email protected] <[email protected]>
To: Hengl, Tom <[email protected]>
CC: [email protected] <[email protected]>,
[email protected] <[email protected]>,
[email protected] <[email protected]>
Dear Dr. Hengl,
I have been reading your interesting book
'A Practical Guide to Geostatistical Mapping'
And I have noticed that you present a 5-day training
course on this area.
GEOSTAT course, 11-17 April 2011, Canberra
How it all got started II
I have recently talked with my colleagues at the
Australian National University about the possibility
of inviting you to Australia to present your
Geostatistical course for us.
Would you be interested and available to present your
GEOSTAT Course in Canberra (Australia's capital)?
A good time for us would be April-May next year but we
would consider any other time when you could be available.
Thank you in anticipation.
(and thank you for your excellent book),
Best Regards,
Augusto
GEOSTAT course, 11-17 April 2011, Canberra

About ISRIC
I ISRIC — World Soil Information.
I ISRIC = International Soil Reference Information Center.
I Non-profit organization / affiliated to Wageningen Universityand Research.
I Mandate: serve soil data; serve international soil standards;moderate collaboration and partnerships.
I Director: Prem Bindraban
I Projects: GlobalSoilMap.net, SOTER, Green Water Credits. . .
GEOSTAT course, 11-17 April 2011, Canberra

The six pillars of open geo-data production1
1. open data, in real-time
2. open source geospatial software
3. open, reproducable procedures
4. open, web-based, methods for data and processing models(interoperability)
5. open and explicitly quantified significance and accuracy levelsof research findings
6. managed, open user and developer communities
1Edzer Pebesma, (OpenGeostatistic.org)
GEOSTAT course, 11-17 April 2011, Canberra

Depression index: Canberra vs Wageningen
Mean long-term cloud fraction (example):
> GNworldgrids(layername="cloudfm", xcoord=6.848911, ycoord=52.245427)
[1] "184"
> GNworldgrids(layername="cloudfm", xcoord=149.11902, ycoord=-35.28028)
[1] "113"
GEOSTAT course, 11-17 April 2011, Canberra

General structure
I DAY 1: Introduction and software installation (R, Tinn-R,SAGA GIS, GRASS. . .).
I DAY 2: Space-time data formats (classes and packages in R).
I DAY 3: MySQL and PostGIS / Preparing gridded data(linking R with GIS)
I DAY 4: Overview of spatial prediction models(regression-kriging in one day!).
I DAY 5: Visualization of space-time data.
GEOSTAT course, 11-17 April 2011, Canberra

The course programme
Monday 9:30–18:00 (Spark-Helmore Theatre)
I Welcome note and course overview
Tuesday 9:00–17:30 (Spark-Helmore Theatre)
I data management (classes and functions for space-time data);
I automating analysis — making functions and packages (scripting editors:Tinn-R);
Wednesday 9:00–17:30 (Spark-Helmore Theatre)
I Introduction to spatial db / SQL and PostGIS;
I Combining R with external applications (SAGA GIS, FWTools);
Thursday 9:00–17:30 (Spark-Helmore Theatre)
I tour de force on geostatistics;
Friday 9:00–17:00 (P.A.P. Moran room!)
I optional lessons (space-time data visualization);
GEOSTAT course, 11-17 April 2011, Canberra

What is a crash course
A “crash course” is a compressed version of a training course forpeople that already have full agendas. It is really intended for
people who pick up new methods/tools quickly and have ahigh motivation to learn (PhD students?). This means no longquestions, no going back, no deep discussion, no complains aboutthe speed/programme of the course. . . and of course: no promises
that you will manage to master these tools in such a short time.
GEOSTAT course, 11-17 April 2011, Canberra

Types of R courses
I You loose time, we loose time.
I You loose time (we practice teaching).
I We loose time.
I You run a similar course in 1–2 years.
GEOSTAT course, 11-17 April 2011, Canberra

Types of R courses
I You loose time, we loose time.
I You loose time (we practice teaching).
I We loose time.
I You run a similar course in 1–2 years.
GEOSTAT course, 11-17 April 2011, Canberra

Types of R courses
I You loose time, we loose time.
I You loose time (we practice teaching).
I We loose time.
I You run a similar course in 1–2 years.
GEOSTAT course, 11-17 April 2011, Canberra
Types of R courses
I You loose time, we loose time.
I You loose time (we practice teaching).
I We loose time.
I You run a similar course in 1–2 years.
GEOSTAT course, 11-17 April 2011, Canberra

Did you do your homework?
Kabacoff, R.I., 2009. Data Analysis and Graphics with R.Manning publications, 375 p.
Hengl, T. 2009. A Practical Guide for Geostatistical Mapping.University of Amsterdam, (lulu.com).
Beaudette, D., 2009. Open Source Software Tools for SoilScientists. University of California at Davis.
GEOSTAT course, 11-17 April 2011, Canberra

Some important assumptions
I Some of you are experienced users (20–30% are beginners).
I Most of you are new to SAGA / GRASS (you need a gentleintro).
I R is sexy.
I It has a steep learning curve: R is hell.
I You all have various backgrounds and see world with differenteyes.
GEOSTAT course, 11-17 April 2011, Canberra

Disclaimer
I We can give you an overview of R+OSGeo in 5 days; we canNOT teach you statistics, GIS, RS, computer science. . . in 40hours.
I Dylan & Tom are not responsible for WLAN, local logisticsetc.(ANU).
I We are not responsible for how you organize things on yourlaptop.
GEOSTAT course, 11-17 April 2011, Canberra

Getting the right motivation (inspiration)
I Why should you invest time to learn to speak R?
I What can it do? (and what it can’t do?)
I How does the R-sig-geo community works (what are itsshared principles)?
I Is R the best choice for spatio-temporal data analysis?
GEOSTAT course, 11-17 April 2011, Canberra

The open source movement
Open Source solutions2:
I Operating systems: Linux
I Databases: SQL
I Scientific writing: LATEX
I Spatial analysis: GRASS GIS, SAGA GIS
I Statistical computing: R
2http://www.gnu.org/philosophy/fsfs/rms-essays.pdf
GEOSTAT course, 11-17 April 2011, Canberra

Quote
“To build a better world we need to replace thepatchwork of lucky breaks and arbitrary advantages thattoday determine success – the fortunate birth dates andthe happy accidents of history – with a society thatprovides opportunities for all.”
Malcom Gladwell in “Outliers”.
GEOSTAT course, 11-17 April 2011, Canberra

FOSS and academic work
GEOSTAT course, 11-17 April 2011, Canberra
What is R?
I the open source implementation of the S language forstatistical computing created by Ross Ihaka and RobertGentleman (now maintained by the R Development CoreTeam);
I why R?: the name “R” was selected for two reasons: (1)precedence —“R”is a letter before“S”, and (2) coincidence —both of the creators’ names start with a letter “R”;
I it is a computer language developed to simplify statisticalcomputing/programming;
I widely recognized as one of the fastest growing and mostcomprehensive statistical computing tools;
I it is a movement;
GEOSTAT course, 11-17 April 2011, Canberra

R packages
8 INVITED SECTION: THE FUTURE OF R
StageInitial Transitional R Core
Approximate Dates 1990-94 1994-97 1997-Recruitment some student participation demonstrated interest semi-purposive, by invitationDivision of labour none developing semi-formalHierarchy none original developers, contributors differential participationPrincipal Mode of Cooperation direct collaboration anarchic voluntarism partly distinct roles + voluntarismPlanning none implicit partialDecision-Making joint individual modified consensusResolution of Disagreements discussion largely unnecessary discussion, preemption, avoidanceprincipal goal personal development reproduce and improve S various, partly conflicting
Table 1: Stages in the development of the R Project.
Num
ber
of C
RA
N P
acka
ges
2001
−06
−21
2001
−12
−17
2002
−06
−12
2003
−05
−27
2003
−11
−16
2004
−06
−05
2004
−10
−12
2005
−06
−18
2005
−12
−16
2006
−05
−31
2006
−12
−12
2007
−04
−12
2007
−11
−16
2008
−03
−18
2008
−10
−18
2009
−09
−17
100
200
300
400
500600
800
10001200
1500
2000
1.3
1.4
1.5
1.7
1.8
1.9
2.0
2.1
2.2
2.3
2.4
2.5
2.6
2.7
2.8
2.9
110129
162
219
273
357406
548647739
9111000
1300142716141952
Date
R Version
●
●
●
●
●
●●
●
●●
●●
●●
●
●
−0.
20−
0.15
−0.
10−
0.05
0.00
0.05
0.10
Date
Res
idua
ls
2002 2004 2006 2008 2010
●
●
●
●
●
● ●
●
●
●●
●
●
●
●
●
Figure 3: The number of packages on CRAN (left panel) has grown roughly exponentially, with residu-als from the exponential trend (right panel) showing a recent decline in the rate of growth. The numberof packages for R version 1.6 is not shown because the count was taken only two days after that for ver-sion 1.5, and therefore indicated just one additional package. (An earlier version of the graph in the leftpanel appeared in Fox, 2008.) Sources of data: https://svn.r-project.org/R/branches/ and (for version 2.9)http://cran.r-project.org/web/checks/check_summary.html.
The R Journal Vol. 1/2, December 2009 ISSN 2073-4859
GEOSTAT course, 11-17 April 2011, Canberra

R is“sexy”
GEOSTAT course, 11-17 April 2011, Canberra

What it is not
I it’s not a software with GUI and point-and-click control;
I there are practically no data analysis wizards (RCommander?);
I it comes with no warranties (but so does the commercialsoftware too!!);
I there is practically no formal support;
I the best way to use R is to learn the (source) code, andto meet the R guru’s;
GEOSTAT course, 11-17 April 2011, Canberra

FOSS vs commercial packages
GEOSTAT course, 11-17 April 2011, Canberra

Why make scripts?
I Roger Bivand: “Because S (and its implementation R) is awell-developed, simple and effective programming languagewhich includes conditionals, loops, user-defined recursivefunctions and input and output facilities, existing functionscan be modified.” This is what is referred to as statisticalprogramming — in R we all become programmers (but muchfaster than with C++ or Java).
I The basic approach to using R is to generate scripts thatdefine the data processing steps (workflows?).
I Documenting the analysis process is a “good thing”, soprogramming scripts are not just a burden, certainly for usersdoing original research and repetitive work, arguably forstudent classes too.
I Point-and-click operations are for little children!
GEOSTAT course, 11-17 April 2011, Canberra

Do you speak R?
After some time you basically discovered that most of the thingsyou want to do, you can do in R, the only question is how.
Well, first, you have to learn to how to speak’n’write R.
GEOSTAT course, 11-17 April 2011, Canberra

Some important facts
I R was first time released in 1997;
I majority of the development is (still) done by prof.Brian D.Ripley;
I a the moment, there are +2000 contributed packages!
I according to Google trends, R-project.org has a communityof about 200–350k active users;
I in 2003, a group of researchers (International Workshop onDistributed Statistical Computing) decided to add spatialfunctionality to R;
I . . . now is time to use it more broadly (MSc level and PhDlevel modules, projects, reports and scientific documents);
GEOSTAT course, 11-17 April 2011, Canberra

Quote
“Once methodological problems start being perceived oreven defined in terms of what one’s favorite softwaredoes well, then the software has stopped being a tool,and has become a crutch, and at worse a shackle.”
Simon Jackman
GEOSTAT course, 11-17 April 2011, Canberra

Quote
“R has really become the second language for peoplecoming out of grad school now, and there’s an amazingamount of code being written for it.”
Max Kuhn
GEOSTAT course, 11-17 April 2011, Canberra

Why I use R?
I It’s provides analysis tools of highest quality (top scientistswork with R).
I It’s reliable (it’s open).
I It’s developing at faster speed.
I It expands my creativity.
I It provides opportunity.
GEOSTAT course, 11-17 April 2011, Canberra
Why I use R?
I It’s provides analysis tools of highest quality (top scientistswork with R).
I It’s reliable (it’s open).
I It’s developing at faster speed.
I It expands my creativity.
I It provides opportunity.
GEOSTAT course, 11-17 April 2011, Canberra

Why I use R?
I It’s provides analysis tools of highest quality (top scientistswork with R).
I It’s reliable (it’s open).
I It’s developing at faster speed.
I It expands my creativity.
I It provides opportunity.
GEOSTAT course, 11-17 April 2011, Canberra

Why I use R?
I It’s provides analysis tools of highest quality (top scientistswork with R).
I It’s reliable (it’s open).
I It’s developing at faster speed.
I It expands my creativity.
I It provides opportunity.
GEOSTAT course, 11-17 April 2011, Canberra
Why I use R?
I It’s provides analysis tools of highest quality (top scientistswork with R).
I It’s reliable (it’s open).
I It’s developing at faster speed.
I It expands my creativity.
I It provides opportunity.
GEOSTAT course, 11-17 April 2011, Canberra

The ASDA(R) team
GEOSTAT course, 11-17 April 2011, Canberra
Jazz & GEOSTAT
GEOSTAT course, 11-17 April 2011, Canberra

A Practical Guide to Geostatistical Mapping
GEOSTAT course, 11-17 April 2011, Canberra

Quote
“I created Quick-R for one simple reason. I wanted tolearn R and I am a teacher at heart. The easiest wayfor me to learn something is to teach it”
Robert I.Kabacoff
GEOSTAT course, 11-17 April 2011, Canberra

The happy triangle
GIS analysis
Browsing of
geo-data
Statistical
computing
KML
GDAL
ground
overlays,
time-series
GRASS GIS
GEOSTAT course, 11-17 April 2011, Canberra

Software
Not all software is required to follow the exercises
I R v2.12 (Windows OS) including a list of packages;
I Tinn-R v2.3 (code editor);
I SAGA GIS v2.0.6 — a light GIS excellent for educationalpurposes; FWTools v2.4 — a list of utilities to handle spatialdata; GRASS GIS v6.4.
I ODBC driver for windows;
GEOSTAT course, 11-17 April 2011, Canberra

Installing the add-on packages
> install.packages("ctv")
> library(ctv)
> install.views("Spatial")
This will install all connected packages listed at views/Spatial.
GEOSTAT course, 11-17 April 2011, Canberra
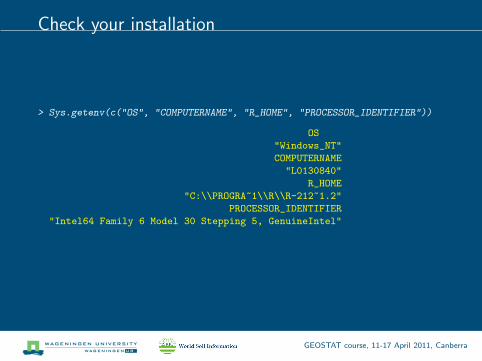
Check your installation
> Sys.getenv(c("OS", "COMPUTERNAME", "R_HOME", "PROCESSOR_IDENTIFIER"))
OS
"Windows_NT"
COMPUTERNAME
"L0130840"
R_HOME
"C:\\PROGRA~1\\R\\R-212~1.2"
PROCESSOR_IDENTIFIER
"Intel64 Family 6 Model 30 Stepping 5, GenuineIntel"
GEOSTAT course, 11-17 April 2011, Canberra

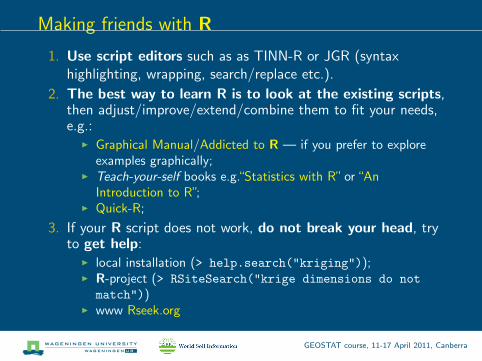
Making friends with R
1. Use script editors such as as TINN-R or JGR (syntaxhighlighting, wrapping, search/replace etc.).
2. The best way to learn R is to look at the existing scripts,then adjust/improve/extend/combine them to fit your needs,e.g.:
I Graphical Manual/Addicted to R — if you prefer to exploreexamples graphically;
I Teach-your-self books e.g.“Statistics with R” or “AnIntroduction to R”;
I Quick-R;
3. If your R script does not work, do not break your head, tryto get help:
I local installation (> help.search("kriging"));I R-project (> RSiteSearch("krige dimensions do not
match"))I www Rseek.org
GEOSTAT course, 11-17 April 2011, Canberra

Making friends with R
1. Use script editors such as as TINN-R or JGR (syntaxhighlighting, wrapping, search/replace etc.).
2. The best way to learn R is to look at the existing scripts,then adjust/improve/extend/combine them to fit your needs,e.g.:
I Graphical Manual/Addicted to R — if you prefer to exploreexamples graphically;
I Teach-your-self books e.g.“Statistics with R” or “AnIntroduction to R”;
I Quick-R;
3. If your R script does not work, do not break your head, tryto get help:
I local installation (> help.search("kriging"));
I R-project (> RSiteSearch("krige dimensions do not
match"))I www Rseek.org
GEOSTAT course, 11-17 April 2011, Canberra

Making friends with R
1. Use script editors such as as TINN-R or JGR (syntaxhighlighting, wrapping, search/replace etc.).
2. The best way to learn R is to look at the existing scripts,then adjust/improve/extend/combine them to fit your needs,e.g.:
I Graphical Manual/Addicted to R — if you prefer to exploreexamples graphically;
I Teach-your-self books e.g.“Statistics with R” or “AnIntroduction to R”;
I Quick-R;
3. If your R script does not work, do not break your head, tryto get help:
I local installation (> help.search("kriging"));I R-project (> RSiteSearch("krige dimensions do not
match"))
I www Rseek.org
GEOSTAT course, 11-17 April 2011, Canberra
Making friends with R
1. Use script editors such as as TINN-R or JGR (syntaxhighlighting, wrapping, search/replace etc.).
2. The best way to learn R is to look at the existing scripts,then adjust/improve/extend/combine them to fit your needs,e.g.:
I Graphical Manual/Addicted to R — if you prefer to exploreexamples graphically;
I Teach-your-self books e.g.“Statistics with R” or “AnIntroduction to R”;
I Quick-R;
3. If your R script does not work, do not break your head, tryto get help:
I local installation (> help.search("kriging"));I R-project (> RSiteSearch("krige dimensions do not
match"))I www Rseek.org
GEOSTAT course, 11-17 April 2011, Canberra

R GUI
GEOSTAT course, 11-17 April 2011, Canberra

JaGuaR
GEOSTAT course, 11-17 April 2011, Canberra

RStudio
GEOSTAT course, 11-17 April 2011, Canberra

New function
> name <- function(arg_1, arg_2, ...) expression
> sum2 <- function(x, y) {
+ sum2 <- x + y
+ return(sum2)
+ }
> sum2(5, 6)
[1] 11
GEOSTAT course, 11-17 April 2011, Canberra

Soil texture triangle (USDA)Texture triangle: USDA
Cl
SiClSaCl
ClLo SiClLo
SaClLo
LoSiLo
SaLoSiLoSa
Sa
102030405060708090
10
20
30
40
50
60
70
80
90
1020
3040
5060
7080
90
●
●
●
[%] Sand 50−2000 µm
[%] C
lay
0−2
µm
[%] Silt 2−50 µm
GEOSTAT course, 11-17 April 2011, Canberra

Get texture fractions based on TT class
> library(soiltexture)
> TT.classes.tbl(class.sys = "USDA.TT", collapse = ", ")
abbr name points
[1,] "Cl" "clay" "24, 1, 5, 6, 2"
[2,] "SiCl" "silty clay" "2, 6, 7"
[3,] "SaCl" "sandy clay" "1, 3, 4, 5"
[4,] "ClLo" "clay loam" "5, 4, 10, 11, 12, 6"
[5,] "SiClLo" "silty clay loam" "6, 12, 13, 7"
[6,] "SaClLo" "sandy clay loam" "3, 8, 9, 10, 4"
[7,] "Lo" "loam" "10, 9, 16, 17, 11"
[8,] "SiLo" "silty loam" "11, 17, 22, 23, 18, 19, 13, 12"
[9,] "SaLo" "sandy loam" "8, 14, 21, 22, 17, 16, 9"
[10,] "Si" "silt" "18, 23, 26, 19"
[11,] "LoSa" "loamy sand" "14, 15, 20, 21"
[12,] "Sa" "sand" "15, 25, 20"
GEOSTAT course, 11-17 April 2011, Canberra

Conversion function
> get.TF.from.XY <- function(objectname, xcoord, ycoord) {
+ objectname$CLAY <- objectname[, ycoord]/sin(pi/3)
+ objectname$SAND <- (2 - objectname$CLAY - 2 * objectname[,
+ xcoord]) * 0.5
+ objectname$SILT <- 1 - (objectname$SAND + objectname$CLAY)
+ return(objectname)
+ }
GEOSTAT course, 11-17 April 2011, Canberra
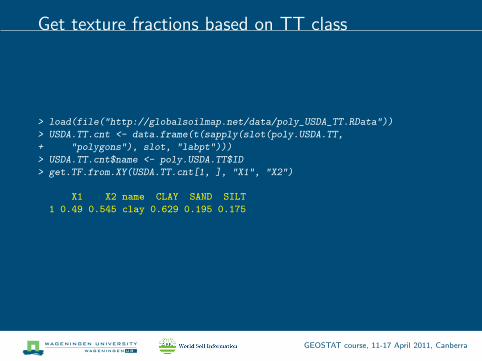
Get texture fractions based on TT class
> load(file("http://globalsoilmap.net/data/poly_USDA_TT.RData"))
> USDA.TT.cnt <- data.frame(t(sapply(slot(poly.USDA.TT,
+ "polygons"), slot, "labpt")))
> USDA.TT.cnt$name <- poly.USDA.TT$ID
> get.TF.from.XY(USDA.TT.cnt[1, ], "X1", "X2")
X1 X2 name CLAY SAND SILT
1 0.49 0.545 clay 0.629 0.195 0.175
GEOSTAT course, 11-17 April 2011, Canberra