INTRA - EXTRA EU TRADE STATISTICS … OF CYPRUS INTRA - EXTRA EU TRADE STATISTICS (SUMMARISED DATA)...
64
REPUBLIC OF CYPRUS INTRA - EXTRA EU TRADE STATISTICS (SUMMARISED DATA) JANUARY 2015 Issued by the STATISTICAL SERVICE OF CYPRUS Foreign Trade Statistics ● Series III ● Report No. 129
Transcript of INTRA - EXTRA EU TRADE STATISTICS … OF CYPRUS INTRA - EXTRA EU TRADE STATISTICS (SUMMARISED DATA)...

REPUBLIC OF CYPRUS
INTRA - EXTRA EU TRADE STATISTICS (SUMMARISED DATA)
JANUARY 2015
Issued by the STATISTICAL SERVICE OF CYPRUS
Foreign Trade Statistics ● Series III ● Report No. 129
ISSN: 1450-1864 © Copyright: 2015 Republic of Cyprus Quotations are permitted on the condition that the source is stated.
PREFACE
This report is issued on a monthly basis and aims at providing a general view of the external trade of Cyprus and its partner countries for January 2015. It is divided into three parts. Part A pertains to total trade statistics under the general trade system, Part B to Extra-EU trade statistics under the special trade system and Part C to Intra-EU trade statistics. All values shown in the tables of this report are in Euros.
The statistics of trade with non-EU countries (Extra-EU trade) are compiled mainly from ‘THESEAS’ system, the computerized system of Customs Authorities for imports, the paper based customs exports declaration and the customs exports computerized system (from July 2013). The statistics of trade with EU countries (Intra-EU trade) are compiled mainly via the Intrastat system and the data collected via the VAT returns.
This report was prepared by Ms. I. Leontiou, Statistics Officer under the guidance of Mr. S. Vikis, Statistics Officer A΄.
The valuable cooperation of the Department of Customs and Excise and the Tax Department is acknowledged.
George Chr. Georgiou Director
Statistical Service
14 April, 2015
- 3 -

CONTENTS PAGE
PREFACE
TABLE OF CONTENTS
INTRODUCTION
PART A: TOTAL TRADE STATISTICS
Table 1: Foreign Trade of Cyprus, 2014 and January 2015
Table 2: Trade by area and month, 2014 and January 2015
Table 3: Trade by country, January 2015
Table 4: Trade by country, January 2015 and 2014
Table 5: Trade classified by H.S Commodity Section, January 2015 and 2014
Table 6: Imports/Arrivals by economic destination, January 2015 and 2014
Table 7: Imports/Arrivals destined for home use by economic destination,
January 2015 and 2014
Table 8: Exports/Dispatches of domestically produced goods, excluding stores and provisions, by
broad economic sector, January 2015 and 2014
PART B: EXTRA-EU TRADE STATISTICS
Table 1: Extra-EU trade by country, January 2015
Table 2: Extra-EU trade classified by H.S Commodity Section, January 2015
PART C: INTRA-EU TRADE STATISTICS
Table 1: Summary of trade with EU countries, 2014 and January 2015
Table 2: Intra-EU trade by country, January 2015
Table 3: Intra-EU trade classified by H.S Commodity Section, January 2015
APPENDIX
DEFINITIONS OF TERMS USED
3
5
7-9
13
14-17
18-23
24-33
34-35
36
37
38-41
45-49
50
53-56
57
58
61-63
- 5 -


INTRODUCTION
DEVELOPMENTS IN EXTERNAL TRADE FOR JANUARY 2015 Total imports/arrivals (covering total imports from third countries and arrivals from E.U countries) in January 2015 amounted to €357,9mn as compared to €396,1mn in January 2014. Total exports/dispatches (covering total exports to third countries and dispatches to other Member States) in January 2015 were €258,3mn compared to €111,1mn in January 2014. As a result of the above developments the trade deficit was €99,6mn in January 2015 compared to €285,0mn in the corresponding month of 2014. Total imports/arrivals Imported goods were €357,9mn in January 2015 and €396,1mn in January 2014.
a. Total imports/arrivals by H.S Section Section V ‘Mineral products ‘ lead the list with €90,6mn followed by Section VI ‘Products of the chemical or allied industries’ with €44,0mn, Section IV ‘Prepared foodstuffs, beverages, spirits and vinegar, tobacco and manufactured tobacco substitutes’ with €42,4mn, Section XVI ‘Machinery, electrical equipment and parts’ with €35,2mn, Section XVII ‘Vehicles, aircraft, vessels and associated transport equipment’ with €21,4mn, Section XI ‘Textiles and textile articles’ with €19,8mn and Section II ‘Vegetable products’ with €19,5mn. Total imports/arrivals by economic destination
- Consumer goods valued at €122,6mn or 34,3% in January 2015 and €122,9mn or 31,0% in the respective month of 2014.
- Intermediate inputs valued at €95,4mn or 26,7% in January 2015 as against €97,4mn or 24,6%
in January 2014. The manufacturing sector absorbed €61,7mn in January 2015 as compared with €66,2mn in January 2014. Raw materials for the construction sector were €13,7mn in January 2015 and €11,4mn in January 2014.
- Fuels and lubricants, including crude petroleum oil, valued at €90,2mn in January 2015 and
€129,6mn in the corresponding month of 2014.
- Transport equipment with their parts accounted for €26,5mn in January 2015 as compared with €25,0mn in January 2014.
- Capital goods valued at €22,7mn in January 2015 and €21,0mn in January 2014. The
manufacturing sector was €3,8mn in January 2015 as against €4,1mn in January 2014. Capital goods for the construction and mining sectors valued at €2,5mn in January 2015 and €2,7mn in January 2014. The transport, storage and communication sector valued at €3,1mn in the January 2015 and €3,3mn in January 2014. Capital goods for agriculture accounted for €0,9mn in January 2015 and €0,8mn in the corresponding month of 2014.
b. Total imports/arrivals by area
- The European Union continued to be the main source of supply of goods to Cyprus in January 2015, with a share of €255,1mn of total imports/arrivals. Major suppliers within the Union were Greece with €92,4mn, the United Kingdom with €31,7mn, Germany with €28,1mn, Italy with €23,5mn, France with €21,0mn, Spain with €15,6mn and the Netherlands with €13,5mn.
- Imports from all other European countries totaled €26,6mn in January 2015 with Russia
€19,1mn, Switzerland with €2,7mn and Ukraine and Moldova with €1,7mn.
- 7 -

- Imports from the rest of the world in January 2015 amounted to €76,2mn with China(People’s Republic of) €19,5mn, Israel with €18,3mn, the United States with €4,5mn, India with €4,3mn, Japan with €2,8mn, Argentina with €2,7mn and Brazil with €2,5mn.
- Total imports/arrivals destined for home use Imported goods destined for home use were €337,9mn in January 2015 and €380,9mn in January 2014.
a. Imports/arrivals destined for home use by economic destination
- Consumer goods valued at €112,6mn or 33,3% and €114,9mn or 30,2% in January 2015 and January 2014, accordingly.
- Intermediate inputs valued at €91,9mn or 27,2% in January 2015 as against €96,0mn or 25,2%
in January 2014. The manufacturing sector absorbed €59,7mn in January 2015 and €65,2mn in January 2014.
- Fuels and lubricants, including crude petroleum oil, valued at €86,2mn in January 2015 and
€123,0mn in the corresponding month of 2014.
- Transport equipment with their parts accounted for €26,8mn in January 2015 as compared with €26,1mn in January 2014.
- Capital goods valued at €20,0mn in January 2015 and €20,6mn in January 2014. The
manufacturing sector was €3,7mn in January 2015 as against €4,1mn in January 2014. Capital goods for the construction and mining sectors valued at €1,9mn in January 2015 and €2,7mn in January 2014. The transport, storage and communication sector absorbed €2,8mn in January 2015 as against €3,1mn in January 2014. Capital goods for agriculture accounted for €0,9mn in January 2015 and €0,8mn the respective month of 2014.
Total exports/dispatches Total exports/dispatches, including stores and provisions, accounted for €258,3mn in January 2015 as compared with €111,1mn in January 2014. a. Total exports/dispatches, including stores and provisions, by H.S Section Section XVII ‘Vehicles, aircraft, vessels and associated transport equipment’ lead the list with €160,9mn, followed by Section V ‘Mineral products’ with €28,9mn, Section VI ‘Products of the chemical or allied industries’ with €20,6mn, Section XVI ‘Machinery electrical equipment and parts’ with €12,2mn, Section I ‘Live animals, animal products’ with €9,9mn, Section IV ‘Prepared foodstuffs, beverages, spirits and vinegar, tobacco and manufactured tobacco substitutes’ with €7,8mn, Section II ‘Vegetable products’ with €4,5mn and Section XV ‘Base metal and articles of base metal’ with €4,3mn. b. Total exports/dispatches of domestically produced goods, excluding stores and provisions, by
category
- Industrial products of domestic produce exported during January 2015 valued at €56,6mn and €51,2mn in January 2014.
- Exports/dispatches of raw agricultural products valued at €5,8mn or 9,2% in January 2015 and
€10,3mn or 16,5% in the corresponding month of 2014.
- 8 -

- Mineral exports valued at €0,5mn or 0,8% in January 2015 and €0,5mn or 0,9% in January 2014.
c. Total exports/dispatches by area
- Dispatches to the European Union accounted for €208,5mn in January 2015 of the total exports/dispatches. Dispatches to Ireland accounted for €158,7mn, to Greece for €13,6mn, to Slovenia for €11,7mn, to the United Kingdom for €7,6mn, to Germany for €2,6mn, to Slovakia and Italy for €2,2mn.
- Exports to Near and Middle Eastern countries occupied the second place in importance with
€15,2mn for January 2015. - Exports to the Asian countries in January 2015 amounted to €9,1mn.
- Exports to all other European countries in January 2015 followed in importance with €4,5mn.
- Exports to countries and territories not specified in January 2015 amounted to €0,4mn and stores
and provisions in January 2015 valued at €10,8mn.
- 9 -

PART A: TOTAL TRADE STATISTICS

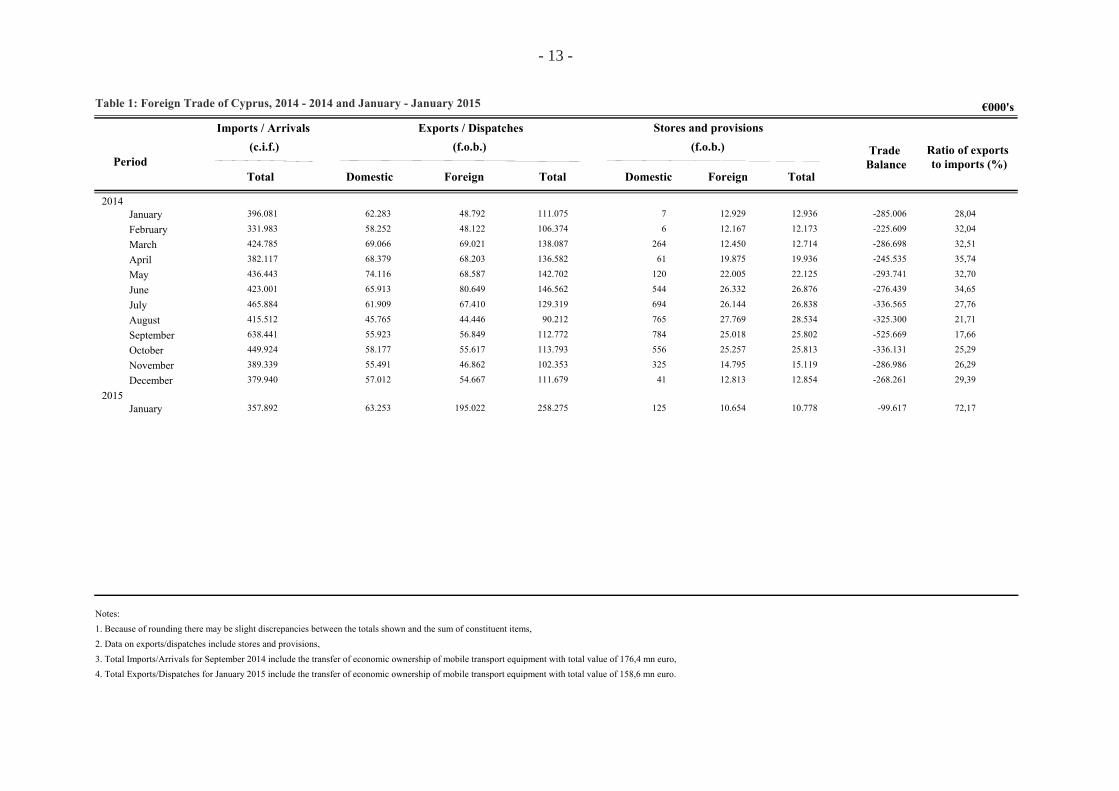
€000'sTable 1: Foreign Trade of Cyprus, 2014 - 2014 and January - January 2015
TotalDomestic Foreign Domestic
Stores and provisions
PeriodTotal
Exports / Dispatches(f.o.b.)(c.i.f.) (f.o.b.)
Foreign
Imports / Arrivals
Total
Trade Balance
Ratio of exports to imports (%)
2014396.081 62.283 48.792 7 12.929January 111.075 12.936 -285.006 28,04 331.983 58.252 48.122 6 12.167February 106.374 12.173 -225.609 32,04 424.785 69.066 69.021 264 12.450March 138.087 12.714 -286.698 32,51 382.117 68.379 68.203 61 19.875April 136.582 19.936 -245.535 35,74 436.443 74.116 68.587 120 22.005May 142.702 22.125 -293.741 32,70 423.001 65.913 80.649 544 26.332June 146.562 26.876 -276.439 34,65 465.884 61.909 67.410 694 26.144July 129.319 26.838 -336.565 27,76 415.512 45.765 44.446 765 27.769August 90.212 28.534 -325.300 21,71 638.441 55.923 56.849 784 25.018September 112.772 25.802 -525.669 17,66 449.924 58.177 55.617 556 25.257October 113.793 25.813 -336.131 25,29 389.339 55.491 46.862 325 14.795November 102.353 15.119 -286.986 26,29 379.940 57.012 54.667 41 12.813December 111.679 12.854 -268.261 29,39
2015357.892 63.253 195.022 125 10.654January 258.275 10.778 -99.617 72,17
Notes: 1. Because of rounding there may be slight discrepancies between the totals shown and the sum of constituent items,2. Data on exports/dispatches include stores and provisions,3. Total Imports/Arrivals for September 2014 include the transfer of economic ownership of mobile transport equipment with total value of 176,4 mn euro,4. Total Exports/Dispatches for January 2015 include the transfer of economic ownership of mobile transport equipment with total value of 158,6 mn euro.
- 13 -
AFRICA
Table 2: Trade by area and by month, 2014 and 2015 IMPORTS / ARRIVALS
€000's
1
Period EUROPEAN UNION
OTHER EUROPEAN
COUNTRIES/TERRITORIES
NORTH AFRICA
CENTRAL AMERICA
AND CARIBBEAN
NORTH AMERICA
SOUTH AMERICA
OTHER AFRICAN
COUNTRIES
2014January 264.836 16.736 3.172 1.689953 2.0004.816
February 239.115 14.109 1.664 2.758720 3442.829
March 318.438 13.705 1.893 1.479917 3.1553.630
April 275.921 16.210 2.524 15.255993 2.4174.685
May 320.426 16.157 3.566 2.5301.196 3.6074.859
June 316.558 10.817 3.989 1.658864 5.5113.259
July 327.012 12.292 2.512 6.5671.020 4.15123.011
August 291.919 8.359 2.144 4.723943 1.6158.258
September 341.651 11.614 2.217 176.647903 1.81711.195
October 333.791 9.121 2.356 2.8935.364 1.8649.492
November 304.432 6.047 2.413 2.2712.416 3.1004.259
December 285.521 12.695 1.713 4.5831.187 1.1956.106
2015January 255.098 26.613 1.544 2.565979 5.4964.805
Care should be taken when comparing data for May 2004 onwards with pre-May 2004 data due to methodological changes resulting from the accession of Cyprus to the EU.1
- 14 -

NEAR AND MIDDLE
EASTERN COUNTRIES
OTHER ASIAN
COUNTRIES
OTHER COUNTRIES OF OCEANIA AND
POLAR REGIONS
COUNTRIES NOT
SPECIFIED TOTAL
AUSTRALIA AND NEW ZEALAND
€000's
Table 2: Trade by area and by month, 2014 and 2015 - continued IMPORTS / ARRIVALS
Period
201463.894 36.993 5 48 396.081939January36.929 32.780 - 47 331.983688February31.174 48.944 - 20 424.7851.430March30.630 32.353 - 14 382.1171.113April48.376 34.321 - 34 436.4431.371May44.332 35.009 - 63 423.001943June49.444 38.390 - 7 465.8841.479July58.934 36.491 54 620 415.5121.452August51.863 37.393 2.012 93 638.4411.035September50.638 33.876 1 151 449.924376October29.909 33.631 1 99 389.339763November29.918 36.469 - 214 379.940338December
201521.408 38.820 - 191 357.892372January
Care should be taken when comparing data for May 2004 onwards with pre-May 2004 data due to methodological changes resulting from the accession of Cyprus to the EU.1
- 15 -

Table 2: Trade by area and by month, 2014 and 2015 - continued EXPORTS / DISPATCHES
€000's
AFRICA
Period EUROPEANUNION
OTHER EUROPEAN
COUNTRIES/TERRITORIES
NORTH AFRICA
CENTRAL AMERICA
AND CARIBBEAN
NORTH AMERICA
SOUTH AMERICA
OTHER AFRICAN
COUNTRIES
2014
January 55.914 3.948 5.027 2953.328 2111.818
February 46.565 6.477 3.683 2074.767 163.947
March 55.154 6.173 6.436 1487.408 16.7054.533
April 68.083 4.623 6.793 9878.394 862.395
May 65.821 5.526 6.762 1476.307 764.580
June 67.578 5.121 4.202 1.3156.897 542.837
July 50.657 4.135 3.062 7648.013 773.820
August 28.007 2.286 1.787 81696 1332.423
September 42.574 3.298 4.199 1571.066 593.040
October 40.126 4.943 5.043 1.4221.207 1043.518
November 39.602 6.320 3.254 4821.251 1443.704
December 41.036 4.704 3.946 1.0171.135 2153.635
2015
January 208.531 4.510 4.534 1.213645 4861.424
Care should be taken when comparing data for May 2004 onwards with pre-May 2004 data due to methodological changes resulting from the accession of Cyprus to the EU.1
- 16 -

NEAR AND MIDDLE
EASTERN COUNTRIES
OTHER ASIAN
COUNTRIES
OTHER COUNTRIES OF OCEANIA AND
POLAR REGIONS
COUNTRIES NOT
SPECIFIEDTOTAL
AUSTRALIA AND NEW ZEALAND
€000's
EXPORTS / DISPATCHESTable 2: Trade by area and by month, 2014 and 2015 - continued
Period
2014
17.507 8.590 44 13.410 111.075984January16.045 10.770 10 12.618 106.3741.268February16.297 11.361 10 13.250 138.087613March13.966 8.213 114 21.746 136.5821.182April19.043 10.322 - 22.575 142.7021.543May16.406 10.253 13 30.450 146.5621.434June19.283 10.032 44 28.433 129.3191.001July16.903 7.585 29 29.398 90.212884August19.426 11.453 32 25.969 112.7721.499September16.015 13.461 81 26.669 113.7931.205October17.828 12.646 9 15.866 102.3531.247November21.777 17.096 18 14.027 111.6793.074December
2015
15.182 9.110 9 11.139 258.2751.491January
Care should be taken when comparing data for May 2004 onwards with pre-May 2004 data due to methodological changes resulting from the accession of Cyprus to the EU.1
Notes: 1. Because of rounding there may be slight discrepancies between the totals shown and the sum of constituent items.
2. European Union consisting of the 28 Member States.
- 17 -

Table 3: Trade by country, January - January 2015
Country
% %
(c.i.f.) (f.o.b.)Imports / Arrivals Exports / Dispatches
€000's €000's
357.892 258.275TOTAL 100,00 100,00
EUROPEAN UNION 255.098 208.53171,28 80,74
AustriaAT 2.611 9260,73 0,36BelgiumBE 6.663 3311,86 0,13BulgariaBG 4.783 6231,34 0,24CroatiaHR 10 218 - 0,08CyprusCY - - - - Czech RepublicCZ 1.683 5510,47 0,21DenmarkDK 1.830 840,51 0,03EstoniaEE 150 2120,04 0,08FinlandFI 900 4530,25 0,18FranceFR 21.020 1.0615,87 0,41GermanyDE 28.074 2.6337,84 1,02GreeceGR 92.415 13.63825,82 5,28HungaryHU 953 1050,27 0,04IrelandIE 542 158.6750,15 61,44ItalyIT 23.526 2.1516,57 0,83LatviaLV 392 20,11 - LithuaniaLT 168 4960,05 0,19LuxembourgLU 43 -0,01 - MaltaMT 207 3260,06 0,13NetherlandsNL 13.486 1.6213,77 0,63PolandPL 1.865 1440,52 0,06PortugalPT 716 820,20 0,03RomaniaRO 3.799 8861,06 0,34SlovakiaSK 659 2.2440,18 0,87SloveniaSI 142 11.6570,04 4,51SpainES 15.577 2444,35 0,09SwedenSE 1.180 1.5520,33 0,60United KingdomGB 31.703 7.6178,86 2,95
OTHER EUROPEAN COUNTRIES/TERRITORIES
26.613 4.5107,44 1,75
AlbaniaAL - 14 - 0,01AndorraAD 1 1 - - BelarusBY 3 38 - 0,01Bosnia and HerzegovinaBA - 10 - - Faroe IslandsFO - - - - Former Yugoslav Republic of MacedoniaMK 71 950,02 0,04GibraltarGI - - - - Holy SeeVA - - - - IcelandIS - 3 - - Kosovo (under UNSCR 1244)XK - 13 - 0,01LiechtensteinLI - - - - MoldovaMD 1.656 190,46 0,01MontenegroME - - - -
Notes: 1. The General trade system is applied.2. Dispatches to EU countries include also goods which were initially imported from third countries and placed under customs warehouses.3. Kosovo, as defined by the United Nations Security Council Resolution 1244 of 10 June 1999.
- 18 -

Table 3: Trade by country, January - January 2015 - continued
Country
% %
(c.i.f.) (f.o.b.)Imports / Arrivals Exports / Dispatches
€000's €000's
NorwayNO 399 6330,11 0,25RussiaRU 19.088 2.2885,33 0,89San MarinoSM - - - - SerbiaXS 849 2030,24 0,08SwitzerlandCH 2.659 7900,74 0,31TurkeyTR 150 360,04 0,01UkraineUA 1.738 3660,49 0,14
NORTH AFRICA 1.544 4.5340,43 1,76
AlgeriaDZ 45 1.0260,01 0,40CeutaXC - - - - EgyptEG 1.319 2.9820,37 1,15LybiaLY - 234 - 0,09MelillaXL - - - - MoroccoMA 164 2020,05 0,08TunisiaTN 16 90 - 0,03Western SaharaEH - - - -
OTHER AFRICAN COUNTRIES 979 1.4240,27 0,55
AngolaAO - 65 - 0,03BeninBJ - - - - BotswanaBW - - - - British Indian Ocean TerritoryIO - - - - Burkina FasoBF - - - - BurundiBI - - - - CameroonCM 120 -0,03 - Cape VerdeCV - - - - Central African RepublicCF - - - - ChadTD - - - - ComorosKM - - - - CongoCG - - - - Congo (Zaire)CD 28 180,01 0,01Cote d' IvoireCI - - - - DjiboutiDJ - - - - Equatorial GuineaGQ - - - - EritreaER - - - - EthiopiaET 13 - - - GabonGA - - - - GambiaGM - 9 - - GhanaGH 4 31 - 0,01GuineaGN - 27 - 0,01Guinea-BissauGW - - - - KenyaKE 106 1840,03 0,07LesothoLS - - - - LiberiaLR - 25 - 0,01MadagascarMG - - - - MalawiMW - - - - MaliML - 42 - 0,02
Notes: 1. The General trade system is applied.2. Dispatches to EU countries include also goods which were initially imported from third countries and placed under customs warehouses.3. Kosovo, as defined by the United Nations Security Council Resolution 1244 of 10 June 1999.
- 19 -

Table 3: Trade by country, January - January 2015 - continued
Country
% %
(c.i.f.) (f.o.b.)Imports / Arrivals Exports / Dispatches
€000's €000's
MauritaniaMR 112 -0,03 - MauritiusMU - 98 - 0,04MayotteYT - - - - MozambiqueMZ - 9 - - NamibiaNA 47 -0,01 - NigerNE - - - - NigeriaNG 25 380,01 0,01RwandaRW - - - - Saint HelenaSH - - - - Sao Tome and PrincipeST - - - - SenegalSN 59 260,02 0,01SeychellesSC 73 240,02 0,01Sierra LeoneSL - - - - SomaliaSO - 69 - 0,03South AfricaZA 385 1370,11 0,05South SudanSS - 25 - 0,01SudanSD - 235 - 0,09SwazilandSZ - - - - TanzaniaTZ - 58 - 0,02TogoTG - 87 - 0,03UgandaUG 4 169 - 0,07ZambiaZM - - - - ZimbabweZW 1 47 - 0,02
NORTH AMERICA 4.805 6451,34 0,25
CanadaCA 354 1130,10 0,04GreenlandGL - - - - Saint Pierre and MiquelonPM - - - - United StatesUS 4.452 5321,24 0,21
CENTRAL AMERICA AND CARIBBEAN 2.565 1.2130,72 0,47
AnguillaAI - - - - Antigua and BarbudaAG - - - - ArubaAW - - - - BahamasBS - 3 - - BarbadosBB - - - - BelizeBZ - - - - BermudaBM - - - - Bonaire, Sint Eustatious and SabaBQ - - - - Cayman IslandsKY - - - - Costa RicaCR - - - - CubaCU 1.629 -0,46 - CuracaoCW - 14 - 0,01DominicaDM - - - - Dominican RepublicDO 2 24 - 0,01El SalvadorSV - - - - GrenadaGD - - - - GuatemalaGT 12 - - -
Notes: 1. The General trade system is applied.2. Dispatches to EU countries include also goods which were initially imported from third countries and placed under customs warehouses.3. Kosovo, as defined by the United Nations Security Council Resolution 1244 of 10 June 1999.
- 20 -

Table 3: Trade by country, January - January 2015 - continued
Country
% %
(c.i.f.) (f.o.b.)Imports / Arrivals Exports / Dispatches
€000's €000's
HaitiHT - 8 - - HondurasHN - 1.145 - 0,44JamaicaJM - - - - MexicoMX 917 -0,26 - MontserratMS - - - - NicaraguaNI 4 - - - PanamaPA - - - - Saint BarthelemyBL - - - - Sint Maarten (Dutch part)SX - 10 - - St Kitts and NevisKN - - - - St LuciaLC - - - - St Vincent and the GrenadinesVC - 9 - - Trinidad and TobagoTT - - - - Turks and Caicos IslandsTC - - - - Virgin Islands (British)VG - - - - Virgin Islands (US)VI - - - -
SOUTH AMERICA 5.496 4861,54 0,19
ArgentinaAR 2.744 20,77 - BoliviaBO - - - - BrazilBR 2.482 -0,69 - ChileCL 82 650,02 0,03ColombiaCO 9 - - - EcuadorEC 135 20,04 - Falkland IslandsFK - - - - GuyanaGY - - - - ParaguayPY - 387 - 0,15PeruPE 44 -0,01 - SurinameSR - - - - UruguayUY - 29 - 0,01VenezuelaVE - - - -
NEAR AND MIDDLE EASTERN COUNTRIES 21.408 15.1825,98 5,88
ArmeniaAM - 43 - 0,02AzerbaijanAZ 1 4 - - BahrainBH 36 3950,01 0,15GeorgiaGE - 60 - 0,02IranIR 106 1850,03 0,07IraqIQ - 289 - 0,11IsraelIL 18.281 6.7015,11 2,59JordanJO 86 5710,02 0,22KuwaitKW 62 2900,02 0,11LebanonLB 661 3.0950,18 1,20Occupied Palestinian TerritoryPS - - - - OmanOM 43 2450,01 0,09QatarQA 87 2890,02 0,11Saudi ArabiaSA 571 8710,16 0,34SyriaSY 18 54 - 0,02
Notes: 1. The General trade system is applied.2. Dispatches to EU countries include also goods which were initially imported from third countries and placed under customs warehouses.3. Kosovo, as defined by the United Nations Security Council Resolution 1244 of 10 June 1999.
- 21 -
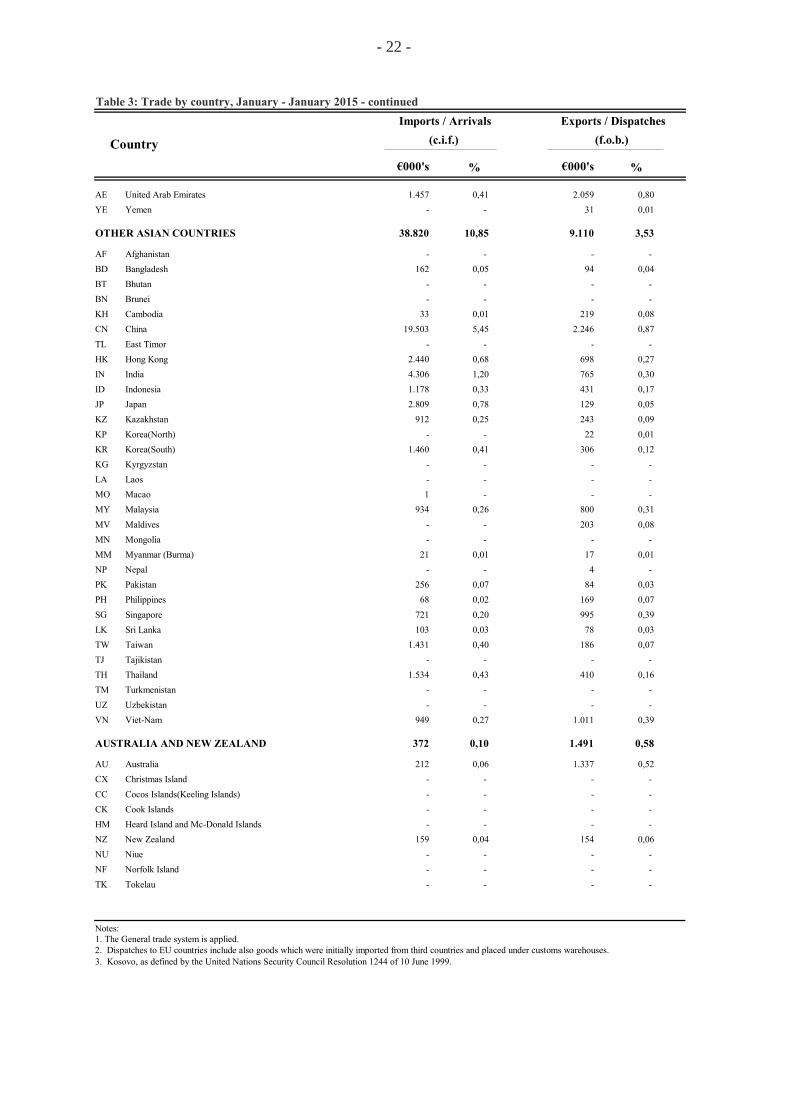
Table 3: Trade by country, January - January 2015 - continued
Country
% %
(c.i.f.) (f.o.b.)Imports / Arrivals Exports / Dispatches
€000's €000's
United Arab EmiratesAE 1.457 2.0590,41 0,80YemenYE - 31 - 0,01
OTHER ASIAN COUNTRIES 38.820 9.11010,85 3,53
AfghanistanAF - - - - BangladeshBD 162 940,05 0,04BhutanBT - - - - BruneiBN - - - - CambodiaKH 33 2190,01 0,08ChinaCN 19.503 2.2465,45 0,87East TimorTL - - - - Hong KongHK 2.440 6980,68 0,27IndiaIN 4.306 7651,20 0,30IndonesiaID 1.178 4310,33 0,17JapanJP 2.809 1290,78 0,05KazakhstanKZ 912 2430,25 0,09Korea(North)KP - 22 - 0,01Korea(South)KR 1.460 3060,41 0,12KyrgyzstanKG - - - - LaosLA - - - - MacaoMO 1 - - - MalaysiaMY 934 8000,26 0,31MaldivesMV - 203 - 0,08MongoliaMN - - - - Myanmar (Burma)MM 21 170,01 0,01NepalNP - 4 - - PakistanPK 256 840,07 0,03PhilippinesPH 68 1690,02 0,07SingaporeSG 721 9950,20 0,39Sri LankaLK 103 780,03 0,03TaiwanTW 1.431 1860,40 0,07TajikistanTJ - - - - ThailandTH 1.534 4100,43 0,16TurkmenistanTM - - - - UzbekistanUZ - - - - Viet-NamVN 949 1.0110,27 0,39
AUSTRALIA AND NEW ZEALAND 372 1.4910,10 0,58
AustraliaAU 212 1.3370,06 0,52Christmas IslandCX - - - - Cocos Islands(Keeling Islands)CC - - - - Cook IslandsCK - - - - Heard Island and Mc-Donald IslandsHM - - - - New ZealandNZ 159 1540,04 0,06NiueNU - - - - Norfolk IslandNF - - - - TokelauTK - - - -
Notes: 1. The General trade system is applied.2. Dispatches to EU countries include also goods which were initially imported from third countries and placed under customs warehouses.3. Kosovo, as defined by the United Nations Security Council Resolution 1244 of 10 June 1999.
- 22 -

Table 3: Trade by country, January - January 2015 - continued
Country
% %
(c.i.f.) (f.o.b.)Imports / Arrivals Exports / Dispatches
€000's €000's
OTHER COUNTRIES OF OCEANIA AND POLAR REGIONS
- 9- -
American SamoaAS - - - - AntarcticaAQ - - - - Bouvet IslandBV - - - - FijiFJ - - - - French PolynesiaPF - - - - French Southern TerritoriesTF - - - - GuamGU - - - - KiribatiKI - - - - Marshall IslandsMH - - - - MicronesiaFM - - - - NauruNR - - - - New CaledoniaNC - - - - Northern Mariana IslandsMP - - - - PalauPW - - - - Papua New GuineaPG - - - - PitcairnPN - - - - SamoaWS - - - - Solomon IslandsSB - - - - South Georgia and South Sandwich IslandsGS - - - - TongaTO - - - - TuvaluTV - - - - United States Minor Outlying IslandsUM - - - - VanuatuVU - 9 - - Wallis and FutunaWF - - - -
COUNTRIES AND TERRITORIES N/S 191 3610,05 0,14
Countries and territories not specifiedQU 191 3610,05 0,14
STORES AND PROVISIONS - 10.778- 4,17
Stores and provisionsQQ - 10.778 - 4,17
Notes: 1. The General trade system is applied.2. Dispatches to EU countries include also goods which were initially imported from third countries and placed under customs warehouses.3. Kosovo, as defined by the United Nations Security Council Resolution 1244 of 10 June 1999.
- 23 -
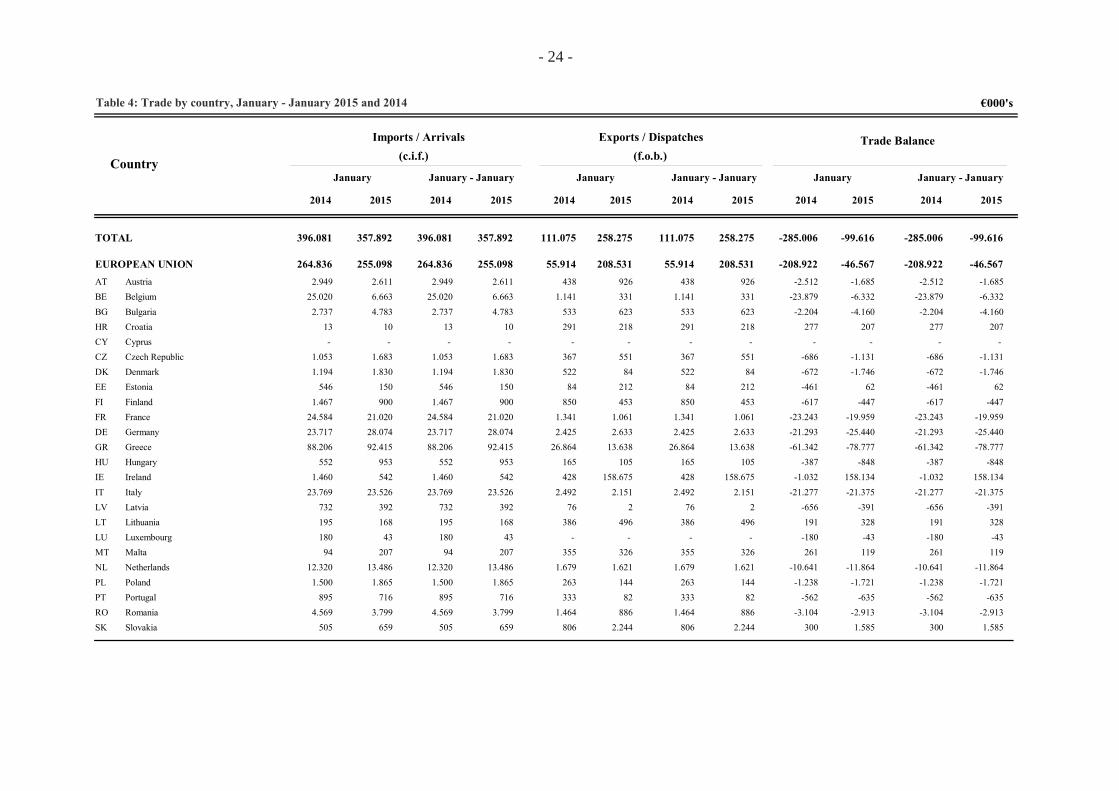
Table 4: Trade by country, January - January 2015 and 2014
Country
Imports / Arrivals Trade Balance
€000's
(c.i.f.)Exports / Dispatches
(f.o.b.)
January
20152014
JanuaryJanuary
20142014 20152015
January - January January - January January - January
20142014 2014 201520152015
357.892 258.275TOTAL -99.616396.081 111.075 -285.006357.892396.081 111.075 258.275 -99.616-285.006
EUROPEAN UNION 255.098 208.531 -46.567264.836 55.914 -208.922264.836 255.098 55.914 208.531 -46.567-208.922AustriaAT 2.611 926 -1.6852.949 438 -2.5122.611 926 -1.6852.949 438 -2.512BelgiumBE 6.663 331 -6.33225.020 1.141 -23.8796.663 331 -6.33225.020 1.141 -23.879BulgariaBG 4.783 623 -4.1602.737 533 -2.2044.783 623 -4.1602.737 533 -2.204CroatiaHR 10 218 20713 291 27710 218 20713 291 277CyprusCY - - - - - - - - - - - - Czech RepublicCZ 1.683 551 -1.1311.053 367 -6861.683 551 -1.1311.053 367 -686DenmarkDK 1.830 84 -1.7461.194 522 -6721.830 84 -1.7461.194 522 -672EstoniaEE 150 212 62546 84 -461150 212 62546 84 -461FinlandFI 900 453 -4471.467 850 -617900 453 -4471.467 850 -617FranceFR 21.020 1.061 -19.95924.584 1.341 -23.24321.020 1.061 -19.95924.584 1.341 -23.243GermanyDE 28.074 2.633 -25.44023.717 2.425 -21.29328.074 2.633 -25.44023.717 2.425 -21.293GreeceGR 92.415 13.638 -78.77788.206 26.864 -61.34292.415 13.638 -78.77788.206 26.864 -61.342HungaryHU 953 105 -848552 165 -387953 105 -848552 165 -387IrelandIE 542 158.675 158.1341.460 428 -1.032542 158.675 158.1341.460 428 -1.032ItalyIT 23.526 2.151 -21.37523.769 2.492 -21.27723.526 2.151 -21.37523.769 2.492 -21.277LatviaLV 392 2 -391732 76 -656392 2 -391732 76 -656LithuaniaLT 168 496 328195 386 191168 496 328195 386 191LuxembourgLU 43 - -43180 - -18043 - -43180 - -180MaltaMT 207 326 11994 355 261207 326 11994 355 261NetherlandsNL 13.486 1.621 -11.86412.320 1.679 -10.64113.486 1.621 -11.86412.320 1.679 -10.641PolandPL 1.865 144 -1.7211.500 263 -1.2381.865 144 -1.7211.500 263 -1.238PortugalPT 716 82 -635895 333 -562716 82 -635895 333 -562RomaniaRO 3.799 886 -2.9134.569 1.464 -3.1043.799 886 -2.9134.569 1.464 -3.104SlovakiaSK 659 2.244 1.585505 806 300659 2.244 1.585505 806 300
- 24 -

Table 4: Trade by country, January - January 2015 and 2014 - continued
Country
Imports / Arrivals Trade Balance
€000's
(c.i.f.)Exports / Dispatches
(f.o.b.)
January
20152014
JanuaryJanuary
20142014 20152015
January - January January - January January - January
20142014 2014 201520152015
SloveniaSI 142 11.657 11.515496 27 -469142 11.657 11.515496 27 -469SpainES 15.577 244 -15.33319.689 361 -19.32815.577 244 -15.33319.689 361 -19.328SwedenSE 1.180 1.552 3721.538 1.936 3981.180 1.552 3721.538 1.936 398United KingdomGB 31.703 7.617 -24.08624.855 10.288 -14.56631.703 7.617 -24.08624.855 10.288 -14.566
OTHER EUROPEAN COUNTRIES/TERRITORIES
26.613 4.510 -22.10316.736 3.948 -12.78816.736 26.613 3.948 4.510 -22.103-12.788
AlbaniaAL - 14 14- 79 79- 14 14- 79 79AndorraAD 1 1 - - - - 1 1 - - - - BelarusBY 3 38 359 159 1503 38 359 159 150Bosnia and HerzegovinaBA - 10 10- - - - 10 10- - - Faroe IslandsFO - - - - - - - - - - - - Former Yugoslav Republic of MacedoniaMK 71 95 2567 110 4371 95 2567 110 43GibraltarGI - - - - - - - - - - - - Holy SeeVA - - - - - - - - - - - - IcelandIS - 3 378 4 -74- 3 378 4 -74Kosovo (under UNSCR 1244)XK - 13 13- 120 120- 13 13- 120 120LiechtensteinLI - - - - - - - - - - - - MoldovaMD 1.656 19 -1.63770 75 51.656 19 -1.63770 75 5MontenegroME - - - - 12 12- - - - 12 12NorwayNO 399 633 235500 412 -88399 633 235500 412 -88RussiaRU 19.088 2.288 -16.8005.107 1.318 -3.78919.088 2.288 -16.8005.107 1.318 -3.789San MarinoSM - - - - - - - - - - - - SerbiaXS 849 203 -646752 143 -609849 203 -646752 143 -609SwitzerlandCH 2.659 790 -1.8704.660 797 -3.8622.659 790 -1.8704.660 797 -3.862TurkeyTR 150 36 -114983 2 -981150 36 -114983 2 -981UkraineUA 1.738 366 -1.3714.511 715 -3.7951.738 366 -1.3714.511 715 -3.795
Note: Kosovo, as defined by United Nations Security Council Resolution 1244 of 10 June 1999 .
- 25 -

Table 4: Trade by country, January - January 2015 and 2014 - continued
Country
Imports / Arrivals Trade Balance
€000's
(c.i.f.)Exports / Dispatches
(f.o.b.)
January
20152014
JanuaryJanuary
20142014 20152015
January - January January - January January - January
20142014 2014 201520152015
NORTH AFRICA 1.544 4.534 2.9903.172 5.027 1.8553.172 1.544 5.027 4.534 2.9901.855AlgeriaDZ 45 1.026 981- 386 38645 1.026 981- 386 386CeutaXC - - - - - - - - - - - - EgyptEG 1.319 2.982 1.6633.005 2.336 -6691.319 2.982 1.6633.005 2.336 -669LybiaLY - 234 234- 2.251 2.251- 234 234- 2.251 2.251MelillaXL - - - - - - - - - - - - MoroccoMA 164 202 3899 6 -92164 202 3899 6 -92TunisiaTN 16 90 7468 47 -2116 90 7468 47 -21Western SaharaEH - - - - - - - - - - - -
OTHER AFRICAN COUNTRIES 979 1.424 444953 1.818 865953 979 1.818 1.424 444865AngolaAO - 65 65- 40 40- 65 65- 40 40BeninBJ - - - - - - - - - - - - BotswanaBW - - - - 80 80- - - - 80 80British Indian Ocean TerritoryIO - - - - - - - - - - - - Burkina FasoBF - - - - - - - - - - - - BurundiBI - - - - - - - - - - - - CameroonCM 120 - -120- 97 97120 - -120- 97 97Cape VerdeCV - - - - - - - - - - - - Central African RepublicCF - - - - - - - - - - - - ChadTD - - - - - - - - - - - - ComorosKM - - - - - - - - - - - - CongoCG - - - - - - - - - - - - Congo (Zaire)CD 28 18 -10- 44 4428 18 -10- 44 44Cote d' IvoireCI - - - 28 - -28- - - 28 - -28DjiboutiDJ - - - - - - - - - - - - Equatorial GuineaGQ - - - - - - - - - - - -
- 26 -

Table 4: Trade by country, January - January 2015 and 2014 - continued
Country
Imports / Arrivals Trade Balance
€000's
(c.i.f.)Exports / Dispatches
(f.o.b.)
January
20152014
JanuaryJanuary
20142014 20152015
January - January January - January January - January
20142014 2014 201520152015
EritreaER - - - - 63 63- - - - 63 63EthiopiaET 13 - -13- 353 35313 - -13- 353 353GabonGA - - - - 3 3- - - - 3 3GambiaGM - 9 9- - - - 9 9- - - GhanaGH 4 31 27- - - 4 31 27- - - GuineaGN - 27 27- 9 9- 27 27- 9 9Guinea-BissauGW - - - - - - - - - - - - KenyaKE 106 184 79210 38 -172106 184 79210 38 -172LesothoLS - - - - 20 20- - - - 20 20LiberiaLR - 25 25- 12 12- 25 25- 12 12MadagascarMG - - - - 9 9- - - - 9 9MalawiMW - - - - - - - - - - - - MaliML - 42 42- - - - 42 42- - - MauritaniaMR 112 - -112- - - 112 - -112- - - MauritiusMU - 98 98- 78 78- 98 98- 78 78MayotteYT - - - - - - - - - - - - MozambiqueMZ - 9 9- - - - 9 9- - - NamibiaNA 47 - -47117 13 -10547 - -47117 13 -105NigerNE - - - - - - - - - - - - NigeriaNG 25 38 1369 27 -4225 38 1369 27 -42RwandaRW - - - - - - - - - - - - Saint HelenaSH - - - - - - - - - - - - Sao Tome and PrincipeST - - - - - - - - - - - - SenegalSN 59 26 -3474 17 -5759 26 -3474 17 -57SeychellesSC 73 24 -4966 26 -4073 24 -4966 26 -40Sierra LeoneSL - - - - - - - - - - - - SomaliaSO - 69 69- - - - 69 69- - -
- 27 -

Table 4: Trade by country, January - January 2015 and 2014 - continued
Country
Imports / Arrivals Trade Balance
€000's
(c.i.f.)Exports / Dispatches
(f.o.b.)
January
20152014
JanuaryJanuary
20142014 20152015
January - January January - January January - January
20142014 2014 201520152015
South AfricaZA 385 137 -248380 259 -121385 137 -248380 259 -121South SudanSS - 25 25- - - - 25 25- - - SudanSD - 235 235- 337 337- 235 235- 337 337SwazilandSZ - - - - - - - - - - - - TanzaniaTZ - 58 58- 160 160- 58 58- 160 160TogoTG - 87 87- - - - 87 87- - - UgandaUG 4 169 1657 48 414 169 1657 48 41ZambiaZM - - - - 1 1- - - - 1 1ZimbabweZW 1 47 46- 84 841 47 46- 84 84
NORTH AMERICA 4.805 645 -4.1604.816 3.328 -1.4884.816 4.805 3.328 645 -4.160-1.488CanadaCA 354 113 -240506 233 -272354 113 -240506 233 -272GreenlandGL - - - - - - - - - - - - Saint Pierre and MiquelonPM - - - - - - - - - - - - United StatesUS 4.452 532 -3.9204.311 3.094 -1.2164.452 532 -3.9204.311 3.094 -1.216
CENTRAL AMERICA AND CARIBBEAN
2.565 1.213 -1.3521.689 295 -1.3941.689 2.565 295 1.213 -1.352-1.394
AnguillaAI - - - - - - - - - - - - Antigua and BarbudaAG - - - - 14 14- - - - 14 14ArubaAW - - - - - - - - - - - - BahamasBS - 3 3- - - - 3 3- - - BarbadosBB - - - - 36 36- - - - 36 36BelizeBZ - - - - - - - - - - - - BermudaBM - - - - - - - - - - - - Bonaire, Sint Eustatious and SabaBQ - - - - - - - - - - - - Cayman IslandsKY - - - - - - - - - - - - Costa RicaCR - - - 27 - -27- - - 27 - -27
- 28 -
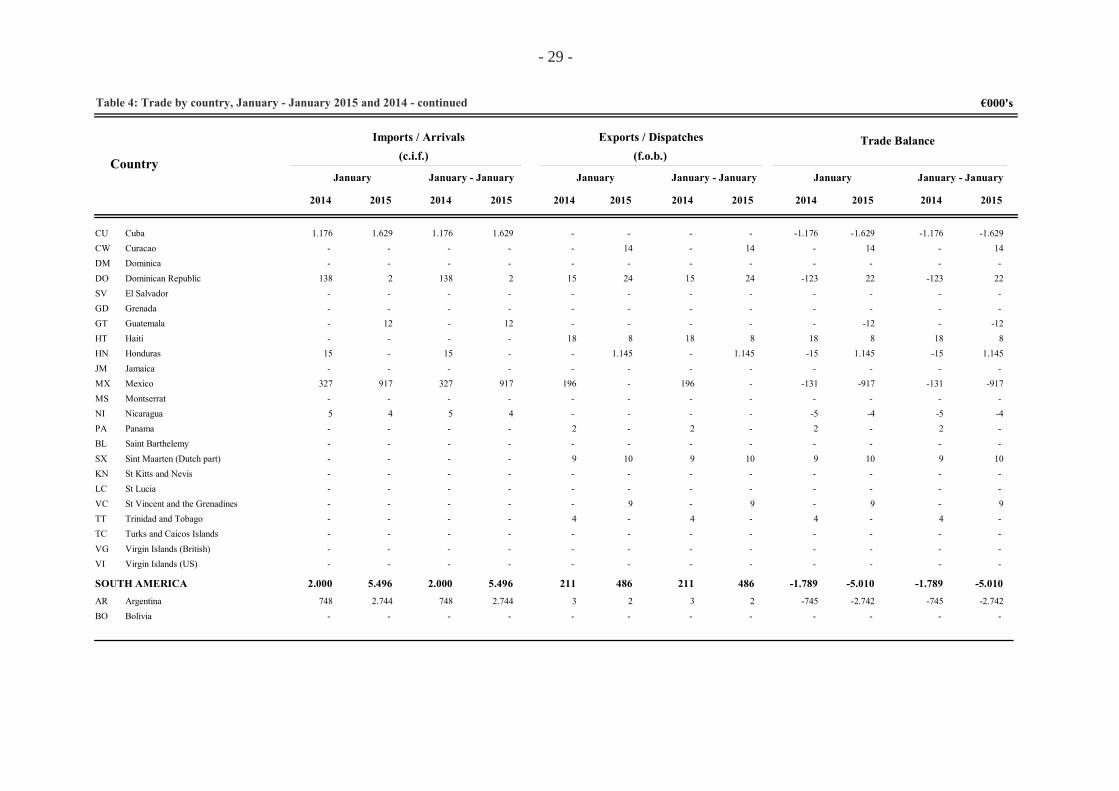
Table 4: Trade by country, January - January 2015 and 2014 - continued
Country
Imports / Arrivals Trade Balance
€000's
(c.i.f.)Exports / Dispatches
(f.o.b.)
January
20152014
JanuaryJanuary
20142014 20152015
January - January January - January January - January
20142014 2014 201520152015
CubaCU 1.629 - -1.6291.176 - -1.1761.629 - -1.6291.176 - -1.176CuracaoCW - 14 14- - - - 14 14- - - DominicaDM - - - - - - - - - - - - Dominican RepublicDO 2 24 22138 15 -1232 24 22138 15 -123El SalvadorSV - - - - - - - - - - - - GrenadaGD - - - - - - - - - - - - GuatemalaGT 12 - -12- - - 12 - -12- - - HaitiHT - 8 8- 18 18- 8 8- 18 18HondurasHN - 1.145 1.14515 - -15- 1.145 1.14515 - -15JamaicaJM - - - - - - - - - - - - MexicoMX 917 - -917327 196 -131917 - -917327 196 -131MontserratMS - - - - - - - - - - - - NicaraguaNI 4 - -45 - -54 - -45 - -5PanamaPA - - - - 2 2- - - - 2 2Saint BarthelemyBL - - - - - - - - - - - - Sint Maarten (Dutch part)SX - 10 10- 9 9- 10 10- 9 9St Kitts and NevisKN - - - - - - - - - - - - St LuciaLC - - - - - - - - - - - - St Vincent and the GrenadinesVC - 9 9- - - - 9 9- - - Trinidad and TobagoTT - - - - 4 4- - - - 4 4Turks and Caicos IslandsTC - - - - - - - - - - - - Virgin Islands (British)VG - - - - - - - - - - - - Virgin Islands (US)VI - - - - - - - - - - - -
SOUTH AMERICA 5.496 486 -5.0102.000 211 -1.7892.000 5.496 211 486 -5.010-1.789ArgentinaAR 2.744 2 -2.742748 3 -7452.744 2 -2.742748 3 -745BoliviaBO - - - - - - - - - - - -
- 29 -
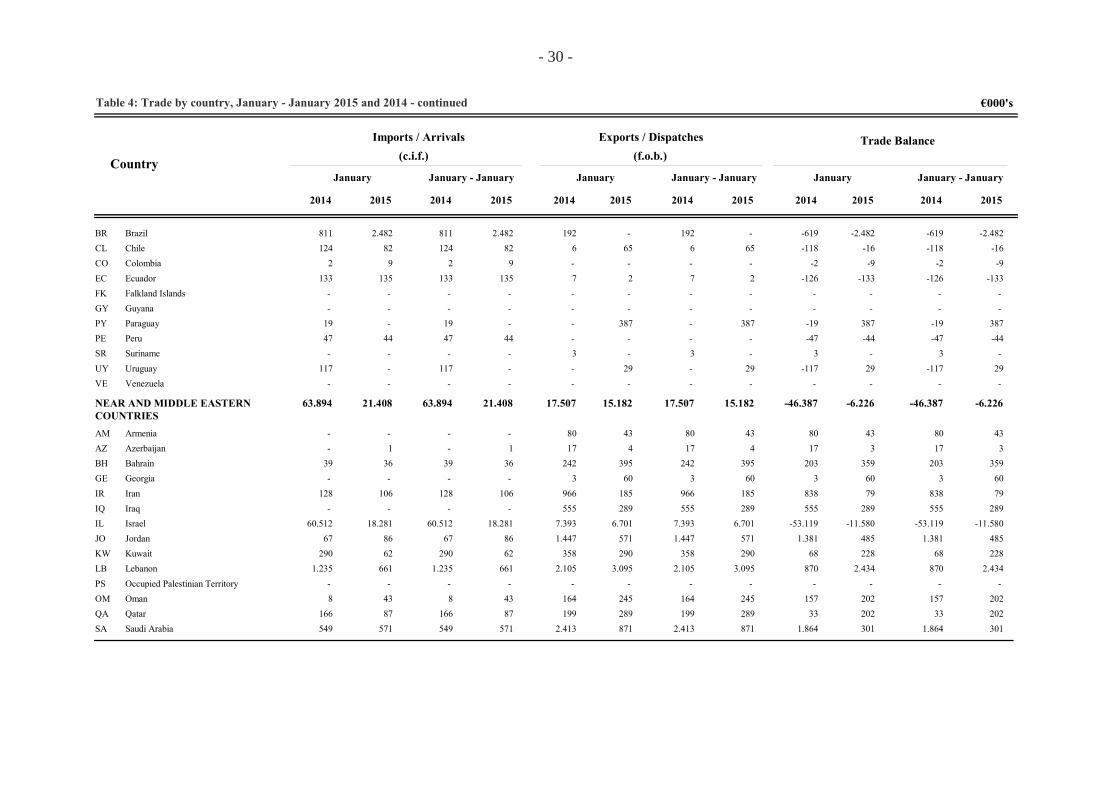
Table 4: Trade by country, January - January 2015 and 2014 - continued
Country
Imports / Arrivals Trade Balance
€000's
(c.i.f.)Exports / Dispatches
(f.o.b.)
January
20152014
JanuaryJanuary
20142014 20152015
January - January January - January January - January
20142014 2014 201520152015
BrazilBR 2.482 - -2.482811 192 -6192.482 - -2.482811 192 -619ChileCL 82 65 -16124 6 -11882 65 -16124 6 -118ColombiaCO 9 - -92 - -29 - -92 - -2EcuadorEC 135 2 -133133 7 -126135 2 -133133 7 -126Falkland IslandsFK - - - - - - - - - - - - GuyanaGY - - - - - - - - - - - - ParaguayPY - 387 38719 - -19- 387 38719 - -19PeruPE 44 - -4447 - -4744 - -4447 - -47SurinameSR - - - - 3 3- - - - 3 3UruguayUY - 29 29117 - -117- 29 29117 - -117VenezuelaVE - - - - - - - - - - - -
NEAR AND MIDDLE EASTERN COUNTRIES
21.408 15.182 -6.22663.894 17.507 -46.38763.894 21.408 17.507 15.182 -6.226-46.387
ArmeniaAM - 43 43- 80 80- 43 43- 80 80AzerbaijanAZ 1 4 3- 17 171 4 3- 17 17BahrainBH 36 395 35939 242 20336 395 35939 242 203GeorgiaGE - 60 60- 3 3- 60 60- 3 3IranIR 106 185 79128 966 838106 185 79128 966 838IraqIQ - 289 289- 555 555- 289 289- 555 555IsraelIL 18.281 6.701 -11.58060.512 7.393 -53.11918.281 6.701 -11.58060.512 7.393 -53.119JordanJO 86 571 48567 1.447 1.38186 571 48567 1.447 1.381KuwaitKW 62 290 228290 358 6862 290 228290 358 68LebanonLB 661 3.095 2.4341.235 2.105 870661 3.095 2.4341.235 2.105 870Occupied Palestinian TerritoryPS - - - - - - - - - - - - OmanOM 43 245 2028 164 15743 245 2028 164 157QatarQA 87 289 202166 199 3387 289 202166 199 33Saudi ArabiaSA 571 871 301549 2.413 1.864571 871 301549 2.413 1.864
- 30 -
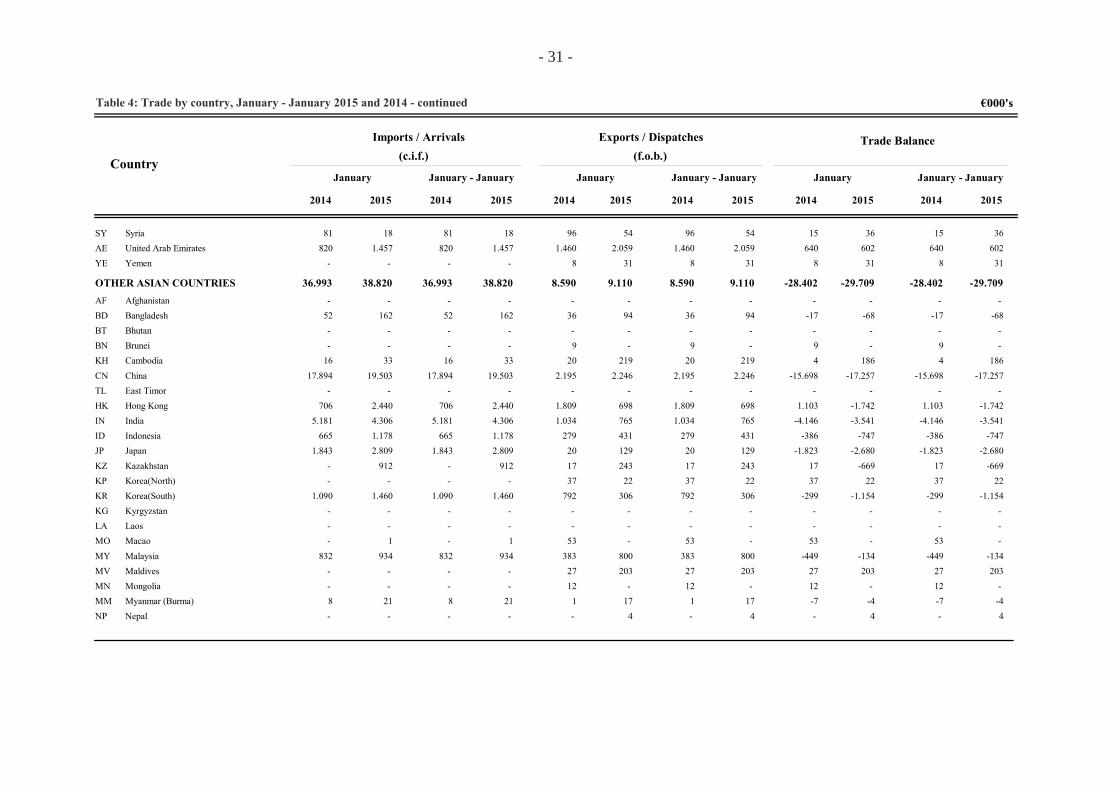
Table 4: Trade by country, January - January 2015 and 2014 - continued
Country
Imports / Arrivals Trade Balance
€000's
(c.i.f.)Exports / Dispatches
(f.o.b.)
January
20152014
JanuaryJanuary
20142014 20152015
January - January January - January January - January
20142014 2014 201520152015
SyriaSY 18 54 3681 96 1518 54 3681 96 15United Arab EmiratesAE 1.457 2.059 602820 1.460 6401.457 2.059 602820 1.460 640YemenYE - 31 31- 8 8- 31 31- 8 8
OTHER ASIAN COUNTRIES 38.820 9.110 -29.70936.993 8.590 -28.40236.993 38.820 8.590 9.110 -29.709-28.402AfghanistanAF - - - - - - - - - - - - BangladeshBD 162 94 -6852 36 -17162 94 -6852 36 -17BhutanBT - - - - - - - - - - - - BruneiBN - - - - 9 9- - - - 9 9CambodiaKH 33 219 18616 20 433 219 18616 20 4ChinaCN 19.503 2.246 -17.25717.894 2.195 -15.69819.503 2.246 -17.25717.894 2.195 -15.698East TimorTL - - - - - - - - - - - - Hong KongHK 2.440 698 -1.742706 1.809 1.1032.440 698 -1.742706 1.809 1.103IndiaIN 4.306 765 -3.5415.181 1.034 -4.1464.306 765 -3.5415.181 1.034 -4.146IndonesiaID 1.178 431 -747665 279 -3861.178 431 -747665 279 -386JapanJP 2.809 129 -2.6801.843 20 -1.8232.809 129 -2.6801.843 20 -1.823KazakhstanKZ 912 243 -669- 17 17912 243 -669- 17 17Korea(North)KP - 22 22- 37 37- 22 22- 37 37Korea(South)KR 1.460 306 -1.1541.090 792 -2991.460 306 -1.1541.090 792 -299KyrgyzstanKG - - - - - - - - - - - - LaosLA - - - - - - - - - - - - MacaoMO 1 - - - 53 531 - - - 53 53MalaysiaMY 934 800 -134832 383 -449934 800 -134832 383 -449MaldivesMV - 203 203- 27 27- 203 203- 27 27MongoliaMN - - - - 12 12- - - - 12 12Myanmar (Burma)MM 21 17 -48 1 -721 17 -48 1 -7NepalNP - 4 4- - - - 4 4- - -
- 31 -
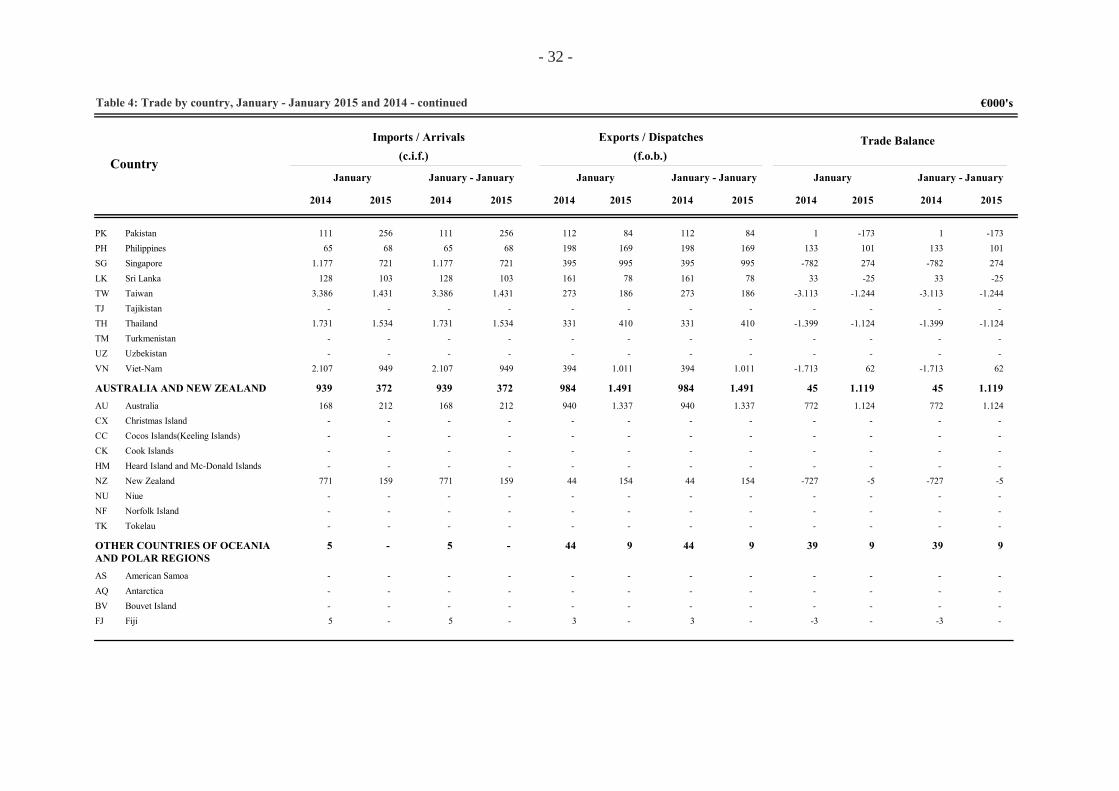
Table 4: Trade by country, January - January 2015 and 2014 - continued
Country
Imports / Arrivals Trade Balance
€000's
(c.i.f.)Exports / Dispatches
(f.o.b.)
January
20152014
JanuaryJanuary
20142014 20152015
January - January January - January January - January
20142014 2014 201520152015
PakistanPK 256 84 -173111 112 1256 84 -173111 112 1PhilippinesPH 68 169 10165 198 13368 169 10165 198 133SingaporeSG 721 995 2741.177 395 -782721 995 2741.177 395 -782Sri LankaLK 103 78 -25128 161 33103 78 -25128 161 33TaiwanTW 1.431 186 -1.2443.386 273 -3.1131.431 186 -1.2443.386 273 -3.113TajikistanTJ - - - - - - - - - - - - ThailandTH 1.534 410 -1.1241.731 331 -1.3991.534 410 -1.1241.731 331 -1.399TurkmenistanTM - - - - - - - - - - - - UzbekistanUZ - - - - - - - - - - - - Viet-NamVN 949 1.011 622.107 394 -1.713949 1.011 622.107 394 -1.713
AUSTRALIA AND NEW ZEALAND 372 1.491 1.119939 984 45939 372 984 1.491 1.11945AustraliaAU 212 1.337 1.124168 940 772212 1.337 1.124168 940 772Christmas IslandCX - - - - - - - - - - - - Cocos Islands(Keeling Islands)CC - - - - - - - - - - - - Cook IslandsCK - - - - - - - - - - - - Heard Island and Mc-Donald IslandsHM - - - - - - - - - - - - New ZealandNZ 159 154 -5771 44 -727159 154 -5771 44 -727NiueNU - - - - - - - - - - - - Norfolk IslandNF - - - - - - - - - - - - TokelauTK - - - - - - - - - - - -
OTHER COUNTRIES OF OCEANIA AND POLAR REGIONS
- 9 95 44 395 - 44 9 939
American SamoaAS - - - - - - - - - - - - AntarcticaAQ - - - - - - - - - - - - Bouvet IslandBV - - - - - - - - - - - - FijiFJ - - - 5 3 -3- - - 5 3 -3
- 32 -

Table 4: Trade by country, January - January 2015 and 2014 - continued
Country
Imports / Arrivals Trade Balance
€000's
(c.i.f.)Exports / Dispatches
(f.o.b.)
January
20152014
JanuaryJanuary
20142014 20152015
January - January January - January January - January
20142014 2014 201520152015
French PolynesiaPF - - - - - - - - - - - - French Southern TerritoriesTF - - - - - - - - - - - - GuamGU - - - - - - - - - - - - KiribatiKI - - - - - - - - - - - - Marshall IslandsMH - - - - - - - - - - - - MicronesiaFM - - - - - - - - - - - - NauruNR - - - - - - - - - - - - New CaledoniaNC - - - - 9 9- - - - 9 9Northern Mariana IslandsMP - - - - - - - - - - - - PalauPW - - - - - - - - - - - - Papua New GuineaPG - - - - 22 22- - - - 22 22PitcairnPN - - - - - - - - - - - - SamoaWS - - - - - - - - - - - - Solomon IslandsSB - - - - - - - - - - - - South Georgia and South Sandwich IslandGS - - - - - - - - - - - - TongaTO - - - - 10 10- - - - 10 10TuvaluTV - - - - - - - - - - - - United States Minor Outlying IslandsUM - - - - - - - - - - - - VanuatuVU - 9 9- - - - 9 9- - - Wallis and FutunaWF - - - - - - - - - - - -
COUNTRIES AND TERRITORIES N/S 191 361 17048 474 42648 191 474 361 170426Countries and territories not specifiedQU 191 361 17048 474 426191 361 17048 474 426
STORES AND PROVISIONS - 10.778 10.778- 12.936 12.936- - 12.936 10.778 10.77812.936Stores and provisionsQQ - 10.778 10.778- 12.936 12.936- 10.778 10.778- 12.936 12.936
Data are not strictly comparable since data prior to May 2004 of Intra-EU and Extra-EU trade on imports/arrivals were recorded by country of origin of the goods while on exports/dispatches by country of final destination whereas for data for May 2004 onwards for Intra-EU trade, arrivals are recorded by country of consignment and dispatches by country of dispatch.
Note:
- 33 -

H.S. Section
Table 5: Trade classified by H.S Commodity Section, January - January 2015 and 2014
2014 2015 2014 2015January January - January
2014 2015 2014 2015January January - January
Imports / Arrivals(c.i.f.)
Exports / Dispatches(f.o.b.)
€000's
TOTAL 396.081 111.075258.275111.075357.892396.081357.892 258.275
I Live animals; animal products 11.426 11.18311.183 11.426 9.898 11.81011.810 9.898
II Vegetable products 19.504 21.04021.040 19.504 4.522 7.8027.802 4.522
III Animal or vegetable fats and oils and their cleavage products;prepared edible fats; animal or vegetable waxes
1.810 1.6121.612 1.810 128 230230 128
IV Prepared foodstuffs; beverages, spirits and vinegar; tobacco and manufactured tobacco substitutes
42.385 36.81736.817 42.385 7.798 6.3616.361 7.798
V Mineral products 90.616 129.973129.973 90.616 28.907 18.75418.754 28.907
VI Products of the chemical or allied industries 44.032 47.37647.376 44.032 20.592 29.43629.436 20.592
VII Plastics and articles thereof; rubber and articles thereof
12.099 12.56312.563 12.099 885 979979 885
VIII Raw hides and skins, leather, furskins and articles thereof; saddlery and harness; travel goods; handbags and similar containers; articles of animal gut (other than silk-worm gut)
1.925 1.6211.621 1.925 372 666666 372
IX Wood and articles of wood; wood charcoal; cork and articles of cork; manufactures of straw, of esparto or of other plaiting materials; basketware and wickerwork
2.947 3.7983.798 2.947 8 4646 8
X Pulp of wood or of other fibrous cellulosic material; recovered (waste and scrap) paper or paperboard; paper and paperboard and articles thereof
7.069 8.4168.416 7.069 418 1.5381.538 418
XI Textiles and textile articles 19.755 21.22721.227 19.755 619 401401 619
Note: The General trade system is applied.
- 34 -

H.S. Section
Table 5: Trade classified by H.S Commodity Section, January - January 2015 and 2014 - continued
2014 2015 2014 2015January January - January
2014 2015 2014 2015January January - January
Imports / Arrivals(c.i.f.)
Exports / Dispatches(f.o.b.)
€000's
XII Footwear, headgear, umbrellas,sun umbrellas, walking sticks, seat sticks, whips, riding crops and parts thereof; prepared feathers and articles made therewith; artificial flowers; articles of human hair
3.762 3.1733.173 3.762 275 206206 275
XIII Articles of stone, plaster, cement, asbestos, mica or similar materials; ceramic products; glass and glassware
6.109 5.1465.146 6.109 33 3636 33
XIV Natural or cultured pearls, precious or semi-precious stones, precious metals, metals clad with precious metal, and articles thereof; imitation jewellery;coins
773 835835 773 1.367 5.0975.097 1.367
XV Base metal and articles of base metal 16.609 13.51313.513 16.609 4.264 7.4947.494 4.264
XVI Machinery and mechanical appliances; electrical equipment; parts thereof; sound recorders and reproducers, television image and sound recorders and reproducters, and parts and accessories of such articles
35.246 38.52638.526 35.246 12.244 11.45611.456 12.244
XVII Vehicles, aircraft, vessels and associated transport equipment
21.369 19.68019.680 21.369 160.924 3.5933.593 160.924
XVIII Optical, photographic, cinematographic, measuring, checking, precision, medical or surgical instruments and apparatus; clocks and watches; musical instruments; parts and accessories thereof
9.107 8.7358.735 9.107 3.140 3.2273.227 3.140
XIX Arms and ammunition; parts and accessories thereof
670 563563 670 227 552552 227
XX Miscellaneous manufactured articles 10.287 10.00310.003 10.287 1.227 1.0281.028 1.227
XXI Works of art, collectors ́pieces and antiques 28 8080 28 7 5959 7
UNCLASSIFIED 361 201201 361 420 305305 420
Note: The General trade system is applied.
- 35 -

Table 6: Imports/Arrivals by Economic Destination, January - January 2015 and 2014
Economic Destination January JanuaryJanuary - January January - January
2015 2014
€000's €000's€000's€000's% % % %
GRAND TOTAL 100,00357.892 100,00357.892 100,00396.081 100,00396.081
CONSUMER GOODS 34,26122.606 34,26122.606 31,03122.915 31,03122.915
- Non-durable 23,9785.769 23,9785.769 20,9883.087 20,9883.087
(i) Food and beverages 12,8345.914 12,8345.914 10,7942.729 10,7942.729
(ii) Other (incl. tobacco) 11,1439.856 11,1439.856 10,1940.358 10,1940.358
- Semi-durable 6,0221.561 6,0221.561 5,7622.796 5,7622.796
- Durable 4,2715.275 4,2715.275 4,3017.032 4,3017.032
INTERMEDIATE INPUTS 26,6795.447 26,6795.447 24,5897.366 24,5897.366
- Agriculture 2,248.021 2,248.021 1,837.264 1,837.264
- Construction and mining 3,8413.741 3,8413.741 2,8711.351 2,8711.351
- Manufacturing 17,2461.693 17,2461.693 16,7266.242 16,7266.242
- Transport, storage and communication 0,541.920 0,541.920 0,672.670 0,672.670
- Other 2,8110.072 2,8110.072 2,489.840 2,489.840
CAPITAL GOODS 6,3422.685 6,3422.685 5,3121.032 5,3121.032
- Agriculture 0,24875 0,24875 0,20780 0,20780
- Construction and mining 0,692.458 0,692.458 0,682.711 0,682.711
- Manufacturing 1,073.843 1,073.843 1,044.130 1,044.130
- Transport, storage and communication 0,883.148 0,883.148 0,843.347 0,843.347
- Other 3,4512.362 3,4512.362 2,5410.066 2,5410.066
TRANSPORT EQUIPMENT AND PARTS THEREOF
7,4126.528 7,4126.528 6,3125.011 6,3125.011
- Passenger motor vehicles 4,5416.265 4,5416.265 3,5514.068 3,5514.068
- Motor vehicles for the transport of goods 0,20698 0,20698 0,301.190 0,301.190
- Special purpose lorries and vans - - - - - - - -
- Public-service type passenger motor vehicles
- - - - 0,03115 0,03115
- Aircraft, helicopters, balloons and airships - - - - - - - -
- Motorcycles and bicycles 0,09305 0,09305 0,09338 0,09338
- Other transport equipment 0,26915 0,26915 0,17678 0,17678
- Parts for transport equipment 2,338.345 2,338.345 2,188.621 2,188.621
FUELS AND LUBRICANTS 25,2190.233 25,2190.233 32,71129.557 32,71129.557
UNCLASSIFIED 0,11393 0,11393 0,05201 0,05201
- 36 -

1Table 7: Imports/Arrivals destined for home use by Economic Destination, January - January 2015 and 2014
Economic Destination January JanuaryJanuary - January January - January
2015 2014
€000's €000's€000's€000's% % % %
GRAND TOTAL 100,00337.935 100,00337.935 100,00380.857 100,00380.857
CONSUMER GOODS 33,31112.577 33,31112.577 30,16114.878 30,16114.878
- Non-durable 23,4979.388 23,4979.388 20,4477.850 20,4477.850
(i) Food and beverages 13,0544.098 13,0544.098 11,0141.918 11,0141.918
(ii) Other (incl. tobacco) 10,4435.290 10,4435.290 9,4335.932 9,4335.932
- Semi-durable 5,9720.183 5,9720.183 5,8722.364 5,8722.364
- Durable 3,8513.007 3,8513.007 3,8514.664 3,8514.664
INTERMEDIATE INPUTS 27,2091.931 27,2091.931 25,2196.009 25,2196.009
- Agriculture 2,327.834 2,327.834 1,887.166 1,887.166
- Construction and mining 3,9213.257 3,9213.257 3,0011.426 3,0011.426
- Manufacturing 17,6659.683 17,6659.683 17,1165.175 17,1165.175
- Transport, storage and communication 0,541.830 0,541.830 0,672.537 0,672.537
- Other 2,769.327 2,769.327 2,559.705 2,559.705
CAPITAL GOODS 5,9220.020 5,9220.020 5,4220.636 5,4220.636
- Agriculture 0,25852 0,25852 0,20780 0,20780
- Construction and mining 0,571.930 0,571.930 0,702.672 0,702.672
- Manufacturing 1,093.684 1,093.684 1,084.104 1,084.104
- Transport, storage and communication 0,822.774 0,822.774 0,823.133 0,823.133
- Other 3,1910.781 3,1910.781 2,619.946 2,619.946
TRANSPORT EQUIPMENT AND PARTS THEREOF
7,9426.838 7,9426.838 6,8726.146 6,8726.146
- Passenger motor vehicles 4,9716.789 4,9716.789 3,9615.083 3,9615.083
- Motor vehicles for the transport of goods 0,19655 0,19655 0,321.229 0,321.229
- Special purpose lorries and vans - - - - - - - -
- Public-service type passenger motor vehicles
- - - - 0,03115 0,03115
- Aircraft, helicopters, balloons and airships - - - - - - - -
- Motorcycles and bicycles 0,08284 0,08284 0,09329 0,09329
- Other transport equipment 0,27909 0,27909 0,18690 0,18690
- Parts for transport equipment 2,438.201 2,438.201 2,288.701 2,288.701
FUELS AND LUBRICANTS 25,5186.208 25,5186.208 32,29122.987 32,29122.987
UNCLASSIFIED 0,11361 0,11361 0,05201 0,05201
Note: Imports/Arrivals destined for home use correspond to imports for home consumption
- 37 -

Exports/Dispatches of domestically produced goods, excluding stores and provisions, by Broad Economic Sector, January - January 2015 and 2014
Economic Sector January JanuaryJanuary - January January - January
2015 2014
€000's €000's€000's€000's% % % %
Table 8:
GRAND TOTAL 100,0063.128 100,0063.128 100,0062.276 100,0062.276
AGRICULTURAL PRODUCTS (RAW)
9,155.779 9,155.779 16,5110.280 16,5110.280
Live trees, bulbs, cut flowers 0,0317 0,0317 0,015 0,015
Potatoes 2,341.475 2,341.475 5,033.131 5,033.131
Other vegetables fresh, frozen or dried 0,91572 0,91572 1,22758 1,22758
Citrus fruit 2,231.411 2,231.411 4,222.628 4,222.628
Grapes, fresh - 1 - 1 - - - -
Fish (Live, fresh, chilled or frozen) 2,341.480 2,341.480 2,981.859 2,981.859
Live animals 1,07677 1,07677 2,941.830 2,941.830
Plants of a kind used in perfumery, pharmacy, insecticidal, fungicidal, etc.
0,0849 0,0849 0,0852 0,0852
Other fruits, fresh, frozen or dried 0,0742 0,0742 0,016 0,016
All others 0,0955 0,0955 0,0211 0,0211
MINERALS 0,84533 0,84533 0,87543 0,87543
Bentonite (excl. activated) 0,84533 0,84533 0,87543 0,87543
INDUSTRIAL PRODUCTS OF AGRICULTURAL ORIGIN
17,4811.032 17,4811.032 17,1310.666 17,1310.666
Meat 0,29183 0,29183 0,33205 0,33205
Halloumi cheese 11,357.168 11,357.168 10,766.698 10,766.698
Cheese (excl. halloumi) 0,1385 0,1385 0,0955 0,0955
Honey - - - - - - - -
Locust beans (incl. seeds) 0,49308 0,49308 0,69428 0,69428
Fruit preserved 0,31195 0,31195 0,25157 0,25157
Fruit and vegetable juices 2,461.555 2,461.555 2,271.416 2,271.416
Beer 0,27169 0,27169 0,1166 0,1166
Wines 0,1489 0,1489 0,21132 0,21132
Alcoholic beverages (excl. beer and wines) 0,1064 0,1064 0,0318 0,0318
Raw hides and skins 0,38237 0,38237 0,46288 0,46288
Milk and cream, not concentrated nor containing added sugar
0,32201 0,32201 0,60372 0,60372
Guts, bladders and stomachs of animals 0,1595 0,1595 0,1063 0,1063
- 38 -

Exports/Dispatches of domestically produced goods, excluding stores and provisions, by Broad Economic Sector, January - January 2015 and 2014 - continued
Economic Sector January JanuaryJanuary - January January - January
2015 2014
€000's €000's€000's€000's% % % %
Table 8:
Wheat, meslin and cereal flour 0,62394 0,62394 0,69432 0,69432
Non-alcoholic beverages containing added sugar or flavoured
0,29183 0,29183 0,37231 0,37231
Olive oil and its fractions, whether or not refined, not chemically modified
0,0532 0,0532 0,0636 0,0636
All other 0,1275 0,1275 0,1169 0,1169
INDUSTRIAL PRODUCTS OF MINERAL ORIGIN
2,521.594 2,521.594 3,962.468 3,962.468
Activated natural mineral prod.(Bentonite) 0,18116 0,18116 0,40249 0,40249
Cathodes of refined copper 1,04655 1,04655 2,331.450 2,331.450
Salt suitable for human consumption 0,34214 0,34214 0,48299 0,48299
"Gypsum; Anhydrite" 0,75474 0,75474 0,48296 0,48296
All others 0,21135 0,21135 0,28173 0,28173
INDUSTRIAL PRODUCTS OF MANUFACTURING ORIGIN
69,7344.021 69,7344.021 61,0638.027 61,0638.027
Coffee, roasted - 3 - 3 0,17108 0,17108
Animal or vegetable fats and oils (excl. olive oil)
0,1596 0,1596 0,23145 0,23145
Food preparations based on meat (prepared or preserved meat)
0,0530 0,0530 0,1273 0,1273
Ice cream and other edible ice - - - - - - - -
Sugar and Chocolate confectionery 0,015 0,015 - 3 - 3
Bread 0,014 0,014 0,0638 0,0638
Biscuits, waffles, wafers and other bakers wares
0,1274 0,1274 0,1277 0,1277
Cigarettes 0,82520 0,82520 - - - -
Cement 8,745.515 8,745.515 7,334.567 7,334.567
Pharmaceutical products 22,6614.307 22,6614.307 25,0315.587 25,0315.587
Paints and varnishes 0,1061 0,1061 0,1275 0,1275
Essential oils, perfumery and cosmetics 0,21131 0,21131 0,44273 0,44273
Soap, washing preparations 0,0316 0,0316 0,0745 0,0745
Insecticides - - - - 0,0531 0,0531
Tubes, pipes, sheets of plastics 1,08681 1,08681 1,03640 1,03640
Plastic articles for packing goods 0,1064 0,1064 0,0425 0,0425
- 39 -
Exports/Dispatches of domestically produced goods, excluding stores and provisions, by Broad Economic Sector, January - January 2015 and 2014 - continued
Economic Sector January JanuaryJanuary - January January - January
2015 2014
€000's €000's€000's€000's% % % %
Table 8:
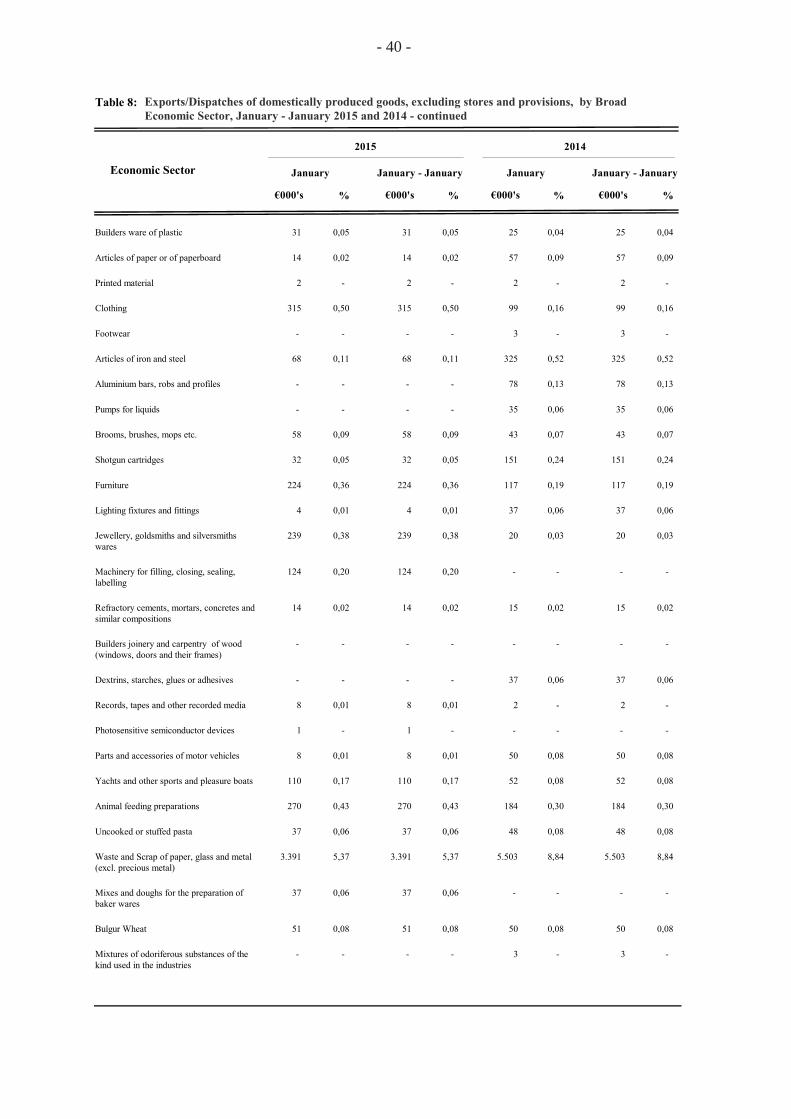
Builders ware of plastic 0,0531 0,0531 0,0425 0,0425
Articles of paper or of paperboard 0,0214 0,0214 0,0957 0,0957
Printed material - 2 - 2 - 2 - 2
Clothing 0,50315 0,50315 0,1699 0,1699
Footwear - - - - - 3 - 3
Articles of iron and steel 0,1168 0,1168 0,52325 0,52325
Aluminium bars, robs and profiles - - - - 0,1378 0,1378
Pumps for liquids - - - - 0,0635 0,0635
Brooms, brushes, mops etc. 0,0958 0,0958 0,0743 0,0743
Shotgun cartridges 0,0532 0,0532 0,24151 0,24151
Furniture 0,36224 0,36224 0,19117 0,19117
Lighting fixtures and fittings 0,014 0,014 0,0637 0,0637
Jewellery, goldsmiths and silversmiths wares
0,38239 0,38239 0,0320 0,0320
Machinery for filling, closing, sealing, labelling
0,20124 0,20124 - - - -
Refractory cements, mortars, concretes and similar compositions
0,0214 0,0214 0,0215 0,0215
Builders joinery and carpentry of wood (windows, doors and their frames)
- - - - - - - -
Dextrins, starches, glues or adhesives - - - - 0,0637 0,0637
Records, tapes and other recorded media 0,018 0,018 - 2 - 2
Photosensitive semiconductor devices - 1 - 1 - - - -
Parts and accessories of motor vehicles 0,018 0,018 0,0850 0,0850
Yachts and other sports and pleasure boats 0,17110 0,17110 0,0852 0,0852
Animal feeding preparations 0,43270 0,43270 0,30184 0,30184
Uncooked or stuffed pasta 0,0637 0,0637 0,0848 0,0848
Waste and Scrap of paper, glass and metal (excl. precious metal)
5,373.391 5,373.391 8,845.503 8,845.503
Mixes and doughs for the preparation of baker wares
0,0637 0,0637 - - - -
Bulgur Wheat 0,0851 0,0851 0,0850 0,0850
Mixtures of odoriferous substances of the kind used in the industries
- - - - - 3 - 3
- 40 -

Exports/Dispatches of domestically produced goods, excluding stores and provisions, by Broad Economic Sector, January - January 2015 and 2014 - continued
Economic Sector January JanuaryJanuary - January January - January
2015 2014
€000's €000's€000's€000's% % % %
Table 8:
Diagnostic or Laboratory reagents 0,22136 0,22136 0,22139 0,22139
Gold (unwrought, semi-manufactured, powder form)
1,06672 1,06672 7,754.829 7,754.829
Waste and Scrap of precious metal - - - - 0,1381 0,1381
Filtering or purifying machinery for liquids and gases
0,95600 0,95600 1,04645 1,04645
Fire extinguishers 0,83524 0,83524 1,17728 1,17728
Dairy machinery - - - - 0,1382 0,1382
Telecommunications equipment 4,993.152 4,993.152 3,031.886 3,031.886
Parts of boards, panels, consoles, desks, cabinets for electric control and distribution
- - - - 0,019 0,019
Waste and Scrap of lead-acid spent-electric accumulators
- - - - 0,0427 0,0427
All others 19,6312.392 19,6312.392 1,57976 1,57976
UNCLASSIFIED 0,27169 0,27169 0,47292 0,47292
- 41 -

PART B: EXTRA-EU TRADE STATISTICS


Table 1: Extra-EU trade by country, January 2015
Country% %
(c.i.f.) (f.o.b.)Imports Exports
€000's €000's
SPECIAL TRADE SYSTEM
96.021 50.777TOTAL 100,00 100,00
OTHER EUROPEAN COUNTRIES/TERRITORIES 26.755 2.25527,86 4,44AlbaniaAL - 14 - 0,03AndorraAD 1 1 - - BelarusBY 3 38 - 0,08Bosnia and HerzegovinaBA - 10 - 0,02Faroe IslandsFO - - - - Former Yugoslav Republic of MacedoniaMK 71 950,07 0,19GibraltarGI - - - - Holy SeeVA - - - - IcelandIS - 3 - 0,01Kosovo (under UNSCR 1244)XK - 13 - 0,03LiechtensteinLI - - - - MoldovaMD 1.656 191,73 0,04MontenegroME - - - - NorwayNO 280 6160,29 1,21RussiaRU 19.087 8019,88 0,16San MarinoSM - - - - SerbiaXS 849 2030,88 0,40SwitzerlandCH 2.748 7612,86 1,50TurkeyTR 338 360,35 0,07UkraineUA 1.723 3661,79 0,72
NORTH AFRICA 1.610 4.3031,68 8,47AlgeriaDZ 45 8230,05 1,62CeutaXC - - - - EgyptEG 1.319 2.9571,37 5,82LybiaLY - 230 - 0,45MelillaXL - - - - MoroccoMA 230 2020,24 0,40TunisiaTN 16 900,02 0,18Western SaharaEH - - - -
OTHER AFRICAN COUNTRIES 1.002 1.3801,04 2,72AngolaAO - 65 - 0,13BeninBJ - - - - BotswanaBW - - - - British Indian Ocean TerritoryIO - - - - Burkina FasoBF - - - - BurundiBI - - - - CameroonCM 120 -0,13 - Cape VerdeCV - - - - Central African RepublicCF - - - - ChadTD - - - - ComorosKM - - - - CongoCG - - - - Congo (Zaire)CD 28 180,03 0,03Cote d' IvoireCI - - - - DjiboutiDJ - - - - Equatorial GuineaGQ - - - -
Note: Kosovo, as defined by the United Nations Security Council Resolution 1244 of 10 June 1999.
- 45 -

Table 1: Extra-EU trade by country, January 2015 - continued
Country% %
(c.i.f.) (f.o.b.)Imports Exports
€000's €000's
SPECIAL TRADE SYSTEM
EritreaER - - - - EthiopiaET 13 -0,01 - GabonGA - - - - GambiaGM - 9 - 0,02GhanaGH 4 31 - 0,06GuineaGN - 27 - 0,05Guinea-BissauGW - - - - KenyaKE 106 1720,11 0,34LesothoLS - - - - LiberiaLR - 25 - 0,05MadagascarMG - - - - MalawiMW - - - - MaliML - 42 - 0,08MauritaniaMR 112 -0,12 - MauritiusMU - 93 - 0,18MayotteYT - - - - MozambiqueMZ - 9 - 0,02NamibiaNA 47 -0,05 - NigerNE - - - - NigeriaNG 25 370,03 0,07RwandaRW - - - - Saint HelenaSH - - - - Sao Tome and PrincipeST - - - - SenegalSN 59 -0,06 - SeychellesSC 73 240,08 0,05Sierra LeoneSL - - - - SomaliaSO - 69 - 0,14South AfricaZA 408 1370,42 0,27South SudanSS - 25 - 0,05SudanSD - 235 - 0,46SwazilandSZ - - - - TanzaniaTZ - 58 - 0,11TogoTG - 87 - 0,17UgandaUG 4 169 - 0,33ZambiaZM - - - - ZimbabweZW 1 47 - 0,09
NORTH AMERICA 3.402 6453,54 1,27CanadaCA 354 1130,37 0,22GreenlandGL - - - - Saint Pierre and MiquelonPM - - - - United StatesUS 3.048 5323,17 1,05
CENTRAL AMERICA AND CARIBBEAN 1.084 1.2131,13 2,39AnguillaAI - - - - Antigua and BarbudaAG - - - - ArubaAW - - - - BahamasBS - 3 - 0,01BarbadosBB - - - - BelizeBZ - - - - BermudaBM - - - - Bonaire, Sint Eustatious and SabaBQ - - - -
Note: Kosovo, as defined by the United Nations Security Council Resolution 1244 of 10 June 1999.
- 46 -
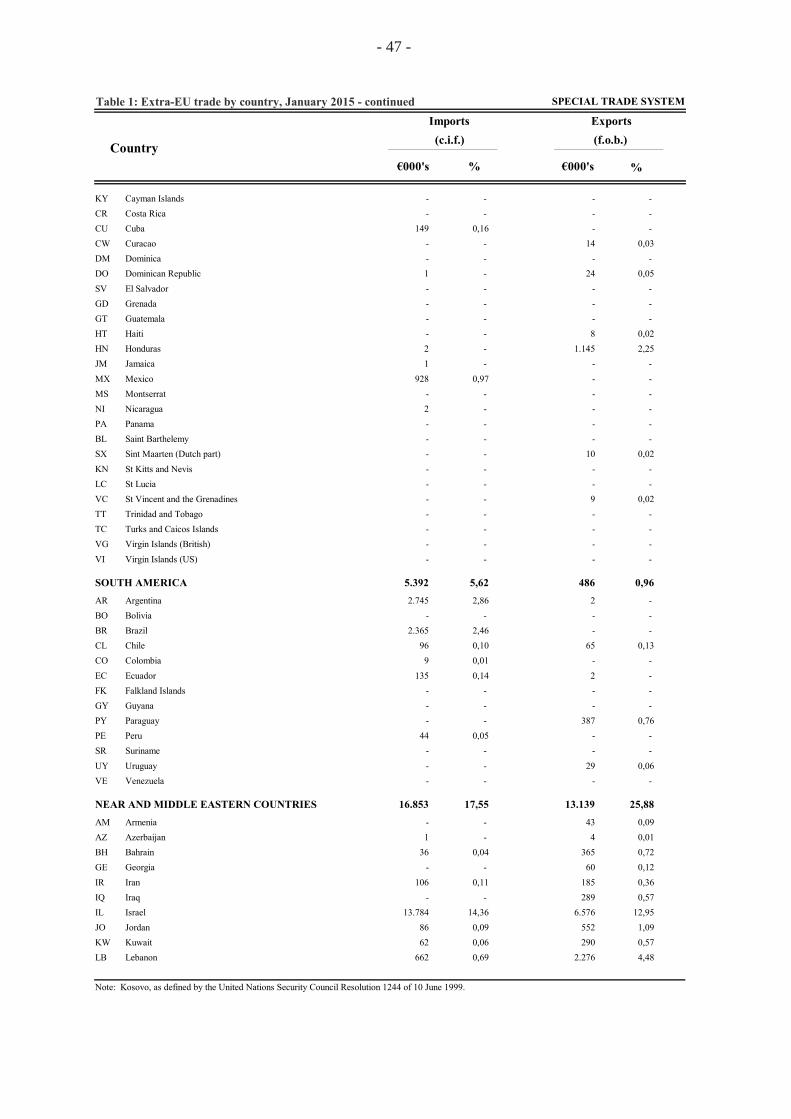
Table 1: Extra-EU trade by country, January 2015 - continued
Country% %
(c.i.f.) (f.o.b.)Imports Exports
€000's €000's
SPECIAL TRADE SYSTEM
Cayman IslandsKY - - - - Costa RicaCR - - - - CubaCU 149 -0,16 - CuracaoCW - 14 - 0,03DominicaDM - - - - Dominican RepublicDO 1 24 - 0,05El SalvadorSV - - - - GrenadaGD - - - - GuatemalaGT - - - - HaitiHT - 8 - 0,02HondurasHN 2 1.145 - 2,25JamaicaJM 1 - - - MexicoMX 928 -0,97 - MontserratMS - - - - NicaraguaNI 2 - - - PanamaPA - - - - Saint BarthelemyBL - - - - Sint Maarten (Dutch part)SX - 10 - 0,02St Kitts and NevisKN - - - - St LuciaLC - - - - St Vincent and the GrenadinesVC - 9 - 0,02Trinidad and TobagoTT - - - - Turks and Caicos IslandsTC - - - - Virgin Islands (British)VG - - - - Virgin Islands (US)VI - - - -
SOUTH AMERICA 5.392 4865,62 0,96ArgentinaAR 2.745 22,86 - BoliviaBO - - - - BrazilBR 2.365 -2,46 - ChileCL 96 650,10 0,13ColombiaCO 9 -0,01 - EcuadorEC 135 20,14 - Falkland IslandsFK - - - - GuyanaGY - - - - ParaguayPY - 387 - 0,76PeruPE 44 -0,05 - SurinameSR - - - - UruguayUY - 29 - 0,06VenezuelaVE - - - -
NEAR AND MIDDLE EASTERN COUNTRIES 16.853 13.13917,55 25,88ArmeniaAM - 43 - 0,09AzerbaijanAZ 1 4 - 0,01BahrainBH 36 3650,04 0,72GeorgiaGE - 60 - 0,12IranIR 106 1850,11 0,36IraqIQ - 289 - 0,57IsraelIL 13.784 6.57614,36 12,95JordanJO 86 5520,09 1,09KuwaitKW 62 2900,06 0,57LebanonLB 662 2.2760,69 4,48
Note: Kosovo, as defined by the United Nations Security Council Resolution 1244 of 10 June 1999.
- 47 -
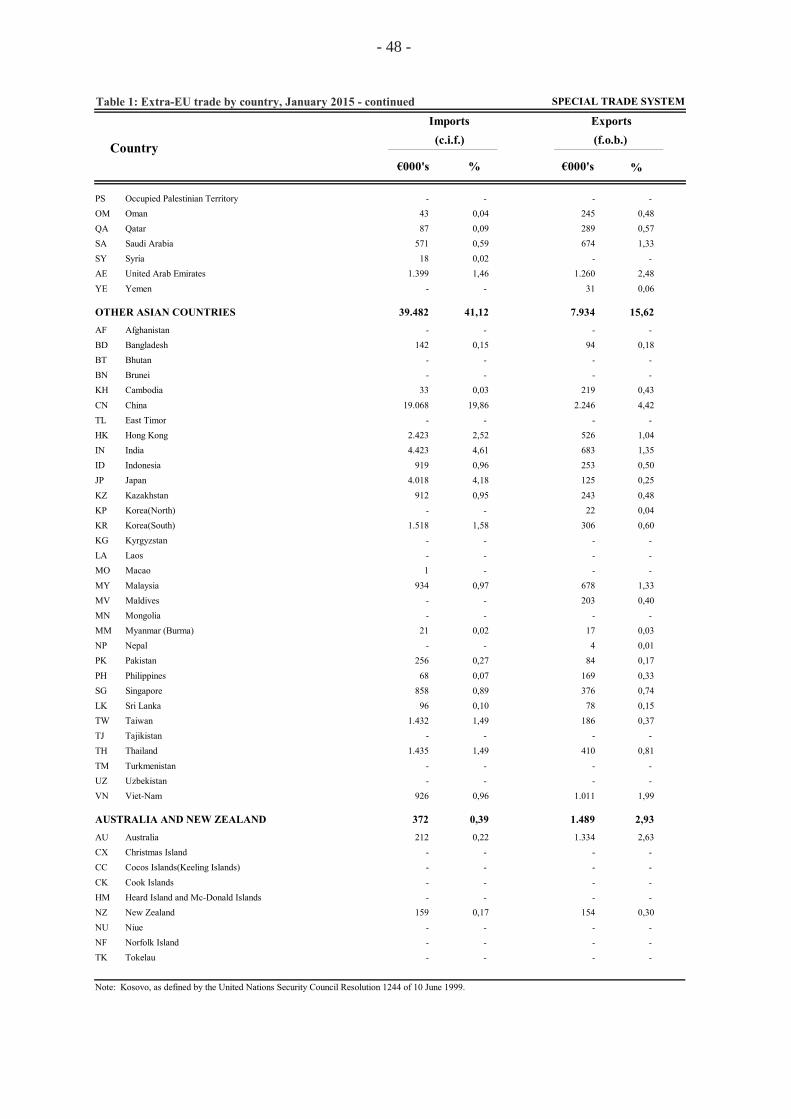
Table 1: Extra-EU trade by country, January 2015 - continued
Country% %
(c.i.f.) (f.o.b.)Imports Exports
€000's €000's
SPECIAL TRADE SYSTEM
Occupied Palestinian TerritoryPS - - - - OmanOM 43 2450,04 0,48QatarQA 87 2890,09 0,57Saudi ArabiaSA 571 6740,59 1,33SyriaSY 18 -0,02 - United Arab EmiratesAE 1.399 1.2601,46 2,48YemenYE - 31 - 0,06
OTHER ASIAN COUNTRIES 39.482 7.93441,12 15,62AfghanistanAF - - - - BangladeshBD 142 940,15 0,18BhutanBT - - - - BruneiBN - - - - CambodiaKH 33 2190,03 0,43ChinaCN 19.068 2.24619,86 4,42East TimorTL - - - - Hong KongHK 2.423 5262,52 1,04IndiaIN 4.423 6834,61 1,35IndonesiaID 919 2530,96 0,50JapanJP 4.018 1254,18 0,25KazakhstanKZ 912 2430,95 0,48Korea(North)KP - 22 - 0,04Korea(South)KR 1.518 3061,58 0,60KyrgyzstanKG - - - - LaosLA - - - - MacaoMO 1 - - - MalaysiaMY 934 6780,97 1,33MaldivesMV - 203 - 0,40MongoliaMN - - - - Myanmar (Burma)MM 21 170,02 0,03NepalNP - 4 - 0,01PakistanPK 256 840,27 0,17PhilippinesPH 68 1690,07 0,33SingaporeSG 858 3760,89 0,74Sri LankaLK 96 780,10 0,15TaiwanTW 1.432 1861,49 0,37TajikistanTJ - - - - ThailandTH 1.435 4101,49 0,81TurkmenistanTM - - - - UzbekistanUZ - - - - Viet-NamVN 926 1.0110,96 1,99
AUSTRALIA AND NEW ZEALAND 372 1.4890,39 2,93AustraliaAU 212 1.3340,22 2,63Christmas IslandCX - - - - Cocos Islands(Keeling Islands)CC - - - - Cook IslandsCK - - - - Heard Island and Mc-Donald IslandsHM - - - - New ZealandNZ 159 1540,17 0,30NiueNU - - - - Norfolk IslandNF - - - - TokelauTK - - - -
Note: Kosovo, as defined by the United Nations Security Council Resolution 1244 of 10 June 1999.
- 48 -

Table 1: Extra-EU trade by country, January 2015 - continued
Country% %
(c.i.f.) (f.o.b.)Imports Exports
€000's €000's
SPECIAL TRADE SYSTEM
OTHER COUNTRIES OF OCEANIA AND POLAR - 9 - 0,02American SamoaAS - - - - AntarcticaAQ - - - - Bouvet IslandBV - - - - FijiFJ - - - - French PolynesiaPF - - - - French Southern TerritoriesTF - - - - GuamGU - - - - KiribatiKI - - - - Marshall IslandsMH - - - - MicronesiaFM - - - - NauruNR - - - - New CaledoniaNC - - - - Northern Mariana IslandsMP - - - - PalauPW - - - - Papua New GuineaPG - - - - PitcairnPN - - - - SamoaWS - - - - Solomon IslandsSB - - - - South Georgia and South Sandwich IslandsGS - - - - TongaTO - - - - TuvaluTV - - - - United States Minor Outlying IslandsUM - - - - VanuatuVU - 9 - 0,02Wallis and FutunaWF - - - -
COUNTRIES AND TERRITORIES N/S 69 11.6280,07 22,90Countries and territories not specifiedQW 69 11.6280,07 22,90
STORES AND PROVISIONS - 6.296 - 12,40Stores and provisionsQS - 6.296 - 12,40
Note: Kosovo, as defined by the United Nations Security Council Resolution 1244 of 10 June 1999.
- 49 -

H.S. Section Imports Exports
(c.i.f.) (f.o.b.)
€000'sTable 2: Extra-EU trade classified by H.S Commodity Section, January 2015
TOTAL 96.021 50.777
I 2.020 3.805Live animals; animal products
II 5.244 995Vegetable products
III 381 18Animal or vegetable fats and oils and their cleavage products;prepared edible fats; animal or vegetable waxes
IV 8.899 4.433Prepared foodstuffs; beverages, spirits and vinegar; tobacco and manufactured tobacco substitutes
V 31.301 23.918Mineral products
VI 10.637 8.053Products of the chemical or allied industries
VII 4.731 460Plastics and articles thereof; rubber and articles thereof
VIII 362 79Raw hides and skins, leather, furskins and articles thereof; saddlery and harness; travel goods; handbags and similar containers; articles of animal gut (other than silk-worm gut)
IX 1.240 - Wood and articles of wood; wood charcoal; cork and articles of cork; manufactures of straw, of esparto or of other plaiting materials; basketware and wickerwork
X 2.447 381Pulp of wood or of other fibrous cellulosic material; recovered (waste and scrap) paper or paperboard; paper and paperboard and articles thereof
XI 2.353 210Textiles and textile articles
XII 409 56Footwear, headgear, umbrellas,sun umbrellas, walking sticks, seat sticks, whips, riding crops and parts thereof; prepared feathers and articles made therewith; artificial flowers; articles of human hair
XIII 1.163 - Articles of stone, plaster, cement, asbestos, mica or similar materials; ceramic products; glass and glassware
XIV 178 359Natural or cultured pearls, precious or semi-precious stones, precious metals, metals clad with precious metal, and articles thereof; imitation jewellery;coins
XV 5.574 1.098Base metal and articles of base metal
XVI 9.223 4.681Machinery and mechanical appliances; electrical equipment; parts thereof; sound recorders and reproducers, television image and sound recorders and reproducters, and parts and accessories of such articles
XVII 4.711 727Vehicles, aircraft, vessels and associated transport equipment
XVIII 1.217 684Optical, photographic, cinematographic, measuring, checking, precision, medical or surgical instruments and apparatus; clocks and watches; musical instruments; parts and accessories thereof
XIX 3 182Arms and ammunition; parts and accessories thereof
XX 3.672 368Miscellaneous manufactured articles
XXI 23 7Works of art, collectors ́pieces and antiques
UNCLASSIFIED 231 261
Note: The Special trade system is applied.
- 50 -

PART C: INTRA-EU TRADE STATISTICS

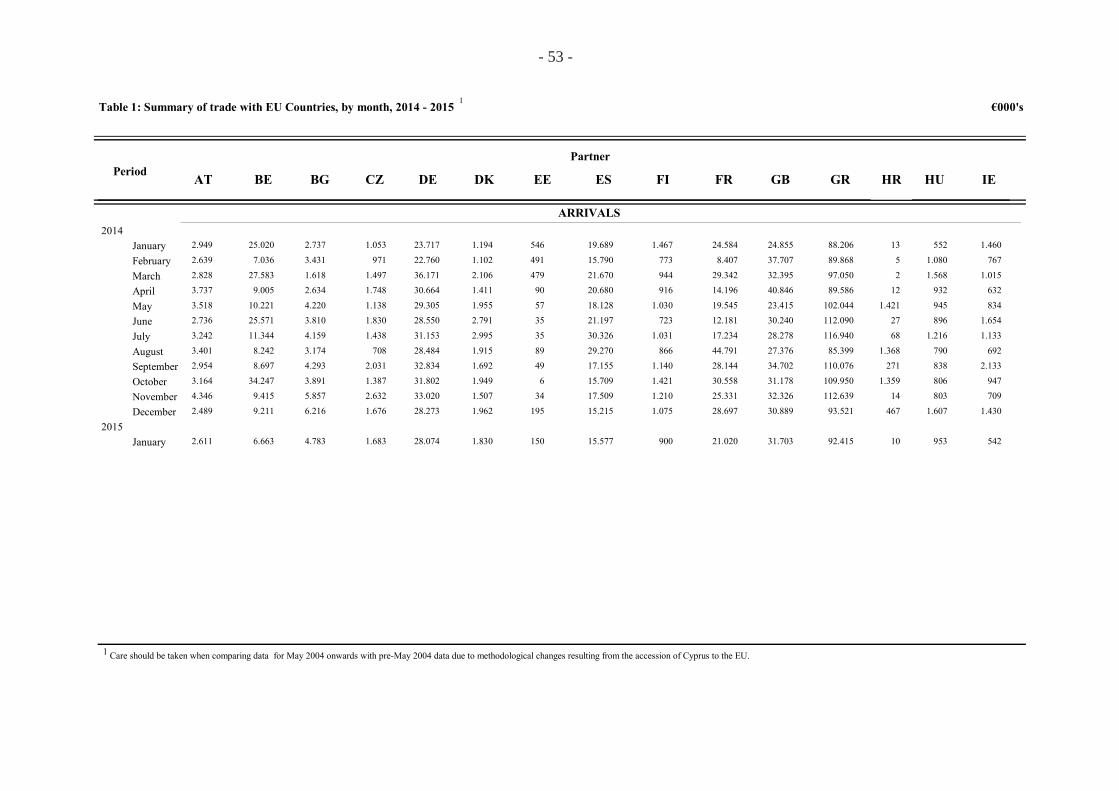
Table 1: Summary of trade with EU Countries, by month, 2014 - 2015 €000's1
Period AT BE CZ DK EE FI FRDE GR HU IEES GBBG
ARRIVALS
Partner
HR
2014January 2.949 25.020 1.053 1.194 546 1.467 24.58423.717 88.206 552 1.46019.689 24.8552.737 13
February 2.639 7.036 971 1.102 491 773 8.40722.760 89.868 1.080 76715.790 37.7073.431 5
March 2.828 27.583 1.497 2.106 479 944 29.34236.171 97.050 1.568 1.01521.670 32.3951.618 2
April 3.737 9.005 1.748 1.411 90 916 14.19630.664 89.586 932 63220.680 40.8462.634 12
May 3.518 10.221 1.138 1.955 57 1.030 19.54529.305 102.044 945 83418.128 23.4154.220 1.421
June 2.736 25.571 1.830 2.791 35 723 12.18128.550 112.090 896 1.65421.197 30.2403.810 27
July 3.242 11.344 1.438 2.995 35 1.031 17.23431.153 116.940 1.216 1.13330.326 28.2784.159 68
August 3.401 8.242 708 1.915 89 866 44.79128.484 85.399 790 69229.270 27.3763.174 1.368
September 2.954 8.697 2.031 1.692 49 1.140 28.14432.834 110.076 838 2.13317.155 34.7024.293 271
October 3.164 34.247 1.387 1.949 6 1.421 30.55831.802 109.950 806 94715.709 31.1783.891 1.359
November 4.346 9.415 2.632 1.507 34 1.210 25.33133.020 112.639 803 70917.509 32.3265.857 14
December 2.489 9.211 1.676 1.962 195 1.075 28.69728.273 93.521 1.607 1.43015.215 30.8896.216 467
2015January 2.611 6.663 1.683 1.830 150 900 21.02028.074 92.415 953 54215.577 31.7034.783 10
Care should be taken when comparing data for May 2004 onwards with pre-May 2004 data due to methodological changes resulting from the accession of Cyprus to the EU.1
- 53 -

Table 1: Summary of trade with EU Countries, by month, 2014 - 2015 - continued €000's1
RO QV TOTALIT LT LU LV MT NL PL PT SI SKSE Period
ARRIVALS
Partner
201423.769 195 180 732 94 12.320 1.500 895 496 5051.538January 264.884484.56925.666 211 233 359 151 11.163 1.147 1.544 478 3511.137February 239.158433.84832.077 572 237 359 402 17.456 1.995 1.764 434 1.2032.190March 318.457193.47932.973 370 221 215 97 15.618 1.867 1.750 1.091 9052.414April 275.921 - 1.31029.788 203 236 614 258 61.848 2.628 1.046 643 9681.327May 320.460343.09428.553 246 203 366 6.317 15.084 1.831 11.527 1.018 6674.270June 316.620622.14731.739 416 135 318 143 32.961 1.875 1.957 1.212 7241.884July 327.012 - 3.05826.023 332 85 381 1.831 18.916 2.100 1.540 945 4911.560August 291.954351.15035.734 205 99 161 341 47.059 2.115 957 672 6482.383September 341.651 - 4.26934.622 200 285 258 181 20.647 1.857 1.338 223 8411.657October 333.79423.30831.214 241 135 455 138 15.942 1.991 897 477 9162.414November 304.529972.25730.924 131 142 240 256 21.344 1.317 1.089 764 3362.053December 285.6451234.002
201523.526 168 43 392 207 13.486 1.865 716 142 6591.180January 255.2201223.799
Care should be taken when comparing data for May 2004 onwards with pre-May 2004 data due to methodological changes resulting from the accession of Cyprus to the EU.1
- 54 -
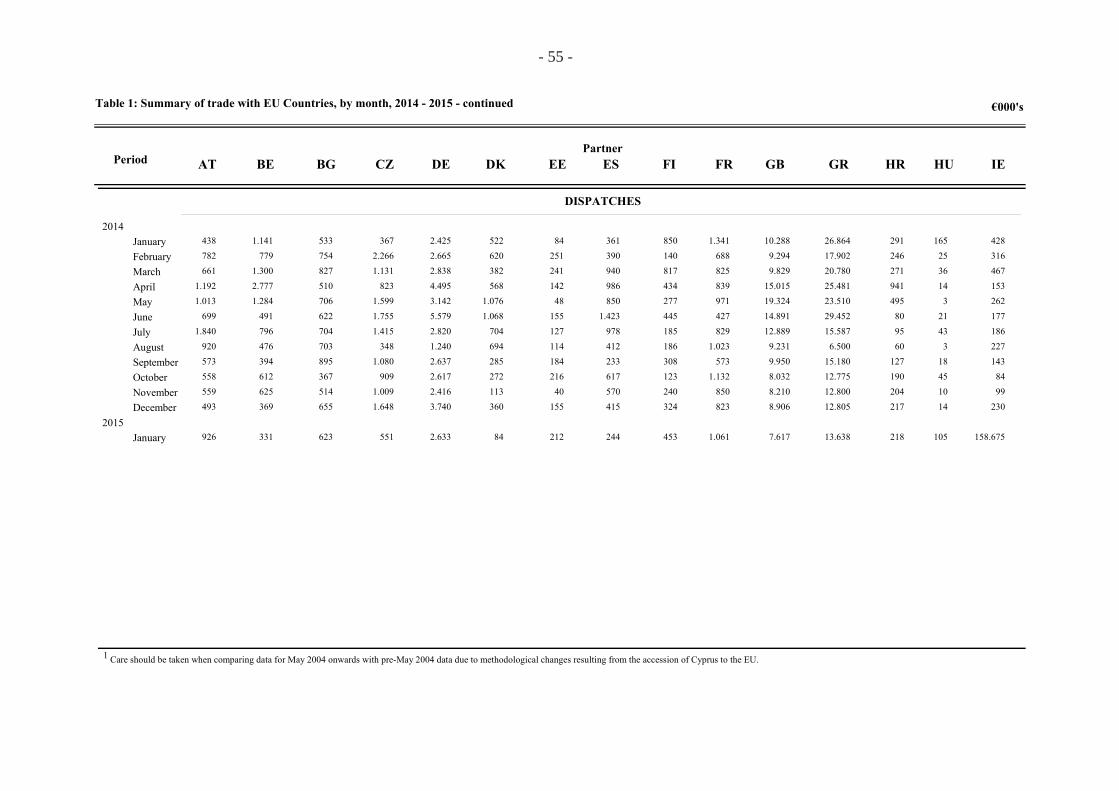
Table 1: Summary of trade with EU Countries, by month, 2014 - 2015 - continued €000's
Period AT BE CZ DK EE FI FRDE GR HU IEES GBBG
DISPATCHES
PartnerHR
2014January 438 1.141 367 522 84 850 1.3412.425 26.864 165 428361 10.288533 291
February 782 779 2.266 620 251 140 6882.665 17.902 25 316390 9.294754 246
March 661 1.300 1.131 382 241 817 8252.838 20.780 36 467940 9.829827 271
April 1.192 2.777 823 568 142 434 8394.495 25.481 14 153986 15.015510 941
May 1.013 1.284 1.599 1.076 48 277 9713.142 23.510 3 262850 19.324706 495
June 699 491 1.755 1.068 155 445 4275.579 29.452 21 1771.423 14.891622 80
July 1.840 796 1.415 704 127 185 8292.820 15.587 43 186978 12.889704 95
August 920 476 348 694 114 186 1.0231.240 6.500 3 227412 9.231703 60
September 573 394 1.080 285 184 308 5732.637 15.180 18 143233 9.950895 127
October 558 612 909 272 216 123 1.1322.617 12.775 45 84617 8.032367 190
November 559 625 1.009 113 40 240 8502.416 12.800 10 99570 8.210514 204
December 493 369 1.648 360 155 324 8233.740 12.805 14 230415 8.906655 217
2015January 926 331 551 84 212 453 1.0612.633 13.638 105 158.675244 7.617623 218
Care should be taken when comparing data for May 2004 onwards with pre-May 2004 data due to methodological changes resulting from the accession of Cyprus to the EU.1
- 55 -
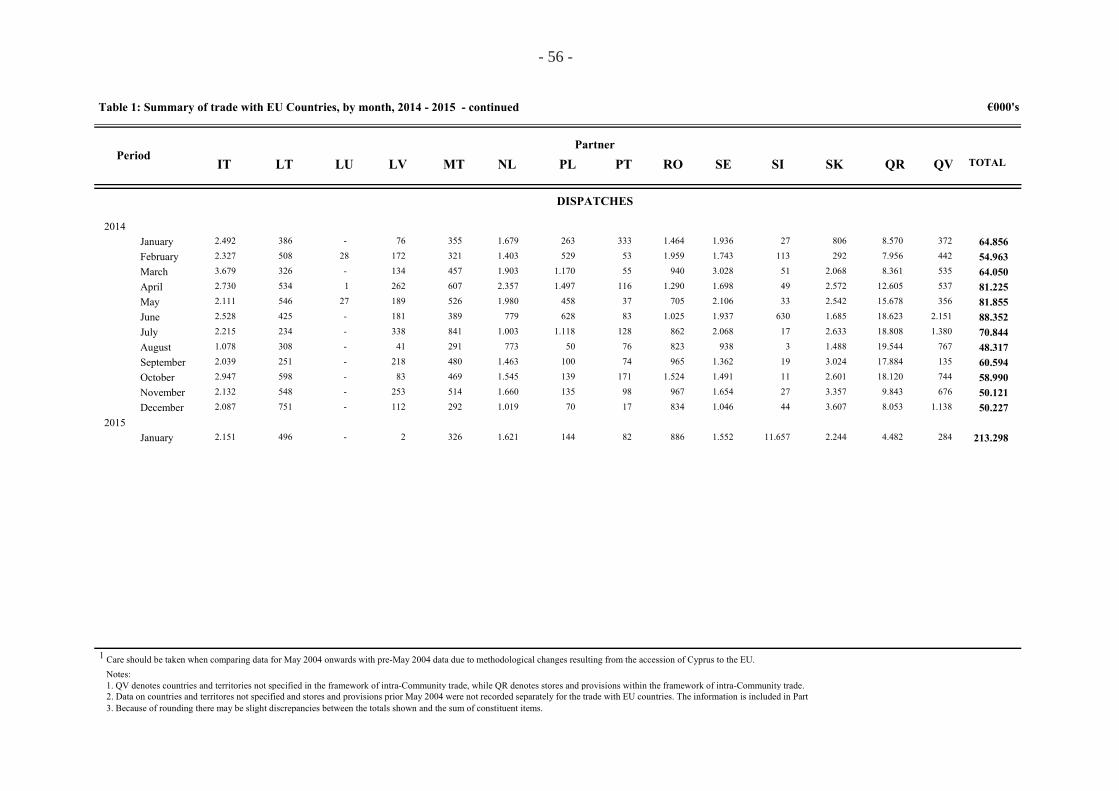
Table 1: Summary of trade with EU Countries, by month, 2014 - 2015 - continued €000's
RO QVQR TOTALIT LT LU LV MT NL PL PT SI SKSE Period
DISPATCHES
Partner
20142.492 386 - 76 355 1.679 263 333 27 8061.936January 64.8563728.5701.4642.327 508 28 172 321 1.403 529 53 113 2921.743February 54.9634427.9561.9593.679 326 - 134 457 1.903 1.170 55 51 2.0683.028March 64.0505358.3619402.730 534 1 262 607 2.357 1.497 116 49 2.5721.698April 81.22553712.6051.2902.111 546 27 189 526 1.980 458 37 33 2.5422.106May 81.85535615.6787052.528 425 - 181 389 779 628 83 630 1.6851.937June 88.3522.15118.6231.0252.215 234 - 338 841 1.003 1.118 128 17 2.6332.068July 70.8441.38018.8088621.078 308 - 41 291 773 50 76 3 1.488938August 48.31776719.5448232.039 251 - 218 480 1.463 100 74 19 3.0241.362September 60.59413517.8849652.947 598 - 83 469 1.545 139 171 11 2.6011.491October 58.99074418.1201.5242.132 548 - 253 514 1.660 135 98 27 3.3571.654November 50.1216769.8439672.087 751 - 112 292 1.019 70 17 44 3.6071.046December 50.2271.1388.053834
20152.151 496 - 2 326 1.621 144 82 11.657 2.2441.552January 213.2982844.482886
Care should be taken when comparing data for May 2004 onwards with pre-May 2004 data due to methodological changes resulting from the accession of Cyprus to the EU.1
Notes:1. QV denotes countries and territories not specified in the framework of intra-Community trade, while QR denotes stores and provisions within the framework of intra-Community trade.2. Data on countries and territores not specified and stores and provisions prior May 2004 were not recorded separately for the trade with EU countries. The information is included in Part3. Because of rounding there may be slight discrepancies between the totals shown and the sum of constituent items.
- 56 -
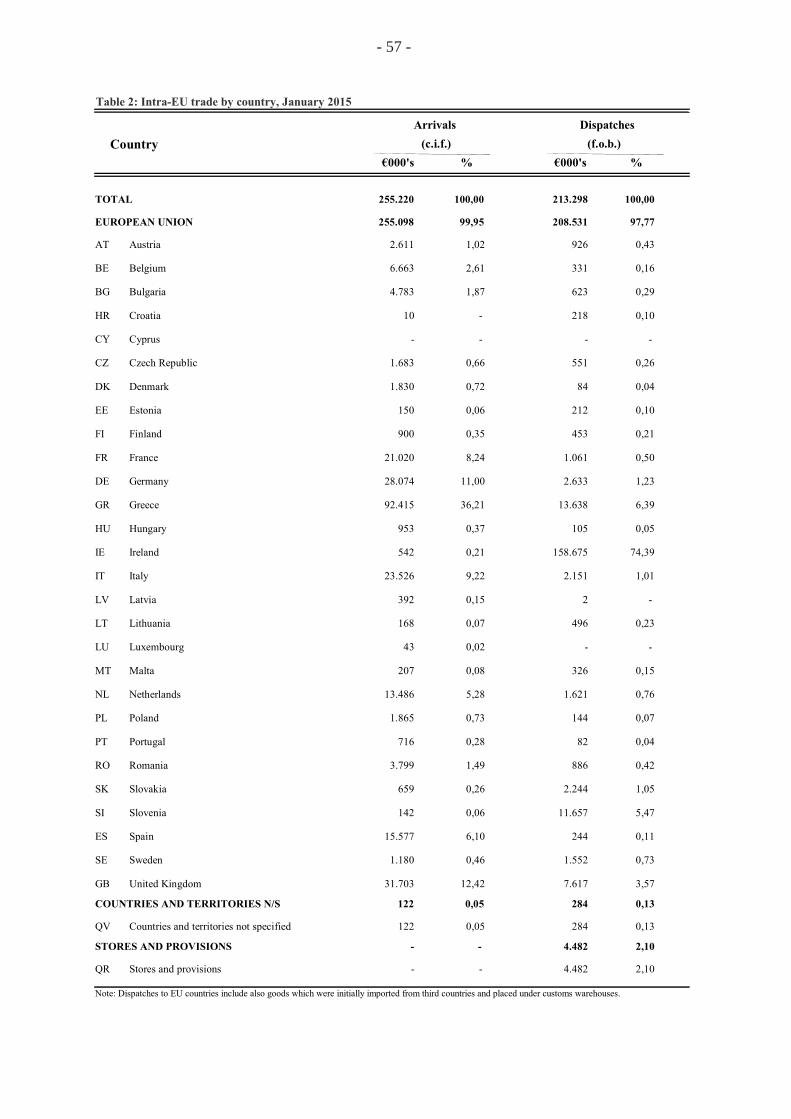
Table 2: Intra-EU trade by country, January 2015
Country% %
(c.i.f.) (f.o.b.)Arrivals Dispatches
€000's €000's
255.220 213.298TOTAL 100,00 100,00
EUROPEAN UNION 255.098 208.53199,95 97,77
AustriaAT 2.611 9261,02 0,43
BelgiumBE 6.663 3312,61 0,16
BulgariaBG 4.783 6231,87 0,29
CroatiaHR 10 218 - 0,10
CyprusCY - - - -
Czech RepublicCZ 1.683 5510,66 0,26
DenmarkDK 1.830 840,72 0,04
EstoniaEE 150 2120,06 0,10
FinlandFI 900 4530,35 0,21
FranceFR 21.020 1.0618,24 0,50
GermanyDE 28.074 2.63311,00 1,23
GreeceGR 92.415 13.63836,21 6,39
HungaryHU 953 1050,37 0,05
IrelandIE 542 158.6750,21 74,39
ItalyIT 23.526 2.1519,22 1,01
LatviaLV 392 20,15 -
LithuaniaLT 168 4960,07 0,23
LuxembourgLU 43 - 0,02 -
MaltaMT 207 3260,08 0,15
NetherlandsNL 13.486 1.6215,28 0,76
PolandPL 1.865 1440,73 0,07
PortugalPT 716 820,28 0,04
RomaniaRO 3.799 8861,49 0,42
SlovakiaSK 659 2.2440,26 1,05
SloveniaSI 142 11.6570,06 5,47
SpainES 15.577 2446,10 0,11
SwedenSE 1.180 1.5520,46 0,73
United KingdomGB 31.703 7.61712,42 3,57
COUNTRIES AND TERRITORIES N/S 122 2840,05 0,13
Countries and territories not specifiedQV 122 2840,05 0,13
STORES AND PROVISIONS - 4.482 - 2,10
Stores and provisionsQR - 4.482 - 2,10
Note: Dispatches to EU countries include also goods which were initially imported from third countries and placed under customs warehouses.
- 57 -

H.S. Section Arrivals Dispatches(c.i.f.) (f.o.b.)
€000'sTable 3: Intra-EU trade classified by H.S Commodity Section, January 2015
TOTAL 255.220 213.298
I Live animals; animal products 9.336 6.093
II Vegetable products 14.361 3.527
III Animal or vegetable fats and oils and their cleavage products;prepared edible fats; animal or vegetable waxes
1.386 109
IV Prepared foodstuffs; beverages, spirits and vinegar; tobacco and manufactured tobacco substitutes
31.770 1.608
V Mineral products 55.291 16.591
VI Products of the chemical or allied industries 33.096 12.307
VII Plastics and articles thereof; rubber and articles thereof
7.341 425
VIII Raw hides and skins, leather, furskins and articles thereof; saddlery and harness; travel goods; handbags and similar containers; articles of animal gut (other than silk-worm gut)
1.566 222
IX Wood and articles of wood; wood charcoal; cork and articles of cork; manufactures of straw, of esparto or of other plaiting materials; basketware and wickerwork
1.707 8
X Pulp of wood or of other fibrous cellulosic material; recovered (waste and scrap) paper or paperboard; paper and paperboard and articles thereof
4.641 37
XI Textiles and textile articles 17.320 409
XII Footwear, headgear, umbrellas,sun umbrellas, walking sticks, seat sticks, whips, riding crops and parts thereof; prepared feathers and articles made therewith; artificial flowers; articles of human hair
2.769 7
XIII Articles of stone, plaster, cement, asbestos, mica or similar materials; ceramic products; glass and glassware
4.947 33
XIV Natural or cultured pearls, precious or semi-precious stones, precious metals, metals clad with precious metal, and articles thereof; imitation jewellery;coins
596 1.008
XV Base metal and articles of base metal 10.894 3.140
XVI Machinery and mechanical appliances; electrical equipment; parts thereof; sound recorders and reproducers, television image and sound recorders and reproducters, and parts and accessories of such articles
25.989 5.299
XVII Vehicles, aircraft, vessels and associated transport equipment
18.239 159.069
XVIII Optical, photographic, cinematographic, measuring, checking, precision, medical or surgical instruments and apparatus; clocks and watches; musical instruments; parts and accessories thereof
6.545 2.361
XIX Arms and ammunition; parts and accessories thereof
670 28
XX Miscellaneous manufactured articles 6.623 859
XXI Works of art, collectors ́pieces and antiques 5 -
UNCLASSIFIED 129 159
- 58 -

APPENDIX


DEFINITIONS OF TERMS USED
Arrivals "Arrivals" are analogous to imports. Arrivals include: a) goods in free circulation which enter the statistical territory of Cyprus; b) goods which have been placed under the CUSTOMS procedure for inward processing or processing under CUSTOMS control (for processing, transformation) in another Member State and which enter the statistical territory of Cyprus. c) Some goods movements are included in statistics based on specific conditions e.g. aircrafts and ships whose ownership has been transferred from a person established in another Member State to a person established in the Cyprus are included in the statistics of arrivals of Cyprus. Dispatches "Dispatches" are analogous to exports. Dispatches include: a) goods in free circulation which leave the statistical territory of Cyprus bound for another Member State; b) goods which have been placed under the CUSTOMS procedure for inward processing or processing under CUSTOMS control (for processing, transformation) in Cyprus and which are destined for another Member State. c) Some goods movements are included in statistics based on specific conditions. In particular, aircraft and ships whose ownership has been transferred from a person established in the Cyprus to a person established in another Member State are included in the statistics on dispatches of Cyprus.
Imports Imports under special trade system include: a) Goods, which enter the statistical territory of Cyprus from a non-member country and are:
- Placed under the CUSTOMS procedure for release into free circulation (goods intended to be consumed in Cyprus or dispatched to another Member State), either immediately or after a period in a CUSTOMS warehouse or
- Placed under the CUSTOMS procedure for inward processing or processing under CUSTOMS control (usually goods destined to be processed, transformed for subsequent re-export) either immediately or after a period in a CUSTOMS warehouse.
b) Some movements of goods are included in statistics based on specific conditions e.g aircrafts and ships whose ownership has been transferred from a person established in a non-member country to a person established in Cyprus are included in import statistics of Cyprus. Exports Exports under special trade system include: a) goods that leave the statistical territory of Cyprus bound for a non-member country, having gone through:
- The CUSTOMS export procedure (final export, export following inward processing, etc.); or
- The CUSTOMS outward-processing procedure (usually goods destined to be processed, transformed for subsequent re-import).
- 61 -

The Harmonized Commodity Description and Coding System (HS) The Harmonised System is a legal instrument adopted by the Customs Co-operation Council (now the World Customs Organisation) in June 1983 and the International Convention on the Harmonised System (H.S. Convention) entered into force on the 1st January 1988. According to the H.S. Convention, the HS ¨means the Nomenclature comprising the headings and the subheadings and their related numerical codes, the Section, Chapter and Subheadings notes and the General Rules for the interpretation of the Harmonised System¨. The H.S. is designed as a ¨multipurpose nomenclature¨, to be used for transportable goods. Both H.S. and C.N. are therefore concerned heavily with the nature or material of the product. The shape of the H.S. and the C.N. classifications is illustrated in the following table:
Nomenclature Levels of breakdown
Code Number
H.S. Section One digit
21
Chapter Two digits
99
Heading Fourdigits
1229
Sub-heading Six digits
5214
C.N. Sub-heading Eight digits
9379
Country classification The classification of countries is the country nomenclature (Geonomenclature) as set annually in the Official Journal of the European Communities. The full list of countries is given in an essentially geographical order in Table 4, Part A, Total trade statistics.
Partner country For exports and dispatches, the trading partner is the country (or Member State) of final destination of the goods. The last country to which the goods are specifically directed on their outward movement from the State is regarded as their final destination. This is not necessarily the country in which the good will be unshipped or that in which they will be finally consumed. For imports (extra-EU trade), the trading partner is the country of origin. In general, goods obtained entirely from a given country originate in that country. A product, in the production of which two or more countries were concerned, is considered as originating in the country in which the last transformation or substantial processing took place. Packing repacking, sorting and blending are not regarded as manufacturing processes. For arrivals (intra-EU trade), the trading partner is the Member State of consignment of the goods. Trade systems There are broadly two approaches, closely linked with customs procedures, used for the measurement of international trade in goods: the general trade system and the special trade system. General trade system The general trade system is the wider concept and under it the recorded aggregates include all goods entering or leaving the economic territory of Cyprus with the exception of simple transit trade. In particular all goods which are received into customs warehouses are recorded as imports at that stage whether or not they subsequently go into free circulation in Cyprus. Similarly, outgoing goods from customs warehouses are included in the general trade aggregates at the time they leave Cyprus.
- 62 -
Special trade system The special trade system is a narrower concept. Goods from a foreign country which are received into customs warehouse are not recorded in the special trade aggregates unless they subsequently go into free circulation in Cyprus (or are placed under the customs procedures for inward processing). Similarly, outgoing goods from customs warehouses are not recorded as exports. Stores and provisions Stores and provisions denote ships´and aircraft´s stores and supplies. - ships and aircraft's stores' means the various products for consumption by the crew and passengers of vessels or aircraft; - ships and aircraft's supplies' means the products for the operation of the engines, machines and other equipment on vessels or aircraft, such as fuel, oil and lubricants. Domestic and foreign goods Domestic goods are goods originating in the economic territory of Cyprus; if they have been wholly obtained in it or were substantially transformed by processing in it, so that the processing confers domestic origin. Goods originally imported and having undergone only repair or minor operations which leave them essentially unchanged are not defined as domestic. Minor operations include blending, packaging, bottling, cleaning, sorting, husking and selling. Foreign goods are goods originating in the rest of the world, i.e not included in the economic territory of Cyprus and compensating goods obtained under the outward processing procedure when such processing confers foreign origin.
Sources of additional information Details at the level of H.S. and C.N. are available on a free basis on the web site: http://www.mof.gov.cy/cystat Enquiries are welcome. More details on intra-EU and extra-EU statistics can also be obtained by phone, fax, post or personal visit to: Statistical Service of Cyprus Michalaki Karaoli str., 1444 Nicosia, Cyprus Phone No.: (+357) 22605122 Fax No.: (+357) 22661313 E-mail: [email protected]
- 63 -

European Statistical Data • European statistical data are available on the website of Eurostat
(http://epp.eurostat.ec.europa.eu) free of charge to all users. Amongst other, the website offers access to statistical data contained in Eurostat's databases as well as to the publications of Eurostat in electronic format (pdf).
• Eurostat set up with all Member States a network of support centers. Their
mission is to provide help and guidance to Internet users of European statistical data, thus to all users of Eurostat's website.
• The Statistical Service of Cyprus (CYSTAT) has set up the Centre of European
Statistical Data Support (ESDS) which provides support for the following:
- Information on availability of data/ publications - Verification of data - Methodological information - Technical support
• Users may contact the ESDS Centre via:
- CYSTAT’s website (http://www.mof.gov.cy/cystat) under the section Services / ESDS where they can fill out the predefined form
- Email: [email protected] - Telephone: +357-22605151 - Fax: +357-22661313
• The service is available daily during the working hours of the Cyprus civil
service.