The Measurement Uncertainty Evaluation Technique for the ...

The Pennsylvania State University
The Graduate School
College of Earth and Mineral Sciences
INTERPRETIVE UNCERTAINTY AND THE
EVALUATION OF SYMBOLS
AND
A TAXONOMY OF SYMBOL EVALUATION METHODS AND
MOBILE EVALUATION TOOL
A Thesis in
Geography
by
Ryan S. Mullins
c© 2014 Ryan S. Mullins
Submitted in Partial Fulfillmentof the Requirements
for the Degree of
Master of Science
December 2014
The thesis of Ryan S. Mullins was reviewed and approved* by the following:
Alan M. MacEachrenProfessor of GeographyThesis Adviser
Anthony C. RobinsonAssistant Professor of Geography
Cynthia A. BrewerProfessor of GeographyHead of the Department of Geography
*Signatures on file in the Graduate School.

iii
Table of Contents
List of Tables . . . . . . . . . . . . . . . . . . . . . . . . . . . . . . . . . . . . . . . . . . . . iv
List of Figures . . . . . . . . . . . . . . . . . . . . . . . . . . . . . . . . . . . . . . . . . . . v
Acknowledgments . . . . . . . . . . . . . . . . . . . . . . . . . . . . . . . . . . . . . . . . . vi
Chapter 1. Interpretive Uncertainty and the Evaluation of Symbols . . . . . . . . . . . . . 11.1 Introduction . . . . . . . . . . . . . . . . . . . . . . . . . . . . . . . . . . . . . . 11.2 Analytic Framework . . . . . . . . . . . . . . . . . . . . . . . . . . . . . . . . . 31.3 Research Questions Driving Symbol Evaluation . . . . . . . . . . . . . . . . . . 4
1.3.1 Cartography and GIScience . . . . . . . . . . . . . . . . . . . . . . . . . 51.3.2 Other Fields . . . . . . . . . . . . . . . . . . . . . . . . . . . . . . . . . . 15
1.4 Research Methods Used in Symbol Evaluation . . . . . . . . . . . . . . . . . . . 191.5 Discussion and Conclusions . . . . . . . . . . . . . . . . . . . . . . . . . . . . . 26
Chapter 2. A Taxonomy of Symbol Evaluation Methods and Mobile Evaluation Tool . . . 312.1 Introduction . . . . . . . . . . . . . . . . . . . . . . . . . . . . . . . . . . . . . . 312.2 Related Work . . . . . . . . . . . . . . . . . . . . . . . . . . . . . . . . . . . . . 322.3 Taxonomy of Symbol Evaluation Methods for Mobile Devices . . . . . . . . . . 36
2.3.1 Comprehension . . . . . . . . . . . . . . . . . . . . . . . . . . . . . . . . 392.3.2 Operability . . . . . . . . . . . . . . . . . . . . . . . . . . . . . . . . . . 442.3.3 Efficiency . . . . . . . . . . . . . . . . . . . . . . . . . . . . . . . . . . . 512.3.4 Robustness . . . . . . . . . . . . . . . . . . . . . . . . . . . . . . . . . . 54
2.4 Prototype Mobile Application . . . . . . . . . . . . . . . . . . . . . . . . . . . . 582.4.1 Design and Feature Requirements . . . . . . . . . . . . . . . . . . . . . . 582.4.2 Design and Implementation . . . . . . . . . . . . . . . . . . . . . . . . . 59
2.4.2.1 Supported Experiments . . . . . . . . . . . . . . . . . . . . . . 592.4.2.2 Reporting Results . . . . . . . . . . . . . . . . . . . . . . . . . 642.4.2.3 Architecture . . . . . . . . . . . . . . . . . . . . . . . . . . . . 66
2.4.3 Availability . . . . . . . . . . . . . . . . . . . . . . . . . . . . . . . . . . 682.5 Conclusions and Future Work . . . . . . . . . . . . . . . . . . . . . . . . . . . . 68
Bibliography . . . . . . . . . . . . . . . . . . . . . . . . . . . . . . . . . . . . . . . . . . . . 70

iv
List of Tables
1.1 Research questions related to thematic mapping in cartography and GIScience. . . 101.2 Research questions related to reference mapping. . . . . . . . . . . . . . . . . . . . 121.3 Research questions about digital and mobile technology in cartography and GIScience. 141.4 Research questions on methodologies in cartography and GIScience. . . . . . . . . 141.5 Research questions related to comprehension testing in other fields. . . . . . . . . . 161.6 Research questions related to task-based evaluation in other fields. . . . . . . . . . 171.7 Research questions related to icons used on mobile devices in other fields. . . . . . 181.8 Research questions on methodologies from other fields. . . . . . . . . . . . . . . . . 19
v
List of Figures
1.1 Board’s (1978, pg. 6) taxonomy of map reading tasks. . . . . . . . . . . . . . . . . 8
2.1 A partial representation of the Alonso et al. (2010) taxonomy of usability topics. . 332.2 Board’s (1978, pg. 6) taxonomy of map reading tasks. . . . . . . . . . . . . . . . . 342.3 Roth’s (2012) taxonomy of cartographic interaction primitives. . . . . . . . . . . . 352.4 A taxonomy of evaluation methods to address symbol usability. . . . . . . . . . . . 382.5 The comprehension category of the symbol evaluation taxonomy. . . . . . . . . . . 402.6 The operability category of the symbol evaluation taxonomy. . . . . . . . . . . . . 452.7 The efficiency category of the symbol evaluation taxonomy. . . . . . . . . . . . . . 522.8 The robustness category of the symbol evaluation taxonomy. . . . . . . . . . . . . 562.9 Sympol prototype in Xcode’s Interface Builder . . . . . . . . . . . . . . . . . . . . 602.10 Association task interface as implemented in the current prototype. . . . . . . . . . 612.11 Sympol search task map interface as implemented in the current prototype. . . . . 63

vi
Acknowledgments
I would like to thank Alan MacEachren for his support and guidance over the course of this
project. I would also like to thank my family — my mother, Denise, my father, Stacey, and my
sister, Courtney — for their endless support and encouragement; without their constant nudges I
would never have completed this work. And finally, I would like to thank a few friends. Vaughn
Whisker, for forcibly removing me from my duties at work so that I would return to grad school
and complete my studies. Joshua Stevens, for being my sounding board for ideas and frustrations,
as well as my traveling companion to conferences. Sydney Shaw, much like my family, literally
poked, prodded, and motivated me to write, even when it was the last thing on my to-do list.

1
Chapter 1
Interpretive Uncertainty and the Evaluation of Symbols
Uncertainty is a complex topic that affects data and those seeking to use data. This research
explores a dimension of uncertainty often passed over in the geography and cartography literature;
how uncertainty is introduced through the process of interpreting a symbol, referred to herein as
interpretive uncertainty. This research is grounded in an extensive analysis of research questions and
methods, to re-frame and relate existing research to interpretive uncertainty, with a specific focus
on the point symbols. This analysis shows that questions asked in existing literature have some
ties to interpretive uncertainty, but lack metrics to enable proper understanding. Two participant-
reported metrics — certainty and confidence — are recommended for use in measuring interpretive
uncertainty. The analysis also shows that the experimental methods used to evaluate map symbols
are equally appropriate for evaluating interpretive uncertainty. Modifications to these methods are
suggested for incorporating metrics that measure interpretive uncertainty as a component of more
general symbol evaluations.
1.1 Introduction
Geographic and cartographic literature has discussed uncertainty related to error or inaccu-
racy of data in great detail (see Buttenfield (1993); Zhang & Goodchild (2002)). Such work includes
the study of sources of error in geographic data, the visualization of error and accuracy in symbols

2
(Pang 2001; Wittenbrink et al. 1995), and the use of interactivity to provide access to more detailed
information about these qualities of data (Fisher 1993; Howard & MacEachren 1996).
Uncertainty is also a factor when an individual interprets a symbol. This type of uncertainty
is not addressed as frequently in the geography or cartography literature, at least not under the term
uncertainty. Kennedy (2011), a linguist at the University of Chicago, uses the term interpretive
uncertainty to describe “that the mapping from an utterance to a meaning appears (at least from
the external perspective of a hearer or addressee) to be one-to-many rather than one-to-one”.
I propose that this definition should be expanded to consider the effects that this one-to-many
mapping relationship has on an interpreter’s ability to act upon that interpretation. Therefore,
interpretive uncertainty is defined in this research as the uncertainty that affects an individual’s
ability to act upon their interpretation of a symbol, especially when that symbol can be interpreted
to have multiple meanings.
There has been a substantial volume of research on how to visualize data uncertainty on
maps (e.g. Pang (2001); Wittenbrink et al. (1995); Fisher (1993); Howard & MacEachren (1996))
and many human subjects studies have been carried out to assess the methods (MacEachren et al.
2012; Bisantz et al. 2005). Such research can be extended to address interpretive uncertainty.
This paper examines existing research in geography, cartography, information science, and
other related fields to accomplish three goals: (1) to identify the research questions that have histor-
ically driven symbol evaluation research (with an emphasis on map symbols) and re-contextualize
them such that they can be used to examine interpretive uncertainty; (2) to similarly identify and
re-contextualize the research methods that have historically driven this symbol evaluation research;
and (3) to identify metrics and mechanisms for measuring interpretive uncertainty by modifying
these proven research methods.
3
1.2 Analytic Framework
This research is based on an extension of the traditional literature review. A collection of 112
peer-reviewed articles related to symbol evaluation was gathered and analyzed to address two main
questions. First, what are the primary research questions addressed in each article? Included with
this is an exploration of the research domain and symbol characteristics. Second, which methods
are used to evaluate the symbols in this research?
The results of this analysis are presented in two sections. Section 1.3 highlights research
questions found in each article. This discussion is split into two subsections, one focusing on re-
search questions from the geography and cartography literature, and the other focusing on research
questions from information science and related research domains. This split was chosen to highlight
key differences in the concerns of researchers in other domains. Section 1.4 looks at the methods
used to evaluate symbols. Unlike the research questions discussed in Section 1.3, this section does
not split up the discussion of research methods as they are very similar across disciplines.
Research articles included in this analysis were chosen based on some simple criteria. A base
of research was collected, beginning with recommended articles from experts and examples used in
geography coursework focused on uncertainty. Other research was then identified using a series of
keyword and citation network queries, and articles were included if they met the following criteria.
• The research was published in a reputable, peer-reviewed journal, edited publication, or
conference proceedings.
• Research included from the first round of queries must have been cited at least ten times.
• Research included from the second round of queries must have been cited at least five times.

4
• The body of literature must be at least 51% from geography and cartography to ensure an
emphasis on methods used in my field of research while maximizing exposure to research in
similar or related fields.
• Special exceptions were be made for research published within the last five years.
Of the 112 articles collected, 65 (58%) came from the cartography and geography community.
A relatively large proportion of papers (47, 42%) were collected from outside geography/cartogra-
phy, because there has been considerable attention to symbol design in fields such as public safety,
and studies in domains such as psychology and human factors have served as models for similar
studies in cartography. Most of these studies either include a map component or focused on point
symbols assessed interdependently of any background image that could (sometimes with modifica-
tion to cope with smaller size) be used on maps. Articles were published as early as 1952 and as
recently as 2014, with the majority of articles (72%) published after 1990.
1.3 Research Questions Driving Symbol Evaluation
Many disciplines evaluate graphical symbols for a variety of reasons, from design to com-
prehension to usability of tools and systems that include the symbols. This section analyzes the
research questions that are driving this research in two segments — within Cartography and GIS-
ceince, and outside of Cartography and GIScience. Of particular importance are the foundations
and classification of symbol evaluation in Cartographic and GIScience research, and the isolation
of variables in evaluations from all disciplines.

5
1.3.1 Cartography and GIScience
Cartographic symbol evaluation first gained popularity in the mid-twentieth century. Arthur
Robinson’s work in this area helped define the reasoning and some methods behind map and
symbol evaluation (Robinson 1952). He was among the first to lay the foundation for the map
communication model (see also Board (1973, 1977); Kolacny (1969); Robinson & Petchenik (1975)),
based on work done in information science. This work sought to answer three core questions: (1)
what makes a map successful at communicating information; (2) why is there a need to evaluate
maps and symbols; and (3) how do we define a system that can evaluate the maps and symbols we
create and use?
Robinson & Petchenik (1975) defined a “percipient” as an individual who was receiving and
interpreting a message that had been encoded in a map by a cartographer. While not explicitly using
the words interpretive uncertainty, the authors (1975 p. 100) did briefly describe an underlying
problem, the correct and erroneous understanding of the real world in both the “percipient” and
the cartographer. Finding a way to bridge this gap is an important step in fully evaluating symbols
and understanding interpretive uncertainty.
Two articles published in 1979 focused on the cognitive aspects of cartographic experimen-
tation; together they shed some light on bridging the gap mentioned above. Olson (1979) looked
at“the interaction of the visual product and the mental processes” involved in interpreting maps,
noting two important points. First, cognitive processes cannot be observed directly, requiring a
method or tool to collect observable information — i.e. speech, writing, pictures, etc. — that
can provide insight into these processes. And second, that the processes used by cartographers
to encode a message and an individual interpreting that message are different and are affected

6
by time, task, and cognitive level. Guelke (1979) examined how culture and cognitive processes
affect perception and interpretation of maps and map symbols. The findings indicated that it is
impossible to create a “universal set of cartographic symbols based on psycho-physical research”
because of these factors, but that there is room for standardization within more limited contexts.
Montello (2002) sought to reevaluate the ideas proposed by Robinson (1952) and Olson
(1979) and compare them to changes over the last several decades. His review examined cogni-
tive cartography, and provided some insight into the successes and failures of this research. Chief
among the cited failures are limitations of the map communication model. Specifically, critics
note that the map communication model does not provide enough details on how to improve
map design for the reader, and that it focused on the idea of a context-dependent message in-
stead of less context-dependent information (Montello 2002 p. 294). MacEachren states that
the map provides an individual with information represented by symbols, and that these sym-
bols stimulate connotations, ideas, and inferences about that information from the individual’s
prior experiences and knowledge. Montello goes on to note the chief success of the work related
to the map communication model, the focus on the collection of data that can be used to un-
derstand the cognitive processes described by Olson (1979). The technology to collect data to
support such research has become more available and affordable in recent years, providing new life
in the study of cognitive cartography, with new research in this domain being stimulated by the es-
tablishment of the International Cartographic Association Commission on Cognitive Visualization
(https://www.geo.uzh.ch/microsite/icacogvis/mission.html) in 2011.
The work discussed so far has focused on establishing a historical view of how cartographers
have modeled map evaluation research, as well as the roles of cognition and, to a lesser extent,
uncertainty in shaping the modeling process. Next, I consider literature that seeks to define the

7
methods and conditions for evaluating maps and map symbols. Map reading tasks, and the map’s
ability to help an individual complete these tasks, have been the most common factor in this map
and map symbol evaluation research.
Bertin (1983, originally published in French in 1967) used the concept of reading levels —
elementary, intermediate, and overall — to describe the difference between information about in-
dividual objects, subsets of objects, or all objects in a space. Complementary to consideration of
these reading levels, MacEachren (1982) notes that there have generally been three reading objec-
tives evaluated in the literature — value estimation, pattern identification, and pattern comparison;
Blok (2000) found that the latter two reading objectives were also used in map reading tasks deal-
ing with spatiotemporal information. These categories are based on thematic maps, but leave out
the world of reference maps. Board (1978) expanded on the objectives associated with reference
mapping (Figure 1.1) using three general categories of navigation, measurement, and visualization.
When combined, these two categorizations provide a broad profile of the possible objectives an in-
dividual using a map might have. The literature uses the term task to describe most of the symbol
evaluations. However, a distinction can be made between two high-level types of reading tasks:
those focused on the comprehension of a symbol’s meaning, and those focused on how a symbol
performs when used to accomplish an objective. This distinction is mirrored in the literature of
other disciplines, discussed in Section 1.3.2.

8
Fig. 1.1. Board’s (1978, pg. 6) taxonomy of map reading tasks.
Thematic map symbols have been a frequent object of evaluation, with a major focus on
the effective use of the different visual variables proposed by Bertin (1983), and later added to
by Morrison (1974) and MacEachren (1992, 2004). Visual variables are controlled to examine the
effects that changes have on an map reader’s ability to recognize or derive some value from a
symbol, measured as effectiveness (accuracy) and efficiency (speed). These metrics can be used to
make inferences about interpretive uncertainty (discussed in Section 1.4).
Of the three color components included in the extended list of visual variables (hue, value,
and saturation), color value consistently performs the best for discrimination and recognition.
Color hue, saturation, and value can also be useful for implying data value, and therefore useful in
comparisons (Crawford 1971; Gill 1988). Research has examined how different color scheme designs
9
should be used with different types of data for easier, more accurate perception (Brewer 1994), and
how different colors affect perception when next to each other (Brewer 1997).
The size of a symbol is most often associated with some sort of visual hierarchy or in
proportion to the value of some attribute of a feature. This makes the use of size especially suited
for comparison and estimation tasks. As a result, a variety of studies have been done to test the
perception of different size symbols. The foci of such studies have included: symbol discrimination
(Meihoefer 1969), value and size estimation (Crawford 1973), and models for measuring these tasks
(Chang 1977; Monmonier 1977).
Shape, much like color hue, has been shown to be most suitable for the discrimination and
recognition of different types of information (Slocum 1981). It has also been shown to be effective
at conveying value (Flannery 1971). Others have looked at how the design and structure of the
shapes in a symbol affect the readers cognitive processes and comprehension ability (Michaelidou
et al. 2005; Olson 1975). Shape is also a potentially useful tool for conveying complex relationships
in information. Researchers have varied shape (Klippel et al. 2009), and sometimes dimensionality
(Brewer & Campbell 1998), to communicate a complex attribute space to a reader.
As shown in Table 1.1, the questions asked about the use and variation of different visual
variables are often built on similar foundations (subsequent tables will present representative ques-
tions with other foci). Generally, these questions follow a basic form that: (1) identifies the map
reader’s objectives or tasks; (2) identifies a visual variable to isolate; (3) defines the metrics by
which to measure effectiveness; and (4) outlines any unique attributes employed by the symbol
that may affect the outcomes of an evaluation. The research discussed above focuses on a single set
of symbols. Others have successfully looked at two symbols or sets of symbols (MacEachren et al.
1998) using this same question structure.

10
Table 1.1. Research questions related to thematic mapping in cartography and GIScience.
Reference maps present a challenge to cartographers as a single map could be used for a
variety of tasks. They require a balance of information and aesthetic appeal, often restricted by an
external force that is contracting the creation of the symbols or map. Some maps, like tourist maps,
may offer flexibility in the style of symbols used in the map. Forrest & Castner (1985) and (Forrest
1998) assessed the comprehension of tourist map symbols, looking at the effects of abstraction,
shape, and other factors.
A restriction common to maps produced by governing bodies, such as governments, is the
adherence to a graphic standard. Gerber et al. (1990), Grant & Keller (1999), and Kostelnick et al.
(2008) examined how standards affected the the design and creation of symbols. Burden (1988) was
cited by Gerber et al. (1990) as one of the first cartographers to use a national standard (AS 2342)

11
to drive the process for designing and evaluating map symbols. Dymon (2003) developed a theoret-
ical framework for designing emergency map symbols for the Federal Geospatial Data Committee
(FGDC), and used it to create and evaluate such a symbol set, which eventually became an ANSI
standard (ANSI-INCITS-415-2006 2006). Akella (2009) performed an evaluation of point symbols
found in the FGDC Homeland Security Working Group’s Emergency and Hazard Management
Mapping Standards, symbols originally designed by Dymon, with firefighters in California. This
study, as well as studies by Wolff & Wogalter (1998) and Mayhorn et al. (2004), used open-ended
questionnaires to gather qualitative information about symbol interpretation. Such data can be an-
alyzed to understand how semantic distance, familiarity, or concreteness may affect interpretation
and introduce uncertainty during the interpretation.
Reference maps may also be designed, or even restricted, to use in a specific location. Levine
(1982) focused on the comprehension and perception of you-are-here maps, eventually providing
guidance on the design of these maps based on his empirical studies — to provide salient, coordi-
nated labels on maps and terrain, placing maps in asymmetrical or unique parts of the environment,
designing symbology to indicate map-terrain correspondence, aligning maps with the terrain, and
redundantly using these ideas as often as possible. Differences in comprehension based on environ-
mental context is another measure that can be used to examine interpretive uncertainty.
Reference maps are often used as a navigational aid. Blades & Spencer (1987) examined
the competency and confidence of individuals that were using reference maps as navigational aids.
Competency and confidence can be used to examine interpretive uncertainty, for example partici-
pants reporting confidence in their interpretation of a symbol.
The questions in Table 1.2 differ from those in Table 1.1 in two ways. First, the variations
in symbol design are examined differently between reference and thematic mapping. Second, the

12
amount of external context provided by the map or the environment differs between reference
and thematic mapping. As discussed above, reference mapping is often subject to restrictions from
external sources. For example, the symbols designed by Dymon (2003) strictly adhered to a graphic
standard, whereas symbols examined by Brewer & Campbell (1998) were able to more freely adapt
to the needs to the designers and data. External context is often provided as a component of user
studies involving reference maps, as they tend to be used for a wide variety of purposes (Forrest
& Castner 1985; Blades & Spencer 1987). In relation to context, Levine (1982) and Levine et al.
(1984) looked at context beyond what is displayed graphically on the map and included the context
provided in the physical environment. Purely thematic maps do not typically see the same variety
of use as reference maps, allowing designers to focus on a limited set of attributes or relationships
in the data without the need to provide a broader external context (Brewer & Campbell 1998;
MacEachren et al. 2012).
Table 1.2. Research questions related to reference mapping.

13
Digital and, to a lesser extent, mobile technologies have changed how symbols are designed,
created, and shared. Digital technologies have made maps and other geographic information more
accessible to the masses. They have also changed how symbols are used by individuals (Gale
2013; Robinson et al. 2012). These technologies allow for more flexible and powerful ways for
depicting characteristics of data. For example, modern digital systems offer control over image
opacity and provide a variety of blur algorithms, enabling the use and examination of the visual
variables transparency and fuzziness as a means of depicting error and uncertainty in the data
(Johnson & Sanderson 2003; MacEachren 1992; Pang et al. 1997; Pang 2001). Digital interfaces
have been shown to aid in visual reasoning by adding the capacity for dynamic interaction with
the data and representations (Lai & Yeh 2004; Slocum et al. 2000). Though this is not to say
that digital technologies do not impose restrictions. The physical size and screen resolution of
modern mobile devices has made the size and shape of graphics even more important to consider
(Stevens et al. 2013). The questions that drive research in digital and mobile mapping cover a
broad spectrum of topics, many of which examine how digital systems enable the communication
of uncertain information, see Table 1.3.

14
Table 1.3. Research questions about digital and mobile technology in cartography and GIScience.
While a primary focus of cartographers is on the design of symbols and maps, there is also
an interest in the methodologies used to evaluate symbols (Table 1.4). Researchers often look at
new methods for creating and evaluating symbols, or measuring the effectiveness existing methods
(Gerber et al. 1990; Robinson et al. 2011a; Roth et al. 2011).
Table 1.4. Research questions on methodologies in cartography and GIScience.

15
1.3.2 Other Fields
Outside of cartography, disciplines including psychology, human-computer interaction, er-
gonomics, and industrial engineering also study the interpretation of symbols, often referenced as
icons in this literature. At the core of many of these evaluations are the same focal points of
cartographic evaluations, comprehension and performance in a task (see Section 1.3.1). Compre-
hension is studied primarily from two aspects (see Table 1.5). First, from a theoretical standpoint,
researchers seek to understand the cognitive and human factors that contribute to comprehension
(Chan & Ng 2010; Handcock et al. 2004; McDougall et al. 2000; Ng & Chan 2007). This leads to
research questions involving the relationships between comprehension and concepts like articulatory
distance (Blankenberger & Hahnt 1991), semantic distance (Blankenberger & Hahnt 1991), context
(Ward et al. 2004), etc., similar to those shown in Table 1.5.

16
Table 1.5. Research questions related to comprehension testing in other fields.
Second, complementing theory-driven studies are studies and evaluations of a task-based
nature. Many of these studies also maintain a focus on the cognitive processes involved in in-
terpreting symbols. This literature uses objective measures to examine these processes, including
speed (Isherwood et al. 2007), accuracy (Mayhorn et al. 2004), precision, and certainty (Dessus &
Peraya 2007). As a result, the questions driving this research (Table 1.6) are designed primarily to
be answered using quantitative metrics, rather than the mix of quantitative and qualitative metrics
found in more design-oriented fields like cartography or graphic design. Some work looks at how
changes to interface design can be used to improve speed, accuracy, and precision (MacLean &
Enriquez 2003). Recognition, defined as an individual’s ability to find, identify, and comprehend
the meaning of a symbol in a context, is paramount in fields where personal safety is involved.

17
Researchers often use task-based evaluations to measure how changes in design or interface af-
fect recognition speed and accuracy (Campbell et al. 2004; Goonetilleke et al. 2001; Teghtsoonian
1965). Accuracy, in particular, is a very important aspect of interpretive uncertainty. However,
interpretive uncertainty in this research also considers the mental state of the person interpreting
the symbol. Accuracy and speed are not adequate for representing the mental state of the reader,
and so other methods must be used to complement these metrics (e.g. open-ended questionnaires,
see Dessus & Peraya (2007)).
Table 1.6. Research questions related to task-based evaluation in other fields.

18
Mobile devices have attracted more research attention in human-computer interaction (HCI)
and computer science (CS) than thus far in cartography and geography (Table 1.7). Mobile-
focused research in HCI and CS includes studies of design and interaction (Burigat et al. 2006;
Burigat & Chittaro 2011), of perception (Koutsourelakis & Chorianopoulos 2010), and of the
methods used to study each (Salman et al. 2010). The cartographic research discussed in Section
1.3.1 focused primarily on designing symbols to work in a mobile context (Stevens et al. 2013).
Mobile technologies have the potential of enabling more advanced research methods, such as the
eye tracking methods discussed in Section 1.4 (Coltekin et al. 2009, 2010).
Table 1.7. Research questions related to icons used on mobile devices in other fields.
Methodology is another important component of symbol evaluation research in fields outside
of cartography and geography (see Table 1.8). There are many papers examining the effectiveness
of symbol evaluation methodologies (Wogalter et al. 2006; Hicks et al. 2003), the evaluation of new
methodologies (Campbell et al. 2004; Cedilnik & Rheingas 2000; Gabbard et al. 1999; Handcock
et al. 2004), the effects of variables on methods (Salman et al. 2007, 2010, 2012), and, perhaps most
importantly, the ecological validity of some common methods (Lesch & McDevitt 2002; Wisniewski
et al. 2006). This work is often accompanied by empirical studies to test ideas.

19
Table 1.8. Research questions on methodologies from other fields.
1.4 Research Methods Used in Symbol Evaluation
This section presents the results from an analysis of research methods used to evaluate
symbols, both within and outside the fields of cartography and GIScence. Unlike Section 1.3,
which separated the research questions asked in cartography and GIScience from other fields, the
methods used to evaluate symbols are quite similar and are presented together. The section begins

20
by examining methods used to address the association between graphics and meanings, and then
moves on to look at methods for evaluating how symbols are used.
Questionnaires are far and away the most common method for examining the relationship
between a graphic and the meaning people associate with it. This method is used in cartography and
GIScience (Akella 2009; Andrade & Sluter 2012; Dymon 2003), psychology (Teghtsoonian 1965),
industrial and transportation safety (Campbell et al. 2004; Chan & Ng 2010; Handcock et al. 2004;
Lesch 2003, 2005; Ng & Chan 2007), and computer and information science (Blankenberger &
Hahnt 1991; Dessus & Peraya 2007). Generally speaking, there are two categories of questionnaires
used for this sort of evaluation, open-ended and multiple choice.
Open-ended questionnaires are the most prominent questionnaire method found in the re-
viewed articles, having been used by Akella (2009); Blankenberger & Hahnt (1991); Chan & Ng
(2010); Dessus & Peraya (2007); Handcock et al. (2004); Ng & Chan (2007) and others. This
method is typically used to study symbol comprehension, with the questionnaires taking one of
two forms. In the first form, a participant is presented with a graphic, most often a point symbol.
Alongside this graphic is a space where they are asked to describe the meaning they have derived
from this graphic (Akella 2009). In some instances there may be a word limit, though most of the
time there is not. In the second form, a participant is presented with a graphic, again it is most
frequently a point symbol. Alongside this graphic is a space where they are asked to describe the
various visual elements that they can see in the symbol, in the order that they notice them, without
associating a meaning with the symbol (Chan & Ng 2010). There are several possible metrics that
can be used with these questionnaires. Blankenberger & Hahnt (1991) used similarity, relatedness,
or agreement of the meaning associated with the symbol to the meaning that the designer intended.
Mcdougall et al. (1999) had participants rate a series of five symbol characteristics — concreteness,

21
visual complexity, meaningfulness, familiarity, and semantic distance. All of these metrics can be
used to make inferences about interpretive uncertainty. Relationships between the agreement of
meaning and familiarity, for instance, can explain why a symbol is interpreted with high certainty.
Nielsen (2005) and Sauro (2013) used a modification to the open-ended questionnaire in
their evaluations. In this modification, a symbol is shown to an individual then taken away after
some period of time, typically a second or so. After the symbol is removed the participant is asked
to write down the meaning of that symbol in a typical sentence structure, or to describe the symbol
using a series of words and phrases without making a sentence. The key metrics with this sort of
task are the accuracy (in relation to a predetermined meaning) and consistency of the meaning or
description associated with the symbol, with the length of time that the symbol was displayed being
a key experimental condition. Again, the relationships between the time that a symbol was shown
and the accuracy and consistency of the associated meaning enable researchers to make inferences
about the nature of interpretive uncertainty.
Some studies have adapted open-ended questionnaires for research related to interpretive
uncertainty. Dessus & Peraya (2007) used a method they called the “Iconometer”. Participants
were presented with an open-ended questionnaire and asked to associate meanings with symbols,
as well as their certainty, measured as a percentage, that the meaning they ascribed to the symbol
was the correct one. Similar methods have been employed in cartographic studies that go beyond
interpretation of symbol meaning to interpretation of map patterns. Harrower et al. (2000) used
open-ended questionnaires to measure the confidence participants had in their responses to ques-
tions asked during the evaluation of the EarthSystemVisualizer. Confidence data was compared
with logical consistency and the space, time, and attribute dimensionality of responses to make
inferences about the tools effectiveness and usability. While this study focused on evaluating a tool
22
rather than symbols, the analytic process used to assess and make inferences using this data can
be applied to studies focusing on interpretive uncertainty. Fish et al. (2011) asked participants to
use a three-level Likert scale to indicate their confidence that they answered one of three types of
questions related to detecting change in area symbols correctly. The use of the word confidence
is useful to consider. Confidence may illicit a more emotional response from participants, whereas
certainty may illicit a more pragmatic approach. MacEachren et al. (2012) asked participants to
rate the intuitiveness of different symbol sets (either illogical or logical) using a seven step dis-
crete visual analog scale, similar to a Likert scale but sequential instead of diverging. Wilkening &
Fabrikant (2011) asked participants to use a four-step rating scale to indicate their confidence in
their response to a slope detection task. This research sets a precedent for using ratings scales and
similar metrics to assess certainty or confidence in an interpretation of a graphic.
Multiple choice questionnaires used for symbol evaluation, like open-ended questionnaires,
generally come in one of two forms. In the first form, a participant is given a symbol. Alongside
this symbol is a series of potential meanings. Participants must then select the meaning from the
choices that they believe corresponds to that symbol (Lesch & McDevitt 2002). In the second
form, a participant is given a meaning and alongside this meaning is a series of symbols. The
series of symbols is either a collection of symbols representing the same referent, or a collection
of symbols representing different referents. Participants must then select the symbol that they
feel is the best representation of that meaning (Sauro 2013). The same metrics used with open-
ended questionnaires can be used with multiple-choice questionnaires, as can traditional statistical
analyses of correct and incorrect responses.
The use of multiple choice questionnaires has faced some resistance in the literature. Lesch &
McDevitt (2002), researchers working on various safety-related projects, argued that the multiple

23
choice method in the first form was invalid. Their main critique was that in a situation where
personal safety is a primary factor, i.e. industrial safety or transportation, an individual would not
be presented with a list of potential meanings for a symbol. Instead, an individual must identify
the symbol and either recall the meaning from memory or derive the meaning from the graphic.
This finding echoes the findings from an earlier study by Wolff & Wogalter (1998), and is supported
by future research from Garvey (2003) and Yu et al. (2012).
Task-based evaluations can be used for both understanding the effectiveness of symbols as
a tool for interacting with information, and for understanding how well symbols aid individuals in
the use of a tool. As shown by Board (1978), there are a considerable number of tasks that can
be evaluated, and this list increases as technology evolves. Some common examples of task-based
evaluation include visual search (Board 1973; Wolfe et al. 2011), comparison (Board 1973; Blanken-
berger & Hahnt 1991), measurement, and classification (Bianchetti et al. 2012; Roth et al. 2011).
More complex tasks can be defined by interacting with symbols in different ways, or interacting
with different symbols in series. Accuracy and speed are common metrics found in task-based
evaluations. Other metrics, like preference, can be used to supplement the accuracy and speed.
These metrics do not measure interpretive uncertainty directly, but can be used as indicators. A
faster completion or response time, for instance, could indicate that a participant is more certain
in their interpretation of a symbol.
Perhaps the most versatile aspect of task-based evaluations is their ability to supply a context
for the evaluation. Context includes the application domain, some defined purpose for the object
of evaluation, and participants from a potential pool of users (Isherwood et al. 2007; Sauro 2013),
as well as the geographic context, the place and features depicted on the map. Evaluating a symbol
in context is of the most importance, as it will determine how effective the symbol is at performing
24
its intended function. Evaluating a symbol out of context is useful for understanding how it might
function in a role outside its intended purpose, or how a symbol might be interpreted by different
groups. Two effective methods for evaluating symbols out of context are task-based evaluations in
a new or different application domain, or as part of a more complex simulation of events requiring
their use in different tasks.
Simulation of events and conditions is a particularly popular method for symbol evaluations
in fields like crisis informatics and industrial or transportation safety (Fitrianie et al. 2008), as
well as in some psychological research (Levine et al. 1984). The core purpose of a simulation is
to evaluate the performance of one or more technologies in an environment that mirrors reality as
closely as possible. Simulations are typically designed around a scenario, which provides a context
for the symbol evaluation. During the execution of the scenario, various events happen that need
to be dealt with by the participants. Often these events are dealt with as a series of tasks. This
means that simulation designers can design events that require specific tasks, which can, in turn,
be the subject of a task based analysis. The metrics for each scenario, event, and task vary, but,
at the core, the metrics commonly used to evaluate symbols in a simulation are the same as those
in a task-based evaluation — accuracy and speed. Simulations can be used to evaluate symbols
in stand-alone tasks, as part of a series of tasks, or using questionnaire methods before or after
a simulation. Gamification is becoming a popular mechanism for simulation-based evaluations,
with proven success in the crisis informatics domain. Fitrianie et al. (2008) used gamification as a
method for assessing an icon-based language for communicating crisis situations.
Task-based evaluations typically involve some aspect of using a symbol, see the discussion
above for more, but tasks can be more than just using the symbol (or map it is depicted on). Tasks
can focus on creating symbols when there are none, or when the existing symbols are ineffective.

25
Salman et al. (2007, 2010, 2012) used a method where participants were tasked with designing
symbols as well as evaluating them. They began by engaging their target audiences, giving them a
list of concepts and asking them to sketch out a design of each concept. These sketches were then
given to graphic designers, who condensed the common attributes of the various sketches into a se-
ries of symbols. Participants from the target audience were then reengaged and asked to complete
an evaluation of the symbols that included various questionnaire and task-based methods. The
result was a set of symbols that were well understood by a target audience, which in turn made for
more usable interfaces. A similar example is the Iconathon effort from the Noun Project (2011).
Iconathon events are held in cities across the United States and give designers, practitioners, and
developers an opportunity to come together and work on designing symbols that represent “univer-
sally recognized concepts”. Drafts of symbols are generated with input from those in attendance.
The designs are revised after the event using social media and social collaboration tools. These
types of methods, to the best of this author’s knowledge, have not been used in the cartographic
or GIScience communities.
The methods discussed above provide a means for studying the qualitative, quantitative, and
mixed methods for assessing interpretive uncertainty at the end of interpretation. Two methods
that can be used to look at the cognitive processes involved in interpreting a symbol during the
interpretation process are think- and talk-aloud protocols, and eye tracking. Think- and talk-aloud
protocols ask participants to verbalize their process, and the reasoning behind it (in think-aloud
methods only), for completing a task, and those verbalizations are recorded for later analysis
(Lewis & Rieman 1993). These protocols are an effective complement to task-based evaluations
or simulations. Gilhooly et al. (1988) used this method to look at differences in the abilities of
experienced and novice map readers to recall the details of contour and planometric maps. Perkins

26
& Gardiner (2003) also used talk-aloud protocols to collect extra data about the strategies employed
to read maps. Talk-aloud protocols have also been used by Kjeldskov & Stage (2004) to evaluate
the interfaces of mobile devices. A modification to the Harrower et al. (2000) experiment would use
talk-aloud protocols to supplement or replace the open-ended questionnaires that the participants
completed based on their experiences with the EarthSystemVisualizer application.
Another avenue for capturing data about cognitive processes is the use of eye tracking.
Eye tracking studies collect information on pupil diameter, number of times a participant’s eyes
fixate on a target, the duration of these fixations, and the saccades (rapid eye movements between
fixations) multiple times per second over the course of a trial (Coltekin et al. 2009, 2010). Using
these measures it is possible to derive where the participant was looking at a given time, and relate
this back to the cognitive processes that are driving their decisions during the completion of a task.
At present, the most common implementation of eye trackers involves external apparatuses, though
some have looked at how to use the cameras built into mobile devices for such purposes (Bulling
& Gellersen 2010; Drewes et al. 2007; Giannopoulos et al. 2012). The addition of think-aloud,
talk-aloud, or eye tracking methods would be very useful in helping to collect more detailed data
that may lead to new insights about the cognitive processes used to interpret or use a symbol.
1.5 Discussion and Conclusions
The research questions discussed in this paper were often not directly concerned with in-
terpretive uncertainty, though some aspects related to this uncertainty existed in most studies
reviewed. In particular, there has been considerable research into both quantitative (speed, accu-
racy, precision, etc.) and qualitative (self-reported confidence, certainty, etc.) measures of cognitive

27
processes involved in understanding a symbol. Many quantitative metrics, for example speed and
accuracy, do not directly measure interpretive uncertainty, but can be used to make inferences
about interpretive uncertainty. The qualitative measures, specifically participant-reported confi-
dence or certainty, provide a direct means of measuring uncertainty, but may not provide a clear
or consistent comparison across symbols or populations.
The methods discussed in this paper provide a baseline for enabling researchers to collect
data for these indirect measures. These methods were broadly categorized as relating to either
comprehension or performance. Methods for comprehension studies, in this paper, focused on
collecting data of a more qualitative nature, using open-ended and multiple-choice questionnaires
or card sorting categorization evaluations. Methods best suited for measuring performance tended
to focus on collecting quantitative data (i.e. speed and accuracy), using map reading tasks and
simulations. Think- or talk-aloud protocols and eye tracking equipment can be used to complement
and strengthen the analysis of both comprehension and performance evaluations. These methods
enable the analysis of second order effects of the interpretation process as it is happening (e.g.
pupillary response in relation to attention and cognitive load).
My contention, based on this review, is that interpretive uncertainty in relation to car-
tographic symbols cannot be measured by accuracy alone; requiring methods that capture the
quantitative metrics related to how effectively a symbol can be used by an interpreter (e.g. ac-
curacy, speed), as well as qualitative metrics capable of capturing and representing the mental
model of the interpreter throughout the interpretation process. When combined, these measures
can be used to identify the components of a symbol that cause interpretive uncertainty, allowing for
mitigation, and can be used to examine how interpretive uncertainty may affect other dependent
processes, such as decision making.

28
To showcase how an interpretive uncertainty study may be defined, I present a prototypical
symbol comprehension evaluation, and two variations on this example. This comprehension evalu-
ation uses the types of questions asked by Akella (2009) as part of a think-aloud protocol with eye
tracking. In this evaluation, participants are situated in front a computer display. The display is
equipped with eye tracking equipment with similar capabilities to Coltekin et al. (2009, 2010). A
proctor, seated next to them, is serving two functions: operating the audio recording system for
the talk-aloud protocol, and providing a sounding board to facilitate participant communication.
Point symbols will be displayed, one at a time, on the screen on a solid background (without a
map) at a very large size, for example 1000 pixels by 1000 pixels, and participants will be asked to
ascribe a meaning to each symbol. Rather than write down the meaning, participants would speak
their meanings aloud for the audio recording system to capture, including their thought process
while interpreting the symbol. During their dictation the eye tracking software will monitor their
gaze location, fixation points, and measure the length of fixations. Once a participant is satisfied
with the meaning they have derived, they are asked to recite the meaning completely, and indicate
their certainty that their meaning is the correct meaning using a one (1) to five (5) rating scale
(Cox III 1980).
Data from this evaluation would be analyzed in several ways: (1) the articulatory and
semantic distance between participant reported meaning; (2) a latent semantic analysis of the
transcribed audio recordings; (3) an analysis and comparison of the thought processes used by
participants; and (4) an analysis of the eye tracking data to identify the fixation points and correlate
them back to features of the symbols. Comparisons of data from different sources are used to develop
a picture of the greater interpretation process. Certainty values are compared with the results
from the latent semantic analysis and the articulatory and semantic distances. This comparison

29
highlights the relationship between the detail of a response and the certainty associated with it.
More detailed and/or succinct descriptions will likely correlate with greater certainty values. Eye
tracking data are combined with the audio recordings, providing insight into the participant’s
exact fixation point while they were describing some aspect of the symbol. The size of the symbols
displayed on screen allows the researchers to pinpoint the exact graphic element of the symbol a
participant was fixated upon at a given time. The characteristics of the description during each
fixation provides insight into the uncertainty associated with that graphical element, and with the
symbol as a whole. Detailed and/or succinct responses will correlate with graphical elements, and
therefore symbols, that are more easily interpreted, implying higher certainty. The complexity
of the thought processes described by participants at each fixation also enables inferences about
uncertainty. More complex thinking implies greater uncertainty, or perhaps greater interest (the
difference should be obvious from the articulations), while interpreting that graphical feature.
These relationships, fixations with description characteristics and fixations with thought process
complexity, are verified by comparing the generated inferences with the reported certainty values.
Following this analysis, a study would be run that places one point symbol at a time on a
map, at a more common size for point symbols, for example 24 pixels by 24 pixels, and participants
are asked to ascribe a meaning to that symbol. The map style would be controlled so that each
symbol is evaluated on three different map types, perhaps four depending on the number of symbols
being evaluated. The same combination of eye tracking and a proctor facilitated think-aloud
protocol used in the first study are also used in this study. Similarly, the same analytical methods
used in the first study are also applied to this study. These analyses are accompanied by analyses
that examine the relationships between map type and participant reported certainty values, the

30
relationship between fixation and description characteristics, and fixations and thought process
complexity.
A final study would vary the size of the symbols on top of the map type associated with
the highest certainty. The size of the symbols would be guided by various interface standards for
various digital platforms (see Apple (2014), Google (2014), and Microsoft (2014)). Again, the data
collection methods are the same as the first experiment, with the additional variable of symbol
size. The analysis of data from this study would also be the same as it was for the first study,
but include an examination of the relations between symbol size and participant reported certainty
values, the relationship between fixation and description characteristics, and fixations and thought
process complexity. When combined, these three studies provide insight into: (1) the characteristics
of interpretive uncertainty related to symbols in optimal viewing conditions; (2) the characteristics
of uncertainty related to symbols under varying map types and styles; and (3) the characteristics
of uncertainty related to symbols of varying size on a well-paired base map. These insights can
then be used to augment the design of symbols, or in further analyses of how individuals use point
symbols on maps.
Future work in this domain should seek to formalize a framework for evaluating interpretive
uncertainty. This framework should include: (1) a collection of methods to use in evaluations; (2)
the measures possible with each method in the collection; (3) the kinds of research questions each
method is capable of addressing; and (4) frameworks for analyzing collected data to appropriately
answer these research questions. Validation of the framework should be done using controlled,
human subject experiments, beginning with the core research methods discussed in this paper and
then building out to incorporate new methods enabled by technology or innovative thinking.
31
Chapter 2
A Taxonomy of Symbol Evaluation Methods
and Mobile Evaluation Tool
Practicing cartographers are often limited in the time and resources available to evaluate the
effectiveness of the symbols they design and use. Evaluation is a critical component for assessing the
effectiveness of a map symbol, but requires considerable effort to adequately design and execute.
This overhead can be reduced by providing cartographers with tools that aid in the design and
execution process. This paper presents a taxonomy of point symbol evaluation methods from the
perspective of a usability evaluation, and a prototype mobile application for performing evaluations
using these methods.
2.1 Introduction
Evaluation is critical to understanding cartographic symbol usability, comprehension, and
effectiveness. Unfortunately, the resource restrictions placed on practicing cartographers often
precludes formal evaluations during the map or symbol design process. In informal discussions
with cartographers at conferences and other venues, the factors that most restrict their ability to
conduct evaluations are time and cost. Formal evaluations are not trivial to design and execute,
often requiring as much or more time than the cartographer spent designing a symbol. The cost
of conducting a formal evaluation is limiting in two ways. Evaluations require human subject
participants, and often these participants are compensated for the time they spend evaluating a
symbol or map, potentially placing significant financial burden on the project (Heer & Bostock

32
2010; Bhowmick et al. 2008; Nielsen 1994a). Evaluations also consume overhead, both in the
billable hours required from the cartographer, and in the cost of creating or purchasing the tools
required to carry out the evaluation.
This paper presents research that aims to aid in mitigating the time and cost of conducting
symbol evaluations, thereby making it easier for cartographers to evaluate the symbols they create
and use in their maps. This research has two goals: (1) to define a taxonomy of evaluation methods
that can be used by cartographers to quickly identify the types of evaluations they should conduct
in order to understand how map readers will interpret their symbols; and (2) to create a prototype
for a free, open-source tool that cartographers can use to carry out evaluations using the methods
defined in the aforementioned taxonomy.
2.2 Related Work
Alonso-Rıos et al. (2009) developed a hierarchical taxonomy of usability topics to support the
development of systems using user-centered design methods. Their taxonomy categorizes topics into
six high-level categories (Figure 2.1). Knowability refers to an individual’s ability to “understand,
learn, and remember how to use a system”. Operability refers to a system’s ability to “provide
users with the necessary functionalities” and to adapt to the varying needs of users. Efficiency
refers to the system’s ability to transform inputs into outputs. Robustness refers to the system’s
ability to “resist error and adverse situations”. Safety refers to a system’s ability to “avoid risk and
damage derived from use”. Subjective satisfaction refers to the “feelings of pleasure and interest”
felt by individuals when using a system. High-level categories are further broken down into a series
of sub-categories (termed “sub-attributes” by the original authors). This categorization can be

33
translated from the view of system evaluation to that of symbol evaluation by restricting the scope
and culling the unrelated sub-attributes.
Fig. 2.1. A partial representation of the Alonso et al. (2010) taxonomy of usability topics.
Task-based evaluation is a common method for assessing symbol usability and effective-
ness, seeing use in cartography, psychology, industrial safety, and crisis informatics, among others
(Bianchetti et al. 2012; Board 1973; Fitrianie et al. 2008; Roth et al. 2011; Wolfe et al. 2011).
Board (1978) proposed a classification of map reading tasks (Figure 2.2). Board used three high
level categories — navigation, measurement, and visualization — to classify 18 unique map reading
tasks. Some tasks were placed in multiple categories, and others were expanded to define more
specific types of map reading tasks.

34
Fig. 2.2. Board’s (1978, pg. 6) taxonomy of map reading tasks.
Board’s classification was created in a time where creating and interacting with maps in a
digital environment was difficult, due to expense and availability. Modern digital mapping tech-
nologies make it easy to create and design interactive maps. Roth (2012, 2013) created a taxonomy
of primitives that defines the fundamental components involved when interacting with cartographic
information (Table 2.3). His taxonomy categorized these primitives into four main categories —
goals, objectives, operators, and operands. While not specifically designed for symbol evaluations,
the goal and objective categories are useful for defining tasks for evaluations.

35
Fig. 2.3. Roth’s (2012) taxonomy of cartographic interaction primitives.
The taxonomies developed by Board (1978) and Roth (2012) lend themselves to the eval-
uation of symbol performance in a task, often in a strongly practical sense. Complementing this
is the evaluation of how individual’s comprehend a symbol’s meaning. Comprehension is defined
as an individual’s ability to interpret a symbol, ascribe a meaning to that symbol, and make use

36
of that meaning to accomplish some goal. Methods for evaluating comprehension are discussed in
Section 2.3.1.
2.3 Taxonomy of Symbol Evaluation Methods for Mobile Devices
The first goal of this research is to develop a taxonomy of symbol evaluation methods that
acts as a tool to aid practicing cartographers and cartographic researchers in designing symbol
evaluations.
As discussed in Section 2.2, this taxonomy is derived from three prior taxonomies related
to usability and symbol evaluation. Alonso-Rıos et al. (2009) created a well-structured taxonomy
of topics in usability studies that can be adapted to the study of cartographic symbols. Their
taxonomy focused on the study of systems, specifically software, that focuses on six high-level
categories — knowability, operability, efficiency, robustness, safety, and subjective satisfaction. The
taxonomy presented in this section uses their taxonomy as a basis, but culls and modifies categories
to user terminology found in the cartographic symbol evaluation literature. I have retained the core
concepts from the knowability, operability, efficiency, and robustness categories (Figure 2.4). The
knowability category has been renamed to comprehension to better align with the terminology used
in cartographic research (see Akella (2009); Dymon (2003); Dessus & Peraya (2007); MacEachren
et al. (2012)).
The concepts represented by the categories safety and subjective satisfaction have been
worked into the other four dimensions. Public safety is often a focus of symbol designers, especially
in fields like crisis management and disaster response (Akella 2009; Robinson et al. 2011b, 2010).
Unlike the systems discussed by Alonso-Rıos et al., risk associated with interpreting a symbol is

37
not typically a direct result of the interpretation, but how an individual or group acted based on
their interpretations. Misinterpretation that may lead to risky actions is easily identified by study-
ing symbol comprehension. Similarly, cartographers aim to design symbols that are aesthetically
appealing to the map reader, as those that at not appealing are less likely to be used (Tractinsky
et al. 2000; Robinson et al. 2010). Aesthetic is also related to the ease with which a symbol is
comprehended (Forrest 1998). As such, the study of comprehension can be tailored to include the
study of subjective satisfaction, and can be further supplemented with methods from the study of
efficiency and robustness.

38
Fig. 2.4. A taxonomy of evaluation methods to address symbol usability. Each category and
sub-category of the taxonomy is represented as a rounded rectangle with fill. Each method in the
taxonomy is represented by an oval with fill. The colored shapes within the oval indicate which
sub-categories of the taxonomy can be assessed using that method. Black shapes indicate that the
methods can be used to study the entire category. Shapes for comprehension are shown on the
right of the oval, operability at the top, efficiency on the left, and robustness at the bottom.
39
2.3.1 Comprehension
The comprehension branch of this taxonomy (Figure 2.5) provides methods for assessing
how well a symbol is understood by a reader. This branch is based on the knowability branch from
the Alonso-Rıos et al. taxonomy. They used four sub-categories to define knowability: (1) clarity,
the “ease with which the system can be perceived by the mind and the senses”; (2) consistency,
uniformity and coherence within the system; (3) memorability, the ease with which an individual
can “remember the elements and the functionality of the system”; and (4) helpfulness, the “means
provided by the system to help” individuals make use of the system.
I have altered the this categorization to better suit cartographic symbol evaluation. The clar-
ity, consistency, and memorability sub-categories were retained with slightly different definitions.
Clarity relates to how easily a meaning can be derived from a symbol by a reader. Consistency
is the uniformity of the aesthetic and the coherence of meaning, especially when symbols are con-
sidered as a set. Memorability is the ability to recall the meaning of a symbol after previously
interpreting it. Helpfulness was removed as the helpfulness of a symbol is directly related to how
clearly it conveys meaning. Additional, interactive functionality that aids in conveying meaning,
such as tool-tips, are not considered a part of the symbol but part of the larger system in which
that symbol is used, although that are an example of a means to address helpfulness.

40
Fig. 2.5. The comprehension category of the symbol evaluation taxonomy.
Evaluating comprehension is a complex process that may involve qualitative and quantitative
methods. Qualitative methods are often used to gauge symbol comprehension (Akella 2009; Dymon
2003; Bianchetti et al. 2012; Roth et al. 2011; Chan & Ng 2010). Other methods that collect more
quantitative data have been used to understand and asses comprehension. These methods include
multiple choice questionnaires, heuristic evaluation, and classification tasks using card sorting.
Each is described briefly below.
Open-ended questionnaires take one of two forms and can be administered electronically
or on paper. In the first form, Participants are presented with a symbol and asked to ascribe a
meaning to it as it would be found in a dictionary (see Akella (2009); Blankenberger & Hahnt
(1991); Chan & Ng (2010); Dessus & Peraya (2007); Handcock et al. (2004); Ng & Chan (2007)).
In the second form, Participants are presented with a symbol and asked to list as many words or

41
phrases as possible that they would associate with the symbol without giving a dictionary-style
meaning for that symbol (see Sauro (2013)).
Multiple-choice questionnaires (see Lesch & McDevitt (2002) and related work from Clarke
(1989) and Dobson (1974)) also take one of two forms and can be administered on paper or elec-
tronically. In the first form, participants are presented with a symbol and a list of meanings, and
are asked to choose the meaning that best fits the symbol. In the second form, participants are
presented with a meaning and a list of symbols, and are asked to choose the symbol that best fits
the meaning. In the third form, symbols are presented alongside a meaning and participants use
ranking and rating scales, for example Likert scales (Likert 1932), to indicate their attitude toward
or agreement with the pairing. This third method may also be considered a form of heuristic
evaluation, if the participants are considered experts (Nielsen 1994b,c).
Card sorting (Roth et al. 2011), and can be done using either open- or closed-category
methods (Bianchetti et al. 2012; Cooke 1994; Goldstone 1994; Kelly 1970; Spencer 2009). In open-
category classification, the participants are free to define their own groupings and may edit these
groupings as they sort though the symbols. In closed-category classification, the groupings are
defined by the researcher and cannot be changed by the participants. Bianchetti et al. (2012)
have shown that combining open- and closed-category classification is useful for understanding how
symbol sets work as a whole.
Assessing comprehension based on the data collected from these methods requires two def-
initions, a ground truth definition provided by the symbol designer, and a candidate definition
provided by potential readers of this symbol. These two definitions are compared to determine
overall comprehension.

42
Data collected from open-ended surveys and card sorting tasks are best suited to analysis
of the similarities and agreement in associated meanings. One method for analysis of this data is
to code the meanings ascribed by participants (Auerbach & Silverstein 2003; Basit 2003; Miles &
Huberman 1994), indicating if they agree with the ground truth definition. A more quantitative
analytical approach may use methods like articulatory and semantic distance (Blankenberger &
Hahnt 1991), latent semantic analysis (LSA) (Dumais 2004; Dessus & Peraya 2007), or latent
Dirichlet allocation (LDA) (Blei et al. 2003). Articulatory and semantic distance are measures of
the similarity in the syntactic representation of concepts and topics text. Distance is measured
as the shortest path linking the syntactic representation from a participant to that of the ground
truth definition. LSA is used to determine the concepts found in a text. It is especially useful for
long form text, but could be adapted to analyze this data by combining all of the definitions into a
single document. LDA is modeling technique used to derive the topics discussed in a text or series
of texts using a Bayesian statistical model with a Dirichlet prior probability distribution. LDA uses
this distribution to attribute the existence of each word in the text to some specific but unobserved
topic. The concepts and topics identified by LSA and LDA can then be compared with the ground
truth definition to determine similarity.
Data collected during evaluations involving multiple choice questionnaires and closed-category
card sorting tasks are most appropriately analyzed using quantitative methods. Questions and clas-
sifications may have only one correct answer in the eye of the researcher (Lesch & McDevitt 2002).
The best result in this case is one where all participant responses match the correct answer, or
where they meet some threshold for the proportion of correct responses. Some incorrect answers
may be similar to the correct answer and participants may tend to select wrong answers more often
than the correct answer. In this case, analyses similar to those used for open-ended methods can

43
be applied to the comments participants make about their choices, enabling some understanding of
the reasoning process and possible misunderstandings. Questions may also have multiple correct
meanings, a practice that would be common in finding the symbol that is preferred by participants,
or in cognitive studies that look at the interaction of symbols and cognitive processes (Bianchetti
et al. 2012; Roth et al. 2011). In the former, inter-participant metrics would be used to find the
symbol or symbols that are most often selected by the participants, which may indicate the best
symbol to use for a map targeting that population. An analysis of the latter would likely require
additional data from a think- or talk-aloud study (discussed in Section 2.3.2).
The success of a symbol is sometimes difficult to gauge. Some standards have been devel-
oped to assist designers in assessing symbols used by governments (ANSI-Z535.3 2007; AS-2342
1992), typically using 80% as the threshold for the proportion of participants that correctly inter-
preted a symbol. Symbols that are unsuccessful are considered either ambiguous, having multiple
meanings, or vague, having insufficient detail to ascribe a sufficiently specific meaning (Kennedy
2011). Ambiguous symbols would be typical of participant responses that consistently produce:
(1) multiple semantically similar but different meanings in the ascribed definitions or groupings;
(2) have multiple, distinct clusters of highly semantically related words in the provided definitions
or groupings; or (3) refer to a large number of semantically different but relate-able concepts or
topics in the results from LSA or LDA. Vague symbols would be those where participants failed to
provide sufficiently detailed definitions to match the ground truth definition.

44
2.3.2 Operability
Operability, from the perspective of Alonso-Rıos et al. (2009), is related to a system’s ability
to provide some functionality to an individual, and in turn adapt to their changing needs. In
essence, it is a measure of how well something works. Symbols differ greatly in that they do not
inherently do work, but are used in the process of doing work. Therefore, the operability of a
symbol or symbol set must be measured differently than the operability of a system.
I have included four sub-categories of operability in this taxonomy — accuracy, precision,
completeness, and flexibility (Figure 2.6). Accuracy is a measure of how close participant perfor-
mance is to some expected or ground truth value when using some symbol. Precision is a measure
of the similarity in the performance of the participants in the pool when using a symbol. I propose
that completeness can be thought of in two ways: (1) the breadth of tasks supported by a symbol
or symbol set; or (2) the breadth and depth of geographic features that can be conveyed using a
symbol set. Flexibility is the variety of different types and styles of maps that a symbol or symbol
set can be used with, for example a map of areas affected by a natural disaster compared with a
tourist map of pretzel factories in Lancaster County, PA.

45
Fig. 2.6. The operability category of the symbol evaluation taxonomy.
Evaluating symbol operability is, by its very nature, rooted in the use of task-based evalua-
tion methods; such evaluations have been used extensively (Salman et al. 2007, 2010, 2012; Nelson
2000; Bianchetti et al. 2012). Task-based evaluations are defined using three components: a tar-
get symbol or set of symbols, an objective or goal, and a prompt that triggers a participant to
accomplish that goal by using the symbol in some specified way. As cited above, Board (1978)
listed three high-level objectives in his classification of map reading tasks — navigation, measure-
ment, and visualization. Roth (2012) draws a distinction between goals and objectives, listing
three goals — procure, predict, and prescribe — and five objectives — identify, compare, rank,
associate, delineate. Board and Roth also describe a series of 18 and 7 tasks, respectively, that
can be used to evaluate symbols. Providing an exhaustive list of all possible permutations of tasks

46
for evaluating symbol operability would be useful, but is beyond the scope of this research, which
focuses on an overarching taxonomy, not a delineation of all possible tasks. This section discusses
a distilled list of tasks, their instantiation in user studies, and metrics that cover the breadth of
operability. The specific tasks discussed include: (1) search tasks, and their derivatives counting,
location, and identification tasks; (2) comparison tasks, and their derivatives, including contrasting
and discrimination tasks; (3) measurement tasks, and their derivatives, including estimation and
derivation tasks; and (5) ordering tasks.
Search tasks follow a simple premise; the participant is presented with a map and asked to
find a specific feature (Board 1973). In some versions, the researchers show a participant an image
of the symbol that they are to find, then show them a map populated with a variety of symbols,
one of which is the symbol they were asked to find. In other versions, researchers describe the
symbol in text, either as a definition or a description of the symbol’s graphical elements, instead
of presenting the participant with an image. Search tasks that show an image of the symbol prior
to the start of the task can be used to assess efficiency. The metrics for assessing efficiency are
discussed in Section 2.3.3. Search tasks that provide textual descriptions are used to assess accuracy
and precision. Accuracy is measured by the target symbol hit-rate, the number of times the target
symbol is found in across trials.
Precision is sometimes difficult to measure directly. Hierarchical symbol sets provide a
natural structure to measure precision, where a symbol selected closer to the terminal points on the
hierarchy are by definition more precise. When symbol sets do not provide these natural measures,
it is possible to make inferences about precision by combining metrics. One way of making inferences
about precision is to examine the consistency with which a symbol is chosen when participants are
given a textual description. Greater consistency in participant selection implies greater precision.

47
Another way of making inferences about precision involves a combination of metrics from search
tasks with methods for assessing cognitive load (discussed in Section 2.3.3). When combined, these
methods will show imprecision in the definition or symbol design based on the amount of cognitive
load experienced by the participant prior to finding a symbol. Symbols that require higher cognitive
load to produce an accurate result may be insufficiently precise.
Search tasks may also include multiple instances of the target symbol on the map. In such
cases, there are several possible directives that can be provided to the participant. One common
directive is to count the number of target symbols that appear on a map that contains a variety of
other symbols. Prior to starting the task, participants are either shown the target symbol exactly
as it will appear on the map, or given a textual description. Counting tasks follow the same pattern
as search tasks in relation to how participants are introduced to the target symbol and the metrics
used to assess performance. Researchers may vary counting experiments by choosing to either
hide or show the total number of symbols to count, and the number of symbols counted thus far
(Wolfe et al. 2011; Reijnen et al. 2013). Accuracy and precision are assessed in the same fashion
in counting tasks as they are in search tasks, but also include the information on the number of
symbols found compared to the total number to find. A high hit-rate on counting tasks is indicative
of visually distinct (and therefore easy to find) symbols that accurately and precisely match the
provided definition.
Location tasks are a variation on search tasks useful in assessing symbol accuracy, precision,
and flexibility. In a location task, the participant is shown a map with symbols, one of which is the
target symbol, this target symbol is described using spatial relationships to other map objects along
with the definition for the symbol or a description of its appearance (Board 1973). For example,
a participant is presented with a reference map and asked to locate the gas station on the corner

48
of 7th Avenue and Pine Street. Accuracy and precision in location tasks are measured in the same
way as search tasks, and these measures can be used to make similar inferences.
A variation on the search task similar to the location task is the identification task, which
can be used to assess all aspects of operability. Identification tasks ask participants to describe
the geographic feature at a location without giving a description of the symbol itself (Board 1973).
Such tasks rely heavily on the spatial relationships between map objects to define the search
parameters. For example, a participant is presented with a reference map that shows roadways and
buildings, with point symbols delineating different types of buildings. The participant is then asked
to identify what is found in the northeast quadrant of the intersection of 5th Avenue and Main
Street. Data collected during an identification task is either free form text or answers to multiple
choice questions. These data should be analyzed using the methods similar to those used to assess
open-ended and multiple-choice questionnaires (see Section 2.3.1). The accuracy and precision of
participant responses can be used to make inferences about the completeness of a symbol set. More
accurate and precise responses would indicate more complete symbols sets, whereas the opposite
would identify gaps that need to be filled.
Symbol flexibility can be measured in the same way by search tasks and its derivatives,
counting, location, and identification tasks. All require a base map. By systematically varying the
combination of base map style and symbol style, researchers can identify which pairs work best
together by examining the relationship between pairing and the accuracy and precision data.
Comparison tasks ask participants to compare two or more symbols based on the value of
some common attribute (Board 1973). The data collected during these tasks is useful in assessing
completeness, accuracy, and precision. The general form of comparison tasks asks participants to
compare symbols regardless of the type of feature they represent or their aesthetic. Researchers

49
may specify the exact aspects to compare, or they may ask for comparison of all aspects of the
symbols, including similarities and differences in design, style, the attributes represented, and the
importance of each attribute. There are two more specific forms of comparison tasks. Contrasting
tasks focus on comparing the differences between two or more symbols that represent different kinds
of geographic features. These studies are useful for highlighting how the attributes of a geographic
feature influence the design of a symbol. Discrimination tasks focus on comparing the differences
between two or more symbols that represent the same type of geographic feature. These studies are
useful for understanding how different design styles influence a participant or population’s ability
to make use of a symbol. Data is typically gathered using free form responses similar to open-
ended surveys (see Section 2.3.1). As such, some of the same analyses are useful for understanding
participant responses, including hand coding and LDA. Similar, high detail responses across the
participant pool are indicative of a symbol or symbol set that is sufficiently complete to support
accurate and precise comparison. These data could also be used to identify gaps in the types of
geographic features that a set covers, or an area that the set could do a better job of covering,
especially when combined with data from comprehension methods.
Measurement tasks are tasks where participants are asked to determine some value about a
geographic feature by interpreting a symbol (Board 1973). These tasks are used to assess accuracy
and precision, and include the process of either deriving or estimating a value. Derivation is the
process of extracting an exact value, either using purely visual and cognitive process, or with the
assistance of some tool. Estimation is the process of inferring an approximate value using visual and
cognitive processes, though this process may be aided by graphic cues (e.g. visual benchmarks, see
Harrower (2002)). For the purposes of this taxonomy, only the attributes of the feature represented
in a symbol are measured. As such, distances between two symbols are not considered as they do
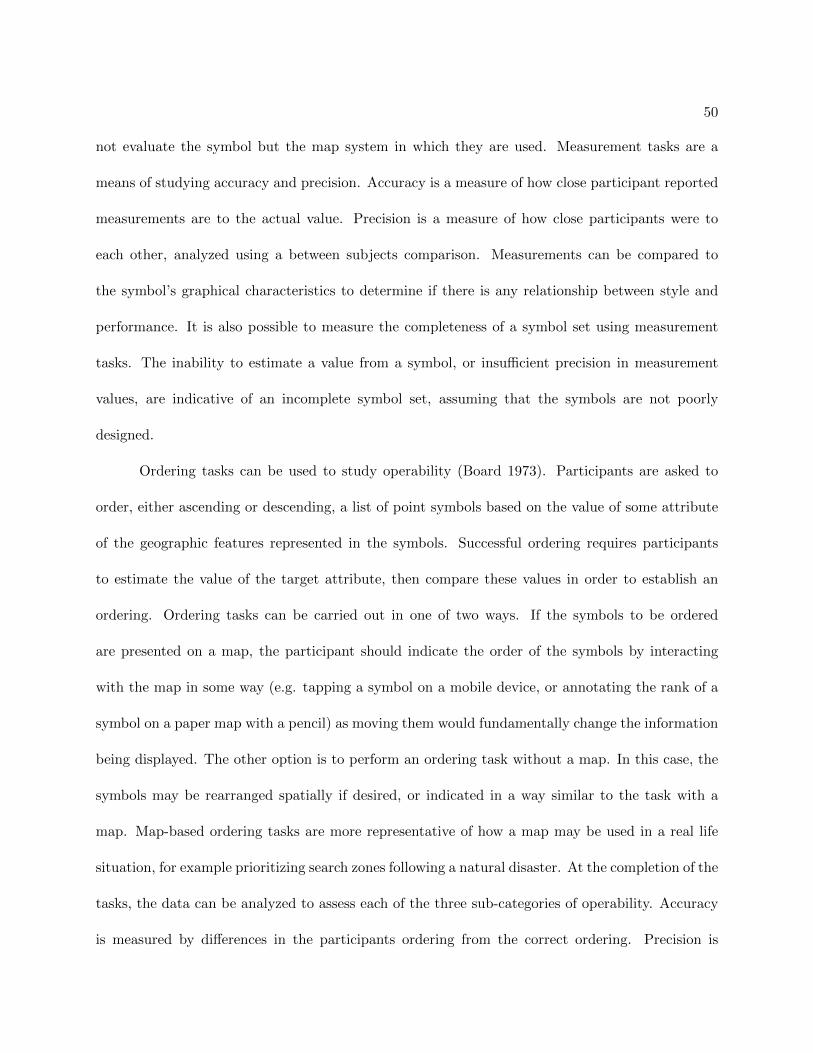
50
not evaluate the symbol but the map system in which they are used. Measurement tasks are a
means of studying accuracy and precision. Accuracy is a measure of how close participant reported
measurements are to the actual value. Precision is a measure of how close participants were to
each other, analyzed using a between subjects comparison. Measurements can be compared to
the symbol’s graphical characteristics to determine if there is any relationship between style and
performance. It is also possible to measure the completeness of a symbol set using measurement
tasks. The inability to estimate a value from a symbol, or insufficient precision in measurement
values, are indicative of an incomplete symbol set, assuming that the symbols are not poorly
designed.
Ordering tasks can be used to study operability (Board 1973). Participants are asked to
order, either ascending or descending, a list of point symbols based on the value of some attribute
of the geographic features represented in the symbols. Successful ordering requires participants
to estimate the value of the target attribute, then compare these values in order to establish an
ordering. Ordering tasks can be carried out in one of two ways. If the symbols to be ordered
are presented on a map, the participant should indicate the order of the symbols by interacting
with the map in some way (e.g. tapping a symbol on a mobile device, or annotating the rank of a
symbol on a paper map with a pencil) as moving them would fundamentally change the information
being displayed. The other option is to perform an ordering task without a map. In this case, the
symbols may be rearranged spatially if desired, or indicated in a way similar to the task with a
map. Map-based ordering tasks are more representative of how a map may be used in a real life
situation, for example prioritizing search zones following a natural disaster. At the completion of the
tasks, the data can be analyzed to assess each of the three sub-categories of operability. Accuracy
is measured by differences in the participants ordering from the correct ordering. Precision is

51
measured by performing a between-subjects comparison of participant responses. Completeness
is measured by looking for systematic issues when ordering the symbols as a set; specifically the
inability to order symbols due to insufficient precision or the symbols’ inability to convey the value
of an attribute. Flexibility can be measured as the ability for a participant to order the symbols
on a given style of base map, providing insight into the number of mapping contexts in which the
symbols would be useful. Ordering tasks may also be a useful way of assessing the comprehension
of symbols.
2.3.3 Efficiency
Efficiency complements operability by measuring how easily work can be done. Efficiency is
broken down by Alonso-Rıos et al. (2009) into four sub-attributes, human effort, execution time,
resources, and economic cost. Of these, only human effort and execution time are relevant to
symbol evaluation (Figure 2.7). Human effort is the actual physical and mental energy required
to use something, in this case a symbol. Execution time, in the computer science domain, is
the time needed for a user to send a command to the system and for the system to execute a
command. Symbols do not have a directly analogous concept, but the time required to interpret
a symbol may make the difference in its usability. In the cartographic literature, two terms are
used to express this measurement of this time, reaction time for very short time (e.g. milliseconds)
and response time for longer times. I have chosen to use the term interpretation time in this
taxonomy, as it is a single term that can cover both reaction and response times. The “tied up
resources” category used by Alonso-Rıos et al. is a reference to the amount of computational
resources used by a system (e.g. processor time, memory, disk space). Symbols do not require

52
these types of resources once displayed, and so the category was dropped. Unlike computational
systems, which constantly consume electricity and often require more storage space, symbols do
not have a significant economic cost aside from the cost of designing and publishing them. As a
result, the “economic costs” category was also dropped.
Fig. 2.7. The efficiency category of the symbol evaluation taxonomy.
Much like operability, efficiency is measured using a task-based evaluation, including search
tasks, counting tasks, location tasks, identification tasks, measurement tasks, and ordering tasks.
Section 2.3.2 discusses these task-based evaluations, as well as the specifics for setting up such
evaluations. These tasks are easily adapted to the study of efficiency by adding a mechanism for
measuring participant speed in completing the task. This mechanism is often provided by the
evaluation platform, especially when using digital systems. Interpretation time is measured as

53
either the total time to complete the entire task, or the time to complete the various steps required
to complete a task. Greater interpretation times, in this sense, are indicative of symbols that are
easier to find, measure, or compare. Tasks often require some amount motor movement in order for
participants to complete a them. As a result, evaluations must be designed to minimize the motor
movement time in order to provide a better measurement of the cognitive and visual processes at
work. Interpretation time can also be used as a metric to measure comprehension. In this case,
more comprehensible symbols would, in general, take less time to interpret.
The other half of efficiency is the human effort portion. A complete understanding of hu-
man effort requires two components, the physical energy and the mental energy expended by the
individual. Physical energy can be measured using a variety of techniques, including biometric
sensors and the measurement of interpretation time (as lower times would correlate to less energy
expended, assuming a linear energy expenditure rate). Mental, or cognitive, effort is somewhat
harder to measure. Two methods that provide some insight into cognitive effort useful in symbol
evaluations are think- or talk-aloud protocols, and eye-tracking (Paas et al. 2003; Lewis & Rie-
man 1993). These methods can be used to complement other evaluation methods discussed in this
research.
Think- and talk-aloud protocols ask participants to verbalize the process, and the reasoning
behind it (in think-aloud methods only), for completing some activity, and those verbalizations
are recorded for later analysis (Lewis & Rieman 1993). Recording can be done by a stenographer
or using an audio-video recording device, depending on the needs of the researcher. The data
collected using these protocols provide insight into the thought process of individual’s as they
are interacting with a symbol. This makes them a useful addition to both comprehension and
task-based evaluations (Gilhooly et al. 1988; Perkins & Gardiner 2003; Kjeldskov & Stage 2004;
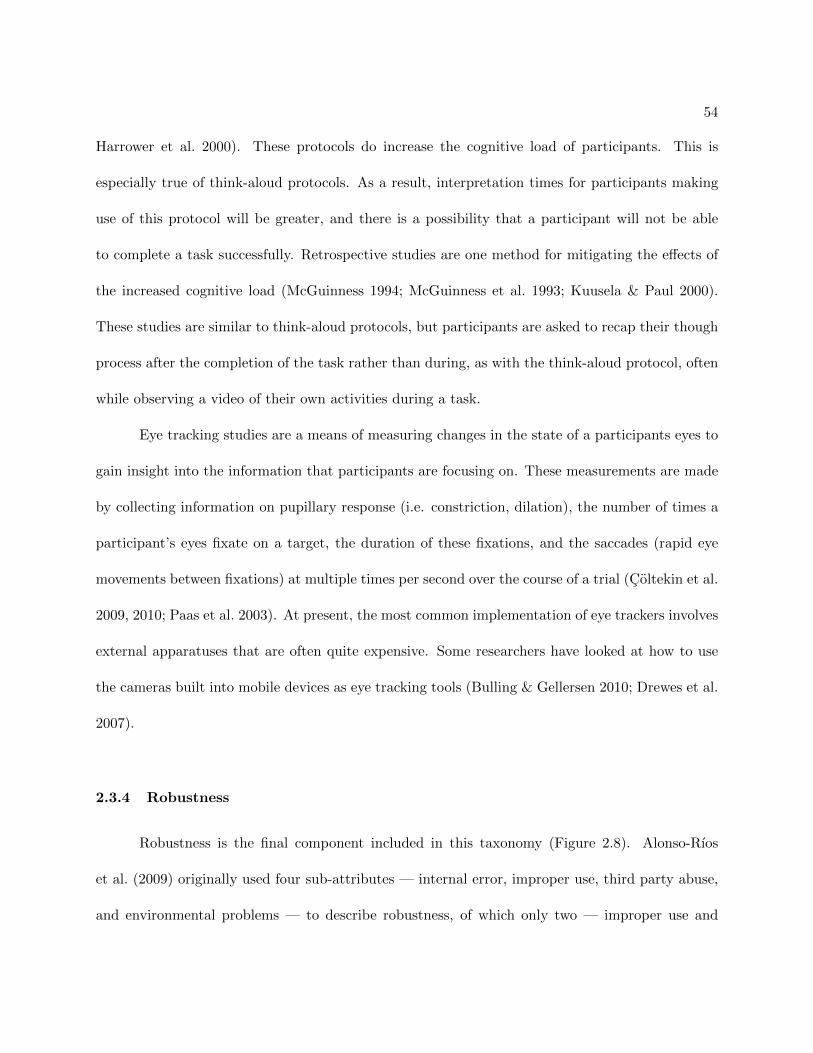
54
Harrower et al. 2000). These protocols do increase the cognitive load of participants. This is
especially true of think-aloud protocols. As a result, interpretation times for participants making
use of this protocol will be greater, and there is a possibility that a participant will not be able
to complete a task successfully. Retrospective studies are one method for mitigating the effects of
the increased cognitive load (McGuinness 1994; McGuinness et al. 1993; Kuusela & Paul 2000).
These studies are similar to think-aloud protocols, but participants are asked to recap their though
process after the completion of the task rather than during, as with the think-aloud protocol, often
while observing a video of their own activities during a task.
Eye tracking studies are a means of measuring changes in the state of a participants eyes to
gain insight into the information that participants are focusing on. These measurements are made
by collecting information on pupillary response (i.e. constriction, dilation), the number of times a
participant’s eyes fixate on a target, the duration of these fixations, and the saccades (rapid eye
movements between fixations) at multiple times per second over the course of a trial (Coltekin et al.
2009, 2010; Paas et al. 2003). At present, the most common implementation of eye trackers involves
external apparatuses that are often quite expensive. Some researchers have looked at how to use
the cameras built into mobile devices as eye tracking tools (Bulling & Gellersen 2010; Drewes et al.
2007).
2.3.4 Robustness
Robustness is the final component included in this taxonomy (Figure 2.8). Alonso-Rıos
et al. (2009) originally used four sub-attributes — internal error, improper use, third party abuse,
and environmental problems — to describe robustness, of which only two — improper use and

55
environmental problems — are relevant to the evaluation of symbols. Improper use of a symbol is
a serious concern, especially when symbols are used in the context of industrial or public safety. I
have chosen to replace environmental problems with the term context in this taxonomy, in order
to be more consistent with cartographic literature (Forrest & Castner 1985; Levine et al. 1984).
Context encompasses physical, cultural, and domain specific factors that may influence the use of
symbols. Though it may be impossible to eliminate problems related to improper use and context,
a robust symbol or symbol set will mitigate their effects. In the domain of systems, robustness to
internal error is the system’s ability to adapt and recover from errors related to processing data
and commands. Similarly, robustness to third party abuse is a reference to the system security,
specifically the ability to stop external sources from exploiting the system data and functionality in
a way that would harm the user. Map symbols are not capable of suffering from errors related to
processing data or commands, nor are they responsible for system security. As such, I have chose
to remove these categories.

56
Fig. 2.8. The robustness category of the symbol evaluation taxonomy.
Symbols are often multiple-purpose, serving different roles and enabling different activities.
Context is the combination of the map, reader, environment, and culture (Isherwood et al. 2007;
Sauro 2013). Varying any one attribute will change the context in which the map is being used.
Every map and every symbol is designed to function within a specific context. The scope of this
context could be as specific as designing a symbol set for the American Red Cross to denote
to location of blood drive centers in New York City, or as broad as the official administrative
boundary maps published by the United States Department of State. Evaluations can be done
either in context or out of context, based on whether or not the context of the evaluation matches
the context defined by the designer of the symbols. When evaluations are done out of context the
symbols may be incomprehensible, confusing, or otherwise ineffective at conveying information to
a map reader. The effects of context are can measured using qualitative and quantitative methods
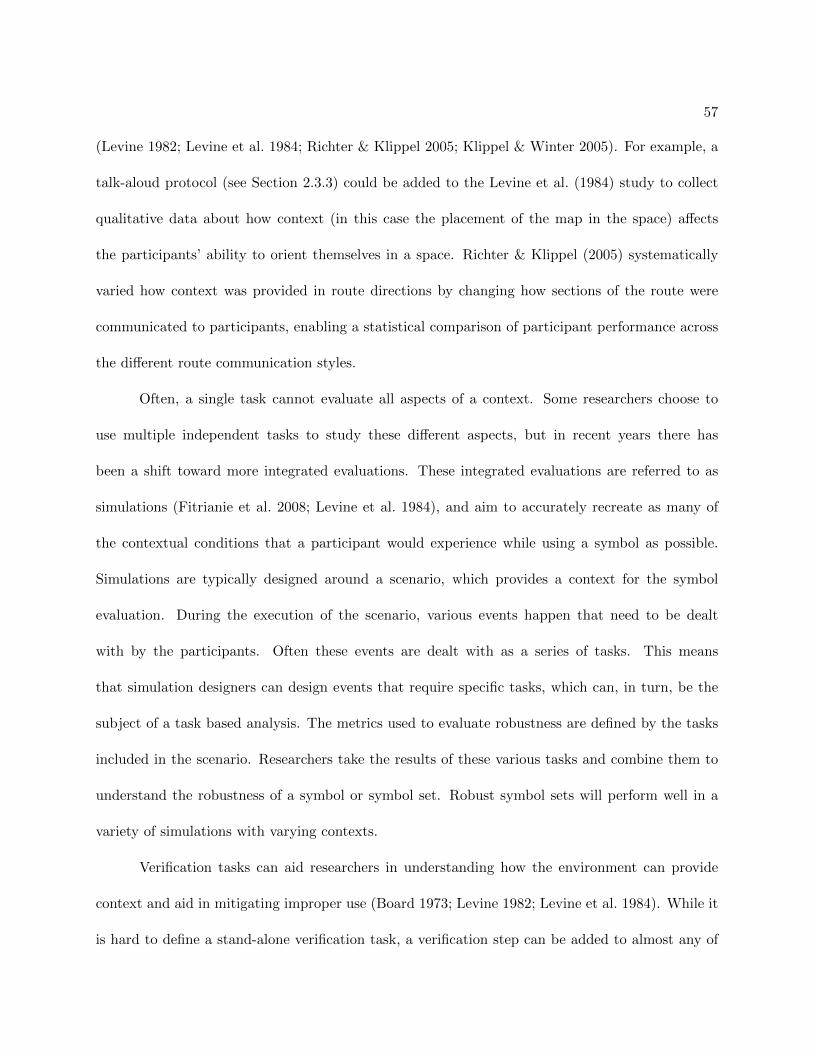
57
(Levine 1982; Levine et al. 1984; Richter & Klippel 2005; Klippel & Winter 2005). For example, a
talk-aloud protocol (see Section 2.3.3) could be added to the Levine et al. (1984) study to collect
qualitative data about how context (in this case the placement of the map in the space) affects
the participants’ ability to orient themselves in a space. Richter & Klippel (2005) systematically
varied how context was provided in route directions by changing how sections of the route were
communicated to participants, enabling a statistical comparison of participant performance across
the different route communication styles.
Often, a single task cannot evaluate all aspects of a context. Some researchers choose to
use multiple independent tasks to study these different aspects, but in recent years there has
been a shift toward more integrated evaluations. These integrated evaluations are referred to as
simulations (Fitrianie et al. 2008; Levine et al. 1984), and aim to accurately recreate as many of
the contextual conditions that a participant would experience while using a symbol as possible.
Simulations are typically designed around a scenario, which provides a context for the symbol
evaluation. During the execution of the scenario, various events happen that need to be dealt
with by the participants. Often these events are dealt with as a series of tasks. This means
that simulation designers can design events that require specific tasks, which can, in turn, be the
subject of a task based analysis. The metrics used to evaluate robustness are defined by the tasks
included in the scenario. Researchers take the results of these various tasks and combine them to
understand the robustness of a symbol or symbol set. Robust symbol sets will perform well in a
variety of simulations with varying contexts.
Verification tasks can aid researchers in understanding how the environment can provide
context and aid in mitigating improper use (Board 1973; Levine 1982; Levine et al. 1984). While it
is hard to define a stand-alone verification task, a verification step can be added to almost any of

58
the tasks discussed in Section 2.3.2. By adding this verification step, researchers can expect that
the quality (accuracy, precision, detail, etc.) of participant responses will improve. Depending on
the type of device being used to present the symbol in the evaluation, participants may be able
to use precise built-in sensors, like GPS or an accelerometer, to verify their position, the position
of other geographic features, and potentially the attributes of geographic features. This would be
useful, for example, when examining or verifying the interpretations of a symbol set designed for
describing the facilities of a park. If a participant encounters a symbol that they are unsure of,
they can use the GPS to guide them to the nearest facility represented by that symbol and verify
the meaning with the physical environment.
2.4 Prototype Mobile Application
The second purpose of this research was to develop a prototype application that enables
researchers to conduct evaluation of their symbols on mobile devices. Mobile devices were chosen as
the target device due to their availability, familiarity to many users, and the breadth of sensors and
interactions included with these devices. The resulting prototype is called Sympol, an application
that makes symbol evaluation simple. This section discusses Sympol in more detail, including the
design and feature requirements, the current implementation, and plans for future development.
2.4.1 Design and Feature Requirements
The Sympol prototype was designed to meet six requirements. These requirements were
used to define the key features of Sympol, and aid in creating a road-map for development.
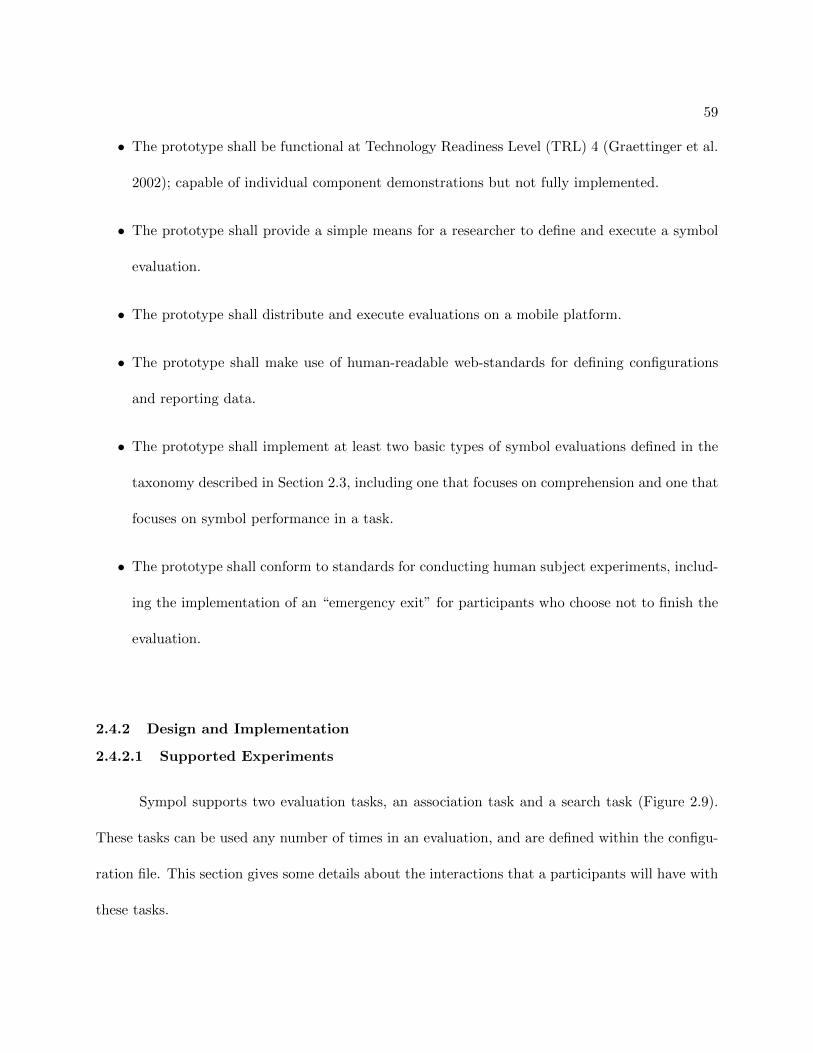
59
• The prototype shall be functional at Technology Readiness Level (TRL) 4 (Graettinger et al.
2002); capable of individual component demonstrations but not fully implemented.
• The prototype shall provide a simple means for a researcher to define and execute a symbol
evaluation.
• The prototype shall distribute and execute evaluations on a mobile platform.
• The prototype shall make use of human-readable web-standards for defining configurations
and reporting data.
• The prototype shall implement at least two basic types of symbol evaluations defined in the
taxonomy described in Section 2.3, including one that focuses on comprehension and one that
focuses on symbol performance in a task.
• The prototype shall conform to standards for conducting human subject experiments, includ-
ing the implementation of an “emergency exit” for participants who choose not to finish the
evaluation.
2.4.2 Design and Implementation
2.4.2.1 Supported Experiments
Sympol supports two evaluation tasks, an association task and a search task (Figure 2.9).
These tasks can be used any number of times in an evaluation, and are defined within the configu-
ration file. This section gives some details about the interactions that a participants will have with
these tasks.

60
Fig. 2.9. Sympol prototype in Xcode’s Interface Builder. Arrows indicate a flow between views
following a user interaction. Leaves in the chain will return to their parent when complete.
The open-ended questionnaire uses the first type of open-ended survey (see Section 2.3.1),
where participants are asked to ascribe a meaning to a symbol. This is a single-view task with
two interactive user components (Figure 2.10). When the view loads, the participant is presented
with a symbol in the upper portion of the screen. Below this symbol is a text field and a slider
control. The participant taps on the text field to begin inputting the meaning they associate with
the symbol. Once they have entered the meaning, they hit the “return” key to dismiss the keyboard
and return to the original view. When the participant has finished entering a meaning, they click
the “Submit” button at the bottom of the view. Multiple symbols can be included in a single
association task, with each symbol repeating the process above.

61
Fig. 2.10. Association task interface as implemented in the current prototype.
The association task collects two metrics: (1) a complete record of the metadata for the
symbol supplied in the configuration file; and (2) a string containing the meaning that the partici-
pant ascribed to the symbol. These metrics are stored as a pair and added to a list of pairs that is
reported as the task results.

62
The search task is a two-view task designed to follow the basic pattern for search tasks
outlined in Section 2.3.2. When the task loads, the participant is presented with a description or
the meaning of the symbol they are supposed to find on the map. Once they have acknowledged
that they have read the description they click the button at the bottom of the screen and a map
is displayed on the screen. The map is populated with a preset number of symbols, defined by the
configuration file (Figure 2.11). One of these symbols is the target symbol that the participant must
find and select, the rest are randomly selected from the primary list of symbols in the configuration
file. By default, the map, generated using Apple’s MapKit mapping service, is a 1000 meter
wide swath of land centered over 39.828333, -77.232222, just outside of Gettysburg, PA. This area
consists of mostly land with a small lake to the east. The map is minimally interactive. In future
versions, these parameters will be definable as part of the configuration file, allowing the map to
easily adapt to various screen sizes. Participants can touch the symbols to select them, but they
cannot pan, zoom, and otherwise alter the map’s view. Symbols are displayed at 24 pixels by 24
pixels, and positioned randomly within the map bounds without overlap, which is possible because
of the region and scale used for the map and the relative size of the symbols (see recommendations
from Forrest & Castner (1985)). A variation on this would allow the researcher to define a series of
likely locations for a set of symbols, and then randomize which symbols show up in which locations.
Depending on the number of symbols to be included on the map there may be repeat instances of a
symbol, but the target symbol can never be repeated, by design. The participant selects a symbol
by tapping on it.
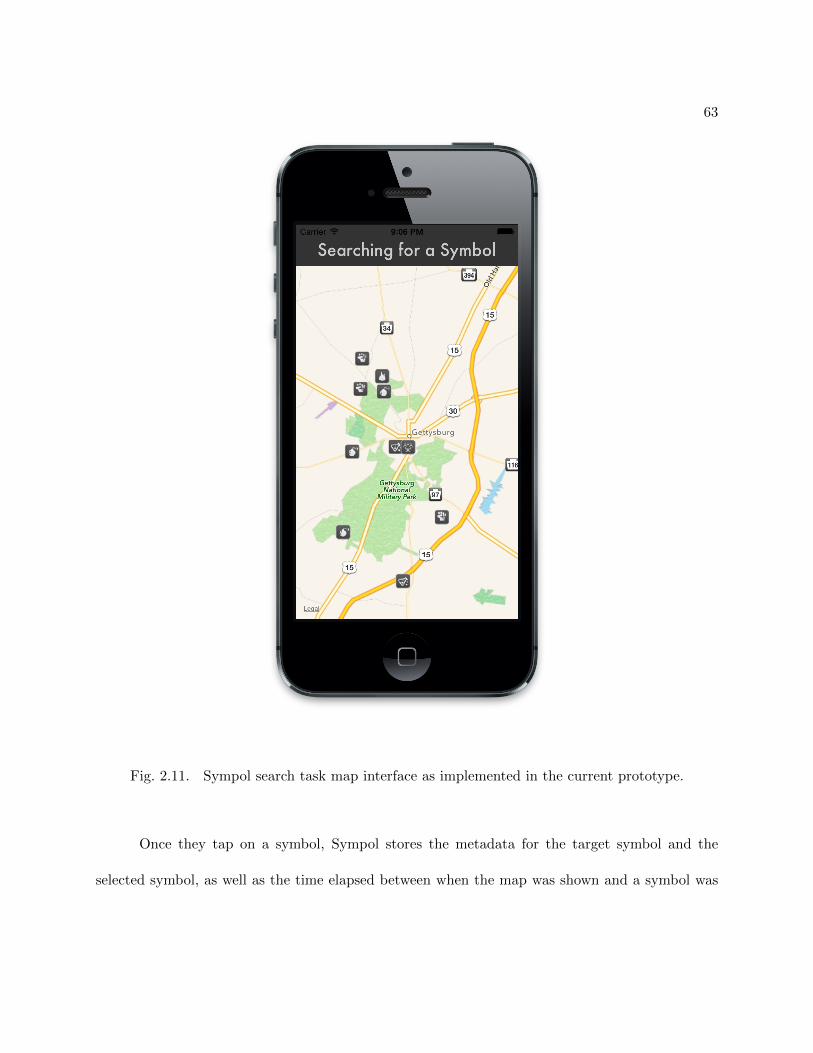
63
Fig. 2.11. Sympol search task map interface as implemented in the current prototype.
Once they tap on a symbol, Sympol stores the metadata for the target symbol and the
selected symbol, as well as the time elapsed between when the map was shown and a symbol was

64
selected as a triple in a list. These triples are recorded and reported back to the researcher in a
JSON format.
2.4.2.2 Reporting Results
The Sympol mobile client is responsible for executing and recording the data from evalua-
tions. During an evaluation, data is stored locally on the device. If, at any time, a user decides
that they prefer not to finish the evaluation they can stop the evaluation by clicking on the home
button, a physical button at the bottom of the device. Clicking the home button acts like an
emergency exit; any data collected during the evaluation is deleted and application is reset to start
a new evaluation. This feature allows the Sympol application to easily comply with Institutional
Review Board requirements for human subject research. Researchers should note that there is
no mechanism for recovering data from an evaluation that was stopped by using this emergency
exit, and should warn participants that clicking the home button will erase their progress. Future
versions of this application will seek to develop a less polarized mechanism for the emergency exit,
preferably one that includes a confirmation process so that data is not accidentally lost.
When a participant completes an evaluation, the Sympol mobile client prompts them to
acknowledge that they are finished and that the data collected during this evaluation may be sent
to researchers. When the participant indicates that the data may be shared with researchers the
prototype Sympol client converts the data stored on the device to a JSON file (see Listing 2.1) and
emails this file to the researcher at the address listed in the contact section of the configuration
file. When participants indicate that they do not wish for this data to be shared with researchers
the Sympol client behaves as if they had used the home button emergency exit.

65
Listing 2.1. ”Sample results file”{
” e v a l u a t i o n I n f o ” : {” r e s e a r c h e r ” : ” Naitona l Park S e r v i c e Employee ” ,” emai l ” : ”nps emp@example . org ” ,” t i t l e ” : ”NPS B a t t l e f i e l d Symbol Evaluat ion ” ,” d e s c r i p t i o n ” : ” This i s sample data . ”
} ,” r e s u l t s ” : [
[{
” type ” : ” ComprehensionAssociat ion ” ,” a s s o c i a t i o n s ” : [{
”symbol ” : {” author ” : ” Naitona l Park S e r v i c e Employee ” ,” c rea ted ” : ”2014−06−01”,” uid ” : ”NPS 2014 01 ” ,” imagePath ” : ” http :// example . com/img/symbol/ b a t t l e f i e l d . png ” ,”keywords ” : ” c i v i l war , b a t t l e f i e l d ” ,” l i c e n s e ” : ” Publ ic Domain” ,”meaning ” : ” B a t t l e f i e l d ” ,”name ” : ” B a t t l e f i e l d ” ,” s e t ” : ” Hypothet i ca l NPS B a t t l e f i e l d Symbols”
} ,”meaning ” : ” B a t t l e f i e l d ”
}]
} ,{
” type ” : ”TaskSearch ” ,” targetSymbol ” : {
” author ” : ” Naitona l Park S e r v i c e Employee ” ,” c rea ted ” : ”2014−06−01”,” uid ” : ”NPS 2014 01 ” ,” imagePath ” : ” http :// example . com/img/symbol/ b a t t l e f i e l d . png ” ,”keywords ” : ” c i v i l war , b a t t l e f i e l d ” ,” l i c e n s e ” : ” Publ ic Domain” ,”meaning ” : ” B a t t l e f i e l d ” ,”name ” : ” B a t t l e f i e l d ” ,” s e t ” : ” Hypothet i ca l NPS B a t t l e f i e l d Symbols”
} ,” se lectedSymbol ” : {
” author ” : ” Naitona l Park S e r v i c e Employee ” ,” c rea ted ” : ”2014−06−01”,

66
” uid ” : ”NPS 2014 01 ” ,” imagePath ” : ” http :// example . com/img/symbol/ b a t t l e f i e l d . png ” ,”keywords ” : ” c i v i l war , b a t t l e f i e l d ” ,” l i c e n s e ” : ” Publ ic Domain” ,”meaning ” : ” B a t t l e f i e l d ” ,”name ” : ” B a t t l e f i e l d ” ,” s e t ” : ” Hypothet i ca l NPS B a t t l e f i e l d Symbols”
} ,” elapsedTime ” : 8.536564959678799
}]
]}
2.4.2.3 Architecture
Sympol makes use of the standard client-server architecture for mobile applications (Wasser-
man 2010). This architecture uses a central web service to provide data to clients. When complete,
the Sympol web service will provide facilities for: (1) storing and accessing point symbols as vector
and raster graphics; (2) storing and accessing evaluation configuration files; (3) storing data from
evaluations conducted on client devices; (4) analyzing stored evaluation data; and (5) providing
authentication service to track which evaluations are managed by which researcher.
When complete, researchers and participants will interact with two Sympol clients. Re-
searchers will interact with both a web client and the mobile client. The web client provides a
graphical interface for researchers to upload their symbols for evaluation, define evaluation con-
figurations using their uploaded symbols, and analyze the data collected from evaluations run on
the mobile client. Researchers will be required to log in to the Sympol web client so that symbols,
configurations, and data can be associated with their account. Researchers and participants will
also interact with the mobile client. The mobile client is the only client able to run an evaluation.
Researchers will interact with this client primarily in a managerial role, logging in to the service
67
and selecting the evaluation to conduct. Participants will use the mobile client to work through an
evaluation. When complete, the mobile client will support all of the types of evaluation discussed
in Section 2.3, and provide facilities to control experimental parameters, for example base map,
symbol size, or area of interest.
Presently, only the Symbol mobile client has been implemented to TRL 4. The Sympol
prototype uses a three-component system to conduct rudimentary evaluations of symbols using the
two evaluation methods cited above (see Section 2.4.2.1). The primary component is the device
itself, an iPhone, for example. The device is used to actually administer an evaluation. Sympol is
provided with a configuration, installed onto a device, and then the evaluation can begin. Currently,
the views are optimized for the iPhone and iPod Touch families of products. The application will
also run on an iPad, but the views do not make the best use of the available screen space.
Supporting the device is a computer. Due to the nature of iOS application development, an
Apple Macintosh computer running at least OS X 10.8 is required and must have Xcode installed.
Xcode is used to install Sympol on the device, and is also used to create or edit the configure file
for the evaluation. Once Sympol has been installed on the device there is no need for the computer,
unless a new configuration is needed.
The final piece to the system is the symbol graphics. Sympol does not store symbol graphics
locally on the device, it downloads them from web servers over an HTTP connection to a server.
Sympol currently supports raster based point symbols, for example PNG, JPEG, or GIF images.
68
2.4.3 Availability
Sympol is available as a free and open source project. The entirety of the source code and
documentation for Sympol was made available on GitHub, a popular social code sharing service,
on 1 Aug 2014. Researchers interested in simply making use of Sympol should visit the repository
on GitHub and download the .zip archive containing the source code. Extract the content of the
archive onto the hard drive of a computer running OS X and open the project in Xcode. Connect
a suitable iOS device, such as an iPhone, and tell Xcode to run the experiment on that device. To
change the specifics of the evaluation, edit the “config.json” file with a text editor. Those looking
to expand Sympol should use the standard GitHub practice of forking the repository, changing and
committing those changes to the fork, and submitting a pull request to the main project repository.
2.5 Conclusions and Future Work
This paper has presented two key products designed to aid cartographers in the evaluation
of map symbols. The first product, discussed in Section 2.3, is a taxonomy of evaluation methods
derived from research in the fields of usability (Alonso-Rıos et al. 2009) and cartography (Board
1978; Roth 2012). This taxonomy aids cartographers in selecting the proper evaluation methods
to use when studying different aspects of their symbols. The second product, discussed in Section
2.4, is a prototype application capable of supporting two basic forms of symbol evaluation, an
association task and a search task. This application is available as a free, open-source application
that researchers may download and use without restriction.
Future research in this area will focus on: (1) the further refinement of the taxonomy; and
(2) the development of the Sympol evaluation platform. Continued research into the taxonomy will

69
involve discussions with academic and practicing cartographers to refine the information included
in the taxonomy. This will include focus group studies and card sorting tasks where cartographers
will evaluate the structure of the taxonomy, identify any weaknesses in the included methods, and
categorize new methods for inclusion.
The greatest amount of research and development work will be put into the development
of the Sympol platform. The primary focus will be the implementation of the remaining eval-
uation methods in the mobile client to support more robust evaluations. Following this will be
the development of the supporting services, namely the web services for distributing and storing
evaluations, symbols, and data, and a web client that allows researchers to configure evaluations
and analyze results. Interfaces will be designed such that the taxonomy defined in this research
will be an integral part in the selection of the included evaluation methods. Other interfaces will
be designed to facilitate the definition of evaluation method parameters, i.e. the symbols evaluated
using this method, the prompts given to participants. Finally, tools will be developed for analyzing
and visualizing the results of Sympol evaluations, and sharing these results with others.

70
Bibliography
Akella, M. (2009) First responders and crisis map symbols: Clarifying communication. Cartographyand Geographic Information Science 36(1):19–28.
Alonso-Rıos, D., Vazquez-Garcıa, A., Mosqueira-Rey, E. & Moret-Bonillo, V. (2009) Usability: acritical analysis and a taxonomy. International Journal of Human-Computer Interaction 26(1):53–74.
Andrade, A. F. & Sluter, C. R. (2012) Evaluation of pictorial symbols in tourist maps. Boletim deCiencias Geodesicas 18(2):242–261.
ANSI-INCITS-415-2006 (2006) Homeland security mapping standard: Point symbology for emer-gency management.
ANSI-Z535.3 (2007) American national standard: Criteria for safety symbols.
Apple (2014) iOS Human Interface Guidelines. Apple, Inc.
AS-2342 (1992) Development, testing and implementation of information and safety symbols andsymbolic signs.
Auerbach, C. F. & Silverstein, L. B. (2003) Qualitative data: An introduction to coding andanalysis. NYU press.
Basit, T. (2003) Manual or electronic? the role of coding in qualitative data analysis. EducationalResearch 45(2):143–154.
Bertin, J. (1983) Semiology of graphics: diagrams, networks, maps .
Bhowmick, T., Robinson, A. C., Gruver, A., MacEachren, A. M. & Lengerich, E. J. (2008) Dis-tributed usability evaluation of the pennsylvania cancer atlas. International Journal of HealthGeographics 7(1):36.
Bianchetti, R. A., Wallgrun, J. O., Yang, J., Blanford, J., Robinson, A. C. & Klippel, A. (2012)Free classification of canadian and american emergency management map symbol standards.Cartographic Journal, The 49(4):350–360.
Bisantz, A. M., Marsiglio, S. S. & Munch, J. (2005) Displaying uncertainty: Investigating theeffects of display format and specificity. Human Factors: The Journal of the Human Factors andErgonomics Society 47(4):777–796.
Blades, S. & Spencer, C. (1987) How do people use maps to navigate through the world? Carto-graphica 24(3):64–75.
Blankenberger, S. & Hahnt, K. (1991) Effects of icon design on human-computer interaction. In-ternational Journal of Man-Machine Studies 35:363–377.

71
Blei, D. M., Ng, A. Y. & Jordan, M. I. (2003) Latent dirichlet allocation. the Journal of machineLearning research 3:993–1022.
Blok, C. (2000) Monitoring change: characteristics of dynamic geo-spatial phenomena for visualexploration. In: Spatial cognition II, Springer, pp. 16–30.
Board, C. (1973) Cartographic communication and standardization. International Yearbook ofCartography 13:229–236.
Board, C. (1977) The geographers contribution to evaluating maps as vehicles for communicatinginformation. International Yearbook of Cartography 17:47–59.
Board, C. (1978) Map reading tasks appropriate in experimental studies in cartographic communica-tion. Cartographica: The International Journal for Geographic Information and Geovisualization15(1):1–12.
Brewer, C. A. (1994) Guidelines for use of the perceptual dimensions of color for mapping andvisualization. In: IS&T/SPIE 1994 International Symposium on Electronic Imaging: Scienceand Technology. International Society for Optics and Photonics, pp. 54–63.
Brewer, C. A. (1997) Evaluation of a model for predicting simultaneous contrast on color maps.The Professional Geographer 49(3):280–294.
Brewer, C. A. & Campbell, A. J. (1998) Beyond graduated circles: Varied point symbols forrepresenting quantitative data on maps. Cartographic Perspectives 29:6–25.
Bulling, A. & Gellersen, H. (2010) Toward mobile eye-based human-computer interaction. PervasiveComputing, IEEE 9(4):8–12.
Burden, P. (1988) Public Information Symbols: There is a Standard. Australian Key Centre ForLand Information Studies.
Burigat, S. & Chittaro, L. (2011) Visualizing references to off-screen content on mobile devices: Acomparison of arrows, wedge, and overview+ detail. Interacting with Computers 23(2):156–166.
Burigat, S., Chittaro, L. & Gabrielli, S. (2006) Visualizing locations of off-screen objects on mobiledevices: a comparative evaluation of three approaches. In: Proceedings of the 8th conference onHuman-computer interaction with mobile devices and services. ACM, pp. 239–246.
Buttenfield, B. P. (1993) Representing data quality. Cartographica: The International Journal forGeographic Information and Geovisualization 30(2):1–7.
Campbell, J. L., Hoffmeister, D. H., Kiefer, R. J., Selke, D. J., Green, P. & Richman, J. B. (2004)Comprehension testing of active safety symbols. SAE International .
Cedilnik, A. & Rheingas, P. (2000) Procedural annotation of uncertain information. In: Proceedingsof Visualization. IEEE, pp. 77–84.
Chan, A. H. S. & Ng, A. W. Y. (2010) Investigation of guessability of industrial safety signs:Effects of prospective-user factors and cognitive sign features. International Journal of IndustrialErgonomics 40:689–697.

72
Chang, K.-T. (1977) Visual estimation of graduated circles. Cartographica: The InternationalJournal for Geographic Information and Geovisualization 14(2):130–138.
Clarke, L. M. (1989) An experimental investigation of the communicative efficiency of point symbolson tourist maps. The Cartographic Journal 26:105–110.
Coltekin, A., Heil, B., Garlandini, S. & Fabrikant, S. I. (2009) Evaluating the effectiveness ofinteractive map interface designs: a case study integrating usability metrics with eye-movementanalysis. Cartography and Geographic Information Science 36(1):5–17.
Coltekin, A., Fabrikant, S. I. & Lacayo, M. (2010) Exploring the efficiency of users’ visual analyticsstrategies based on sequence analysis of eye movement recordings. International Journal ofGeographical Information Science 24(10):1559–1575.
Cooke, N. J. (1994) Varieties of knowledge elicitation techniques. International Journal of Human-Computer Studies 41(6):801–849.
Cox III, E. P. (1980) The optimal number of response alternatives for a scale: A review. Journalof marketing research pp. 407–422.
Crawford, P. V. (1971) Perception of grey-tone symbols. Annals of the Association of AmericanGeographers 61(4):721–735.
Crawford, P. V. (1973) The perception of graduated squares as cartographic symbols. CartographicJournal, The 10(2):85–88.
Dessus, P. & Peraya, D. (2007) Cognitive modeling of icon comprehension. Chapter submitted toE. McKay (Ed.), Enhancing Learning through HCI. Hershey: Idea Group Publishing.
Dobson, M. W. (1974) Refining legend values for proportional circle maps. Cartographica: TheInternational Journal for Geographic Information and Geovisualization 11(1):45–53.
Drewes, H., De Luca, A. & Schmidt, A. (2007) Eye-gaze interaction for mobile phones. In: Pro-ceedings of the 4th international conference on mobile technology, applications, and systems andthe 1st international symposium on Computer human interaction in mobile technology. ACM,pp. 364–371.
Dumais, S. T. (2004) Latent semantic analysis. Annual review of information science and technology38(1):188–230.
Dymon, U. J. (2003) An analysis of emergency map symbology. International Journal of EmergencyManagement 1(3):227–237.
Fish, C., Goldsberry, K. P. & Battersby, S. (2011) Change blindness in animated choropleth maps:an empirical study. Cartography and Geographic Information Science 38(4):350–362.
Fisher, P. F. (1993) Visualizing uncertainty in soil maps by animation. Cartographica: The Inter-national Journal for Geographic Information and Geovisualization 30(2):20–27.
73
Fitrianie, S., Yang, Z. & Rothkrantz, L. J. M. (2008) Developing concept-based user interfacesusing icons for reporting observations. In: F. Fiedrich, B. V. d. W. (ed.), Proceedings of the 5thInternational ISCRAM Conference. Information Systems for Crisis Response and Management,Washington, DC, USA.
Flannery, J. J. (1971) The relative effectiveness of some common graduated point symbols in thepresentation of quantitative data. The Canadian Cartographer 8(2):96–109.
Forrest, D. (1998) On the design of point symbols for tourist maps: Enclosed or not enclosed is notthe question! The Cartographic Journal 35(1):79–81.
Forrest, D. & Castner, H. W. (1985) The design and perception of point symbols for tourist maps.The Cartographic Journal 22:11–19.
Gabbard, J. L., Hix, D. & Swan, J. E. (1999) User-centered design and evaluation of virtualenvironments. Computer Graphics and Applications, IEEE 19(6):51–59.
Gale, G. (2013) Push pins, dots, customisation, brands and services: The three waves of makingdigital maps. The Cartographic Journal 50(2):155–160.
Garvey, P. M. (2003) Motorist comprehension of the slow-moving vehicle (smv) emblem. Journalof agricultural safety and health 9(2):159–169.
Gerber, R., Burden, P. & Stanton, G. (1990) Development of public information symbols for tourismand recreational mapping. The Cartographic Journal 27:92–103.
Giannopoulos, I., Kiefer, P. & Raubal, M. (2012) Geogazemarks: Providing gaze history for theorientation on small display maps. In: Proceedings of the 14th ACM international conference onMultimodal interaction. ACM, pp. 165–172.
Gilhooly, K. J., Wood, M., Kinnear, P. R. & Green, C. (1988) Skill in map reading and memoryfor maps. The quarterly journal of experimental psychology 40(1):87–107.
Gill, G. (1988) Experiments in the ordered perception of coloured cartographic line symbols. Car-tographica 25(4):36–49.
Goldstone, R. L. (1994) The role of similarity in categorization: Providing a groundwork. Cognition52(2):125–157.
Google (2014) Material Design. Google, Inc.
Goonetilleke, R. S., Shih, H. M., On, H. K. & Fritsch, J. (2001) Effects of training and repre-sentational characteristics in icon design. International Journal of Human-Computer Studies55:741–760.
Graettinger, C. P., Garcia, S., Siviy, J., Schenk, R. J. & Van Syckle, P. J. (2002) Using the technol-ogy readiness levels scale to support technology management in the dod’s atd/sto environments.Tech. rep., DTIC Document.
Grant, L. A. & Keller, C. P. (1999) Content and design of canadian provincial travel maps. Carto-graphica 36(1):51–62.

74
Guelke, L. (1979) Perception, meaning, and cartographic design. The Canadian Cartographer16(1):61–69.
Handcock, H. E., Rogers, W. A., Schroeder, D. & Fisk, A. D. (2004) Safety symbol comprehension:Effects of symbol type, familiarity, and age. Human Factors: The Journal of the Human Factorsand Ergonomics Society 46:183–195.
Harrower, M., MacEachren, A. & Griffin, A. L. (2000) Developing a geographic visualization tool tosupport earth science learning. Cartography and Geographic Information Science 27(4):279–293.
Harrower, M. A. (2002) Visual benchmarks: Representing geographic change with map animation.Ph.D. thesis.
Heer, J. & Bostock, M. (2010) Crowdsourcing graphical perception: using mechanical turk to assessvisualization design. In: Proceedings of the SIGCHI Conference on Human Factors in ComputingSystems. ACM, pp. 203–212.
Hicks, K. E., Bell, J. L. & Wogalter, M. S. (2003) On the prediction of pictorial comprehension. In:Proceedings of the Human Factors and Ergonomics Society Annual Meeting. SAGE Publications,vol. 47, pp. 1735–1739.
Howard, D. & MacEachren, A. M. (1996) Interface design for geographic visualization: Tools forrepresenting reliability. Cartography and Geographic Information Systems 23(2):59–77.
Isherwood, S. J., McDougall, S. J. & Curry, M. B. (2007) Icon identification in context: Thechanging role of icon characteristics with user experience. Human Factors: The Journal of theHuman Factors and Ergonomics Society 49(3):465–476.
Johnson, C. R. & Sanderson, A. R. (2003) A next step: Visualizing errors and uncertainty. Com-puter Graphics and Applications, IEEE 23(5):6–10.
Kelly, G. A. (1970) Perspectives in Personal Construct Theory, Academic Press, chap. A briefintroduction to personal construct theory.
Kennedy, C. (2011) Semantics, DE GRUYTER MOUTON, chap. Ambiguity and vagueness: Anoverview, pp. 507–535.
Kjeldskov, J. & Stage, J. (2004) New techniques for usability evaluation of mobile systems. Inter-national journal of human-computer studies 60(5):599–620.
Klippel, A. & Winter, S. (2005) Structural salience of landmarks for route directions. In: Spatialinformation theory, Springer, pp. 347–362.
Klippel, A., Haridsty, F. & Weaver, C. (2009) Star plots: How shape characteristics influenceclassification tasks. Cartography and Geographic Information Science 36(2):149–163.
Kolacny, A. (1969) Cartographic information—a fundamental concept and term in modern cartog-raphy. The cartographic journal 6(1):47–49.
Kostelnick, J. C., Dobson, J. E., Egbert, S. L. & Dunbar, M. D. (2008) Cartographic symbols forhumanitarian demining. Cartographic Journal, The 45(1):18–31.

75
Koutsourelakis, C. & Chorianopoulos, K. (2010) Unaided icon recognition in mobile phones: acomparative study with young users. The Design Journal 13(3):313–328.
Kuusela, H. & Paul, P. (2000) A comparison of concurrent and retrospective verbal protocol anal-ysis. The American journal of psychology .
Lai, P.-C. & Yeh, A. G.-O. (2004) Assessing the effectiveness of dynamic symbols in cartographiccommunication. Cartographic Journal, The 41(3):229–244.
Lesch, M. F. (2003) Comprehension and memory for warning symbols: age-related differences andimpact of training. Journal of Safety Research 34(5):495–505.
Lesch, M. F. (2005) A semantic relatedness paradigm for assessing comprehension of warningsymbols. In: Proceedings of the Human Factors and Ergonomics Society Annual Meeting. SAGEPublications, vol. 49, pp. 1795–1799.
Lesch, M. F. & McDevitt, J. R. (2002) Methodological issues in testing comprehension of safetysymbols. In: Proceedings of the Human Factors and Ergonomics Society Annual Meeting. SAGEPublications, vol. 46, pp. 1744–1747.
Levine, M. (1982) You-are-here maps: Psychological considerations. Environment and Behavior14:221–237.
Levine, M., Marchon, I. & Hanley, G. (1984) The placement and misplacement of you-are-heremaps. Environment and Behavior 16:139–157.
Lewis, C. & Rieman, J. (1993) Task-centered user interface design. A Practical Introduction .
Likert, R. (1932) A technique for the measurement of attitudes. Archives of psychology .
MacEachren, A. M. (1982) The role of complexity and symbolization method in thematic mapeffectiveness. Annals of the Association of American Geographers 72(4):495–513.
MacEachren, A. M. (1992) Visualizing uncertain information. Cartographic Perspectives 13(13):10–19.
MacEachren, A. M. (2004) How maps work: representation, visualization, and design .
MacEachren, A. M., Brewer, C. A. & Pickle, L. W. (1998) Visualizing georeferenced data: repre-senting reliability of health statistics. Environment and Planning A 30(9):1547–1561.
MacEachren, A. M., Roth, R. E., O’Brien, J., Li, B., Swingley, D. & Gahegan, M. (2012) Vi-sual semiotics and uncertainty visualization: An empirical study. Visualization and ComputerGraphics, IEEE Transactions on 18(12):2496–2505.
MacLean, K. & Enriquez, M. (2003) Perceptual design of haptic icons. In: Proceedings of Euro-haptics. pp. 351–363.
Mayhorn, C. B., Wogalter, M. S. & Bell, J. L. (2004) Homeland security safety symbols: Are weready? Ergonomics in design 12(4):6–14.

76
Mcdougall, S. J., Curry, M. B. & de Bruijn, O. (1999) Measuring symbol and icon characteristics:Norms for concreteness, complexity, meaningfulness, familiarity, and semantic distance for 239symbols. Behavior Research Methods, Instruments, & Computers 31(3):487–519.
McDougall, S. J. P., de Bruijn, O. & Curry, M. B. (2000) xploring the effects of icon characteristicson user performance: The role of icon concreteness, complexity, and distinctiveness. Journal ofExperimental Psychology 6(4):291–306.
McGuinness, C. (1994) Expert/novice use of visualization tools.
McGuinness, C., Van Wersch, A. & Stringer, P. (1993) User differences in a gis environment: aprotocol study. In: Proceedings. vol. 1, pp. 478–485.
Meihoefer, H.-J. (1969) The utility of the circle as an effective cartographic symbol. Cartographica:The International Journal for Geographic Information and Geovisualization 6(2):105–117.
Michaelidou, E., Filippakopoulou, V., Nakos, B. & Petropoulou, A. (2005) Designing point mapsymbols: The effect of preattentive attribute of shape. In: Proceedings of the 22th InternationalCartographic Association Conference, A Coruna.
Microsoft (2014) Designing UX for Apps. Microsoft, Inc.
Miles, M. B. & Huberman, A. M. (1994) Qualitative data analysis: An expanded sourcebook. Sage.
Monmonier, M. S. (1977) Regression-based scaling to facilitate the cross-correlation of graduatedcircle maps. Cartographic Journal, The 14(2):89–98.
Montello, D. R. (2002) Cognitive map-design research in the twentieth century: Theoretical andempirical approaches. Cartography and Geographic Information Science 29(3):283–304.
Morrison, J. L. (1974) A theoretical framework for cartographic generalization with the emphasison the process of symbolization. International Yearbook of Cartography 14:115–127.
Nelson, E. S. (2000) Designing effective bivariate symbols: The influence of perceptual groupingprocesses. Cartography and Geographic Information Science 27(4):261–278.
Ng, A. W. & Chan, A. H. (2007) The guessability of traffic signs: Effects of prospective-user factorsand sign design features. Accident Analysis & Prevention 39(6):1245–1257.
Nielsen, J. (1994a) Guerrilla hci: Using discount usability engineering to penetrate the intimidationbarrier. Cost-justifying usability pp. 245–272.
Nielsen, J. (1994b) Heuristic evaluation. Usability inspection methods 17(1):25–62.
Nielsen, J. (1994c) Usability inspection methods. In: Conference companion on Human factors incomputing systems. ACM, pp. 413–414.
Nielsen, J. (2005) Ten usability heuristics .
Olson, J. M. (1975) Experience and the improvement of cartographic communication. CartographicJournal, The 12(2):94–108.
77
Olson, J. M. (1979) Cognitive cartographic experimentation. The Canadian Cartographer 16(1):34–44.
Paas, F., Tuovinen, J. E., Tabbers, H. & Van Gerven, P. W. (2003) Cognitive load measurementas a means to advance cognitive load theory. Educational psychologist 38(1):63–71.
Pang, A. (2001) Visualizing uncertainty in geo-spatial data. In: Proceedings of the Workshop onthe Intersections between Geospatial Information and Information Technology. pp. 1–14.
Pang, A. T., Wittenbrink, C. M. & Lodha, S. K. (1997) Approaches to uncertainty visualization.The Visual Computer 13(8):370–390.
Perkins, C. & Gardiner, A. (2003) Real world map reading strategies. The Cartographic Journal40(3):265–268.
Project, T. N. (2011) Iconathon: a new design initiative to add civic symbols to the public domain.
Reijnen, E., Wolfe, J. M. & Krummenacher, J. (2013) Coarse guidance by numerosity in visualsearch. Attention, Perception, & Psychophysics 75(1):16–28.
Richter, K.-F. & Klippel, A. (2005) A model for context-specific route directions. In: SpatialCognition IV. Reasoning, Action, Interaction, Springer, pp. 58–78.
Robinson, A. C., Roth, R. E. & MacEachren, A. M. (2010) Challenges for map symbol standardiza-tion in crisis management. In: Proceedings of the 7th International ISCRAM Conference–Seattle.vol. 1.
Robinson, A. C., Roth, R. E., Blanford, J., Pezanowski, S. & MacEachren, A. M. (2011a) Acollaborative process for developing map symbol standards. Procedia-Social and BehavioralSciences 21:93–102.
Robinson, A. C., Roth, R. E. & MacEachren, A. M. (2011b) Understanding user needs for mapsymbol standards in emergency management. Journal of Homeland Security and EmergencyManagement 8(1).
Robinson, A. C., Roth, R. E., Blanford, J., Pezanowski, S. & MacEachren, A. M. (2012) Developingmap symbol standards through an iterative collaboration process. Environment and Planning-Part B 39(6):1034.
Robinson, A. H. (1952) The look of maps: An examination of cartography design .
Robinson, A. H. & Petchenik, B. B. (1975) The map as a communication system. The CartographicJournal 12(1):7–15.
Roth, R. (2012) An empirically-derived taxonomy of cartographic interaction primitives. In: Proc.GIScience. pp. 18–21.
Roth, R. E. (2013) Interactive maps: What we know and what we need to know. Journal of SpatialInformation Science (6):59–115.

78
Roth, R. E., Finch, B. G., Blanford, J. I., Klippel, A., Robinson, A. C. & MacEachren, A. M. (2011)Card sorting for cartographic research and practice. Cartography and Geographic InformationScience 38(2):89–99.
Salman, Y. B., Kim, J. Y., Karahoca, A. & CHENG, H.-I. (2007) Participatory icon design formedical information systems. Hong Kong: International Association of Design Research .
Salman, Y. B., Kim, Y.-H. & Cheng, H.-I. (2010) Senior—friendly icon design for the mobile phone.In: Digital Content, Multimedia Technology and its Applications (IDC), 2010 6th InternationalConference on. IEEE, pp. 103–108.
Salman, Y. B., Cheng, H.-I. & Patterson, P. E. (2012) Icon and user interface design for emer-gency medical information systems: A case study. International Journal of Medical Informatics81(1):29–35.
Sauro, J. (2013) Seven ways to test the effectiveness of icons.
Slocum, T. A. (1981) Analyzing the communicative efficiency of two-sectored pie graphs. Carto-graphica 18(3):53–65.
Slocum, T. A., Yoder, S. C., Kessler, F. C. & Sluter, R. S. (2000) Maptime: software for exploringspatiotemporal data associated with point locations. Cartographica: The International Journalfor Geographic Information and Geovisualization 37(1):15–32.
Spencer, D. (2009) Card sorting: Designing usable categories. Rosenfeld Media.
Stevens, J. E., Robinson, A. C. & MacEachren, A. M. (2013) Designing map symbols for mobiledevices: Challenges, best practices, and the utilization of skeuomorphism. In: 26th InternationalCartographic Conference.
Teghtsoonian, M. (1965) The judgment of size. The American Journal of Psychology 78(3):392–402.
Tractinsky, N., Katz, A. & Ikar, D. (2000) What is beautiful is usable. Interacting with computers13(2):127–145.
Ward, S. J., Wogalter, M. S. & Mercer, A. W. (2004) Comprehension and training of internationalroad signs. In: Proceedings of the Human Factors and Ergonomics Society Annual Meeting.SAGE Publications, vol. 48, pp. 2104–2108.
Wasserman, A. I. (2010) Software engineering issues for mobile application development. In: Pro-ceedings of the FSE/SDP workshop on Future of software engineering research. ACM, pp. 397–400.
Wilkening, J. & Fabrikant, S. I. (2011) How do decision time and realism affect map-based decisionmaking? In: Spatial Information Theory, Springer, pp. 1–19.
Wisniewski, E. C., Isaacson, J. J. & Hall, S. M. (2006) Techniques for assessing safety symbolcomprehension: Web-based vs. in-person questionnaire administration. In: Proceedings of theHuman Factors and Ergonomics Society Annual Meeting. Sage Publications, vol. 50, pp. 2207–2211.

79
Wittenbrink, C. M., Saxon, E., Furman, J. J., Pang, A. & Lodha, S. K. (1995) Glyphs for visualizinguncertainty in environmental vector fields. In: IS&T/SPIE’s Symposium on Electronic Imaging:Science & Technology. International Society for Optics and Photonics, pp. 87–100.
Wogalter, M. S., Silver, N. C. & Leonard, S. D. (2006) Warning symbols .
Wolfe, J. M., Alvarez, G. A., Rosenholtz, R., Kuzmova, Y. I. & Sherman, A. M. (2011) Visual searchfor arbitrary objects in real scenes. Attention, Perception, & Psychophysics 73(6):1650–1671.
Wolff, J. S. & Wogalter, M. S. (1998) Comprehension of pictorial symbols: Effects of contextand test method. Human Factors: The Journal of the Human Factors and Ergonomics Society40(2):173–186.
Yu, B., Willis, M., Sun, P. & Wang, J. (2012) Crowdsourcing participatory evaluation of medicalpictograms using amazon mechanical turk. Journal of medical Internet research 15(6):e108–e108.
Zhang, J. & Goodchild, M. F. (2002) Uncertainty in geographical information. CRC press.