Visitor Use and Evaluation of Interpretive Media
115
National Park Service U.S. Department of the Interior Social Science Program Visitor Use and Evaluation of Interpretive Media Glacier National Park, 1960 A Report on Visitors to the National Park System The National Park Service Visitor Services Project The National Park Service Social Science Program September 2003
Transcript of Visitor Use and Evaluation of Interpretive Media

National Park Service U.S. Department of the Interior Social Science Program
Visitor Use and Evaluation of Interpretive Media
Glacier National Park, 1960
A Report on Visitors to the National Park System The National Park Service Visitor Services Project The National Park Service Social Science Program September 2003

National Park Service U.S. Department of the Interior Social Science Program
Visitor Use and Evaluation of Interpretive Media
A Report on Visitors to the National Park System
The National Park Service Visitor Services Project The National Park Service Social Science Program Prepared by: Brian E. Forist Research Associate National Park Service Social Science Program With assistance from1: Margaret Littlejohn Coordinator NPS Visitor Services Project University of Idaho Park Studies Unit Rodney Baxter Former Data Analysis/Systems Manager Washington State University Public Opinion Laboratory Dr. Gary E. Machlis Visiting Senior Scientist National Park Service Dr. James H. Gramann Visiting Chief Social Scientist National Park Service
1 This report was reviewed by: Dr. Gary Mullins, Director, School of Natural Resources, The Ohio State University; Dr. Gail Vander Stoep, Associate Professor, Park, Recreation & Tourism Resources, Michigan State University; Sam Vaughn, Associate Manager, Interpretive Planning, Harpers Ferry Center, National Park Service; and Dr. Marcella Wells, Private Consultant, Fort Collins, Colorado.

About the photographs All photographs used in this report are courtesy of the National Park Service, Harpers Ferry Center Historic Photograph Collection with the exception of the photograph on page 110, courtesy of Terry Bergerson. The historic photographs depict visitors interacting with interpretive media or participating in ranger-guided programs in units of the National Park System. The photographs should not be construed as illustrations of the current state of interpretive media found in parks. They are important illustrations of park visitors and interpretive media in the past. Some photographs used here illustrate visitors and interpretive media in parks from which data is included in this report. Other photographs provide more general illustrations. The National Park Service Harpers Ferry Center maintains a collection of current, state-of-the art illustrations of interpretive media. For further information on the Historic Photograph Collection or current interpretive media photographs, contact the National Park Service Harpers Ferry Center, P.O. Box 50, Filmore Street, Harpers Ferry, WV 24245 or on the internet at <www.nps.gov/hfc>.
Self-guided nature trail, Yellowstone National Park, 1972

Visitor Use and Evaluation of Interpretive Media 4
Introduction 9 Section 1: Selected NPS Visitor Services Project Surveys, 1997-1999 13 Section 2: Visitors to Selected NPS Units, 1997-1999 16 Section 3: Visitor Use of Interpretive Media 21 Section 4: Visitor Evaluation of Interpretive Media 24 Section 5: Use and Evaluation of Interpretive Media by Groups of Different Size 28 Section 6: Use and Evaluation of Interpretive Media by Different Group Types 38 Section 7: Use and Evaluation of Interpretive Media by Respondents of Different
Ages 48 Section 8: Use and Evaluation of Interpretive Media by Visitors of Different Group Age Structure 58 Section 9: Use and Evaluation of Interpretive Media by Frequency of Visits 68 Section 10: Use and Evaluation of Interpretive Media by Length of Visit 78 Section 11: Findings by Type of Interpretive Media⎯Conclusions 88 Appendix: NPS Visitor Services Project Survey Methods 110
Table of Contents
Visitor Use and Evaluation of Interpretive Media 5
Table # Table Title Page Table 1.1: VSP studies, 1997-1999 13 Table 1.2: 1997-1999 VSP studies by region 14 Table 1.3: 1997-1999 VSP studies by NPS unit type 15 Table 2.1: Visitor and visit characteristics and variables 17 Table 3.1: Interpretive media categories and specific terms 22 Table 4.1: Importance rating scale for interpretive media 25 Table 4.2: Importance of interpretive media - rating and rank order 26 Table 4.3: Quality rating scale for interpretive media 26 Table 4.4: Quality of interpretive media - rating and rank order 27 Table 5.1: Importance rating scale for interpretive media 35 Table 5.2: Importance of interpretive media by visitor group size 36 Table 5.3 Quality rating scale for interpretive media 36 Table 5.4: Quality of interpretive media by visitor group size 37 Table 6.1: Importance rating scale for interpretive media 45 Table 6.2: Importance of interpretive media by visitor group type 46 Table 6.3 Quality rating scale for interpretive media 46 Table 6.4: Quality of interpretive media by visitor group type 47 Table 7.1: Importance rating scale for interpretive media 55 Table 7.2: Importance of interpretive media by respondents of different ages 56 Table 7.3 Quality rating scale for interpretive media 56 Table 7.4: Quality of interpretive media by respondents of different ages 57 Table 8.1: Importance rating scale for interpretive media 65 Table 8.2: Importance of interpretive media by group age structure 66 Table 8.3 Quality rating scale for interpretive media 66 Table 8.4: Quality of interpretive media by group age structure 67 Table 9.1: Importance rating scale for interpretive media 75 Table 9.2: Importance of interpretive media by frequency of visit s 76 Table 9.3 Quality rating scale for interpretive media 76 Table 9.4: Quality of interpretive media by frequency of visits 77
List of Tables

Visitor Use and Evaluation of Interpretive Media 6
Table # Table Title Page Table 10.1: Importance rating scale for interpretive media 85 Table 10.2: Importance of interpretive media by length of visit 86 Table 10.3 Quality rating scale for interpretive media 86 Table 10.4: Quality of interpretive media by length of visit 87 Table 11.1: Importance of visitor center exhibits 91 Table 11.2: Importance of internet/park websites 101

Visitor Use and Evaluation of Interpretive Media 7
Figure # Figure Title Page Figure 1.1: NPS Regions 14 Figure 2.1: Visitor group size, 1997-1999 VSP studies 18 Figure 2.2: Visitor group type, 1997-1999 VSP studies 18 Figure 2.3: Visitor ages, 1997-1999 VSP studies 19 Figure 2.4: Visitor group age structure, 1997-1999 VSP studies 19 Figure 2.5: Frequency of visits, 1997-1999 VSP studies 20 Figure 2.6: Length of visit, 1997-1999 VSP studies 20 Figure 3.1: Visitor use of interpretive media, 1997-1999 VSP studies 23 Figure 5.1: Use of park brochures by visitor group size 30 Figure 5.2: Use of visitor center exhibits by visitor group size 30 Figure 5.3: Use of wayside exhibits by visitor group size 31 Figure 5.4: Use of audio-visual programs by visitor group size 31 Figure 5.5: Use of self-guided tours by visitor group size 32 Figure 5.6: Use of park newspapers by visitor group size 32 Figure 5.7: Use of internet/park websites by visitor group size 33 Figure 5.8: Use of bulletin boards by visitor group size 33 Figure 5.9: Use of park information radio stations by visitor group size 34 Figure 5.10: Use of ranger-guided programs by visitor group size 34 Figure 6.1: Use of park brochures by visitor group type 40 Figure 6.2: Use of Visitor center exhibits by visitor group type 40 Figure 6.3: Use of wayside exhibits by visitor group type 41 Figure 6.4: Use of audio-visual programs by visitor group type 41 Figure 6.5: Use of self-guided tours by visitor group type 42 Figure 6.6: Use of park newspapers by visitor group type 42 Figure 6.7: Use of internet/park websites by visitor group type 43 Figure 6.8: Use of bulletin boards by visitor group type 43 Figure 6.9: Use of park information radio stations by visitor group type 44 Figure 6.10: Use of ranger-guided programs by visitor group type 44 Figure 7.1: Use of park brochures by respondents of different ages 50 Figure 7.2: Use of visitor center exhibits by respondents of different ages 50 Figure 7.3: Use of wayside exhibits by respondents of different ages 51 Figure 7.4: Use of audio-visual programs by respondents of different ages 51 Figure 7.5: Use of self-guided tours by respondents of different ages 52 Figure 7.6: Use of park newspapers by respondents of different ages 52 Figure 7.7: Use of internet/park websites by respondents of different ages 53 Figure 7.8: Use of bulletin boards by respondents of different ages 53
List of Figures
Visitor Use and Evaluation of Interpretive Media 8
Figure # Figure Title Page Figure 7.9: Use of park information radio stations by respondent age 54 Figure 7.10: Use of ranger-guided programs by respondent age 54 Figure 8.1: Use of park brochures by group age structure 60 Figure 8.2: Use of visitor center exhibits by group age structure 60 Figure 8.3: Use of wayside exhibits by group age structure 61 Figure 8.4: Use of audio-visual programs by group age structure 61 Figure 8.5: Use of self-guided tours by group age structure 62 Figure 8.6: Use of park newspapers by group age structure 62 Figure 8.7: Use of internet/park websites by group age structure 63 Figure 8.8: Use of bulletin boards by group age structure 63 Figure 8.9: Use of park information radio stations by group age structure 64 Figure 8.10: Use of ranger-guided programs by group age structure 64 Figure 9.1: Use of park brochures by frequency of visits 70 Figure 9.2: Use of visitor center exhibits by frequency of visits 70 Figure 9.3: Use of wayside exhibits by frequency of visits 71 Figure 9.4: Use of audio-visual programs by frequency of visits 71 Figure 9.5: Use of self-guided tours by frequency of visits 72 Figure 9.6: Use of park newspapers by frequency of visits 72 Figure 9.7: Use of internet/park websites by frequency of visits 73 Figure 9.8: Use of bulletin boards by frequency of visits 73 Figure 9.9: Use of park information radio stations by frequency of visits 74 Figure 9.10: Use of ranger-guided programs by frequency of visits 74 Figure 10.1: Use of park brochures by length of visit 80 Figure 10.2: Use of visitor center exhibits by length of visit 80 Figure 10.3: Use of wayside exhibits by length of visit 81 Figure 10.4: Use of audio-visual programs by length of visit 81 Figure 10.5: Use of self-guided tours by length of visit 82 Figure 10.6: Use of park newspapers by length of visit 82 Figure 10.7: Use of internet/park websites by length of visit 83 Figure 10.8: Use of bulletin boards by length of visit 83 Figure 10.9: Use of park information radio stations by length of visit 84 Figure 10.10: Use of ranger-guided programs by length of visit 84

Visitor Use and Evaluation of Interpretive Media 9
The United States National Park Service (NPS) preserves the country’s most valued natural and cultural resources for the enjoyment by the public now and in the future. Resources protected within units of the National Park System⎯geysers and wildlife at Yellowstone National Park, Native American work sites at Alibates Flint Quarries National Monument, lawn chairs that belonged to the President and First Lady at Eisenhower National Historic Site, and more⎯all hold special and varied meanings for the American public and park visitors from other nations.
Park visitors, Yellowstone National Park, 1969 Visitors to units of the National Park System acquire information pertinent to their park visit by using a wide variety of non-personal interpretive media and participating in personal or ranger-guided programs⎯all providing experiences that orient the park visitor, inform them about the park unit, and help them to form intellectual and emotional connections with the significance and meanings inherent in the park resources. A visitor may comprehend the landscape of a wilderness park with the aid of a park map or brochure. One may grow to understand the magnitude of loss during the American Civil War and broader lessons of U.S. history through a wayside exhibit explaining the placement of monuments in a battlefield park. A family may plan their trip to several national park units using information acquired on NPS websites. Audio-visual programs, printed materials, visitor center exhibits, and many other types of non-personal interpretive media as well as personal ranger-guided programs help the visitor understand the protected
Introduction

Visitor Use and Evaluation of Interpretive Media 10
resources within the National Park System and to experience park resources, landscapes, and stories in meaningful and often personal ways. Effective planning of interpretive media and ranger-guided programs requires a thorough and accurate understanding of park visitors and their use of those media and programs. One of the best ways to gain this understanding is by asking visitors to report on and evaluate their park experiences. The NPS Visitor Services Project (VSP) provides an opportunity for visitors to voice their opinions through participation in visitor surveys. Analysis of survey results can provide park managers with usable knowledge about visitors and their park experiences. A significant portion of data collected in VSP studies is relevant to park managers engaged in design of interpretive media and ranger-guided programs. Since 1988, the VSP has conducted more than 140 in-depth visitor studies in units of the National Park System. The methods and instruments used in VSP studies have been developed and improved since the inception of the project and vary little from park to park. The studies are based on mail-back surveys distributed to randomly selected park visitors. In most VSP studies, visitors are asked to report their use of park services and facilities, including various types of interpretive media and ranger-guided programs. Visitors also are asked to assess the importance and quality of those services and facilities used. Each year, park managers submit requests for VSP surveys to be conducted in specific units of the National Park System. All requests are prioritized on the NPS regional level and the VSP Advisory Committee makes final decisions. Approximately ten in-depth visitor surveys are conducted by the VSP annually. Visitor Services Project surveys collect park-specific data to meet individual park management needs. Park-specific reports are prepared. Data from each year's VSP surveys and the Visitor Survey Card (VSC), a short “customer satisfaction” survey administered each year in most units of the National Park System, are analyzed to create the annual Serving the Visitor reports. The Serving the Visitor reports analyze VSP and VSC data to create a “report card” on how well the NPS is serving visitors in select ways. While the VSP approach successfully provides usable knowledge for those parks selected for study, it does not necessarily contribute to the needs of other parks or of the NPS as a whole. Systematic analysis of existing VSP data, like that described in this report, can provide park managers with information that can be useful on a broader scale throughout the National Park System. This report was requested of the VSP by the NPS Harpers Ferry Center (HFC), as part of the HFC research agenda described in A Social Science Plan for the Harpers Ferry Center2, prepared in September 1997. This report moves beyond the typical park-specific analysis of individual VSP data and the reporting on customer service found in the annual Serving the Visitor reports. This report is based on analysis of data collected in 23 in-depth studies conducted by the VSP in 1997, 1998, and 1999, with specific emphasis on visitor use and evaluation of interpretive media. It is important to note that the 23 studies analyzed in this 2 Machlis, G., and L. Silverman. 1997. A Social Science Plan for the Harpers Ferry Center. Washington, DC. National Park Service, U.S. Department of the Interior.

Visitor Use and Evaluation of Interpretive Media 11
report were conducted specifically for the NPS units. Selections of the parks studied in 1997, 1998, and 1999 were based on the total VSP requests in those years and the priorities determined by the NPS Regions and the VSP Advisory Committee. The 23 studies analyzed here were not conducted for the purpose of this report. The goals of this analysis are to: • document visitor use and evaluation of various interpretive media, and • compare the use and evaluation patterns of visitors based on various visitor and visit
characteristics. The types of interpretive media examined in this report are: park brochures, visitor center exhibits, wayside exhibits, audio-visual programs, self-guided tours, park newspapers, bulletin boards, internet/park websites, and park information radio stations. Any reference in this report to interpretive media is limited to the nine types of non-personal media described above. These media represent the range of non-personal interpretive tools employed by the NPS to provide visitors with information and insight on the natural and cultural resources protected in parks. The nine types of interpretive media reported on here do not represent all types of interpretive media used by the NPS. This report is not specifically an analysis of personal services or ranger-guided programs, though information on visitor use and evaluation of those programs is included for comparison only. The first section of this report identifies the 23 National Park System units for which survey results are analyzed. Those 23 NPS units are categorized by year of study, NPS region, and NPS unit designation type (primarily natural area parks or primarily cultural/historic area parks). In the second section of this report, general visitor and visit characteristics of the respondents to the 23 VSP studies conducted in 1997, 1998, and 1999 are documented. The third section of this report documents overall visitor use of the nine types of interpretive media. The proportion of all park visitors surveyed reporting use of each type of interpretive media is included. Interpretive media types are ranked according to the level of visitor use reported. Overall information regarding visitor evaluation of the importance and quality of interpretive media used by respondents is included in the report's fourth section. The nine types of interpretive media used by respondents are ranked in order of importance and quality as assessed by park visitors surveyed. In the report's fifth through tenth sections, visitor use and evaluation of interpretive media are examined according to various visitor and visit characteristics. Analysis is done based on visitor group size, visitor group type, respondent age (age of individual visitor filling out the questionnaire for their party), age structure of visitor groups, frequency of visits, and length of park visit. Visitor evaluation of the importance and quality of interpretive media

Visitor Use and Evaluation of Interpretive Media 12
is reported and discussed along with the use data for the nine media types and variations by each visitor or visit characteristic. In the report’s final section (Section 11), notes are provided regarding use and evaluation of each type of interpretive media. Some broad conclusions are made to support general recommendations for interpretive planners. Included are comments on the limitations of this project and suggestions for further research that could expand and improve upon this work. In the Appendix, methods used in the VSP studies are described. Summary visitor response and other information is included for each of the 23 studies analyzed in this report.
Wayside exhibit, Fort Donelson National Battlefield, 1959

Visitor Use and Evaluation of Interpretive Media 13
Results from 23 VSP studies conducted in 1997, 1998, and 1999 are used in this report. It is important to note that the 23 parks were not selected for this analysis. Each year, park managers submit requests for VSP surveys to be conducted in specific units of the National Park System. All requests are prioritized on the NPS regional level and the VSP Advisory Committee makes final decisions. Each individual study was designed to gather information specifically for that unit of the National Park System. The analysis described in this report uses the data collected in the 23 studies to better understand visitor use and evaluation of interpretive media on a systemwide scale. In the VSP studies analyzed in this report, mail-back questionnaires were distributed to 17,763 visitor groups in the 23 parks. Individuals accepting the questionnaire for their personal visitor group were all adults, 18 years of age or older. Those individuals indicated that they would fill out the questionnaire for their personal group. In total, 13,313 questionnaires were returned, providing an overall response rate of 75%. Following is a list of the 23 park units from which study results are used in this report.
Year National Park System unit
1997 Virgin Islands National Park Mojave National Preserve Martin Luther King, Jr. National Historic Site Lincoln Boyhood National Memorial Grand Teton National Park Bryce Canyon National Park Voyageurs National Park Lowell National Historical Park
1998 Jean Lafitte National Historical Park and Preserve Chattahoochee River National Recreation Area Cumberland Island National Seashore Netherlands Carillon/U.S. Marine Corps War Memorial National Monuments and Memorials - Washington, DC Klondike Gold Rush National Historical Park Whiskeytown National Recreation Area Acadia National Park
1999 Big Cypress National Preserve San Juan National Historic Site St. Croix National Scenic Riverway Rock Creek Park New Bedford Whaling National Historical Park Glacier Bay National Park and Preserve Kenai Fjords National Park and Preserve (Exit Glacier area)
Table 1.1: VSP studies, 1997-1999
Section 1: Selected NPS Visitor Services Project Surveys, 1997-1999

Visitor Use and Evaluation of Interpretive Media 14
Studies were conducted in parks located within all seven regions of the National Park System. As illustrated in Table 1.2, below, three studies were conducted in each NPS region during the selected time period, with the exception of the Intermountain Region (two studies), the Pacific West Region (two studies), and the Southeast Region (seven studies).
NPS Region 1997-1999 surveys Percent of parks surveyed
Number of respondents
Percent of all respondents
Alaska 3 13% 1,422 11% Pacific West 2 9% 1,013 8% Intermountain 2 9% 1,301 10% Midwest 3 13% 1,632 12% Southeast 7 30% 4,111 31% National Capital 3 13% 2,014 15% Northeast 3 13% 1,820 14%
23 Park units 100% 13,313 101%
Table 1.2: 1997-1999 VSP studies by region (Percentages may not equal 100% due to rounding)
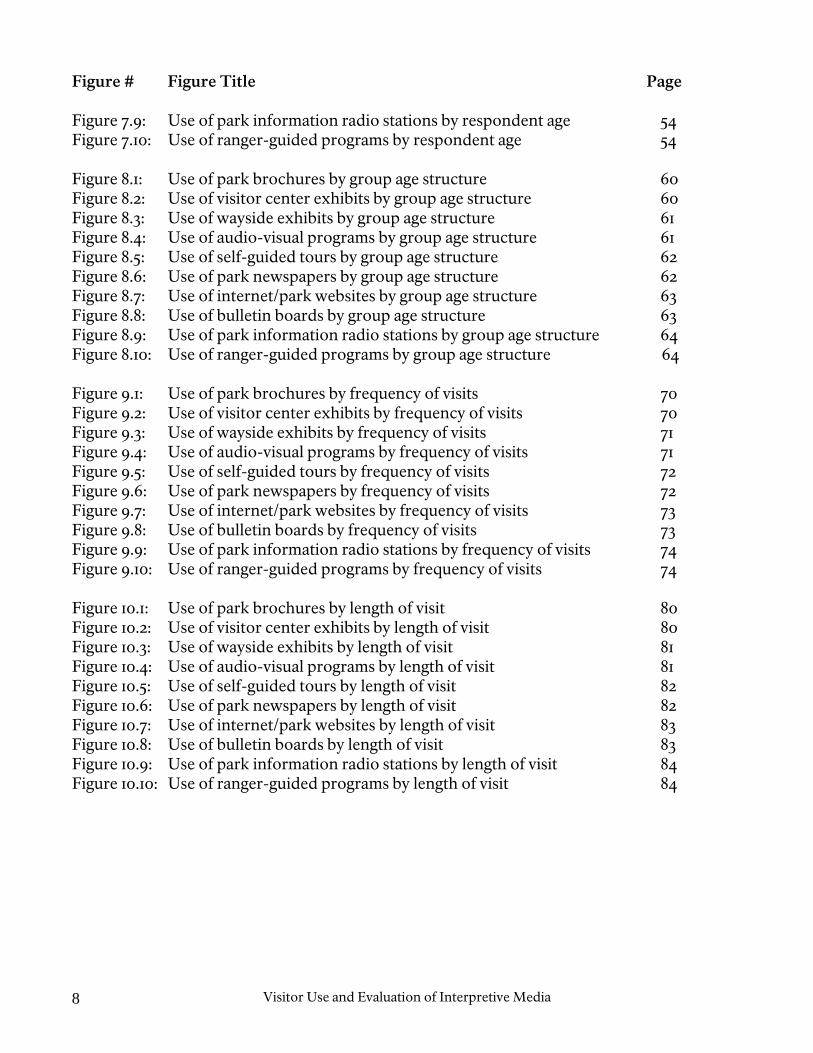
Figure 1.1: NPS Regions In 1997. 1998. and 1999, VSP studies in National Park System areas with various unit designations were conducted. Sixteen of the parks studied are primarily natural area parks (accounting for 65% of the total number of respondents) while seven are primarily cultural/historic area parks (accounting for 35% of the total number of respondents). Table 1.3 (page 15) lists the specific NPS designations for units of the National Park System studied, categorized here as primarily natural area parks or primarily cultural/historic area parks. Included as well is information on the respondents to the surveys conducted in those parks.
Visitor Use and Evaluation of Interpretive Media 15
NPS unit designation 1997-1999 surveys Number of respondents
Percent of all respondents
Primarily Natural area parks National Park 5 4,123 31% National Preserve 2 1,109 8% National Recreation Area 2 1,190 9% National Park and Preserve 2 876 7% National Seashore 1 295 2% National Scenic Riverway 1 499 4% Other (Rock Creek Park) 1 564 4% 14 8,656 65%
Primarily Cultural/historic area parks
National Memorial/Monument 3 1,865 14% National Historic Site 2 937 7% National Historical Park 3 1,301 10% National Historical Park and Preserve
1 554 4%
9 4,657 35%
23 Park units 13,313 100%
Table 1.3: 1997-1999 VSP studies by NPS unit designation

Visitor Use and Evaluation of Interpretive Media 16
Visitors to the units of the National Park System are diverse. Similarly, each visit to a unit of the National Park System has unique characteristics. For the purpose of this project, attention has been given to a variety of visitor and visit characteristics reported by respondents to the 23 VSP studies conducted in 1997, 1998, and 1999. Data included reflect variations in visitor group size, group type, group age structure, respondent age (age of the respondents, 18 or older, filling out the questionnaire for their party), frequency of visits, and length of visit. Visitors to units of the National Park System are also ethnically and racially diverse, have a variety of abilities and disabilities, have varying educational backgrounds, and represent a range of personal income categories. Data regarding ethnicity, race, disability status, educational attainment, and income were sparse in the 23 studies analyzed for this report. This lack of data should be treated as a limitation of this report. Such information has been collected more frequently in VSP studies conducted since 1999, and analysis of those data could provide usable information for interpretive planners and park managers. Understanding visitor and visit characteristics is a critical first step in the design of interpretive media and programs that both appeal to and meet the needs of specific park visitors. Knowing characteristics of the potential audience for a given media type and having accurate information on a park unit's visiting population are essential elements of effective interpretive planning. This report provides such information.
Ranger-guided program for organized school group, Yosemite National Park, 1938
Section 2: Visitors To Selected National Park Units, 1997-1999

Visitor Use and Evaluation of Interpretive Media 17
Table 2.1, below, identifies the six broad categories of visitor and visit characteristics and the variables within each category used in this report. The broad visitor and visit characteristics are in the left column. The specific response options included on the questionnaires within each visitor or visit characteristic used in this report are in the right column. Visitor and visit characteristic Visitor and visit characteristic variables
Visitor group size One, Two, Three or four, Five or more Visitor group type Alone, Family, Friends, Family & friends, Tour
group, Other Respondent age 30 or younger, 31-40, 41-50, 51-60, 61 or older Visitor group age structure Adults only, Adults & children, Seniors only,
Seniors & adults Frequency of visits First visit, Repeat visit Length of visit Less than 2 hours, 2-4 hours, 4-6 hours, 6-16 hours,
17+ hours
Table 2.1: Visitor and visit characteristics and variables When data is presented throughout this report, it is illustrated in the tables to follow. In some cases, statements will be made about one bar on a given figure. In other cases, data from more than one bar on a given figure will be aggregated to illustrate a point made in a statement. Summary use data from the 23 studies analyzed here indicates the following: • The highest proportion of park visitors (39%) were in groups of two. Fifty percent of
park visitors were in groups of three or more (see Figure 2.1). • The highest proportion of park visitors (52%) were traveling with family groups (see
Figure 2.2). • More than 60% of respondents were 50 years old or younger (see Figure 2.3). • Fifty-two percent of respondents were in groups consisting of adults (18-60 years) only
(see Figure 2.4). • A slight majority of park visitors (55%) were first-time visitors to the specific park site
(see Figure 2.6). • More than 40% of park visits were under 4 hours in length (see Figure 2.6). Figures 2.1-2.6 (pages 18-20) summarize the characteristics of visitors and their visits to the 23 units of the National Park System surveyed in 1997, 1998, and 1999.

Visitor Use and Evaluation of Interpretive Media 18
N=13,235 respondents
22%
28%
39%
10%
0 20 40 60 80 100
One
Two
Three or four
Five or more
Group size
Proportion of respondents (%)
Figure 2.1: Visitor group size, 1997-1999 VSP studies (Percentages do not equal 100% due to rounding.)
N=13,171 respondents
8%
4%
9%
15%
52%
11%
0 20 40 60 80 100
Alone
Family
Friends
Family and friends
Other
Tour group
Group type
Proportion of respondents (%)
Figure 2.2: Visitor group type, 1997-1999 VSP studies (Percentages do not equal 100% due to rounding.)

Visitor Use and Evaluation of Interpretive Media 19
N=13,127 respondents
16%
19%
28%
22%
14%
0 20 40 60 80 100
30 or younger
31-40
41-50
51-60
61 or older
Respondent age (years)
Proportion of respondents (%)
Figure 2.3: Respondent age, 1997-1999 VSP studies (Percentages do not equal 100% due to rounding.)
N=13,135 respondents
11%
9%
28%
52%
0 20 40 60 80 100
Adults only
Adults andchildren
Seniors only
Seniors andadults
Group age structure
Proportion of respondents (%)
Figure 2.4: Visitor group age structure, 1997-1999 VSP studies

Visitor Use and Evaluation of Interpretive Media 20
N=11,820 respondents
45%
55%
0 20 40 60 80 100
First visit
Repeat visit
Frequency of visits
Proportion of respondents (%)
Figure2.5: Frequency of visits, 1997-1999 VSP studies
N=12,321 respondents
21%
22%
12%
16%
29%
0 20 40 60 80 100
Less than 2 hours
2-4 hours
4-6 hours
6-16 hours
17 or more hours
Length of visit
Proportion of respondents (%)
Figure 2.6: Length of visit, 1997-1999 VSP studies

Visitor Use and Evaluation of Interpretive Media 21
Visitors to units of the National Park System may use a variety of non-personal interpretive media while in a park. They may also participate in personal or ranger-guided programs. Understanding which media types are used most frequently by park visitors can be valuable to interpretive planners. An understanding of those who do not use certain interpretive media can allow planners to develop strategies that meet the needs of underserved visitors and visitor populations. Data analyzed here were gathered in short-term studies specific to individual park sites. Results may not apply to all NPS areas, however they can indicate general patterns of interpretive media use.
Museum exhibit, Great Smoky Mountains National Park, circa 1950 Visitor Services Project questionnaires are designed for the individual park unit in which the study is conducted. Some questions are included in all VSP surveys. Several questions are included in many questionnaires. Other questions are customized for a specific park’s needs. As a result of the unique, customized nature of each survey instrument, it has been necessary to define broad categories of interpretive media for this analysis. Table 3.1 (page 22) identifies the broad interpretive media categories used in this report in the left column. The numerous specific terms associated with each broad category and used in the 23 individual studies are listed in the right column.
Section 3: Visitor Use of Interpretive Media

Visitor Use and Evaluation of Interpretive Media 22
Interpretive media Specific terms used in individual VSP studies, 1997-1999
Park brochures (22 parks)
Park brochure/map, Park brochure, Site brochures, NPS park brochure/map, Brochure/map, NPS brochure
Visitor center exhibits (17 parks)
Visitor center exhibits, Museum exhibits, Visitor center museum exhibit, Exhibits, NPS visitor center exhibits, Nature center exhibits
Wayside exhibits (13 parks)
Roadside or trailside exhibits, Outside information exhibits, Road and trail-side exhibits, Roadside exhibits, Roadside/trailside exhibits, Outdoor exhibits, Self-guided trail signs, Roadside/wayside exhibits, Trail exhibits, Trailside exhibits, Outdoor maps, Outdoor exhibits/trail signs
Audio-visual programs (9 parks)
Visitor center audio-visual programs, Slide show/video, Slide program, Interactive exhibits (film, music), Visitor center movie, Orientation slide program, Visitor center video program, Visitor center slide program, Orientation slide show/videos, Visitor center orientation film, Visitor center orientation video, NPS visitor center film, Park movie/video
Self-guided tours (12 parks)
Self-guided trail guide, Walking tour, Battlefield trail, Battlefield auto tour, Self-guided tour, Self-guided trails, Trail map, Canal brochure, Road guide booklets, Motor nature trail, Self-guided trail signs, Trail guides, Self-guided trail brochures, Self-guided nature trails, Nature trail brochures, Self-guided walking tour, Nature trail/historic tour brochure, Self-guiding trails, Self-guided trail map, Self-guided walks
Park newspapers (7 parks)
Park newspaper, Park newsletter
Bulletin boards (12 parks)
Bulletin boards, Informational bulletin boards, NPS daily activities schedule
Internet/park websites (2 parks)
Internet home page, Internet homepage
Park information radio stations (3 parks)
Park information radio station, Park radio information station, Park radio station, Site information radio station, Park travelers information radio station
Ranger-guided programs (23 parks)
Ranger-led walks/talks, Ranger-led programs, Tours, Ranger-led programs/activities, Ranger/volunteer-led programs, Junior ranger program, Ranger-led walking tour, Ranger-led canoe tour, Ranger-led tours or programs, Ranger-led walks/talks/tours, NPS ranger program in visitor center auditorium, NPS live presentation in visitor center auditorium, Campfire program, Ranger talk, Wet walk, Canoe tour, Bicycle tour, Ranger-led talks, Ranger-led tours, NPS junior ranger program, Guided walking tour, Ranger auditorium presentation, Ranger narration on tour boat, Ranger-led walk/hike, Camper orientation by ranger, Boater orientation by ranger, Boater marine VHF weather and information report by ranger
Table 3.1: Interpretive media categories and specific terms
Figure 3.1 (page 23) illustrates visitor use of interpretive media from the 23 visitor surveys conducted between 1997 and 1999. • Park brochures were used by the largest proportion (62%) of visitors who reported use
of interpretive media. • Fifty-four percent of park visitors surveyed reported using visitor center exhibits. • Wayside exhibits were used by 35% of visitors surveyed.

Visitor Use and Evaluation of Interpretive Media 23
• One-third of visitors surveyed (33%) reported use of self-guided tours. • Audio-visual programs, park newspapers, bulletin boards, park information radio
stations, and internet/park websites were each used by fewer than one-third of all park visitors surveyed. It is important to note that questions regarding use of park information radio stations and internet/park websites were included in only three and two surveys, respectively. In addition, the questions regarding use of internet/park websites asked if visitors used them on their visit to the park, not in preparation for their visit. It is likely that visitors referred to use of internet/park websites used prior to the actual park visit.
• Twenty-two percent of all park visitors surveyed reported participation in ranger-
guided programs.
54%
35%
33%
27%
26%
21%
9%
7%
62%
22%
0 20 40 60 80 100
Ranger-guided programs (N=10,103)
Internet/park websites (N=1,320)
Park information radio stations(N=1,990)
Bulletin boards (N=5,370)
Park newspapers (N=3,398)
Audio-visual programs (N=4,499)
Self-guided tours (N=4,725)
Wayside exhibits (N=6,275)
Visitor center exhibits (N=8,029)
Park brochures (N=9,588)
Interpretive media
Proportion of respondents (% of N)
Figure 3.1: Visitor use of interpretive media, 1997-1999 VSP studies (Percentages do not equal 100%. Respondents reported on all types of interpretive media used.)

Visitor Use and Evaluation of Interpretive Media 24
Visitors to selected units of the National Park System surveyed in 1997, 1998, and 1999 evaluated the importance and quality of interpretive media they utilized and ranger-guided programs in which they participated. Importance and quality data were collected regarding only those types of interpretive media a respondent reported using. Visitors did not evaluate the importance or quality of interpretive media they did not use on the given park visit. “Importance” here is taken to mean the importance to the visitor of a given type of interpretive media used on a park visit. Similarly, “quality” is the visitor’s opinion of the quality of the interpretive media. Importance data can provide interpretive planners with useful information regarding visitor preferences and the value visitors place on particular media types. Data regarding visitor evaluation of interpretive media quality is critical in assessing the effectiveness of NPS services and facilities. Understanding visitor preferences and variations in the evaluation of interpretive media can help park planners choose the appropriate media for a specific park’s visitors. In park situations where finances or resources are limited, park managers may choose the interpretive media appropriate to their site’s visitor population.
Visitor center exhibit preparation, Theodore Roosevelt National Park, 1959 Importance of Interpretive Media Visitors evaluated the importance of various interpretive media using a rating scale with values ranging from one to five, with one being “not important” and five being “extremely important.” For this report, overall mean importance ratings have been calculated in which the numerical importance ratings of all responses have been aggregated to provide one
Section 4: Visitor Evaluation of Interpretive Media

Visitor Use and Evaluation of Interpretive Media 25
overall importance rating for the type of interpretive media. Mean numerical values falling within specific ranges corresponding with importance ratings are illustrated in Table 4.1, below. It is important to note that respondents were not asked to rank the importance of interpretive media used during their visit. Respondents simply assigned an importance value (from one to five) for each type of interpretive media used. The aggregation of responses from all 23 studies and calculation of an overall mean importance value have been done specifically for this analysis.
Mean numerical value
Importance rating
Actual Range 1 1.00-1.49 “Not important” 2 1.50-2.49 “Somewhat important” 3 2.50-3.49 “Moderately important” 4 3.50-4.49 “Very important” 5 4.50-5.00 “Extremely important”
Table 4.1: Importance rating scale for interpretive media
Using the mean importance ratings calculated for each type, the media have been assigned an importance ranking for inclusion in this report. These rankings are shown in Table 4.2 (page 26). It is important to note that the variation in means indicating importance of interpretive media is minimal. While importance ranks are assigned to the various types of interpretive media, the importance rating of “not important,” “somewhat important,” “moderately important,” “very important,” or “extremely important” is more consistent with the responses given by visitors surveyed. Analysis of data from the 23 visitor surveys conducted between 1997 and 1999 indicate the following regarding the importance of interpretive media used on park visits: • All forms of interpretive media were rated as “very important” or “moderately
important.” • Self-guided tours were rated as the most important interpretive media type overall. • Park brochures, audio-visual programs, bulletin boards, and park newspapers each
received importance ratings placing them in the “very important” category. • Internet/park websites, visitor center exhibits, wayside exhibits, and park information
radio stations each received importance ratings placing them in the “moderately important” category.
• Park information radio stations received the lowest overall importance rating, though
they were still considered to be “moderately important.”

Visitor Use and Evaluation of Interpretive Media 26
• Ranger-guided programs were categorized as “very important,” and ranked higher in importance than all non-personal media except self-guided tours and park brochures.
Interpretive media Importance
Mean Rating Rank Self-guided tours 4.32 “Very important” 1 Park brochures 4.29 “Very important” 2 Audio-visual programs 4.09 “Very important” 3 Bulletin boards 3.70 “Very important” 4 Park newspapers 3.57 “Very important” 5 Internet/park websites 3.49 “Moderately important” 6 Visitor center exhibits 3.43 “Moderately important” 7 Wayside exhibits 3.27 “Moderately important” 8 Park information radio stations
2.99 “Moderately important” 9
Ranger-guided programs 4.17 “Very important”
Table 4.2: Importance of interpretive media – rating and rank order Quality of Interpretive Media Visitors evaluated the quality of various interpretive media they used on a park visit using a rating scale with values ranging from one to five, with one being “very poor” and five being “very good.” For this report, overall mean quality ratings have been calculated in which the numerical quality ratings of all responses have been aggregated to provide one overall quality rating for the type of interpretive media used. Mean numerical values falling within specific ranges corresponding with quality ratings are illustrated in Table 4.3. It is important to note that respondents were not asked to rank-order the quality of interpretive media used during their visit. Respondents simply assigned a quality value (from one to five) for each type of interpretive media used. The aggregation of responses from all 23 studies and calculation of an overall mean quality value have been done specifically for this analysis.
Mean numerical value Quality rating
Actual Range 1 1.00-1.49 “Very poor” 2 1.50-2.49 “Poor” 3 2.50-3.49 “Average” 4 3.50-4.49 “Good” 5 4.50-5.00 “Very good”
Table 4.3: Quality rating scale for interpretive media
Using the mean quality ratings calculated for each type, the media have been assigned an overall quality ranking for this report. Table 4.4 (page 27) illustrates the overall quality of

Visitor Use and Evaluation of Interpretive Media 27
interpretive media as reported by respondents to the 23 VSP studies. It is important to note that the variation in mean numerical values indicating quality of interpretive media is minimal. While quality ranks are assigned to the various types of interpretive media, the quality rating of “very poor,” “poor,” “average,” “good,” or “very good” is more consistent with the responses given by visitors surveyed. Analysis of data from the 23 VSP studies included here indicates the following regarding the quality of interpretive media used on park visits: • Audio-visual programs were rated as the highest in quality. • All types of interpretive media, with the exception of park information radio stations,
received overall mean quality ratings placing them in the “good” category. • Park information radio stations received the lowest quality rating of any type of
interpretive media, placing them in the “average” category. • Ranger-guided programs were rated higher in quality than all types of non-personal
interpretive media.
Interpretive media Quality
Mean Rating Rank Audio-visual programs 4.28 “Good” 1 Park brochures 4.27 “Good” 2 Self-guided tours 4.20 “Good” 3 Visitor center exhibits 4.16 “Good” 4 Wayside exhibits 4.12 “Good” 5 Park newspapers 4.07 “Good” 6 Bulletin boards 3.97 “Good” 7 Internet/park websites 3.60 “Good” 8 Park information radio stations
3.14 “Average” 9
Ranger-guided programs 4.38 “Good”
Table 4.4: Quality of interpretive media – rating and rank order

Visitor Use and Evaluation of Interpretive Media 28
Visitors to units of the National Park System surveyed in 1997, 1998, and 1999 were traveling alone or in groups of varying size. On the survey instruments, visitors reported the actual size of their personal group, not the size of an organized tour group they may have been part of. In this report, the following group size categories are used: alone, groups of 2, groups of 3 or 4, and groups of 5 or more. Variations in the size of groups can influence the activities in which a group engages while visiting a park. Use of interpretive media and ranger-guided programs varied with group size. Groups of different sizes evaluated the importance and quality of interpretive media in unique ways. Knowledge of the variations in use and evaluation of interpretive media by groups of different size allows interpretive planners to tailor media appropriately or to identify barriers to interpretive media use based on group size. In addition, knowledge of the use of interpretive media by groups of different sizes can allow park managers to anticipate issues of crowding, capacity of use in certain areas and of certain facilities, and to assign staff and schedule maintenance of interpretive media accordingly.
Scenic overlook, Zion National Park, 1955 Use of Interpretive Media Groups of 2 were the most common users of all types of interpretive media, followed by groups of 3 or 4 individuals. Visitors traveling alone made less use of interpretive media than groups of all sizes. Solitary visitors accounted for 10% of all visitors surveyed and accounted for less than 10% of those reporting use of all types of interpretive media.
Section 5: Use and Evaluation of Interpretive Media by Groups of Different Size

Visitor Use and Evaluation of Interpretive Media 29
Analysis of individual interpretive media use data indicates the following:: • Park brochures were used primarily by visitors in groups of 2 or more (94%). Only 6%
of visitors reporting use of park brochures were traveling alone (see Figure 5.1). • Forty-three percent of those reporting use of visitor center exhibits were in groups of 2.
Few respondents reporting use of visitor center exhibits (5%) were visiting alone. (see Figure 5.2).
• Seventy-three percent of wayside exhibit users were in groups of 2 to 4. Six percent of
those reporting use of waysides were visiting the park alone (see Figure 5.3). • Forty-five percent of those reporting use of audio-visual programs were in groups of 2
while only 6% of visitors reporting use of audio-visual programs were traveling alone (see Figure 5.4).
• Self-guided tours were used primarily by visitor groups of 2 or more (97%). Only 4% of
respondents reporting use of self-guided tours were solitary travelers (see Figure 5.5). • Seventy-five percent of those reporting use of park newspapers were in groups of 2 to 4.
The smallest proportion of visitors reporting use of park newspapers (3%) were traveling alone (see Figure 5.6).
• Internet/park websites were used in highest proportions by visitors in groups of 3 or
more (58%). Six percent of those reporting use of internet/park websites were visiting the park alone (see Figure 5.7).
• Seventy-two percent of those reporting use of park bulletin boards were in groups of 2
to 4 visitors. Six percent of those reporting use of bulletin boards were visiting the park alone (see Figure 5.8).
• Eighty-three percent of respondents reporting use of park information radio stations
were in groups of 2 to 4 visitors while only 4% of those reporting such use were solitary visitors (see Figure 5.9).
• The highest proportion of visitors reporting participation in ranger-guided programs
(42%) were in groups of 2. Only 5% of park visitors traveling alone participated in ranger-guided programs (see Figure 5.10).
On the following figures, the black bars represent the percentage of visitors who reported use of a particular type of interpretive media who were in groups of a given size. The proportion of all park visitors sharing a particular visitor or visit characteristic is provided for comparison and represented by the gray bars. For instance, Figure 5.1 indicates that 23% of visitors reporting use of park brochures were in groups of 5 or more and 22% of all park visitors were in groups of 5 or more.

Visitor Use and Evaluation of Interpretive Media 30
22 parks; 9,834 respondents
39%
28%
22%
10%
41%
30%
23%
6%
0 20 40 60 80 100
One
Two
Three orfour
Five ormore
Group size
Proportion of respondents (%)
% of visitors using parkbrochures% of all park visitors
Figure 5.1: Use of park brochures by visitor group size (Percentages may not equal 100% due to rounding.)
17 parks; 8,240 respondents
22%
28%
39%
10%
21%
31%
43%
5%
0 20 40 60 80 100
One
Two
Three orfour
Five ormore
Group size
Proportion of respondents (%)
% of visitors using visitorcenter exhibits% of all park visitors
Figure 5.2: Use of visitor center exhibits by visitor group size (Percentages may not equal 100% due to rounding.)

Visitor Use and Evaluation of Interpretive Media 31
13 parks; 6,423 respondents
22%
28%
39%
10%
21%
32%
41%
6%
0 20 40 60 80 100
One
Two
Three orfour
Five ormore
Group size
Proportion of respondents (%)
% of visitors using waysideexhibits% of all park visitors
Figure 5.3: Use of wayside exhibits by visitor group size (Percentages may not equal 100% due to rounding.)
9 parks; 4,598 respondents
10%
22%
28%
39%
20%
29%
45%
6%
0 20 40 60 80 100
One
Two
Three orfour
Five ormore
Group size
Proportion of respondents (%)
% of visitors using audio-visual programs% of park visitors
Figure 5.4: Use of audio-visual programs by visitor group size
(Percentages may not equal 100% due to rounding.)

Visitor Use and Evaluation of Interpretive Media 32
12 parks; 4,842 respondents
22%
28%
39%
10%
23%
32%
42%
4%
0 20 40 60 80 100
One
Two
Three orfour
Five ormore
Group size
Proportion of respondents (%)
% of visitors using self-guided tours% of park visitors
Figure 5.5: Use of self-guided tours by visitor group size (Percentages do not equal 100% due to rounding.)
7 parks; 3,485 respondents
22%
28%
39%
10%
22%
35%
40%
3%
0 20 40 60 80 100
One
Two
Three orfour
Five ormore
Group size
Proportion of respondents (%)
% of visitors using parknewspapers% of all park visitors
Figure 5.6: Use of park newspapers by visitor group size (Percentages may not equal 100% due to rounding.)

Visitor Use and Evaluation of Interpretive Media 33
2 parks; 1,339 respondents
22%
28%
39%
10%
26%
32%
36%
6%
0 20 40 60 80 100
One
Two
Three orfour
Five ormore
Group size
Proportion of respondents (%)
% of visitors usinginternet/park websites% of all park visitors
Figure 5.7: Use of internet/park websites by visitor group size (Percentages may not equal 100% due to rounding.)
12 parks; 5,499 respondents
22%
28%
39%
10%
22%
32%
40%
6%
0 20 40 60 80 100
One
Two
Three orfour
Five ormore
Group size
Proportion of respondents (%)
% of visitors using bulletinboards% of all park visitors
Figure 5.8: Use of bulletin boards by visitor group size (Percentages may not equal 100% due to rounding.)

Visitor Use and Evaluation of Interpretive Media 34
3 parks; 2,031 respondents
10%
39%
28%
22%
4%
49%
34%
14%
0 20 40 60 80 100
One
Two
Three orfour
Five ormore
Group size
Proportion of respondents (%)
% of visitors using parkinformation radio stations% of all park visitors
Figure 5.9: Use of park information radio stations by visitor group size (Percentages do not equal 100% due to rounding.)
23 parks; 10,328 respondents
10%
39%
28%
22%
5%
42%
29%
24%
0 20 40 60 80 100
One
Two
Three orfour
Five ormore
Group size
Proportion of respondents (%)
% of visitors using ranger-guided programs% of all park visitors
Figure 5.10: Use of ranger-guided programs by visitor group size (Percentages may not equal 100% due to rounding.)

Visitor Use and Evaluation of Interpretive Media 35
Importance of Interpretive Media Visitors evaluated the importance of various interpretive media using a rating scale with values ranging from one to five, with one being “not important” and five being “extremely important” as illustrated in Table 5.1, below.
Mean numerical value
Importance rating
Actual Range 1 1.00-1.49 “Not important” 2 1.50-2.49 “Somewhat important” 3 2.50-3.49 “Moderately important” 4 3.50-4.49 “Very important” 5 4.50-5.00 “Extremely important”
Table 5.1: Importance rating scale for interpretive media
All types of interpretive media and ranger-guided programs were rated as either “very important” or “moderately important” by visitors in groups of all sizes. Respondents in groups of all sizes rated park brochures, self-guided tours, park newspapers, bulletin boards, and ranger-guided programs as “very important.” Respondents in groups of all sizes considered wayside exhibits and park information radio stations to be “moderately important.” Analysis of individual interpretive media importance data (illustrated in Table 5.2) indicates the following: • Park brochures received the highest or second highest mean importance rating from
visitor groups of all sizes. • Audio-visual programs were given the highest mean importance rating by visitors
traveling alone. • Visitors in groups of 3 or 4, and groups of 5 or more ranked self-guided tours as the most
important interpretive media. • Wayside exhibits and park information radio stations were each assigned the lowest
mean importance ratings by visitors in groups of all sizes.

Visitor Use and Evaluation of Interpretive Media 36
Interpretive media Visitor group size
One Two Three or four Five or more
Importance Rating Rank Rating Rank Rating Rank Rating RankPark brochures 4.19 2 4.36 1 4.29 2 4.29 2 Visitor center exhibits 3.66 4 3.54 6 3.29 7 3.24 7 Wayside exhibits 3.25 8 3.20 7 3.08 9 3.22 8 Audio-visual programs 4.23 1 3.17 8 4.07 3 4.08 3 Self-guided tours 4.17 3 4.29 2 4.38 1 4.35 1 Park newspapers 3.50 6 3.60 5 3.78 4 3.52 6 Internet/park websites 3.43 7 3.73 3 3.57 6 3.61 5 Bulletin boards 3.51 5 3.69 4 3.64 5 3.71 4 Park information radio stations
3.14 9 2.99 9 3.11 8 3.00 9
Ranger-guided programs 3.93 4.16 4.18 4.21
Table 5.2: Importance of interpretive media by visitor group size Quality of Interpretive Media Visitors evaluated the quality of various interpretive media they used on a given park visit using a rating scale with values ranging from one to five, with one being “very poor” and five being “very good” as illustrated in Table 5.3, below.
Mean numerical value Quality rating
Actual Range 1 1.00-1.49 “Very poor” 2 1.50-2.49 “Poor” 3 2.50-3.49 “Average” 4 3.50-4.49 “Good” 5 4.50-5.00 “Very good”
Table 5.3: Quality rating scale for interpretive media
All types of interpretive media and ranger-guided programs were considered to be of “good” quality by visitors in groups of all sizes with only two exceptions. Solitary visitors considered the quality of internet/park websites to be “average.” Visitors in groups of all sizes considered park information radio stations to be “average” in quality. Analysis of individual interpretive media quality data (illustrated in Table 5.4) indicates the following: • Park brochures were ranked highest in quality by visitors in groups of 5 or more.
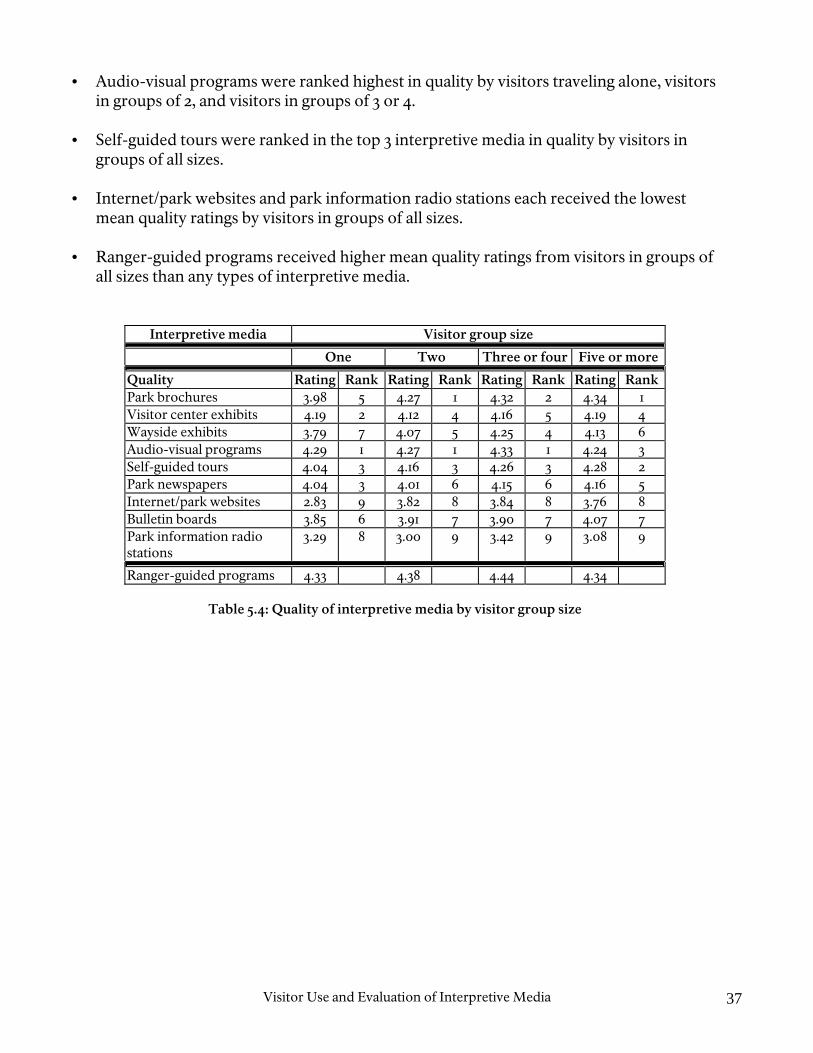
Visitor Use and Evaluation of Interpretive Media 37
• Audio-visual programs were ranked highest in quality by visitors traveling alone, visitors in groups of 2, and visitors in groups of 3 or 4.
• Self-guided tours were ranked in the top 3 interpretive media in quality by visitors in
groups of all sizes. • Internet/park websites and park information radio stations each received the lowest
mean quality ratings by visitors in groups of all sizes. • Ranger-guided programs received higher mean quality ratings from visitors in groups of
all sizes than any types of interpretive media.
Interpretive media Visitor group size
One Two Three or four Five or more
Quality Rating Rank Rating Rank Rating Rank Rating RankPark brochures 3.98 5 4.27 1 4.32 2 4.34 1 Visitor center exhibits 4.19 2 4.12 4 4.16 5 4.19 4 Wayside exhibits 3.79 7 4.07 5 4.25 4 4.13 6 Audio-visual programs 4.29 1 4.27 1 4.33 1 4.24 3 Self-guided tours 4.04 3 4.16 3 4.26 3 4.28 2 Park newspapers 4.04 3 4.01 6 4.15 6 4.16 5 Internet/park websites 2.83 9 3.82 8 3.84 8 3.76 8 Bulletin boards 3.85 6 3.91 7 3.90 7 4.07 7 Park information radio stations
3.29 8 3.00 9 3.42 9 3.08 9
Ranger-guided programs 4.33 4.38 4.44 4.34
Table 5.4: Quality of interpretive media by visitor group size

Visitor Use and Evaluation of Interpretive Media 38
Park visitors identified themselves as traveling alone, with family, with friends, with family and friends, or as part of an organized tour group. Data from the group type category “other” will not be discussed in this report. Respondents using the category of “other” to describe their group did not provide any description of their group so any reporting here would have little meaning. Use and evaluation of interpretive media and ranger-guided programs varied with visitor group type. Knowledge of the use and evaluation patterns of groups of various types can help park managers and interpretive planners to tailor media to the visitors common to a given park unit. In particular, knowledge of use and evaluation of interpretive media by family groups can lead to design choices accommodating different family members’ interests and abilities. Similarly, knowledge of the ways in which large tour groups use interpretive media can influence facility planning, staffing, and maintenance.
Park visitors, Castillo de San Marcos National Monument, 1955
Use of Interpretive Media Family groups were the most frequent users of all types of interpretive media (47% to 94% of those reporting use of interpretive media). Family groups made greatest use of interpretive media that have an orientation or information function and can be used independently. These include park brochures, park newspapers, internet/park websites, and park information radio stations. Regarding exhibits, family groups made greater use of wayside exhibits than they did of visitor center exhibits.
Section 6: Use and Evaluation of Interpretive Media by Different Group Types

Visitor Use and Evaluation of Interpretive Media 39
Analysis of individual interpretive media use data indicates the following: • Sixty percent of visitors reporting use of park brochures were in family groups. Only
6% of those reporting use of park brochures were in tour groups (see Figure 6.1). • While accounting for only 9% of all park visitors, groups of friends accounted for 15% of
those reporting use of visitor center exhibits. The smallest proportion of those using visitor center exhibits (7%) were alone (see Figure 6.2).
• Seventy-two percent of park visitors reporting use of wayside exhibits were in groups
consisting of family or family and friends. Only 3% of those using wayside exhibits were in tour groups (see Figure 6.3).
• Seventeen percent of visitors reporting use of audio-visual programs were in groups of
friends. Eleven percent of visitors reporting use of audio-visual programs were in tour groups. These two group types account for 17% of all visitors surveyed (see Figure 6.4).
• Seventy-seven percent of those visitors reporting use of self-guided tours were in family
groups (57%), groups of friends (11%), or in tour groups (9%). The smallest proportion of visitors reporting use of self-guided tours (6%) were traveling alone (see Figure 6.5).
• Sixty-nine percent of those using park newspapers were in family groups. Only 2% of
those in tour groups reported using park newspapers (see Figure 6.6). • Visitors in family groups accounted for 74% of those reporting use of internet/park
websites. Visitors in tour groups accounted for only 2% of those reporting use of internet/park websites (see Figure 6.7).
• Bulletin boards were used in the highest proportion (60%) by visitors in family groups.
Visitors traveling alone and those in tour groups each accounted for 6% of those reporting use of bulletin boards (see Figure 6.8).
• Seventy-two percent of visitors using park information radio stations were traveling in
family groups. Only 1% of visitors reporting use of park information radio stations were in tour groups (see Figure 6.9).
• Tour groups accounted for 11% of those participating in ranger-guided programs (see
Figure 6.10). On the following figures, the black bars represent the percentage of visitors who reported use of a particular type of interpretive media who were in groups of a given type. The proportion of all park visitors sharing a particular visitor characteristic is provided for comparison and represented by the gray bars. For instance, Figure 6.1 indicates that 6% of visitors reporting use of park brochures were in tour groups and 8% of all park visitors were in tour groups.

Visitor Use and Evaluation of Interpretive Media 40
22 parks; 9,784 respondents
8%
4%
15%
9%
52%
11%
6%
4%
9%
14%
60%
7%
0 20 40 60 80 100
Alone
Family
Friends
Family andfriends
Other
Tour group
Group type
Proportion of respondents (%)
% of visitors using parkbrochures% of all park visitors
Figure 6.1: Use of park brochures by visitor group type (Percentages may not equal 100% due to rounding.)
17 parks; 8,159 respondents
8%
4%
15%
9%
52%
11%
9%
4%
9%
15%
55%
7%
0 20 40 60 80 100
Alone
Family
Friends
Family andfriends
Other
Tourgroup
Group type
Proportion of respondents (%)
% of visitors using visitorcenter exhibits% of all park visitors
Figure 6.2: Use of Visitor center exhibits by visitor group type (Percentages do not equal 100% due to rounding.)

Visitor Use and Evaluation of Interpretive Media 41
13 parks; 6,368 respondents
8%
4%
15%
9%
52%
11%
3%
5%
7%
12%
65%
7%
0 20 40 60 80 100
Alone
Family
Friends
Family andfriends
Other
Tour group
Group type
Proportion of respondents (%)
% of visitors using waysideexhibits% of all park visitors
Figure 6.3: Use of wayside exhibits by visitor group type (Percentages do not equal 100% due to rounding.)
9 parks; 4,587 respondents
8%
4%
15%
9%
52%
11%
11%
5%
10%
17%
47%
9%
0 20 40 60 80 100
Alone
Family
Friends
Family and friends
Other
Tour group
Group type
Proportion of respondents (%)
% of visitors using audio-visual programs% of all park visitors
Figure 6.4: Use of audio-visual programs by visitor group type (Percentages do not equal 100% due to rounding.)

Visitor Use and Evaluation of Interpretive Media 42
12 parks; 4,844 respondents
8%
4%
15%
9%
52%
11%
9%
3%
11%
13%
57%
6%
0 20 40 60 80 100
Alone
Family
Friends
Family andfriends
Other
Tour group
Group type
Proportion of respondents (%)
% of visitors using self-guided tours% of all park visitors
Figure 6.5: Use of self-guided tours by visitor group type (Percentages do not equal 100% due to rounding.)
7 parks; 3,484 respondents
8%
4%
15%
9%
52%
11%
2%
2%
12%
11%
69%
4%
0 20 40 60 80 100
Alone
Family
Friends
Family andfriends
Other
Tour group
Group type
Proportion of respondents (%)
% of visitors using parknewspapers% of all park visitors
Figure 6.6: Use of park newspapers by visitor group type (Percentages may not equal 100% due to rounding.)

Visitor Use and Evaluation of Interpretive Media 43
2 parks; 1,341 respondents
11%
52%
9%
15%
4%
8%
5%
74%
10%
5%
3%
2%
0 20 40 60 80 100
Alone
Family
Friends
Family andfriends
Other
Tour group
Group type
Proportion of respondents (%)
% of visitors usinginternet/park websites% of all park visitors
Figure 6.7: Use of internet/park websites by visitor group type (Percentages do not equal 100% due to rounding.)
12 parks; 5,499 respondents)
8%
4%
15%
9%
52%
11%
6%
3%
12%
13%
60%
6%
0 20 40 60 80 100
Alone
Family
Friends
Family andfriends
Other
Tour group
Group type
Proportion of respondents (%)
% of visitors using bulletinboards% of all park visitors
Figure 6.8: Use of bulletin boards by visitor group type (Percentages may not equal 100% due to rounding.)

Visitor Use and Evaluation of Interpretive Media 44
3 parks; 1,965 respondents
11%
52%
9%
15%
4%
8%
5%
72%
15%
3%
4%
1%
0 20 40 60 80 100
Alone
Family
Friends
Family andfriends
Other
Tour group
Group type
Proportion of respondents (%)
% of visitors using parkinformation radio stations% of all park visitors
Figure 6.9: Use of park information radio stations by visitor group type (Percentages may not equal 100% due to rounding.)
23 parks; 10,274 respondents
8%
4%
15%
9%
52%
11%
11%
8%
9%
14%
51%
8%
0 20 40 60 80 100
Alone
Family
Friends
Family andfriends
Other
Tour group
Group type
Proportion of respondents (%)
% of visitors using ranger-guided programs% of all park visitors
Figure 6.10: Use of ranger-guided programs by visitor group type (Percentages do not equal 100% due to rounding.)

Visitor Use and Evaluation of Interpretive Media 45
Importance of Interpretive Media Visitors evaluated the importance of various interpretive media using a rating scale with values ranging from one to five, with one being “not important” and five being “extremely important” as illustrated in Table 6.1, below.
Mean numerical value
Importance rating
Actual Range 1 1.00-1.49 “Not important” 2 1.50-2.49 “Somewhat important” 3 2.50-3.49 “Moderately important” 4 3.50-4.49 “Very important” 5 4.50-5.00 “Extremely important”
Table 6.1: Importance rating scale for interpretive media
Park brochures, audio-visual programs, self-guided tours, bulletin boards, and ranger-guided programs were considered to be “very important” by groups of all types. All other forms of interpretive media were considered to be either “very important” or “moderately important” by groups of all types with one exception. Respondents on tour groups considered park information radio stations to be “somewhat important.” Analysis of individual interpretive media importance data (illustrated in Table 6.2) indicates the following: • Park brochures received the highest mean importance rating from family groups. • Self-guided tours were ranked as the most important interpretive media by visitors in all
other group types. • Wayside exhibits and park information radio stations received the lowest mean
importance ratings by all types of visitor groups. • Members of tour groups rated ranger-guided programs higher in importance than any
type of interpretive media.

Visitor Use and Evaluation of Interpretive Media 46
Interpretive media Visitor group type
Alone Family Friends Family & friends
Tour group
Importance Rating Rank Rating Rank Rating Rank Rating Rank Rating Rank
Park brochures 4.23 2 4.36 1 4.25 2 4.29 2 4.18 3 Visitor center exhibits 3.77 4 3.32 7 3.34 7 3.83 4 4.11 4 Wayside exhibits 3.18 9 3.12 8 3.15 8 3.09 8 3.43 7 Audio-visual programs 4.22 3 4.14 3 4.03 3 4.06 3 4.26 2 Self-guided tours 4.29 1 4.33 2 4.30 1 4.40 1 4.29 1 Park newspapers 3.70 6 3.71 4 3.43 5 3.48 7 3.05 8 Internet/park websites 3.33 7 3.71 4 3.40 6 3.50 6 3.50 6 Bulletin boards 3.76 5 3.66 6 3.69 4 3.77 5 3.67 5 Park information radio stations
3.22 8 3.09 9 3.07 9 2.67 9 2.00 9
Ranger-guided programs 4.11 4.17 4.01 4.26 4.33
Table 6.2: Importance of interpretive media by visitor group type Quality of Interpretive Media Visitors evaluated the quality of various interpretive media they used on a given park visit using a rating scale with values ranging from one to five, with one being “very poor” and five being “very good” as illustrated in Table 6.3, below.
Mean numerical value Quality rating
Actual Range 1 1.00-1.49 “Very poor” 2 1.50-2.49 “Poor” 3 2.50-3.49 “Average” 4 3.50-4.49 “Good” 5 4.50-5.00 “Very good”
Table 6.3: Quality rating scale for interpretive media
All types of interpretive media and ranger-guided programs were considered to be of “good” quality by visitors in all group types with few exceptions. Individuals traveling alone rated internet/park websites as “average” in quality. Visitors traveling alone, in family groups, in groups of friends, and in tour groups found park information radio stations to be of “average” quality, and visitors in groups of family and friends found park information radio stations to be of “poor” quality. Respondents in tour groups rated the quality of ranger-guided programs to be “very good,” the only such assessment reported on here.

Visitor Use and Evaluation of Interpretive Media 47
Analysis of individual interpretive media quality data (illustrated in Table 6.4) indicates the following: • Park brochures were rated as highest in quality by family groups and groups of family
and friends. • Audio-visual programs were rated highest in quality by visitors traveling alone, visitors
in groups of friends, and visitors in organized tour groups. • Park information radio stations received the lowest mean quality ratings from visitors in
groups of all types. • Ranger-guided programs were rated higher in quality than any type of interpretive
media by visitors in groups of all types.
Table 6.4: Quality of interpretive media by visitor group type
Interpretive media Visitor group type
Alone Family Friends Family & friends
Tour group
Quality Rating Rank Rating Rank Rating Rank Rating Rank Rating Rank
Park brochures 4.01 4 4.32 1 4.21 2 4.29 1 4.29 3 Visitor center exhibits 4.21 2 4.16 4 4.08 4 4.13 5 4.19 5 Wayside exhibits 3.80 6 4.12 5 4.07 5 4.17 4 4.40 2 Audio-visual programs 4.27 1 4.28 2 4.25 1 4.20 3 4.48 1 Self-guided tours 4.04 3 4.23 3 4.16 3 4.26 2 4.27 4 Park newspapers 4.00 5 4.12 5 3.90 7 4.11 6 3.82 7 Internet/park websites 2.80 9 3.82 8 3.60 8 3.80 8 3.50 8 Bulletin boards 3.72 7 3.89 7 4.04 6 4.05 7 4.05 6 Park information radio stations
3.33 8 3.15 9 3.41 9 1.83 9 2.50 9
Ranger-guided programs 4.42 4.38 4.29 4.40 4.61

Visitor Use and Evaluation of Interpretive Media 48
S Visitors who responded to the 23 VSP surveys conducted in 1997, 1998, and 1999 reported the age of the individual filling out the questionnaire for the group, and for all members of their personal group. For the purposes of this project, respondent age refers to the age of the actual respondent in each visitor group who agreed to fill out the VSP questionnaire. Individuals responding to the surveys were in the following age ranges: 30 or younger, 31-40, 41-50, 51-60, and 61 or older. Respondents of different ages indicated unique patterns of use and evaluation of interpretive media. Interpretive planners can apply knowledge of use and evaluation patterns to the design of media geared for visitors of different ages.
Wayside audio device, Castillo de San Marcos National Monument, 1957
Use of Interpretive Media All types of interpretive media were most commonly used by visitors aged 41-50 years (27% to 39% of those reporting use of interpretive media). Respondents aged 41-50 made greatest use of interpretive media that has an orientation function and that can be used independently. These include park brochures, park newspapers, internet/park websites, and park information radio stations. In particular, park newspapers and internet/park websites were used in greatest proportions by respondents in the 41-50 age category. Use of park newspapers and internet/park websites by respondents of this age category is consistent with data regarding use of these media by family groups. Audio-visual programs and ranger-guided programs were used in greater proportion by visitors aged 51 to 60 and 61 or older.
Section 7: Use and Evaluation of Interpretive Media by Respondents of Different Ages
Visitor Use and Evaluation of Interpretive Media 49
Analysis of individual interpretive media use data indicates the following: • The highest proportion (54%) of respondents reporting use of park brochures were
between 31 and 50 years of age (see Figure 7.1). • Nearly three-fourths (72%) of respondents reporting use of visitor center exhibits were
41 years of age or older. Only 10% of those reporting use of visitor center exhibits were 30 or younger (see Figure 7.2).
• Seventy percent of those reporting use of wayside exhibits were 50 or younger (see
Figure 7.3). • Forty-nine percent of respondents using audio-visual programs were 51 years of age or
older. Only 9% of those reporting use of audio-visual programs were 30 or younger (see Figure 7.4).
• Most users of self-guided tours (73%) were between 31 and 60 years old. Visitors under
30 and 0ver 60 were the least represented among these users (see Figure 7.5). • The greatest proportion of respondents reporting use of park newspapers (37%) were
41-50 years of age. Only 10% of those reporting use of park newspapers were 61 or older (see Figure 7.6).
• Thirty-nine percent of respondents reporting use of internet/park websites were 41-50
years of age. Only 4% of those using internet/park websites were 61 years of age or older (see Figure 7.7).
• The greatest proportion of respondents using bulletin boards (34%) were 41-50 years
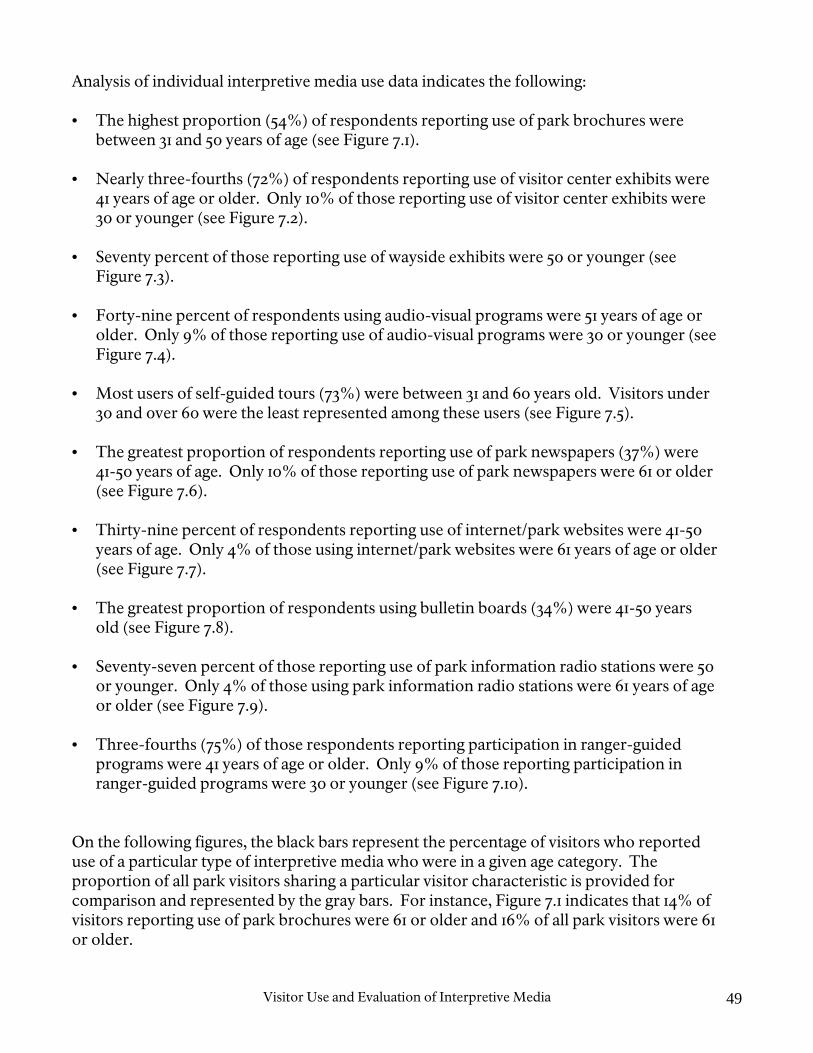
old (see Figure 7.8). • Seventy-seven percent of those reporting use of park information radio stations were 50
or younger. Only 4% of those using park information radio stations were 61 years of age or older (see Figure 7.9).
• Three-fourths (75%) of those respondents reporting participation in ranger-guided
programs were 41 years of age or older. Only 9% of those reporting participation in ranger-guided programs were 30 or younger (see Figure 7.10).
On the following figures, the black bars represent the percentage of visitors who reported use of a particular type of interpretive media who were in a given age category. The proportion of all park visitors sharing a particular visitor characteristic is provided for comparison and represented by the gray bars. For instance, Figure 7.1 indicates that 14% of visitors reporting use of park brochures were 61 or older and 16% of all park visitors were 61 or older.

Visitor Use and Evaluation of Interpretive Media 50
22 parks; 9,803 respondents
14%
22%
28%
19%
16%
13%
23%
31%
18%
14%
0 20 40 60 80 100
30 oryounger
31-40
41-50
51-60
61 or older
Respondent age(years)
Proportion of respondents (%)
% of visitors using parkbrochures% of all park visitors
Figure 7.1: Use of park brochures by respondents of different ages (Percentages do not equal 100% due to rounding.)
17 parks; 8,202 respondents
16%
19%
28%
22%
14%
20%
22%
30%
19%
10%
0 20 40 60 80 100
30 oryounger
31-40
41-50
51-60
61 or older
Respondent age(years)
Proportion of respondents (%)
% of visitors using visitorcenter exhibits% of all park visitors
Figure 7.2: Use of visitor center exhibits by respondents of different ages (Percentages do not equal 100% due to rounding.)

Visitor Use and Evaluation of Interpretive Media 51
13 parks; 6,408 respondents
16%
19%
28%
22%
14%
12%
18%
31%
24%
15%
0 20 40 60 80 100
30 oryounger
31-40
41-50
51-60
61 or older
Respondent age(years)
Proportion of respondents (%)
% of visitors using waysideexhibits% of all park visitors
Figure 7.3: Use of wayside exhibits by respondents of different ages (Percentages may not equal 100% due to rounding.)
9 parks; 4,581 respondents
16%
19%
28%
22%
14%
25%
24%
27%
15%
9%
0 20 40 60 80 100
30 oryounger
31-40
41-50
51-60
61 or older
Respondent age(years)
Proportion of respondents (%)
% of visitors using audio-visualprograms% of all park visitors
Figure 7.4: Use of audio-visual programs by respondents of different ages (Percentages may not equal 100% due to rounding.)

Visitor Use and Evaluation of Interpretive Media 52
12 parks; 4,824 respondents
16%
19%
28%
22%
14%
15%
21%
30%
22%
13%
0 20 40 60 80 100
30 oryounger
31-40
41-50
51-60
61 or older
Respondent age(years)
Proportion of respondents (%)
% of visitors using self-guidedtours% of all park visitors
Figure 7.5: Use of self-guided tours by respondents of different ages (Percentages do not equal 100% due to rounding.)
7 parks; 3,470 respondents
16%
19%
28%
22%
14%
10%
19%
37%
21%
12%
0 20 40 60 80 100
30 or younger
31-40
41-50
51-60
61 or older
Respondent age(years)
Proportion of respondents (%)
% or visitors using parknewspapers% of all park visitors
Figure 7.6: Use of park newspapers by respondents of different ages (Percentages do not equal 100% due to rounding.)

Visitor Use and Evaluation of Interpretive Media 53
2 parks; 1,335 respondents
16%
19%
28%
22%
14%
4%
17%
39%
24%
15%
0 20 40 60 80 100
30 oryounger
31-40
41-50
51-60
61 or older
Respondent age(years)
Proportion of respondents (%)
% of visitors using internet/parkwebsites% of all park visitors
Figure 7.7: Use of internet/park websites by respondents of different ages (Percentages do not equal 100% due to rounding.)
12 parks; 5,482 respondents
16%
19%
28%
22%
14%
12%
18%
34%
22%
14%
0 20 40 60 80 100
30 oryounger
31-40
41-50
51-60
61 or older
Respondent age(years)
Proportion of respondents (%)
% of visitors using bulletinboards% of all park visitors
Figure 7.8: Use of bulletin boards by respondents of different ages (Percentages may not equal 100% due to rounding.)
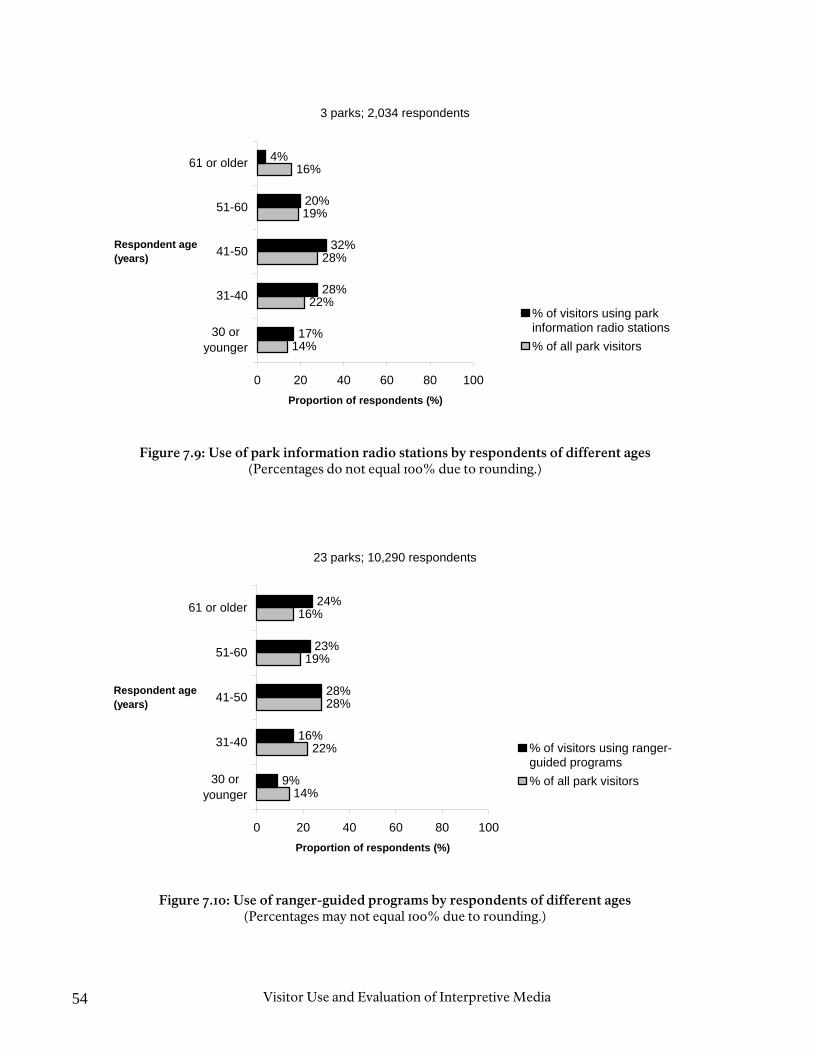
Visitor Use and Evaluation of Interpretive Media 54
3 parks; 2,034 respondents
16%
19%
28%
22%
14%
4%
20%
32%
28%
17%
0 20 40 60 80 100
30 oryounger
31-40
41-50
51-60
61 or older
Respondent age(years)
Proportion of respondents (%)
% of visitors using parkinformation radio stations% of all park visitors
Figure 7.9: Use of park information radio stations by respondents of different ages (Percentages do not equal 100% due to rounding.)
23 parks; 10,290 respondents
19%
16%
28%
22%
14%
28%
23%
24%
16%
9%
0 20 40 60 80 100
30 oryounger
31-40
41-50
51-60
61 or older
Respondent age(years)
Proportion of respondents (%)
% of visitors using ranger-guided programs% of all park visitors
Figure 7.10: Use of ranger-guided programs by respondents of different ages (Percentages may not equal 100% due to rounding.)

Visitor Use and Evaluation of Interpretive Media 55
Importance of Interpretive Media Visitors evaluated the importance of various interpretive media using a rating scale with values ranging from one to five, with one being “not important” and five being “extremely important” as illustrated in Table 7.1, below.
Mean numerical value
Importance rating
Actual Range 1 1.00-1.49 “Not important” 2 1.50-2.49 “Somewhat important” 3 2.50-3.49 “Moderately important” 4 3.50-4.49 “Very important” 5 4.50-5.00 “Extremely important”
Table 7.1: Importance rating scale for interpretive media
All types of interpretive media and ranger-guided programs were considered to be either “very important” or “moderately important” by respondents of all ages. In particular, park brochures, audio-visual programs, self-guided tours, bulletin boards, and ranger-guided programs were considered to be “very important” by respondents of all ages. Analysis of individual interpretive media importance data (illustrated in Table 7.2) indicates the following: • Park brochures were ranked as first or second in importance by respondents of all ages. • Visitor center exhibits, wayside exhibits, and park information radio stations each
received the lowest importance ratings from respondents of all ages, excluding seniors. • Visitor center exhibits and park information radio stations were each of somewhat
greater importance to respondents age 61 or older. • Wayside exhibits were considered to be “moderately important” to respondents in all
age groups. • Self-guided tours were ranked as first or second in importance by respondents of all
ages. • Ranger-guided programs were rated as “very important” by respondents of all ages.

Visitor Use and Evaluation of Interpretive Media 56
Interpretive media Respondent age (years)
30 or younger
31-40 41-50 51-60 61 or older
Importance Rating Rank Rating Rank Rating Rank Rating Rank Rating Rank
Park brochures 4.21 2 4.29 2 4.39 1 4.34 1 4.29 1 Visitor center exhibits 3.16 8 3.04 8 3.31 7 3.64 7 3.79 6 Wayside exhibits 3.22 7 3.16 7 3.13 9 3.18 9 3.26 9 Audio-visual programs 3.98 3 4.10 3 4.01 3 4.20 3 4.25 3 Self-guided tours 4.35 1 4.39 1 4.34 2 4.28 2 4.29 1 Park newspapers 3.50 5 3.47 6 3.72 4 3.71 5 3.68 7 Internet/park websites 3.47 6 3.52 5 3.67 5 3.69 6 4.25 3 Bulletin boards 3.72 4 3.65 4 3.60 6 3.79 4 3.89 5 Park information radio stations
2.91 9 2.73 9 3.18 8 3.25 8 3.57 8
Ranger-guided programs 4.15 4.09 4.22 4.16 4.22
Table 7.2: Importance of interpretive media by respondents of different ages Quality of Interpretive Media Visitors evaluated the quality of various interpretive media they used on a given park visit using a rating scale with values ranging from one to five, with one being “very poor” and five being “very good” as illustrated in Table 7.3, below.
Mean numerical value Quality rating
Actual Range 1 1.00-1.49 “Very poor” 2 1.50-2.49 “Poor” 3 2.50-3.49 “Average” 4 3.50-4.49 “Good” 5 4.50-5.00 “Very good”
Table 7.3: Quality rating scale for interpretive media
All types of interpretive media and ranger-guided programs were considered to be of “good” quality by respondents of all ages with only two exceptions. Respondents aged 31-40 found internet/park websites to be of “average” quality. Respondents of all ages except those aged 51-60 found park information radio stations to be of “average” quality. Analysis of individual interpretive media quality data (illustrated in Table 7.4) indicates the following: • Park brochures, audio-visual programs, and self-guided tours were each ranked as the
top three interpretive media in quality by respondents of all ages, with the exception of those aged 61 or older.

Visitor Use and Evaluation of Interpretive Media 57
• Internet/park websites and park information radio stations were each ranked as the lowest quality interpretive media by respondents of all ages with the exception of those aged 61 or older.
• Respondents aged 61 or older rated internet/park websites as the highest quality
interpretive media. • Ranger-guided programs received mean quality ratings higher than any type of
interpretive media from respondents of all ages up to 60.
Interpretive media Visitor age (years)
30 or younger
31-40 41-50 51-60 61 or older
Quality Rating Rank Rating Rank Rating Rank Rating Rank Rating Rank
Park brochures 4.11 3 4.26 2 4.32 1 4.31 1 4.38 2 Visitor center exhibits 4.10 4 4.11 4 4.15 6 4.14 4 4.24 4 Wayside exhibits 4.06 5 4.06 5 4.17 5 4.09 6 4.13 6 Audio-visual programs 4.33 1 4.23 3 4.23 2 4.29 2 4.34 3 Self-guided tours 4.12 2 4.34 1 4.18 3 4.20 3 4.17 5 Park newspapers 4.00 6 3.97 6 4.18 3 4.12 5 4.10 7 Internet/park websites 3.86 8 3.43 8 3.82 8 3.69 8 4.50 1 Bulletin boards 3.94 7 3.95 7 3.87 7 3.98 7 4.08 8 Park information radio stations
3.00 9 2.86 9 3.27 9 3.50 9 3.43 9
Ranger-guided programs 4.33 4.36 4.40 4.39 4.37
Table 7.4: Quality of interpretive media by respondents of different ages
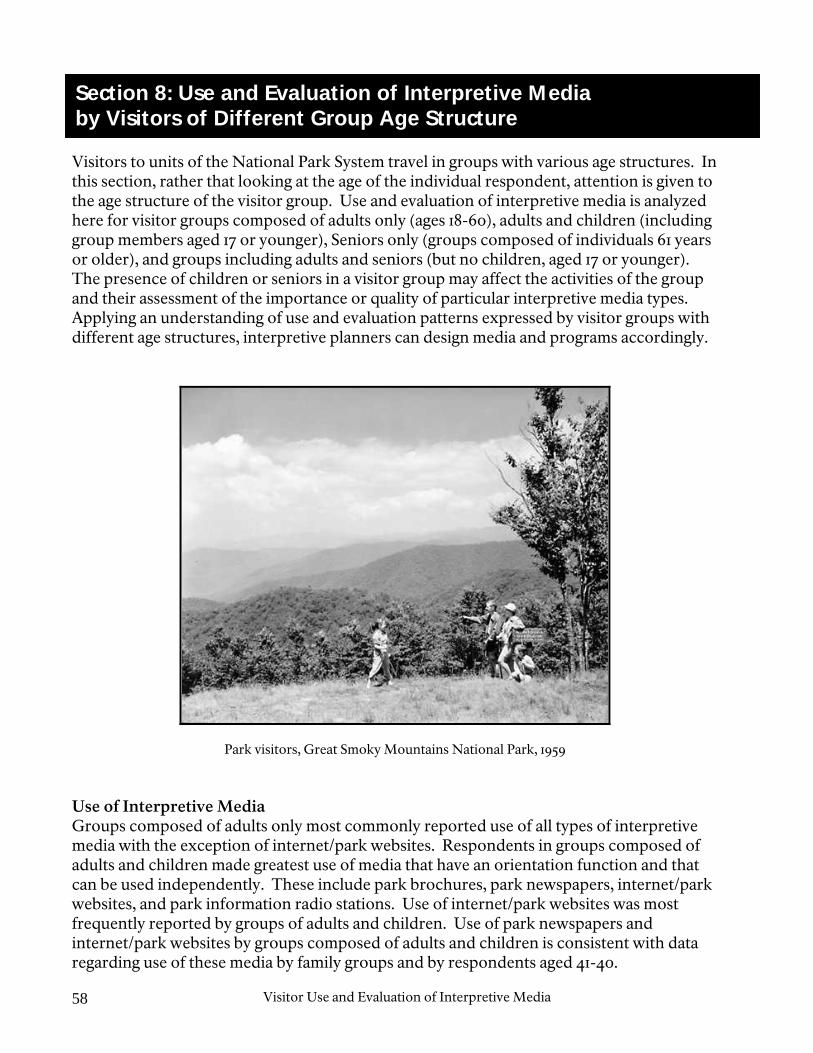
Visitor Use and Evaluation of Interpretive Media 58
Table 7.2: Quality of interpretive media by respondents of different ages
Section 8 Visitors to units of the National Park System travel in groups with various age structures. In this section, rather that looking at the age of the individual respondent, attention is given to the age structure of the visitor group. Use and evaluation of interpretive media is analyzed here for visitor groups composed of adults only (ages 18-60), adults and children (including group members aged 17 or younger), Seniors only (groups composed of individuals 61 years or older), and groups including adults and seniors (but no children, aged 17 or younger). The presence of children or seniors in a visitor group may affect the activities of the group and their assessment of the importance or quality of particular interpretive media types. Applying an understanding of use and evaluation patterns expressed by visitor groups with different age structures, interpretive planners can design media and programs accordingly.
Park visitors, Great Smoky Mountains National Park, 1959 Use of Interpretive Media Groups composed of adults only most commonly reported use of all types of interpretive media with the exception of internet/park websites. Respondents in groups composed of adults and children made greatest use of media that have an orientation function and that can be used independently. These include park brochures, park newspapers, internet/park websites, and park information radio stations. Use of internet/park websites was most frequently reported by groups of adults and children. Use of park newspapers and internet/park websites by groups composed of adults and children is consistent with data regarding use of these media by family groups and by respondents aged 41-40.
Section 8: Use and Evaluation of Interpretive Media by Visitors of Different Group Age Structure

Visitor Use and Evaluation of Interpretive Media 59
Analysis of individual interpretive media use data indicates the following: • One-half of those reporting use of park brochures (50%) were in groups of adults only.
Seven percent of those using park brochures were in groups of seniors only (see Figure 8.1).
• Nearly one-half of those reporting use of visitor center exhibits (47%) were in groups of
adults only. Groups including seniors made use of visitor center exhibits in proportions slightly higher than their proportion in the total visitor population (see Figure 8.2).
• Accounting for 28% of all park visitor groups, 33% of those reporting use of wayside
exhibits were in groups of adults and children. Six percent of those reporting use of waysides were in groups consisting of seniors only (see Figure 8.3).
• Accounting for 20% of all park visitors, visitor groups including seniors accounted for
31% of those reporting use of audio-visual programs (see Figure 8.4). • Thirty-five percent of those reporting use of self-guided tours were in groups of adults
and children. This group type accounts for 28% of all park visitors (see Figure 8.5). • Park newspapers were used in high proportion (41%) by visitor groups consisting of
adults and children. Only 5% of those reporting use of park newspapers were in groups of seniors only (see Figure 8.6).
• Nearly one-half (48%) of the visitors reporting use of internet/park websites were in
groups composed of adults and children. No visitor groups made up of seniors only reported use of internet/park websites (see Figure 8.7).
• Bulletin boards were used widely by visitors in groups with all types of age structures
(see Figure 8.8). • Park information radio stations were used almost exclusively by groups of adults and
children, and groups of adults only (92%). Just 2% of those reporting use of park information radio stations were in groups of seniors only (see Figure 8.9).
• Accounting for 20% of all park visitors, 29% of those reporting participation in ranger-
guided programs were in groups including seniors (see Figure 8.10). On the following figures, the black bars represent the percentage of visitors who reported use of a particular type of interpretive media who were in groups of a given age structure. The proportion of all park visitors sharing a particular visitor characteristic is provided for comparison and represented by the gray bars. For instance, Figure 8.1 indicates that 10% of visitors reporting use of park brochures were in groups of seniors and adults and 11% of all park visitors were in groups of seniors and adults.

Visitor Use and Evaluation of Interpretive Media 60
22 parks; 9,908 respondents
11%
9%
28%
52%
10%
7%
32%
50%
0 20 40 60 80 100
Adults only
Adults andchildren
Seniors only
Seniors andadults
Group age structure
Proportion of respondents (%)
% of visitors using parkbrochures% of all park visitors
Figure 8.1: Use of park brochures by group age structure (Percentages may not equal 100% due to rounding.)
17 parks; 8,207 respondents
11%
9%
28%
52%
13%
11%
29%
47%
0 20 40 60 80 100
Adults only
Adults andchildren
Seniors only
Seniors andadults
Group age structure
Proportion of respondents (%)
% of visitors using visitor centerexhibits% of all park visitors
Figure 8.2: Use of visitor center exhibits by group age structure

Visitor Use and Evaluation of Interpretive Media 61
13 parks; 6,410 respondents
52%
28%
9%
11%
51%
33%
6%
9%
0 20 40 60 80 100
Adultsonly
Adults andchildren
Seniorsonly
Seniorsand adults
Group age structure
Proportion of respondents (%)
% of visitors using waysideexhibits% of all park visitors
Figure 8.3: Use of wayside exhibits by group age structure (Percentages may not equal 100% due to rounding.)
9 parks; 4,582 respondents
11%
9%
28%
52%
16%
15%
22%
47%
0 20 40 60 80 100
Adults only
Adults andchildren
Seniorsonly
Seniorsand adults
Group age structure
Proportion of respondents (%)
% of visitors using audio-visual programs% of all park visitors
Figure 8.4: Use of audio-visual programs by group age structure

Visitor Use and Evaluation of Interpretive Media 62
12 parks; 4,825 respondents
11%
9%
28%
52%
11%
8%
35%
46%
0 20 40 60 80 100
Adults only
Adults andchildren
Seniorsonly
Seniorsand adults
Group age structure
Proportion of respondents (%)
% of visitors using self-guided tours% of all park visitors
Figure 8.5: Use of self-guided tours by group age structure
7 parks; 3,474 respondents
11%
9%
28%
52%
9%
5%
41%
45%
0 20 40 60 80 100
Adults only
Adults andchildren
Seniors only
Seniors andadults
Group age structure
Proportion of respondents (%)
% of visitors using parknewspapers% of all park visitors
Figure 8.6: Use of park newspapers by group age structure

Visitor Use and Evaluation of Interpretive Media 63
2 parks; 1,335 respondents
52%
28%
9%
11%
46%
48%
6%
0 20 40 60 80 100
Adults only
Adults andchildren
Seniors only
Seniors andadults
Group age structure
Proportion of respondents (%)
% of visitors usinginternet/park websites% of all park visitors
Figure 8.7: Use of internet/park websites by group age structure
12 parks; 5,486 respondents
11%
9%
28%
52%
10%
7%
32%
51%
0 20 40 60 80 100
Adultsonly
Adults andchildren
Seniorsonly
Seniorsand adults
Group age structure
Proportion of respondents (%)
% of visitors using bulletinboards% of all park visitors
Figure 8.8: Use of bulletin boards by group age structure

Visitor Use and Evaluation of Interpretive Media 64
3 parks; 2,035 respondents
11%
9%
28%
52%
6%
2%
40%
52%
0 20 40 60 80 100
Adults only
Adults andchildren
Seniorsonly
Seniorsand adults
Group age structure
Proportion of respondents (%)
% of visitors using parkinformation radio stations% of all park visitors
Figure 8.9: Use of park information radio stations by group age structure
23 parks; 10,295 respondents
52%
11%
9%
28%
47%
15%
14%
25%
0 20 40 60 80 100
Adults only
Adults andchildren
Seniorsonly
Seniorsand adults
Group age structure
Proportion of respondents (%)
% of visitors using ranger-guided programs% of all park visitors
Figure 8.10: Use of ranger-guided programs by group age structure (Percentages may not equal 100% due to rounding.)

Visitor Use and Evaluation of Interpretive Media 65
Importance of Interpretive Media Visitors evaluated the importance of various interpretive media using a rating scale with values ranging from one to five, with one being “not important” and five being “extremely important” as illustrated in Table 8.1, below.
Mean numerical value
Importance rating
Actual Range 1 1.00-1.49 “Not important” 2 1.50-2.49 “Somewhat important” 3 2.50-3.49 “Moderately important” 4 3.50-4.49 “Very important” 5 4.50-5.00 “Extremely important”
Table 8.1: Importance rating scale for interpretive media
All types of interpretive media and ranger-guided programs were rated as “very important” by visitor groups of all age structures with few exceptions. Groups composed of adults only and adults and children considered visitor center exhibits to be “moderately important.” Visitors in groups of all age structures found wayside exhibits to be “moderately important.” Groups of adults and children and groups of seniors and adults found park information radio stations to be “moderately important.” Analysis of individual interpretive media importance data (illustrated in Table 8.2) indicates the following: • Park brochures were rated as the most important interpretive media by groups of
seniors only. Park brochures were ranked second in importance by groups of all other age structures.
• Self-guided tours were rated as the most important interpretive media by groups of
adults only, groups of adults and children, and groups of adults and seniors. • Wayside exhibits were rated as “moderately important” by visitors in groups of all age
structures. • No groups composed of seniors only reported on the use or importance of
internet/park websites. • Park information radio stations were categorized as “moderately important” by visitor
groups of all age structures, with the exception of seniors only. Groups composed of seniors only rated park information radio stations as “very important.”
• Visitor groups of all age structures categorized ranger-guided programs as “very
important.”

Visitor Use and Evaluation of Interpretive Media 66
Interpretive media Group age structure
Adults only Adults and children
Seniors only Seniors and adults
Importance Rating Rank Rating Rank Rating Rank Rating Rank
Park brochures 4.31 2 4.34 2 4.28 1 4.32 2 Visitor center exhibits 3.14 8 3.41 7 3.87 5 3.71 7 Wayside exhibits 3.24 7 3.05 9 3.24 8 3.27 8 Audio-visual programs 4.09 3 4.06 3 4.25 2 4.20 3 Self-guided tours 4.32 1 4.36 1 4.17 3 4.39 1 Park newspapers 3.50 6 3.78 4 3.69 7 3.74 6 Internet/park websites 3.67 4 3.51 6 --- --- 4.17 4 Bulletin boards 3.65 5 3.62 5 4.00 4 3.80 5 Park information radio stations
2.96 9 3.15 8 3.75 6 2.73 9
Ranger-guided programs 4.12 4.23 4.17 4.20
Table 8.2: Importance of interpretive media by group age structure Quality of Interpretive Media Visitors evaluated the quality of various interpretive media they used on a given park visit using a rating scale with values ranging from one to five, with one being “very poor” and five being “very good” as illustrated in Table 8.3, below.
Mean numerical value Quality rating
Actual Range 1 1.00-1.49 “Very poor” 2 1.50-2.49 “Poor” 3 2.50-3.49 “Average” 4 3.50-4.49 “Good” 5 4.50-5.00 “Very good”
Table 8.3: Quality rating scale for interpretive media
Visitors in groups of all age structures rated all types of interpretive media as “good” in quality with one exception. Groups composed of adults only, adults and children, and seniors and adults considered the quality of park information radio stations to be “average.” Analysis of individual interpretive media quality data (illustrated in Table 8.4) indicates the following: • Park brochures were rated as the interpretive media by groups composed of adults and
children.

Visitor Use and Evaluation of Interpretive Media 67
• Audio-visual programs ranked as the interpretive media for groups of adults only and groups of seniors only.
• Groups composed of seniors and adults considered internet/park websites to be the
media. This was the only interpretive media to receive a mean quality rating of “very good” by visitor groups of any age structure.
• No groups composed of seniors only reported on the use or quality of internet/park
websites. • Park information radio stations received the lowest mean quality ratings from visitor
groups of all age structures. • Ranger-guided programs were assigned mean quality ratings higher than any type of
interpretive media by groups of adults only, groups of adults and children, and groups of seniors only.
Interpretive media Group age structure
Adults only Adults and children
Seniors only Seniors and adults
Quality Rating Rank Rating Rank Rating Rank Rating Rank
Park brochures 4.22 2 4.34 1 4.34 2 4.39 2 Visitor center exhibits 4.10 4 4.17 5 4.28 3 4.20 6 Wayside exhibits 4.05 5 4.18 4 4.11 7 4.16 7 Audio-visual programs 4.25 1 4.25 3 4.33 1 4.34 4 Self-guided tours 4.16 3 4.26 2 4.16 5 4.35 3 Park newspapers 3.96 6 3.94 7 4.20 4 4.28 5 Internet/park websites 3.69 8 3.70 8 --- --- 4.80 1 Bulletin boards 3.89 7 3.95 6 4.12 6 4.01 8 Park information radio stations
2.97 9 3.36 9 3.50 8 3.40 9
Ranger-guided programs 4.38 4.40 4.42 4.36
Table 8.4: Quality of interpretive media by group age structure

Visitor Use and Evaluation of Interpretive Media 68
S Visitors surveyed in 1997, 1998, and 1999 were asked the actual number of times they had visited the unit of the National Park System in which they were contacted. For this report, visitors are classified as being on a first visit to the park unit or on a repeat visit. Use of interpretive media varied depending on whether one was a first-time or repeat visitor to the park unit. Knowledge of such use and evaluation patterns can allow those designing interpretive media and programs to consider inclusion of orientation information for first-time visitors and more in-depth information of interest to repeat visitors.
Audio-visual program, Rock Creek Park, 1958 Use of Interpretive Media A greater proportion of first-time visitors reported use of all types of interpretive media than did those on repeat visits to the National Park System unit with one exception. Use of internet/park websites was reported by a greater proportion of repeat park visitors. It is likely that repeat visitors used the internet/park websites in preparing for their visit rather than using internet/park websites during their visit (as asked in the survey questions regarding use of interpretive media). Analysis of individual interpretive media use data indicates the following: • Sixty-two percent of visitors reporting use of park brochures were on a first visit to the
park unit (see Figure 9.1).
Section 9: Use and Evaluation of Interpretive Media by Frequency of Visits

Visitor Use and Evaluation of Interpretive Media 69
• Seventy-one percent of those using visitor center exhibits were on a first visit (see Figure 9.2).
• Wayside exhibits were used more frequently by first-time visitors (60%) than by those
on repeat visits (40%) to a park unit (see Figure 9.3). • Eighty percent of those individuals reporting use of audio-visual programs were on a
first visit to a given park unit (see Figure 9.4). • Self-guided tours were used by more visitors on first visits (68%) than by those on
repeat visits (32%) to the park (see Figure 9.5). • Sixty-two percent of visitors reporting use of park newspapers were on a first visit to the
park unit (see Figure 9.6). • Fifty-nine percent of those reporting use of internet/park websites were repeat visitors
(see Figure 9.7). • Bulletin boards were used by all visitors, regardless of the frequency of visit. Fifty-five
percent of all park visitors were on a first visit. Similarly, 55% of those reporting use of bulletin boards were on a first visit (see Figure 9.8).
• Eighty percent of visitors using park information radio stations were on their first visit
to the NPS unit (see Figure 9.9). • Seventy-three percent of those visitors reporting use of ranger-guided programs were
first-time visitors to the park unit (see Figure 9.10). On the following figures, the black bars represent the percentage of visitors who reported use of a particular type of interpretive media who were on a first-time or repeat visit to the park unit. The proportion of all park visitors sharing a particular visitor characteristic is provided for comparison and represented by the gray bars. For instance, Figure 9.1 indicates that 38% of visitors reporting use of park brochures were on a first visit and 45% of all park visitors were first-time visitors.

Visitor Use and Evaluation of Interpretive Media 70
22 parks; 9,074 respondents
45%
55%
38%
62%
0 20 40 60 80 100
First visit
Repeatvisit
Frequency of visits
Proportion of respondents (%)
% of visitors using parkbrochures% of all park visitors
Figure 9.1: Use of park brochures by frequency of visits
17 parks; 7,561 respondents
45%
55%
29%
71%
0 20 40 60 80 100
First visit
Repeatvisit
Frequency of visits
Proportion of respondents (%)
% of visitors using visitorcenter exhibits% of all park visitors
Figure 9.2: Use of visitor center exhibits by frequency of visits

Visitor Use and Evaluation of Interpretive Media 71
13 parks; 5,999 respondents
45%
55%
40%
60%
0 20 40 60 80 100
First visit
Repeatvisit
Frequency of visits
Proportion of respondents (%)
% of visitors using waysideexhibits% of all park visitors
Figure 9.3: Use of wayside exhibits by frequency of visits
9 parks; 4,249 respondents
45%
55%
20%
80%
0 20 40 60 80 100
First visit
Repeatvisit
Frequency of visits
Proportion of respondents (%)
% of visitors using audio-visual programs% of all park visitors
Figure 9.4: Use of audio-visual programs by frequency of visits

Visitor Use and Evaluation of Interpretive Media 72
12 parks; 4,464 respondents
45%
55%
32%
68%
0 20 40 60 80 100
First visit
Repeatvisit
Frequency of visits
Proportion of respondents (%)
% of visitors using self-guided tours% of all park visitors
Figure 9.5: Use of self-guided tours by frequency of visits
7 parks; 3,193 respondents
45%
55%
38%
62%
0 20 40 60 80 100
First visit
Repeatvisit
Frequency of visits
Proportion of respondents (%)
% of visitors using parknewspapers% of all park visitors
Figure 9.6: Use of park newspapers by frequency of visits
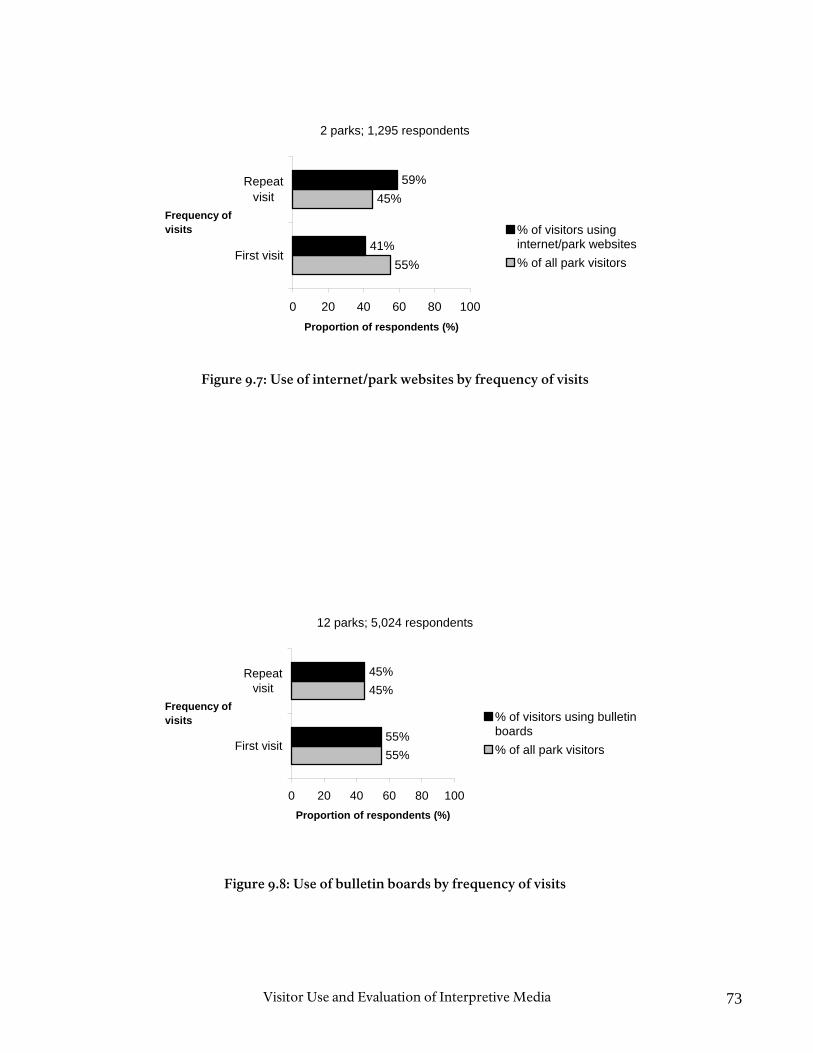
Visitor Use and Evaluation of Interpretive Media 73
2 parks; 1,295 respondents
45%
55%
59%
41%
0 20 40 60 80 100
First visit
Repeatvisit
Frequency of visits
Proportion of respondents (%)
% of visitors usinginternet/park websites% of all park visitors
Figure 9.7: Use of internet/park websites by frequency of visits
12 parks; 5,024 respondents
45%
55%
45%
55%
0 20 40 60 80 100
First visit
Repeatvisit
Frequency of visits
Proportion of respondents (%)
% of visitors using bulletinboards% of all park visitors
Figure 9.8: Use of bulletin boards by frequency of visits

Visitor Use and Evaluation of Interpretive Media 74
3 parks; 1,907 respondents
45%
55%
20%
80%
0 20 40 60 80 100
First visit
Repeatvisit
Frequency of visits
Proportion of respondents (%)
% of visitors using parkinformation radio stations% of all park visitors
Figure 9.9: Use of park information radio stations by frequency of visits
23 parks; 9,567 respondents
45%
55%
27%
73%
0 20 40 60 80 100
First visit
Repeatvisit
Frequency of visits
Proportion of respondents (%)
% of visitors using ranger-guided programs% of all park visitors
Figure 9.10: Use of ranger-guided programs by frequency of visits

Visitor Use and Evaluation of Interpretive Media 75
Importance of Interpretive Media Visitors evaluated the importance of various interpretive media using a rating scale with values ranging from one to five, with one being “not important” and five being “extremely important” as illustrated in Table 9.1, below.
Mean numerical value
Importance rating
Actual Range 1 1.00-1.49 “Not important” 2 1.50-2.49 “Somewhat important” 3 2.50-3.49 “Moderately important” 4 3.50-4.49 “Very important” 5 4.50-5.00 “Extremely important”
Table 9.1: Importance rating scale for interpretive media
All types of interpretive media and ranger-guided programs were considered to be “very important” to both first-time and repeat visitors with a few exceptions. Repeat visitors found visitor center exhibits to be “moderately important.” Both first-time and repeat visitors found wayside exhibits and park information radio stations to be “moderately important.” Analysis of individual interpretive media importance data indicates the following: • With the exception of audio-visual programs, all types of interpretive media were
considered to be more important to first-time park visitors than to those on repeat visits to the individual park unit. Audio-visual programs were slightly more important to repeat visitors.
• Visitor center exhibits were rated as “very important” by first-time park visitors and
“moderately important” to those on repeat visits. • Wayside exhibits were rated as “moderately important” to both first-time and repeat
park visitors. • Park information radio stations were rated as “moderately important” to both first-time
and repeat park visitors. • Ranger-guided programs were assigned “very important” ratings by both first-time and
repeat visitors.
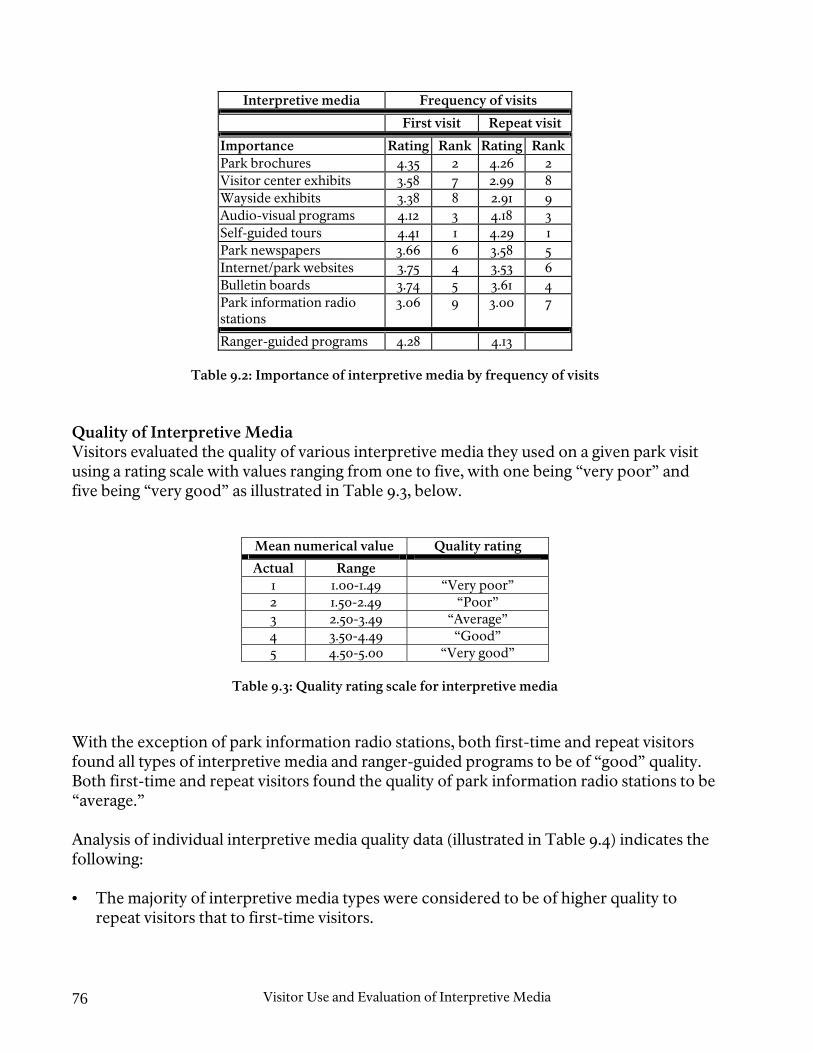
Visitor Use and Evaluation of Interpretive Media 76
Interpretive media Frequency of visits
First visit Repeat visit
Importance Rating Rank Rating RankPark brochures 4.35 2 4.26 2 Visitor center exhibits 3.58 7 2.99 8 Wayside exhibits 3.38 8 2.91 9 Audio-visual programs 4.12 3 4.18 3 Self-guided tours 4.41 1 4.29 1 Park newspapers 3.66 6 3.58 5 Internet/park websites 3.75 4 3.53 6 Bulletin boards 3.74 5 3.61 4 Park information radio stations
3.06 9 3.00 7
Ranger-guided programs 4.28 4.13
Table 9.2: Importance of interpretive media by frequency of visits Quality of Interpretive Media Visitors evaluated the quality of various interpretive media they used on a given park visit using a rating scale with values ranging from one to five, with one being “very poor” and five being “very good” as illustrated in Table 9.3, below.
Mean numerical value Quality rating
Actual Range 1 1.00-1.49 “Very poor” 2 1.50-2.49 “Poor” 3 2.50-3.49 “Average” 4 3.50-4.49 “Good” 5 4.50-5.00 “Very good”
Table 9.3: Quality rating scale for interpretive media
With the exception of park information radio stations, both first-time and repeat visitors found all types of interpretive media and ranger-guided programs to be of “good” quality. Both first-time and repeat visitors found the quality of park information radio stations to be “average.” Analysis of individual interpretive media quality data (illustrated in Table 9.4) indicates the following: • The majority of interpretive media types were considered to be of higher quality to
repeat visitors that to first-time visitors.

Visitor Use and Evaluation of Interpretive Media 77
• Visitor center exhibits, wayside exhibits, self-guided tours, park newspapers, and park information radio stations each received higher quality ratings from repeat visitors than they received from first-time park visitors.
• Park information radio stations received the lowest mean quality ranking by both first-
time and repeat visitors. • Ranger-guided programs received higher mean quality ratings from both first-time and
repeat park visitors than any type of interpretive media.
Interpretive media Frequency of visits
First visit Repeat visit
Quality Rating Rank Rating RankPark brochures 4.29 1 4.27 3 Visitor center exhibits 4.14 4 4.15 4 Wayside exhibits 4.08 5 4.14 5 Audio-visual programs 4.26 2 4.34 1 Self-guided tours 4.17 3 4.29 2 Park newspapers 4.08 5 4.10 6 Internet/park websites 3.79 8 3.68 8 Bulletin boards 3.99 7 3.87 7 Park information radio stations
3.11 9 3.33 9
Ranger-guided programs 4.35 4.45
Table 9.4: Quality of interpretive media by frequency of visits

Visitor Use and Evaluation of Interpretive Media 78
S In the visitor surveys conducted between 1997 and 1999, visitors reported the length of their park stay in hours, days, and portions of days. For the purposes of this report, the following categories will be used: less than 2 hours, 2-4 hours, 4-6 hours, 6-16 hours, and 17 or more hours. Visitor use of interpretive media can vary depending on the length of one's stay in a unit of the National Park System. With knowledge of varying use and evaluation patterns, interpretive planners are able to design media that is most appropriate for visitors on trips of varying length.
Ranger-guided program, Yellowstone National Park, circa 1960 Use of Interpretive Media In general, the longer one stayed in a park, the more likely it was that they would use the various types of interpretive media. Visitors spending 17 or more hours on a park visit were the most frequent users of all types of interpretive media. Analysis of individual interpretive media use data indicates the following: • Sixty percent of those reporting use of park brochures were on park visits greater than 6
hours in length (see Figure 10.1).
Section 10: Use and Evaluation of Interpretive Media by Length of Visit

Visitor Use and Evaluation of Interpretive Media 79
• Visitor center exhibits were used with greater frequency by those spending longer periods of time in a unit of the National Park System. Only 15% of those reporting use of visitor center exhibits were on visits less than 2 hours in length (see Figure 10.2).
• Of those reporting use of wayside exhibits, 45% were on visits of 17 hours or more. Only
10% of those reporting use of waysides were on trips less than 2 hours in length (see Figure 10.3).
• Forty-two percent of those visitors reporting use of audio-visual programs were on
visits lasting between 2 and 6 hours (see Figure 10.4). • Forty-five percent of those visitors reporting use of self-guided tours were on visits of 17
or more hours. Only 11% of visitors reporting use of self-guided tours were on visits less than 2 hours in length (see Figure 10.5).
• Nearly three-fourths (73%) of those visitors reporting use of park newspapers were on
visits of 17 or more hours. While accounting for 21% of the visiting public, only 1% of those visitors on a trip of less than 2 hours reported use of park newspapers (see Figure 10.6).
• Visitors on trips of 17 hours or more made greatest use of internet/park websites (69%).
Only 17% of those reporting use of internet/park websites were on trips under 6 hours in length (see Figure 10.7).
• Bulletin boards were used in the highest percentage by visitors on trips of 17 hours or
more (60%). Twenty-six percent of those reporting use of bulletin boards were on trips under 6 hours in length (see Figure 10.8).
• Sixty percent of visitors reporting use of park information radio stations were on trips of
17 hours or more. Only 2% of visitors reporting use of park information radio stations were on trips less than 2 hours in length (see Figure 10.9).
• Nearly one-half (47%) of those visitors reporting participation in ranger-guided
programs were on visits of 17 or more hours (see Figure 10.10). On the following figures, the black bars represent the percentage of visitors who reported use of a particular type of interpretive media who were on a park visit of a given length. The proportion of all park visitors sharing a particular visitor or visit characteristic is provided for comparison and represented by the gray bars. For instance, Figure 10.1 indicates that 43% of visitors reporting use of park brochures were on visits of 17 or more hours and 29% of all park visitors were on visits of 17 or more hours.

Visitor Use and Evaluation of Interpretive Media 80
22 parks; 9,226 respondents
21%
22%
12%
16%
29%
14%
16%
10%
17%
43%
0 20 40 60 80 100
Less than 2 hours
2-4 hours
4-6 hours
6-16 hours
17 or more hours
Length of visit
Proportion of respondents (%)
% of visitors using parkbrochures% of park visitors
Figure 10.1: Use of park brochures by length of visit
17 parks; 7,807 respondents
29%
16%
12%
22%
21%
31%
17%
15%
22%
15%
0 20 40 60 80 100
Less than2 hours
2-4 hours
4-6 hours
6-16 hours
17 or morehours
Length of visit
Proportion of respondents (%)
% of visitors using visitorcenter exhibits% of park visitors
Figure 10.2: Use of visitor center exhibits by length of visit

Visitor Use and Evaluation of Interpretive Media 81
13 parks; 6,044 respondents
21%
22%
12%
16%
29%
10%
18%
11%
17%
45%
0 20 40 60 80 100
Less than2 hours
2-4 hours
4-6 hours
6-16 hours
17 or morehours
Length of visit
Proportion of respondents (%)
% of visitors using waysideexhibits% of park visitors
Figure 10.3: Use of wayside exhibits by length of visit (Percentages may not equal 100% due to rounding.)
9 parks; 4,394 respondents
21%
22%
12%
16%
29%
16%
27%
15%
16%
27%
0 20 40 60 80 100
Less than2 hours
2-4 hours
4-6 hours
6-16 hours
17 or morehours
Length of visit
Proportion of respondents (%)
% of visitors usingaudio-visual programs% of park visitors
Figure 10.4: Use of audio-visual programs by length of visit (Percentages may not equal 100% due to rounding.)

Visitor Use and Evaluation of Interpretive Media 82
12 parks; 4,551 respondents
29%
16%
12%
22%
21%
45%
17%
12%
15%
11%
0 20 40 60 80 100
Less than2 hours
2-4 hours
4-6 hours
6-16 hours
17 or morehours
Length of visit
Proportion of respondents (%)
% of visitors using self-guided tours% of park visitors
Figure 10.5: Use of self-guided tours by length of visit
7 parks; 3,284 respondents
29%
16%
12%
22%
21%
73%
13%
7%
6%
1%
0 20 40 60 80 100
Less than2 hours
2-4 hours
4-6 hours
6-16 hours
17 or morehours
Length of visit
Proportion of respondents (%)
% of visitors using parknewspapers% of park visitors
Figure 10.6: Use of park newspapers by length of visit

Visitor Use and Evaluation of Interpretive Media 83
2 parks; 1,824 respondents
21%
22%
12%
16%
29%
5%
5%
7%
13%
69%
0 20 40 60 80 100
Less than2 hours
2-4 hours
4-6 hours
6-16 hours
17 or morehours
Length of visit
Proportion of respondents (%)
% of visitors usinginternet/park websites% of park visitors
Figure 10.7: Use of internet/park websites by length of visit (Percentages may not equal 100% due to rounding.)
12 parks; 5,230 respondents
29%
16%
12%
22%
21%
60%
14%
8%
9%
9%
0 20 40 60 80 100
Less than2 hours
2-4 hours
4-6 hours
6-16 hours
17 or morehours
Length of visit
Proportion of respondents (%)
% of visitors using bulletinboards% of park visitors
Figure 10.8: Use of bulletin boards by length of visit

Visitor Use and Evaluation of Interpretive Media 84
3 parks; 1,969 respondents
29%
16%
12%
22%
21%
60%
18%
10%
10%
2%
0 20 40 60 80 100
Less than2 hours
2-4 hours
4-6 hours
6-16 hours
17 or morehours
Length of visit
Proportion of respondents (%)
% of visitors using parkinformation radio stations
% of park visitors
Figure 10.9: Use of park information radio stations by length of visit
23 parks; 9,863 respondents
29%
16%
12%
22%
21%
47%
20%
12%
16%
5%
0 20 40 60 80 100
Less than2 hours
2-4 hours
4-6 hours
6-16 hours
17 or morehours
Length of visit
Proportion of respondents (%)
% of visitors using ranger-guided programs% of park visitors
Figure 10.10: Use of ranger-guided programs by length of visit

Visitor Use and Evaluation of Interpretive Media 85
Importance of Interpretive Media Visitors evaluated the importance of various interpretive media using a rating scale with values ranging from one to five, with one being “not important” and five being “extremely important” as illustrated in Table 10.1, below.
Mean numerical value
Importance rating
Actual Range 1 1.00-1.49 “Not important” 2 1.50-2.49 “Somewhat important” 3 2.50-3.49 “Moderately important” 4 3.50-4.49 “Very important” 5 4.50-5.00 “Extremely important”
Table 10.1: Importance rating scale for interpretive media
Respondents on park visits of varying length found all types of interpretive media and ranger-guided programs to be “very important” with few exceptions. Those spending 16 hours or less on a park visit found visitor center exhibits to be “moderately important.” Visitors spending less than 2 hours on a park visit found park newspapers to be “moderately important.” Visitors spending 2 hours or more on a park visit considered park information radio stations to be “moderately important,” while those on visits of less than 2 hours considered them to be “somewhat important.” Analysis of individual interpretive media importance data (illustrated in Table 10.2) indicates the following: • Visitors spending 4 or more hours in a park rated park brochures as more important
than any other type of interpretive media. • Visitor center exhibits received higher mean importance ratings from those on park
visits of 17 hours or more than from those on shorter visits. • Visitors spending 17 or more hours in the park unit rated wayside exhibits as the least
important type of interpretive media. • Audio-visual programs were rated as the most important interpretive media type by
visitors spending 2-4 hours on their park visit. Audio-visual programs were ranked as the second most important interpretive media type for those spending less than 2 hours on a park visit.
• Self-guided tours were rated as the most important interpretive media type by visitors
spending less than 2 hours in a unit of the National Park System. Self-guided tours were ranked as one of the two most important interpretive media types by all visitors, regardless of length of stay in a unit of the National Park System.

Visitor Use and Evaluation of Interpretive Media 86
• Park information radio stations were rated as the least important interpretive media type
by all visitors with the exception of those spending 17 or more hours in the park. • Ranger-guided programs were rated as “very important” by those visitors spending 2 or
more hours in a park unit. Ranger-guided programs were rated as “moderately important” by those spending less than 2 hours on their visit.
Interpretive media Length of visit
Less than 2 hours
2-4 hours 4-6 hours 6-16 hours 17 or more hours
Importance Rating Rank Rating Rank Rating Rank Rating Rank Rating Rank
Park brochures 4.06 3 4.17 3 4.33 1 4.34 1 4.44 1 Visitor center exhibits 3.47 7 3.40 8 3.19 8 3.10 9 3.60 7 Wayside exhibits 3.96 4 4.09 4 4.12 3 3.42 7 2.54 9 Audio-visual programs 4.27 2 4.29 1 4.03 4 4.12 3 3.97 3 Self-guided tours 4.30 1 4.25 2 4.25 2 4.33 2 4.41 2 Park newspapers 2.50 8 3.53 6 3.54 7 3.68 5 3.66 5 Internet/park websites 3.60 5 3.50 7 3.60 6 3.75 4 3.71 4 Bulletin boards 3.60 5 3.81 5 3.78 5 3.65 6 3.65 6 Park information radio stations
2.00 9 3.29 9 2.79 9 3.15 8 3.04 8
Ranger-guided programs 3.96 4.23 4.23 4.28 4.11
Table 10.2: Importance of interpretive media by length of visit Quality of Interpretive Media Visitors evaluated the quality of various interpretive media they used on a given park visit using a rating scale with values ranging from one to five, with one being “very poor” and five being “very good” as illustrated in Table 10.3, below.
Mean numerical value Quality rating
Actual Range 1 1.00-1.49 “Very poor” 2 1.50-2.49 “Poor” 3 2.50-3.49 “Average” 4 3.50-4.49 “Good” 5 4.50-5.00 “Very good”
Table 10.3: Quality rating scale for interpretive media
Respondents on visits of varying length found the quality of all types of interpretive media and ranger-guided programs to be “good,” with three exceptions. Those spending less than 2 hours on park visits found internet/park websites to be of “average” quality. Those

Visitor Use and Evaluation of Interpretive Media 87
spending 2 hours or more on a park visit found park information radio stations to be of “average” quality, while visitors spending 2 hours or less on a park visit found the quality of park information radio stations to be “poor.” Analysis of individual interpretive media quality data (illustrated in Table 10.4) indicates the following: • Park brochures were rated of highest quality by visitors spending four or more hours in
a unit of the National Park System. • Audio-visual programs were rated of highest quality by visitors spending less than four
hours in a unit of the National Park System. • Park information radio stations received the lowest quality ratings from all visitors,
regardless of length of stay. • Ranger-guided programs received quality ratings higher than or equal to any type of
interpretive media from all visitors except those spending less than 2 hours on their park visits.
Interpretive media Length of visit
Less than 2 hours
2-4 hours 4-6 hours 6-16 hours 17 or more hours
Quality Rating Rank Rating Rank Rating Rank Rating Rank Rating Rank
Park brochures 4.07 5 4.21 5 4.35 1 4.32 1 4.33 1 Visitor center exhibits 4.09 3 4.25 3 4.20 5 4.18 4 4.08 5 Wayside exhibits 4.10 2 4.17 7 4.17 6 4.09 5 4.05 6 Audio-visual programs 4.26 1 4.34 1 4.27 2 4.28 2 4.21 3 Self-guided tours 4.09 3 4.18 6 4.27 2 4.26 3 4.23 2 Park newspapers 3.60 7 4.25 3 4.09 7 4.00 6 4.11 4 Internet/park websites 3.25 8 4.33 2 3.80 8 3.70 8 3.77 8 Bulletin boards 3.99 6 4.07 8 4.24 4 3.99 7 3.85 7 Park information radio stations
2.00 9 3.18 9 3.32 9 3.06 9 3.18 9
Ranger-guided programs 4.23 4.48 4.43 4.32 4.36
Table 10.4: Quality of interpretive media by length of visit

Visitor Use and Evaluation of Interpretive Media 88
Findings by Interpretive Media Type⎯Park Brochures Park brochures are an important tool for orienting visitors, particularly first-time visitors to units of the National Park System. Park brochures were widely used and well-evaluated by all visitors. They were used by more visitors than any other form of interpretive media as reported by respondents to the 23 VSP surveys conducted in 1997, 1998, and 1999. Park brochures were considered to be “very important” to visitors and of consistently “good” quality.
Scenic overlook, Bryce Canyon National Park, 1954 Analysis of individual interpretive media data indicates the following: • Sixty-two percent of all visitors surveyed reported use of park brochures. • Most visitors (94%) reporting use of park brochures were in groups of 2 or more. • Sixty-two percent of visitors on a first visit to a national park unit reported use of park
brochures. • Sixty percent of visitors reporting use of park brochures were in family groups. • Sixty percent of those reporting use of park brochures were on visits of 6 or more hours. • Park brochures received an overall mean importance rating of 4.29, or “very important.”
They were rated as “very important” by all visitor subgroups.
Section 11: Findings by Interpretive Media Type⎯Conclusions

Visitor Use and Evaluation of Interpretive Media 89
• Park brochures were ranked as the most important type of interpretive media by
respondents aged 41-50, 51-60, and 61 or older. Brochures were also ranked as the most important type of interpretive media by those visitors in groups of seniors only, and by visitors spending 4 or more hours on their park visits.
• Park brochures received an overall mean quality rating of 4.27, or “good” in quality. The
quality of park brochures was rated “good” by all visitor subgroups. • Park brochures were considered the highest quality of all interpretive media by
respondents aged 41-50 and aged 51-60 and by those spending 4 or more hours on their park visits.
Responses to the 23 VSP surveys conducted in 1997, 1998, and 1999 indicate that current park brochures are very usable and well designed. Interpretive planners designing park brochures in the future might benefit by keeping a wide audience in mind, including information appropriate to the full range of park visitors. Material that can be shared by groups that include visitors of all ages is appropriate for inclusion in park brochures. It might be appropriate to include detailed trip planning information for visitors spending 4 or more hours in the park in park brochures as well as basic orientation information geared toward first-time park visitors.

Visitor Use and Evaluation of Interpretive Media 90
Findings by Interpretive Media Type⎯Visitor Center Exhibits Visitor center exhibits were used by more than one-half of the visitors surveyed. Of the two types of interpretive exhibits, visitor center exhibits appear to have the greater orientation function. Eighty percent of those reporting use of visitor center exhibits were first-time visitors while 60% of those reporting use of wayside exhibits were first-time visitors. Visitor center exhibits were considered “moderately important” or “very important” by all visitors. They were considered to be of “good” quality by all visitors. Though used by few visitors traveling alone, visitor center exhibits were considered “very important” to those individuals. Visitor center exhibits were used by large proportions of older visitors and were considered to be “very important” to respondents age 51 or older, groups of seniors and adults, and groups of seniors only.
Visitor center exhibit, Fort McHenry National Monument and Historic Shrine, 1957 Analysis of individual interpretive media data indicates the following: • Visitor center exhibits were used by 54% of all visitors surveyed. • Most groups (95%) of those reporting use of visitor center exhibits were composed of 2
or more. • Seventy-two percent of respondents reporting use of visitor center exhibits were 41
years of age or older. • Seventy-one percent of those reporting use of visitor center exhibits were first-time
visitors.

Visitor Use and Evaluation of Interpretive Media 91
• Fifty-five percent of those reporting use of visitor center exhibits were in family groups. • Visitor center exhibits were used in slightly higher proportions (63%) by those on
longer park visits (4 hours or more) than by those on brief visits (up to 4 hours in length).
• The overall mean importance rating assigned to visitor center exhibits was 3.43, or
“moderately important.” They were ranked seventh in importance. • Visitor subgroups rated visitor center exhibits as either “very important” or “moderately
important.” The following table identifies the importance rating the different visitor subgroups assigned to visitor center exhibits.
“Very important” “Moderately important”
Visitors traveling alone and groups of two Groups of 3 or more Groups of family and friends Family groups Tour groups Groups of friends Respondents age 51 or older Respondents age 50 or younger Groups of seniors only Groups of adults only Groups of seniors and adults Groups of adults and children First-time visitors Repeat visitors Visitors spending 17 or more hours in a park Visitors spending up to 16 hours in a park
Table 11.1: Importance of visitor center exhibits
• Visitor center exhibits received an overall mean quality rating of 4.16, or “good.” They
were ranked fourth in quality. • Visitor center exhibit quality was rated as “good” by all visitor subgroups. The orientation function of visitor center exhibits should be in the forefront of design plans for this type of interpretive media. In particular, information critical for first-time park visitors is appropriate to be included in visitor center exhibits. Interpretive planners designing visitor center exhibits should include content appropriate for visitors of all ages. Due to the high interest and use by older visitors, content and presentation should be chosen accordingly. This might include large-print considerations for older visitors. Exhibit features appropriate for those on visits of 4 or more hours as well as those making a quick stop in the visitor center on a short park visit could be included. This might include information that can be easily scanned during a short visit and more detailed information for visitors spending longer periods of time on a park visit.

Visitor Use and Evaluation of Interpretive Media 92
Findings by Interpretive Media Type⎯Wayside Exhibits Wayside exhibits were used by more than one-third of all visitors surveyed. Wayside exhibits were used by larger proportions of groups including adults and children and younger visitors than they were by groups including seniors or older visitors. Wayside exhibits were considered to be “moderately important” and of “good” quality by most visitors who used them.
Wayside exhibit, Antietam National Battlefield, 1990 Analysis of individual interpretive media data indicate the following: • Wayside exhibits were used by 35% of all visitors surveyed. • Most visitors (94%) reporting use of wayside exhibits were in groups of 2 or more. • Wayside exhibits were used primarily by visitors in family groups (65%). • Sixty-two percent of visitors reporting use of wayside exhibits were on visits of 6 hours
or more. Only 10% of visitors in a park for fewer than 2 hours reported use of waysides. • Wayside exhibits were used by slightly more first-time park visitors (60%) than those on
repeat visits. • One-third (33%) of visitors reporting use of wayside exhibits were in groups composed
of adults and children.
Visitor Use and Evaluation of Interpretive Media 93
• Thirty percent of those respondents reporting use of wayside exhibits were age 51 or older.
• Wayside exhibits received an overall mean importance rating of 3.27, or “moderately
important.” The only type of interpretive media with a lower importance rating was park information radio stations.
• Wayside exhibits were rated as “very important” by visitors spending less than 6 hours
on their park visits. Wayside exhibits were rated as “moderately important” by all other visitor subgroups.
• Waysides were ranked as the least important types of interpretive media by respondents
aged 41-60, visitors in groups of seniors only, and those on park visits of 17 or more hours.
• Wayside exhibits received an overall mean quality rating of 4.12, or “good.” • The quality of waysides was rated as “good” by all visitor subgroups. Wayside exhibits could be designed for a diversity of visitors, to be enjoyed by visitors of all ages. In that family groups make disproportionate use of wayside exhibits, designers might consider inclusion of information of varying complexity that can be shared as part of a family experience. Height considerations might also be appropriate. As a type of interpretive media considered “very important” to those on trips of 6 hours or fewer, wayside exhibits are an appropriate type of interpretive media used to provide general park orientation information to visitors.

Visitor Use and Evaluation of Interpretive Media 94
Findings by Interpretive Media Type⎯Audio-Visual Programs Audio-visual programs were used by slightly more than one-quarter of all visitors surveyed. Though accounting for a small proportion of all park visitors, those in tour groups made disproportionate use of audio-visual programs. Among park visitors spending less than 2 hours on a visit, audio-visual programs were the most widely used. Audio-visual programs were considered “very important” to nearly all visitors and the quality was consistently considered to be “good.”
Audio-visual program, Badlands National Park, 1958 Analysis of individual interpretive media data indicate the following: • Audio-visual programs were used by 27% of all visitors surveyed. • Ninety-four percent of those reporting use of audio-visual programs were in groups of 2
or more. Although only 6% of those using audio-visual programs were traveling alone, they ranked audio-visual programs as the most important type of interpretive media.
• Eighty percent of those reporting use of audio-visual programs were first-time visitors. • Nearly half (49%) of respondents reporting use of audio-visual programs were 51 or
older. • Forty-seven percent of those reporting use of audio-visual programs were in family
groups.

Visitor Use and Evaluation of Interpretive Media 95
• Forty-seven percent of visitor groups reporting use of audio-visual programs were composed of adults only.
• More than one-quarter (27%) of those reporting use of audio-visual programs were on
trips between 2 and 4 hours in length. Sixteen percent of those reporting use of audio-visual programs were on such short trips. Of those visitors spending less than 2 hours on a park visit, audio-visual programs were the most widely used form of interpretive media.
• Although groups of seniors only accounted for 9% of all park visitors, 15% percent of
visitor groups reporting use of audio-visual programs were composed of seniors only. • Similarly, while 11% of all respondents were in groups composed of seniors and adults,
groups of seniors and adults accounted for 16% of those reporting use of audio-visual programs.
• Audio-visual programs received an overall mean importance rating of 4.09, or “very
important.” • Audio-visual programs ranked as the third-most important type of interpretive media. • Audio-visual programs were considered to be “very important” by all visitor subgroups,
with the exception of those in groups of 2. Visitors in groups of 2 rated audio-visual programs as “moderately important.”
• Audio-visual programs received an overall mean quality rating of 4.28, or “good.” They
were ranked as the highest quality type of interpretive media. • The quality of audio-visual programs was rated as “good” by all visitor subgroups. Audio-visual programs might best be designed with first-time park visitors clearly in mind. Interpretive planners might consider designing audio-visual programs that appeal to a wide audience, including families, adults, and seniors. Particular attention should be given to the use of audio-visual programs by older visitors and groups including seniors. In designing the venues in which audio-visual programs are presented, the use of these media by tour groups should be considered. This could include design features providing easy auditorium access and egress in the proximity of bus parking areas. Audio-visual programs were the most commonly used type of interpretive media by visitors spending less than 2 hours in a park. Audio-visual programs, thus, may be one of the few ways to effectively communicate about park resources and stories to visitors during a short stop.

Visitor Use and Evaluation of Interpretive Media 96
Findings by Interpretive Media Type⎯Self-Guided Tours One-third of all visitors reported use of self-guided tours. They appeal to diverse audiences, particularly to visitor groups including children. Self-guided tours were not widely used by solitary visitors. Self-guided tours were considered “very important” and of “good” quality by all visitors using them.
Self-guided trail, Chesapeake and Ohio Canal National Historical Park, circa 1900 Analysis of individual interpretive media data indicate the following: • Self-guided tours were used by one-third of all visitors surveyed (33%). • Ninety-seven percent of those reporting use of self-guided tours were in groups of 2 or
more. • Eighty-one percent of respondents reporting use of self-guided tours were in groups of
adults only (46%) and adults and children (35%). • Seventy percent of respondents reporting use of self-guided tours were family groups
(57%) or groups of friends (13%). Only 6% of those reporting use of self-guided tours were visiting the park alone.
• Self-guided tours were used with greater frequency by those on first visits (68%) than
those on repeat visits (32%) to the park.

Visitor Use and Evaluation of Interpretive Media 97
• Forty-five percent of visitors reporting use of self-guided tours were on park visits of 17 or more hours. Only 11% of those reporting use of self-guided tours were on visits under 2 hours in length.
• Self-guided tours were used by the greatest proportion of respondents aged 41-50 (30%),
and aged 51-60 (21%). • Self-guided tours received an overall mean importance rating of 4.32, or “very
important.” • Self-guided tours were rated as “very important” by all visitor subgroups. • Self-guided tours were ranked as the most important type of interpretive media overall. • Self-guided tours were ranked as the most important type of interpretive media by the
following visitor subgroups: • groups of 3 or 4 • groups of 5 or more • groups of adults only • groups of adults and children • groups of seniors and adults • respondents aged 31-40 • first-time visitors • repeat visitors • visitors spending less than 2 hours in the park
• Self-guided tours received an overall mean quality rating of 4.20, or “good.” • They ranked as the third-highest quality type of interpretive media. • The quality of self-guided tours was rated “good” by all visitor subgroups. Self-guided tours, as currently offered within units of the National Park System are popular, considered very important, and the quality is consistently good. The NPS is doing a good job in the design of self-guided tours. Interpretive planners designing this media in the future might consider the potential participation by different visitor group members. In particular, design features that encourage participation in the self-guided tour by children as part of a family or mixed-age group would be appropriate. Content of interest to visitors on short visits (including visits less than 2 hours) and those spending longer periods of time in a given park unit could be included in the design of self-guided tours.

Visitor Use and Evaluation of Interpretive Media 98
Findings by Interpretive Media Type⎯Park Newspapers Park newspapers have an important orientation function, but not for those visitors spending less than 2 hours on a park visit or those visiting as part of a tour group. Park newspapers were used primarily by those on longer visits to the park. Park newspapers were most widely used by first-time visitors, younger visitors, family groups, and groups composed of adults and children. Most visitors found park newspapers to be “very important.” All visitors reporting use of park newspapers found them to be of “good” quality.
Camper reading newspaper, Blue Ridge Parkway, 1956 Analysis of individual interpretive media data indicate the following: • Park newspapers were used by 26% of all visitors surveyed. • Seventy-three percent of those reporting use of park newspapers were on park visits of
17 or more hours. Only 1% of those reporting use of park newspapers were on visits of less than 2 hours.
• Park newspapers were most used (69%) by visitors in family groups. Very few visitors
traveling alone (4%), or in tour groups (2%) made use of park newspapers. • Sixty-two percent of visitors reporting use of park newspapers were on their first visit to
the unit of the National Park System.

Visitor Use and Evaluation of Interpretive Media 99
• Forty-one percent of visitors reporting use of park newspapers were in groups of adults and children. Only 5% of those reporting use of park newspapers were in groups composed of seniors only.
• Thirty-seven percent of those reporting use of park newspapers were aged 41-50. • Thirty-five percent of visitors using park newspapers were in groups of 3 or 4. Park
visitors traveling alone accounted for only 3% of those using park newspapers. • Park newspapers received an overall mean importance rating of 3.57, or “very
important.” They were rated as “very important” by most visitor subgroups. Park newspapers were rated as “moderately important” by visitors traveling alone, groups of family and friends, respondents aged 40 and younger, and groups of adults only.
• Park newspapers received an overall mean quality rating of 4.06, or “good.” • The quality of park newspapers was rated as “good” by all visitor subgroups. Interpretive planners might consider designing park newspapers for a family audience. Information and activities of interest to children should be included. Including more detailed content of interest to those spending longer periods of time on their park visits (17 hours or more) could be appropriate in park newspapers. Park newspapers should not be considered as the media for providing basic orientation information for those on short visits. That function is served more appropriately with park brochures and audio-visual programs.

Visitor Use and Evaluation of Interpretive Media 100
Findings by Interpretive Media Type⎯Internet/Park Websites Internet/park websites were used by few visitors. It is important to note that questions regarding use of internet/park websites were included in only 2 of the 23 VSP surveys conducted in 1997, 1998, and 1999. In addition, the questions regarding use of internet/park websites on the studies included in this report asked if visitors used them on their visit to the park, not in preparation for their visit. It is likely that visitors actually referred to use of internet/park websites used prior to the park visit. Internet/park websites were considered to be “moderately important” or “very important” by all visitor subgroups. The quality of internet/park websites was considered to be “good” overall. Questions regarding use of internet/park websites are routinely included in VSP surveys currently conducted.
Audio-visual program, Rock Creek Park, 1952 Analysis of individual interpretive media data indicate the following: • Internet/park websites were used by 7% of all visitors surveyed. All other types of
interpretive media were used by greater proportions of visitors than internet/park websites.
• Seventy-eight percent of respondents reporting use of internet/park websites were age
50 and younger. The smallest proportion of those reporting use of internet/park websites (4%) were 61 or older.

Visitor Use and Evaluation of Interpretive Media 101
• Almost three-fourths of the visitors reporting use of internet/park websites (74%) were in family groups.
• Sixty percent of those reporting use of internet/park websites were on visits of 17 hours
or more. • Fifty-nine percent of those reporting use of internet/park websites were on repeat visits.
Internet/park websites are the only type of interpretive media used by a greater proportion of repeat visitors than first-time visitors.
• Fifty-eight percent of the visitors reporting use of internet/park websites were in groups
of 3 or more. • Forty-eight percent of those visitors reporting use of internet/park websites were in
groups composed of adults and children. Slightly fewer visitor groups (46%) made up of adults only reported use of internet/park websites.
• No groups composed of seniors only reported using internet/park websites. • Internet/park websites received an overall mean importance rating of 3.49, or
“moderately important.” • Visitor subgroups rated internet/park websites as either “very important” or
“moderately important.” The following table identifies the importance rating the different visitor subgroups assigned to internet/park websites.
“Very important” “Moderately important”
Visitors in groups of two or more Visitors traveling alone (group size) Family groups Visitors traveling alone (group type) Respondents 31 and older Groups of family and friends Groups of adults only, adults and children, and seniors only
Groups of friends
First-time and repeat visitors Tour groups Visitors spending fewer than 2 hours in a park unit Respondents 30 and younger Visitors spending 4 or more hours in a park unit Visitors spending 2-4 hours in a park unit
Table 11.2: Importance of internet/park websites
• Internet/park websites received an overall mean quality rating of 3.60, or “good.” • Internet/park websites were rated of “good” quality by all visitor subgroups with three
exceptions. Respondents aged 31-40 rated the quality of internet/park websites as “average.” Respondents aged 61 and older rated the quality of internet/park websites as “very good.” Groups of seniors and adults rated the quality of internet/park websites as “very good,” higher in quality than any other type of interpretive media.

Visitor Use and Evaluation of Interpretive Media 102
Interpretive planners working with internet/park websites might consider including content and design features that appeal to family groups. Internet/park websites could also include detailed features of interest to those spending longer periods of time on their park visits (17 hours or more) and for those who are repeat visitors. It is likely that the primary function of internet/park websites is in trip planning. For this reason, detailed information appropriate for all of potential visitors should be included.

Visitor Use and Evaluation of Interpretive Media 103
Findings by Interpretive Media Type⎯Bulletin Boards Bulletin boards serve a function of announcing activities and relaying important safety information, among others. Bulletin boards were used by a small proportion of park visitors. They were used primarily by visitors in family groups and those on longer park visits. Bulletin boards were considered to be “very important” and of “good” quality by all respondents.
Bulletin board, Crater Lake National Park, 1931 Analysis of individual interpretive media data indicate the following: • Bulletin boards were used by 21% of all visitors surveyed. • Sixty percent of those reporting use of bulletin boards were in family groups. • Sixty percent of visitors reporting use of bulletin boards were on trips of 17 hours or
more. Those on shorter park visits made little use of bulletin boards. • Fifty-five percent of those reporting use of bulletin boards were first-time visitors.
Similarly, 55% of all park visitors surveyed were first-time visitors. • Of the visitors reporting use of bulletin boards, 52% were in groups composed of adults
only. Thirty-two percent were in groups of adults and children. • Forty percent of the visitors reporting use of bulletin boards were in groups of 2. Only
6% of those reporting use of bulletin boards were visiting the park alone.

Visitor Use and Evaluation of Interpretive Media 104
• Bulletin boards were used by respondents of all ages, with the greatest proportion (34%)
being between the ages of 41-50. • Bulletin boards received an overall mean importance rating of 3.70, or “very important.” • Bulletin boards were rated as “very important” by all visitor subgroups. • Bulletin boards received an overall mean quality rating of 3.97, or “good.” • The quality of bulletin boards was rated as “good” by all visitor subgroups. Interpretive planners designing and maintaining bulletin boards might consider including content appropriate for a wide audience and of interest to those on longer park visits. They should not be seen as the most appropriate media for general park orientation information.

Visitor Use and Evaluation of Interpretive Media 105
Findings by Interpretive Media Type⎯Park Information Radio Stations Park information radio stations were not widely used. They were considered to be “moderately important” and of “average” quality by most visitor subgroups. Park information radio stations were used in the lowest proportions by visitors in tour groups and groups including seniors.
Audio devices, San Francisco Maritime National Historical Park, 1980 Analysis of individual interpretive media data indicate the following: • Park information radio stations were used by 9% of all visitors surveyed. • Ninety-two percent of those reporting use of park information radio stations were in
groups composed of adults only (52%) or adults and children (40%). • Eighty-four percent of visitors reporting use of park information stations were in groups
of 2 (49%) and groups of 3 or 4 (34%). Only 8% of those visitor groups reporting use of park information radio stations included seniors.
• Eighty percent of those reporting use of park information radio stations were first-time
visitors. • Seventy-two percent of visitors reporting use of park information radio stations were in
family groups. Very few visitors reporting use of park information radio stations were in groups composed of family and friends (3%) or in tour groups (1%).
Visitor Use and Evaluation of Interpretive Media 106
• Sixty percent of the visitors reporting use of park information radio stations were on visits of 17 hours or more.
• Only 4% of those reporting use of park information radio stations were 61 or older. • Park information radio stations received an overall mean importance rating of 2.99, or
“moderately important.” • Park information radio stations ranked as both the least important type of interpretive
media overall. • Park information radio stations received an overall mean quality rating of 3.14, or
“average.” • Park information radio stations ranked as the lowest quality type of interpretive media
overall. Interpretive planners responsible for park radio information stations might consider inclusion of content interesting to family groups and those spending more than 17 hours on their park visits.

Visitor Use and Evaluation of Interpretive Media 107
Ranger-Guided Programs Fewer than one-quarter of all visitors surveyed reported participation in ranger-guided programs. Those who did participate in ranger-guided programs considered them to be “very important.” The quality of ranger-guided programs was consistently “good” as rated by those visitors participating in them. For visitors, ranger-guided programs are among the most important aspects of a park’s interpretive offering. They are of the highest quality. Only on occasion was a type of interpretive media considered more important than ranger-guided programs. Nonetheless, not all visitors to parks choose to or are able to participate in such programs.
Ranger-guided program, Frederick Douglass National Historic Site, circa 1970 Analysis of individual interpretive media data indicate the following: • Ranger-guided programs were used by 22% of all visitors surveyed. Ranger-guided
programs were used by more visitors than were bulletin boards, park information radio stations, and internet/park websites.
• Ranger-guided programs were used primarily by visitors in groups of 2 or more (95%). • Ranger-guided programs were used in greatest proportion (75%) by respondents aged
41 or older. • Nearly three-fourths (73%) of those reporting participation in ranger-guided programs
were on first visits to the given park site.

Visitor Use and Evaluation of Interpretive Media 108
• Fifty-one percent of the visitors reporting participation in ranger-guided programs were in family groups.
• Forty-seven percent of visitors reporting participation in ranger-guided programs were
on visits of 17 or more hours, and 20% were on visits of 6-16 hours • Fifteen percent of visitors reporting participation in ranger-guided programs were in
groups composed of seniors and adults, and 15% were in groups of seniors only. These two group types accounted for 11% and 9% of all park visitors respectively.
• Ranger-guided programs received an overall mean importance rating of 4.17 or “very
important.” Only self-guided tours and park brochures were ranked as more important than ranger-guided programs.
• Ranger-guided programs received an overall mean quality rating of 4.38 or “good.”
They were ranked as higher in quality than any type of interpretive media. • Ranger-guided programs were ranked higher in quality than any type of interpretive
media by most visitor subgroups. • The quality of ranger-guided programs was rated as “very good” by those in tour
groups. Due to the great importance visitors place on ranger-guided programs, they are a key element of a park’s interpretive offerings. An effective interpretive plan for a park might best combine high quality ranger-guided programs with use of interpretive media appropriate to the park’s visitor population. Ranger-guided programs should be designed for all age groups as appropriate.

Visitor Use and Evaluation of Interpretive Media 109
Limitations of this Report, Recommendations for Future Research and Analysis There are several limitations that should be considered in using data presented in this report. These limitations also help identify future research and analysis that could provide usable knowledge for park managers involved in the design of interpretive media and ranger-guided programs. Represented here are responses of individuals visiting specific park units during limited periods of time. Though not representative of all park visitors at all parks and at all times, the information included in this report can provide basic guidance applicable systemwide. The 23 VSP studies analyzed in this report were not selected specifically for this project. Future studies may be planned with this kind of systemwide analysis in mind. Standardization of question wording and inclusion of identical questions in multiple surveys would make an effort such as this easier and more efficient. The characteristics of visitors analyzed in this report in no way represent the full diversity of visitors to units of the National Park System. In addition to the individual characteristics presented here, visitors to units of the National Park System are also ethnically and racially diverse, have a variety of abilities and disabilities, have varying educational backgrounds, and represent a range of personal income categories. They also come from various places throughout the United States and the world, speak different languages, and have unique cultural identities. Such demographic data were sparse in the 23 studies analyzed for this report. This lack of data should be treated as a limitation of this report. Such information has been collected more frequently in VSP studies conducted since 1999, particularly regarding ethnicity, race, educational attainment and income, and analysis of those data could provide usable information for interpretive planners and park managers. The trip characteristics analyzed here are not exhaustive. In particular, information regarding the reason for a park visit, the distance traveled to the park, and whether the park was considered a destination or not was not included. Collecting such data on a routine basis could provide valuable information in future projects of this type. In this analysis, simple proportions of interpretive media use were presented. The analysis did not focus on the suite of interpretive media and ranger-guided programs used by different visitors and visitor groups. Future projects and park managers could benefit from an analysis of the variety of interpretive media used by specific park visitors and visitor groups. Data on visitor use of the internet/park websites were collected in only 2 of the surveys analyzed in this report. In the surveys conducted by the VSP since 1999, questions about access to and use of the internet have been included on a regular basis. A more detailed analysis of current VSP data regarding internet use by park visitors would prove particularly valuable for park managers and interpretive designers. A project of this nature can provide some valuable information for park managers. It can also provide valuable insights on the design of future studies and analyses.

Visitor Use and Evaluation of Interpretive Media 110
The in-depth visitor studies conducted by the VSP are based on systematic surveys of park visitors. A random sample of visitor groups is chosen to represent the general visitor population during a study period of approximately one week. Sample size and sampling intervals are based upon estimates using the previous year's visitation statistics. Results are usually accurate to within 4 percentage points for simple questions, and are somewhat less accurate for complex ones. The results are statistically significant at the .05 level. This means that if different samples had been drawn, the results would have been similar 95 out of 100 times. Short interviews are conducted as visitors arrive at a sampling site. The interviews are to collect data for a non-response bias check, obtain mailing addresses for follow-up reminders and distribute the mail-back questionnaires. The refusal rate (the proportion of visitors contacted who decline to participate) currently averages 7%. The response rate (the proportion of visitors who return their questionnaires) currently averages 78%. The data are coded and prepared by the Social and Economic Sciences Research Center at Washington State University. The data are analyzed using a standard statistical analysis program. A check on key variables is conducted to see if those visitors who did not respond (from initial interview data) were significantly different from those who returned their questionnaires (non-response bias). Responses to open-ended questions (for which visitors write in comments) are categorized and summarized by VSP staff. In-depth visitor studies have several limitations. Responses to mail-back questionnaires may not reflect actual behavior or opinions. The results cannot always be generalized beyond the study periods. Visitor groups that do not include an English-speaking person may be underrepresented. These limitations apply to all studies of this type.
Visitor survey distribution, Gettysburg National Military Park, circa 1990
Appendix: Survey Methods

Visitor Use and Evaluation of Interpretive Media 111
1997-1999 Visitor Services Project Surveys Virgin Islands National Park (VSP Report 93) Study period: March 1-9, 1997 1,444 groups contacted 1,328 agreed to participate 1,039 groups responded (78% response rate) Mojave National Preserve (VSP Report 94) Study period: April 5-13, 1997 732 groups contacted 671 agreed to participate 527 groups responded (79% response rate) Martin Luther King, Jr. National Historic Site (VSP Report 95 ) Study period: April 13-19, 1997 517 groups contacted 473 agreed to participate 286 groups responded (61% response rate) Lincoln Boyhood National Memorial (VSP Report 96) Study period: July 3-9, 1997 532 groups contacted 520 agreed to participate 415 groups responded (80% response rate) Grand Teton National Park (VSP Report 97 ) Study period: July 12-18, 1997 1,155 groups contacted 1,078 agreed to participate 874 groups responded (81% response rate) Bryce Canyon National Park (VSP Report 98) Study period: July 15-21, 1997 595 groups contacted 530 agreed to participate 427 groups responded (81% response rate) Voyageurs National Park (VSP Report 99) Study period: July 25-August 3, 1997 931 groups contacted 896 agreed to participate 718 groups responded (80% response rate)

Visitor Use and Evaluation of Interpretive Media 112
Lowell National Historical Park (VSP Report 100) Study period: August 3-9, 1997 604 groups contacted 560 agreed to participate 471 groups responded (84% response rate) Jean Lafitte National Historical Park and Preserve (VSP Report 101) Study period: March 29-April 4, 1998 854 groups contacted 766 agreed to participate 554 groups responded (72% response rate) Chattahoochee River National Recreation Area (VSP Report 102) Study period: April 11-19, 1998 1,127 groups contacted 989 agreed to participate 704 groups responded (71% response rate) Cumberland Island National Seashore (VSP Report 103) Study period: May 3-17, 1998 355 groups contacted 344 agreed to participate 295 groups responded (86% response rate) The Netherlands Carillon/The United States Marine Corps War Memorial (Iwo Jima) (VSP Report 104 ) Study period: May 30-June 7, 1998 948 groups contacted 809 agreed to participate 576 groups responded (71% response rate) National Monuments and Memorials-Washington, DC (VSP Report 105) Study period: June 21-27, 1998 1,542 groups contacted 1,198 agreed to participate 874 groups responded (73% response rate) Klondike Gold Rush National Historical Park (VSP Report 106) Study period: July 6-12, 1998 813 groups contacted 666 agreed to participate 546 groups responded (82% response rate)

Visitor Use and Evaluation of Interpretive Media 113
Whiskeytown National Recreation Area (VSP Report 107) Study period: July 20-26, 1998 858 groups contacted 784 agreed to participate 486 groups responded (62% response rate) Acadia National Park (VSP Report 108) Study period: August 2-8, 1998 1,312 groups contacted 1,255 agreed to participate 1,065 groups responded (85% response rate) Big Cypress National Preserve (VSP Report 109) Study period: January 2-10, 1999 978 groups contacted 857 agreed to participate 582 groups responded (68% response rate) San Juan National Historic Site (VSP Report 110) Study period: February 21-27, 1999 1,036 groups contacted 919 agreed to participate 651 groups responded (71% response rate) St. Croix National Scenic Riverway (VSP Report 111) Study period: June 25-July 3, 1999 842 groups contacted 747 agreed to participate 499 groups responded (67% response rate) Rock Creek Park (VSP Report 112) Study period: July 8-14, 1999 1,036 groups contacted 888 agreed to participate 564 groups responded (64% response rate) New Bedford Whaling National Historical Park (VSP Report 113) Study period: July 20-26, 1999 454 groups contacted 420 agreed to participate 284 groups responded (68% response rate)

Visitor Use and Evaluation of Interpretive Media 114
Glacier Bay National Park and Preserve (VSP Report 114) Study period: July 23-August 1, 1999 719 groups contacted 666 agreed to participate 545 groups responded (82% response rate) Kenai Fjords National Park Exit Glacier Area (VSP Report 115) Study period: August 5-11, 1999 421 groups contacted 400 agreed to participate 331 groups responded (83% response rate)
Ranger-guided program, Castillo de San Marcos National Monument, 1950

Visitor Use and Evaluation of Interpretive Media 115
For more information, contact: NPS Visitor Services Project Park Studies Unit College of Natural Resources Department of Resource Recreation and Tourism University of Idaho P.O. Box 441139 Moscow, ID 83844-1139 (208) 885-7863 http://www.psu.uidaho.edu
NPS Social Science Program National Park Service 1849 C Street, NW (2300) Washington, DC 20240 (202) 513-7190 http://www.nps.gov/socialscience
About the NPS Social Science Program The role and function of the NPS Social Program are to: provide leadership and direction to the social science activities of the NPS, coordinate social science activities with other programs of the NPS, act as liaison with the USGS Biological Resources Division and other federal agencies on social science activities, provide technical support to parks, park clusters, support offices and regional offices, and support a program of applied social science research related to national research needs of the NPS. The objectives of the NPS social science program are to conduct and promote state-of-the-art social science related to the mission of the National Park Service and deliver usable knowledge to NPS managers and to the public.