Interpretation of Noble Metal and Transition Metal XANES
116
X-ray Absorption Spectroscopy Simon R. Bare UOP LLC, a Honeywell Company Des Plaines, IL 60016 USA [email protected] Modern Methods in Heterogeneous Catalysis Research Fritz Haber Institute, October 27, 2006 © 2006 UOP LLC All Rights Reserved
Transcript of Interpretation of Noble Metal and Transition Metal XANES
X-ray Absorption Spectroscopy
Simon R. Bare
UOP LLC, a Honeywell CompanyDes Plaines, IL 60016 USA
Modern Methods in Heterogeneous Catalysis Research
Fritz Haber Institute, October 27, 2006
© 2006 UOP LLC All Rights Reserved
OutlineX-ray absorption processIntroduction to information content of x-ray absorption spectroscopyElements of an x-ray absorption spectroscopy experimentData analysis & development of EXAFS equationExamples of application to catalyst characterization: XANESExamples of application to catalyst characterization: EXAFS
Page 2
Acronyms
EXAFS – Extended X-ray Absorption Fine Structure
XAS – X-ray Absorption Spectroscopy
XAFS – X-ray Absorption Fine Structure
XANES - X-ray Absorption Near Edge Structure
NEXAFS- Near-Edge X-ray Absorption Fine Structure
Page 3
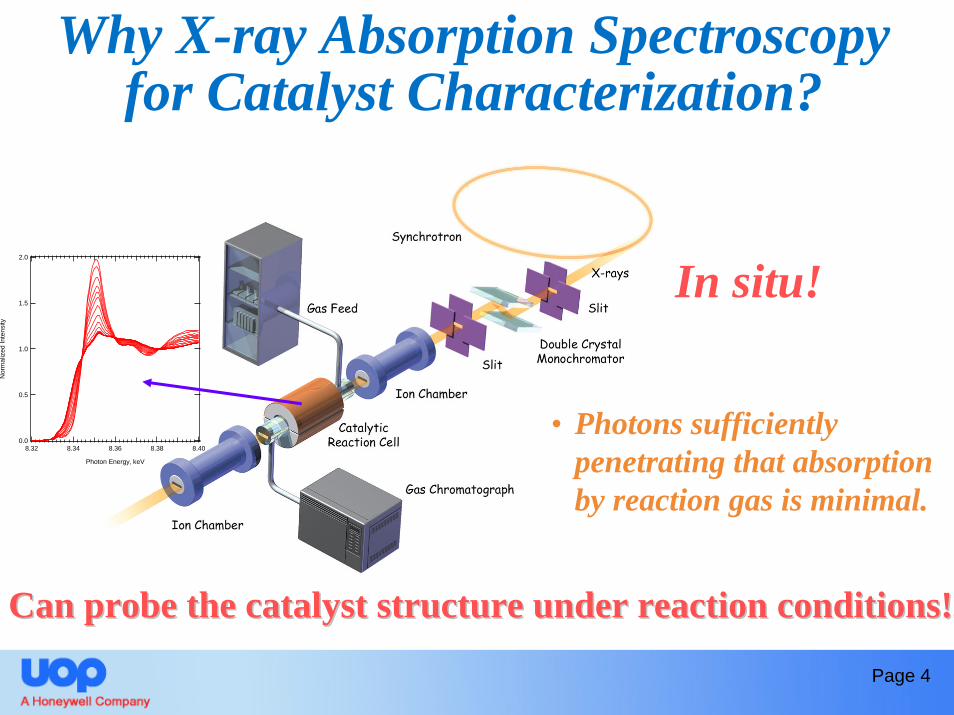
Why X-ray Absorption Spectroscopy for Catalyst Characterization?
• Photons sufficiently penetrating that absorption by reaction gas is minimal.
In situ!2.0
1.5
1.0
0.5
0.0
Nor
mal
ized
Inte
nsity
8.408.388.368.348.32
Photon Energy, keV
Can probe the catalyst structure under reaction conditions!Can probe the catalyst structure under reaction conditions!
Page 4
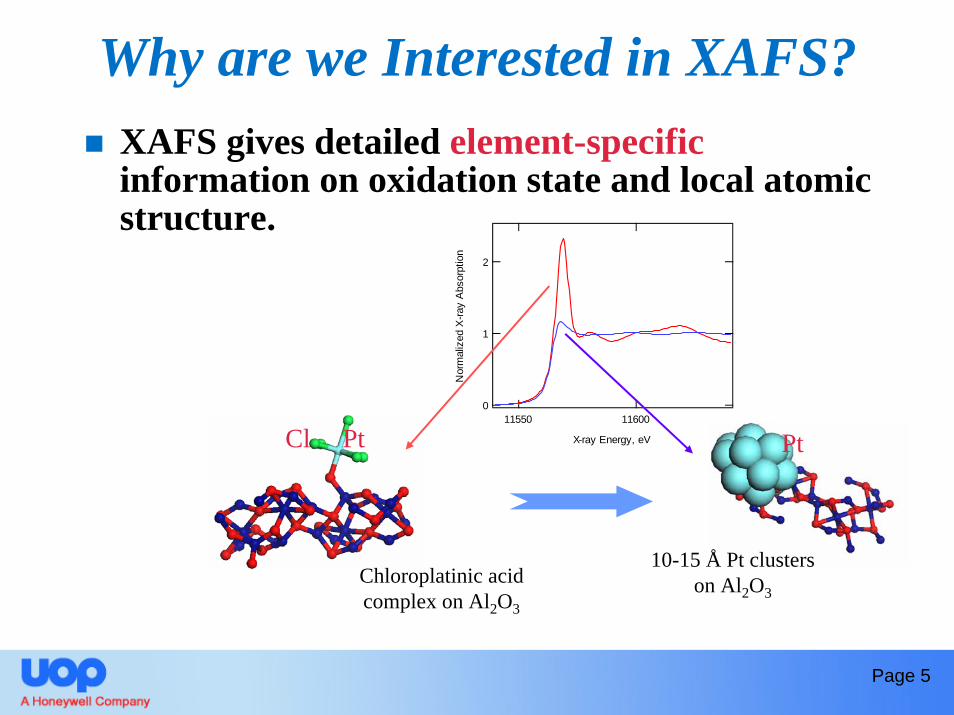
Why are we Interested in XAFS?XAFS gives detailed element-specificinformation on oxidation state and local atomic structure.
PtCl Pt
2
1
0
Nor
mal
ized
X-ra
y A
bsor
ptio
n
1160011550
X-ray Energy, eV
Chloroplatinic acid complex on Al2O3
10-15 Å Pt clusters on Al2O3
Page 5
XANES
EXAFS
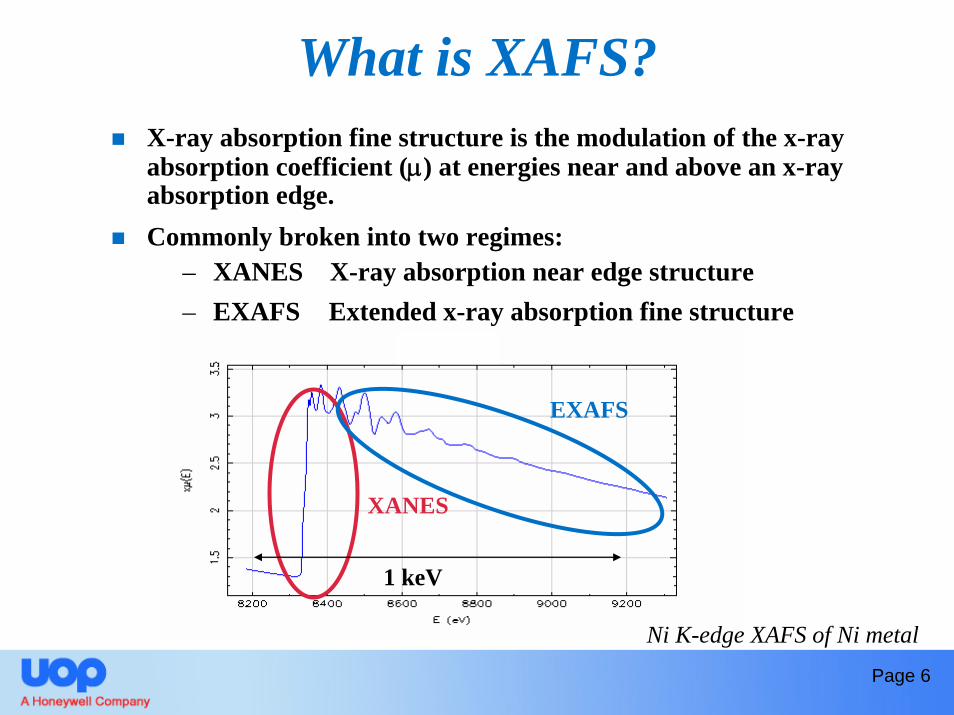
X-ray absorption fine structure is the modulation of the x-ray absorption coefficient (μ) at energies near and above an x-ray absorption edge.Commonly broken into two regimes:
– XANES X-ray absorption near edge structure– EXAFS Extended x-ray absorption fine structure
Page 6
Ni K-edge XAFS of Ni metal
What is XAFS?
1 keV
X-ray Absorption Near Edge Structure (XANES)
Provides quantitative information on:– Average oxidation state– Local coordination environment– Electronic structure (empty density of
states)
Chemistry!
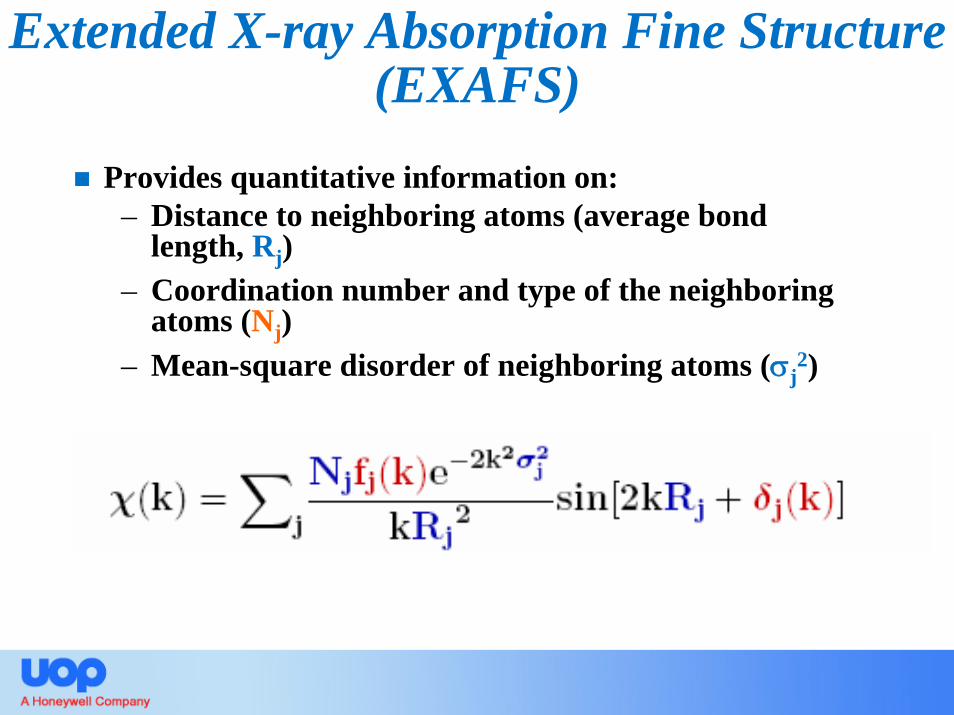
Provides quantitative information on:– Distance to neighboring atoms (average bond
length, Rj)– Coordination number and type of the neighboring
atoms (Nj)– Mean-square disorder of neighboring atoms (σj
2)
Extended X-ray Absorption Fine Structure (EXAFS)
X-ray Absorption
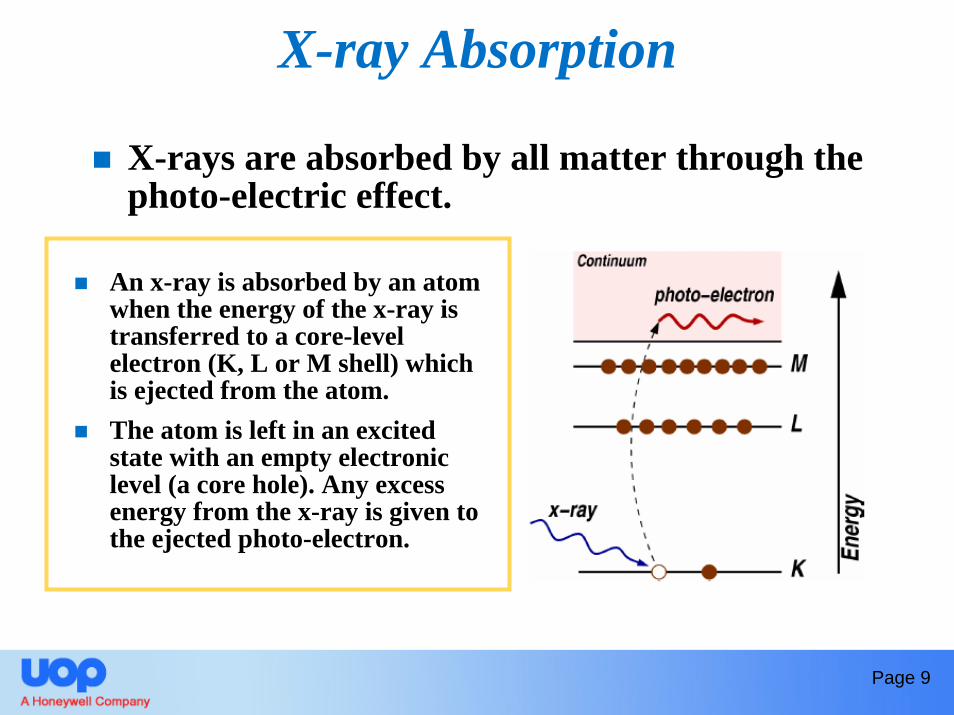
X-rays are absorbed by all matter through the photo-electric effect.
An x-ray is absorbed by an atom when the energy of the x-ray is transferred to a core-level electron (K, L or M shell) which is ejected from the atom.The atom is left in an excited state with an empty electronic level (a core hole). Any excess energy from the x-ray is given to the ejected photo-electron.
Page 9
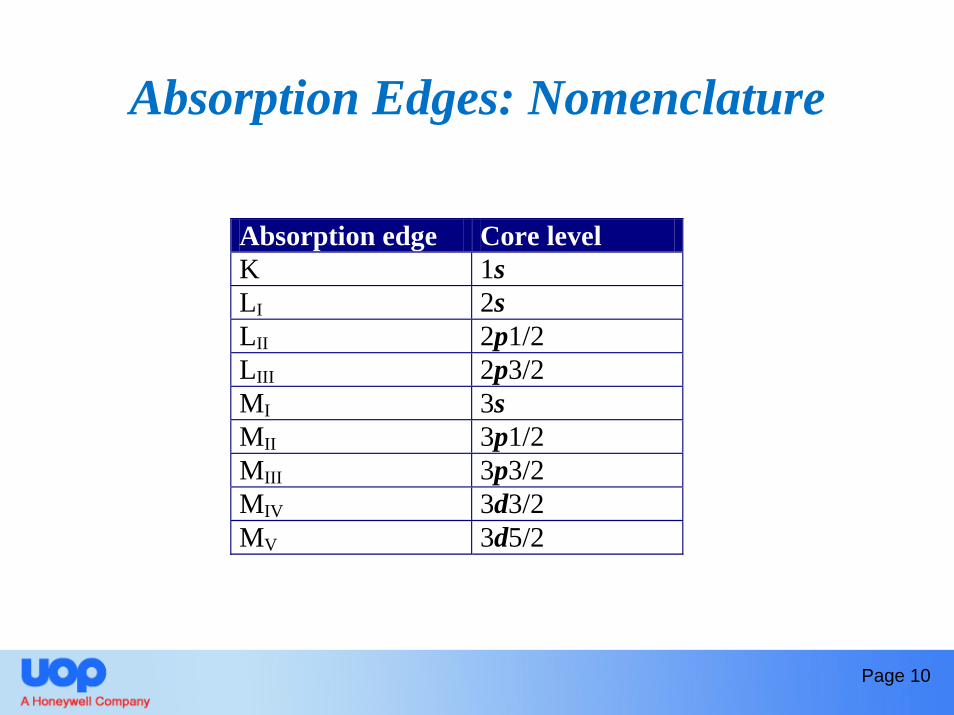
Absorption Edges: Nomenclature
Absorption edge Core level K 1s LI 2s LII 2p1/2
LIII 2p3/2 MI 3s MII 3p1/2
MIII 3p3/2 MIV 3d3/2 MV 3d5/2
Page 10
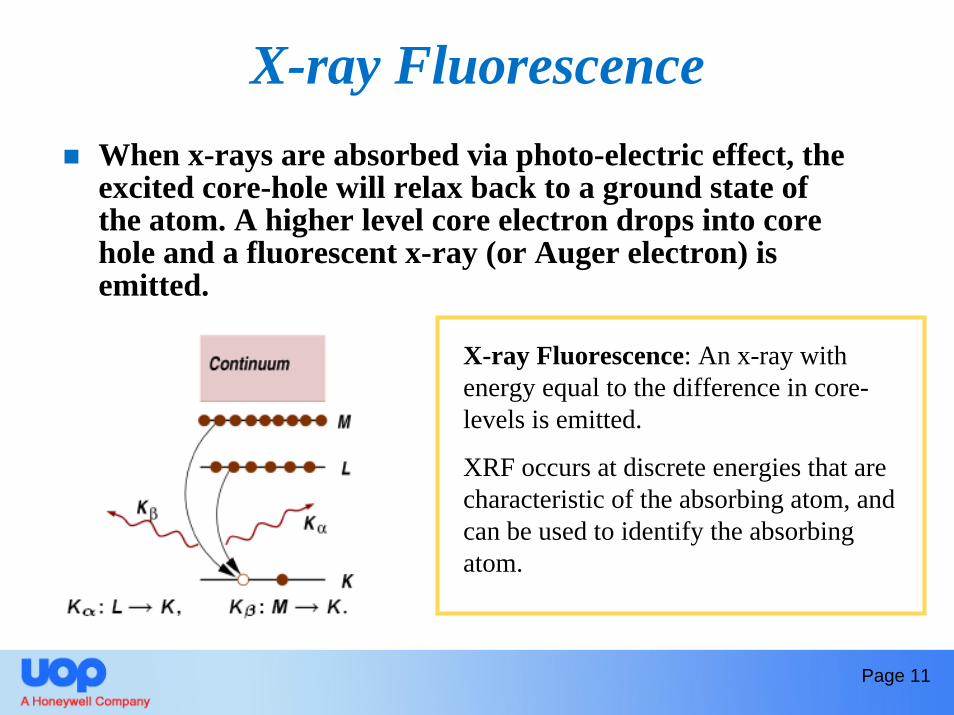
X-ray FluorescenceWhen x-rays are absorbed via photo-electric effect, the excited core-hole will relax back to a ground state of the atom. A higher level core electron drops into core hole and a fluorescent x-ray (or Auger electron) is emitted.
X-ray Fluorescence: An x-ray with energy equal to the difference in core-levels is emitted.
XRF occurs at discrete energies that are characteristic of the absorbing atom, and can be used to identify the absorbing atom.
Page 11
The X-ray Absorption Coefficient: μ
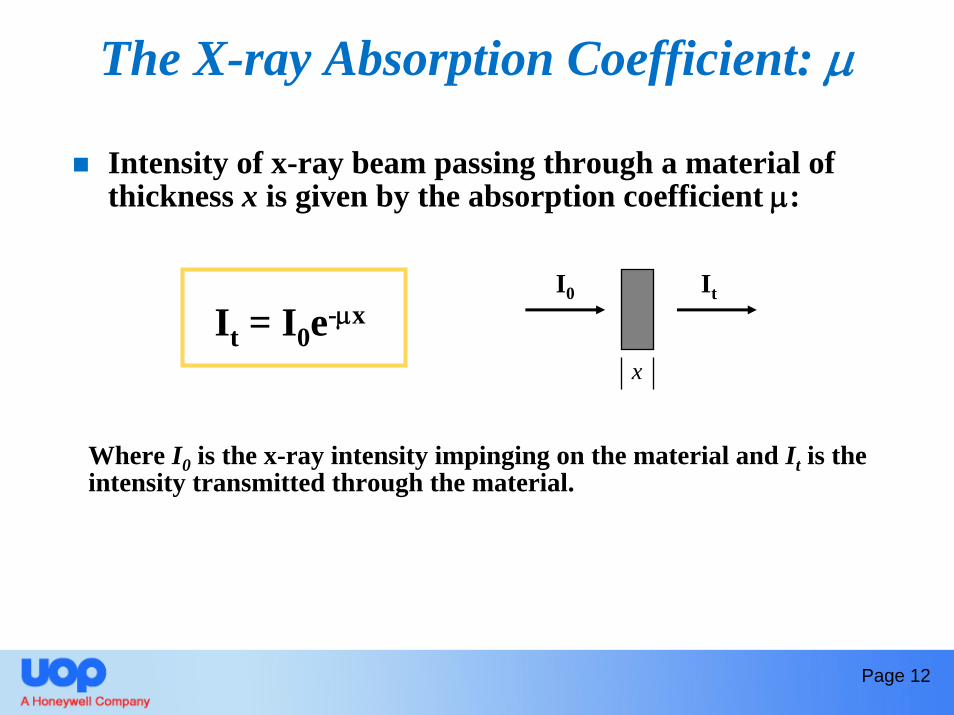
Intensity of x-ray beam passing through a material of thickness x is given by the absorption coefficient μ:
It = I0e-μx
x
I0 It
Where I0 is the x-ray intensity impinging on the material and It is the intensity transmitted through the material.
Page 12
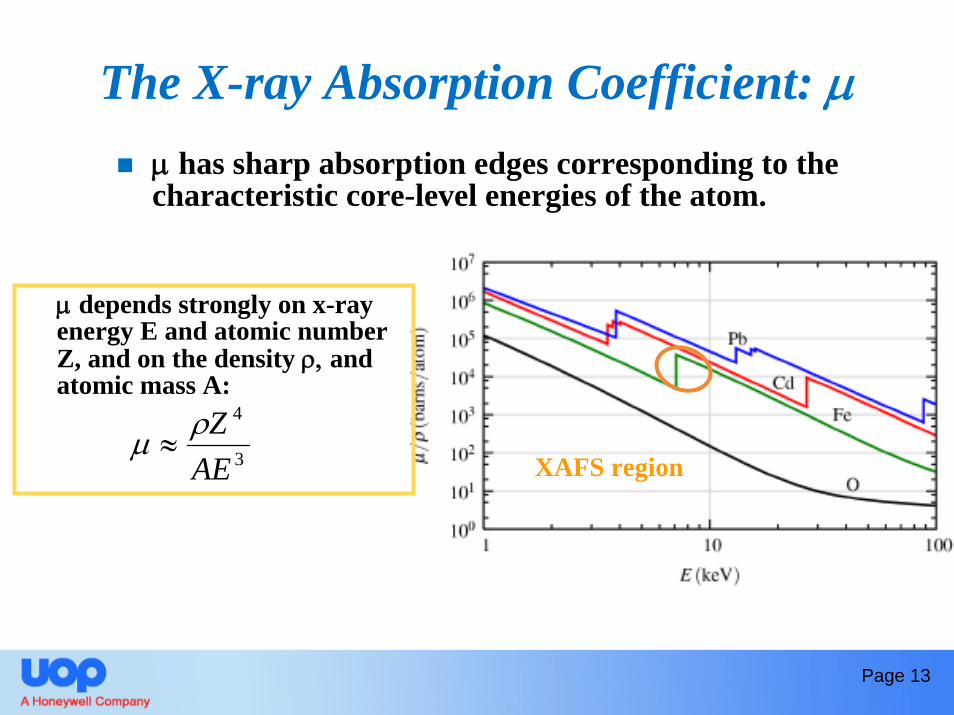
The X-ray Absorption Coefficient: μμ has sharp absorption edges corresponding to the characteristic core-level energies of the atom.
Page 13
XAFS region3
4
AEZρμ ≈
μ depends strongly on x-ray energy E and atomic number Z, and on the density ρ, and atomic mass A:
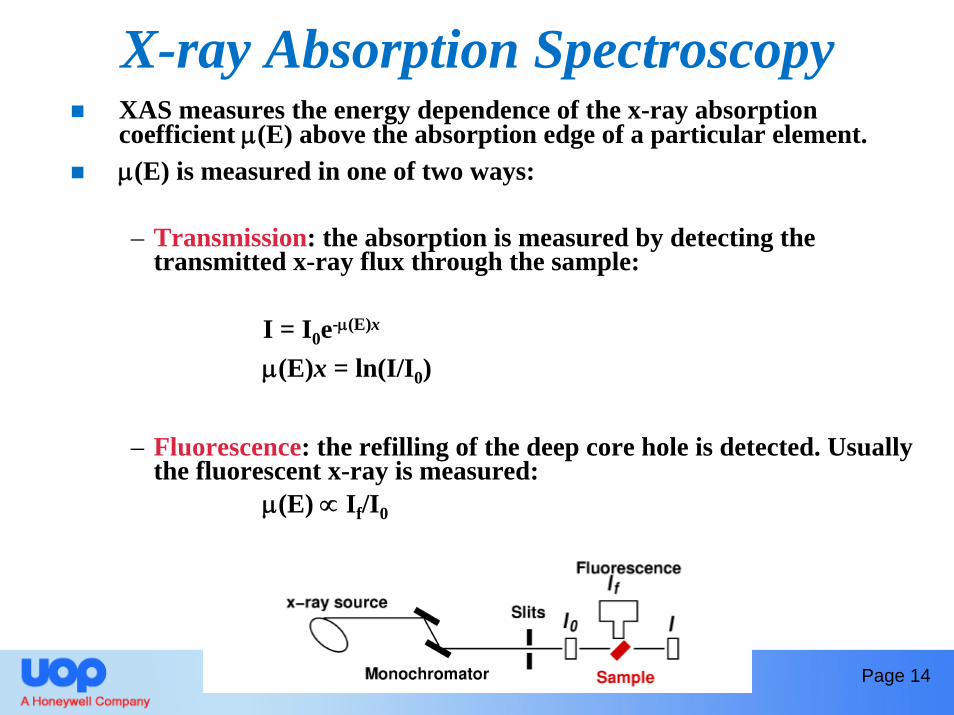
X-ray Absorption SpectroscopyXAS measures the energy dependence of the x-ray absorption coefficient μ(E) above the absorption edge of a particular element. μ(E) is measured in one of two ways:
– Transmission: the absorption is measured by detecting the transmitted x-ray flux through the sample:
I = I0e-μ(E)x
μ(E)x = ln(I/I0)
– Fluorescence: the refilling of the deep core hole is detected. Usually the fluorescent x-ray is measured:
μ(E) ∝ If/I0
Page 14
Page 15
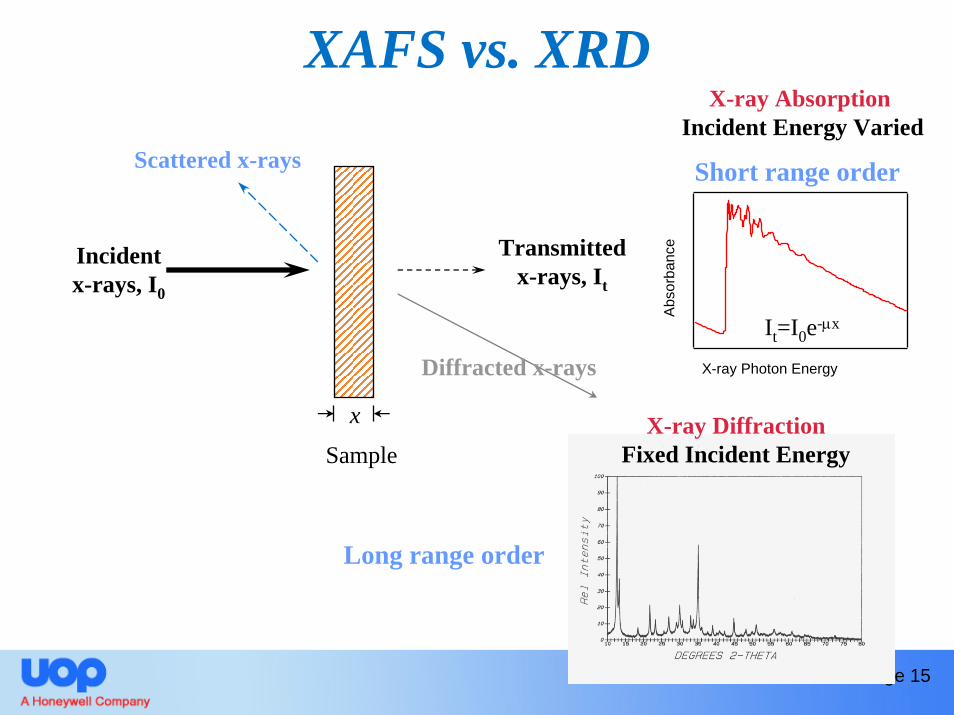
XAFS vs. XRD
Incidentx-rays, I0
Transmittedx-rays, It
Sample
Diffracted x-rays
X-ray DiffractionFixed Incident Energy
X-ray AbsorptionIncident Energy Varied
Abs
orba
nce
X-ray Photon Energy
It=I0e-μx
Scattered x-rays
x
Long range order
Short range order
XAFSCan be used for in situ structure determination: photon-in / photon-out. Elementally specific: information around each element in multi-element catalyst can be determined separately.X-ray absorption is a bulk technique - but if the element of interest if highly dispersed then majority of atoms are surface atoms.Local order only: due to inelastic mean free path XAFS only probes local order (5-6 Å).All elements (except hydrogen).Sensitivity: bulk compounds to sub ppm.All phases can be studied: solids - both crystalline and amorphous, liquids and gases.Spatial information - with specialized experiments.
Page 16
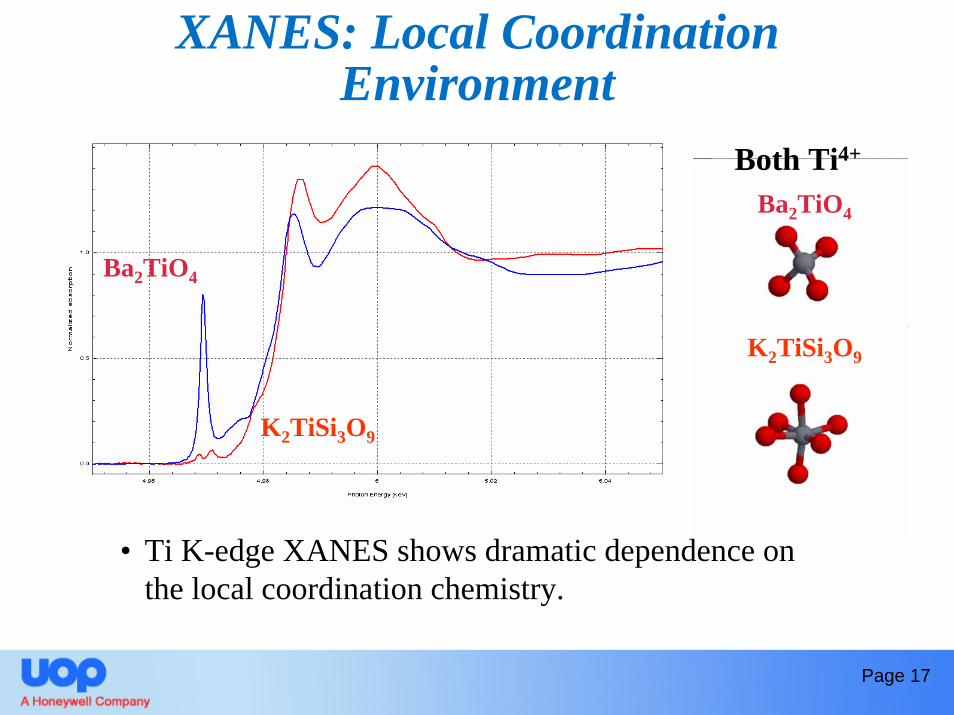
Ba2TiO4
K2TiSi3O9
Both Ti4+
XANES: Local Coordination Environment
Ba2TiO4
K2TiSi3O9
• Ti K-edge XANES shows dramatic dependence on the local coordination chemistry.
Page 17
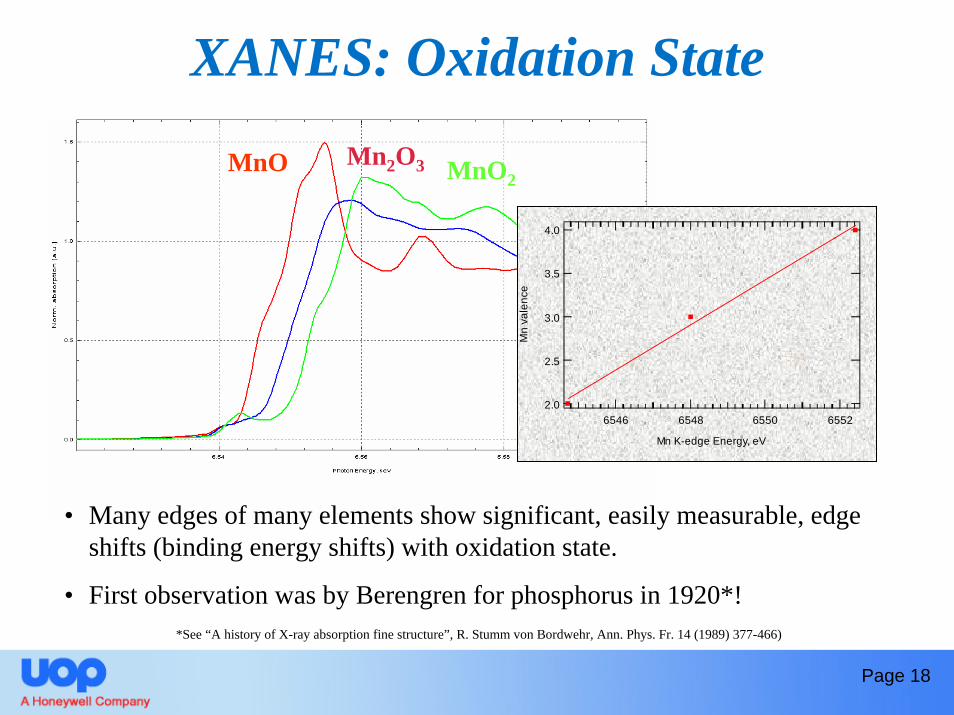
XANES: Oxidation State
MnO Mn2O3 MnO2
4.0
3.5
3.0
2.5
2.0
Mn
vale
nce
6552655065486546
Mn K-edge Energy, eV
• Many edges of many elements show significant, easily measurable, edge shifts (binding energy shifts) with oxidation state.
• First observation was by Berengren for phosphorus in 1920*!*See “A history of X-ray absorption fine structure”, R. Stumm von Bordwehr, Ann. Phys. Fr. 14 (1989) 377-466)
Page 18
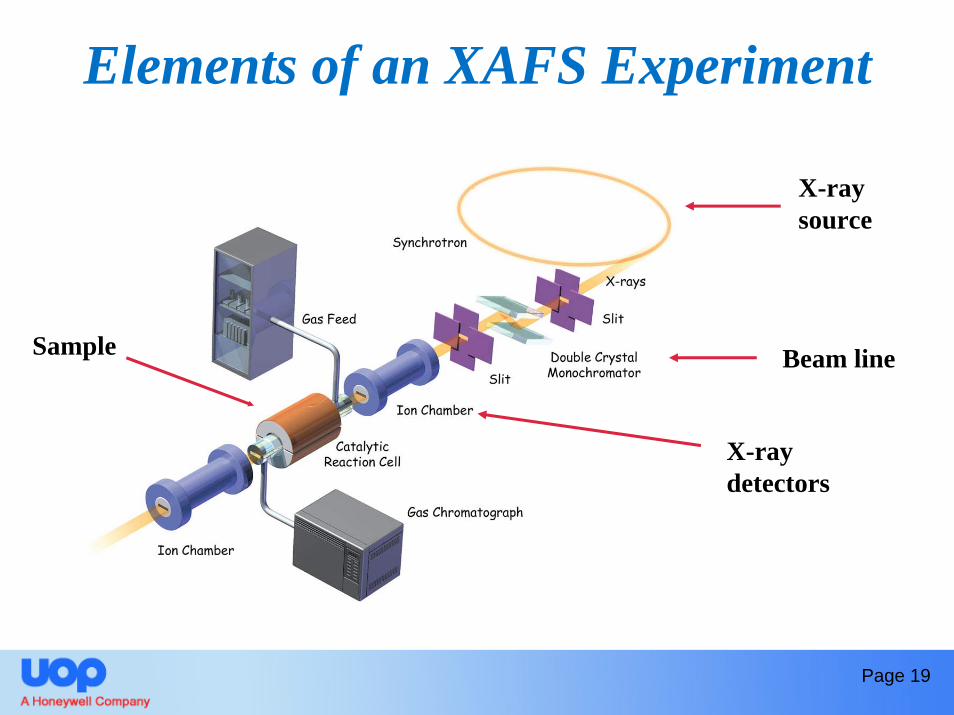
Elements of an XAFS Experiment
X-ray source
Beam line
X-ray detectors
Sample
Page 19
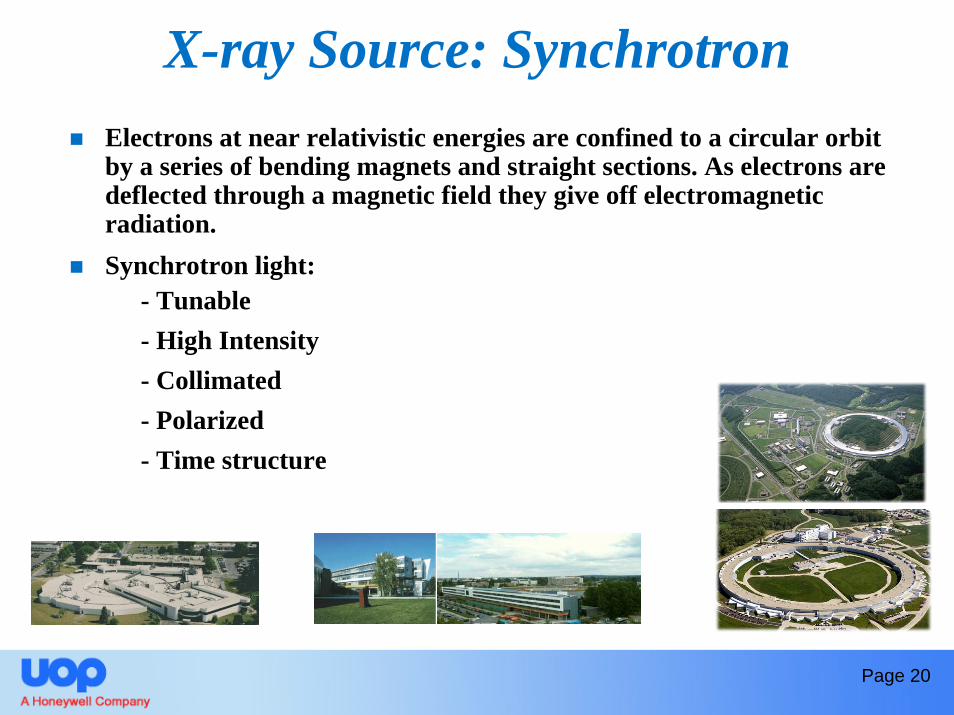
X-ray Source: SynchrotronElectrons at near relativistic energies are confined to a circular orbit by a series of bending magnets and straight sections. As electrons are deflected through a magnetic field they give off electromagneticradiation. Synchrotron light:
- Tunable- High Intensity - Collimated- Polarized- Time structure
Page 20
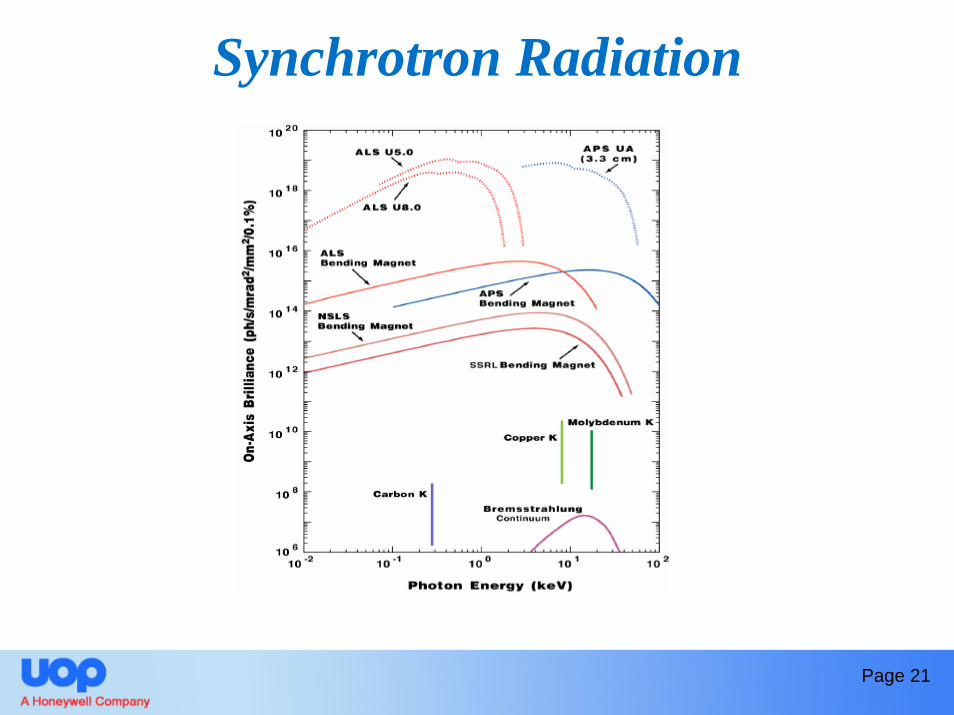
Synchrotron Radiation
Page 21
22
H He
Li Be
*
**
B C N O F Ne
Na Mg Al Si P S Cl Ar
K Ca Sc Ti V Cr Mn Fe Co Ni Cu Zn Ga Ge As Se Br Kr
Rb Sr Y Zr Nb Mo Tc Ru Rh Pd Ag Cd In Sn Sb Te I Xe
Cs Ba Lu Hf Ta W Re Os Ir Pt Au Hg Tl Pb Bi Po At Rn
Fr Ra Lr Rf Db Sg Bh Hs Mt Ds Rg
* La Ce Pr Nd Pm Sm Eu Gd Tb Dy Ho Er Tm Yb
**
Ac Th Pa U Np Pu Am Cm Bk Cf Es Fm Md No
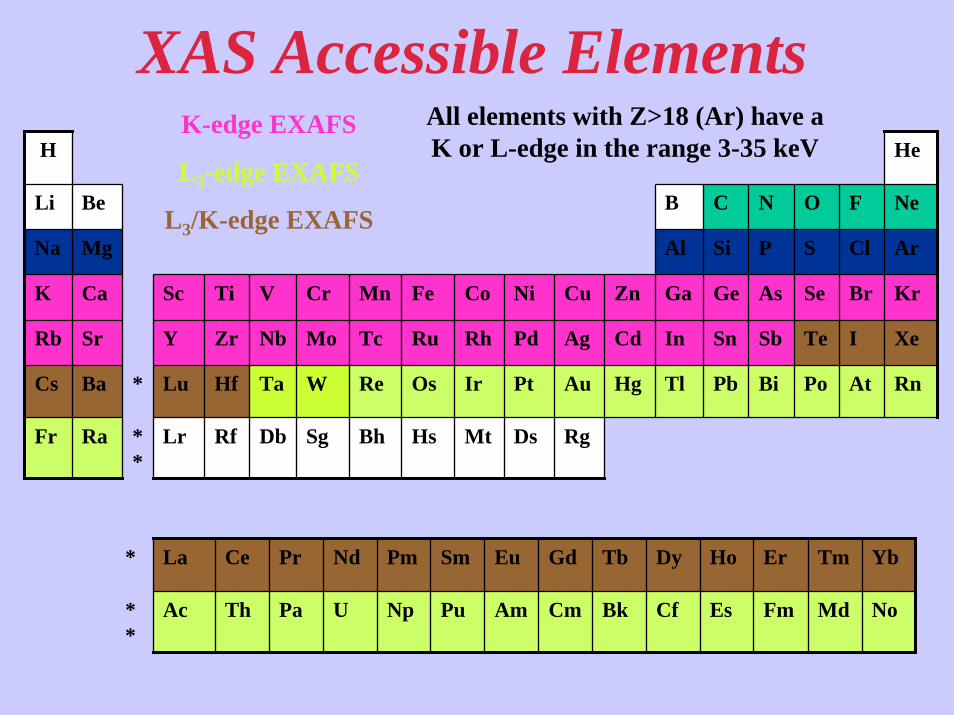
XAS Accessible ElementsK-edge EXAFS
L3-edge EXAFS
L3/K-edge EXAFS
All elements with Z>18 (Ar) have a K or L-edge in the range 3-35 keV
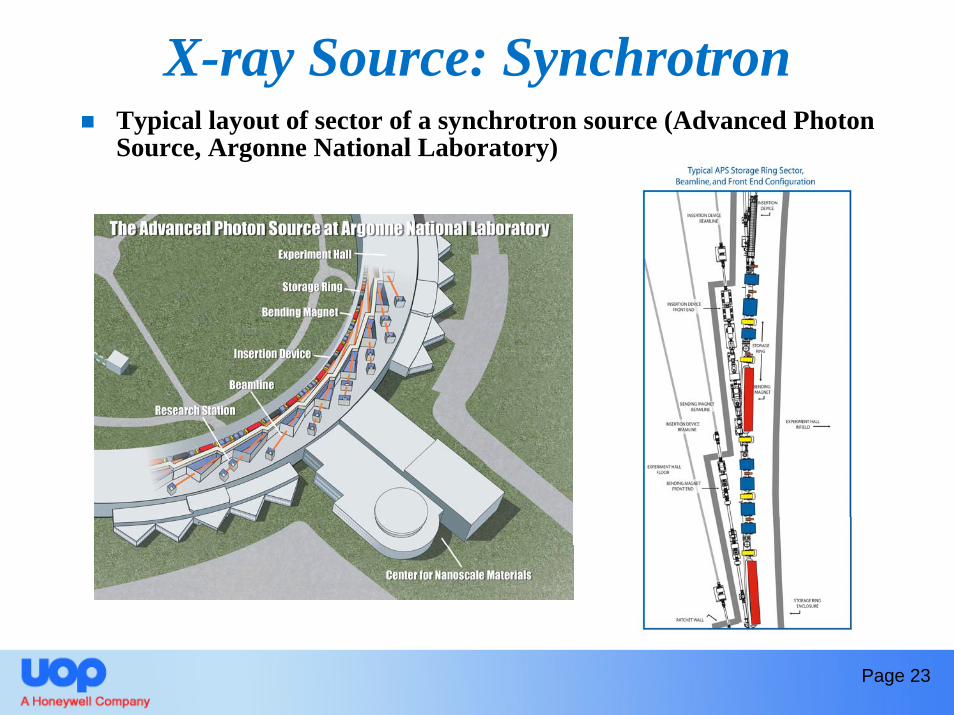
X-ray Source: SynchrotronTypical layout of sector of a synchrotron source (Advanced Photon Source, Argonne National Laboratory)
Page 23
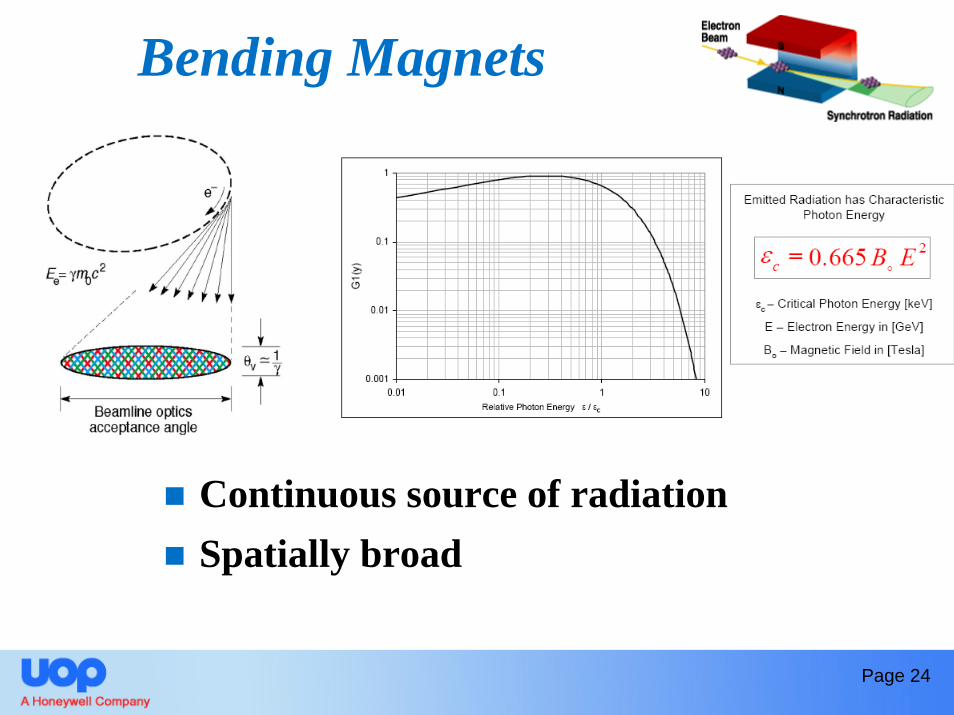
Bending Magnets
Continuous source of radiationSpatially broad
Page 24
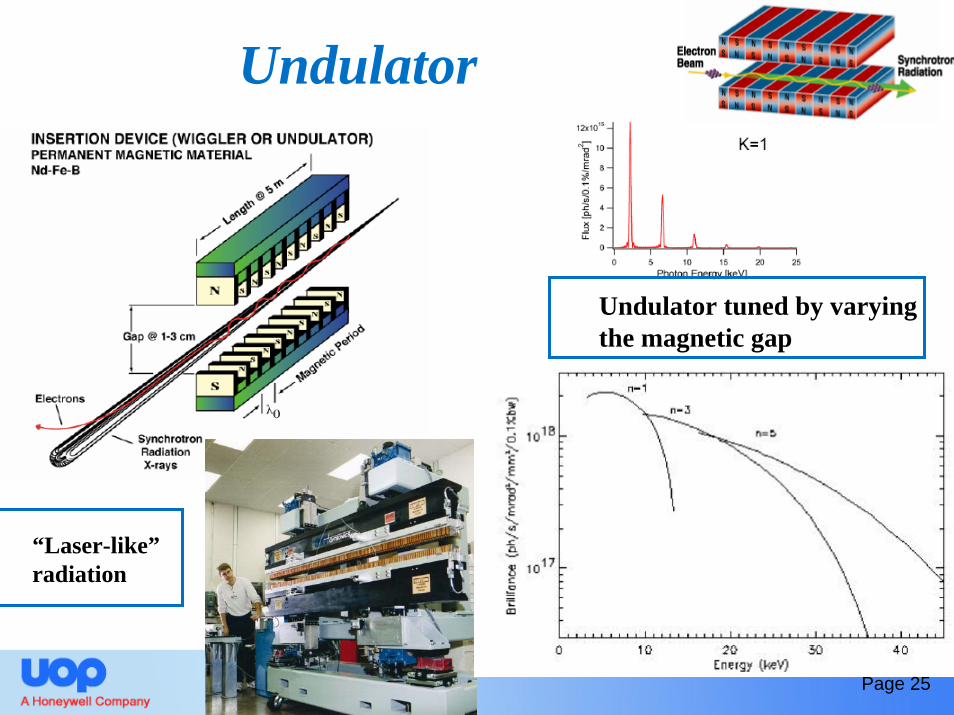
Undulator
Undulator tuned by varying the magnetic gap
Page 25
“Laser-like”radiation
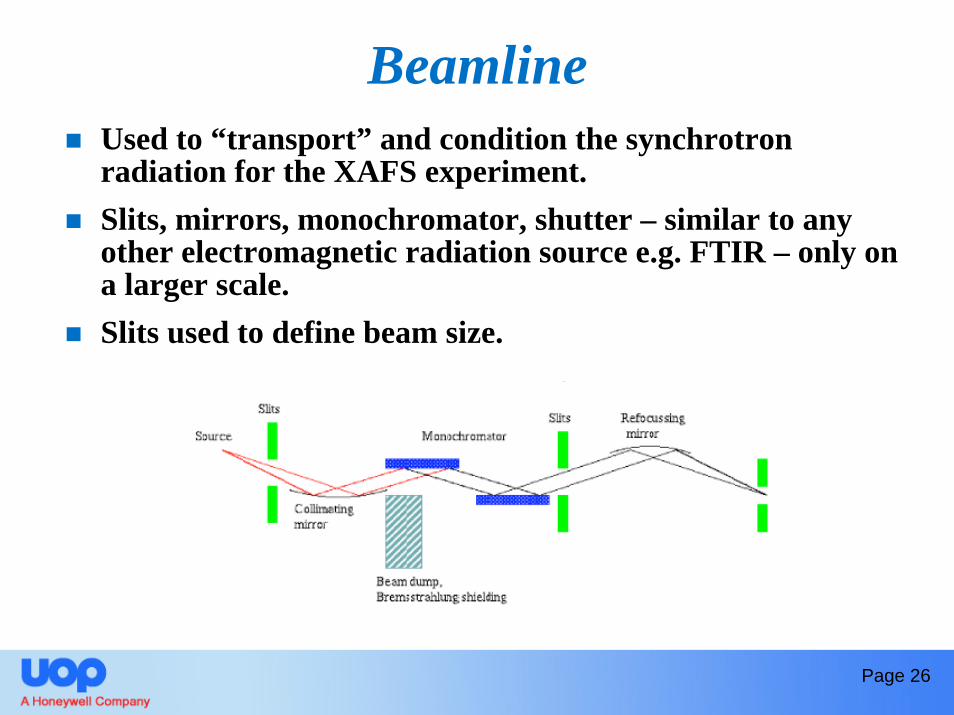
BeamlineUsed to “transport” and condition the synchrotron radiation for the XAFS experiment.Slits, mirrors, monochromator, shutter – similar to any other electromagnetic radiation source e.g. FTIR – only on a larger scale.Slits used to define beam size.
Page 26
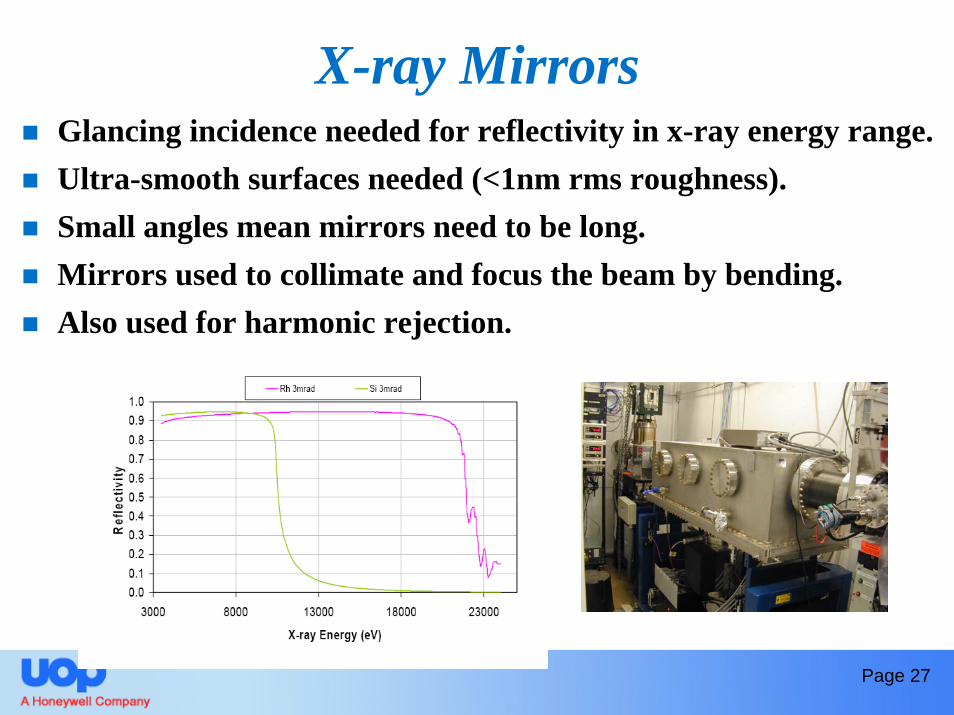
X-ray MirrorsGlancing incidence needed for reflectivity in x-ray energy range.Ultra-smooth surfaces needed (<1nm rms roughness).Small angles mean mirrors need to be long.Mirrors used to collimate and focus the beam by bending.Also used for harmonic rejection.
Page 27
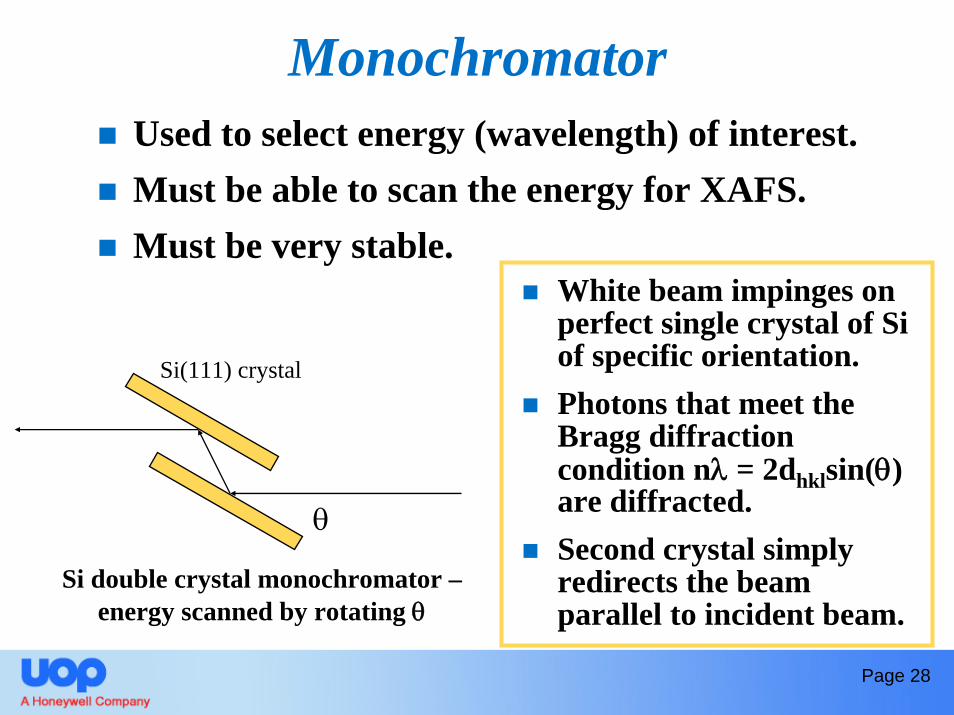
MonochromatorUsed to select energy (wavelength) of interest.Must be able to scan the energy for XAFS.Must be very stable.
θ
Si double crystal monochromator –energy scanned by rotating θ
White beam impinges on perfect single crystal of Si of specific orientation.Photons that meet the Bragg diffraction condition nλ = 2dhklsin(θ) are diffracted.Second crystal simply redirects the beam parallel to incident beam.
Page 28
Si(111) crystal
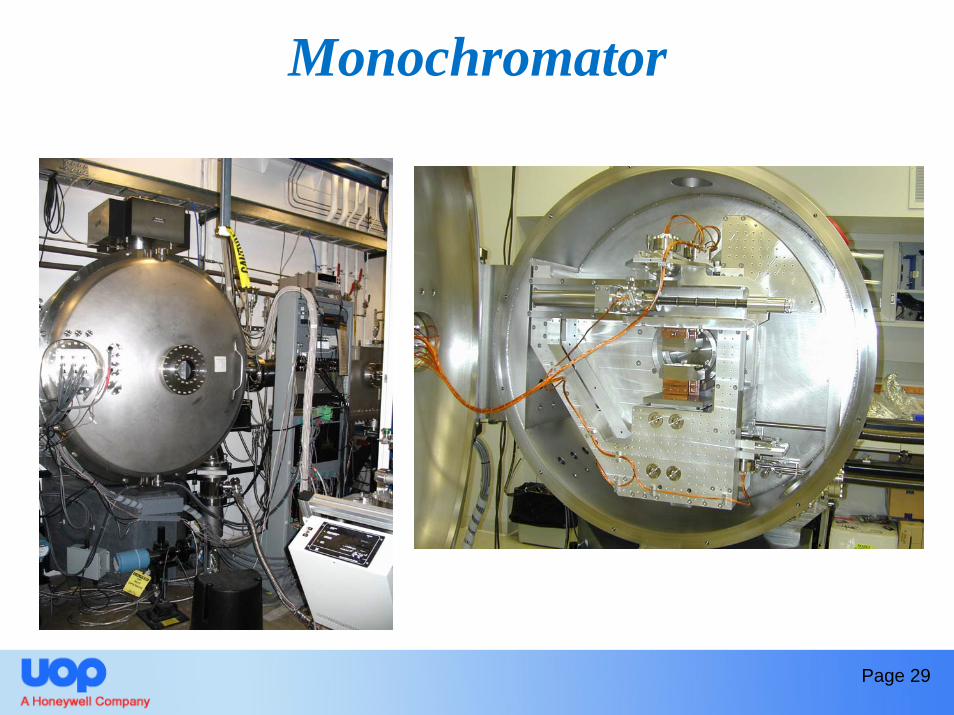
Monochromator
Page 29
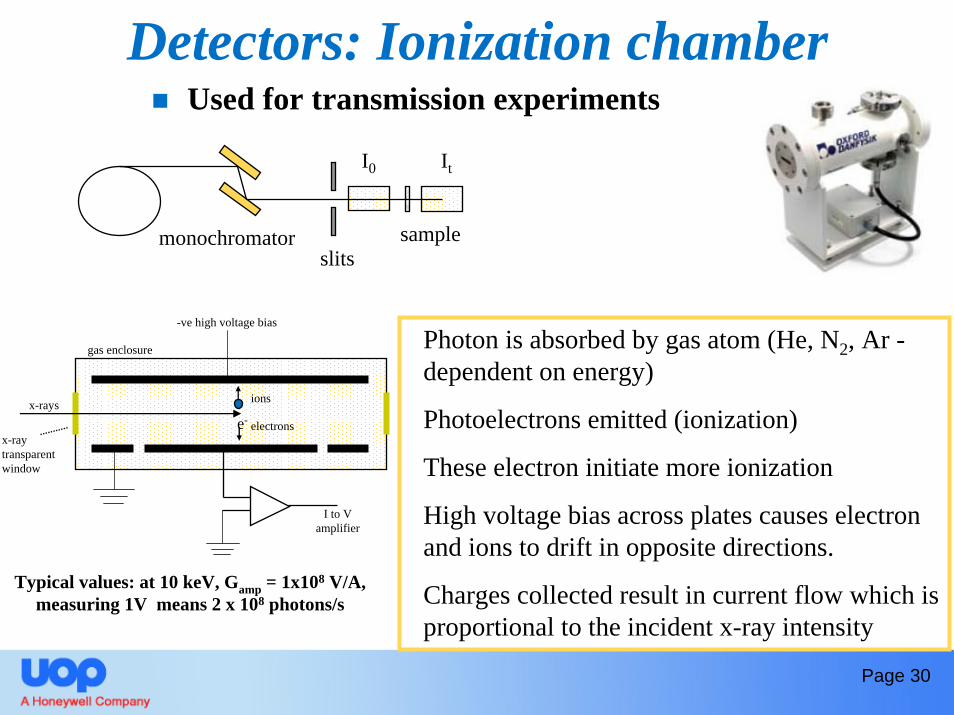
Detectors: Ionization chamberUsed for transmission experiments
Page 30
e-
ions
electrons
x-rays
x-ray transparent window
-ve high voltage bias
gas enclosure Photon is absorbed by gas atom (He, N2, Ar -dependent on energy)
Photoelectrons emitted (ionization)
These electron initiate more ionization
High voltage bias across plates causes electron and ions to drift in opposite directions.
Charges collected result in current flow which is proportional to the incident x-ray intensity
I0 It
samplemonochromatorslits
Typical values: at 10 keV, Gamp = 1x10⁸ V/A, measuring 1V means 2 x 10⁸ photons/s
I to V amplifier
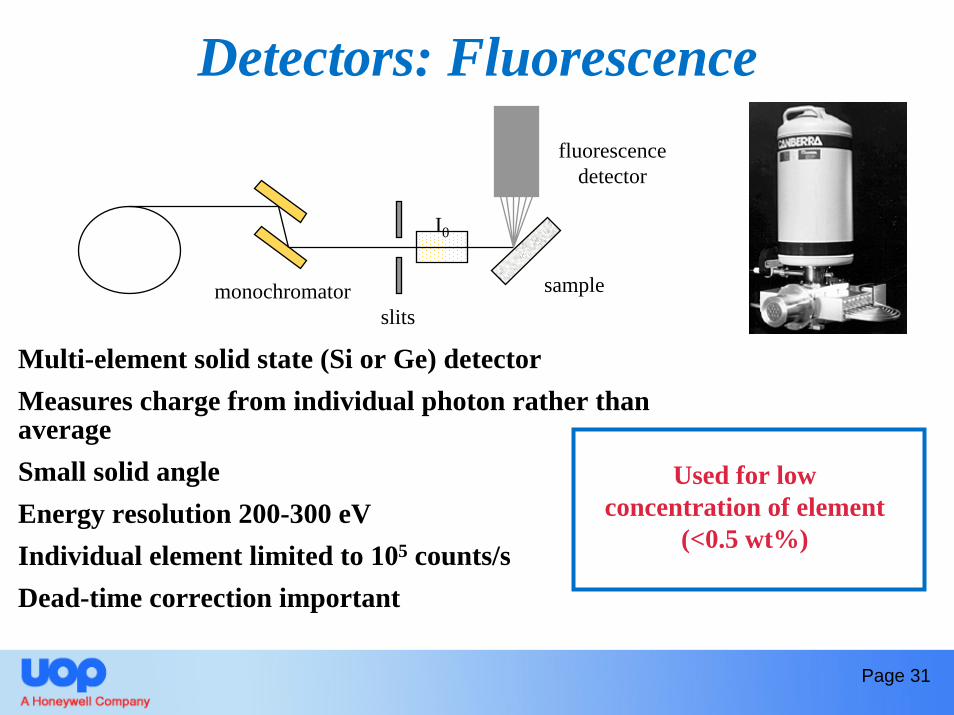
Detectors: Fluorescence
Multi-element solid state (Si or Ge) detectorMeasures charge from individual photon rather than averageSmall solid angleEnergy resolution 200-300 eVIndividual element limited to 105 counts/sDead-time correction important
Used for low concentration of element
(<0.5 wt%)
I0
samplemonochromatorslits
fluorescence detector
Page 31
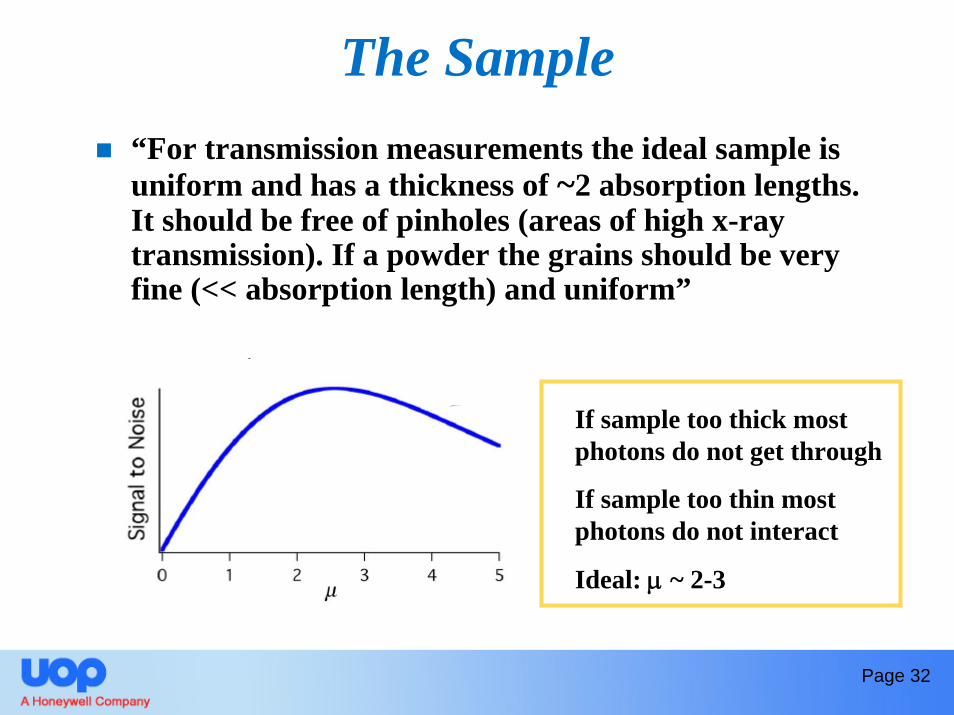
The Sample “For transmission measurements the ideal sample is uniform and has a thickness of ~2 absorption lengths. It should be free of pinholes (areas of high x-ray transmission). If a powder the grains should be very fine (<< absorption length) and uniform”
If sample too thick most photons do not get through
If sample too thin most photons do not interact
Ideal: μ ~ 2-3
Page 32
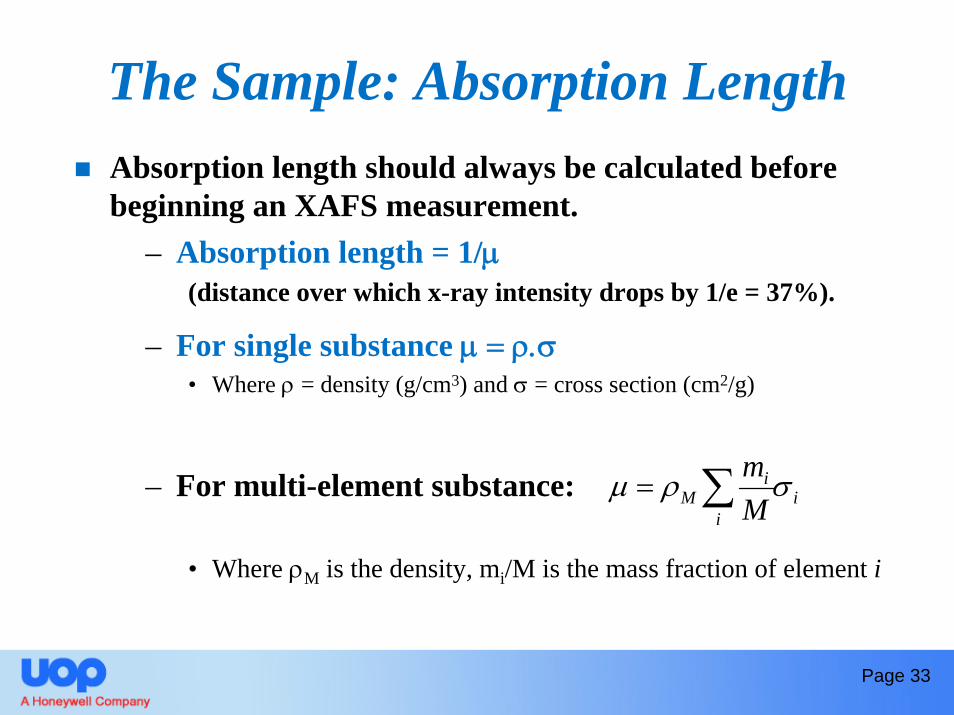
The Sample: Absorption LengthAbsorption length should always be calculated before beginning an XAFS measurement.
– Absorption length = 1/μ(distance over which x-ray intensity drops by 1/e = 37%).
– For single substance μ = ρ.σ• Where ρ = density (g/cm3) and σ = cross section (cm2/g)
– For multi-element substance:
• Where ρM is the density, mi/M is the mass fraction of element i
ii
iM M
m σρμ ∑=
Page 33
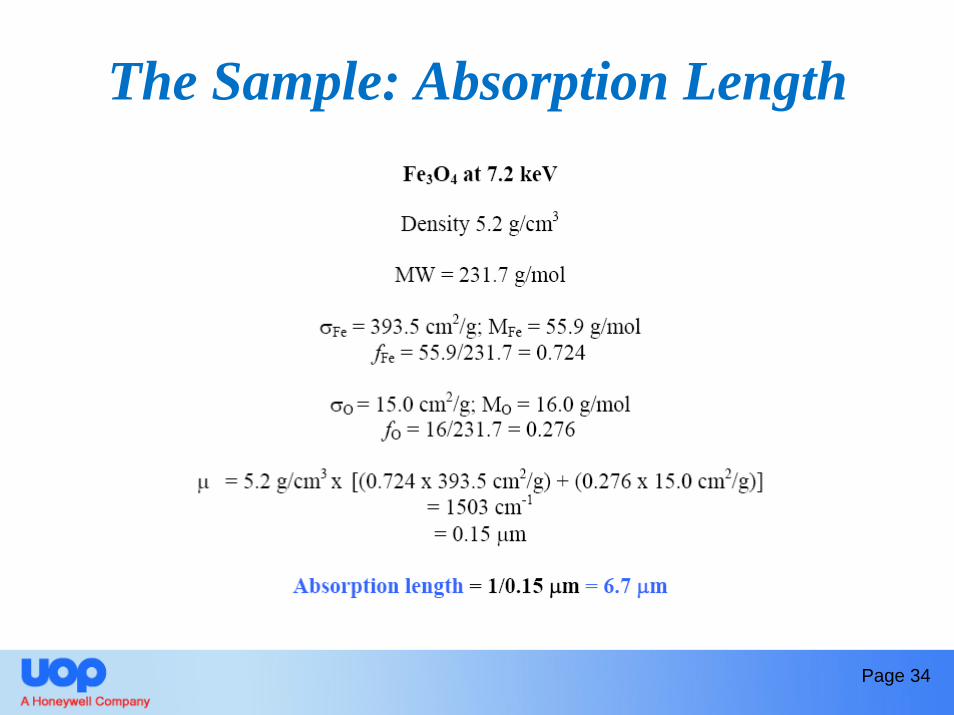
The Sample: Absorption Length
Page 34
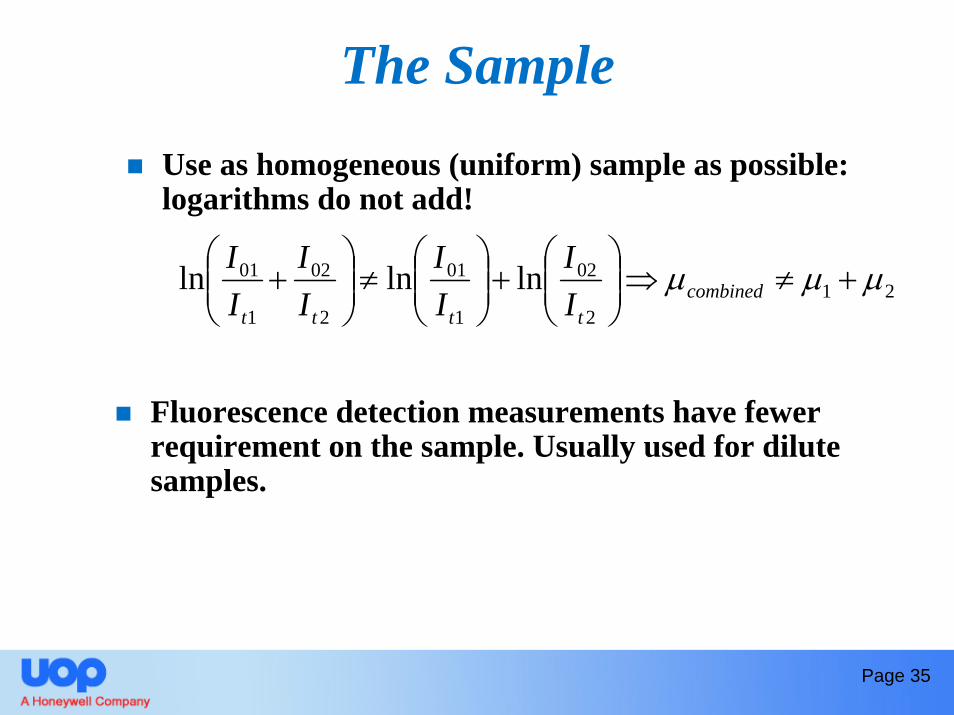
The SampleUse as homogeneous (uniform) sample as possible: logarithms do not add!
212
02
1
01
2
02
1
01 lnlnln μμμ +≠⇒⎟⎟⎠
⎞⎜⎜⎝
⎛+⎟⎟
⎠
⎞⎜⎜⎝
⎛≠⎟⎟
⎠
⎞⎜⎜⎝
⎛+ combined
tttt II
II
II
II
Page 35
Fluorescence detection measurements have fewer requirement on the sample. Usually used for dilute samples.
In situ XAFS MeasurementsKey strength of the technique.Ability to probe the local atomic and geometric structure of the catalyst under reaction conditions.Need some type of reaction vessel that holds the sample that is compatible both with the spectroscopy and with the catalysis.Many, many different designs in the literature.Many factors to consider: temperature, pressure, transmission, fluorescence, x-ray energy, form of catalyst, etc.
Page 36
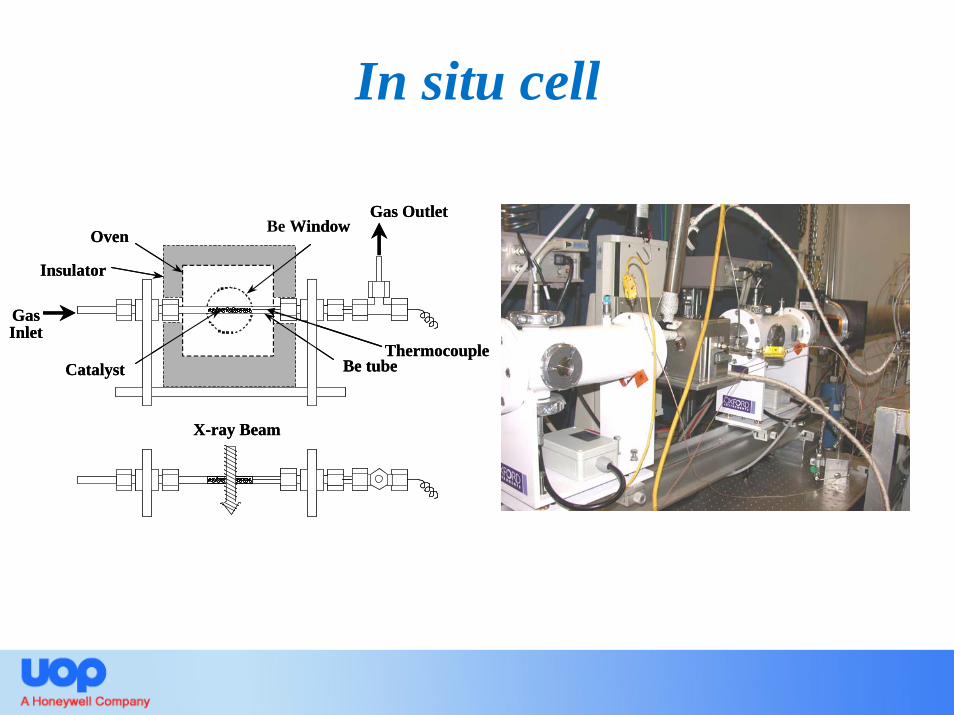
In situ cell
GasInlet
Catalyst
X-ray Beam
Thermocouple
Gas Outlet
Insulator
Oven
Be tube
Be Window
GasInlet
Catalyst
X-ray Beam
Thermocouple
Gas Outlet
Insulator
Oven
Be tube
Be Window
Important ConsiderationsMonochromatic x-rays: need x-rays with small energy spread ΔE ~1 eV at 10 keVLinear Detectors: the XAFS signal is small, so lots of photons needed and detectors that are linear in x-ray intensityWell-aligned Beam: the x-ray beam hitting the detectors should be the same as that hitting the detectorsHomogeneous Sample: uniform and of appropriate thickness, free of pinholesCounting Statistics: good μ(E) data should have a noise level of ~10-3, so need to collect at least 106 photons
Page 38
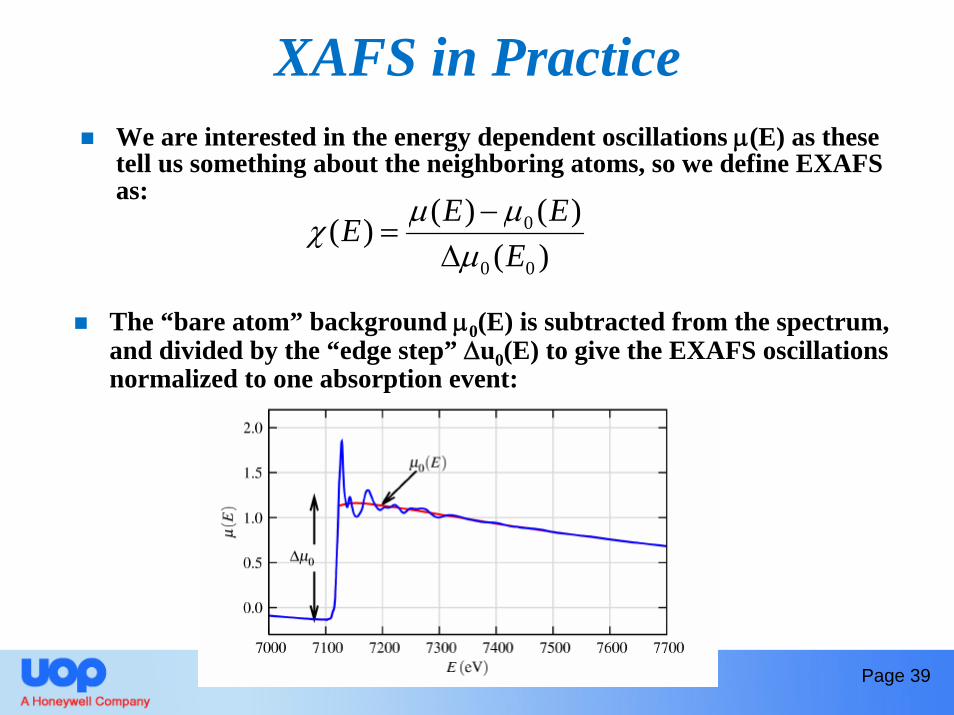
XAFS in PracticeWe are interested in the energy dependent oscillations μ(E) as these tell us something about the neighboring atoms, so we define EXAFS as:
Page 39
)()()()(
00
0
EEEE
μμμχ
Δ−
=
The “bare atom” background μ0(E) is subtracted from the spectrum, and divided by the “edge step” Δu0(E) to give the EXAFS oscillations normalized to one absorption event:
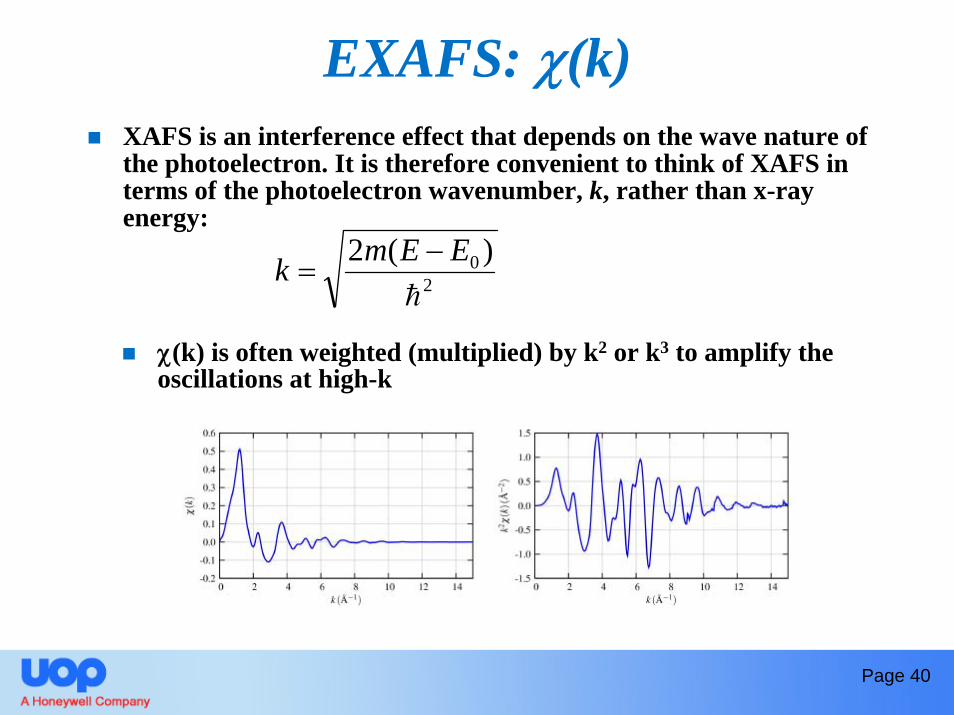
EXAFS: χ(k)XAFS is an interference effect that depends on the wave nature of the photoelectron. It is therefore convenient to think of XAFS in terms of the photoelectron wavenumber, k, rather than x-ray energy:
20 )(2 EEmk −
=
χ(k) is often weighted (multiplied) by k2 or k3 to amplify the oscillations at high-k
Page 40
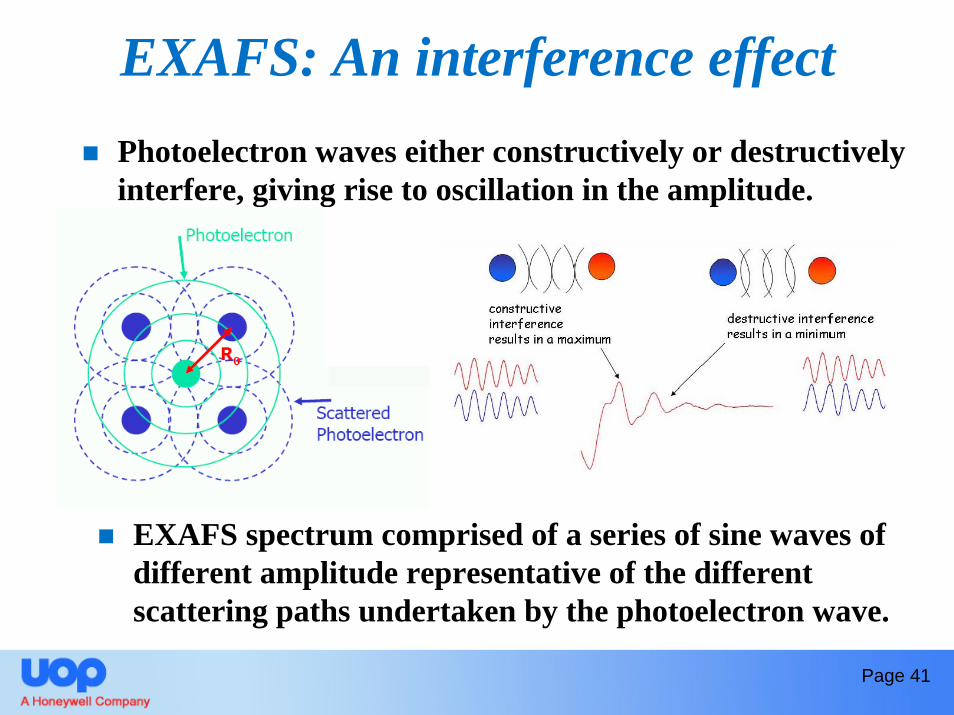
EXAFS: An interference effectPhotoelectron waves either constructively or destructively interfere, giving rise to oscillation in the amplitude.
EXAFS spectrum comprised of a series of sine waves of different amplitude representative of the different scattering paths undertaken by the photoelectron wave.
Page 41
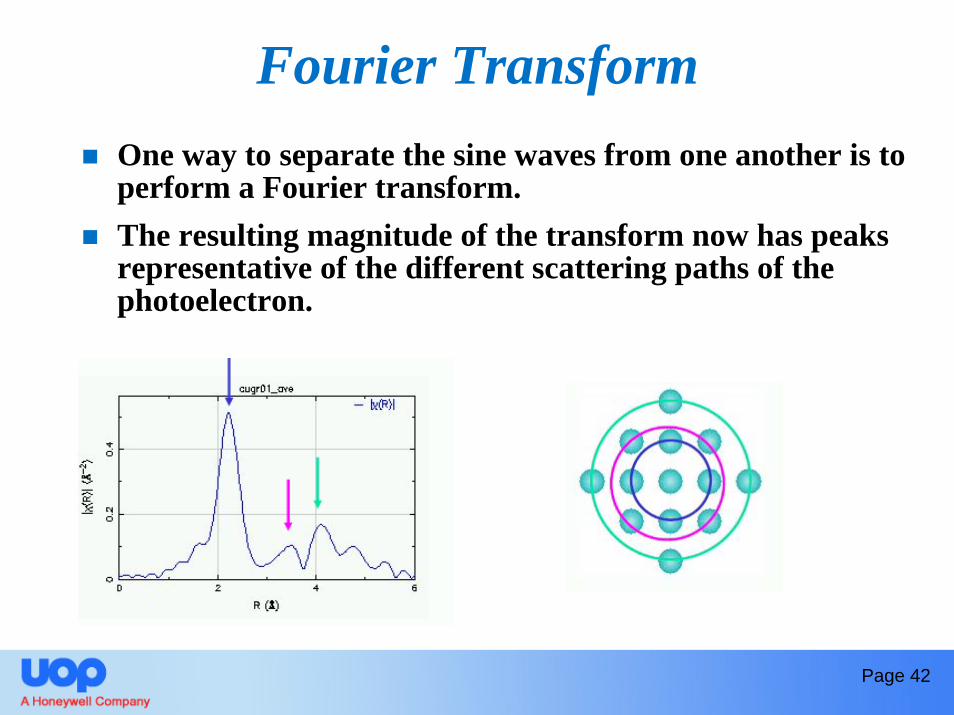
Fourier TransformOne way to separate the sine waves from one another is to perform a Fourier transform.The resulting magnitude of the transform now has peaks representative of the different scattering paths of the photoelectron.
Page 42
Page 43
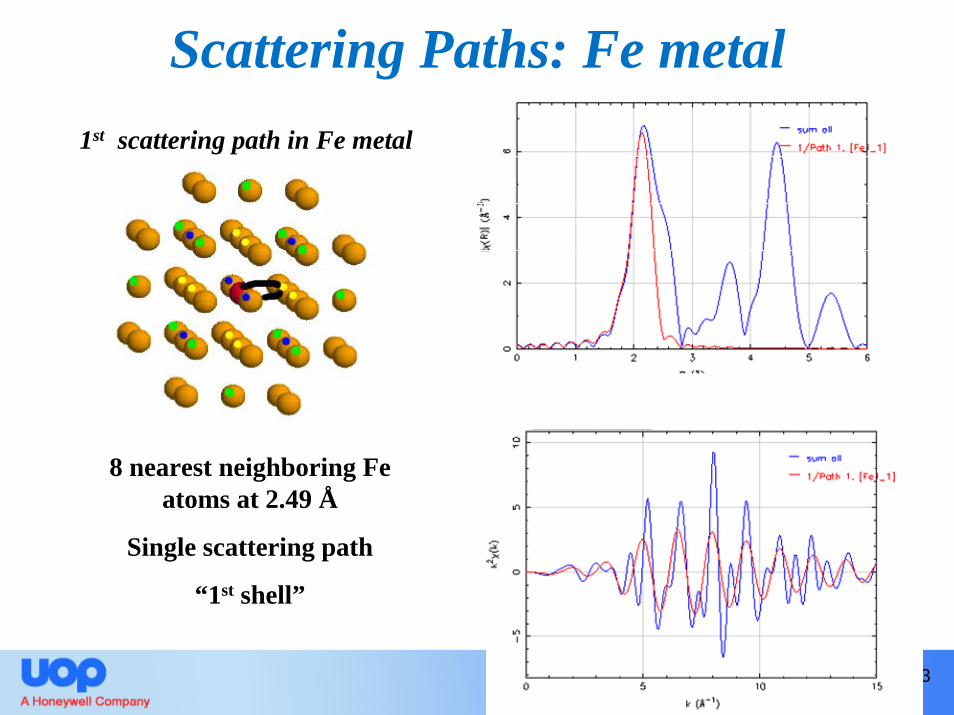
1st scattering path in Fe metal
8 nearest neighboring Fe atoms at 2.49 Å
Single scattering path
“1st shell”
Scattering Paths: Fe metal
Page 44
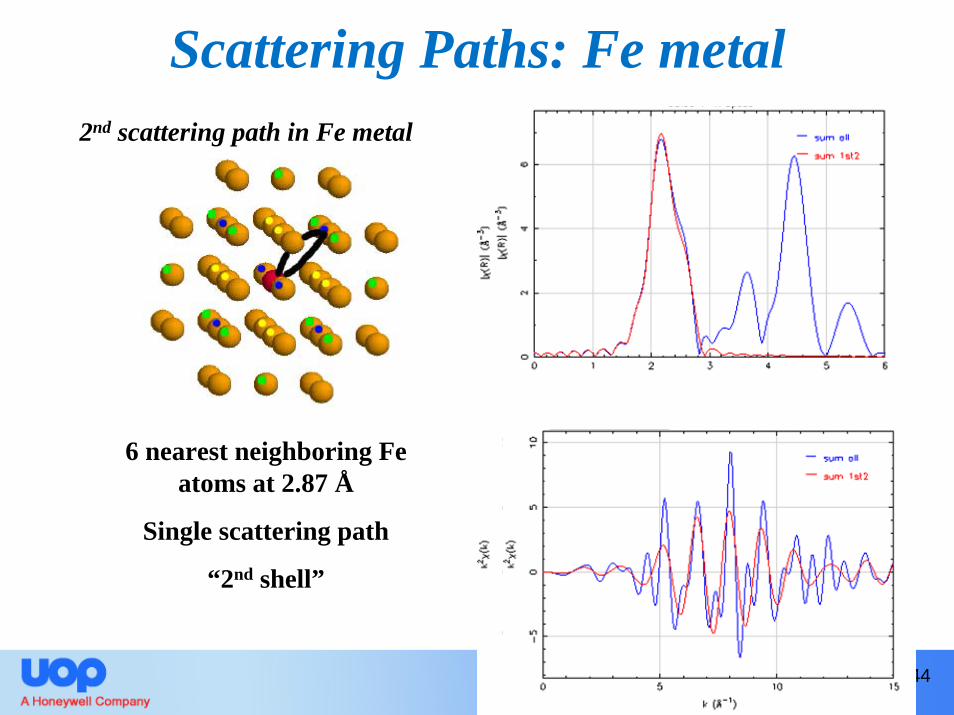
2nd scattering path in Fe metal
Scattering Paths: Fe metal
6 nearest neighboring Fe atoms at 2.87 Å
Single scattering path
“2nd shell”
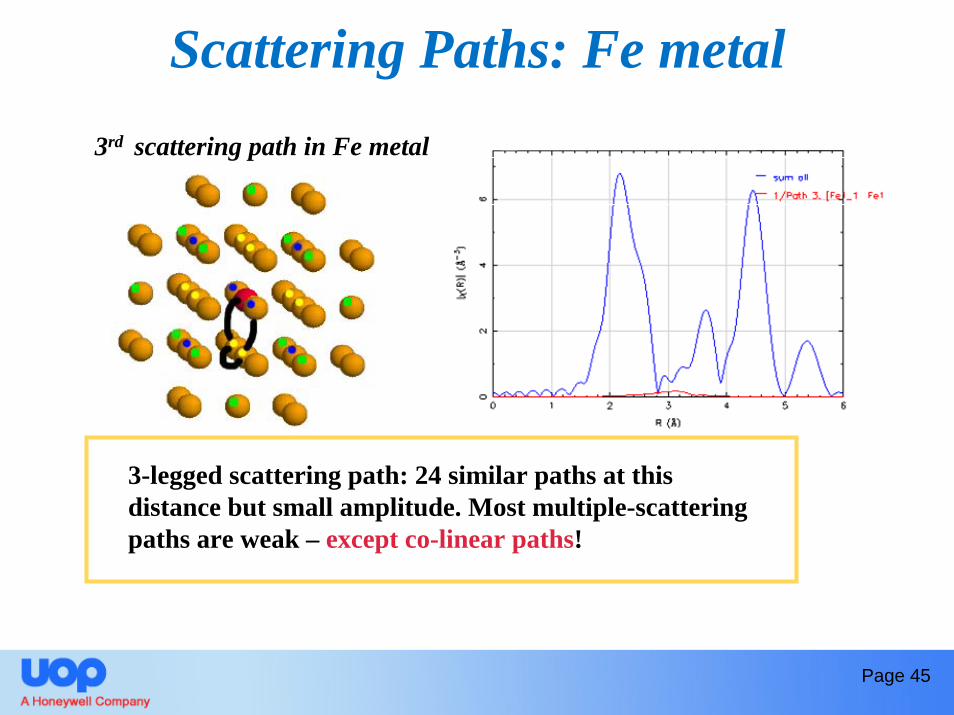
Scattering Paths: Fe metal3rd scattering path in Fe metal
3-legged scattering path: 24 similar paths at this distance but small amplitude. Most multiple-scattering paths are weak – except co-linear paths!
Page 45
Page 46
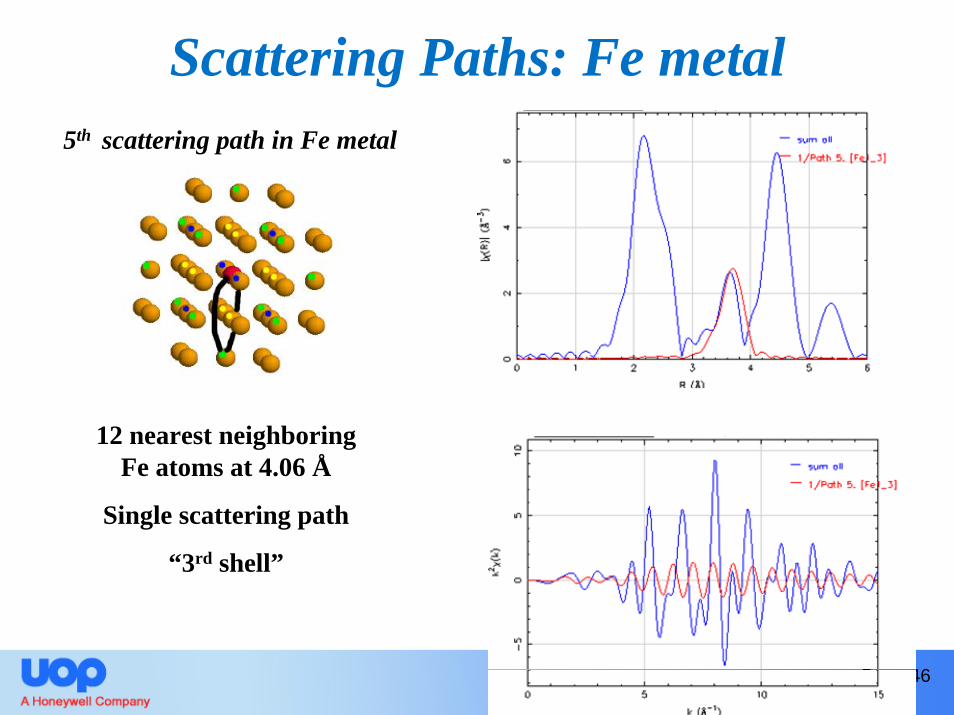
5th scattering path in Fe metal
12 nearest neighboring Fe atoms at 4.06 Å
Single scattering path
“3rd shell”
Scattering Paths: Fe metal
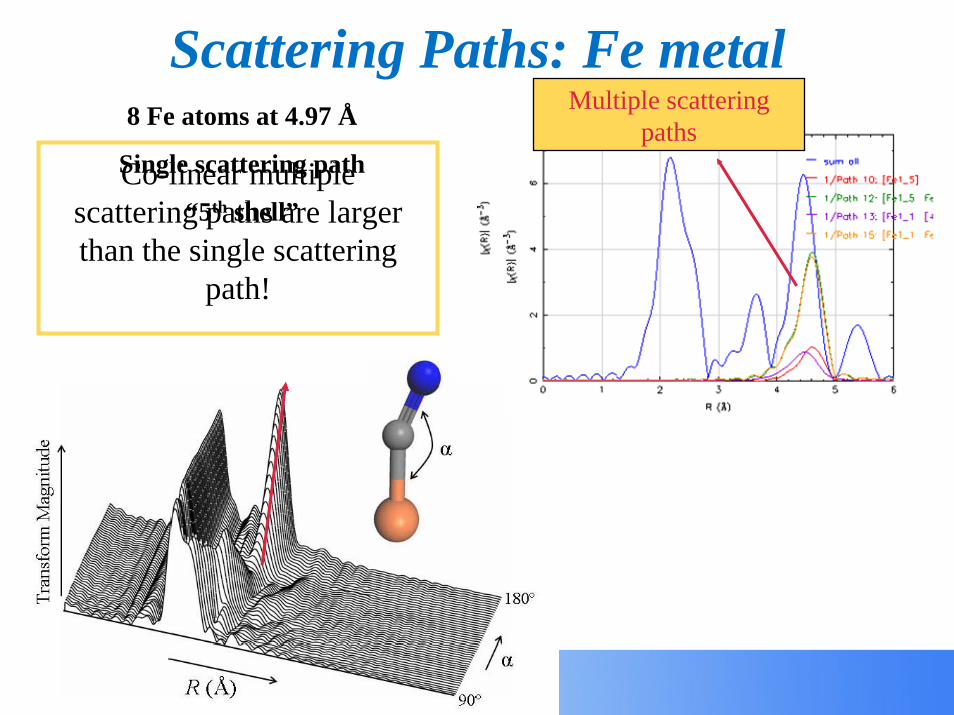
Scattering Paths: Fe metal8 Fe atoms at 4.97 Å
Single scattering path
“5th shell”Co-linear multiple
scattering paths are larger than the single scattering
path!
Multiple scattering paths
In reality…..
In previous example we knew the structure and were able to determine the individual scattering paths.
In a “real” situation we have the EXAFS data and wish to determine the scattering paths in order to determine the local structure around the element of interest in the catalyst.
Therefore we have to fit the experimental spectrum with scattering paths from a model.
Page 48
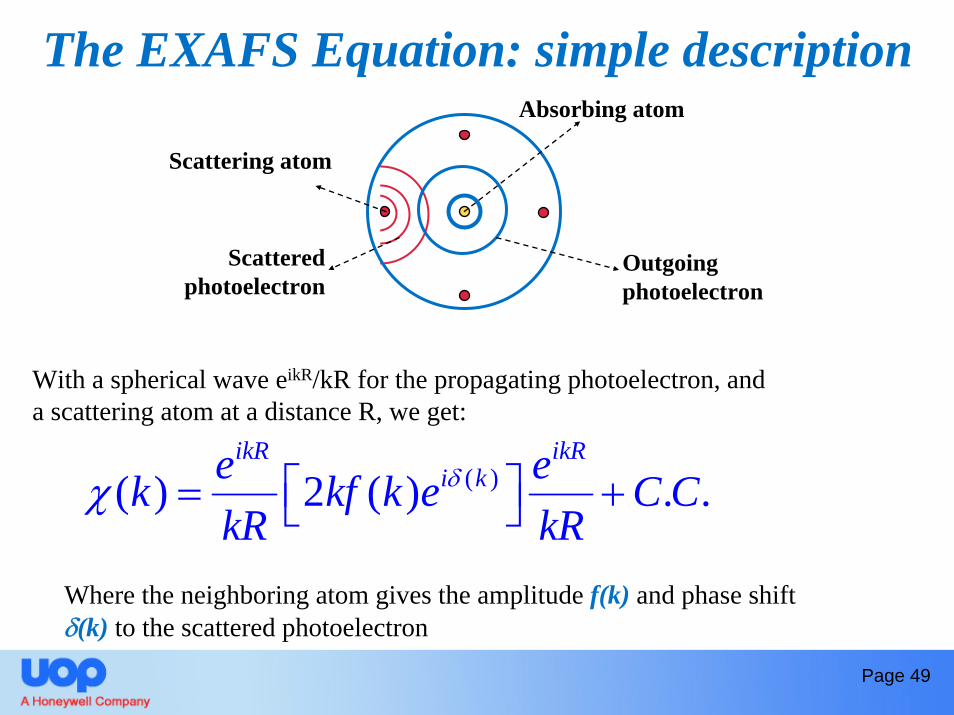
The EXAFS Equation: simple descriptionAbsorbing atom
Outgoing photoelectron
Scattering atom
Scattered photoelectron
With a spherical wave eikR/kR for the propagating photoelectron, and a scattering atom at a distance R, we get:
( )( ) 2 ( ) . .ikR ikR
i ke ek kf k e C CkR kR
δχ ⎡ ⎤= +⎣ ⎦
Where the neighboring atom gives the amplitude f(k) and phase shift δ(k) to the scattered photoelectron
Page 49
The EXAFS Equation: simple description
[ ]2
( )( ) sin 2 ( )f kk kR kkR
χ δ= +
[ ]2 22
2
( )( ) sin 2 ( )kNf k ek kR k
kR
σ
χ δ−
= +
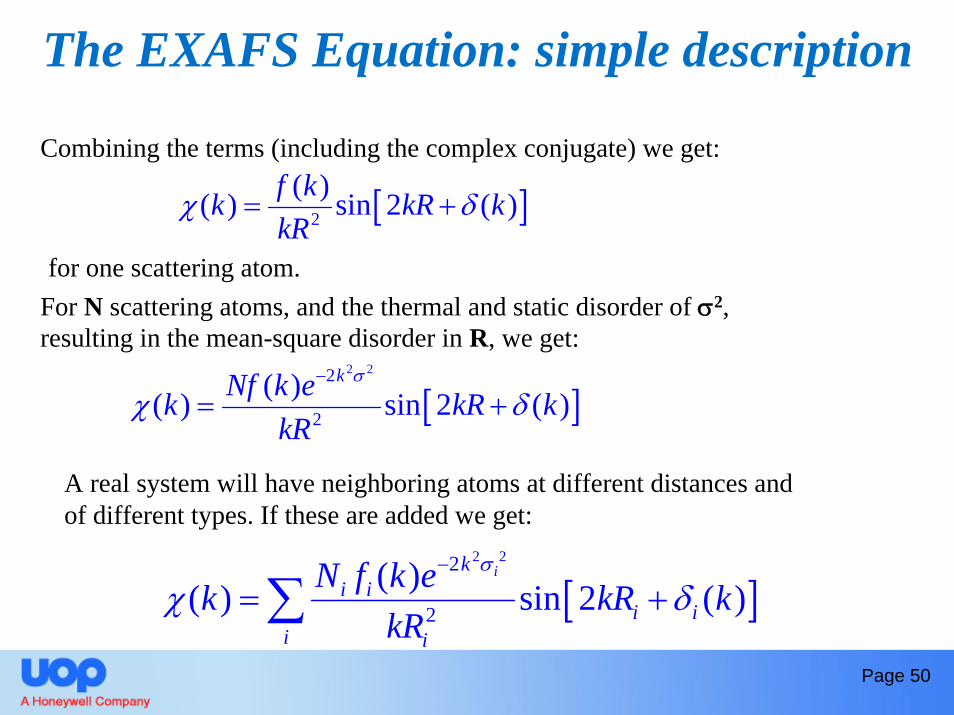
Combining the terms (including the complex conjugate) we get:
for one scattering atom.For N scattering atoms, and the thermal and static disorder of σ2, resulting in the mean-square disorder in R, we get:
A real system will have neighboring atoms at different distances and of different types. If these are added we get:
[ ]2 22
2
( )( ) sin 2 ( )ik
i ii i
i i
N f k ek kR kkR
σ
χ δ−
= +∑Page 50
The EXAFS Equation2 2( 2 ) ( 2 / ( ))2
0 2
( )( ) sin(2 2 )i ii k R k
i i i ii i
f kk S N e e kR
kRσ λχ δ ϕ− −= + +∑
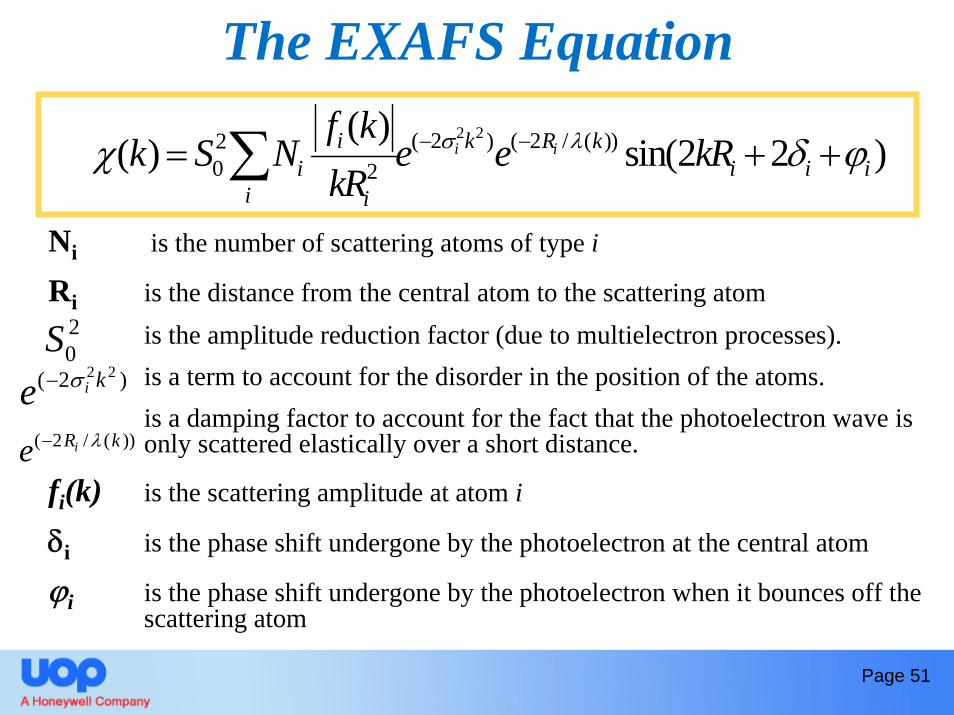
Ni is the number of scattering atoms of type i
Ri is the distance from the central atom to the scattering atomis the amplitude reduction factor (due to multielectron processes). is a term to account for the disorder in the position of the atoms. is a damping factor to account for the fact that the photoelectron wave is only scattered elastically over a short distance.
fi(k) is the scattering amplitude at atom i
δi is the phase shift undergone by the photoelectron at the central atom
ϕi is the phase shift undergone by the photoelectron when it bounces off the scattering atom
2 2( 2 )i ke σ−
( 2 / ( ))iR ke λ−
20S
Page 51
The EXAFS Equation
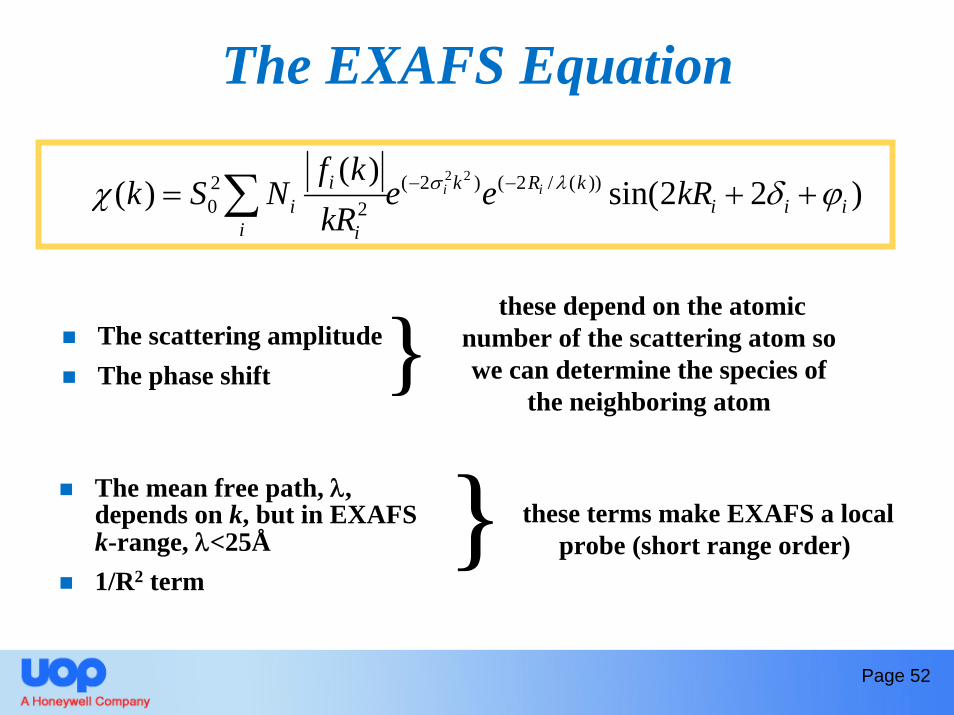
The scattering amplitudeThe phase shift
these depend on the atomic number of the scattering atom so we can determine the species of
the neighboring atom}
2 2( 2 ) ( 2 / ( ))20 2
( )( ) sin(2 2 )i ii k R k
i i i ii i
f kk S N e e kR
kRσ λχ δ ϕ− −= + +∑
The mean free path, λ, depends on k, but in EXAFS k-range, λ<25Å1/R2 term
} these terms make EXAFS a local probe (short range order)
Page 52
The EXAFS Equation)()( kk
ii∑= χχ
( )22 2
20 2( ) Im exp( (2 )
( )exp( 2 )e( )
( )xpi
ii
ii
iii
Rk i kR kF
Rk
k
S
k
kNϕ
λσχ
⎛ ⎞⎛ ⎞−⎜ ⎟= + − ⎜ ⎟⎜ ⎟⎝ ⎠⎝ ⎠0iR RR= + Δ
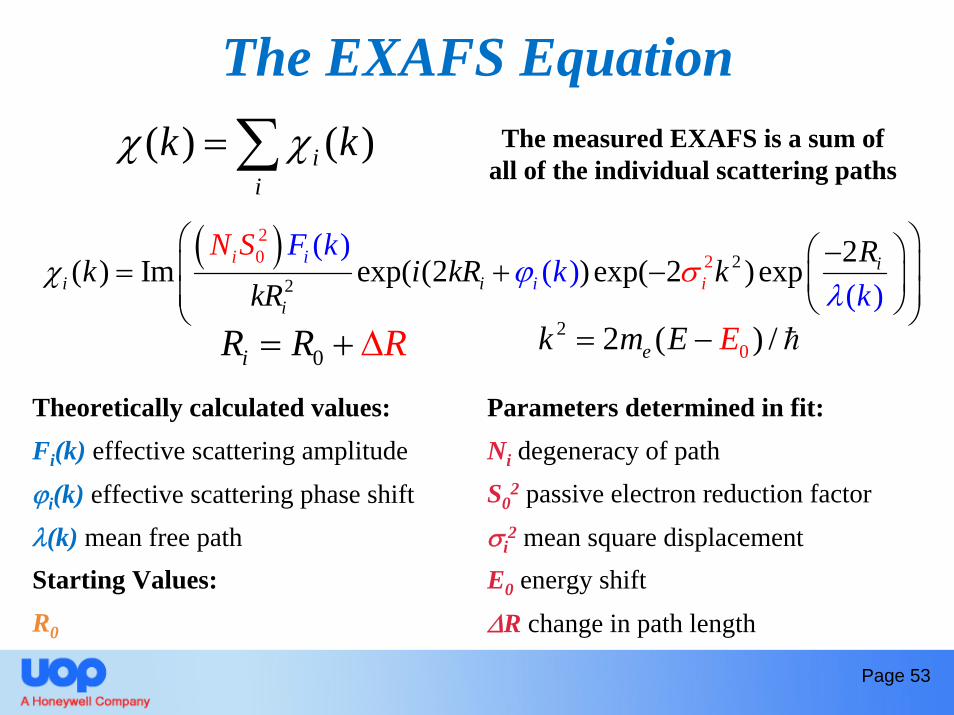
Page 53
The measured EXAFS is a sum of all of the individual scattering paths
02 2 ( ) /ek m E E= −
Theoretically calculated values:Fi(k) effective scattering amplitudeϕi(k) effective scattering phase shiftλ(k) mean free pathStarting Values:R0
Parameters determined in fit:Ni degeneracy of pathS0
2 passive electron reduction factor
σi2 mean square displacement
E0 energy shift
ΔR change in path length
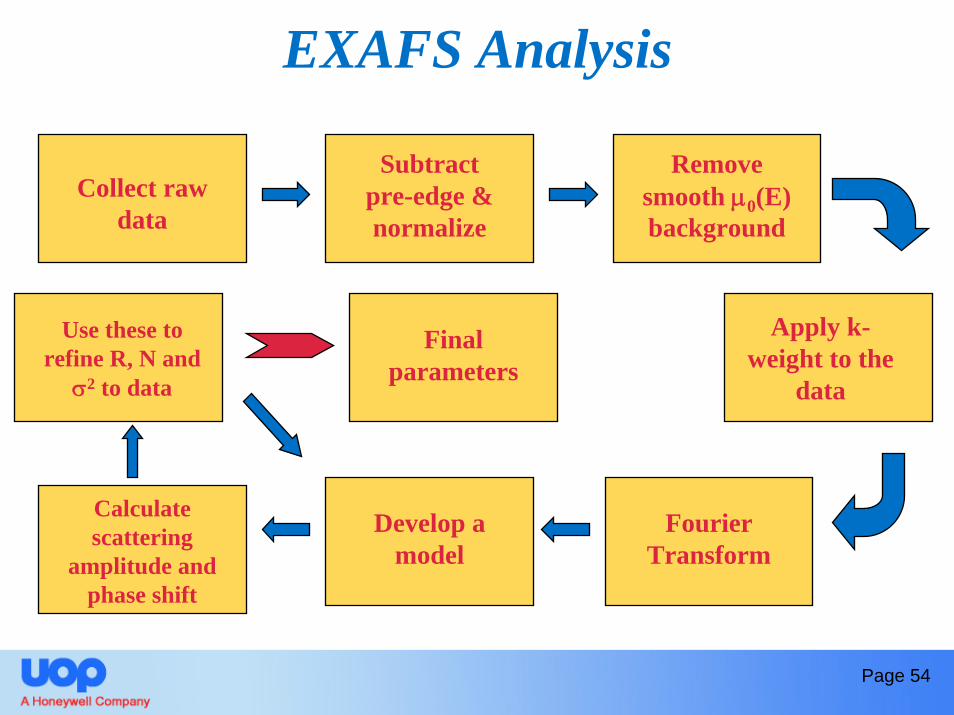
EXAFS Analysis
Collect raw data
Subtract pre-edge & normalize
Remove smooth μ0(E) background
Apply k-weight to the
data
Fourier Transform
Develop a model
Calculate scattering
amplitude and phase shift
Use these to refine R, N and
σ2 to data
Final parameters
Page 54
Examples of Application of XAFS to Catalyst Characterization
XANES
Page 55
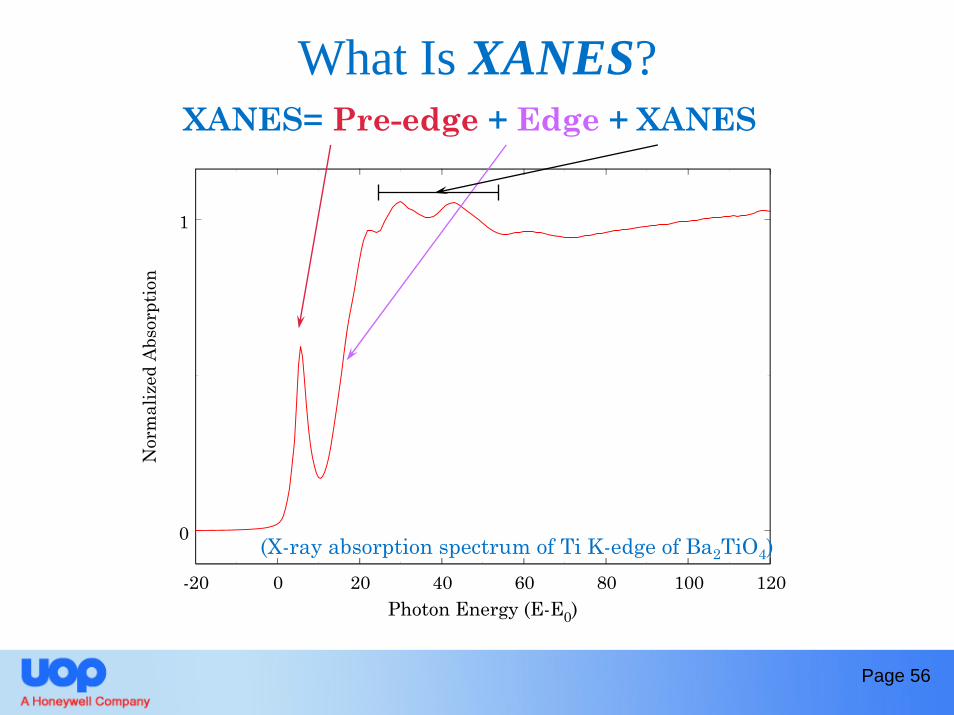
What Is XANES?
-20 0 20 40 60 80 100 120Photon Energy (E-E0)
0
1
Nor
mal
ized
Abs
orpt
ion
(X-ray absorption spectrum of Ti K-edge of Ba2TiO4)
XANES= Pre-edge + Edge + XANES
Page 56
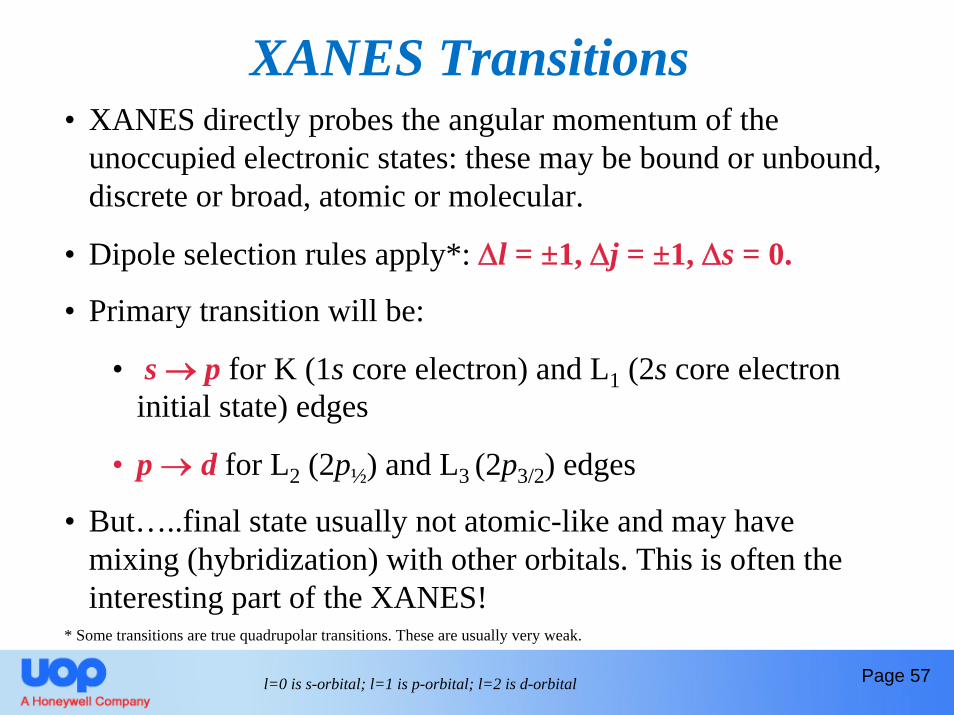
XANES Transitions• XANES directly probes the angular momentum of the
unoccupied electronic states: these may be bound or unbound, discrete or broad, atomic or molecular.
• Dipole selection rules apply*: Δl = ±1, Δj = ±1, Δs = 0.
• Primary transition will be:
• s → p for K (1s core electron) and L1 (2s core electron initial state) edges
• p → d for L2 (2p½) and L3 (2p3/2) edges
• But…..final state usually not atomic-like and may have mixing (hybridization) with other orbitals. This is often the interesting part of the XANES!
* Some transitions are true quadrupolar transitions. These are usually very weak.
Page 57l=0 is s-orbital; l=1 is p-orbital; l=2 is d-orbital
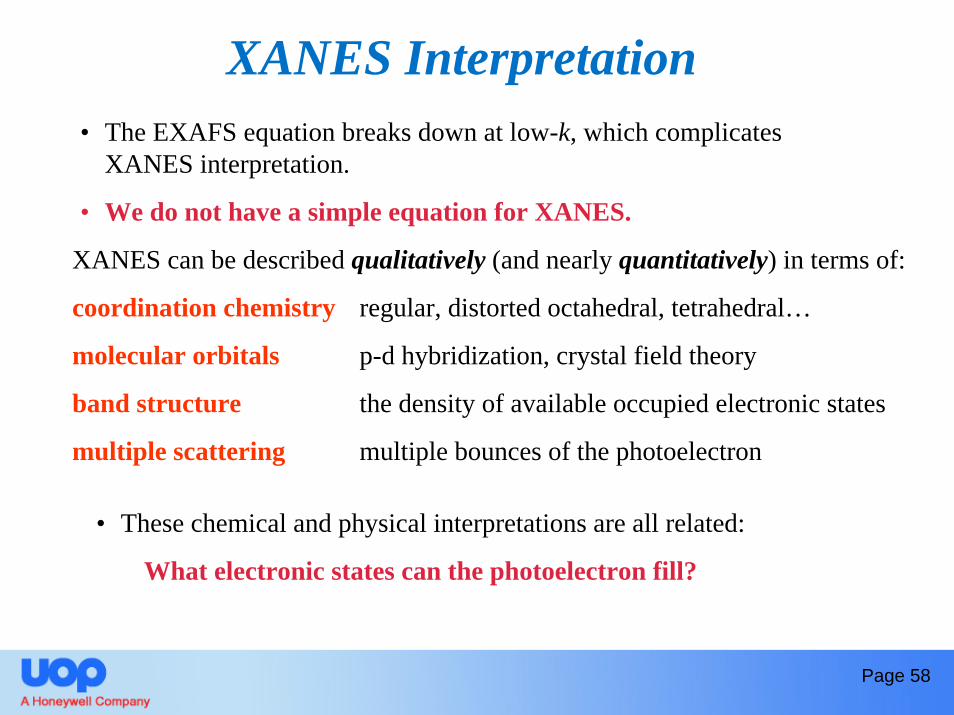
XANES Interpretation• The EXAFS equation breaks down at low-k, which complicates
XANES interpretation.
• We do not have a simple equation for XANES.
XANES can be described qualitatively (and nearly quantitatively) in terms of:
coordination chemistry regular, distorted octahedral, tetrahedral…
molecular orbitals p-d hybridization, crystal field theory
band structure the density of available occupied electronic states
multiple scattering multiple bounces of the photoelectron
• These chemical and physical interpretations are all related:
What electronic states can the photoelectron fill?
Page 58
Advantages of XANES vs. EXAFS• Spectra simpler to measure than EXAFS: features intense, concentrated
in small energy region.
• Weak temperature dependence (Debye-Waller), so spectra can be recorded at reaction temperature (in situ):
• Exp(-2k2σ2) = exp(-2(0.5)2 x 0.005) ~ 1• Faster to measure than full spectrum: <msec demonstrated.
• Sensitive to chemical information: valence, charge transfer.
• Probes unoccupied electronic states: important in chemistry.
• Often used as simple “fingerprint” to identify presence of a particular chemical species.
• Beamlines with micro-probe capabilities can also scan energy and obtain XANES spectra with elemental distribution.
Page 59
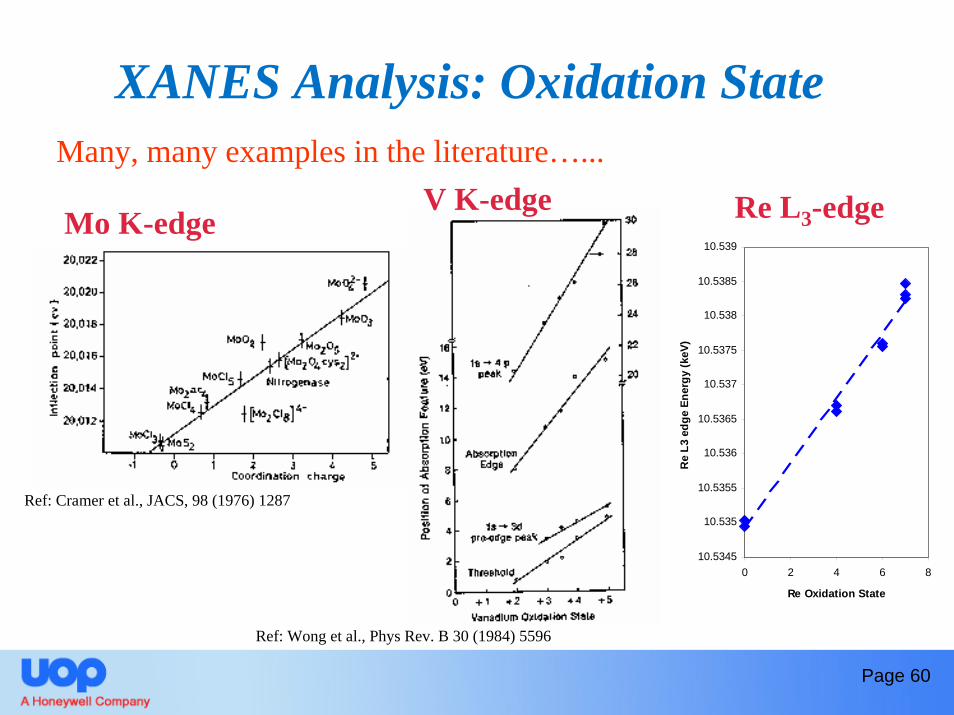
XANES Analysis: Oxidation StateMany, many examples in the literature…...
Mo K-edgeV K-edge
Ref: Wong et al., Phys Rev. B 30 (1984) 5596
Re L3-edge
Ref: Cramer et al., JACS, 98 (1976) 1287
10.5345
10.535
10.5355
10.536
10.5365
10.537
10.5375
10.538
10.5385
10.539
0 2 4 6 8
Re Oxidation State
Re
L3 e
dge
Ener
gy (k
eV)
Page 60
XANES Analysis: Oxidation State
1.0
2.0
3.0
4.0
5.0
6.0
0.0
10 20 30 400 M
o av
erag
e va
lenc
e Mo K edge, (eV)
MoO2
MoO3
Mo4O11
Mo8O23
Mo18O52
Mo5O14
Mo
0.5
1.0
19.95 20 20.05 20.1 20.15
Nor
mal
ized
abs
orpt
ion
Photon energy, (keV)
1.0
2.0
3.0
19.95 20 20.05 20.1 20.15
Nor
mal
ized
abs
orpt
ion
Photon energy, (keV)
MoO2
MoO3
Mo4O11
Mo8O23
Mo18O52
Mo5O14
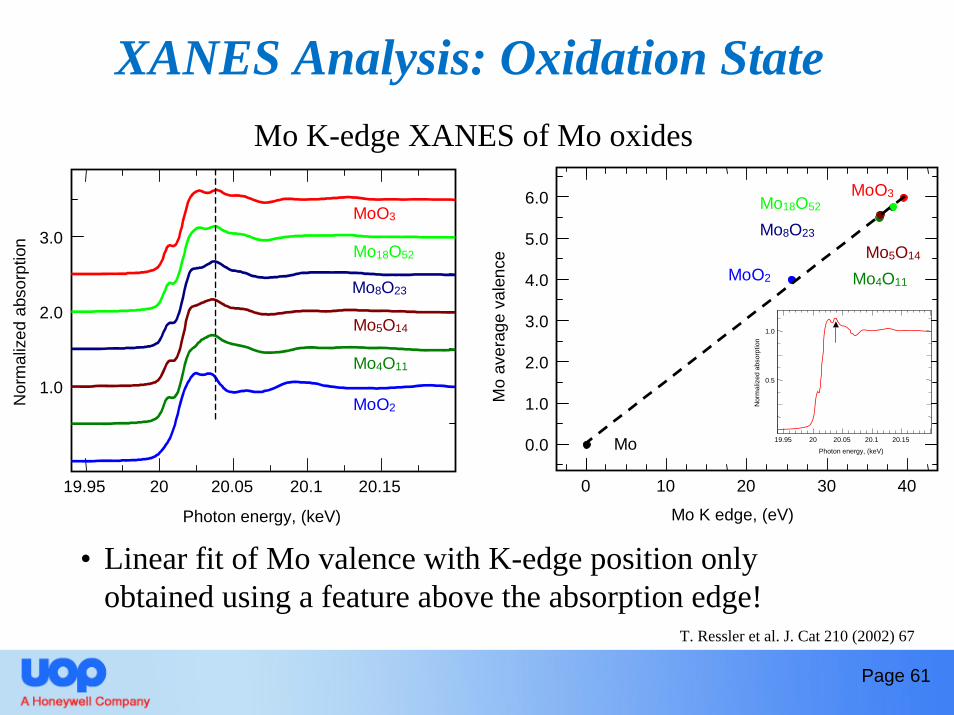
Mo K-edge XANES of Mo oxides
• Linear fit of Mo valence with K-edge position only obtained using a feature above the absorption edge!
T. Ressler et al. J. Cat 210 (2002) 67
Page 61
Metal K-edge XANES
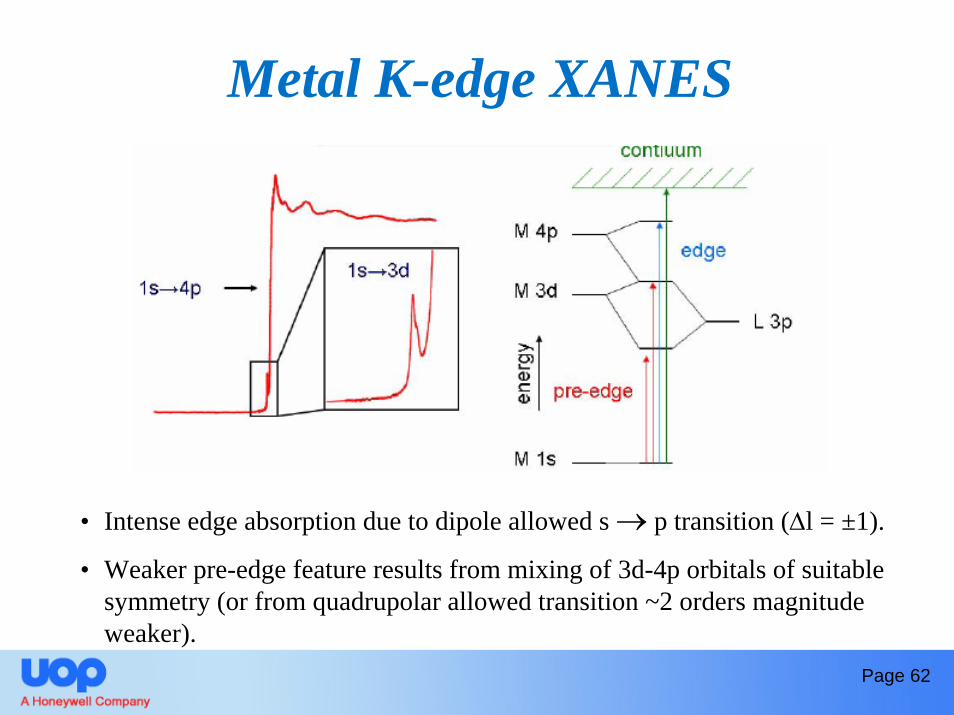
• Intense edge absorption due to dipole allowed s → p transition (Δl = ±1).
• Weaker pre-edge feature results from mixing of 3d-4p orbitals of suitable symmetry (or from quadrupolar allowed transition ~2 orders magnitude weaker).
Page 62
s→ d
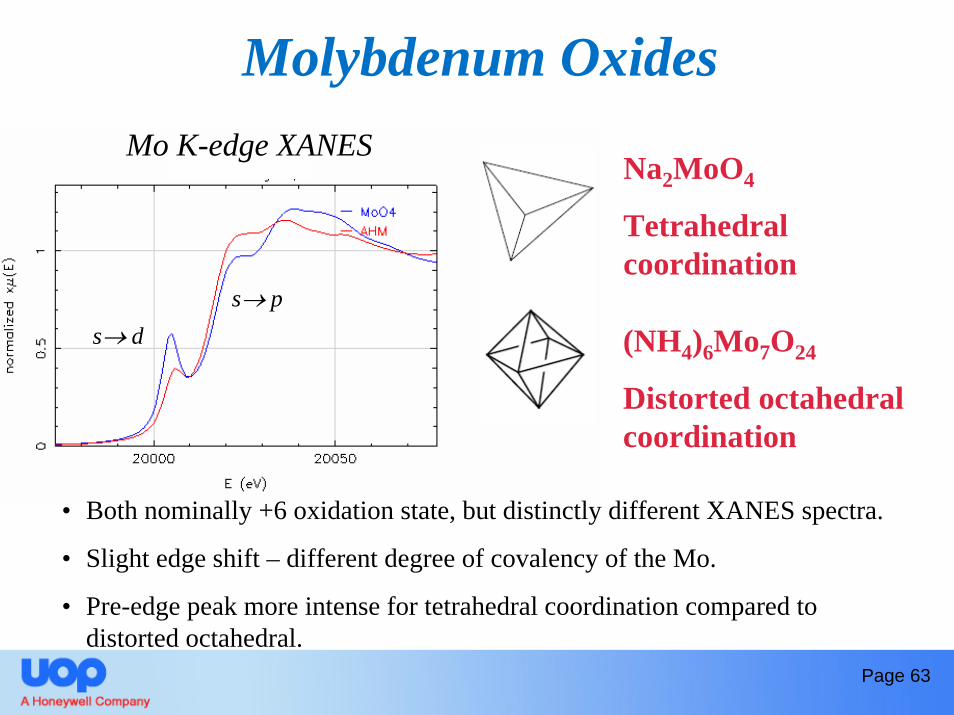
Molybdenum Oxides
(NH4)6Mo7O24
Distorted octahedral coordination
Na2MoO4
Tetrahedral coordination
Mo K-edge XANES
• Both nominally +6 oxidation state, but distinctly different XANES spectra.
• Slight edge shift – different degree of covalency of the Mo.
• Pre-edge peak more intense for tetrahedral coordination compared to distorted octahedral.
Page 63
s→ p
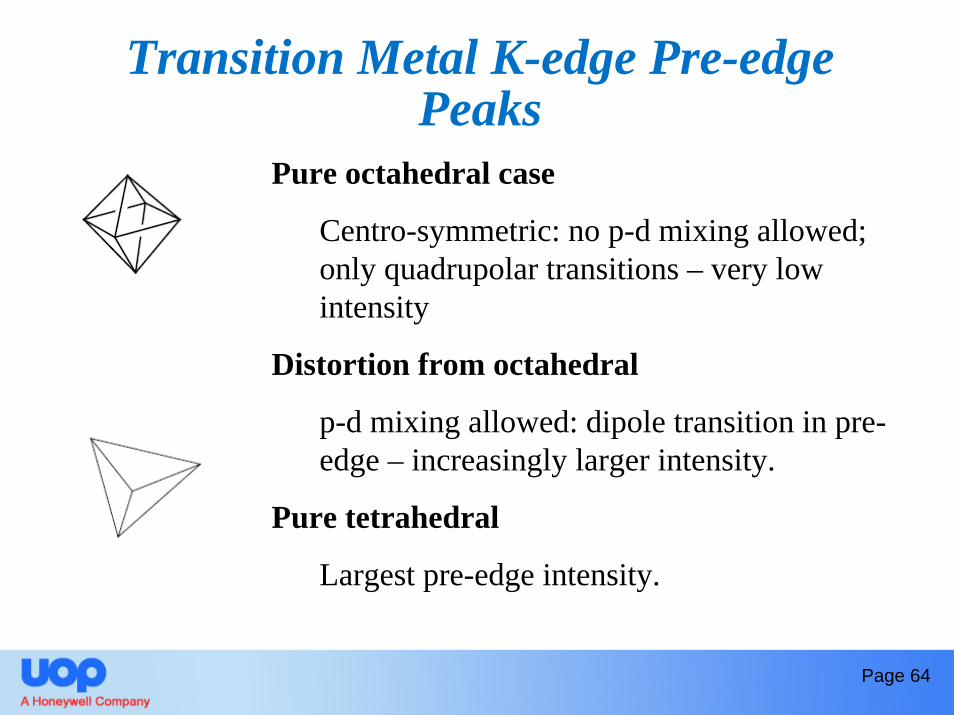
Transition Metal K-edge Pre-edge Peaks
Pure octahedral case
Centro-symmetric: no p-d mixing allowed; only quadrupolar transitions – very low intensity
Distortion from octahedral
p-d mixing allowed: dipole transition in pre-edge – increasingly larger intensity.
Pure tetrahedral
Largest pre-edge intensity.
Page 64
-20 -10 0 10 20 30 40 50
Photon Energy (E-E0) eV
0.0
0.5
1.0
1.5N
orm
aliz
ed A
bsor
ptio
n
Ti_refs1.axg
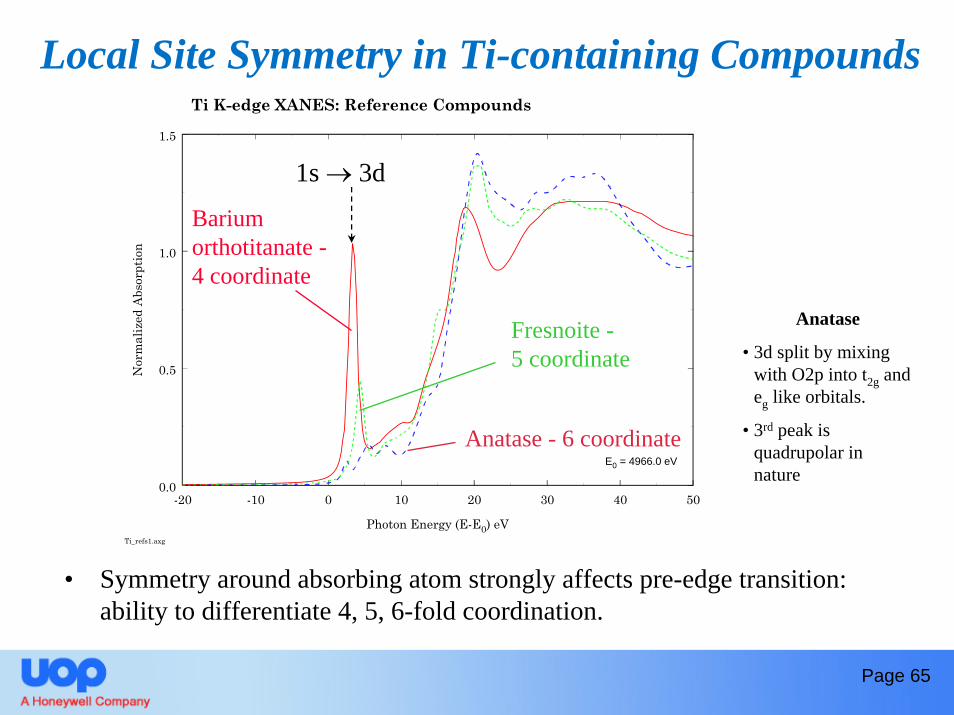
Ti K-edge XANES: Reference Compounds
E0 = 4966.0 eV
Anatase - 6 coordinate
Fresnoite -5 coordinate
Barium orthotitanate -4 coordinate
1s → 3d
• Symmetry around absorbing atom strongly affects pre-edge transition: ability to differentiate 4, 5, 6-fold coordination.
Local Site Symmetry in Ti-containing Compounds
Anatase
• 3d split by mixing with O2p into t2g and eg like orbitals.
• 3rd peak is quadrupolar in nature
Page 65
4969 4970 4971 4972
Absolute Position (eV)
0.0
0.2
0.4
0.6
0.8
1.0
Nor
mal
ized
Hei
ght
[4]
[5]
[6]
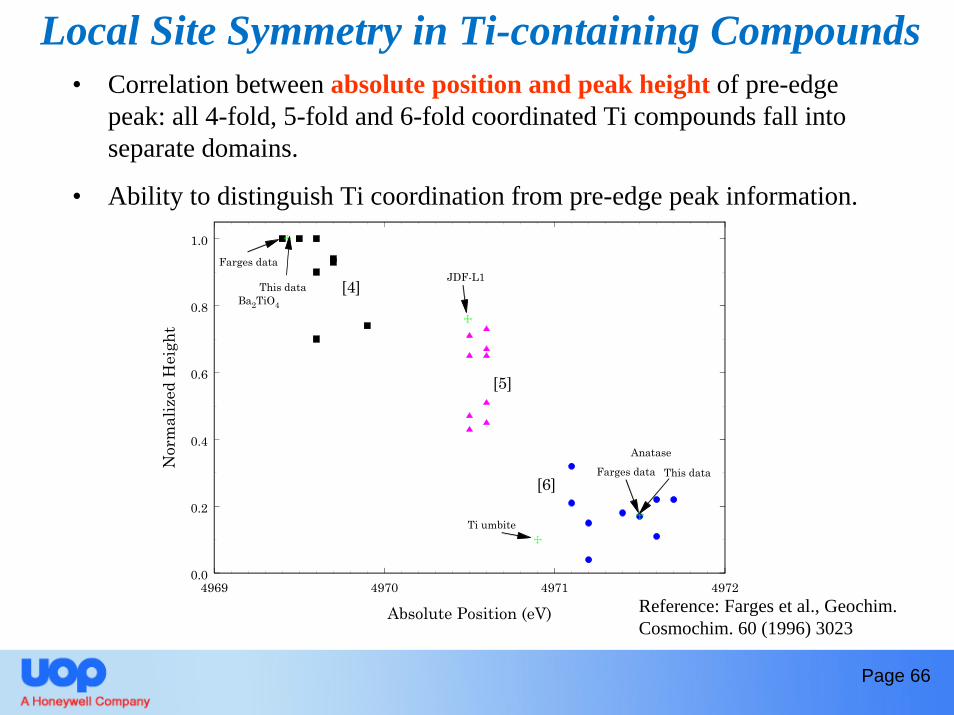
Ba2TiO4
This data
Farges dataJDF-L1
This dataFarges data
Anatase
Ti umbite
• Correlation between absolute position and peak height of pre-edge peak: all 4-fold, 5-fold and 6-fold coordinated Ti compounds fall into separate domains.
• Ability to distinguish Ti coordination from pre-edge peak information.
Reference: Farges et al., Geochim. Cosmochim. 60 (1996) 3023
Page 66
Local Site Symmetry in Ti-containing Compounds
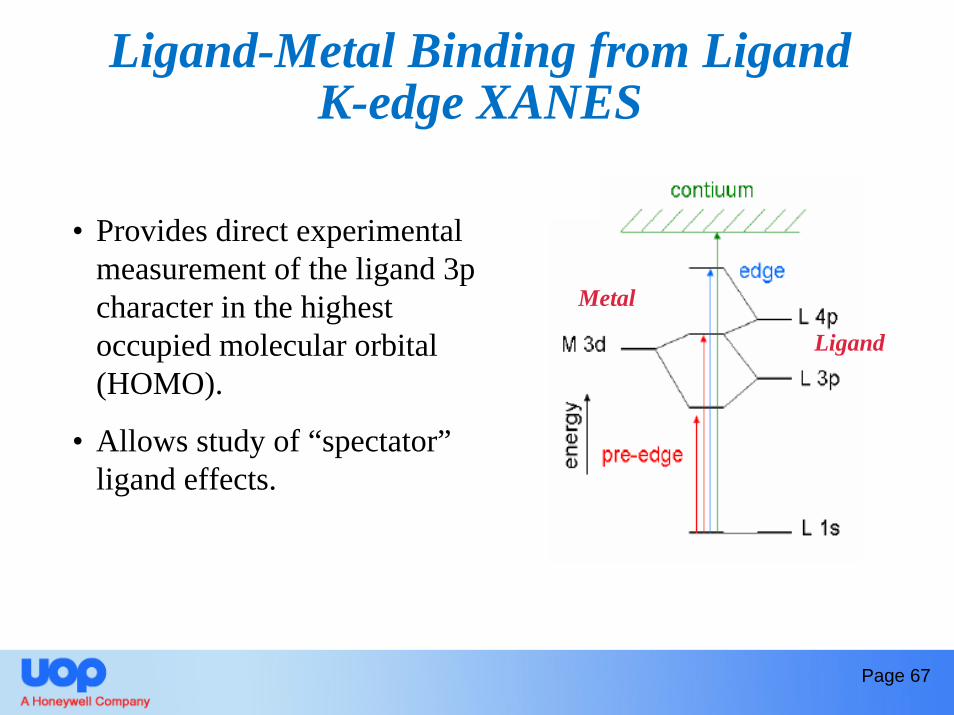
Ligand-Metal Binding from Ligand K-edge XANES
• Provides direct experimental measurement of the ligand 3p character in the highest occupied molecular orbital (HOMO).
• Allows study of “spectator”ligand effects.
Page 67
Metal
Ligand
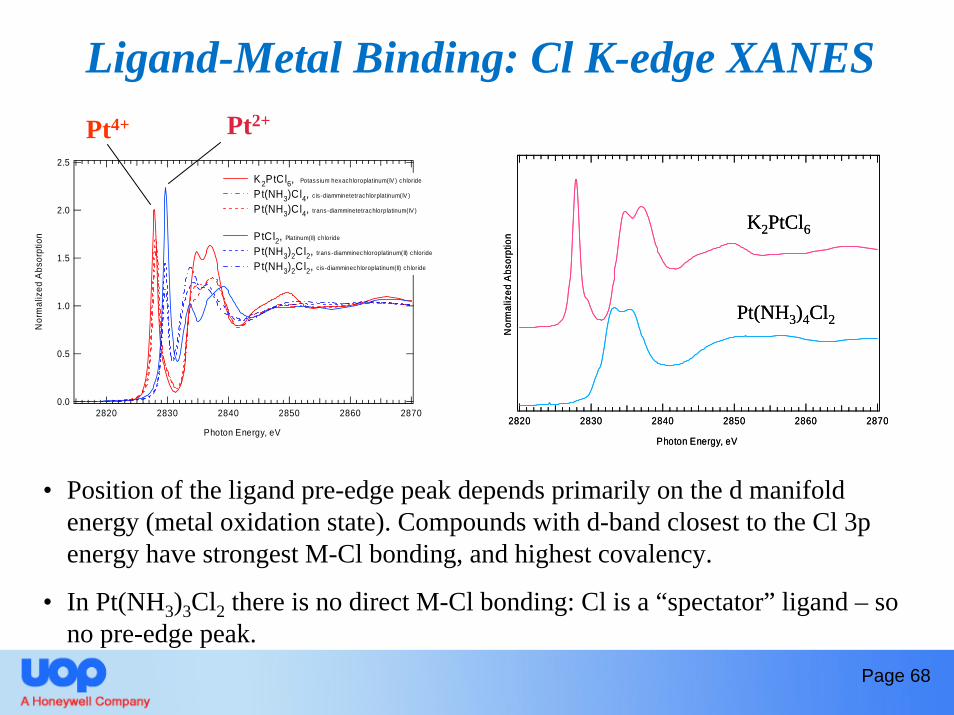
Ligand-Metal Binding: Cl K-edge XANES
2.5
2.0
1.5
1.0
0.5
0.0
Nor
mal
ized
Abs
orpt
ion
287028602850284028302820
Photon Energy, eV
K2PtCl6, Potass ium hexachloroplatinum(IV ) chloride
Pt(NH3)Cl4, c is-diamminetetrachlorplatinum(IV )
Pt(NH3)Cl4, trans-diamminetetrachlorplatinum(IV )
PtCl2, Platinum(II) chloride
Pt(NH3)2Cl2, trans-diamminechloroplatinum(II) chloride
Pt(NH3)2Cl2, c is -diamminechloroplatinum(II) chloride
Pt4+ Pt2+
K2PtCl6
Pt(NH3)4Cl2
Nor
mal
ized
Abs
orpt
ion
287028602850284028302820
Photon Energy, eV
K2PtCl6
Pt(NH3)4Cl2
Nor
mal
ized
Abs
orpt
ion
287028602850284028302820
Photon Energy, eV
• Position of the ligand pre-edge peak depends primarily on the d manifold energy (metal oxidation state). Compounds with d-band closest to the Cl 3p energy have strongest M-Cl bonding, and highest covalency.
• In Pt(NH3)3Cl2 there is no direct M-Cl bonding: Cl is a “spectator” ligand – so no pre-edge peak.
Page 68
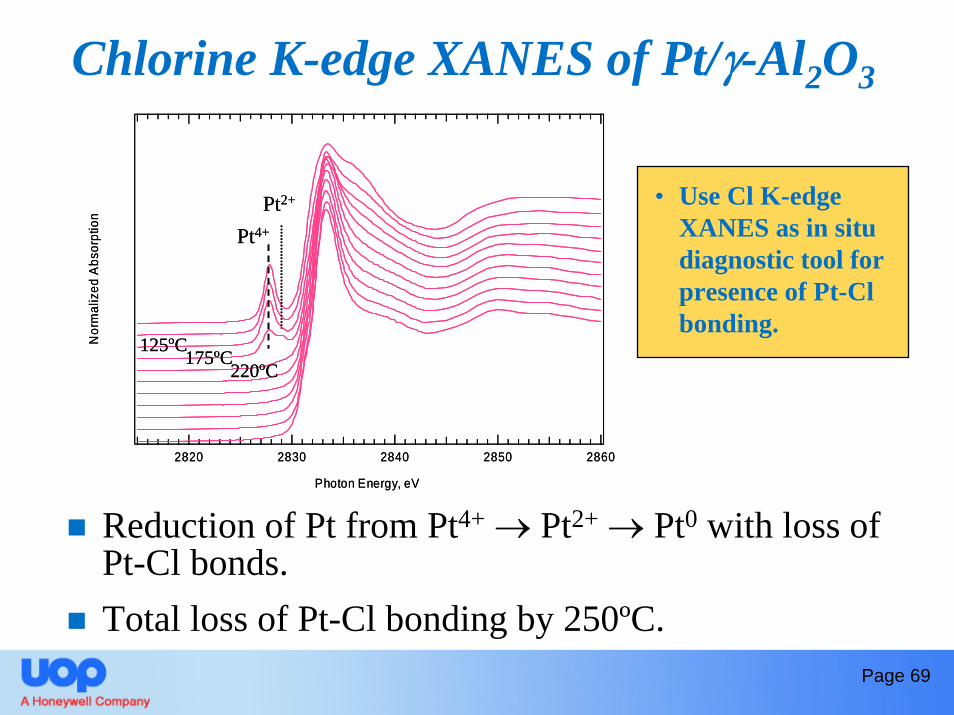
Chlorine K-edge XANES of Pt/γ-Al2O3
Reduction of Pt from Pt4+ → Pt2+ → Pt0 with loss of Pt-Cl bonds.Total loss of Pt-Cl bonding by 250ºC.
Nor
mal
ized
Abs
orpt
ion
28602850284028302820
Photon Energy, eV
Pt4+
Pt2+
220ºC125ºC
175ºC
Nor
mal
ized
Abs
orpt
ion
28602850284028302820
Photon Energy, eV
Pt4+
Pt2+
220ºC125ºC
175ºC
• Use Cl K-edge XANES as in situ diagnostic tool for presence of Pt-Cl bonding.
Page 69
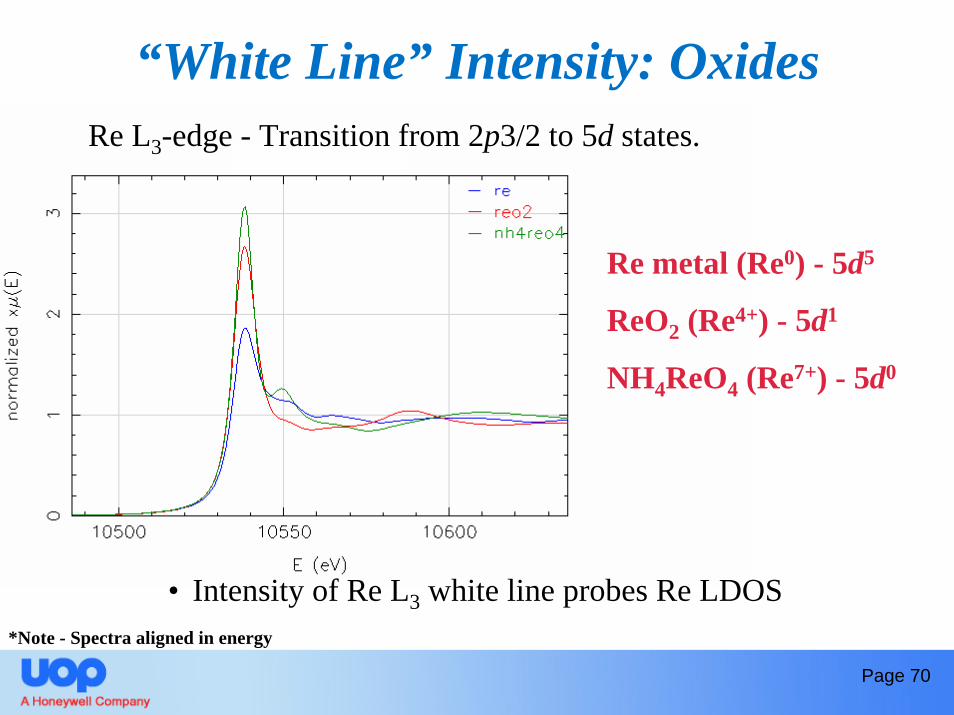
“White Line” Intensity: OxidesRe L3-edge - Transition from 2p3/2 to 5d states.
Re metal (Re0) - 5d5
ReO2 (Re4+) - 5d1
NH4ReO4 (Re7+) - 5d0
• Intensity of Re L3 white line probes Re LDOS*Note - Spectra aligned in energy
Page 70
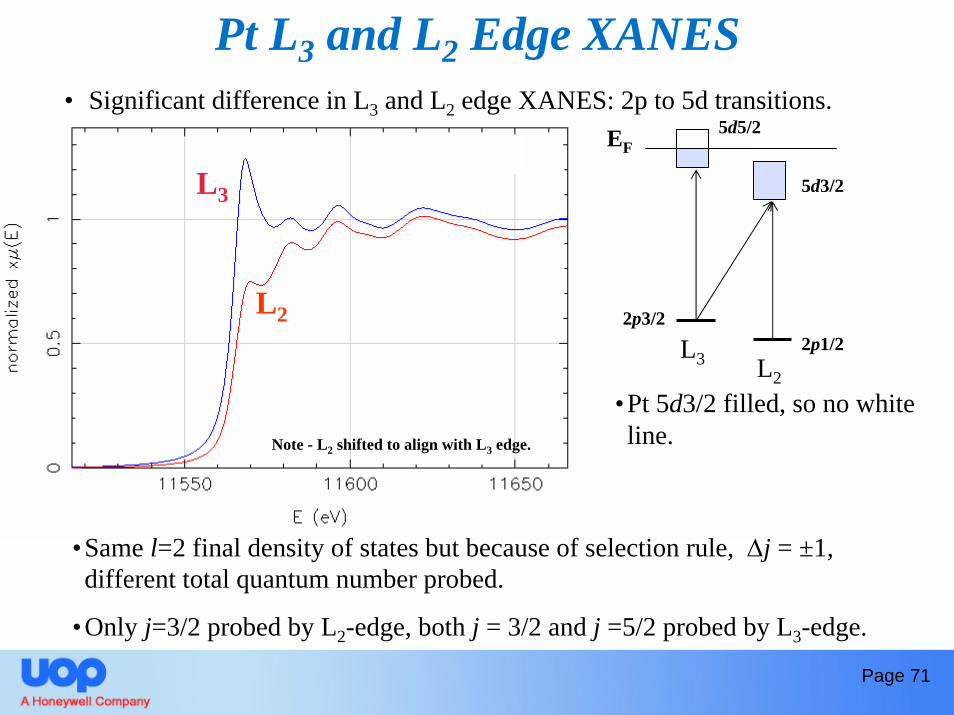
L3
L2
• Significant difference in L3 and L2 edge XANES: 2p to 5d transitions.
•Pt 5d3/2 filled, so no white line.Note - L2 shifted to align with L3 edge.
EF5d5/2
5d3/2
L3 L2
2p1/22p3/2
•Same l=2 final density of states but because of selection rule, Δj = ±1, different total quantum number probed.
•Only j=3/2 probed by L2-edge, both j = 3/2 and j =5/2 probed by L3-edge.
Pt L3 and L2 Edge XANES
Page 71
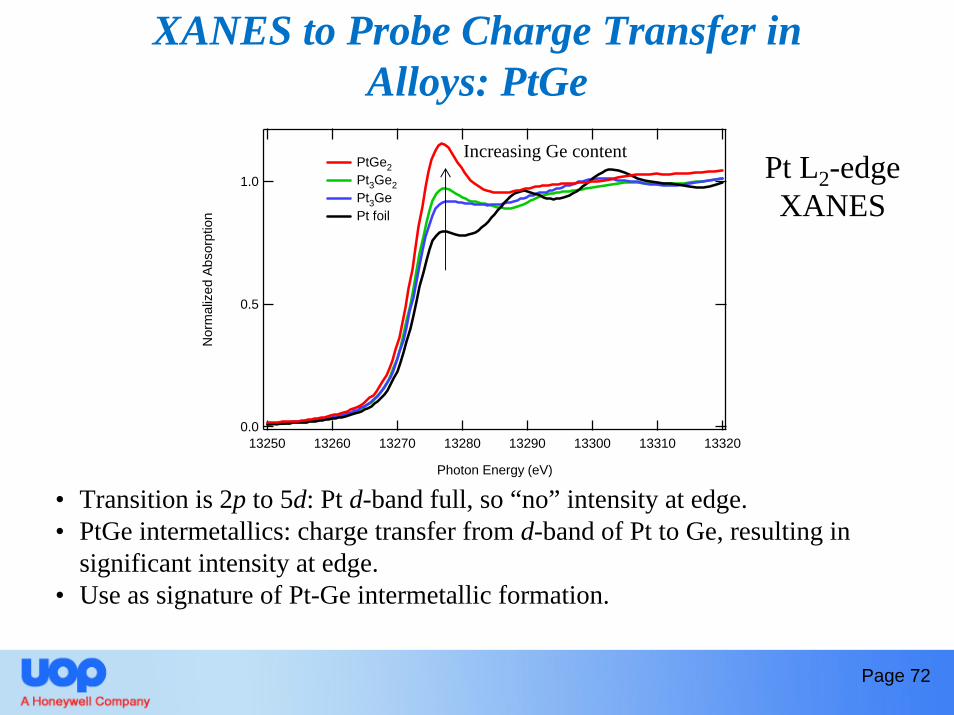
• Transition is 2p to 5d: Pt d-band full, so “no” intensity at edge.• PtGe intermetallics: charge transfer from d-band of Pt to Ge, resulting in
significant intensity at edge.• Use as signature of Pt-Ge intermetallic formation.
XANES to Probe Charge Transfer in Alloys: PtGe
1.0
0.5
0.0
Nor
mal
ized
Abs
orpt
ion
1332013310133001329013280132701326013250
Photon Energy (eV)
PtGe2 Pt3Ge2 Pt3Ge Pt foil
Increasing Ge content
Page 72
Pt L2-edge XANES
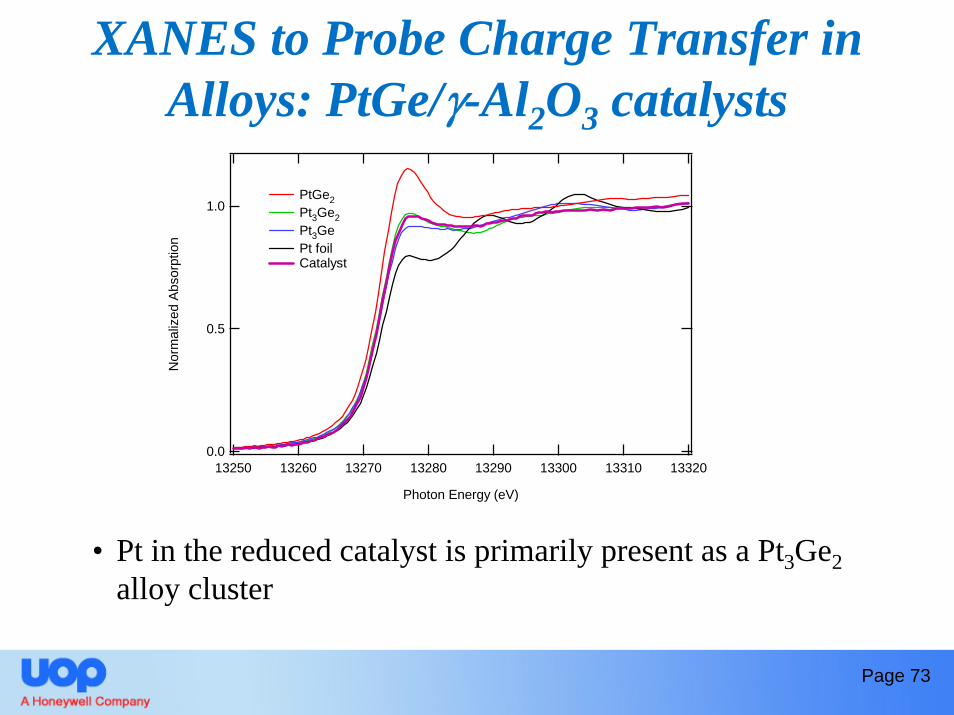
XANES to Probe Charge Transfer in Alloys: PtGe/γ-Al2O3 catalysts
Page 73
1.0
0.5
0.0
Nor
mal
ized
Abs
orpt
ion
1332013310133001329013280132701326013250
Photon Energy (eV)
PtGe2 Pt3Ge2 Pt3Ge Pt foil Catalyst
• Pt in the reduced catalyst is primarily present as a Pt3Ge2alloy cluster
Effect of Adsorbed Molecules on XANES of Dispersed Metal Clusters
Have to be careful and consistent as to how your data are collected.Is there hydrogen (or any other molecule) adsorbed on the metal cluster?If there is then the “chemistry” of the metal-adsorbed molecule could affect the XANES.Combination of ab initio theory and (high resolution) XANES potential powerful tool for determining adsorption site.
Page 74
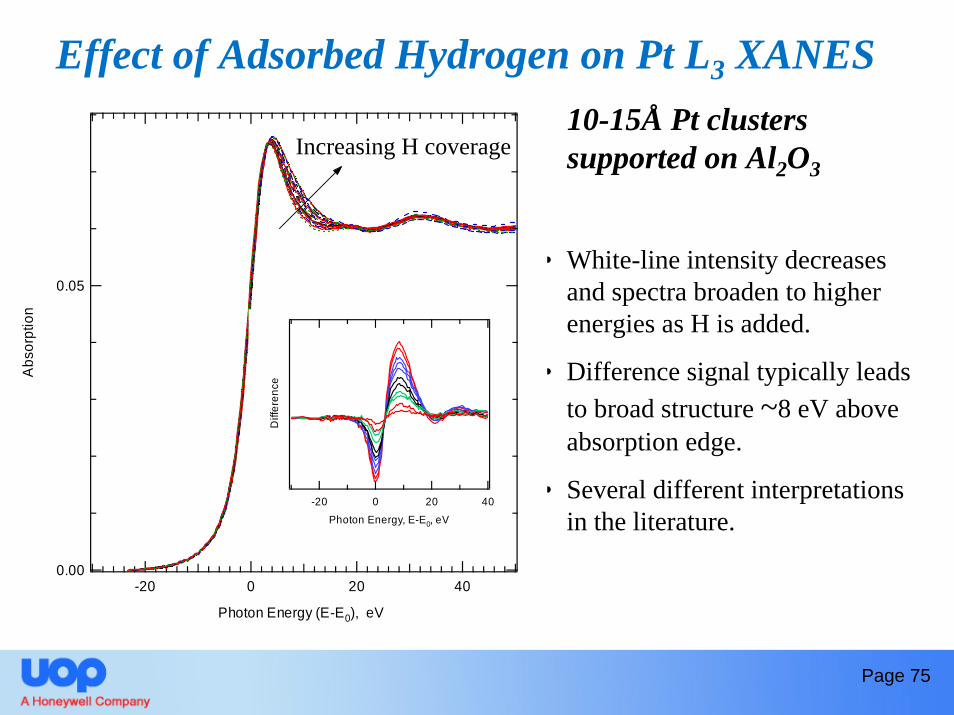
Effect of Adsorbed Hydrogen on Pt L3 XANES
• White-line intensity decreases and spectra broaden to higher energies as H is added.
• Difference signal typically leads to broad structure ~8 eV above absorption edge.
• Several different interpretations in the literature.
0.05
0.00
Abs
orpt
ion
40200-20
Photon Energy (E-E0), eV
Diff
eren
ce
40200-20Photon Energy, E-E0, eV
Increasing H coverage10-15Å Pt clusters supported on Al2O3
Page 75
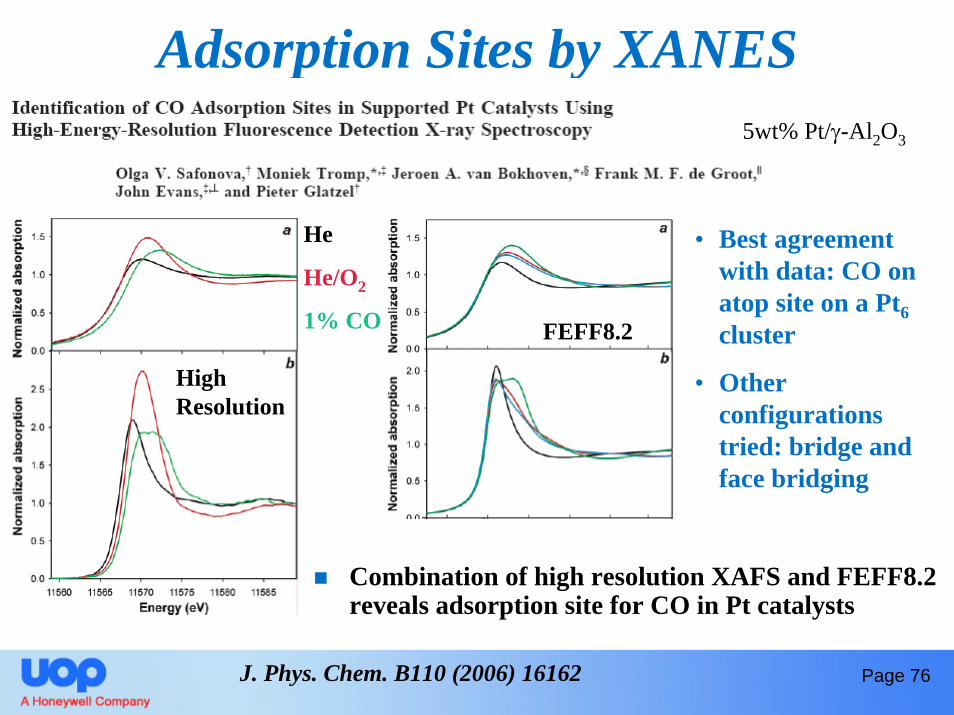
Adsorption Sites by XANES
J. Phys. Chem. B110 (2006) 16162 Page 76
Combination of high resolution XAFS and FEFF8.2 reveals adsorption site for CO in Pt catalysts
5wt% Pt/γ-Al2O3
He
He/O2
1% CO
High Resolution
• Best agreement with data: CO on atop site on a Pt6cluster
• Other configurations tried: bridge and face bridging
FEFF8.2
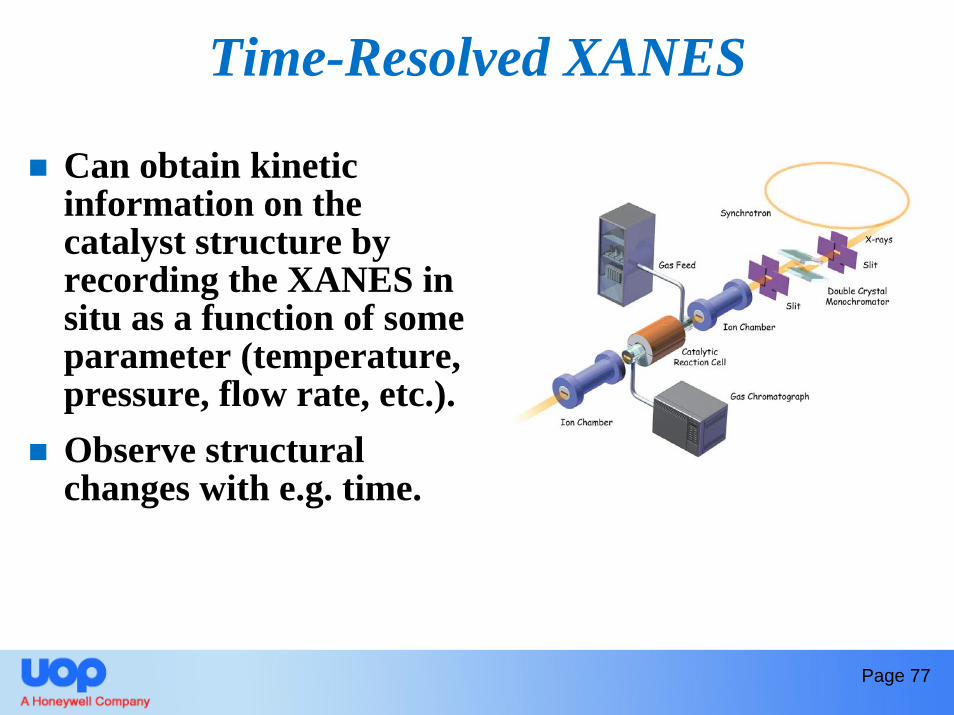
Time-Resolved XANES
Can obtain kinetic information on the catalyst structure by recording the XANES in situ as a function of some parameter (temperature, pressure, flow rate, etc.).Observe structural changes with e.g. time.
Page 77
Q-XANES & D-XANES
Page 78ESRF ID-24
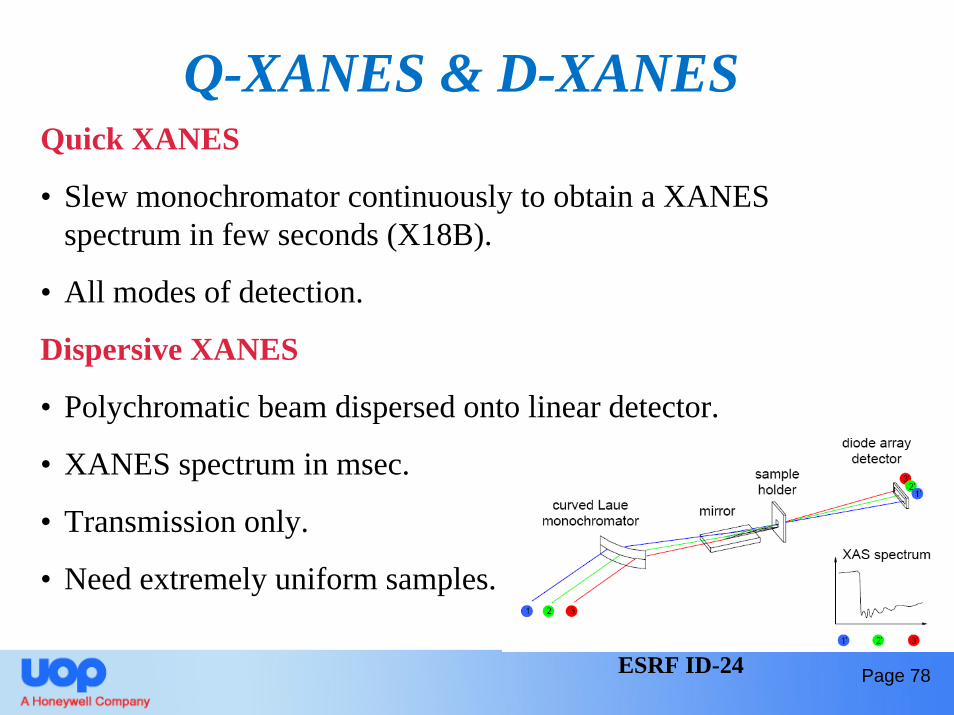
Quick XANES
• Slew monochromator continuously to obtain a XANES spectrum in few seconds (X18B).
• All modes of detection.
Dispersive XANES
• Polychromatic beam dispersed onto linear detector.
• XANES spectrum in msec.
• Transmission only.
• Need extremely uniform samples.
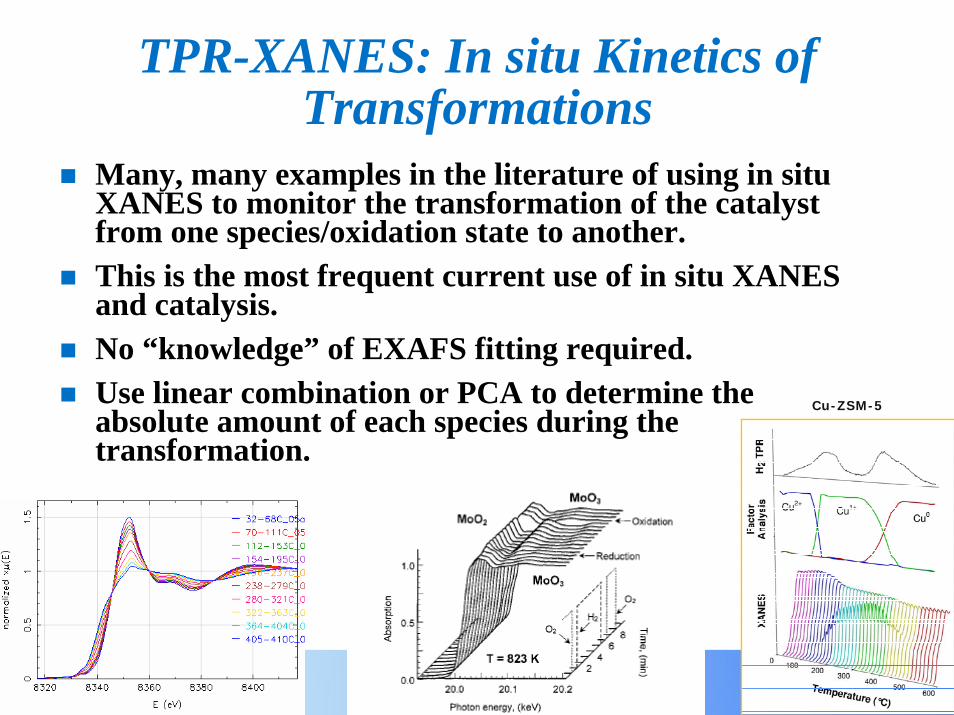
TPR-XANES: In situ Kinetics of Transformations
Many, many examples in the literature of using in situ XANES to monitor the transformation of the catalyst from one species/oxidation state to another.This is the most frequent current use of in situ XANES and catalysis.No “knowledge” of EXAFS fitting required.Use linear combination or PCA to determine the absolute amount of each species during the transformation.
Cu-ZSM-5Cu-ZSM-5
5
4
3
2
1
0
Nor
mal
ized
Abs
orpt
ion
10.5710.5610.5510.5410.5310.52
Photon Energy, keV
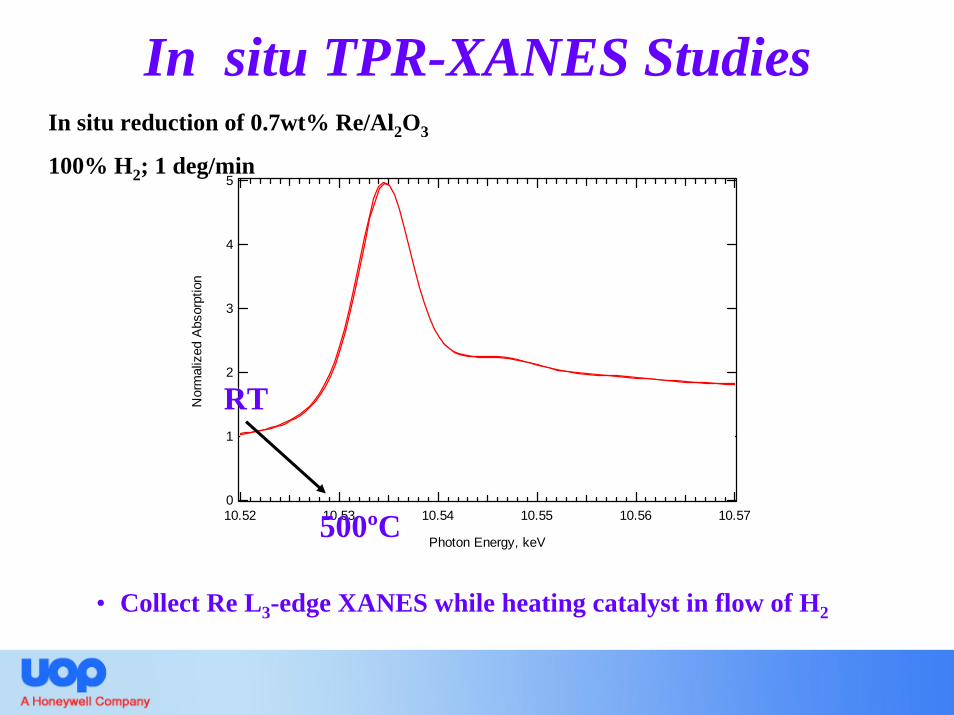
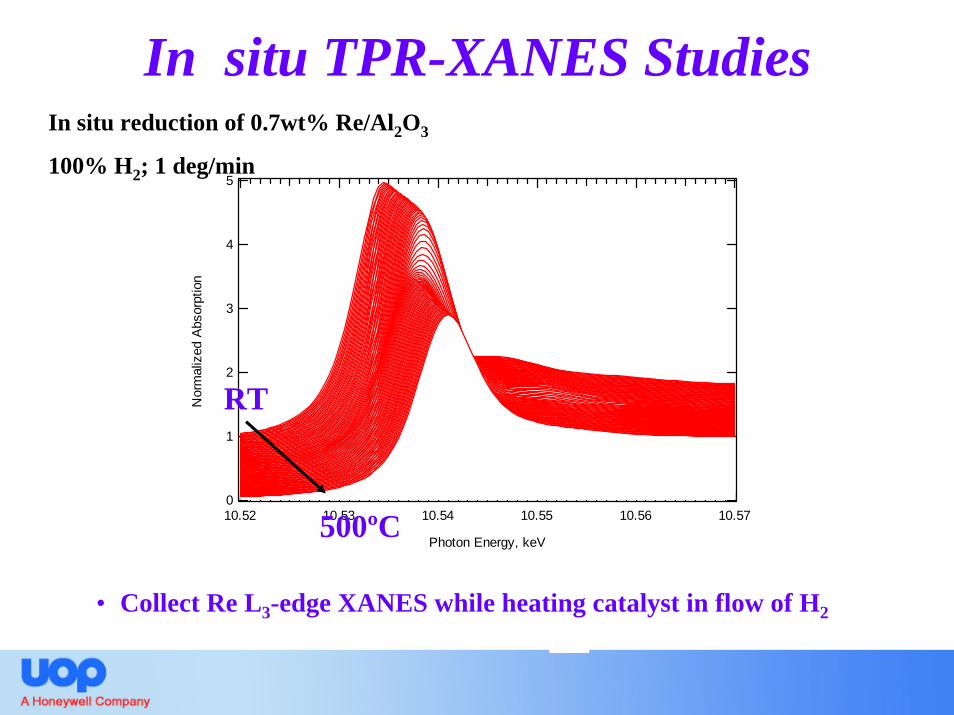
In situ reduction of 0.7wt% Re/Al2O3
100% H2; 1 deg/min
In situ TPR-XANES Studies
RT
500ºC
• Collect Re L3-edge XANES while heating catalyst in flow of H2
5
4
3
2
1
0
Nor
mal
ized
Abs
orpt
ion
10.5710.5610.5510.5410.5310.52
Photon Energy, keV
RT
500ºC
In situ reduction of 0.7wt% Re/Al2O3
100% H2; 1 deg/min
In situ TPR-XANES Studies
• Collect Re L3-edge XANES while heating catalyst in flow of H2
0.0
1.0
2.0
3.0
4.0
0.0
10.54
10.56
10.58
20
40
60
80
Y
X
Z
Photon Energy, keV
Nor
mal
ized
Abs
o rpt
ion
RT
500ºC
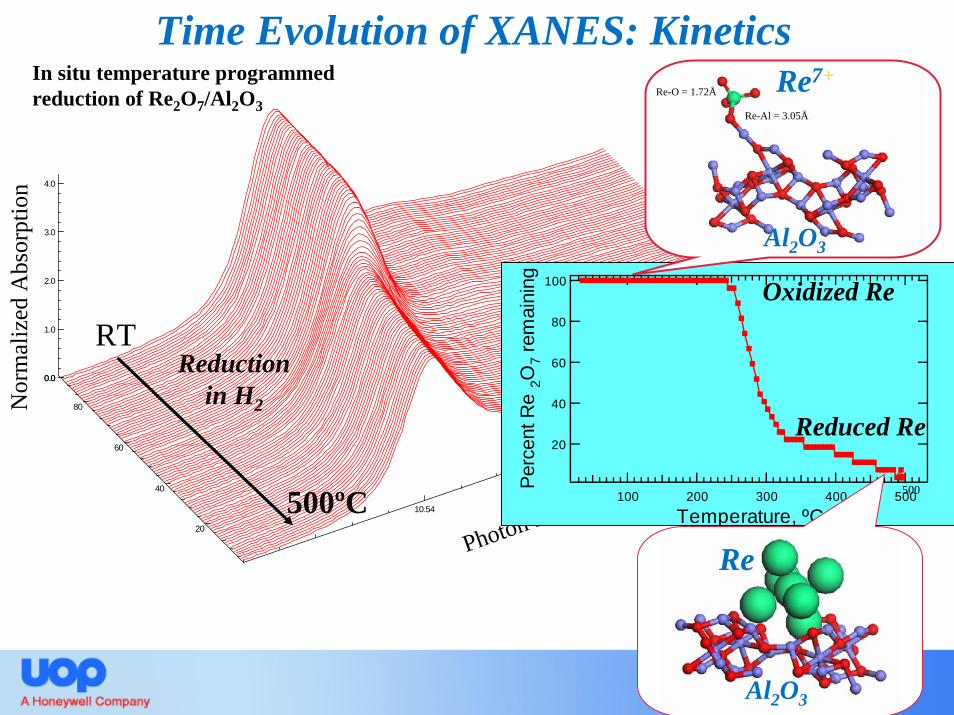
Time Evolution of XANES: Kinetics
Reduction in H2
Reduced Re
Oxidized Re
500
100
80
60
40
20
Perc
ent R
e2O
7 rem
aini
ng
500400300200100
Temperature, ºC
Re
Al2O3
Al2O3
Re-O = 1.72Å
Re-Al = 3.05Å
Re7+In situ temperature programmed reduction of Re2O7/Al2O3
0.5
1.0
1.5
2.0
2.5
3.0
3.5
5.46
5.47
5.48
5.49
5.5
20
40
60
80
Y
X
Z
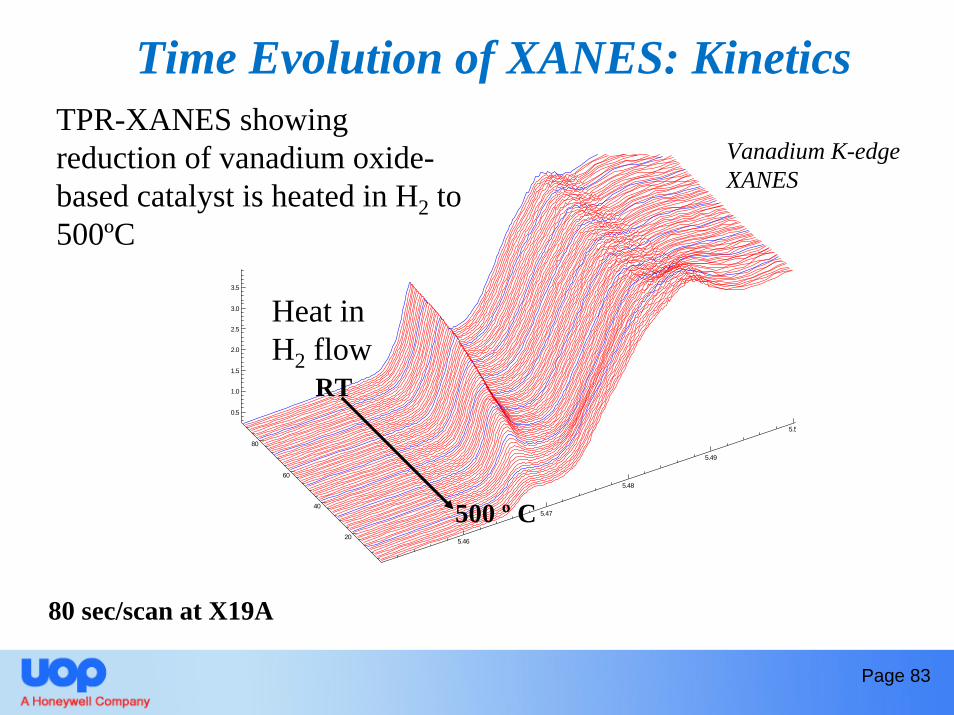
Time Evolution of XANES: KineticsTPR-XANES showing reduction of vanadium oxide-based catalyst is heated in H2 to 500ºC
Heat in H2 flow
Vanadium K-edge XANES
RT
500 º C
80 sec/scan at X19A
Page 83
Analysis of Mixtures
• XANES useful technique to quantitatively determine composition of a mixture of species.
• Useful for following time evolution of species during a chemical reaction.
• Two most common methods:
– Least squares linear combination fitting
– Principal component analysis
Page 84
Least Squares Linear Combination Fitting
• Use a linear combination of spectra of various reference samples.
• Allows quantification of species in multiple-component mixture from their fingerprint in the XANES region.
• Use a least-squares algorithm to refine the sum of a given number of reference spectra to an experimental spectrum.
• Simple method, easy to implement.
• Must have good quality spectra of the reference compounds recorded under similar conditions – energy alignment is critical.
Page 85
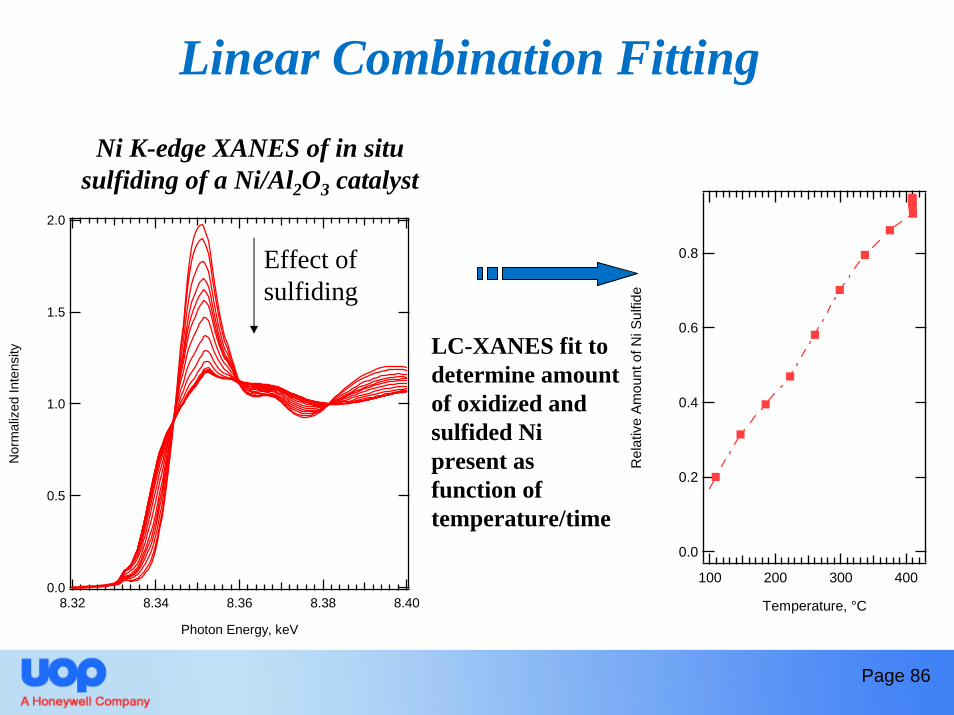
Linear Combination Fitting
2.0
1.5
1.0
0.5
0.0
Nor
mal
ized
Inte
nsity
8.408.388.368.348.32
Photon Energy, keV
Effect of sulfiding
Ni K-edge XANES of in situ sulfiding of a Ni/Al2O3 catalyst
LC-XANES fit to determine amount of oxidized and sulfided Ni present as function of temperature/time
0.8
0.6
0.4
0.2
0.0
Rel
ativ
e Am
ount
of N
i Sul
fide
400300200100
Temperature, °C
Page 86
Future Prospects
Imaging XANES High resolution XANESSelective XANES
Page 87

2D Imaging of Catalyst Structure
Page 88
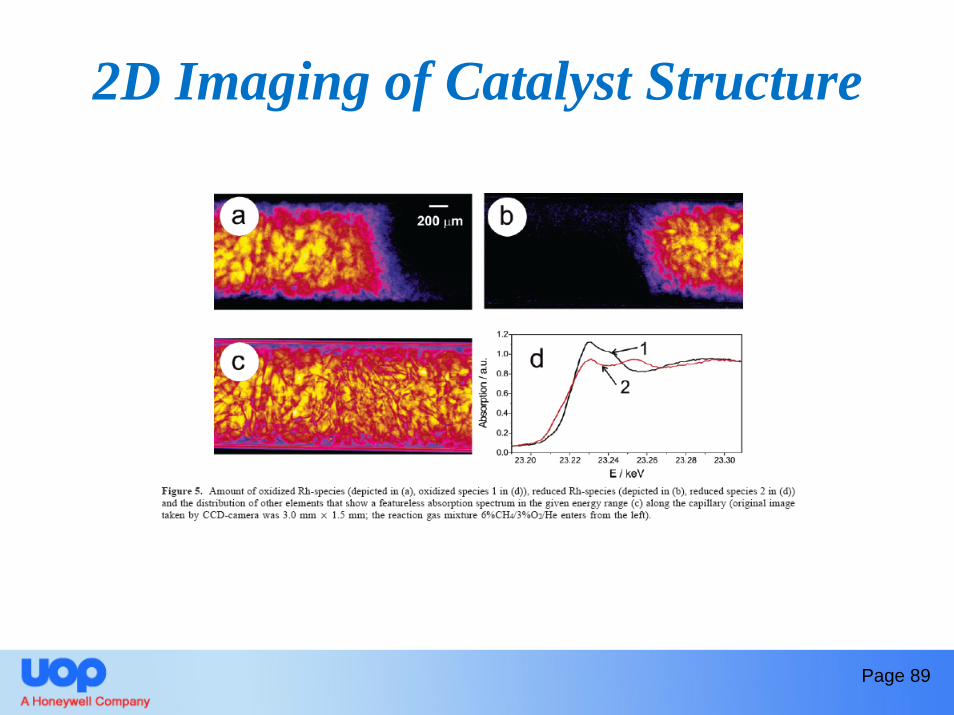
2D Imaging of Catalyst Structure
Page 89
X-Selective XANES
In concept by selecting a single fluorescence decay channel there are many different types of XANES either already demonstrated or feasible:
– Spin-selective– Edge-selective– Valence-selective– Neighbor-selective
Page 90
Examples of Application of XAFS to Catalyst Characterization
EXAFS
Page 91
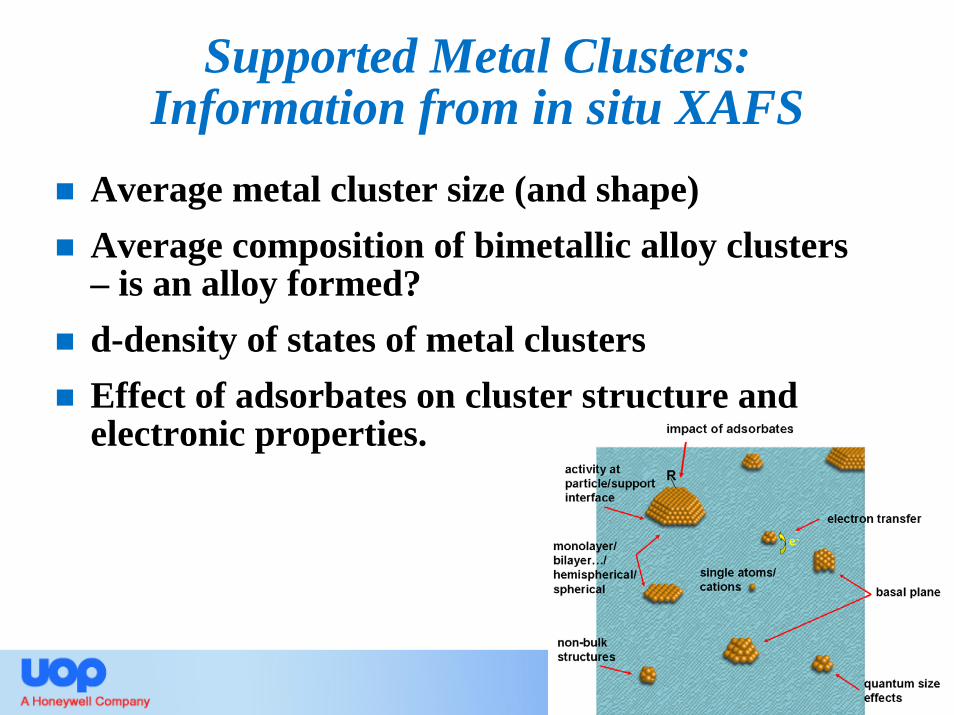
Supported Metal Clusters: Information from in situ XAFS
Average metal cluster size (and shape)Average composition of bimetallic alloy clusters – is an alloy formed?d-density of states of metal clustersEffect of adsorbates on cluster structure and electronic properties.
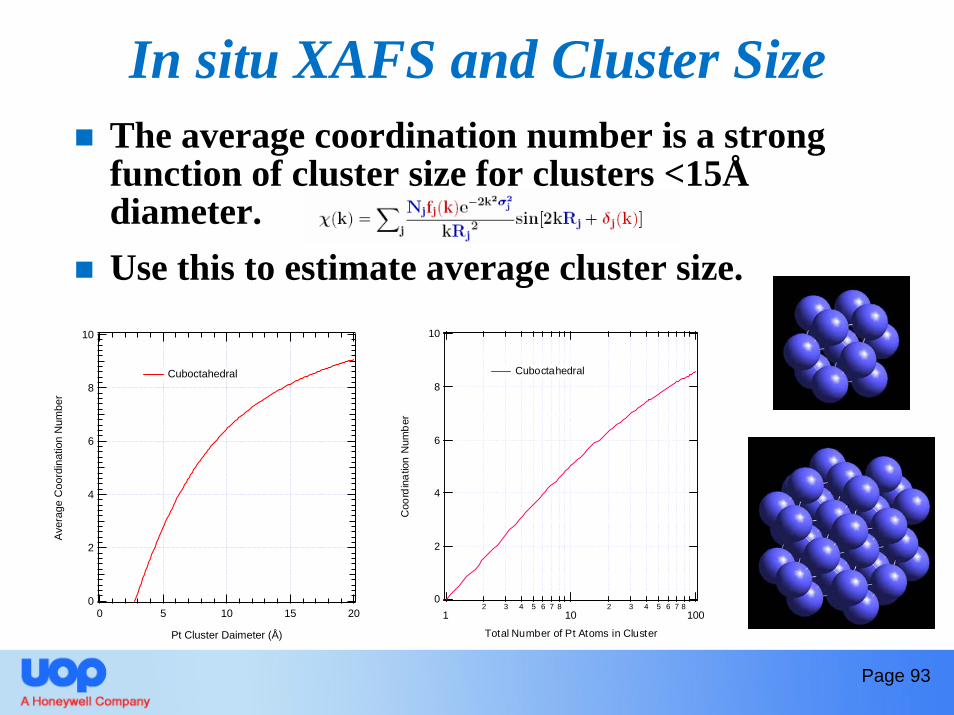
In situ XAFS and Cluster SizeThe average coordination number is a strong function of cluster size for clusters <15Ådiameter.Use this to estimate average cluster size.
10
8
6
4
2
0
Ave
rage
Coo
rdin
atio
n N
umbe
r
20151050
Pt Cluster Daimeter (Å)
Cuboctahedral
10
8
6
4
2
0
Coo
rdin
atio
n N
umbe
r
12 3 4 5 6 7 8
102 3 4 5 6 7 8
100
Total Number of Pt Atoms in Cluster
Cuboctahedral
Page 93
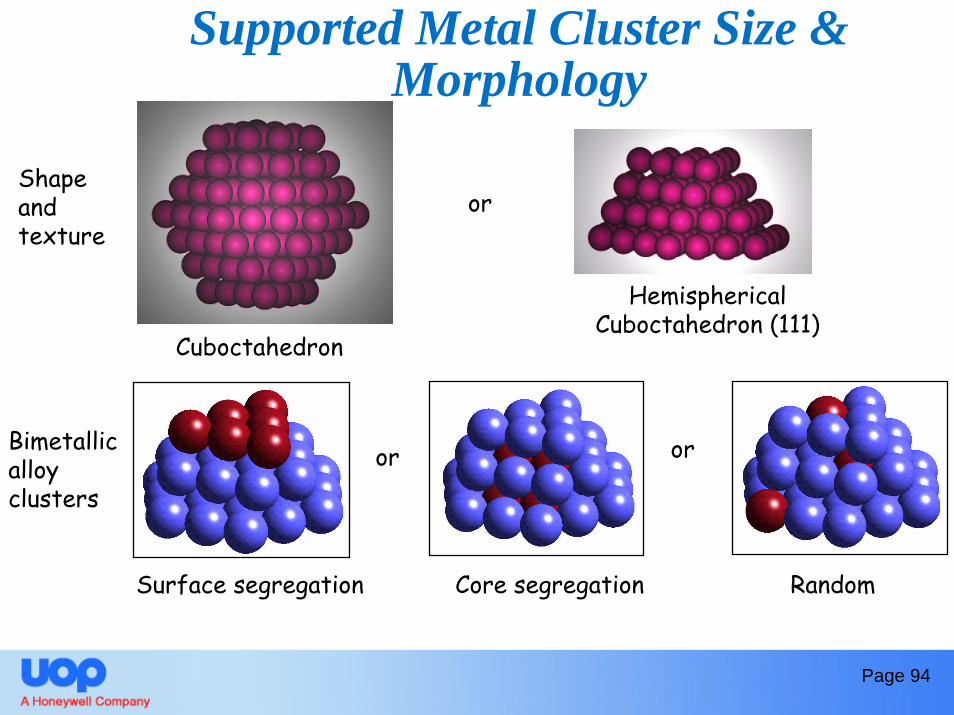
Supported Metal Cluster Size & Morphology
or
HemisphericalCuboctahedron (111)
Shape and texture
Cuboctahedron
Surface segregation
or orBimetallic alloy clusters
Core segregation Random
Page 94
EXAFS Analysis to Determine Size & Shape of Re clusters on γ-Al2O3
Re supported on γ-Al2O3 is catalyst is has been shown to have high activity and high selectivity in olefin metathesis in oxidic form; when Re forms a bimetallic cluster with Pt then the subsequent Pt-Re clusters are used in petroleum reforming catalysts.
What is the structure of Re species on the γ-Al2O3surface after the alumina is impregnated with perrhenic acid, calcined, dried and reduced?
Page 95
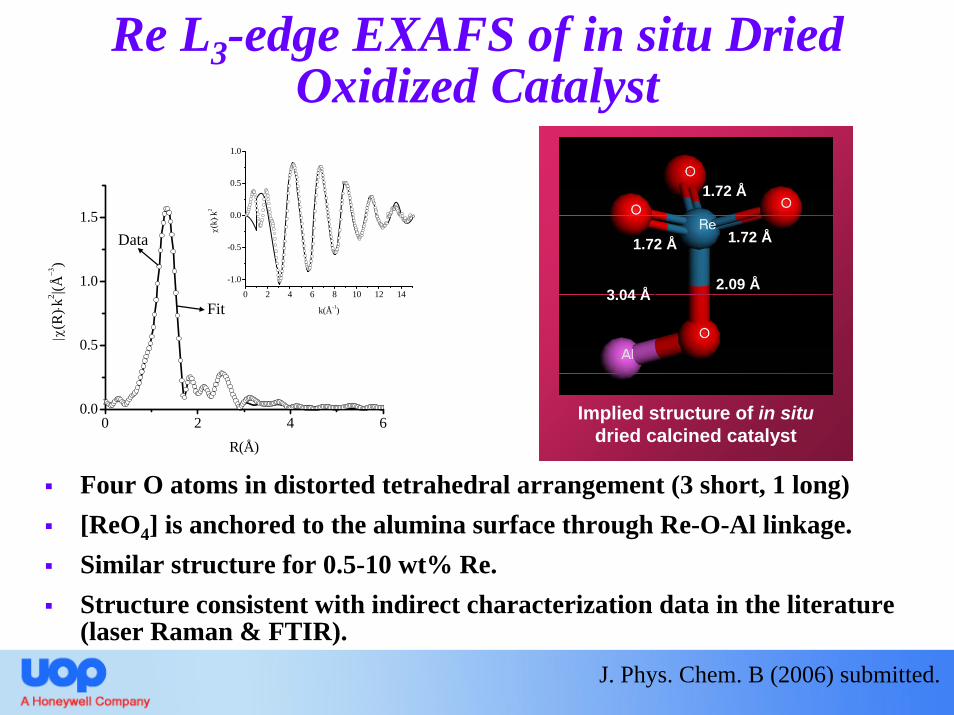
Four O atoms in distorted tetrahedral arrangement (3 short, 1 long)[ReO4] is anchored to the alumina surface through Re-O-Al linkage. Similar structure for 0.5-10 wt% Re.Structure consistent with indirect characterization data in the literature (laser Raman & FTIR).
J. Phys. Chem. B (2006) submitted.
0 2 4 60.0
0.5
1.0
1.5
Re L3-edge EXAFS of in situ Dried Oxidized Catalyst
|χ(R
)⋅k2 |(Å
−3)
R(Å)
B
0 2 4 6 8 10 12 14
-1.0
-0.5
0.0
0.5
1.0A
χ(k)
⋅k2
k(Å-1)Fit
Data
Implied structure of in situdried calcined catalyst
1.72 Å
1.72 Å
1.72 Å
2.09 Å3.04 Å
Implied structure of in situdried calcined catalyst
1.72 Å
1.72 Å
1.72 Å
2.09 Å3.04 Å
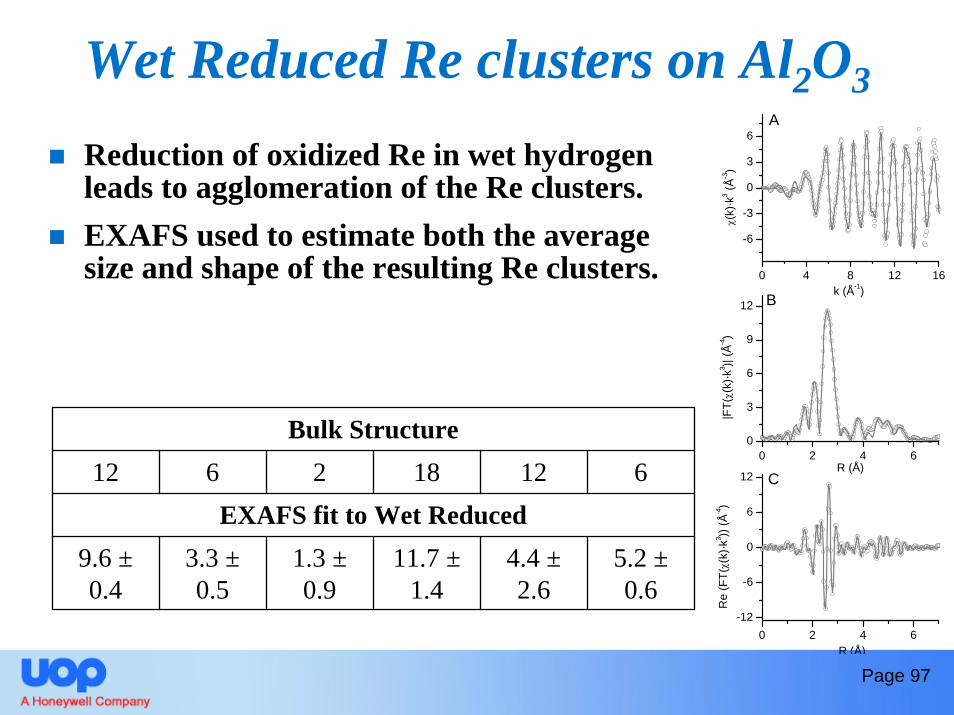
Wet Reduced Re clusters on Al2O3
Reduction of oxidized Re in wet hydrogen leads to agglomeration of the Re clusters.EXAFS used to estimate both the average size and shape of the resulting Re clusters.
0 2 4 60
3
6
9
12
0 2 4 6-12
-6
0
6
12
0 4 8 12 16
-6
-3
0
3
6
R (Å)
B
|FT(
χ(k)
·k3 )|
(Å-4)
Re
(FT(
χ(k)
·k3 ))
(Å-4)
C
R (Å)
A
χ(k
)·k3 (Å
-3)
k (Å-1)
Bulk Structure12 6 2 18 12 6
EXAFS fit to Wet Reduced9.6 ±0.4
3.3 ±0.5
1.3 ±0.9
11.7 ±1.4
4.4 ±2.6
5.2 ±0.6
Page 97
12
10
8
6
4
2
0
Coo
rdin
atio
n N
umbe
r (H
CP
pack
ing)
86420Cluster Order
252015105Cluster Diameter (Å)
1NN 2NN 3NN 4NN 5NN 6NN
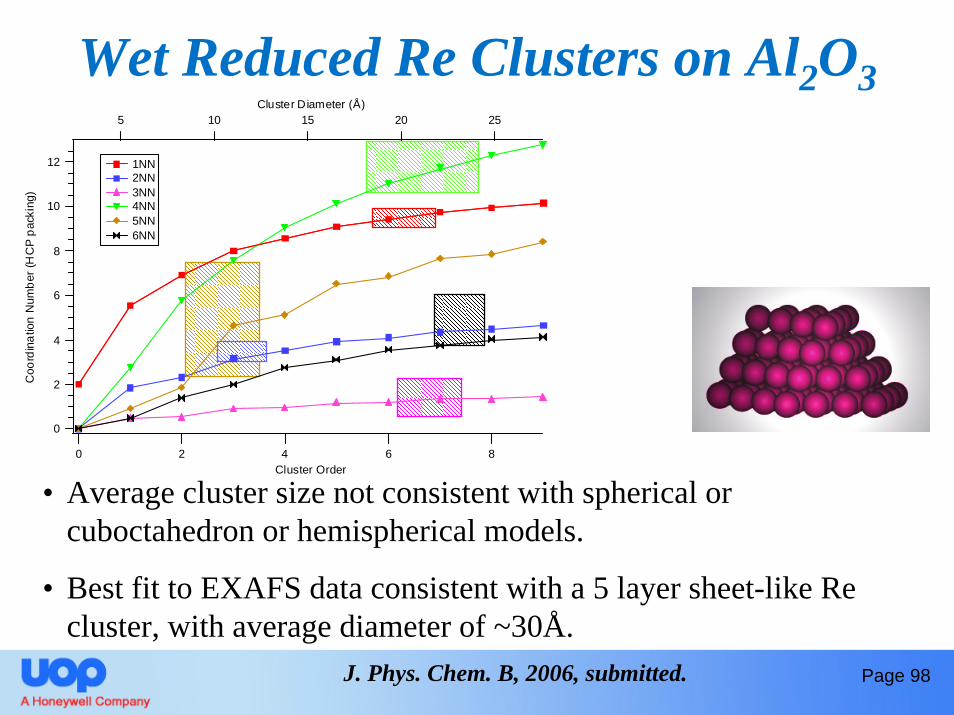
Wet Reduced Re Clusters on Al2O3
• Average cluster size not consistent with spherical or cuboctahedron or hemispherical models.
• Best fit to EXAFS data consistent with a 5 layer sheet-like Re cluster, with average diameter of ~30Å.
J. Phys. Chem. B, 2006, submitted. Page 98
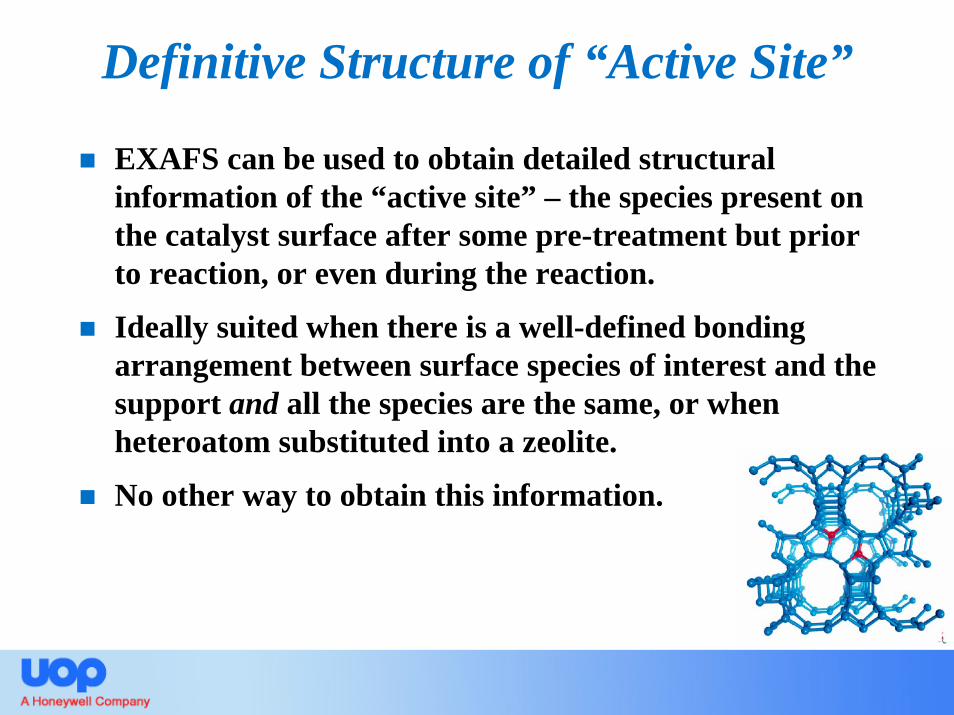
Definitive Structure of “Active Site”
EXAFS can be used to obtain detailed structural information of the “active site” – the species present on the catalyst surface after some pre-treatment but prior to reaction, or even during the reaction.
Ideally suited when there is a well-defined bonding arrangement between surface species of interest and the support and all the species are the same, or when heteroatom substituted into a zeolite.
No other way to obtain this information.
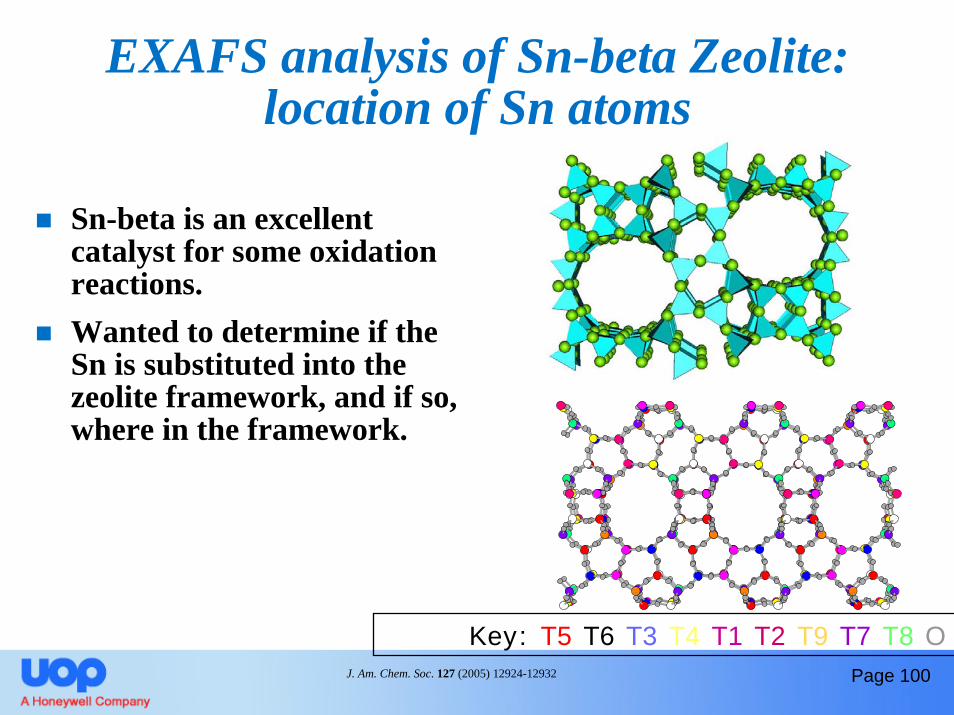
EXAFS analysis of Sn-beta Zeolite: location of Sn atoms
Sn-beta is an excellent catalyst for some oxidation reactions.Wanted to determine if the Sn is substituted into the zeolite framework, and if so, where in the framework.
J. Am. Chem. Soc. 127 (2005) 12924-12932
Key: T5 T6 T3 T4 T1 T2 T9 T7 T8 OPage 100
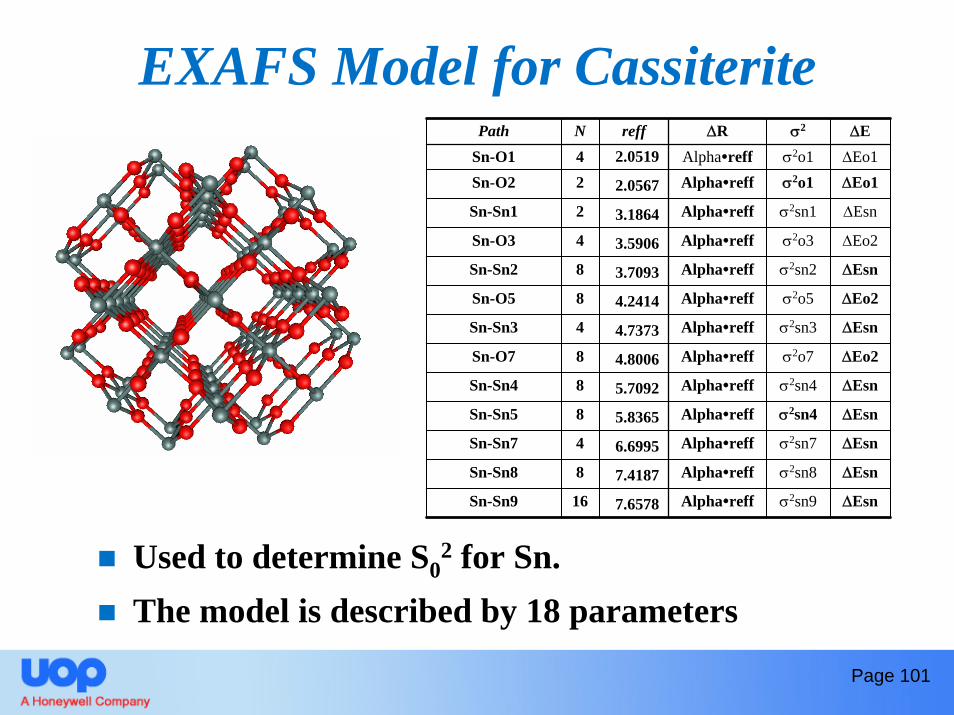
EXAFS Model for Cassiterite
Used to determine S02 for Sn.
The model is described by 18 parameters
Path N reff ΔR σ2 ΔESn-O1 4 2.0519 Alpha∙reff σ2o1 ΔEo1Sn-O2 2 2.0567 Alpha∙reff σ2o1 ΔEo1
Sn-Sn1 2 3.1864 Alpha∙reff σ2sn1 ΔEsn
Sn-O3 4 3.5906 Alpha∙reff σ2o3 ΔEo2
Sn-Sn2 8 3.7093 Alpha∙reff σ2sn2 ΔEsn
Sn-O5 8 4.2414 Alpha∙reff σ2o5 ΔEo2
Sn-Sn3 4 4.7373 Alpha∙reff σ2sn3 ΔEsn
Sn-O7 8 4.8006 Alpha∙reff σ2o7 ΔEo2
Sn-Sn4 8 5.7092 Alpha∙reff σ2sn4 ΔEsn
Sn-Sn5 8 5.8365 Alpha∙reff σ2sn4 ΔEsn
Sn-Sn7 4 6.6995 Alpha∙reff σ2sn7 ΔEsn
Sn-Sn8 8 7.4187 Alpha∙reff σ2sn8 ΔEsn
Sn-Sn9 16 7.6578 Alpha∙reff σ2sn9 ΔEsn
Page 101
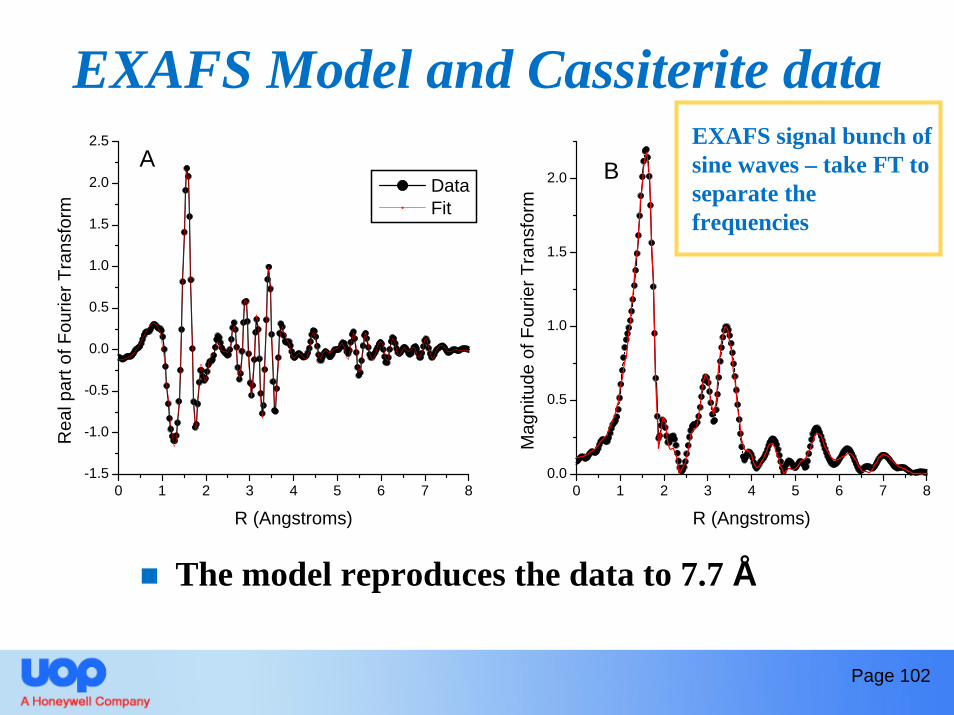
EXAFS Model and Cassiterite data
The model reproduces the data to 7.7 Å
0 1 2 3 4 5 6 7 8-1.5
-1.0
-0.5
0.0
0.5
1.0
1.5
2.0
2.5
0 1 2 3 4 5 6 7 80.0
0.5
1.0
1.5
2.0A
Rea
l par
t of F
ourie
r Tra
nsfo
rm
R (Angstroms)
Data Fit
B
Mag
nitu
de o
f Fou
rier T
rans
form
R (Angstroms)
EXAFS signal bunch of sine waves – take FT to separate the frequencies
Page 102
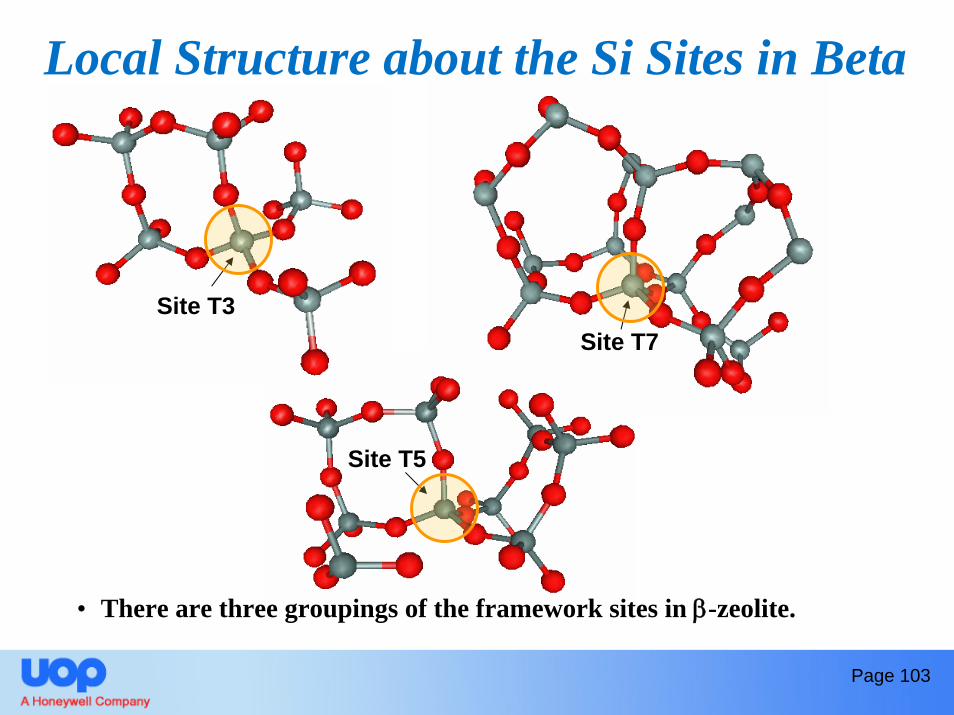
Site T3Site T7
Site T5
Local Structure about the Si Sites in Beta
• There are three groupings of the framework sites in β-zeolite.
Page 103
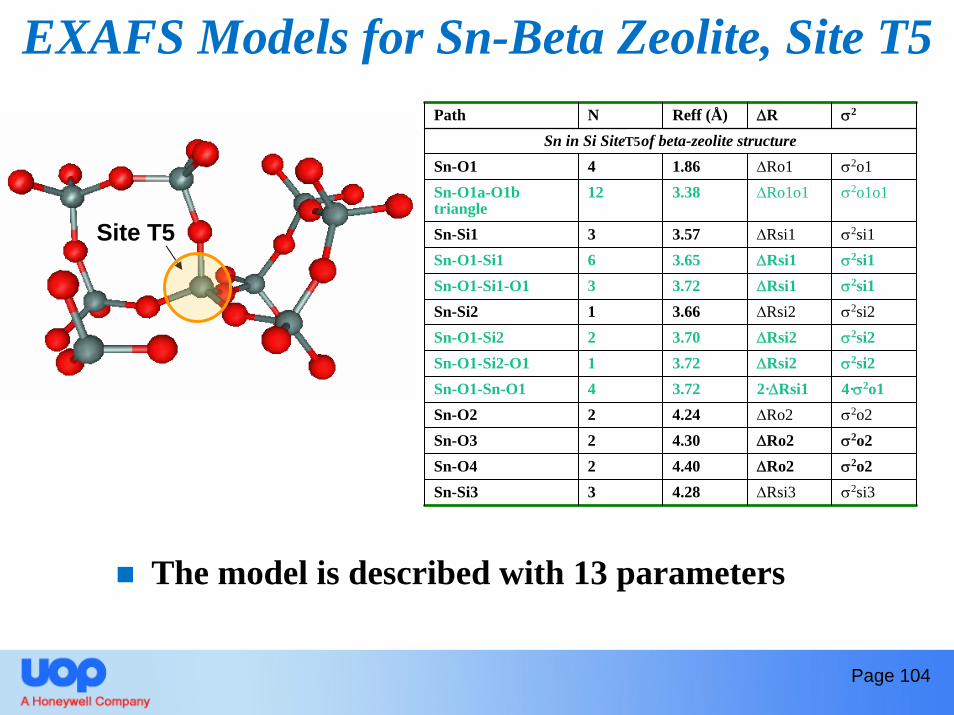
EXAFS Models for Sn-Beta Zeolite, Site T5
The model is described with 13 parameters
Path N Reff (Å) ΔR σ2
Sn in Si Site 1 of beta-zeolite structureSn-O1 4 1.86 ΔRo1 σ2o1Sn-O1a-O1b triangle
12 3.38 ΔRo1o1 σ2o1o1
Sn-Si1 3 3.57 ΔRsi1 σ2si1Sn-O1-Si1 6 3.65 ΔRsi1 σ2si1Sn-O1-Si1-O1 3 3.72 ΔRsi1 σ2si1Sn-Si2 1 3.66 ΔRsi2 σ2si2Sn-O1-Si2 2 3.70 ΔRsi2 σ2si2Sn-O1-Si2-O1 1 3.72 ΔRsi2 σ2si2Sn-O1-Sn-O1 4 3.72 2·ΔRsi1 4·σ2o1Sn-O2 2 4.24 ΔRo2 σ2o2Sn-O3 2 4.30 ΔRo2 σ2o2Sn-O4 2 4.40 ΔRo2 σ2o2Sn-Si3 3 4.28 ΔRsi3 σ2si3
Site T5
T5
Page 104
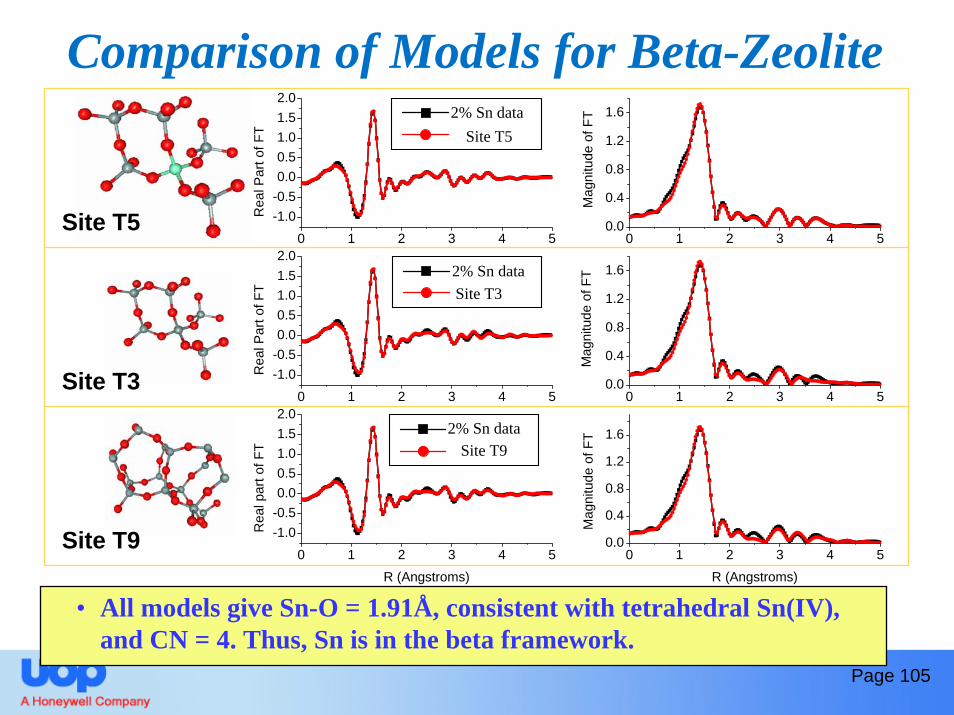
Comparison of Models for Beta-Zeolite
Site T5
Site T3
Site T9
0 1 2 3 4 5-1.0-0.50.00.51.01.52.0
0 1 2 3 4 50.0
0.4
0.8
1.2
1.6
0 1 2 3 4 5
-1.0-0.50.00.51.01.52.0
0 1 2 3 4 50.0
0.4
0.8
1.2
1.6
0 1 2 3 4 5
-1.0-0.50.00.51.01.52.0
0 1 2 3 4 50.0
0.4
0.8
1.2
1.6
Rea
l Par
t of F
T
2wet data site 1
Rea
l Par
t of F
T 2wet data site 3
Rea
l par
t of F
T
R (Angstroms)
2wet data site 7
Mag
nitu
de o
f FT
Mag
nitu
de o
f FT
Mag
nitu
de o
f FT
R (Angstroms)
2% Sn dataSite T3
2% Sn dataSite T9
2% Sn dataSite T5
• All models give Sn-O = 1.91Å, consistent with tetrahedral Sn(IV), and CN = 4. Thus, Sn is in the beta framework.
Page 105
Page 106
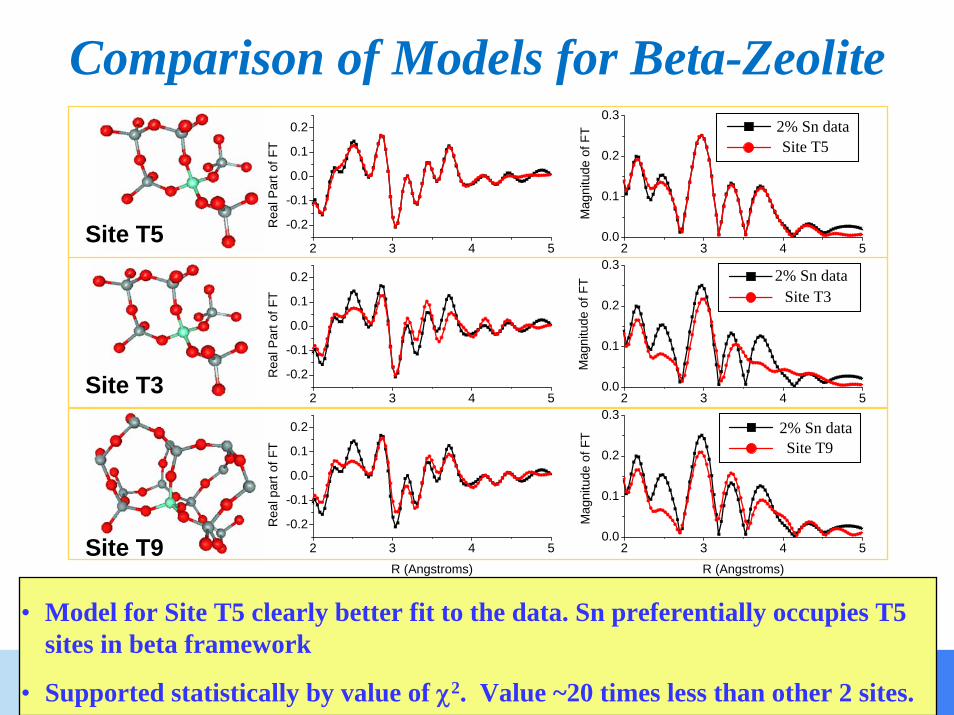
Comparison of Models for Beta-Zeolite
Site T5
Site T3
Site T9
2 3 4 5
-0.2
-0.1
0.0
0.1
0.2
2 3 4 50.0
0.1
0.2
0.3
2 3 4 5
-0.2
-0.1
0.0
0.1
0.2
2 3 4 50.0
0.1
0.2
0.3
2 3 4 5
-0.2
-0.1
0.0
0.1
0.2
2 3 4 50.0
0.1
0.2
0.3
Rea
l Par
t of F
T
2wet data site 1
Rea
l Par
t of F
T 2wet data site 3
Rea
l par
t of F
T
R (Angstroms)
2wet data site 7
Mag
nitu
de o
f FT
Mag
nitu
de o
f FT
Mag
nitu
de o
f FT
R (Angstroms)
2% Sn dataSite T5
2% Sn dataSite T3
Site T92% Sn data
• Model for Site T5 clearly better fit to the data. Sn preferentially occupies T5 sites in beta framework
• Supported statistically by value of χ2. Value ~20 times less than other 2 sites.
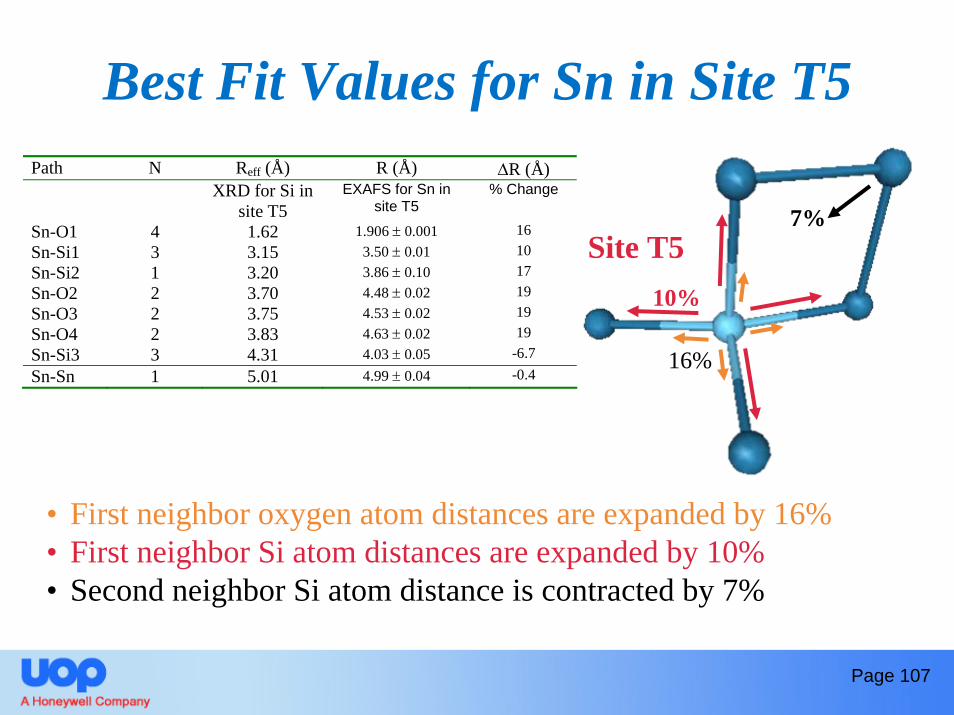
Best Fit Values for Sn in Site T5Path N Reff (Å) R (Å) ΔR (Å) XRD for Si in
site T5 EXAFS for Sn in
site T5 % Change
Sn-O1 4 1.62 1.906 ± 0.001 16 Sn-Si1 3 3.15 3.50 ± 0.01 10 Sn-Si2 1 3.20 3.86 ± 0.10 17 Sn-O2 2 3.70 4.48 ± 0.02 19 Sn-O3 2 3.75 4.53 ± 0.02 19 Sn-O4 2 3.83 4.63 ± 0.02 19 Sn-Si3 3 4.31 4.03 ± 0.05 -6.7 Sn-Sn 1 5.01 4.99 ± 0.04 -0.4
• First neighbor oxygen atom distances are expanded by 16%• First neighbor Si atom distances are expanded by 10%• Second neighbor Si atom distance is contracted by 7%
Site T510%
7%
16%
Page 107
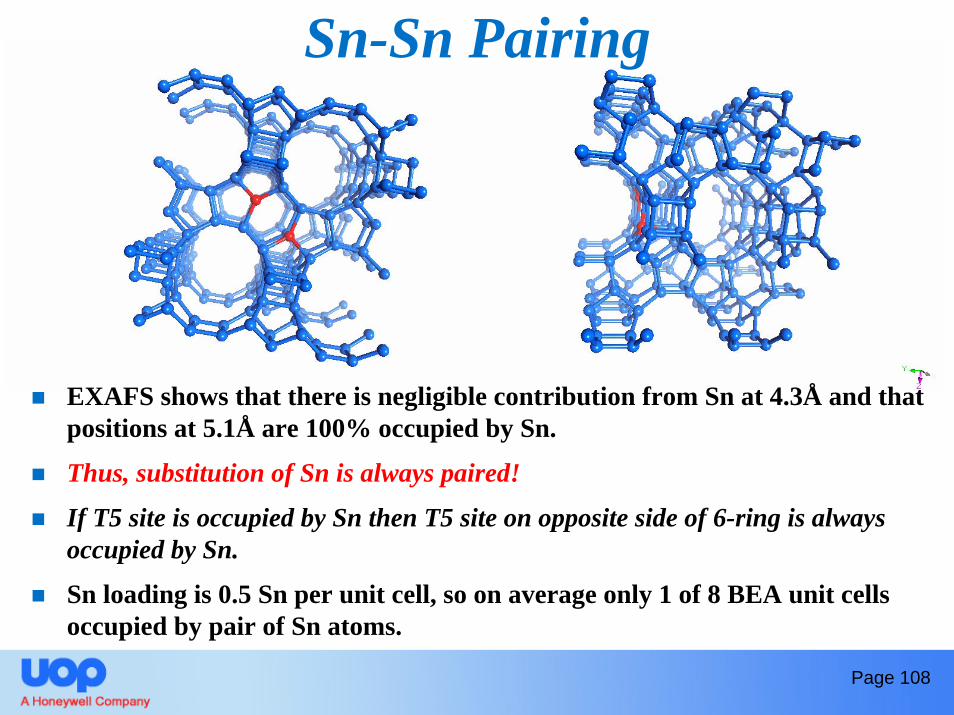
Sn-Sn Pairing
EXAFS shows that there is negligible contribution from Sn at 4.3Å and that positions at 5.1Å are 100% occupied by Sn.
Thus, substitution of Sn is always paired!
If T5 site is occupied by Sn then T5 site on opposite side of 6-ring is always occupied by Sn.
Sn loading is 0.5 Sn per unit cell, so on average only 1 of 8 BEA unit cells occupied by pair of Sn atoms.
Page 108
Summary: EXAFS
Provides quantitative element specific information on:– Distance to neighboring atoms (average bond length, Rj)– Coordination number and type of the neighboring atoms (Nj)– Mean-square disorder of neighboring atoms (σj
2)
Can be performed on all forms of matter.Can be performed on all elements (>H).Can be performed in situ.Can provide time-resolved, and spatially resolved information.
Page 109
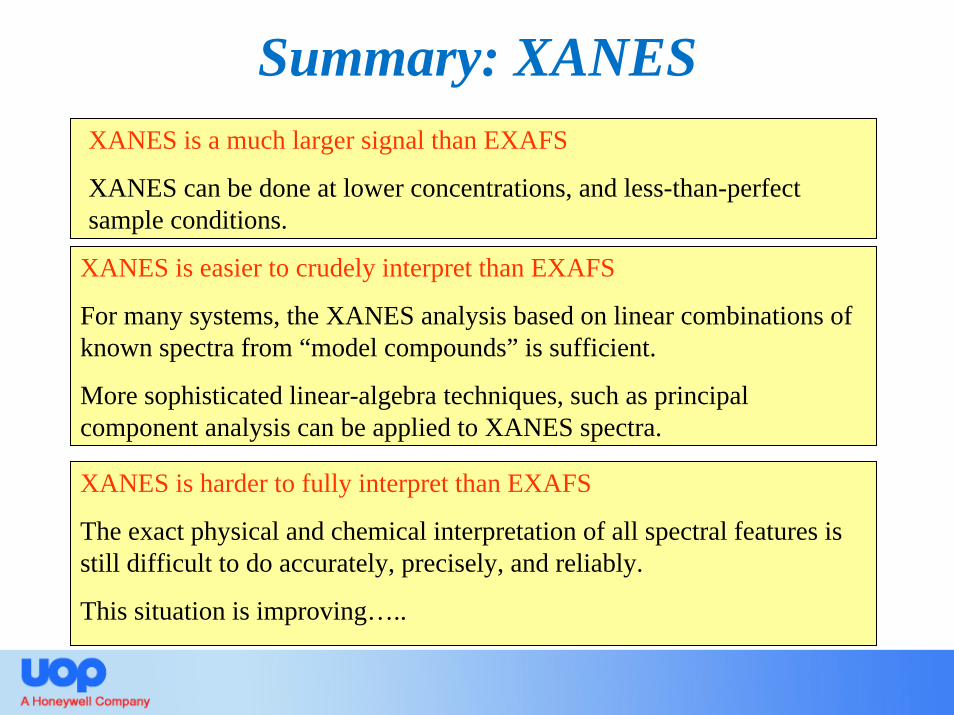
Summary: XANESXANES is a much larger signal than EXAFS
XANES can be done at lower concentrations, and less-than-perfect sample conditions.
XANES is easier to crudely interpret than EXAFS
For many systems, the XANES analysis based on linear combinations of known spectra from “model compounds” is sufficient.
More sophisticated linear-algebra techniques, such as principal component analysis can be applied to XANES spectra.
XANES is harder to fully interpret than EXAFS
The exact physical and chemical interpretation of all spectral features is still difficult to do accurately, precisely, and reliably.
This situation is improving…..
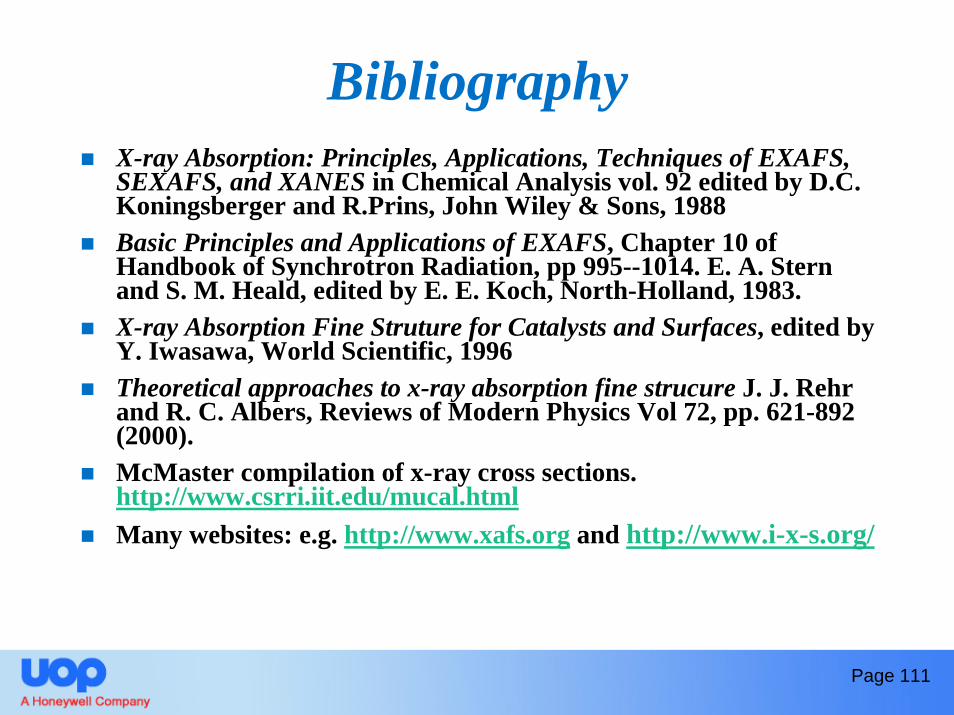
BibliographyX-ray Absorption: Principles, Applications, Techniques of EXAFS, SEXAFS, and XANES in Chemical Analysis vol. 92 edited by D.C. Koningsberger and R.Prins, John Wiley & Sons, 1988Basic Principles and Applications of EXAFS, Chapter 10 of Handbook of Synchrotron Radiation, pp 995--1014. E. A. Stern and S. M. Heald, edited by E. E. Koch, North-Holland, 1983. X-ray Absorption Fine Struture for Catalysts and Surfaces, edited by Y. Iwasawa, World Scientific, 1996Theoretical approaches to x-ray absorption fine strucure J. J. Rehr and R. C. Albers, Reviews of Modern Physics Vol 72, pp. 621-892 (2000). McMaster compilation of x-ray cross sections. http://www.csrri.iit.edu/mucal.htmlMany websites: e.g. http://www.xafs.org and http://www.i-x-s.org/
Page 111

Additional Slides
Page 112
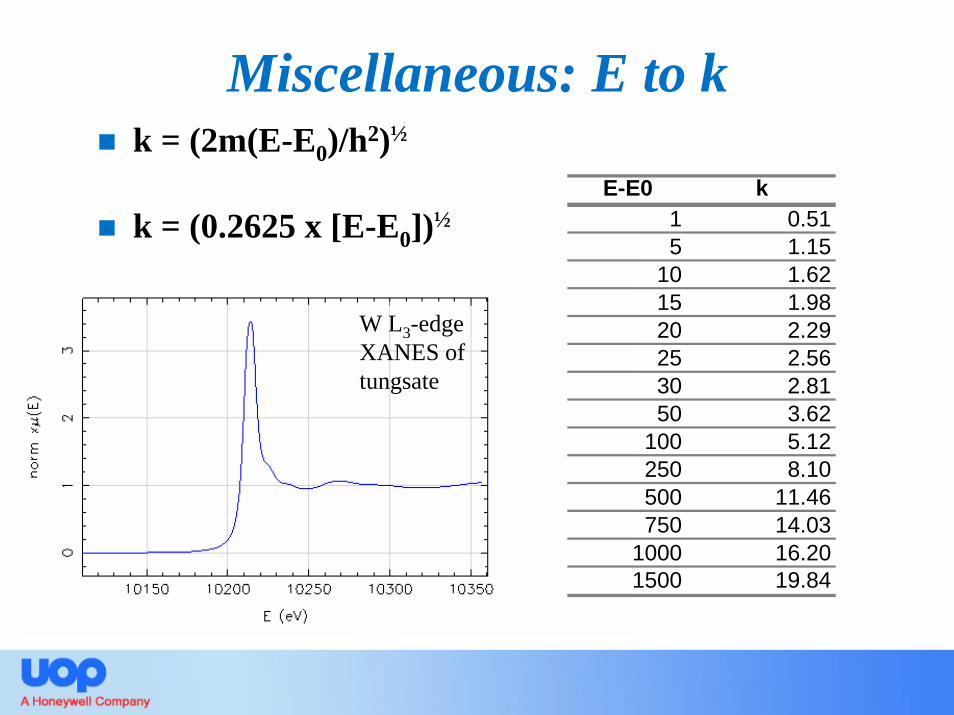
W L3-edge XANES of tungsate
k = (2m(E-E0)/h2)½
k = (0.2625 x [E-E0])½E-E0 k
1 0.515 1.15
10 1.6215 1.9820 2.2925 2.5630 2.8150 3.62
100 5.12250 8.10500 11.46750 14.03
1000 16.201500 19.84
Miscellaneous: E to k
Miscellaneous: “Yellow book”
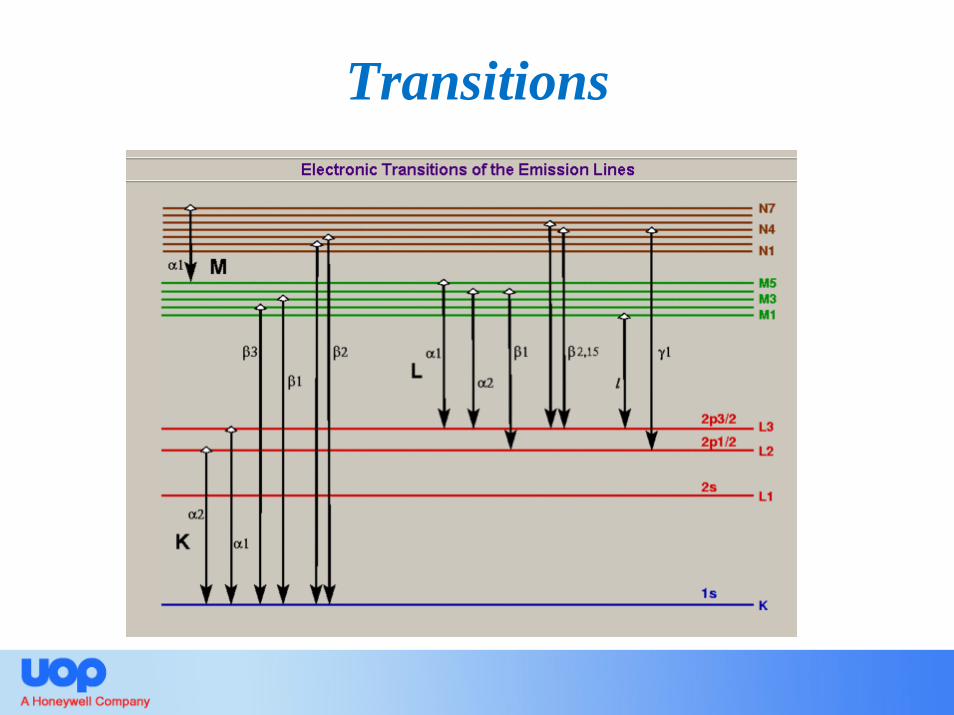
Transitions
Energy ResolutionDepends on divergence and intrinsic resolution.From derivative of Bragg equation, divergence results in: ΔE/E = cot(θ)ΔθΔθ determined by slits (or collimating mirror if present).
Example: 1mm slit 30m from source at 10 keV with Si(111) monochromator
Δθ = 1/30000 = 3.3x10⁻⁵, θ = 11.4 or cot(θ) = 4.9From divergence: ΔE/E = 3.3x10⁻⁵(4.9) = 1.6 x 10⁻⁴
Add divergence term and intrinsic term in quadrature to get approximate final resolution:
ΔE/E = √(1.6x10⁻⁴)2 + (1.3x10⁻⁴)2 = 2.1x10⁻⁴ or 2.1 eV
Page 116

![Hydrogen-Evolution Catalysts Based on Non-Noble Metal ... · cial processes unattractive. Several non-noble metal materi-als, such as transition-metal chalcogenides,[2] carbides,[3]](https://static.fdocuments.net/doc/165x107/5d1f5e3088c993ce268cad2c/hydrogen-evolution-catalysts-based-on-non-noble-metal-cial-processes-unattractive.jpg)