INTERNATIONAL JOURNAL OF ELECTRICAL E ... OF SVC...from Jaisalmer to load centers, 2 nos. 400 kV...
20
International Journal of Electrical Engineering and Technology (IJEET), ISSN 0976 – 6545(Print), ISSN 0976 – 6553(Online) Volume 4, Issue 3, May - June (2013), © IAEME 95 APPLICATION OF SVC FOR VOLTAGE CONTROL IN WIND FARM POWER SYSTEM Dr. M. P. Sharma Devandra Saini AEN, RVPNL, Jaipur Asst. Prof., EE Deptt., SIT, Jaipur Swati Harsh Sarfaraz Nawaz Asst. Prof., EE Deptt.,AICE, Jaipur Associate Prof. Deptt., SKIT, Jaipur ABSTRACT Most of wind power plants are installed far away from load centers, hence require long EHV transmission lines for evacuation system for pooling the power and transmitting to far off load centers. Wind Power Generation is infirm and variable subject to vagaries of nature. Due to large variations in wind power generation, power flows on transmission lines are also vary and accordingly there is a wide variation in power transmission system voltage from minimum 0.8 pu to maximum 1.20 pu. Due to low & high power system voltages, transmission lines are tripped resulting constrained in wind power evacuation. In this paper Static Var Compensator is proposed at wind power plants penetrated power system. In this paper simulation studies have been carried out to validate the effectiveness of the SVC for voltage control with the variation in wind power generation. Case studies are carried out on 18-bus Rajasthan power system to demonstrate the performance of the SVC during high and low wind power generation conditions. Wind power plants penetrated part of Rajasthan power system has been modeled using Mi-Power power system analysis software designed by the M/s PRDC Bangalore. Results of tests conducted on the model system in various possible field conditions are presented and discussed. I. INTRODUCTION In Rajasthan, most of wind power plants are concentrated in western part i.e. Jaisalmer which is far away from load centers. As on 31-3-2013, total 2140 MW capacity wind power plants are installed in Jaisalmer area. For evacuation of wind power generation from Jaisalmer to load centers, 2 nos. 400 kV lines, 3 nos. 220 kV lines & 2 nos. 132 kV lines INTERNATIONAL JOURNAL OF ELECTRICAL ENGINEERING & TECHNOLOGY (IJEET) ISSN 0976 – 6545(Print) ISSN 0976 – 6553(Online) Volume 4, Issue 3, May - June (2013), pp. 95-114 © IAEME: www.iaeme.com/ijeet.asp Journal Impact Factor (2013): 5.5028 (Calculated by GISI) www.jifactor.com IJEET © I A E M E
Transcript of INTERNATIONAL JOURNAL OF ELECTRICAL E ... OF SVC...from Jaisalmer to load centers, 2 nos. 400 kV...
International Journal of Electrical Engineering and Technology (IJEET), ISSN 0976 –
6545(Print), ISSN 0976 – 6553(Online) Volume 4, Issue 3, May - June (2013), © IAEME
95
APPLICATION OF SVC FOR VOLTAGE CONTROL IN WIND FARM
POWER SYSTEM
Dr. M. P. Sharma Devandra Saini
AEN, RVPNL, Jaipur Asst. Prof., EE Deptt., SIT, Jaipur
Swati Harsh Sarfaraz Nawaz Asst. Prof., EE Deptt.,AICE, Jaipur Associate Prof. Deptt., SKIT, Jaipur
ABSTRACT
Most of wind power plants are installed far away from load centers, hence require
long EHV transmission lines for evacuation system for pooling the power and transmitting to
far off load centers. Wind Power Generation is infirm and variable subject to vagaries of
nature. Due to large variations in wind power generation, power flows on transmission lines
are also vary and accordingly there is a wide variation in power transmission system voltage
from minimum 0.8 pu to maximum 1.20 pu. Due to low & high power system voltages,
transmission lines are tripped resulting constrained in wind power evacuation. In this paper
Static Var Compensator is proposed at wind power plants penetrated power system. In this
paper simulation studies have been carried out to validate the effectiveness of the SVC for
voltage control with the variation in wind power generation. Case studies are carried out on
18-bus Rajasthan power system to demonstrate the performance of the SVC during high and
low wind power generation conditions. Wind power plants penetrated part of Rajasthan
power system has been modeled using Mi-Power power system analysis software designed
by the M/s PRDC Bangalore. Results of tests conducted on the model system in various
possible field conditions are presented and discussed.
I. INTRODUCTION
In Rajasthan, most of wind power plants are concentrated in western part i.e.
Jaisalmer which is far away from load centers. As on 31-3-2013, total 2140 MW capacity
wind power plants are installed in Jaisalmer area. For evacuation of wind power generation
from Jaisalmer to load centers, 2 nos. 400 kV lines, 3 nos. 220 kV lines & 2 nos. 132 kV lines
INTERNATIONAL JOURNAL OF ELECTRICAL ENGINEERING
& TECHNOLOGY (IJEET)
ISSN 0976 – 6545(Print) ISSN 0976 – 6553(Online) Volume 4, Issue 3, May - June (2013), pp. 95-114
© IAEME: www.iaeme.com/ijeet.asp Journal Impact Factor (2013): 5.5028 (Calculated by GISI) www.jifactor.com
IJEET
© I A E M E

International Journal of Electrical Engineering and Technology (IJEET), ISSN 0976 –
6545(Print), ISSN 0976 – 6553(Online) Volume 4, Issue 3, May - June (2013), © IAEME
96
have been constructed. There is a huge variations in wind generation i.e. variation is from
zero to maximum generation. Variation in wind power generation on typical days is shown in
following figures:-
Fig-1: HOURLY AVERAGE WIND GENERATION for 15 March, 2013
Fig-2: HOURLY AVERAGE WIND GENERATION for 23 March, 2013

International Journal of Electrical Engineering and Technology (IJEET), ISSN 0976 –
6545(Print), ISSN 0976 – 6553(Online) Volume 4, Issue 3, May - June (2013), © IAEME
97
Fig-3: HOURLY AVERAGE WIND GENERATION for 10 April,2013
Fig-4: HOURLY AVERAGE WIND GENERATION for 15 April, 2013

International Journal of Electrical Engineering and Technology (IJEET), ISSN 0976 –
6545(Print), ISSN 0976 – 6553(Online) Volume 4, Issue 3, May - June (2013), © IAEME
98
Due to variation in wind power generation, power transmission voltage is fluctuated. Voltage
fluctuations are mainly due to
� Long EHV transmission lines
� Lack of load in western Rajasthan
� Erratic variation in generation pattern
� Wind Generators do not provide the required VAR support
Over-voltage causes over-fluxing in transformers resulting in tripping of transformers. Due to
over voltages, transmission lines also tripped. With the help of FACTS devices, it is possible
to regulate power system voltage with the variation of wind power generation.
II. SVC AND POWER SYSTEM V-I CHARACTERISTICS
SVC V-I Characteristic
SVC composed of a controllable reactor and a fixed capacitor. The composite
characteristic of SVC is derived by adding the individual characteristics of the components.
SVC are defined by the slope reactance when the controlled voltage is within the control
range.
Fig 5: SVC V-I characteristics
The V-I characteristics are described by the following three equations:
Within control range (-Icmax ≤ Isvc ≤ ILmax )
V = Vref + XsL Isvc
When V<Vmin , the SVC will reach its capacitive limit
B= -Bcmax
When Isvc>ILmax , the SVC will reach its inductive limit
B= BLmax
International Journal of Electrical Engineering and Technology (IJEET), ISSN 0976 –
6545(Print), ISSN 0976 – 6553(Online) Volume 4, Issue 3, May - June (2013), © IAEME
99
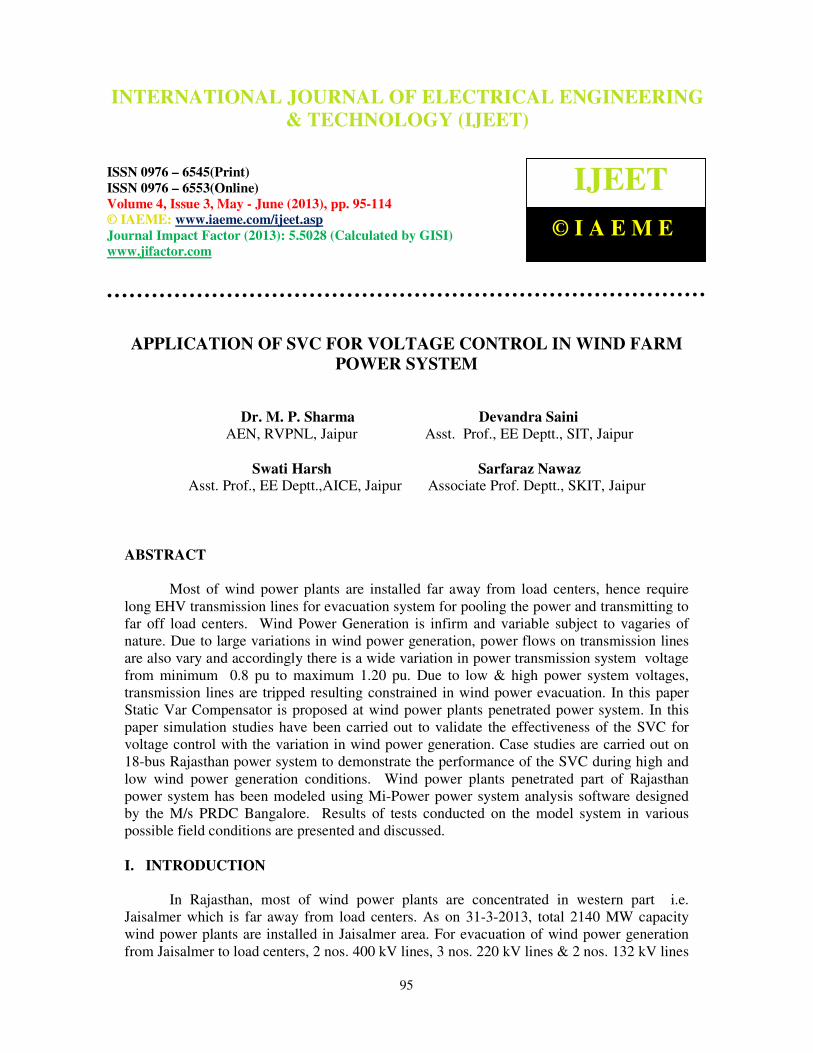
Power System V-I Characteristic
The system V-I characteristic is determined by considering the Thevenin equivalent
circuit as viewed from the bus whose voltage is to be regulated by the SVC. The Thevenin
impedance in Fig-6 is predominantly an inductive reactance. The corresponding bus voltage
versus reactive current characteristic is shown in fig-7. Bus voltage increases linearly with
capacitive current injection at bus and decreases linearly with inductive current injection at
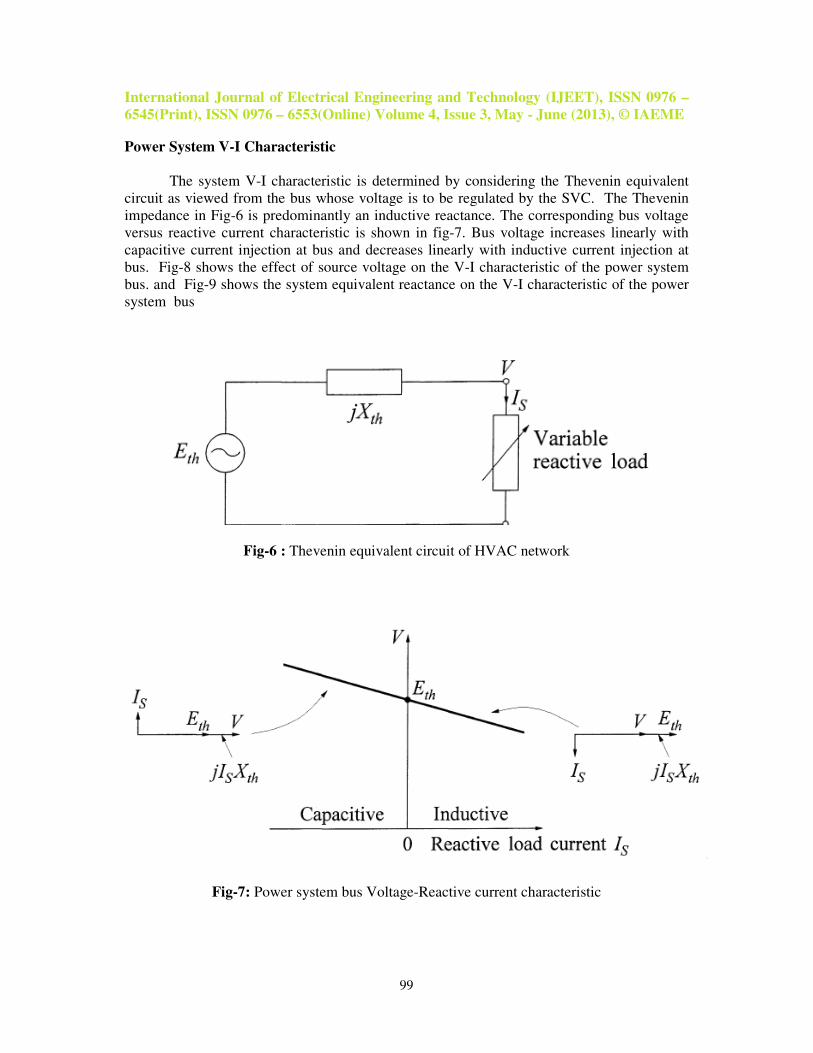
bus. Fig-8 shows the effect of source voltage on the V-I characteristic of the power system
bus. and Fig-9 shows the system equivalent reactance on the V-I characteristic of the power
system bus
Fig-6 : Thevenin equivalent circuit of HVAC network
Fig-7: Power system bus Voltage-Reactive current characteristic
International Journal of Electrical Engineering and Technology (IJEET), ISSN 0976 –
6545(Print), ISSN 0976 – 6553(Online) Volume 4, Issue 3, May - June (2013), © IAEME
100
Fig-8: Effect of varying source voltage on V-I characteristic of power system bus
Fig-9: Effect of varying system reactance on V-I characteristic of power system bus
Composite SVC-Power System V-I Characteristic
The system characteristic may be expressed as
V = Eth – Xth Is
Where
V = Power system bus voltage
Is = Bus load current
Eth = Source voltage
Xth = System Thevenin reactance
For inductive load current Is is positive and for capacitive load current Is is negative.
International Journal of Electrical Engineering and Technology (IJEET), ISSN 0976 –
6545(Print), ISSN 0976 – 6553(Online) Volume 4, Issue 3, May - June (2013), © IAEME
101
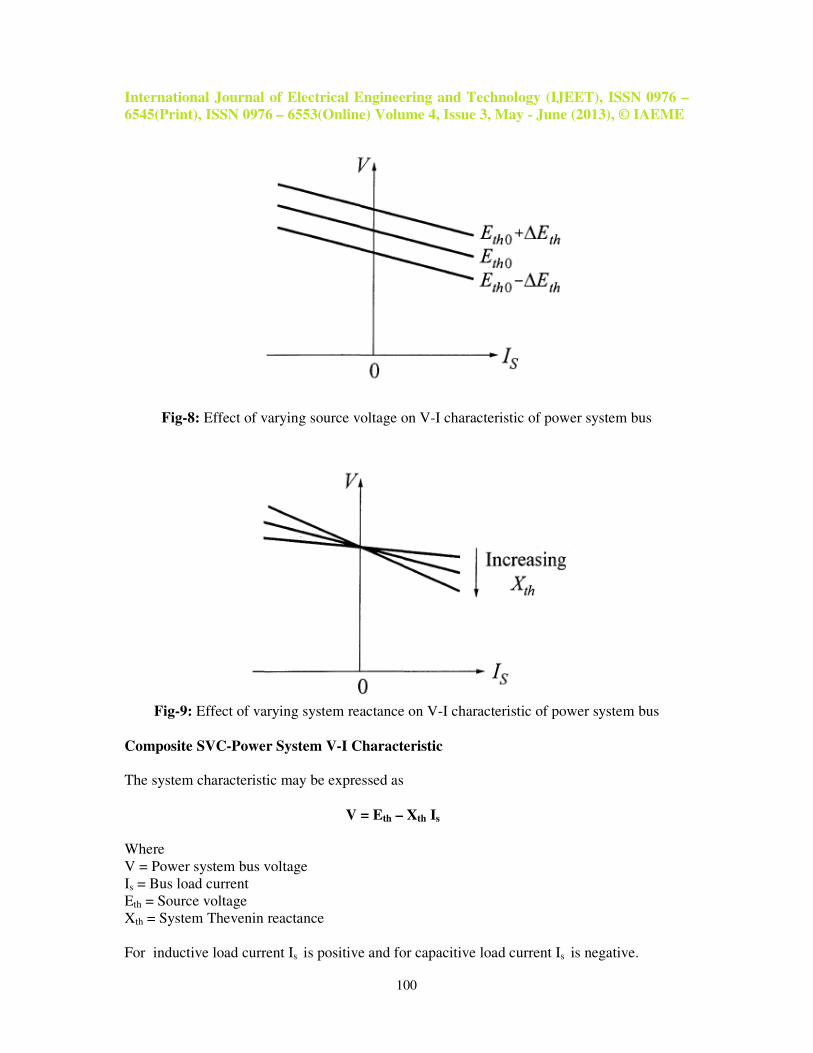
The SVC characteristic may be expressed as
V = V0 + XSL Is Where
V = Power system bus voltage
Is = SVC current
Vo = SVC reference voltage where net SVC current is zero
XSL = SVC slope reactance
For inductive SVC current Is is positive and for capacitive SVC current Is is
negative. For voltage outside the control range, the ratio V/Is is determined by the ratings of
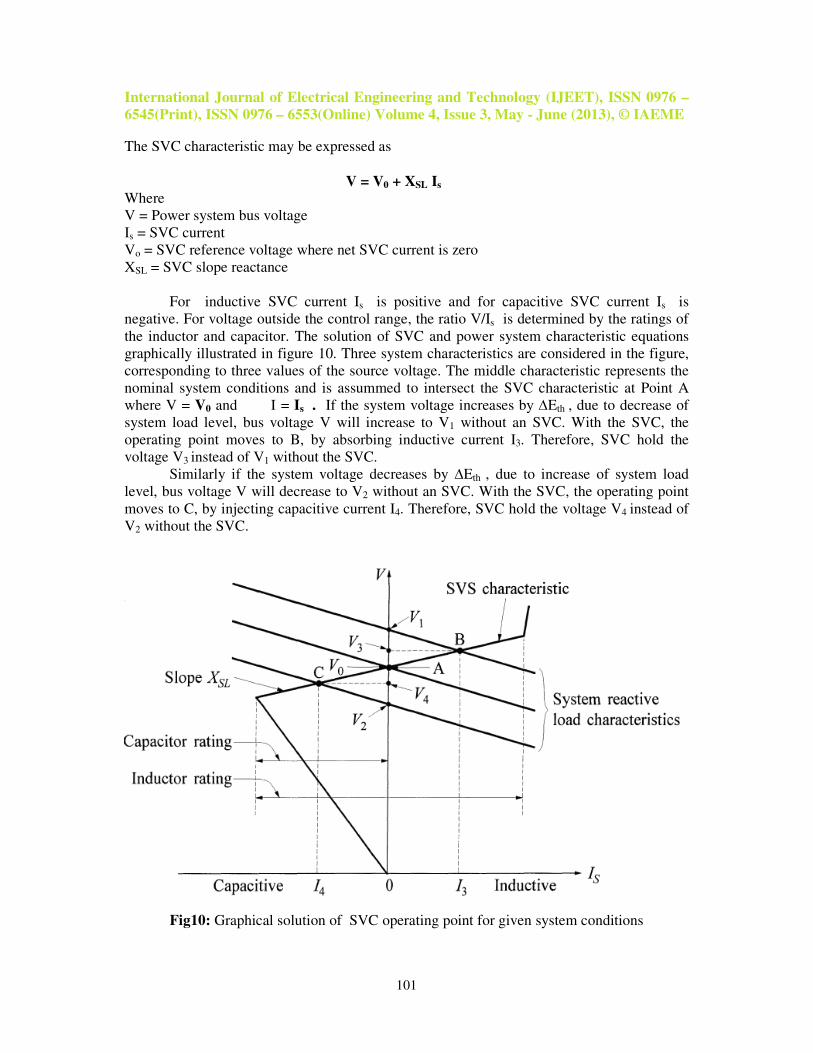
the inductor and capacitor. The solution of SVC and power system characteristic equations
graphically illustrated in figure 10. Three system characteristics are considered in the figure,
corresponding to three values of the source voltage. The middle characteristic represents the
nominal system conditions and is assummed to intersect the SVC characteristic at Point A
where V = V0 and I = Is . If the system voltage increases by ∆Eth , due to decrease of
system load level, bus voltage V will increase to V1 without an SVC. With the SVC, the
operating point moves to B, by absorbing inductive current I3. Therefore, SVC hold the
voltage V3 instead of V1 without the SVC.
Similarly if the system voltage decreases by ∆Eth , due to increase of system load
level, bus voltage V will decrease to V2 without an SVC. With the SVC, the operating point
moves to C, by injecting capacitive current I4. Therefore, SVC hold the voltage V4 instead of
V2 without the SVC.
Fig10: Graphical solution of SVC operating point for given system conditions

International Journal of Electrical Engineering and Technology (IJEET), ISSN 0976 –
6545(Print), ISSN 0976 – 6553(Online) Volume 4, Issue 3, May - June (2013), © IAEME
102
III. RESPONSE OF SVC DURING LOW VOLTAGE AND HIGH WIND POWER
GENERATION CONDITION
SVC of (+)150/(-)150 MVAR capacity is connected at 400 kV GSS Jaisalmer through
400/33 kV transformer (Bus-19). Due to high wind power generation SVC reference voltage
is set to 1.10 PU. The slope of SVC is 0.09. The purpose of connecting SVC at Bus number
19 is to regulate the voltage at bus number 2 i.e. Jaisalmer 400 kV bus with the increase in
wind power generation. To demonstrate the effect of SVC on voltage and system losses, load
flow studies have been carried out without and with (+)150/(-)150 MVAR SVC at Bus-19 for
various wind power generation schedule. Following four cases have been considered in the
load flow studies:-
S.
No.
Particulars Connected
capacity of
wind power
plants (MW)
Net Wind Power Despatch (MW)
Case-1
(45 % of
IC)
Case-2
(55 % of
IC)
Case-3
(65 % of
IC)
Case-4
(75 % of IC)
1 400 kV GSS
Jaisalmer
1340 603 737 871 1005
2 220 kV GSS
Amarsagar
760 342 408 494 570
3 132 kV GSS
Jaisalmer
40 18 22 26 30
Total 2140 963 1177 1391 1605
OUTPUT OF LOAD FLOW STUDIES
Case-1 : 45 % wind power generation of installed wind farms capacity
Power plots of load flow study without SVC at Bus-19 is placed at fig-11A and Power plots
of LFS with (+)150/(-)150 MVAR SVC at Bus-19 while other conditions remains unchanged
is placed at fig-11B.
Case-2: 55 % wind power generation of installed wind farms capacity
Power plots of load flow study without SVC at Bus-19 is placed at fig-12A and Power plots
of LFS with (+)150/(-)150 MVAR SVC at Bus-19 while other conditions remains unchanged
is placed at fig-12B.
Case-3: 65 % wind power generation of installed wind farms capacity
Power plots of load flow study without SVC at Bus-19 is placed at fig-13A and Power plots
of LFS with (+)150/(-)150 MVAR SVC at Bus-19 while other conditions remains unchanged
is placed at fig-13B.
International Journal of Electrical Engineering and Technology (IJEET), ISSN 0976 –
6545(Print), ISSN 0976 – 6553(Online) Volume 4, Issue 3, May - June (2013), © IAEME
103
Case-4: 75 % wind power generation of installed wind farms capacity
Power plots of load flow study without SVC at 400 kV GSS Jaisalmer is placed at fig-14A
and Power plots of LFS with (+)150/(-)150 MVAR SVC at Bus-19 while other conditions
remains unchanged is placed at fig-14B.
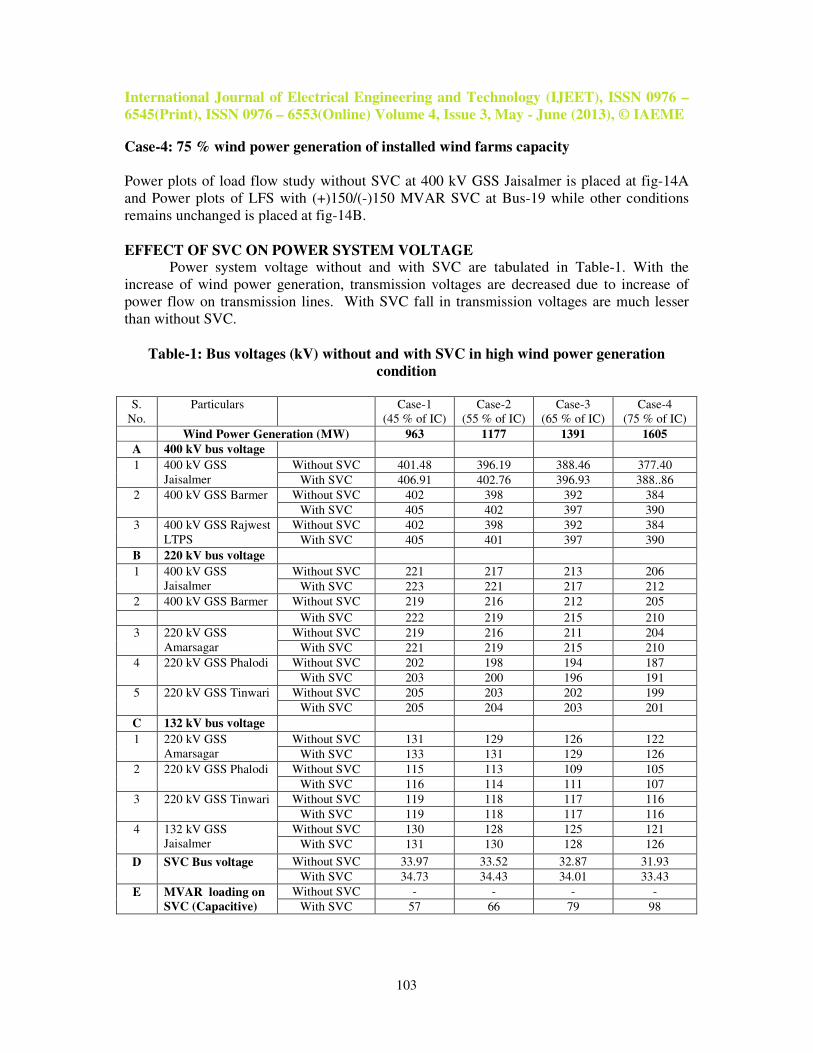
EFFECT OF SVC ON POWER SYSTEM VOLTAGE Power system voltage without and with SVC are tabulated in Table-1. With the
increase of wind power generation, transmission voltages are decreased due to increase of
power flow on transmission lines. With SVC fall in transmission voltages are much lesser
than without SVC.
Table-1: Bus voltages (kV) without and with SVC in high wind power generation
condition
S.
No.
Particulars Case-1
(45 % of IC)
Case-2
(55 % of IC)
Case-3
(65 % of IC)
Case-4
(75 % of IC)
Wind Power Generation (MW) 963 1177 1391 1605
A 400 kV bus voltage
1 400 kV GSS
Jaisalmer
Without SVC 401.48 396.19 388.46 377.40
With SVC 406.91 402.76 396.93 388..86
2 400 kV GSS Barmer Without SVC 402 398 392 384
With SVC 405 402 397 390
3 400 kV GSS Rajwest
LTPS
Without SVC 402 398 392 384
With SVC 405 401 397 390
B 220 kV bus voltage
1 400 kV GSS
Jaisalmer
Without SVC 221 217 213 206
With SVC 223 221 217 212
2 400 kV GSS Barmer Without SVC 219 216 212 205
With SVC 222 219 215 210
3 220 kV GSS
Amarsagar
Without SVC 219 216 211 204
With SVC 221 219 215 210
4 220 kV GSS Phalodi Without SVC 202 198 194 187
With SVC 203 200 196 191
5 220 kV GSS Tinwari Without SVC 205 203 202 199
With SVC 205 204 203 201
C 132 kV bus voltage
1 220 kV GSS
Amarsagar
Without SVC 131 129 126 122
With SVC 133 131 129 126
2 220 kV GSS Phalodi Without SVC 115 113 109 105
With SVC 116 114 111 107
3 220 kV GSS Tinwari Without SVC 119 118 117 116
With SVC 119 118 117 116
4 132 kV GSS
Jaisalmer
Without SVC 130 128 125 121
With SVC 131 130 128 126
D SVC Bus voltage Without SVC 33.97 33.52 32.87 31.93
With SVC 34.73 34.43 34.01 33.43
E MVAR loading on
SVC (Capacitive)
Without SVC - - - -
With SVC 57 66 79 98
International Journal of Electrical Engineering and Technology (IJEET), ISSN 0976 –
6545(Print), ISSN 0976 – 6553(Online) Volume 4, Issue 3, May - June (2013), © IAEME
104
EFFECT OF SVC ON POWER TRANSMISSION LOSSES
Power system voltage without and with SVC for various wind power generation schedules
are tabulated in Table-2.
Table-2: Power System Losses without and with SVC in high wind power generation
condition
S.
No.
Particulars Case-1
(45 % of
IC)
Case-2
(55 % of
IC)
Case-3
(65 % of
IC)
Case-4
(75 % of IC)
1 Wind Power
Generation
(MW)
963 1177 1391 1605
2 Without SVC
Losses (MW)
31.10 43.71 60.14 82.62
3 With SVC Losses
(MW)
30.63 42.88 58.30 78.06
Above tabulated data indicates that with SVC transmission losses are reduced due to increase
of system voltage and decrease of reactive power flow on transmission lines.
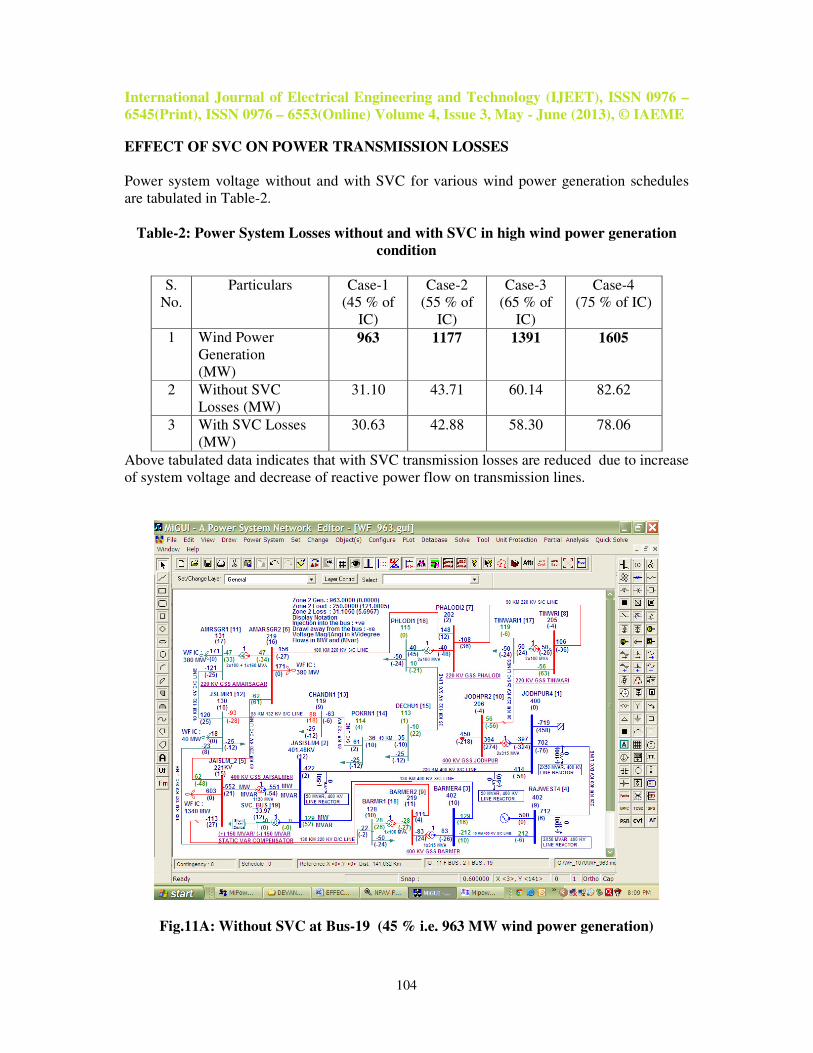
Fig.11A: Without SVC at Bus-19 (45 % i.e. 963 MW wind power generation)
International Journal of Electrical Engineering and Technology (IJEET), ISSN 0976 –
6545(Print), ISSN 0976 – 6553(Online) Volume 4, Issue 3, May - June (2013), © IAEME
105
Fig.11B: With (+) 150/(-)150 MVAR SVC at Bus-19 (45 % i.e. 963 MW wind power
generation)
Fig.12A: Without SVC at Bus-19 (55 % i.e. 1177 MW wind power generation)

International Journal of Electrical Engineering and Technology (IJEET), ISSN 0976 –
6545(Print), ISSN 0976 – 6553(Online) Volume 4, Issue 3, May - June (2013), © IAEME
106
Fig.12B: With (+) 150/(-)150 MVAR SVC at 400 kV GSS Jaisalmer (55 % i.e. 1177
MW wind power generation)
Fig.13A: Without SVC at Bus-19 (65 % i.e. 1391 MW wind power generation)

International Journal of Electrical Engineering and Technology (IJEET), ISSN 0976 –
6545(Print), ISSN 0976 – 6553(Online) Volume 4, Issue 3, May - June (2013), © IAEME
107
Fig.13B: With (+) 150/(-)150 MVAR SVC at Bus-19 (65 % i.e. 1391 MW wind power
generation)
Fig.14A: With SVC at Bus-19 (75 % i.e. 1605 MW wind power generation)

International Journal of Electrical Engineering and Technology (IJEET), ISSN 0976 –
6545(Print), ISSN 0976 – 6553(Online) Volume 4, Issue 3, May - June (2013), © IAEME
108
Fig.14B: With (+) 150/(-)150 MVAR SVC at Bus-19 (75 % i.e. 1605 MW wind power
generation)
Fig.15: Bus-2 Voltage without and with SVC with variation in wind power generation
International Journal of Electrical Engineering and Technology (IJEET), ISSN 0976 –
6545(Print), ISSN 0976 – 6553(Online) Volume 4, Issue 3, May - June (2013), © IAEME
109
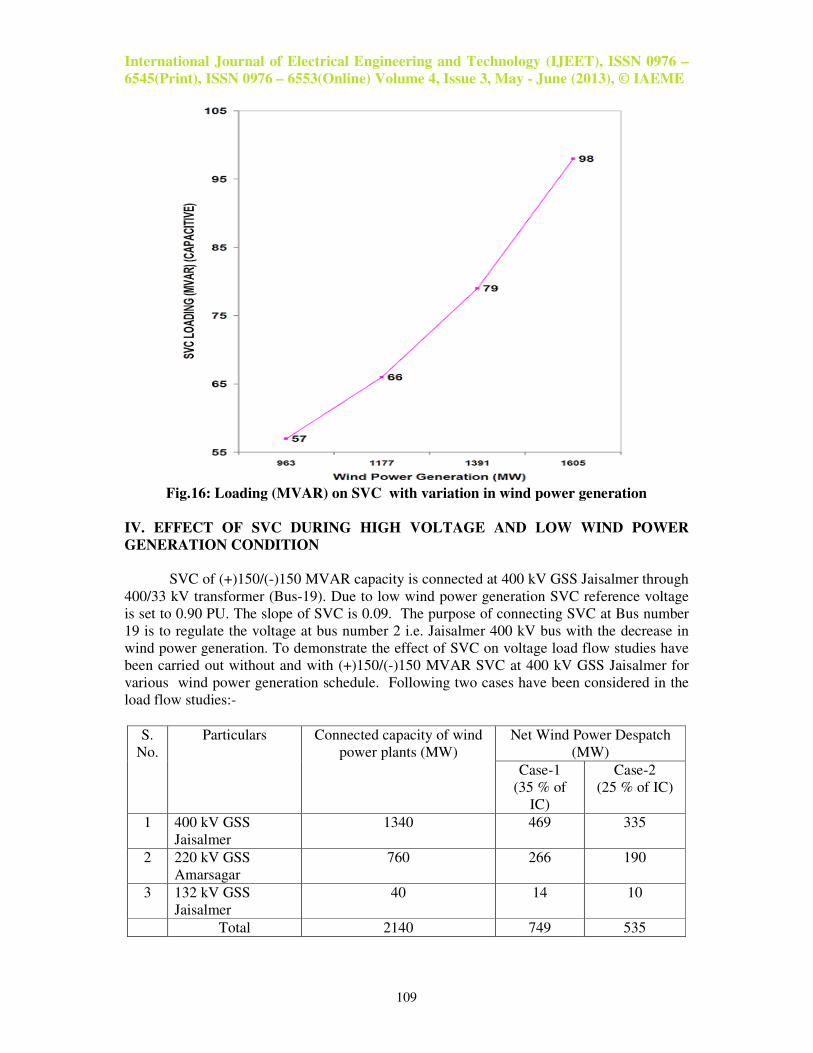
Fig.16: Loading (MVAR) on SVC with variation in wind power generation
IV. EFFECT OF SVC DURING HIGH VOLTAGE AND LOW WIND POWER
GENERATION CONDITION
SVC of (+)150/(-)150 MVAR capacity is connected at 400 kV GSS Jaisalmer through
400/33 kV transformer (Bus-19). Due to low wind power generation SVC reference voltage
is set to 0.90 PU. The slope of SVC is 0.09. The purpose of connecting SVC at Bus number
19 is to regulate the voltage at bus number 2 i.e. Jaisalmer 400 kV bus with the decrease in
wind power generation. To demonstrate the effect of SVC on voltage load flow studies have
been carried out without and with (+)150/(-)150 MVAR SVC at 400 kV GSS Jaisalmer for
various wind power generation schedule. Following two cases have been considered in the
load flow studies:-
S.
No.
Particulars Connected capacity of wind
power plants (MW)
Net Wind Power Despatch
(MW)
Case-1
(35 % of
IC)
Case-2
(25 % of IC)
1 400 kV GSS
Jaisalmer
1340 469 335
2 220 kV GSS
Amarsagar
760 266 190
3 132 kV GSS
Jaisalmer
40 14 10
Total 2140 749 535

International Journal of Electrical Engineering and Technology (IJEET), ISSN 0976 –
6545(Print), ISSN 0976 – 6553(Online) Volume 4, Issue 3, May - June (2013), © IAEME
110
OUTPUT OF LOAD FLOW STUDIES
Case-1 : 35 % wind power generation of installed wind farms capacity
Power plots of load flow study without SVC at Bus-19 is placed at fig-17A and Power plots of
LFS with (+)150/(-)150 MVAR SVC at Bus-19 while other conditions remains unchanged is
placed at fig-17B.
Case-2: 25 % wind power generation of installed wind farms capacity
Power plots of load flow study without SVC at Bus-19 is placed at fig-18A and Power plots of
LFS with (+)150/(-)150 MVAR SVC at Bus-19 while other conditions remains unchanged is
placed at fig-18B.
EFFECT OF SVC ON POWER SYSTEM VOLTAGE
Power system voltage without and with SVC are tabulated in Table-3. With the decrease
of wind power generation, transmission voltages are increased due to decrease of power flow on
transmission lines. With SVC rise in transmission voltages are less than without SVC.
Table-3 : Bus voltages (kV) without and with SVC in low wind power generation condition
S.
No.
Particulars Case-1
(35 % of IC)
Case-2
(25 % of IC)
Wind Power Generation (MW) 749 535
A 400 kV bus voltage
1 400 kV GSS Jaisalmer Without SVC 427.04 428.39
With SVC 412.80 414.14
2 400 kV GSS Barmer Without SVC 427 428
With SVC 419 420
3 400 kV GSS Rajwest LTPS Without SVC 426 428
With SVC 419 421
B 220 kV bus voltage
1 400 kV GSS Jaisalmer Without SVC 235 236
With SVC 228 228
2 400 kV GSS Barmer Without SVC 234 235
With SVC 228 229
3 220 kV GSS Amarsagar Without SVC 233 233
With SVC 226 227
4 220 kV GSS Phalodi Without SVC 218 219
With SVC 214 215
5 220 kV GSS Tinwari Without SVC 218 219
With SVC 217 218
C 132 kV bus voltage
1 220 kV GSS Amarsagar Without SVC 140 140
With SVC 136 136
2 220 kV GSS Phalodi Without SVC 125 126
With SVC 123 124
3 220 kV GSS Tinwari Without SVC 127 127
With SVC 126 127
4 132 kV GSS Jaisalmer Without SVC 139 139
With SVC 135 136
D SVC Bus voltage Without SVC 36.13 36.25
With SVC 34.11 34.21
E MVAR loading on SVC
(Inductive)
Without SVC - -
With SVC 158 161

International Journal of Electrical Engineering and Technology (IJEET), ISSN 0976 –
6545(Print), ISSN 0976 – 6553(Online) Volume 4, Issue 3, May - June (2013), © IAEME
111
Fig.17A: Without SVC at Bus-19 (35 % i.e. 749 MW wind power generation)
Fig.17B: With (+) 150/(-)150 MVAR SVC at Bus-19 (35 % i.e. 749 MW wind power
generation)

International Journal of Electrical Engineering and Technology (IJEET), ISSN 0976 –
6545(Print), ISSN 0976 – 6553(Online) Volume 4, Issue 3, May - June (2013), © IAEME
112
Fig.18A: Without SVC at Bus-19 (25 % i.e. 535 MW wind power generation)
Fig.18B: With (+) 150/(-)150 MVAR SVC at Bus-19 (25 % i.e. 535 MW wind power
generation)

International Journal of Electrical Engineering and Technology (IJEET), ISSN 0976 –
6545(Print), ISSN 0976 – 6553(Online) Volume 4, Issue 3, May - June (2013), © IAEME
113
V. CONCLUSION
Most of wind power plants are installed far away from load centers. Long EHV
transmission lines are being constructed for evacuation of wind power generation up to load
centers without planning reactive power management and voltage control. Reactive power
management using shunt reactors and shunt capacitors is not successful in wind power plants
penetrated power system due to large & sudden variation in wind power generation. SVC is
able to regulate the power transmission voltage with the variation in wind power generation.
With the help of Static Var Compensator high as well as low transmission voltages can be
controlled. During high power system voltage, SVC absorb reactive power and function as
shunt reactor and there is less rise in system voltage with SVC as compared to without SVC.
During low power system voltage, SVC generates reactive power & function as shunt
capacitor. Therefore, there is less drop in system voltage with SVC as compared without
SVC.
VI. REFERENCE
[1]. N.G. Hingorani and L. Gyugy, Understanding FACTS, Concepts and Technology of
Flexible AC Transmission System. New York: Inst. Elect. Electron. Eng., Inc., 2000.
[2]. J. J. Paserba, D. J. Leonard, N.W. Miller, S. T. Naumann, M. G. Lauby, and F. P. Sener,
“Coordination of a distribution level continuously controlled compensation device with
existing substation equipment for long term var management,” IEEE Trans. Power Del., vol.
9, no. 2, pp.1034–1040, Apr. 1994.
[3]. K. M. Son, K. S. Moon, S. K. Lee, and J. K. Park, “Coordination of an SVC with a
ULTC reserving compensation margin for emergency control,” IEEE Trans. Power Del., vol.
15, no. 4, pp. 1193–1198, Oct. 2000.
[4]. Task Force no. 2 on Static Var Compensators, Static Var Compensators (1986).
[5]. IEEE Special Stability Controls Working Group, “Static var compensator models for
power flow and dynamic performance simulation,” IEEE Trans. Power Syst., vol. 9, no. 1,
pp. 229–240, Feb. 1994.
[6]. R.A. Schlueter, ,A voltage stability security assessment method,” IEEE Trans. on Power
Systems, vol. 13, no. 4, November 1998, pp. 1423- 1438.
[7]. D. Jovcic, Pahalawaththa, N., Zavahir, M. & Hassan, H.A. (2003) “SVC Dynamic
analytical Model”_ IEEE Trans. On Power Delivery, Vol. 18, No. 4, (October), pp. 1455 -
1461.
[8]. FACTS Controllers in Power Transmission and Distribution By- K.R. Padiyar.
[9] Ameer H. Abd and D.S.Chavan, “Impact of Wind Farm of Double-Fed Induction
Generator (Dfig) on Voltage Quality”, International Journal of Electrical Engineering &
Technology (IJEET), Volume 3, Issue 1, 2012, pp. 235 - 246, ISSN Print : 0976-6545,
ISSN Online: 0976-6553.
[10] Dr. M. P. Sharma and Sarfaraz Nawaz, “Understanding Operation of Shunt Capacitors
and Oltc for Transmission Loss Reduction”, International Journal of Electrical Engineering &
Technology (IJEET), Volume 4, Issue 2, 2013, pp. 344 - 357, ISSN Print : 0976-6545,
ISSN Online: 0976-6553.
[11] T. Nageswara Prasad, V. Chandra Jagan Mohan and Dr. V.C. Veera Reddy, “Shunt
Compensator for Integration of Wind Farm to Polluted Distribution System”, International
Journal of Electrical Engineering & Technology (IJEET), Volume 3, Issue 3, 2012,
pp. 89 - 101, ISSN Print : 0976-6545, ISSN Online: 0976-6553.

International Journal of Electrical Engineering and Technology (IJEET), ISSN 0976 –
6545(Print), ISSN 0976 – 6553(Online) Volume 4, Issue 3, May - June (2013), © IAEME
114
BIOGRAPHIES
Dr. M. P. Sharma received the B.E. degree in Electrical Engineering in 1996 Govt.
Engineering College, Kota, Rajasthan and M. E. degree in Power Systems in 2001 and Ph.D.
degree in 2009 from Malaviya Regional Engineering College, Jaipur (Now name as MNIT).
He is presently working as Assistant Engineer, Rajasthan Rajya Vidhyut Prasaran Nigam
Ltd., Jaipur. He is involved in the system studies of Rajasthan power system for development
of power transmission system in Rajasthan and planning of the power evacuation system for
new power plants. His research interest includes Reactive Power Optimization, Power
System Stability, reduction of T&D losses and protection of power system.(email:
Devendra Saini received the B.Tech. degree in electrical engineering from Rajasthan
Technical University, Kota, in 2011. He is currently pursuing the M.Tech.degree in Power
System from the Jodhpur National University ,Jodhpur. He is currently an Assistant Professor
at the Electrical Engi. Dept. Shankara Institute Of Technology , Jaipur ,Rajasthan. His
research interests are in the areas of FACTS power system problems, controls and transient
stability (email :[email protected])
Swati Harsh has received her B.E. degree from University of Rajasthan. She is currently
working as Assistant professor in department of Electrical Engineering at Anand
International College of Engineering. She is currently pursuing M.Tech. (Power System)
from Swami Keshvanand Institute of Technology, Management and Gramothan (SKIT)
(email: [email protected])
Sarfaraz Nawaz has received his B.E. degree from University of Rajasthan and M.Tech.
degree from MNIT, Jaipur. His research interests include power systems and power
electronics. He is currently an Associate Professor of the Electrical Engg. Dept., Swami
Keshvanand Institute of Technology, Management and Gramothan (SKIT) , Jaipur,
Rajasthan. (email: [email protected])