International Bathymetric Chart of the Southern Ocean1 International Bathymetric Chart of the...
23
1 International Bathymetric Chart of the Southern Ocean IBCSO - Status Report 2011- Hans Werner Schenke Alfred Wegener Institute for Polar and Marine Research 9/27/2012 GEBCO-Meeting 2011 La Jolla 1
Transcript of International Bathymetric Chart of the Southern Ocean1 International Bathymetric Chart of the...
1
International Bathymetric Chart of the Southern Ocean
IBCSO
- Status Report 2011-
Hans Werner Schenke
Alfred Wegener Institute for Polar and Marine Research
9/27/2012 GEBCO-Meeting 2011La Jolla
1
Presenter
Presentation Notes
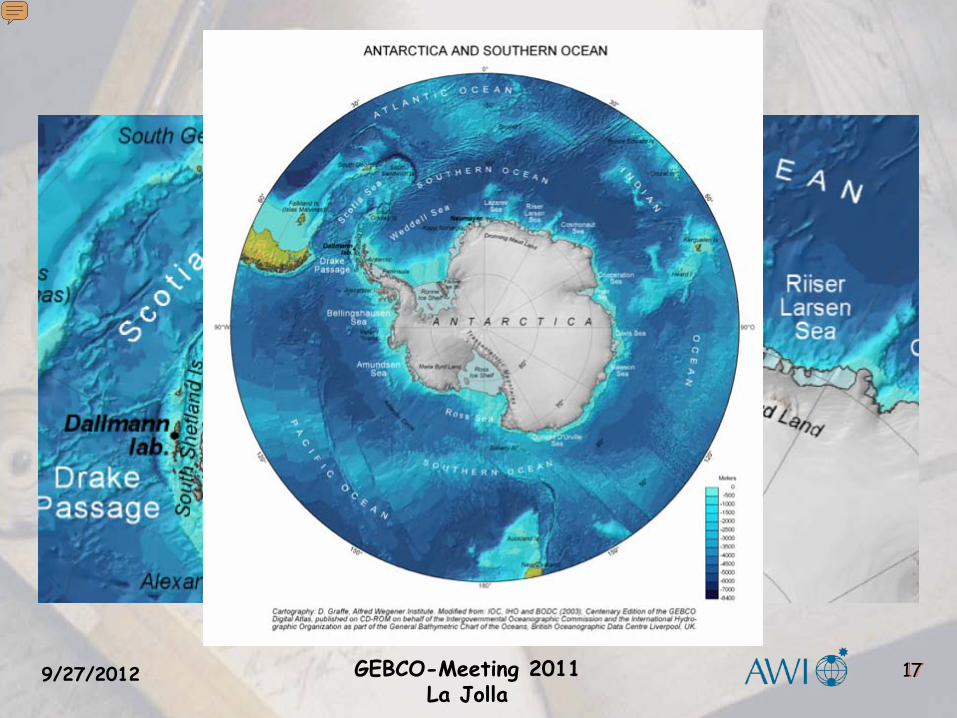
IBCSO was adopted as part of the IOC International Bathymetric Charting program at the IOC XXXVII Executive Council Meeting in June 2004, (Resolution IOC EC-XXXVII.5) and later in 2004 at the XXVII SCAR Conference in Bremen as Expert Group under the SCAR GSSG. IBCSO has established strong ties to GEBCO (General Bathymetric Chart of the Oceans, www.gebco.net), the IHO Hydrographic Committee for Antarctica (HCA), and the Southern Ocean Observing System (SOOS) in order to scale up sources for data exchange and product utilization. The objective target of the IBCSO is the compilation and modelling of a homogeneous and seamless geo-data base for the Southern Ocean on the base of available bathymetric data, land topography, and actual coast line. This product is urgently needed by most scientific disciplines dealing with the Southern Ocean. Why IBCSO? The Southern Ocean bathymetry defines ocean gateways and barriers. The sea floor topography controls ocean circulation and ocean mixing – and has strong influence on global climate. The transformation of multibeam data into classified products for coastal and marine research supports protection and conservation of marine biodiversity. Furthermore, bathymetric data provide additional numerical descriptors of terrain variables.

9/27/2012 2GEBCO-Meeting 2011La Jolla
Presenter
Presentation Notes
The IBCSO program is endorsed by international organizations such as the Intergovernmental Oceanographic Commission (IOC) of UNESCO, the International Hydrographic Organization (IHO), and the Scientific Committee on Antarctic Research (SCAR). IBCSO is one of several Expert Groups in the SCAR Standing Scientific Group on GeoSciences (SSG-GS)
3
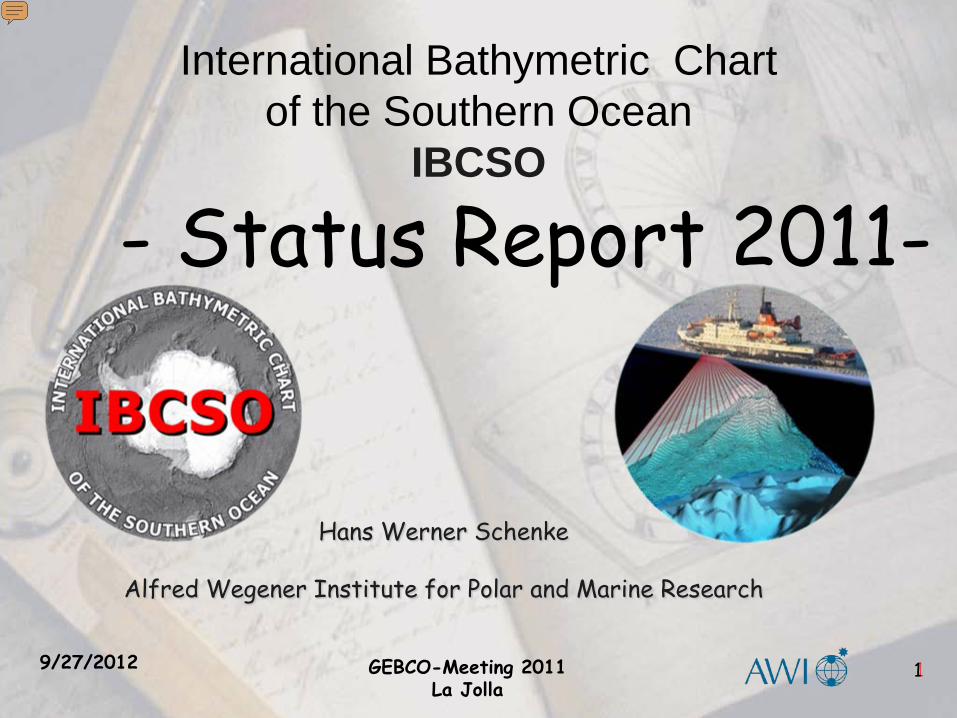
IBCSO Board (2011)Italy (Michele Rebesco)Spain (Jesus Galindo-Zaldivar)United Kingdom (Alex Tate)New Zealand (Vaughan Stagpoole/J. Black)Sweden (Martin Jakobsson)GEBCO (N.N. from TSCOM)IHO (N.N. from HCA)IOC (N.N.)SCAR (Colin Summerhayes/Mike Sparrow)
9/27/2012 3GEBCO-Meeting 2011La Jolla
Presenter
Presentation Notes
The IBCSO board is composed of national representatives from SCAR member countries and involved organizations. On 5 December 2007, SCAR circulated a letter (CL 770) to SCAR members to start the nomination process. This Board acts as an information forum about planned scientific activities in Antarctic waters and existing bathymetric data for implementation in the IBCSO. Board members report the current IBCSO status to their SCAR national delegates.
4
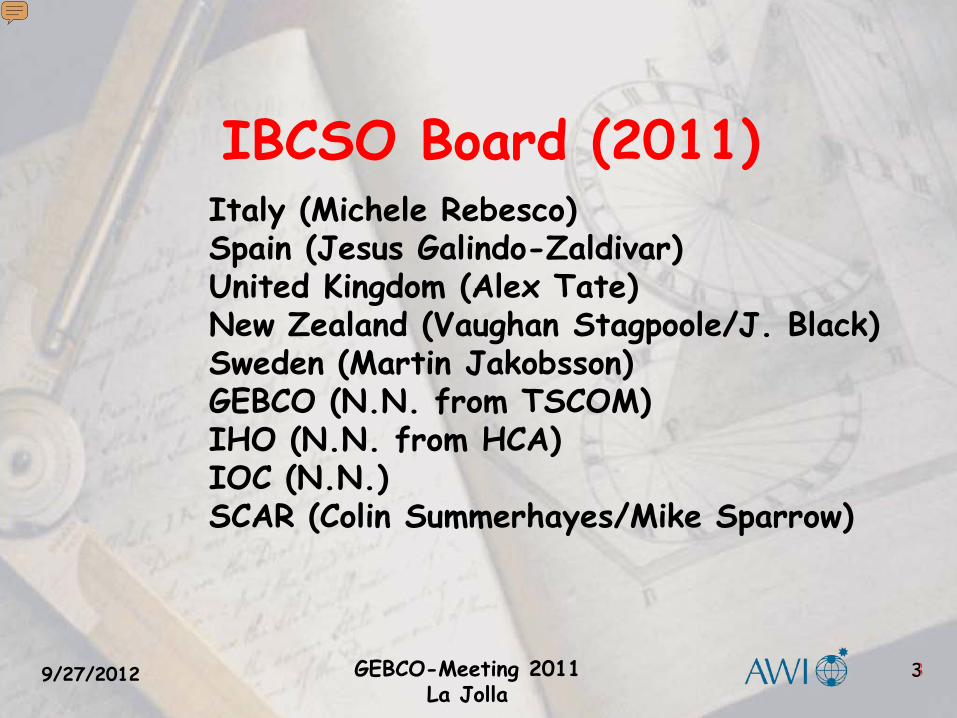
Hans Werner Schenke (AWI, Germany)Jan Erik Arndt; Data Manager (AWI, Germany)Frank Nitsche (LDEO, USA)NN (SHOA, Chile)Fred Davey (GNS, New Zealand)AlexTate (BAS, UK)Rudolf Greku (IGS, Ukraine)Yoshifumi Nogi (NIPR, Japan)Phil O’Brien (GA, Australia)Howard Stagg (GA, Australia)Vaughan Stagpoole (GNS, New Zealand)Jenny Black (GNS, New Zealand)Gleb Udintsev (Vernadsky, Russia)Martin Jakobbson, (University Stockholm, Sweden)
Editorial Board (2011)
9/27/2012 4GEBCO-Meeting 2011La Jolla
Presenter
Presentation Notes
The Editorial Board was established during the 1st IBCSO Meeting held at the X International Symposium on Antarctic Earth Sciences at the University of California Santa Barbara, USA, in 2007. The Board has been updated during the 2nd IBCSO Meeting held at the XXX SCAR Science Week 2008 in St Petersburg, Russia.

5
• Alfred Wegener Institute for Polar and Marine Research (AWI), Germany• Australian Government Antarctic Division (AAD), Australia • British Antarctic Survey (BAS), United Kingdom • Geoscience Australia (GA), Australia • IHO Data Center for Digital Bathymetry (IHO DCDB) at NGDC• Institute of Geological Sciences (IGS), Ukraine• Instituto Anadaluz de Ciencias de la Tierra (IACT), Spain • Lamont-Doherty Earth Observatory (LDEO), Columbia University, New York,
USA• National Institute of Geology and Nuclear Sciences (GNS), New Zealand • National Institute of Polar Research (NIPR), Japan • NOAA's National Geophysical Data Center (NGDC), United States • Polar Marine Geosurvey Expedition (PMGE), Russia • Scripps Institution of Oceanography (SIO), University of California San Diego,
USA• United Kingdom Hydrographic Office (UKHO), United Kingdom• Universidad de Granada UG), Spain• Vernadsky Institute of Geochemistry (GEOKHI), Russia • VNIIOkeangeologia, Russia• Woods Hole Oceanographic Institution (WHOI), USA
Data Originator and Provider
9/27/2012 5GEBCO-Meeting 2011La Jolla
Presenter
Presentation Notes
Data Originator and Provider A great number of individuals, scientific institutions, hydrographic offices and international databases provide bathymetric data. This comprises single- and multibeam data, bathymetric grid compilations, and global data sets. Major contributions are provided by (in alphabetical order):
6
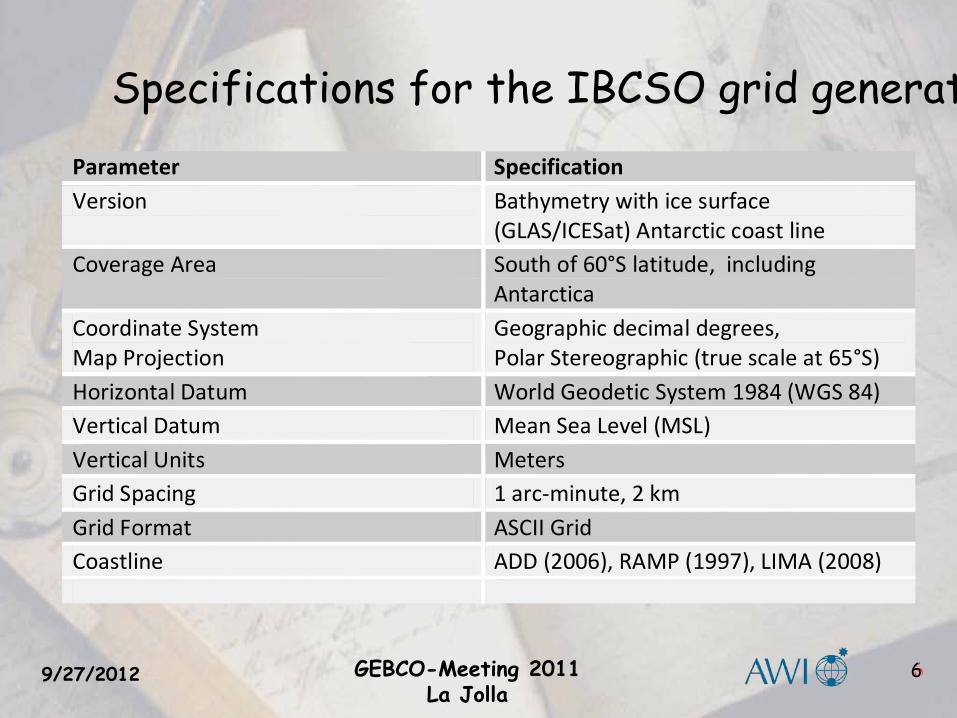
Specifications for the IBCSO grid generat
9/27/2012 6
Parameter Specification Version Bathymetry with ice surface
(GLAS/ICESat) Antarctic coast line Coverage Area South of 60°S latitude, including
Antarctica Coordinate System Map Projection
Geographic decimal degrees, Polar Stereographic (true scale at 65°S)
Horizontal Datum World Geodetic System 1984 (WGS 84) Vertical Datum Mean Sea Level (MSL) Vertical Units Meters Grid Spacing 1 arc-minute, 2 km Grid Format ASCII Grid Coastline ADD (2006), RAMP (1997), LIMA (2008)
GEBCO-Meeting 2011La Jolla

7
Single-beam Data
9/27/2012 7
Data Source Cruises
AAD, CSIRO, GA, Fishery 500AWI 48BAS, UKHO 123GNS 170IHO DCDB, NGDC 500PMGE, VNIIO, Vernadsky 20TOTAL 1361
[1] 300 data sets from fisheries
GEBCO-Meeting 2011La Jolla
Presenter
Presentation Notes
Single-beam Data Most vessels are at least equipped with narrow beam sonar (NBS) for the acquisition of single-beam data. Table 2 lists major contributions from national institutions and international bathymetric databases. A comprehensive list of ship tracks with single-beam data is not presented in this report due to the great number of cruises from research vessels, merchant vessels, fisheries boats and others. For further information, please refer to the NGDC and MGDS data services or see the IBCSO homepage for a data source listing.
8
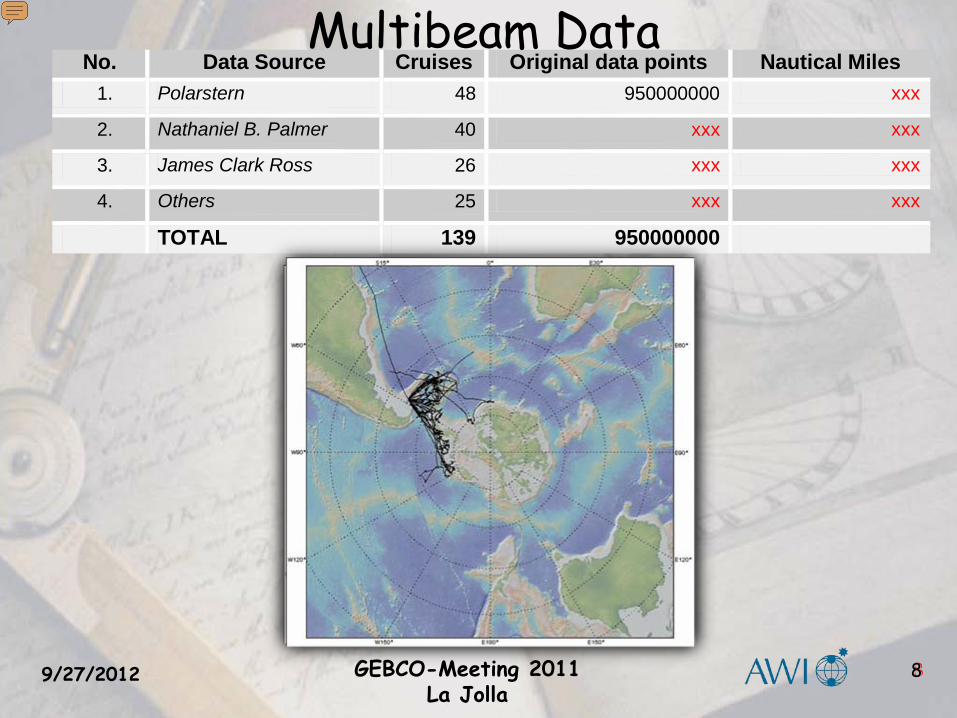
No. Data Source Cruises Original data points Nautical Miles 1. Polarstern 48 950000000 xxx 2. Nathaniel B. Palmer 40 xxx xxx 3. James Clark Ross 26 xxx xxx 4. Others 25 xxx xxx
TOTAL 139 950000000
Multibeam Data
9/27/2012 8GEBCO-Meeting 2011La Jolla
Presenter
Presentation Notes
Swath Data Only few research vessels (RVs) operating in the Southern Ocean are equipped with multibeam echosounder (MBES). In summary 140 multibeam surveys ranging from small to large survey areas are available (Table 3). Swath data have been acquired by RVs L’Atalante (1), Conrad (1), Dufresne (4), Ewing (7), Knorr (2), Melville (3), Mirai (2), Petrov (2), Revelle (1), Sonne (1), Strakhov (2), and others. Swath data are managed at the NGDC and national archives and accessible via web map interfaces. Major contributions of swath data are provided by RVs Polarstern, NB Palmer, and JC Ross. There are 48 RV Polarstern cruises with multibeam data available from the Alfred Wegener Institute for Polar and Marine Research. Data were acquired with multibeam echosounder (Seabeam and Hydrosweep DS-2) from1986 until 2007. Polarstern data cover mainly the South Atlantic sector of the Southern Ocean (Figure 4). Approximately 950,000,000 data points were acquired in Antarctic waters south of 50°S during the past two decades.

9
Grid Source Year Grid Size Data Points Sat. Altimetry 1. Amundsen Sea 2008 250 m n/a n/a 2. GEBCO Digital Atlas 2003 1 minute n/a n/a 3. Heard Island 2005 500 m ~5,000,000 ~17,000
4. Kerguelen Plateau 2008 500 m ~34,000,000 ~850,000
5. Macquarie Island 2004 250 m ~57,400,000 ~160,000
6. Marguerite Bay 2004 75 m n/a 0
7. Ross Sea 2004 Xxx m ~50,000,000 n/a
8. Scotia Sea 2005 200 m 35,000,000 0
9. South Georgia Island 2008 150 m n/a n/a
10. Weddell Sea 2001 1000 m 474,000,000 0
TOTAL 665,000,000 1,100,000
Bathymetric grid compilations used for the IBCSO
9/27/2012 9GEBCO-Meeting 2011La Jolla
Presenter
Presentation Notes
Compiled grids at a regional scale are available from the GEBCO Digital Atlas, Weddell Sea (Schenke et al., 2001), Ross Sea (Davey, 2004 and Stagpoole et al., 2004), Marguerite Bay (Bolmer et al., 2004), Central Scotia Sea (Schenke et al., 2005), Amundsen Sea (Nitsche et al., 2008), and South Georgia Island (Fretwell et al., 2009). Large regional grids in the southern Indian Ocean are available from Heard Island (Sexton, 2005), Macquarie Island (Sexton & Tully, 2004), and the Kerguelen Plateau (Leon, 2008).

9/27/2012
11
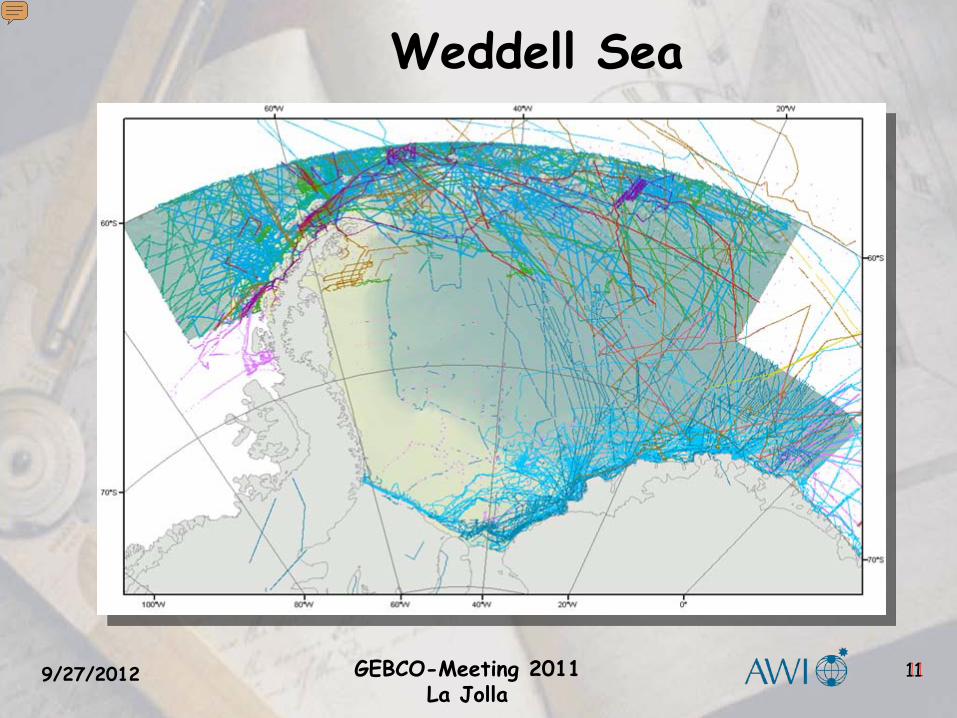
Weddell Sea
9/27/2012 11GEBCO-Meeting 2011La Jolla
Presenter
Presentation Notes
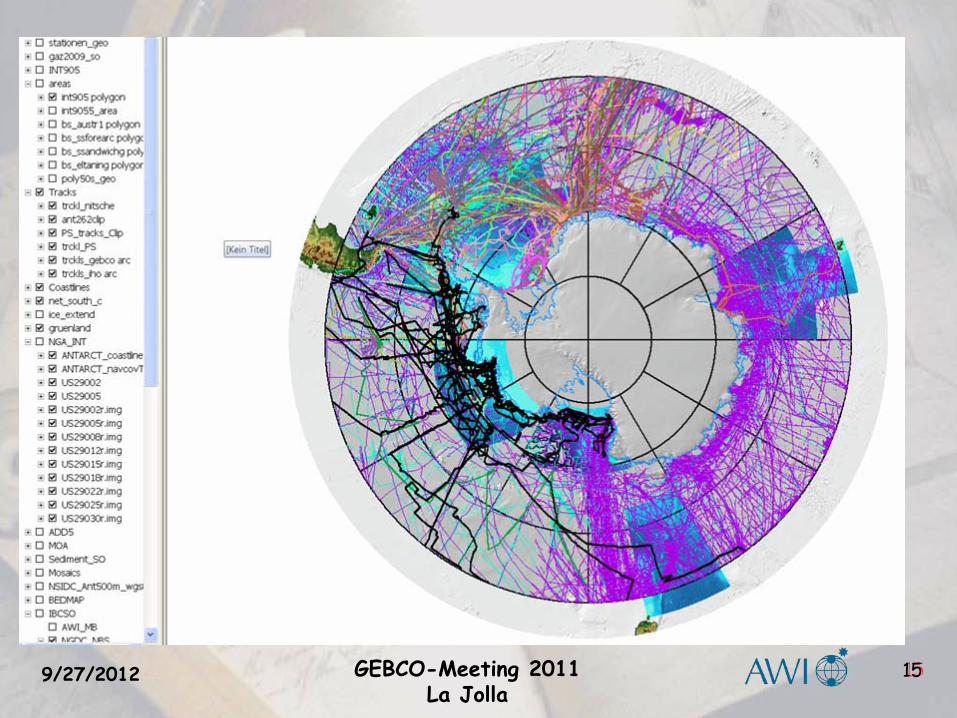
Bathymetric data for the BCWS grid compilation consist of 29 multibeam data sets from Polarstern and Boris Petrov. Digital single-beam data of 27 cruises (Polar Duke, Polar Circle, Endurance, and Surveyor) from the IHO DCDB, NGDC, Russia, and the United Kingdom are integrated in the map (Figure 16). Hydrographic Offices from Argentina, Brazil, Chile, Russia, and the United Kingdom provided nautical charts. Sound velocity is calculated with 1500 m/s.
129/27/2012 12GEBCO-Meeting 2011La Jolla
Presenter
Presentation Notes
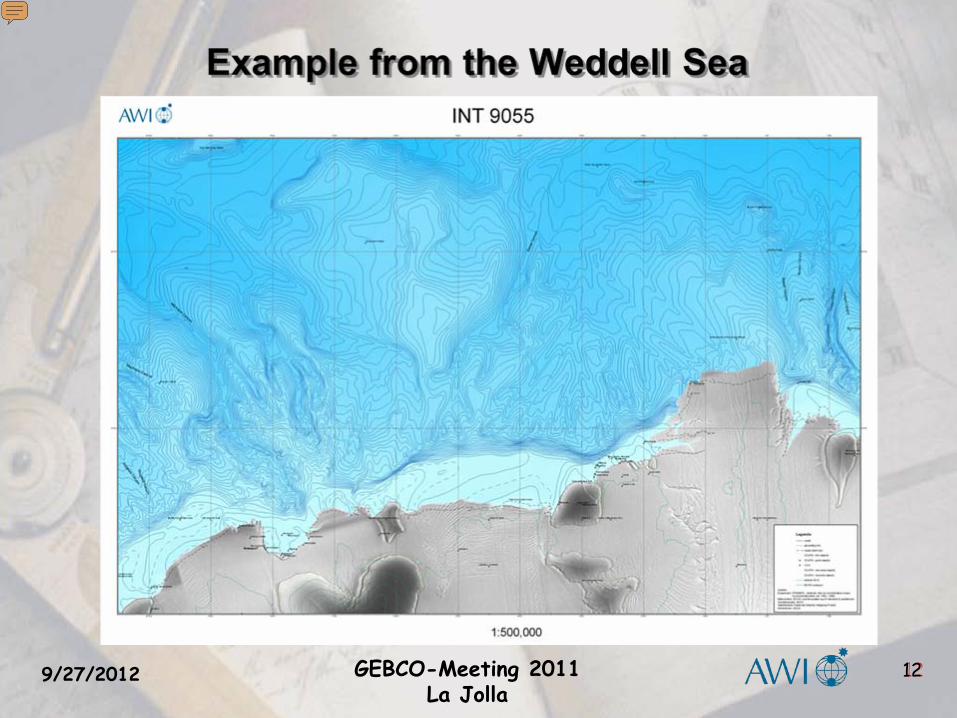
Base for the Nautical Chart in the Southern Weddell Sea Satellite imagery has been used for the land/ice part of the map, Multibeam data used here was quality controlled, to fullfil the S-44 regulations,
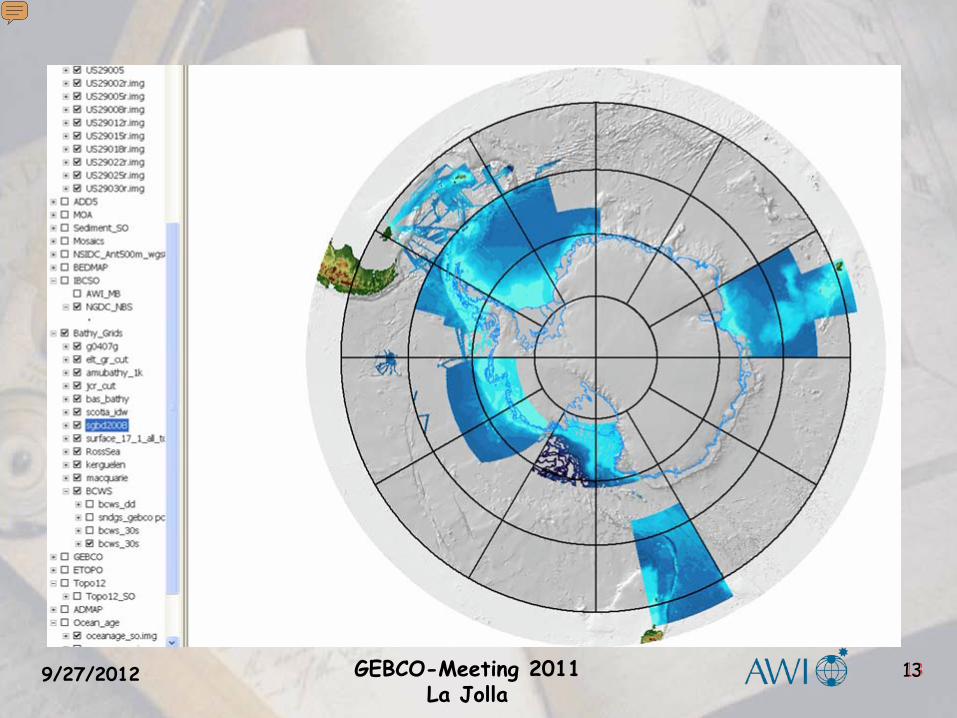
139/27/2012 13GEBCO-Meeting 2011La Jolla
Presenter
Presentation Notes
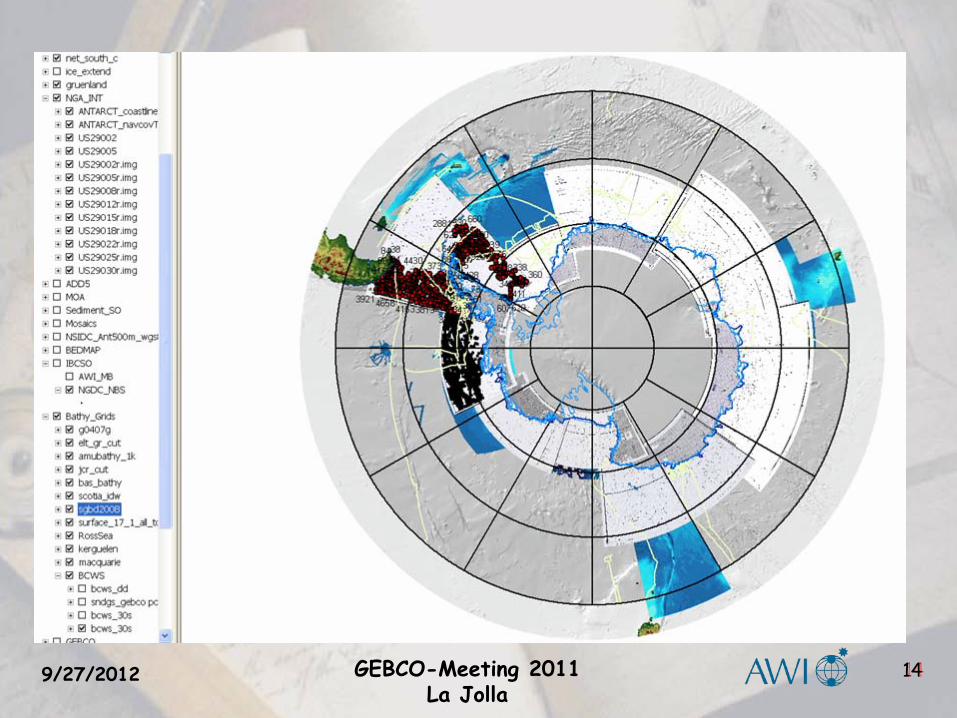
The South Georgia Bathymetric Dataset (SGDB) of the British Antarctic Survey (BAS) is a high-resolution gridded raster sampled at 150 m resolution. Several bathymetric data sources were used for the SGDB compilation. The database contains 16 multibeam cruises from JC Ross. Single-beam data of 25 cruises from JC Ross, Endurance and fisheries vessels are compiled. Hydrographic charts and GEBCO data were used to fill bathymetric data gaps with interpolated data (Figure 15).
149/27/2012 14GEBCO-Meeting 2011La Jolla
159/27/2012 15GEBCO-Meeting 2011La Jolla
9/27/2012
179/27/2012 17GEBCO-Meeting 2011La Jolla
Presenter
Presentation Notes
But the way to reach this is long…..
18
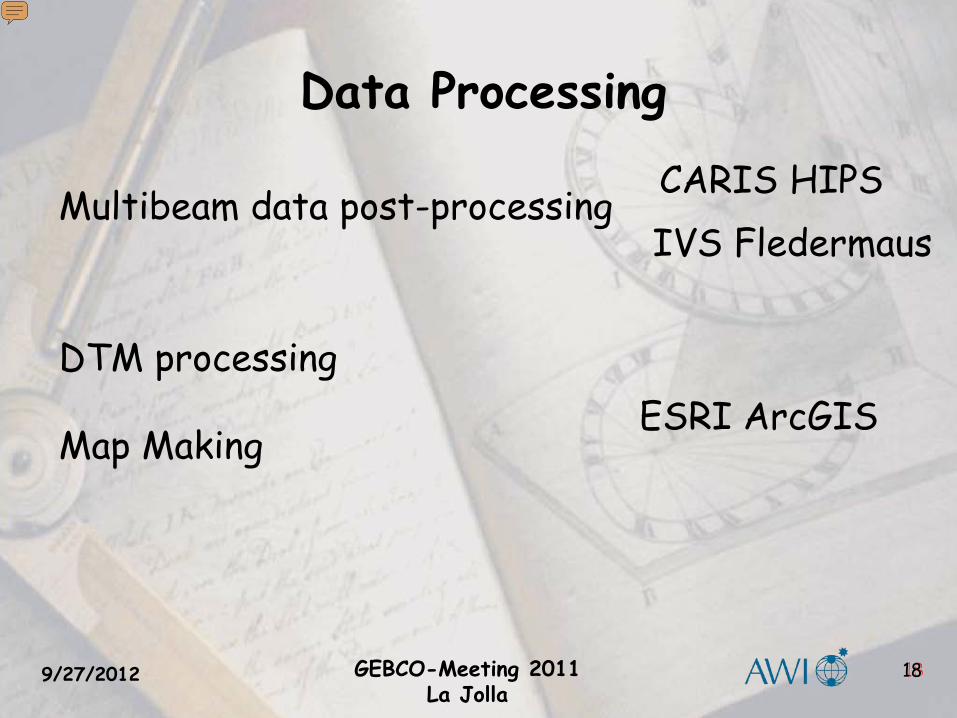
Data Processing
CARIS HIPS IVS Fledermaus
DTM processing
Map Making
Multibeam data post-processing
ESRI ArcGIS
9/27/2012 18GEBCO-Meeting 2011La Jolla
Presenter
Presentation Notes
Data Processing Data cleaning and processing for all 48 Polarstern cruises with sonar swath data is completed. Swath data from Ross are edited, processed, and gridded by BAS. Nearly all of the 22 cruises from the NGDC MGG are raw data. Twelve of the 65 cruises from the MGDS are proprietary hold; four cruises are raw data without any edits and processing. Data sets from six cruises are slightly edited products. Much data are of higher quality level and are already processed. Single-beam or navigational data are available only for the half number of cruises. Editing and processing of digital bathymetry is performed by various software applications depending on data quality respectively processing level. Software Cleaning and editing of raw multibeam data is performed with CARIS HIPS 6.1. The CARIS Swath Editor helps to examine multibeam data and provides data cleaning tools.

199/27/2012 19GEBCO-Meeting 2011La Jolla
Thank you!
Presenter
Presentation Notes
The input data were derived from a number of sources. Data quality and data density varies considerably throughout the region (Sexton & Tully, 2004). Nearly 55 Million data points are acquired with multibeam echo sounder during eight cruises from NB Palmer, Ewing, Melville, L’Atalante, and Sonne. The data is provided from various sources e.g. UTIG, GEOMAR, IFREMER, SIO, and LDEO. One Million data points are single-beams from fisheries and data stored in national and international databases (MARDAT, NGDC, and CSIRO)

9/27/2012

9/27/2012
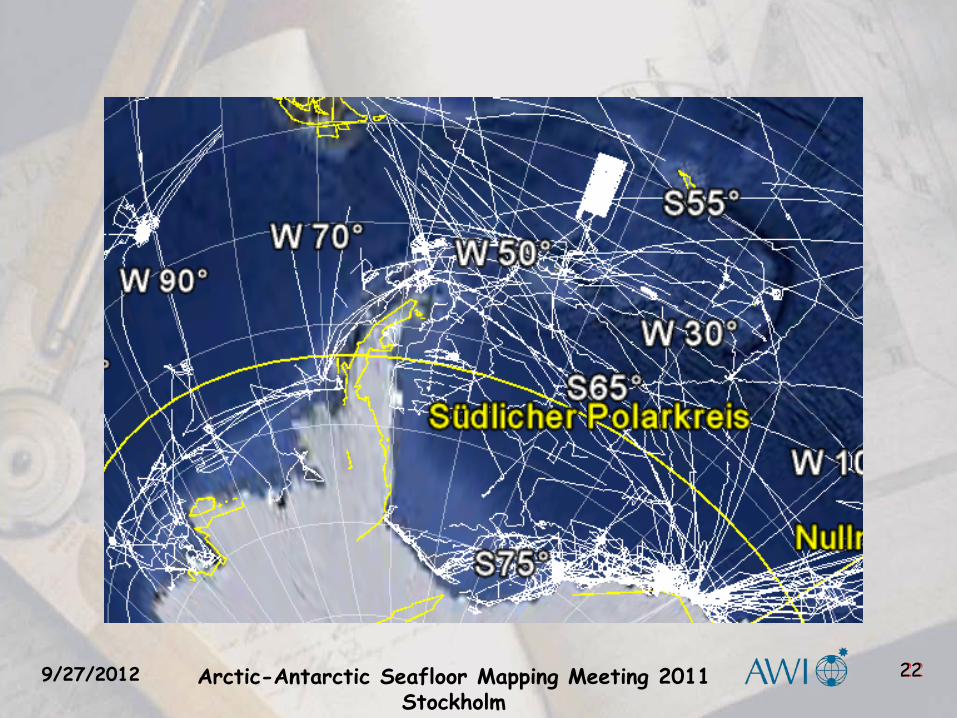
229/27/2012 Arctic-Antarctic Seafloor Mapping Meeting 2011 Stockholm
22
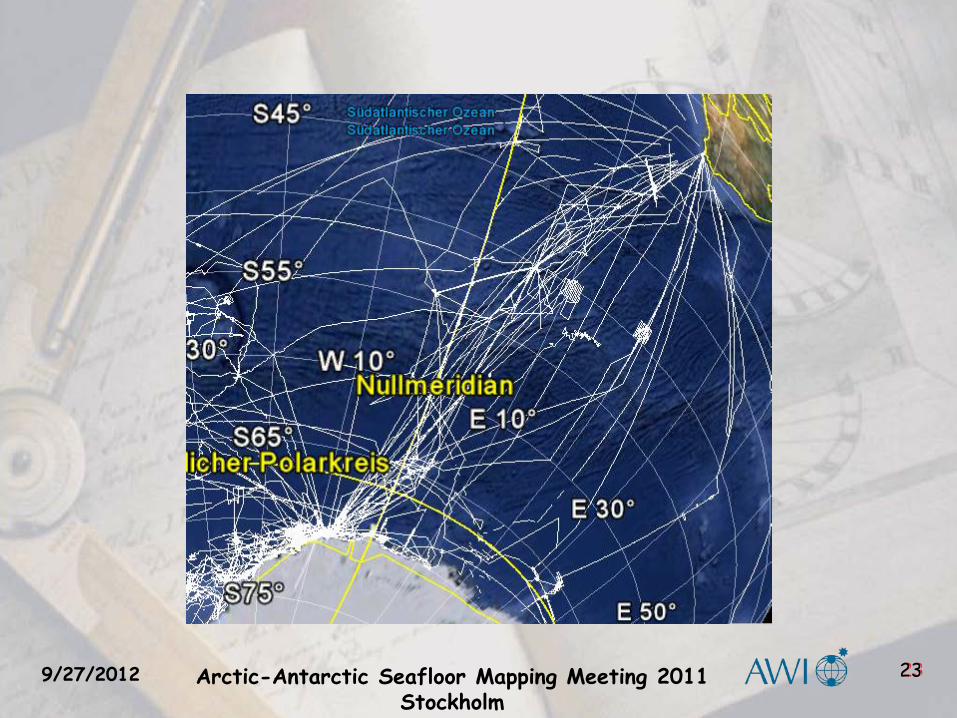
239/27/2012 Arctic-Antarctic Seafloor Mapping Meeting 2011 Stockholm
23