Bathymetric map
25
-
Upload
zee-zaka -
Category
Technology
-
view
199 -
download
3
Transcript of Bathymetric map
Bathymetric Maps and Plate Tectonics
CPO Science
Key Questions
• What is a bathymetric map?
• What is plate tectonics, and what are the chief tectonic plates of Earth’s lithosphere?
• What will Earth’s surface look like in 50 million years?

What is a bathymetric map?
• Look at your bathymetric map
• What features do you see?

What features do you see?
What is a bathymetric map?
• Bathymetry is from the Greek: bathos = deep, and metry = measure
• A bathymetric map shows what the ocean floor would look like if all the water drained out
• Bathymetric data from the oceans is used to help us understand plate tectonics
Some interesting tidbits about bathymetry
• Many got their first look at the ocean floor in the late ’60s, when National Geographic published bathymetric maps of the ocean
• More is known about the surface of Venus, Mars, and the dark side of the moon
• Satellite Altimetry is an advancement over acoustic pulse/sonar mapping technology
• Recommended Reading:– Mapping The Deep by Robert Kunzig
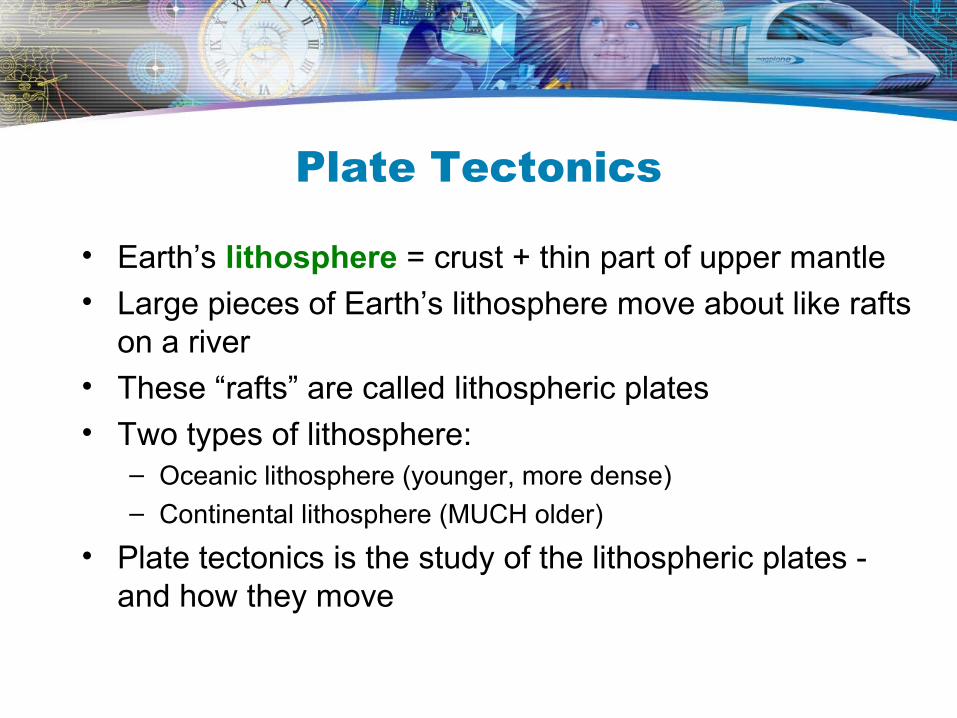
Plate Tectonics
• Earth’s lithosphere = crust + thin part of upper mantle• Large pieces of Earth’s lithosphere move about like rafts
on a river• These “rafts” are called lithospheric plates
• Two types of lithosphere:– Oceanic lithosphere (younger, more dense)– Continental lithosphere (MUCH older)
• Plate tectonics is the study of the lithospheric plates - and how they move
What we will do with the bathymetric map
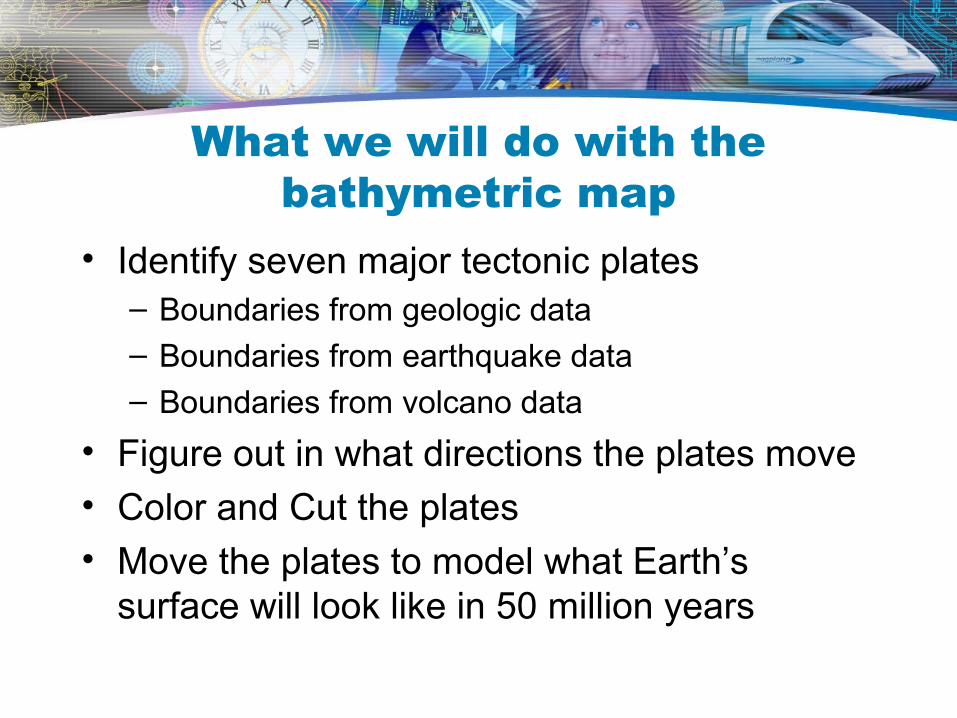
• Identify seven major tectonic plates– Boundaries from geologic data
– Boundaries from earthquake data
– Boundaries from volcano data
• Figure out in what directions the plates move• Color and Cut the plates• Move the plates to model what Earth’s
surface will look like in 50 million years
Begin to find plate boundaries
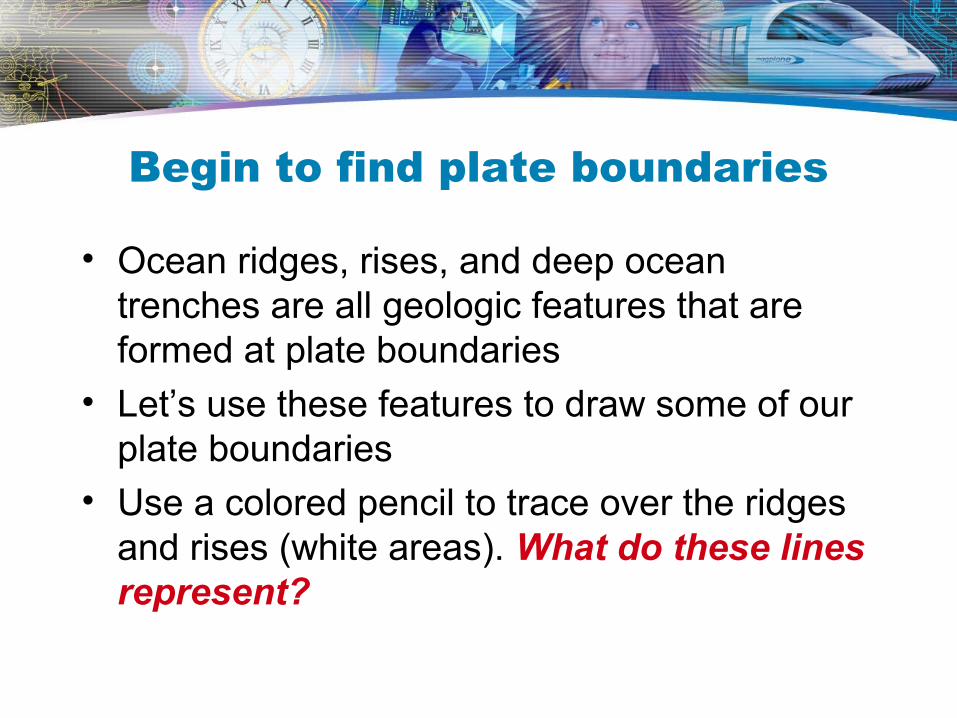
• Ocean ridges, rises, and deep ocean trenches are all geologic features that are formed at plate boundaries
• Let’s use these features to draw some of our plate boundaries
• Use a colored pencil to trace over the ridges and rises (white areas). What do these lines represent?
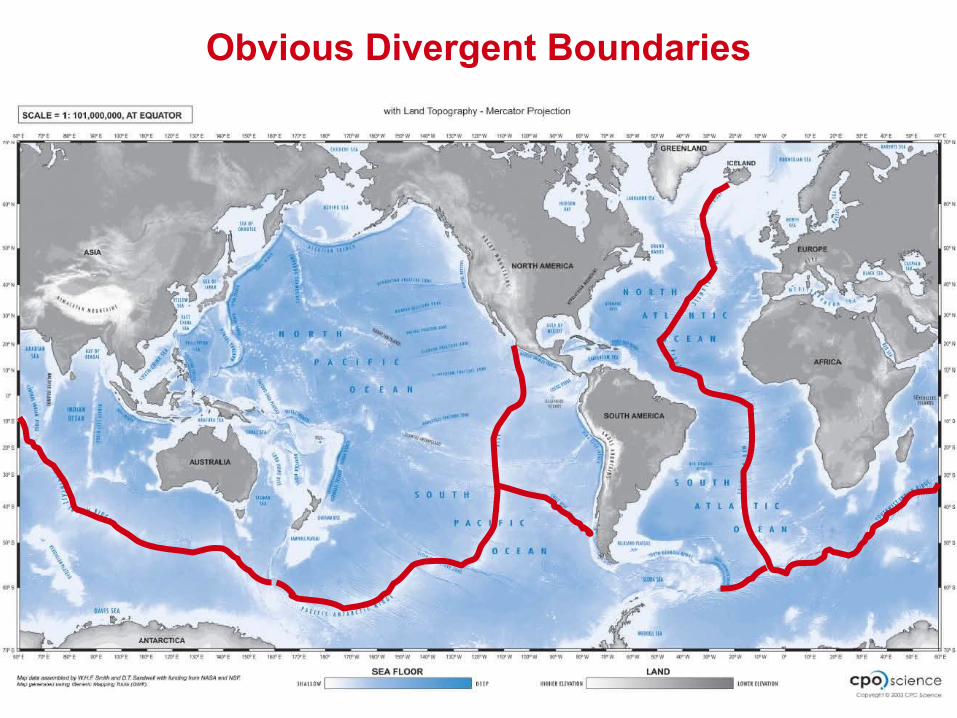
Obvious Divergent Boundaries
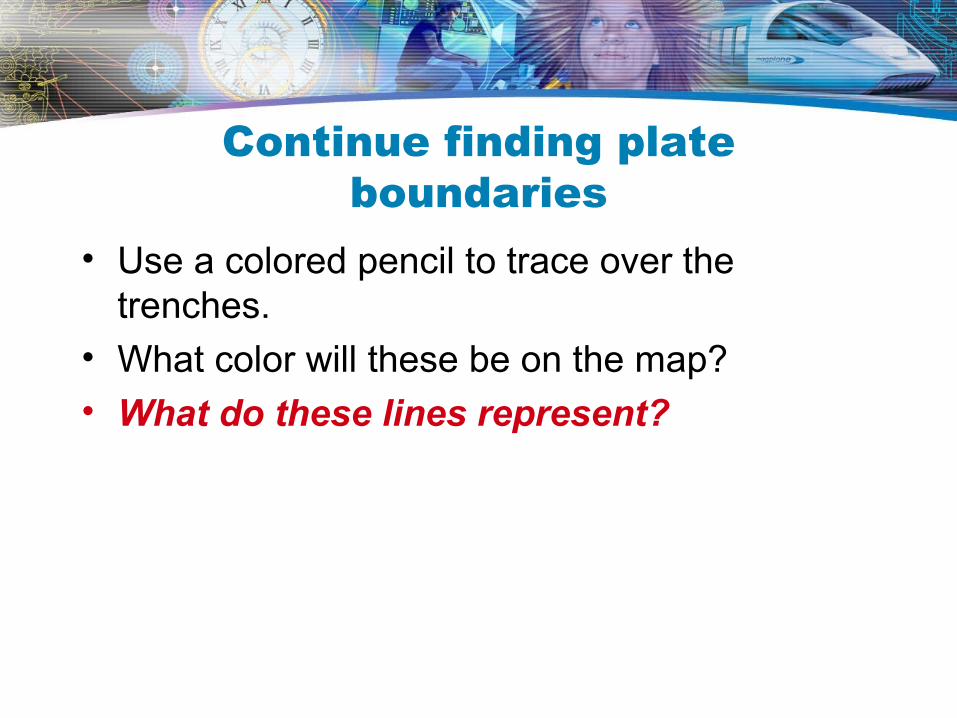
Continue finding plate boundaries
• Use a colored pencil to trace over the trenches.
• What color will these be on the map?• What do these lines represent?
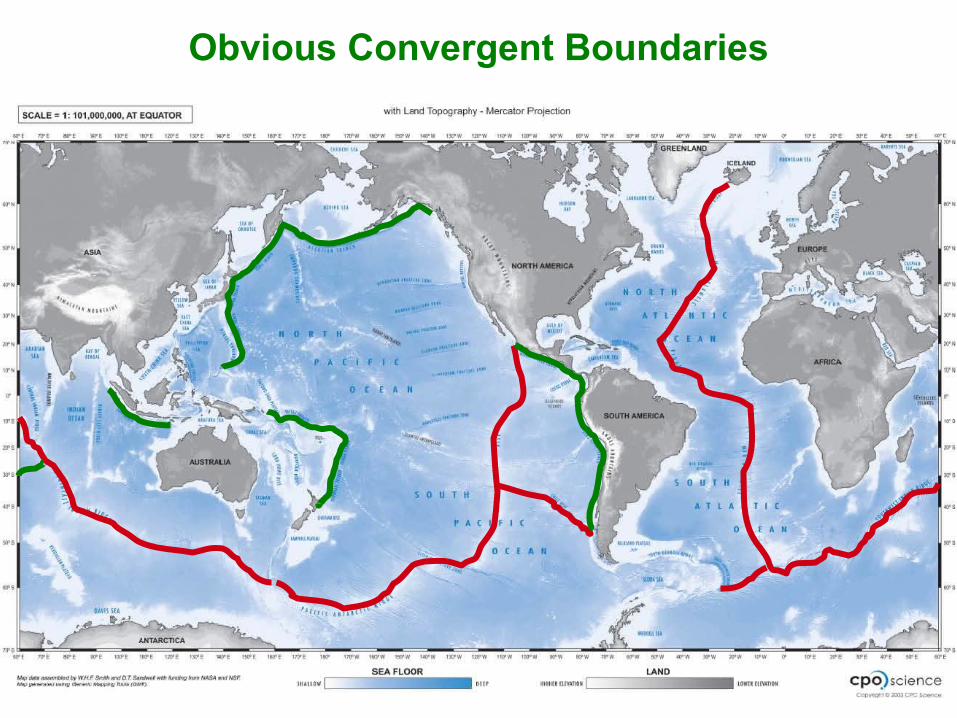
Obvious Convergent Boundaries
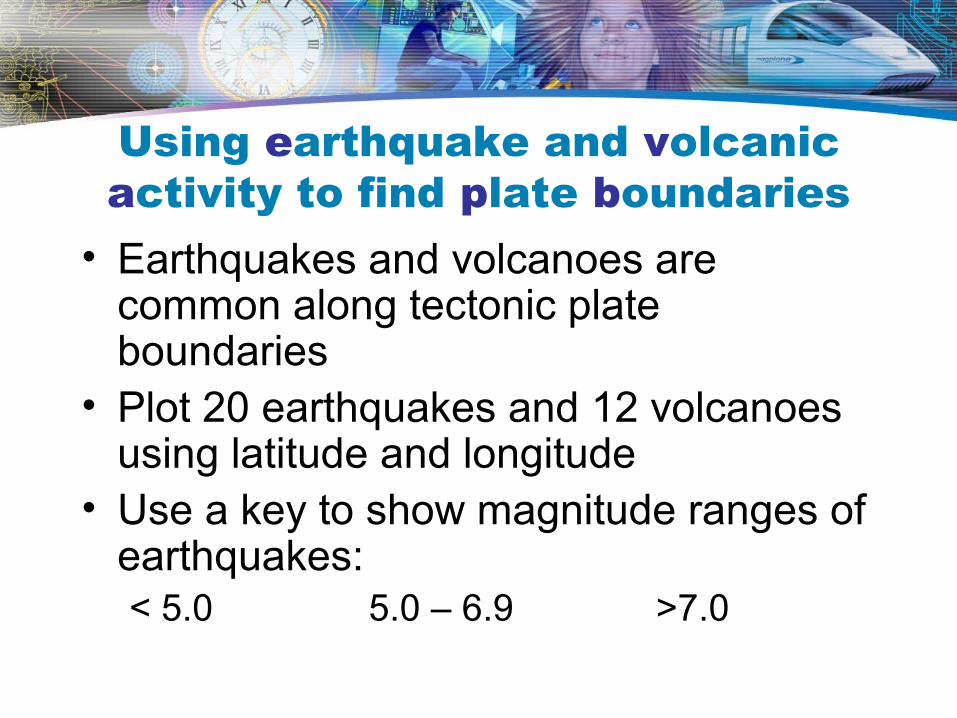
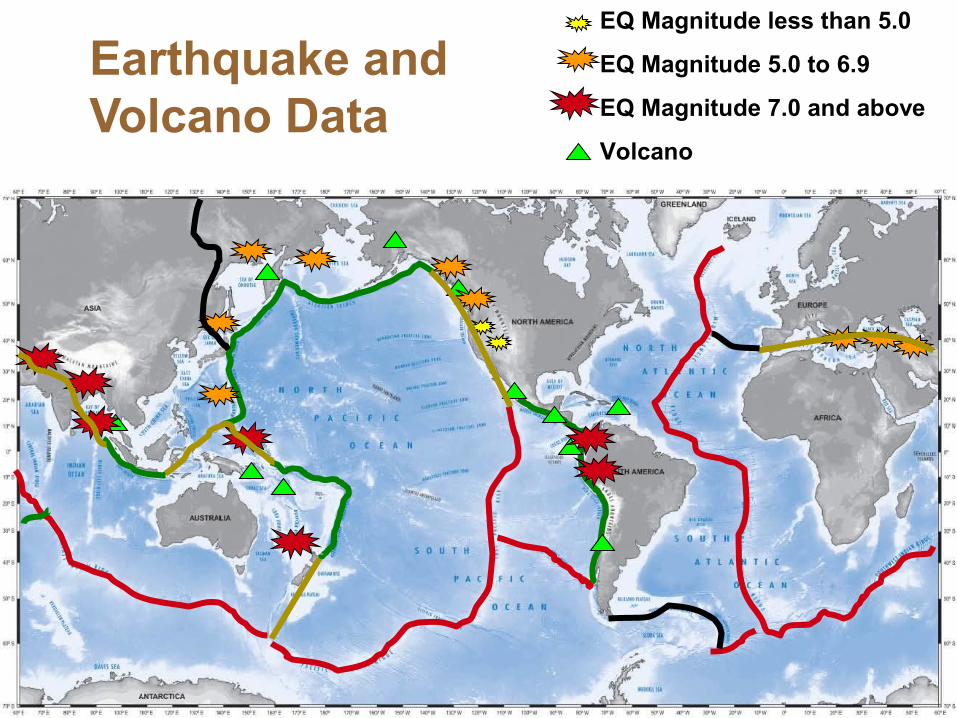
Using earthquake and volcanic activity to find plate boundaries
• Earthquakes and volcanoes are common along tectonic plate boundaries
• Plot 20 earthquakes and 12 volcanoes using latitude and longitude
• Use a key to show magnitude ranges of earthquakes: < 5.0 5.0 – 6.9 >7.0
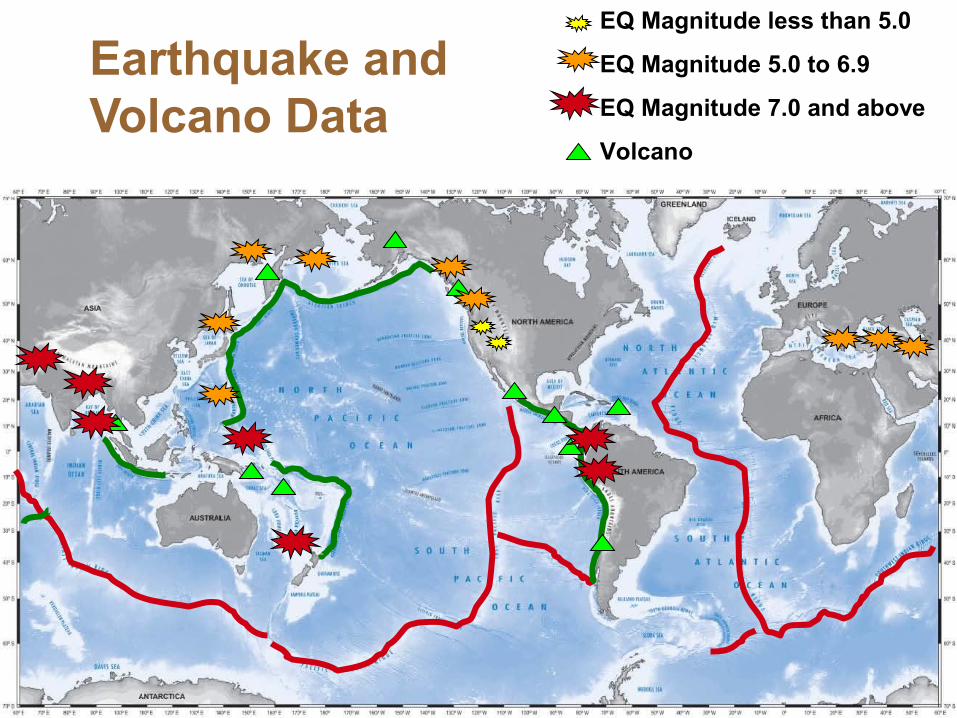
Earthquake and Volcano Data
EQ Magnitude less than 5.0
EQ Magnitude 5.0 to 6.9
EQ Magnitude 7.0 and above
Volcano
Earthquake and Volcano Data
EQ Magnitude less than 5.0
EQ Magnitude 5.0 to 6.9
EQ Magnitude 7.0 and above
Volcano
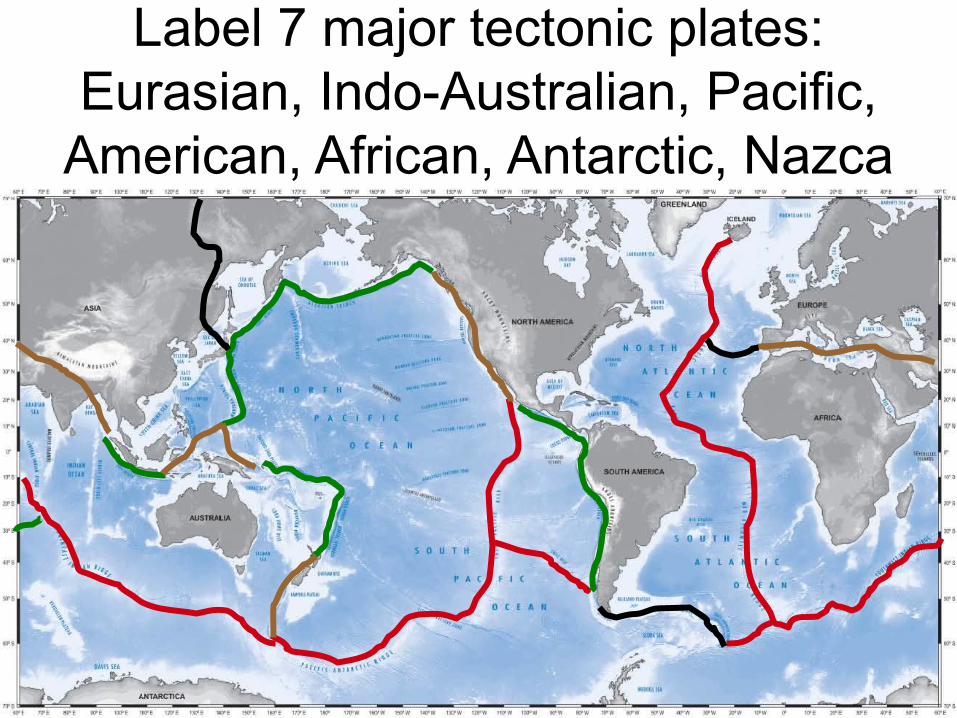
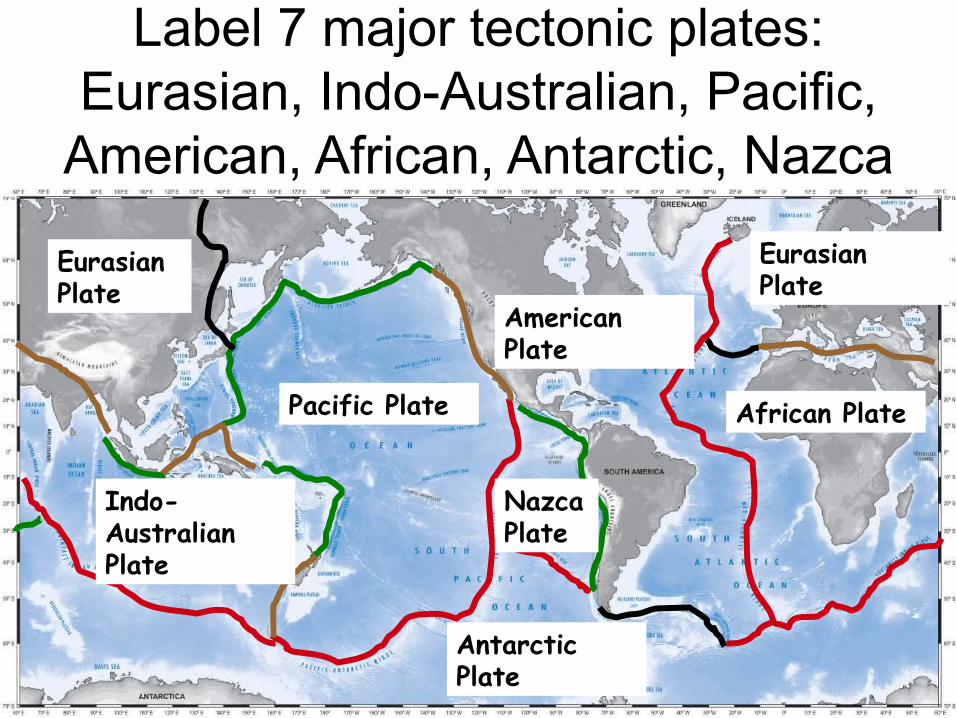
Label 7 major tectonic plates:Eurasian, Indo-Australian, Pacific,
American, African, Antarctic, Nazca
Label 7 major tectonic plates:Eurasian, Indo-Australian, Pacific,
American, African, Antarctic, Nazca
American Plate
Eurasian Plate
Indo-Australian Plate
Pacific Plate
Eurasian Plate
Antarctic Plate
African Plate
Nazca Plate
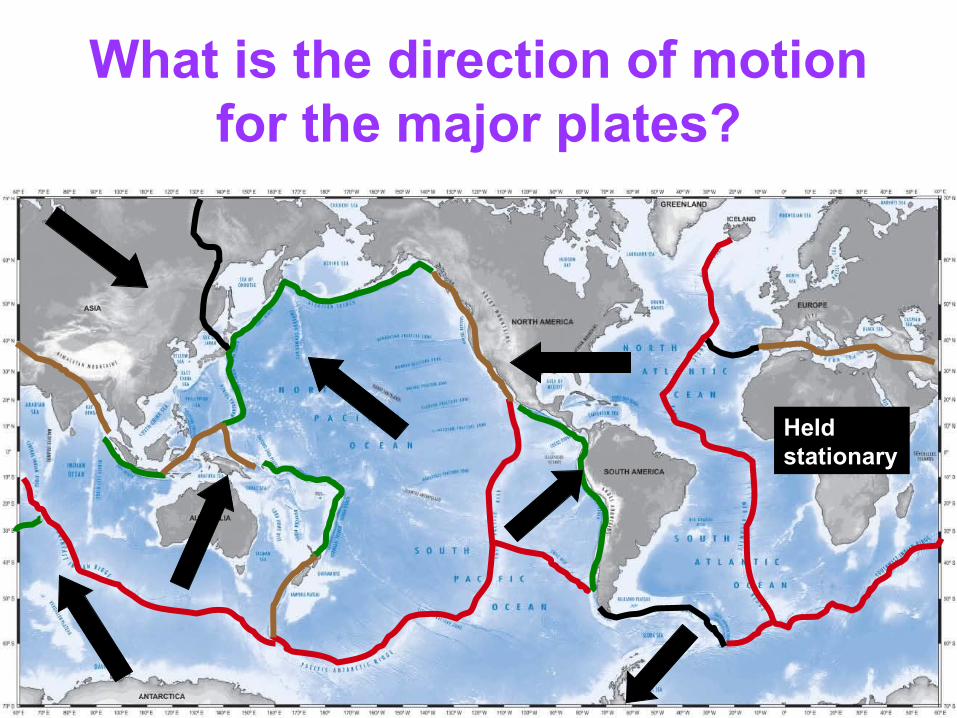
What is the direction of motion for the major plates?
Held stationary
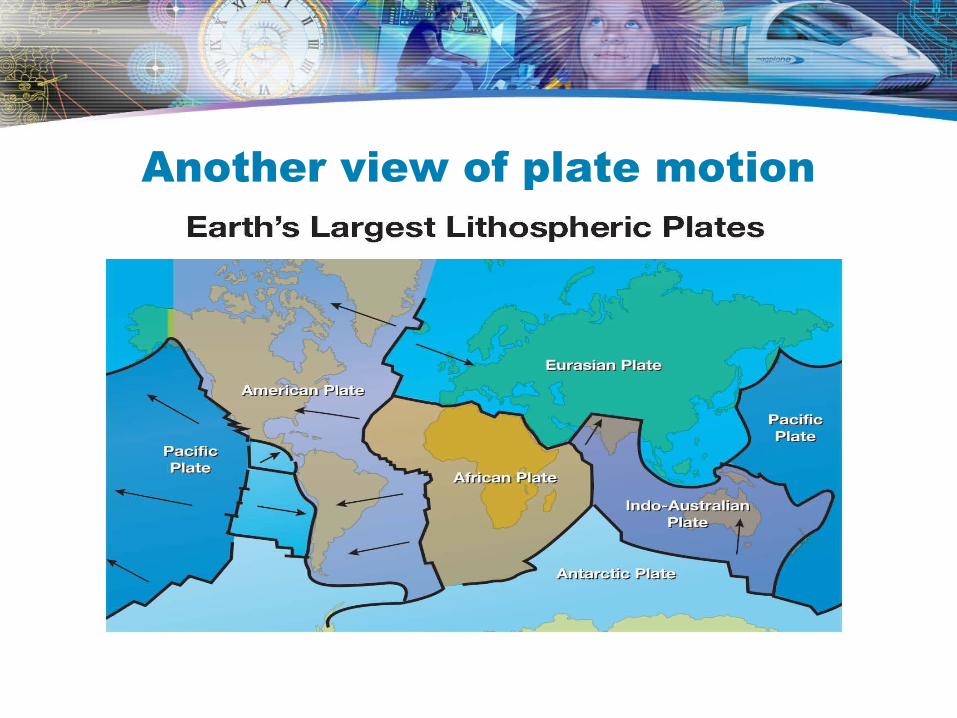
Another view of plate motion
Color the plates
• Lightly color each plate a different color. Remember that the left and right edges of the map are connected; color any split plates with the same color! Hold the map edges together, forming a cylinder, so that you can see this relationship.
• Make sure you have an arrow on each plate (except the African plate) to show direction of motion
Cut the plates
• Before cutting out the plates, make a small cut between the map and its border. Cut the border from the map in one piece.
• Now, cut the plates along boundary lines.• Reassemble the map on top of your backing
sheet
Move the Plates
• You have a present-day representation of the major lithospheric plates
• Assume that in 50 million years the plates will move about 3% from current positions, continuing in current direction
• Hold African plate stationary. Move other plates 1.5 cm in direction indicated by arrow.
Move the Plates
• At boundaries with trenches, slide subducting plate under other plate– When oceanic crust and continental crust
converge, the oceanic crust subducts
• Where continents come together, remember that continents cannot subduct, so mountain-building takes place. Use a black pen or crayon to draw in mountains (or more mountains)
• Glue plates in place on backing sheet
Analyze your Map
• What has happened to the area once known as the “cradle of civilization”?– The areas of North Africa and the Middle East
have collided, forming a new mountain range. The Mediterranean Sea basin is now part of that mountain range.
• Where will the longest mountain range be located 50 million years from now?– Spain to the Indian Ocean, maybe even all the
way to Alaska!