International Baccalaureate Organization · This report sources data from the International...
25
International Baccalaureate Students studying at UK Higher Education Institutions: How do they fare? Produced by the Analytical Services team at the Higher Education Statistics Agency on behalf of the International Baccalaureate Organization, April 2011 0 Introduction and executive summary With growing numbers of students entering the UK tertiary education system holding International Baccalaureate qualifications, there is now sufficient data available to make comparisons between International Baccalaureate (IB) students and those holding the more traditional A levels and Scottish Higher qualifications (A levels). This report sources data from the International Baccalaureate Organization (IBO) on students known to hold International Baccalaureate qualifications and data from the Higher Education Statistics Agency (HESA) on students studying at Higher Education Institutions (HEIs) in the United Kingdom. The report combines data from these two sources to identify characteristics and trends of IB students compared with students holding the more traditional A level, Scottish Higher and other level 3 qualifications. Throughout this report, data has been restricted to full‐time first degree students attending, qualifying or leaving HEIs in the UK. The majority of the data has been restricted to the academic year 2008/09 with some comparisons with the academic year 2007/08 for entrants. Different cohorts of students are used throughout this report: entrants refer to the cohort who entered their HEI during the specified academic year; students refers to those studying at an HEI during the specified academic year, regardless of their year of study; qualifiers refers to students who gained a qualification during the specified academic year and leavers are those students who left their institution in the specified academic year. Data on non‐ continuation rates of students uses both academic years 2007/08 and 2008/09. For entrants, comparisons can be made between IB and A level students. For students, qualifiers and leavers who entered HE prior to 2007/08 (the majority of full‐time first degree students, qualifiers and leavers), it is not possible to identify students holding only A level qualifications and therefore comparisons have been made between IB and A level & equivalent qualifications. The report aims to answer the following research questions proposed by the International Baccalaureate Organization. 1. To what extent are IB students more likely to enrol in top‐ranked universities? o IB entrants were much more likely to be enrolled at one of the top 20 HEIs than entrants holding other qualifications. Proportion wise, more than double the amount of IB entrants attended the top HEIs compared with A level entrants. [Figure 8, Section 2]. o IB entrants holding 35 or more IB points were more likely to attend a top 20 HEIs than any other HEI. In particular, 91.0% of IB entrants holding 44‐45 points attended one of the top 20 HEIs. [Figure 9, Section 2]. 2. What fields of study do IB students pursue at tertiary level, and how does IB diploma participation/performance relate to and/or predict their tertiary academic performance in general, and in these selected fields? Page 1 of 25
-
Upload
nguyenxuyen -
Category
Documents
-
view
228 -
download
1
Transcript of International Baccalaureate Organization · This report sources data from the International...
International Baccalaureate Students studying at UK Higher Education Institutions: How do they fare? Produced by the Analytical Services team at the Higher Education Statistics Agency on behalf of the International Baccalaureate Organization, April 2011 0 Introduction and executive summary With growing numbers of students entering the UK tertiary education system holding International Baccalaureate qualifications, there is now sufficient data available to make comparisons between International Baccalaureate (IB) students and those holding the more traditional A levels and Scottish Higher qualifications (A levels). This report sources data from the International Baccalaureate Organization (IBO) on students known to hold International Baccalaureate qualifications and data from the Higher Education Statistics Agency (HESA) on students studying at Higher Education Institutions (HEIs) in the United Kingdom. The report combines data from these two sources to identify characteristics and trends of IB students compared with students holding the more traditional A level, Scottish Higher and other level 3 qualifications. Throughout this report, data has been restricted to full‐time first degree students attending, qualifying or leaving HEIs in the UK. The majority of the data has been restricted to the academic year 2008/09 with some comparisons with the academic year 2007/08 for entrants. Different cohorts of students are used throughout this report: entrants refer to the cohort who entered their HEI during the specified academic year; students refers to those studying at an HEI during the specified academic year, regardless of their year of study; qualifiers refers to students who gained a qualification during the specified academic year and leavers are those students who left their institution in the specified academic year. Data on non‐continuation rates of students uses both academic years 2007/08 and 2008/09. For entrants, comparisons can be made between IB and A level students. For students, qualifiers and leavers who entered HE prior to 2007/08 (the majority of full‐time first degree students, qualifiers and leavers), it is not possible to identify students holding only A level qualifications and therefore comparisons have been made between IB and A level & equivalent qualifications. The report aims to answer the following research questions proposed by the International Baccalaureate Organization.
1. To what extent are IB students more likely to enrol in top‐ranked universities? o IB entrants were much more likely to be enrolled at one of the top 20 HEIs than entrants holding
other qualifications. Proportion wise, more than double the amount of IB entrants attended the top HEIs compared with A level entrants. [Figure 8, Section 2].
o IB entrants holding 35 or more IB points were more likely to attend a top 20 HEIs than any other HEI. In particular, 91.0% of IB entrants holding 44‐45 points attended one of the top 20 HEIs. [Figure 9, Section 2].
2. What fields of study do IB students pursue at tertiary level, and how does IB diploma
participation/performance relate to and/or predict their tertiary academic performance in general, and in these selected fields?
Page 1 of 25
Page 2 of 25
o The most popular subject areas studied by IB entrants were Business & administrative studies and Social studies. IB entrants were almost twice as likely to study Medicine & dentistry than A level entrants, but less likely to study Biological sciences [Figure 10, Section 3].
o IB students were more likely to achieve a first class honours award than A level students in all subject areas except in Mass communications & documentation [Figure 14, Section 4].
o Across all subject areas, except Languages, Architecture, building & planning, IB entrants were less likely to leave their institution without receiving an award in the following year than A level entrants [Figure 17, Section 5].
3. How do IB students perform academically at tertiary level, in terms of subject grades, class of
graduation qualification (e.g. first class, second class upper division, etc.) and length of degree completion/graduation rates, relative to a matched comparison group and to students overall within the UK tertiary education system?
o IB students outperformed A level students in terms of class of degree in the majority of subjects areas [Figure 13, Section 4].
o A clear positive relationship was seen between number of IB points held and proportions gaining first class and upper second class honours degrees [Figure 15, Section 4]
o Although the majority of IB and A level & equivalent students obtained their first degrees in their third year of study, a higher proportion of A level & equivalent students than IB students qualified in their fourth year. Much of this difference may be attributed to subject of study [Section 4].
4. How do IB students engage with learning at tertiary level, as measured by continuation rate (measures
attrition/dropout), relative to a matched comparison group and to students overall within the UK tertiary education system?
o Entrants holding IB qualifications were less likely to leave their institution in the following year, without gaining an award than entrants holding other types of qualifications [Figure 17, Section 5].
o A level entrants were more likely than IB entrants to leave without an award in all subject areas except for Languages and Architecture, building & planning [Figure 18, Section 5].
5. To what extent do IB students, across (i) Socio‐economic status (SES), and (ii) ethnic groups (especially
ethnic minorities), perform academically and engage productively at tertiary level, in terms of subject grades, class of graduation qualification (e.g. first class, second class upper division, etc.), length of degree completion/graduation rates, and continuation rate, relative to a matched comparison group and to students overall within the UK tertiary education system (or specific university level)?
o UK students from managerial and professional occupation backgrounds (Socio‐economic classification groups 1 to 3) generally performed better than those from other backgrounds, this was more apparent for IB qualifiers than for A level & equivalent qualifiers [Figure 16, Section 4].
o White UK students outperformed Black and minority ethnic (BME) students for both IB and A level & equivalent qualifiers with the difference being more apparent amongst A level & equivalent qualifiers [Figure 16, Section 4].
o For UK IB entrants, there was little difference between the proportions who left with no award for the different occupation backgrounds [Section 5].
o White UK IB entrants were slightly more likely to both continue into the following year and also to leave with no award than UK BME entrants, similar was true of A level entrants [Section 5].
6. What are the post‐tertiary pathways of IB students, and how do these compare with non‐IB students?
This can be further broken down into the following: • To what extent do IB students pursue graduate studies, and in what fields? • What are the post‐tertiary employment circumstances and patterns of IB students? • What industry sectors and fields of work do they pursue post‐graduation?
o IB leavers were more likely to go into further study only after leaving their HEI than A level & equivalent leavers [Figure 19, Section 6].
o Of those leavers entering further study, IB leavers were more likely to study for a Higher degree than A level & equivalent leavers [Figure 20, Section 6].

Page 3 of 25
o Greater proportion of IB leavers than A level & equivalent leavers were employed within professional, scientific and technical activities, but lower proportions were employed in wholesale and retail trade; repair of motor vehicles and motorcycles and human health and social work activities [Figure 21, Section 6].
o IB leavers were more likely to be employed in graduate level jobs and in higher paid occupations than A level & equivalent leavers [Figures 23 and 24, Section 6].
In order to address these research questions, this report first provides an overview of IB entrants studying in the UK, looking at the overall proportions of IB entrants, where they came from, the location of HEI attended, socio‐economic background and, for UK students, the type of school they attended. Following on from this, the report analyses the enrolment patterns at the ‘top’ HEIs, the chosen fields of study, achievement and non‐continuation rates. The final section looks at the activities of leavers approximately six months after leaving HEIs, including further study, employment rates, types of jobs, industries and occupations of employment.
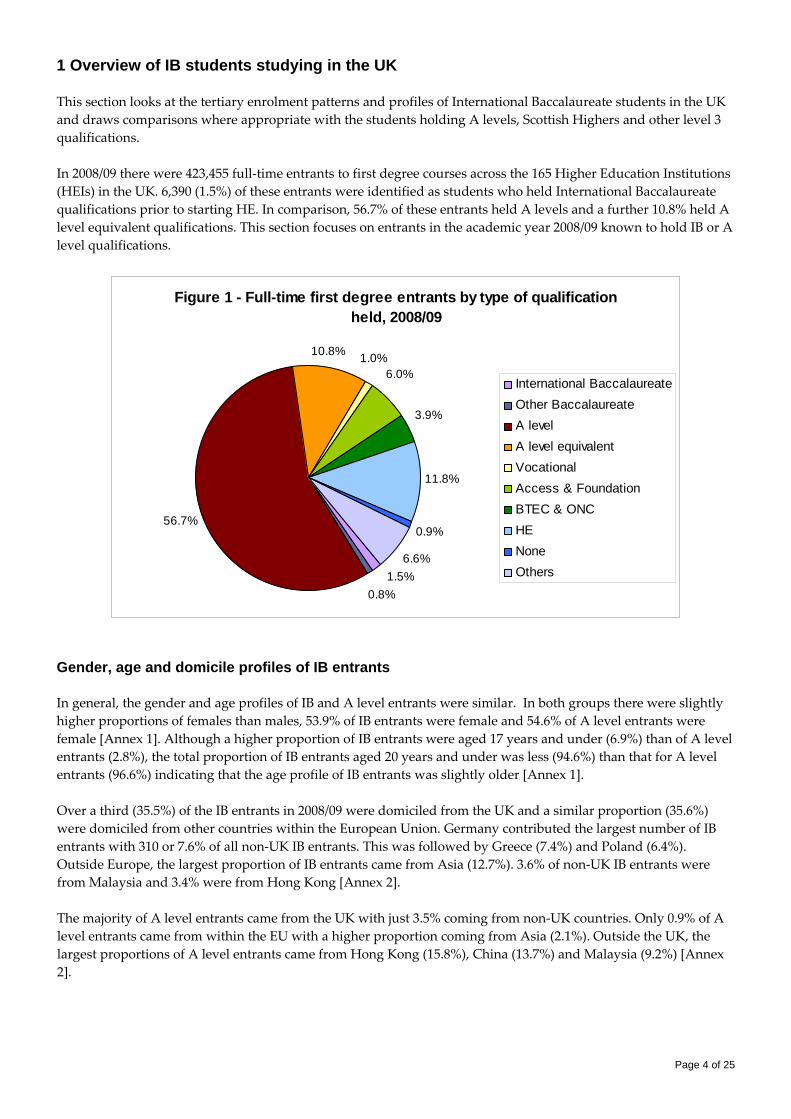
1 Overview of IB students studying in the UK This section looks at the tertiary enrolment patterns and profiles of International Baccalaureate students in the UK and draws comparisons where appropriate with the students holding A levels, Scottish Highers and other level 3 qualifications. In 2008/09 there were 423,455 full‐time entrants to first degree courses across the 165 Higher Education Institutions (HEIs) in the UK. 6,390 (1.5%) of these entrants were identified as students who held International Baccalaureate qualifications prior to starting HE. In comparison, 56.7% of these entrants held A levels and a further 10.8% held A level equivalent qualifications. This section focuses on entrants in the academic year 2008/09 known to hold IB or A level qualifications.
Figure 1 - Full-time first degree entrants by type of qualification held, 2008/09
56.7%
6.0%
3.9%
0.9%
10.8% 1.0%
11.8%
0.8%1.5%
6.6%
International BaccalaureateOther BaccalaureateA levelA level equivalentVocationalAccess & FoundationBTEC & ONCHENone Others
Gender, age and domicile profiles of IB entrants In general, the gender and age profiles of IB and A level entrants were similar. In both groups there were slightly higher proportions of females than males, 53.9% of IB entrants were female and 54.6% of A level entrants were female [Annex 1]. Although a higher proportion of IB entrants were aged 17 years and under (6.9%) than of A level entrants (2.8%), the total proportion of IB entrants aged 20 years and under was less (94.6%) than that for A level entrants (96.6%) indicating that the age profile of IB entrants was slightly older [Annex 1]. Over a third (35.5%) of the IB entrants in 2008/09 were domiciled from the UK and a similar proportion (35.6%) were domiciled from other countries within the European Union. Germany contributed the largest number of IB entrants with 310 or 7.6% of all non‐UK IB entrants. This was followed by Greece (7.4%) and Poland (6.4%). Outside Europe, the largest proportion of IB entrants came from Asia (12.7%). 3.6% of non‐UK IB entrants were from Malaysia and 3.4% were from Hong Kong [Annex 2]. The majority of A level entrants came from the UK with just 3.5% coming from non‐UK countries. Only 0.9% of A level entrants came from within the EU with a higher proportion coming from Asia (2.1%). Outside the UK, the largest proportions of A level entrants came from Hong Kong (15.8%), China (13.7%) and Malaysia (9.2%) [Annex 2].
Page 4 of 25
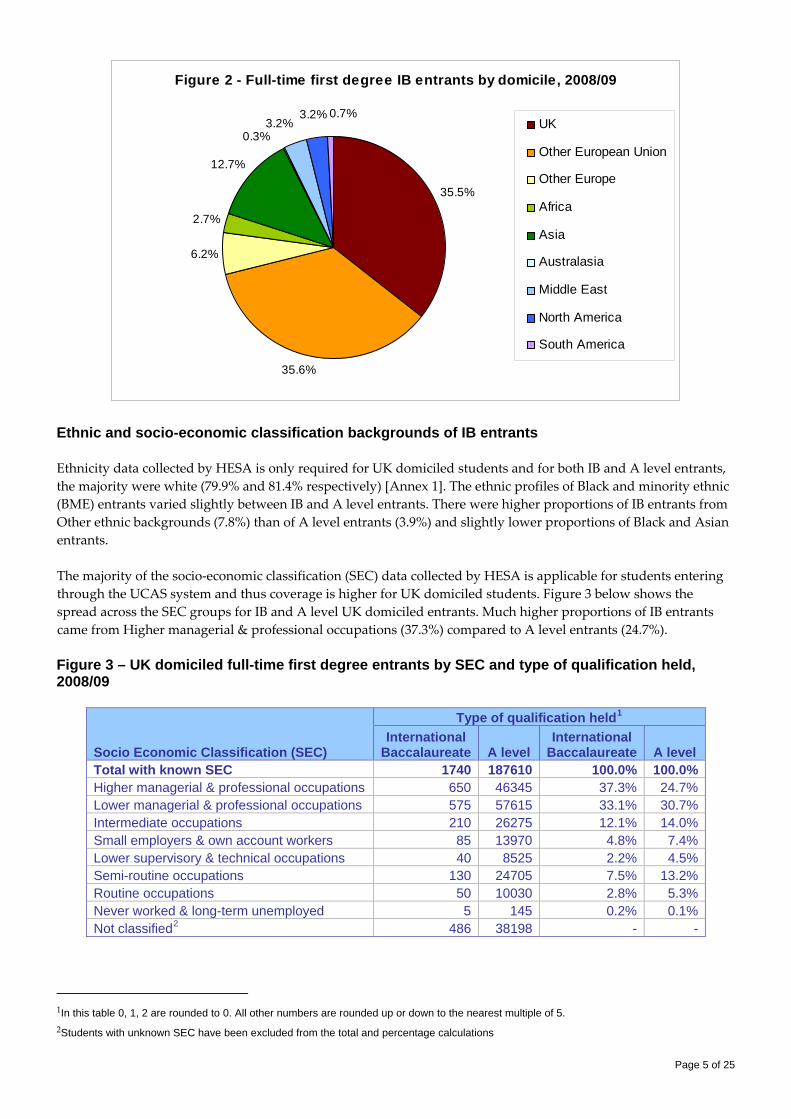
Figure 2 - Full-time first degree IB entrants by domicile, 2008/09
35.5%
35.6%
6.2%
2.7%
12.7%
0.7%3.2%3.2%
0.3%UK
Other European Union
Other Europe
Africa
Asia
Australasia
Middle East
North America
South America
Ethnic and socio-economic classification backgrounds of IB entrants Ethnicity data collected by HESA is only required for UK domiciled students and for both IB and A level entrants, the majority were white (79.9% and 81.4% respectively) [Annex 1]. The ethnic profiles of Black and minority ethnic (BME) entrants varied slightly between IB and A level entrants. There were higher proportions of IB entrants from Other ethnic backgrounds (7.8%) than of A level entrants (3.9%) and slightly lower proportions of Black and Asian entrants. The majority of the socio‐economic classification (SEC) data collected by HESA is applicable for students entering through the UCAS system and thus coverage is higher for UK domiciled students. Figure 3 below shows the spread across the SEC groups for IB and A level UK domiciled entrants. Much higher proportions of IB entrants came from Higher managerial & professional occupations (37.3%) compared to A level entrants (24.7%). Figure 3 – UK domiciled full-time first degree entrants by SEC and type of qualification held, 2008/09
Socio Economic Classification (SEC)
Type of qualification held1
International Baccalaureate A level
International Baccalaureate A level
Total with known SEC 1740 187610 100.0% 100.0%Higher managerial & professional occupations 650 46345 37.3% 24.7%Lower managerial & professional occupations 575 57615 33.1% 30.7%Intermediate occupations 210 26275 12.1% 14.0%Small employers & own account workers 85 13970 4.8% 7.4%Lower supervisory & technical occupations 40 8525 2.2% 4.5%Semi-routine occupations 130 24705 7.5% 13.2%Routine occupations 50 10030 2.8% 5.3%Never worked & long-term unemployed 5 145 0.2% 0.1%Not classified2
486 38198 - -
1In this table 0, 1, 2 are rounded to 0. All other numbers are rounded up or down to the nearest multiple of 5. 2Students with unknown SEC have been excluded from the total and percentage calculations
Page 5 of 25
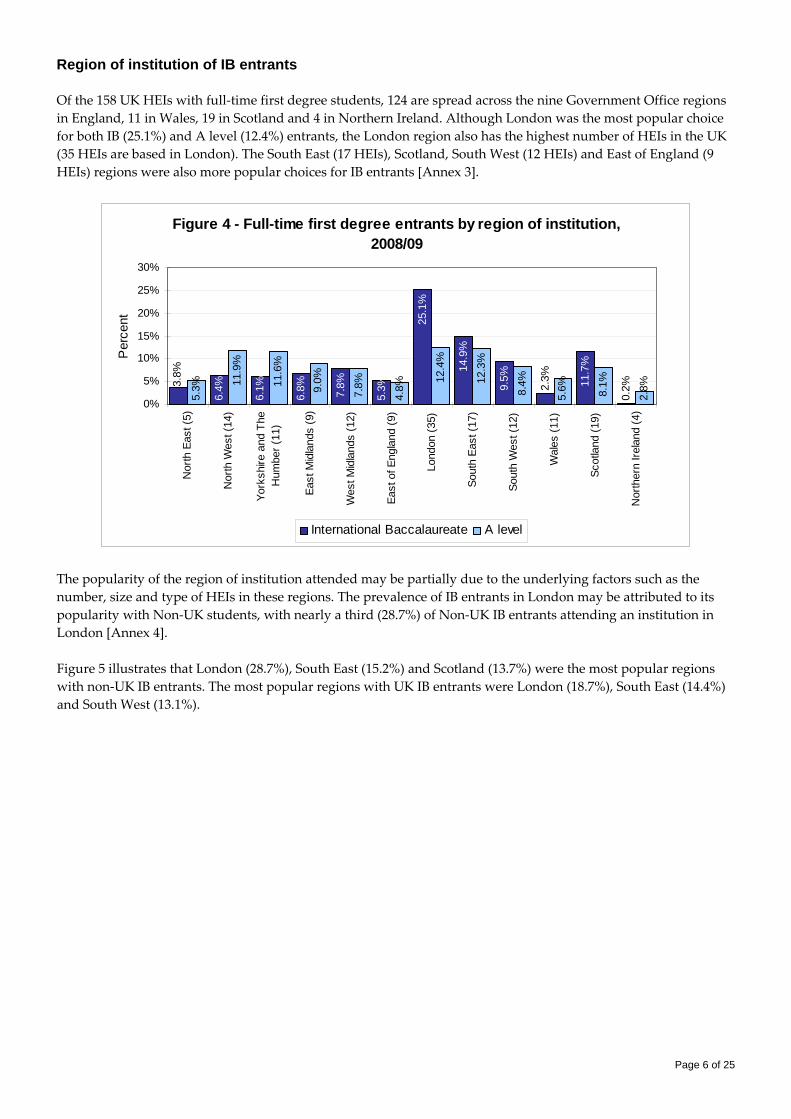
Region of institution of IB entrants Of the 158 UK HEIs with full‐time first degree students, 124 are spread across the nine Government Office regions in England, 11 in Wales, 19 in Scotland and 4 in Northern Ireland. Although London was the most popular choice for both IB (25.1%) and A level (12.4%) entrants, the London region also has the highest number of HEIs in the UK (35 HEIs are based in London). The South East (17 HEIs), Scotland, South West (12 HEIs) and East of England (9 HEIs) regions were also more popular choices for IB entrants [Annex 3].
Figure 4 - Full-time first degree entrants by region of institution, 2008/09
6.4%
6.1%
6.8% 7.8%
5.3%
25.1
%
14.9
%
9.5% 11
.7%
5.3% 11
.9%
11.6
%
9.0%
7.8%
4.8%
12.4
%
12.3
%
8.4%
5.6% 8.1%
2.8%
0.2%2.
3%3.8%
0%
5%
10%
15%
20%
25%
30%
Nor
th E
ast (
5)
Nor
th W
est (
14)
York
shire
and
The
Hum
ber (
11)
East
Mid
land
s (9
)
Wes
t Mid
land
s (1
2)
East
of E
ngla
nd (9
)
Lond
on (3
5)
Sout
h Ea
st (1
7)
Sout
h W
est (
12)
Wal
es (1
1)
Scot
land
(19)
Nor
ther
n Ire
land
(4)
Per
cent
International Baccalaureate A level
The popularity of the region of institution attended may be partially due to the underlying factors such as the number, size and type of HEIs in these regions. The prevalence of IB entrants in London may be attributed to its popularity with Non‐UK students, with nearly a third (28.7%) of Non‐UK IB entrants attending an institution in London [Annex 4]. Figure 5 illustrates that London (28.7%), South East (15.2%) and Scotland (13.7%) were the most popular regions with non‐UK IB entrants. The most popular regions with UK IB entrants were London (18.7%), South East (14.4%) and South West (13.1%).
Page 6 of 25
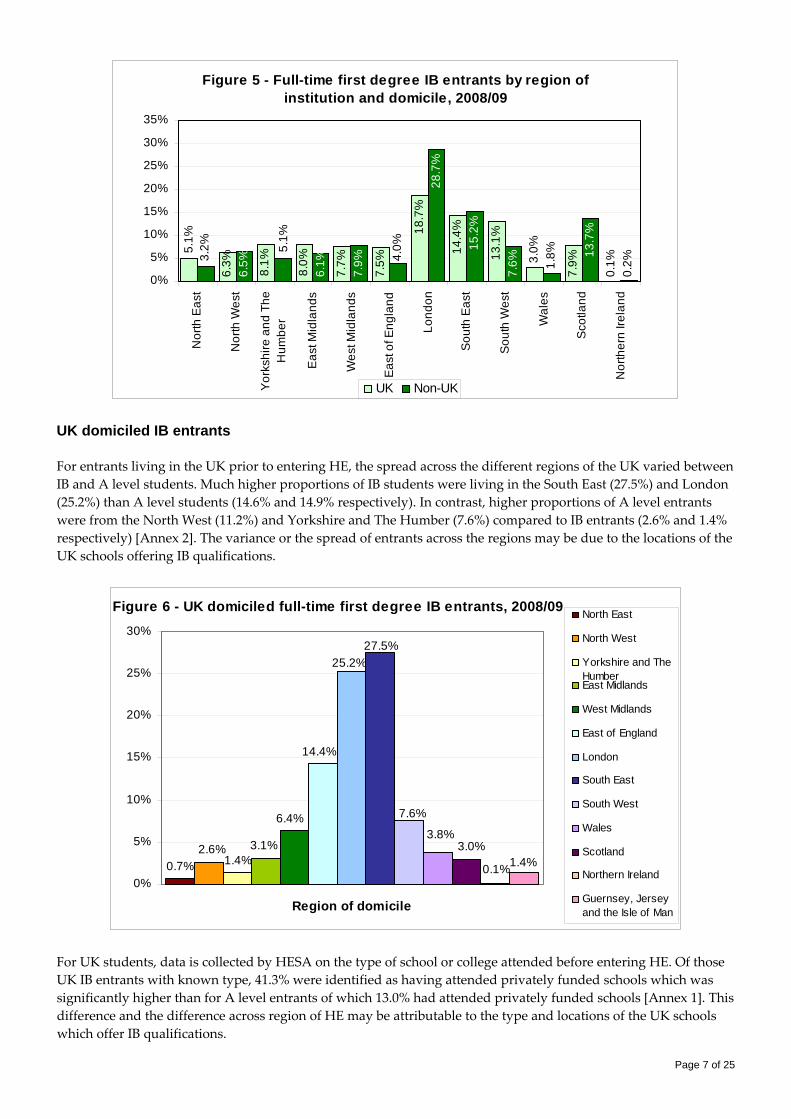
Figure 5 - Full-time first degree IB entrants by region of institution and domicile, 2008/09
6.3%
8.1%
8.0%
7.7%
7.5%
14.4
%
13.1
%
7.9%
6.5%
6.1%
7.9%
28.7
%
15.2
%
7.6%
13.7
%
5.1%
3.0%
0.1%
18.7
%
3.2%
1.8%
0.2%4.
0%5.1%
0%
5%
10%
15%
20%
25%
30%
35%
Nor
th E
ast
Nor
th W
est
Yor
kshi
re a
nd T
heH
umbe
r
Eas
t Mid
land
s
Wes
t Mid
land
s
Eas
t of E
ngla
nd
Lond
on
Sou
th E
ast
Sou
th W
est
Wal
es
Sco
tland
Nor
ther
n Ire
land
UK Non-UK
UK domiciled IB entrants For entrants living in the UK prior to entering HE, the spread across the different regions of the UK varied between IB and A level students. Much higher proportions of IB students were living in the South East (27.5%) and London (25.2%) than A level students (14.6% and 14.9% respectively). In contrast, higher proportions of A level entrants were from the North West (11.2%) and Yorkshire and The Humber (7.6%) compared to IB entrants (2.6% and 1.4% respectively) [Annex 2]. The variance or the spread of entrants across the regions may be due to the locations of the UK schools offering IB qualifications.
Figure 6 - UK domiciled full-time first degree IB entrants, 2008/09
0.7%2.6%
1.4%3.1%
6.4%
14.4%
25.2%27.5%
7.6%
3.8%3.0%
0.1%1.4%
0%
5%
10%
15%
20%
25%
30%
Region of domicile
North East
North West
Yorkshire and TheHumberEast Midlands
West Midlands
East of England
London
South East
South West
Wales
Scotland
Northern Ireland
Guernsey, Jerseyand the Isle of Man
For UK students, data is collected by HESA on the type of school or college attended before entering HE. Of those UK IB entrants with known type, 41.3% were identified as having attended privately funded schools which was significantly higher than for A level entrants of which 13.0% had attended privately funded schools [Annex 1]. This difference and the difference across region of HE may be attributable to the type and locations of the UK schools which offer IB qualifications.
Page 7 of 25
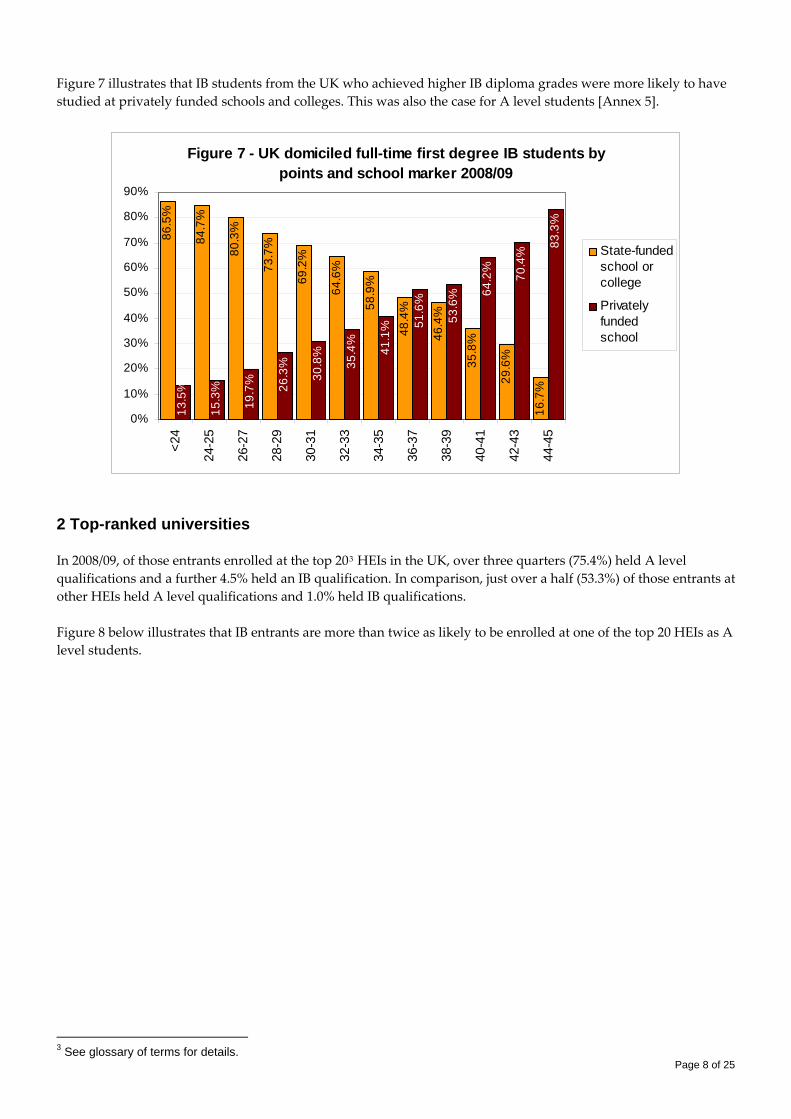
Figure 7 illustrates that IB students from the UK who achieved higher IB diploma grades were more likely to have studied at privately funded schools and colleges. This was also the case for A level students [Annex 5].
Figure 7 - UK domiciled full-time first degree IB students by points and school marker 2008/09
86.5
%
84.7
%
80.3
%
73.7
%
69.2
%
64.6
%
58.9
%
48.4
%
46.4
%
35.8
%
29.6
%
16.7
%
13.5
%
15.3
%
19.7
% 26.3
%
30.8
%
35.4
%
41.1
% 51.6
%
53.6
% 64.2
%
70.4
%
83.3
%
0%
10%
20%
30%
40%
50%
60%
70%
80%
90%<2
4
24-2
5
26-2
7
28-2
9
30-3
1
32-3
3
34-3
5
36-3
7
38-3
9
40-4
1
42-4
3
44-4
5
State-fundedschool orcollege
Privatelyfundedschool
2 Top-ranked universities In 2008/09, of those entrants enrolled at the top 203 HEIs in the UK, over three quarters (75.4%) held A level qualifications and a further 4.5% held an IB qualification. In comparison, just over a half (53.3%) of those entrants at other HEIs held A level qualifications and 1.0% held IB qualifications. Figure 8 below illustrates that IB entrants are more than twice as likely to be enrolled at one of the top 20 HEIs as A level students.
3 See glossary of terms for details.
Page 8 of 25
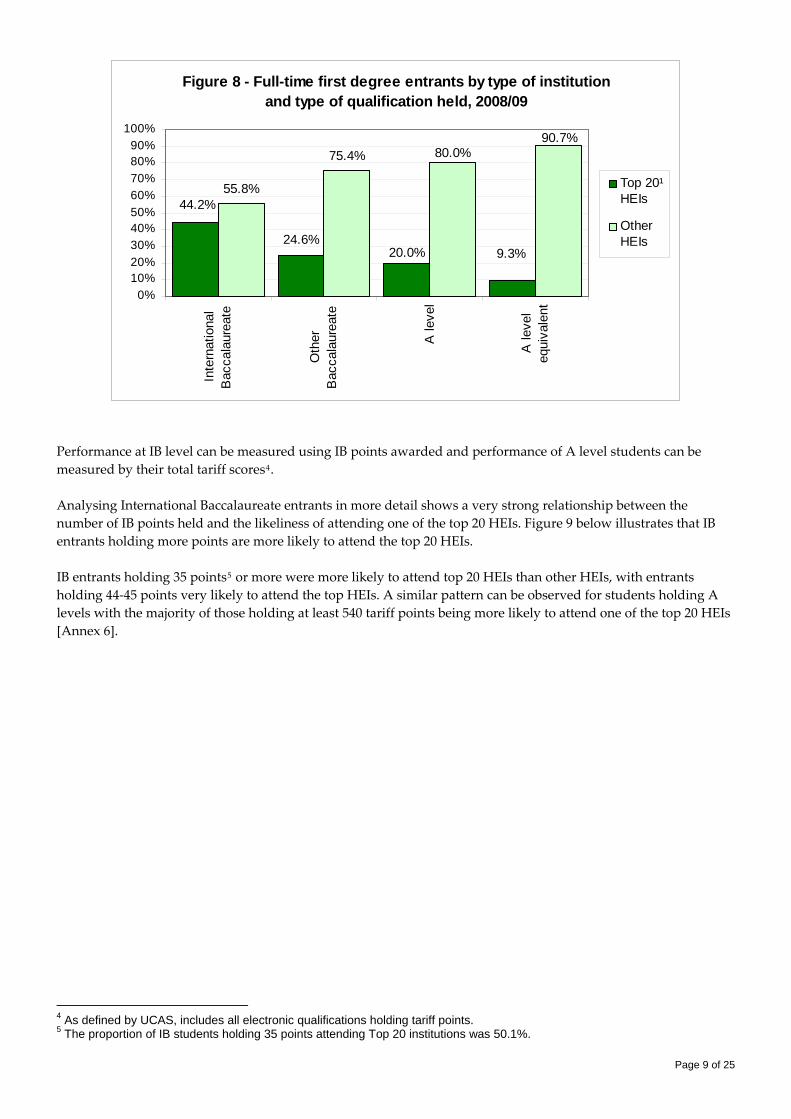
Figure 8 - Full-time first degree entrants by type of institution and type of qualification held, 2008/09
55.8%
75.4%
9.3%20.0%24.6%
44.2%
80.0%90.7%
0%10%20%30%40%50%60%70%80%90%
100%
Inte
rnat
iona
lB
acca
laur
eate
Oth
erB
acca
laur
eate
A le
vel
A le
vel
equi
vale
nt
Top 20¹HEIs
OtherHEIs
Performance at IB level can be measured using IB points awarded and performance of A level students can be measured by their total tariff scores4. Analysing International Baccalaureate entrants in more detail shows a very strong relationship between the number of IB points held and the likeliness of attending one of the top 20 HEIs. Figure 9 below illustrates that IB entrants holding more points are more likely to attend the top 20 HEIs. IB entrants holding 35 points5 or more were more likely to attend top 20 HEIs than other HEIs, with entrants holding 44‐45 points very likely to attend the top HEIs. A similar pattern can be observed for students holding A levels with the majority of those holding at least 540 tariff points being more likely to attend one of the top 20 HEIs [Annex 6].
4 As defined by UCAS, includes all electronic qualifications holding tariff points. 5 The proportion of IB students holding 35 points attending Top 20 institutions was 50.1%.
Page 9 of 25
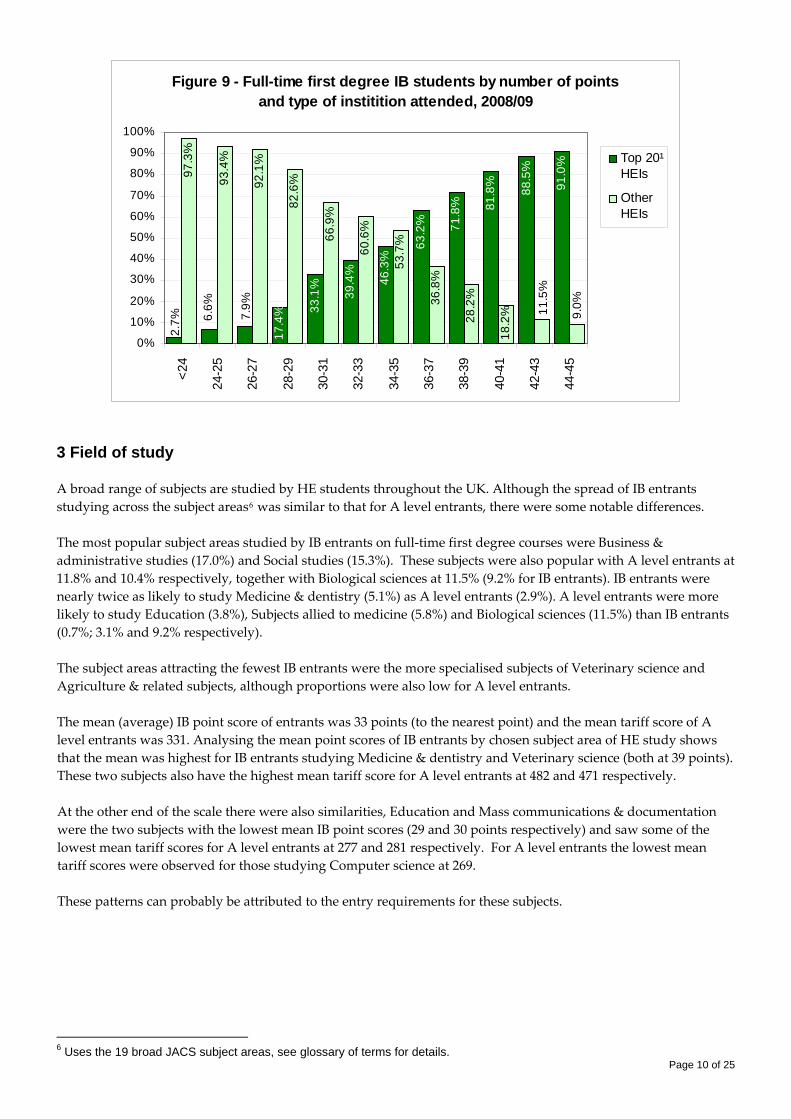
Figure 9 - Full-time first degree IB students by number of points and type of institition attended, 2008/09
17.4
% 33.1
%
39.4
%
46.3
%
63.2
% 71.8
% 81.8
%
88.5
%
91.0
%
97.3
%
93.4
%
92.1
%
82.6
%
66.9
%
60.6
%
53.7
%
36.8
%
28.2
%
18.2
%7.9%
6.6%
2.7% 9.
0%11.5
%
0%
10%
20%
30%
40%
50%
60%
70%
80%
90%
100%
<24
24-2
5
26-2
7
28-2
9
30-3
1
32-3
3
34-3
5
36-3
7
38-3
9
40-4
1
42-4
3
44-4
5
Top 20¹HEIs
OtherHEIs
3 Field of study A broad range of subjects are studied by HE students throughout the UK. Although the spread of IB entrants studying across the subject areas6 was similar to that for A level entrants, there were some notable differences. The most popular subject areas studied by IB entrants on full‐time first degree courses were Business & administrative studies (17.0%) and Social studies (15.3%). These subjects were also popular with A level entrants at 11.8% and 10.4% respectively, together with Biological sciences at 11.5% (9.2% for IB entrants). IB entrants were nearly twice as likely to study Medicine & dentistry (5.1%) as A level entrants (2.9%). A level entrants were more likely to study Education (3.8%), Subjects allied to medicine (5.8%) and Biological sciences (11.5%) than IB entrants (0.7%; 3.1% and 9.2% respectively). The subject areas attracting the fewest IB entrants were the more specialised subjects of Veterinary science and Agriculture & related subjects, although proportions were also low for A level entrants. The mean (average) IB point score of entrants was 33 points (to the nearest point) and the mean tariff score of A level entrants was 331. Analysing the mean point scores of IB entrants by chosen subject area of HE study shows that the mean was highest for IB entrants studying Medicine & dentistry and Veterinary science (both at 39 points). These two subjects also have the highest mean tariff score for A level entrants at 482 and 471 respectively. At the other end of the scale there were also similarities, Education and Mass communications & documentation were the two subjects with the lowest mean IB point scores (29 and 30 points respectively) and saw some of the lowest mean tariff scores for A level entrants at 277 and 281 respectively. For A level entrants the lowest mean tariff scores were observed for those studying Computer science at 269. These patterns can probably be attributed to the entry requirements for these subjects.
6 Uses the 19 broad JACS subject areas, see glossary of terms for details.
Page 10 of 25
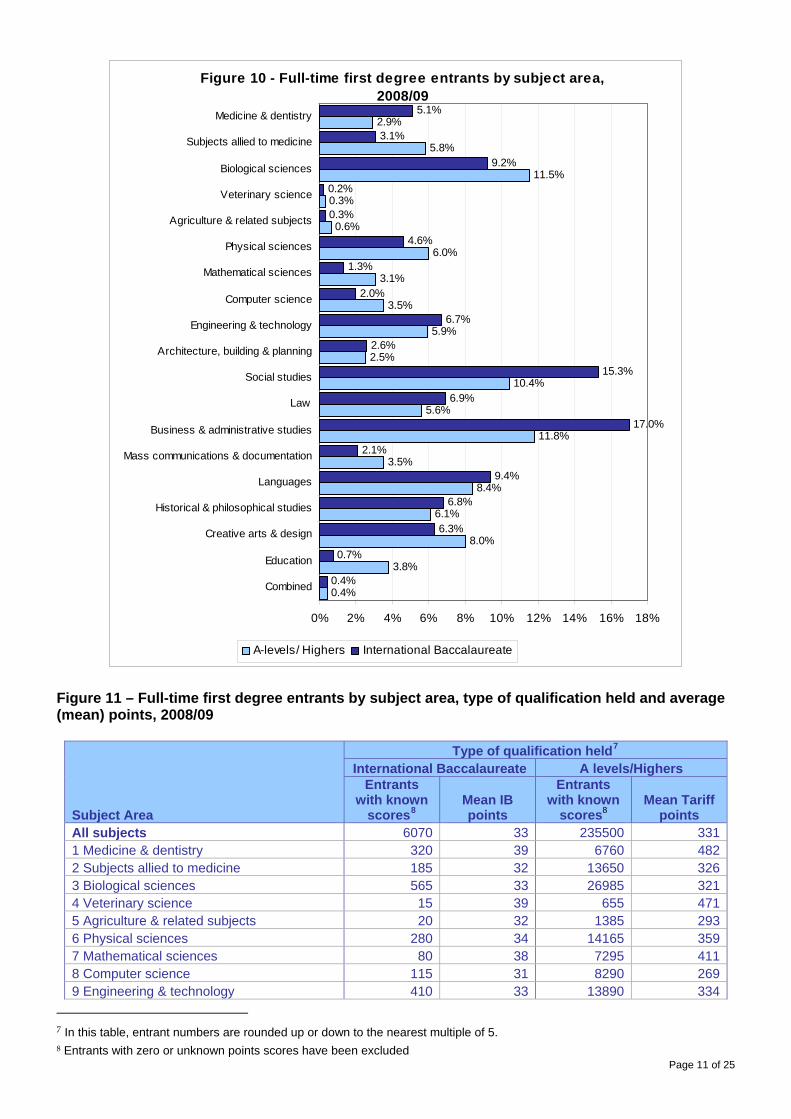
Figure 10 - Full-time first degree entrants by subject area, 2008/09
0.4%
3.8%
8.0%
6.1%
8.4%
3.5%
11.8%
5.6%
10.4%
2.5%
5.9%
3.5%
3.1%
6.0%
0.6%
0.3%
11.5%
5.8%
2.9%
0.4%
0.7%
6.3%
6.8%
9.4%
2.1%
17.0%
6.9%
15.3%
2.6%
6.7%
2.0%
1.3%
4.6%
0.3%
0.2%
9.2%
3.1%
5.1%
0% 2% 4% 6% 8% 10% 12% 14% 16% 18%
Combined
Education
Creative arts & design
Historical & philosophical studies
Languages
Mass communications & documentation
Business & administrative studies
Law
Social studies
Architecture, building & planning
Engineering & technology
Computer science
Mathematical sciences
Physical sciences
Agriculture & related subjects
Veterinary science
Biological sciences
Subjects allied to medicine
Medicine & dentistry
A-levels/ Highers International Baccalaureate
Figure 11 – Full-time first degree entrants by subject area, type of qualification held and average (mean) points, 2008/09
Subject Area
Type of qualification held7
International Baccalaureate A levels/Highers Entrants
with known scores8
Mean IB points
Entrants with known
scores8
Mean Tariff points
All subjects 6070 33 235500 3311 Medicine & dentistry 320 39 6760 4822 Subjects allied to medicine 185 32 13650 3263 Biological sciences 565 33 26985 3214 Veterinary science 15 39 655 4715 Agriculture & related subjects 20 32 1385 2936 Physical sciences 280 34 14165 3597 Mathematical sciences 80 38 7295 4118 Computer science 115 31 8290 2699 Engineering & technology 410 33 13890 334
7 In this table, entrant numbers are rounded up or down to the nearest multiple of 5. 8 Entrants with zero or unknown points scores have been excluded
Page 11 of 25
A Architecture, building & planning 160 32 5805 310B Social studies 940 34 24425 336C Law 430 34 13260 343D Business & administrative studies 1015 31 27785 294E Mass communications & documentation 120 30 8355 281F Languages 585 35 19690 370G Historical & philosophical studies 425 35 14385 367H Creative arts & design 350 31 18870 292I Education 35 29 8965 277J Combined 25 31 885 289
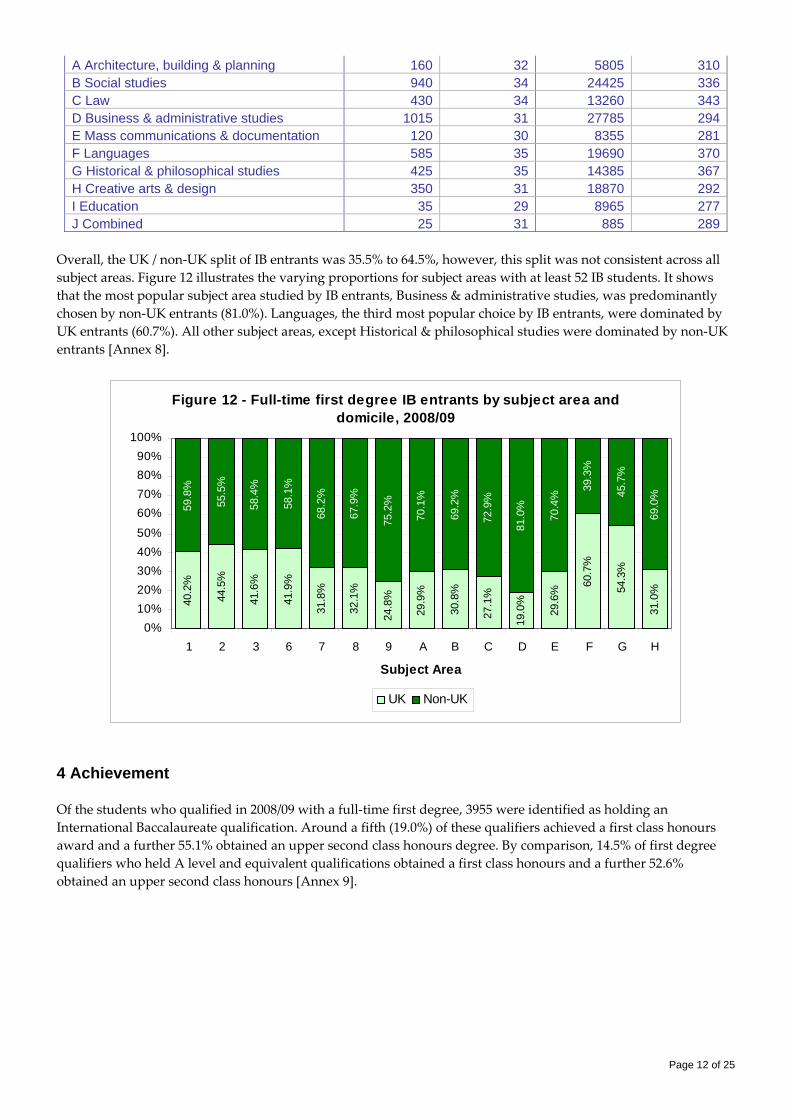
Overall, the UK / non‐UK split of IB entrants was 35.5% to 64.5%, however, this split was not consistent across all subject areas. Figure 12 illustrates the varying proportions for subject areas with at least 52 IB students. It shows that the most popular subject area studied by IB entrants, Business & administrative studies, was predominantly chosen by non‐UK entrants (81.0%). Languages, the third most popular choice by IB entrants, were dominated by UK entrants (60.7%). All other subject areas, except Historical & philosophical studies were dominated by non‐UK entrants [Annex 8].
Figure 12 - Full-time first degree IB entrants by subject area and domicile, 2008/09
40.2
%
44.5
%
41.6
%
41.9
%
31.8
%
32.1
%
24.8
%
29.9
%
30.8
%
27.1
%
29.6
%
60.7
%
54.3
%
31.0
%
59.8
%
55.5
%
58.4
%
58.1
%
68.2
%
67.9
%
75.2
%
70.1
%
69.2
%
72.9
%
81.0
%
70.4
%
39.3
%
45.7
%
69.0
%
19.0
%
0%10%20%30%40%50%
60%70%80%90%
100%
1 2 3 6 7 8 9 A B C D E F G H
Subject Area
UK Non-UK
4 Achievement Of the students who qualified in 2008/09 with a full‐time first degree, 3955 were identified as holding an International Baccalaureate qualification. Around a fifth (19.0%) of these qualifiers achieved a first class honours award and a further 55.1% obtained an upper second class honours degree. By comparison, 14.5% of first degree qualifiers who held A level and equivalent qualifications obtained a first class honours and a further 52.6% obtained an upper second class honours [Annex 9].
Page 12 of 25
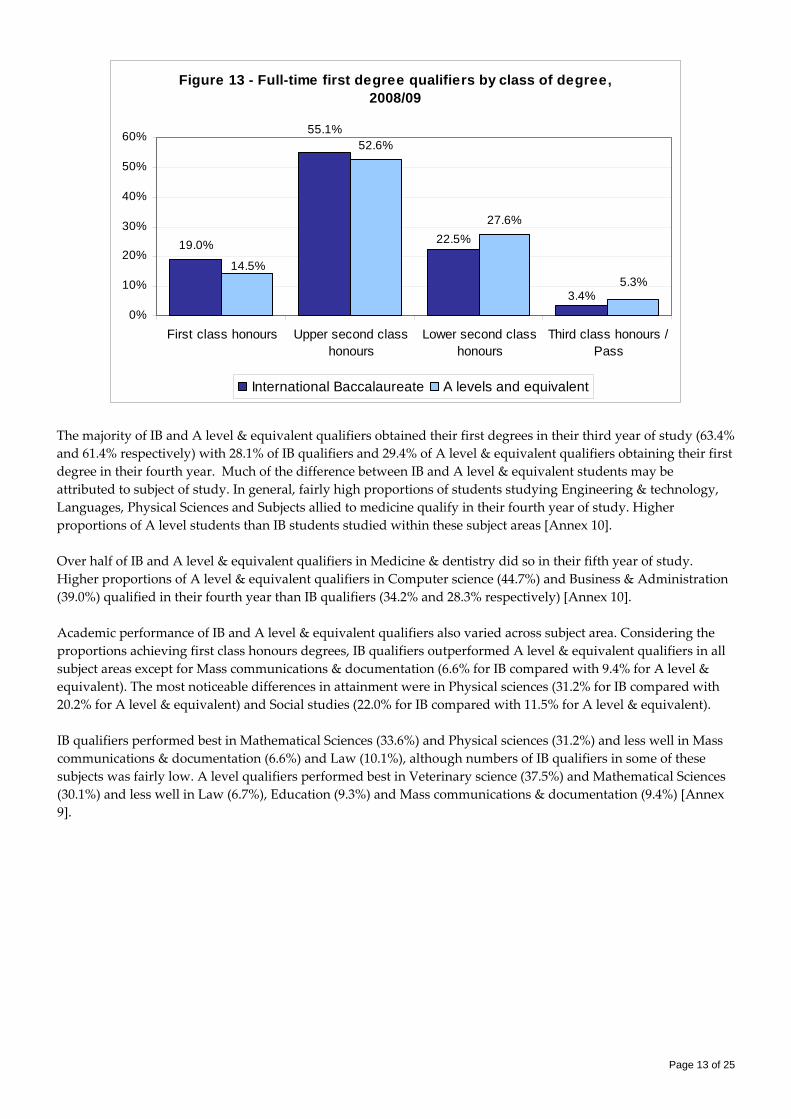
Figure 13 - Full-time first degree qualifiers by class of degree, 2008/09
19.0%
52.6%
27.6%
55.1%
22.5%
3.4%
14.5%5.3%
0%
10%
20%
30%
40%
50%
60%
First class honours Upper second classhonours
Lower second classhonours
Third class honours /Pass
International Baccalaureate A levels and equivalent
The majority of IB and A level & equivalent qualifiers obtained their first degrees in their third year of study (63.4% and 61.4% respectively) with 28.1% of IB qualifiers and 29.4% of A level & equivalent qualifiers obtaining their first degree in their fourth year. Much of the difference between IB and A level & equivalent students may be attributed to subject of study. In general, fairly high proportions of students studying Engineering & technology, Languages, Physical Sciences and Subjects allied to medicine qualify in their fourth year of study. Higher proportions of A level students than IB students studied within these subject areas [Annex 10]. Over half of IB and A level & equivalent qualifiers in Medicine & dentistry did so in their fifth year of study. Higher proportions of A level & equivalent qualifiers in Computer science (44.7%) and Business & Administration (39.0%) qualified in their fourth year than IB qualifiers (34.2% and 28.3% respectively) [Annex 10]. Academic performance of IB and A level & equivalent qualifiers also varied across subject area. Considering the proportions achieving first class honours degrees, IB qualifiers outperformed A level & equivalent qualifiers in all subject areas except for Mass communications & documentation (6.6% for IB compared with 9.4% for A level & equivalent). The most noticeable differences in attainment were in Physical sciences (31.2% for IB compared with 20.2% for A level & equivalent) and Social studies (22.0% for IB compared with 11.5% for A level & equivalent). IB qualifiers performed best in Mathematical Sciences (33.6%) and Physical sciences (31.2%) and less well in Mass communications & documentation (6.6%) and Law (10.1%), although numbers of IB qualifiers in some of these subjects was fairly low. A level qualifiers performed best in Veterinary science (37.5%) and Mathematical Sciences (30.1%) and less well in Law (6.7%), Education (9.3%) and Mass communications & documentation (9.4%) [Annex 9].
Page 13 of 25
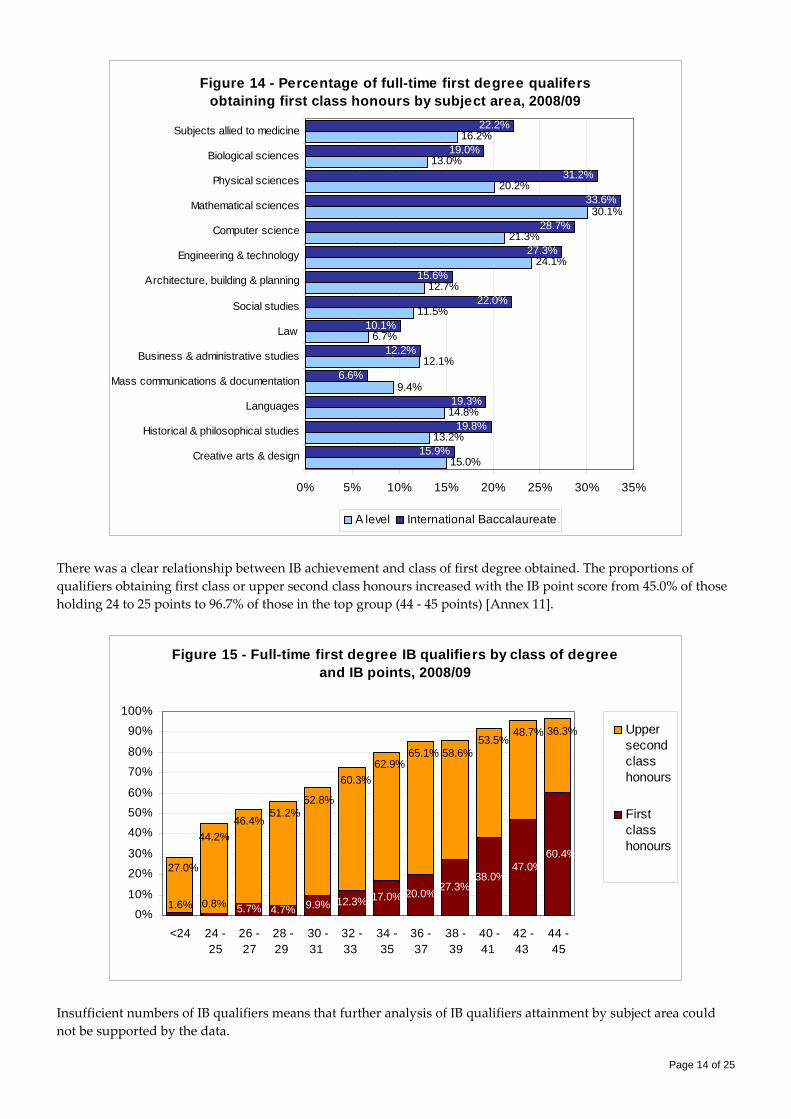
Figure 14 - Percentage of full-time first degree qualifers obtaining first class honours by subject area, 2008/09
15.0%
13.2%
14.8%
9.4%
12.1%
6.7%
11.5%
12.7%
24.1%
21.3%
30.1%
20.2%
13.0%
16.2%
15.9%
19.8%
19.3%
6.6%
12.2%
10.1%
22.0%
15.6%
27.3%
28.7%
33.6%
31.2%
19.0%
22.2%
0% 5% 10% 15% 20% 25% 30% 35%
Creative arts & design
Historical & philosophical studies
Languages
Mass communications & documentation
Business & administrative studies
Law
Social studies
Architecture, building & planning
Engineering & technology
Computer science
Mathematical sciences
Physical sciences
Biological sciences
Subjects allied to medicine
A level International Baccalaureate
There was a clear relationship between IB achievement and class of first degree obtained. The proportions of qualifiers obtaining first class or upper second class honours increased with the IB point score from 45.0% of those holding 24 to 25 points to 96.7% of those in the top group (44 ‐ 45 points) [Annex 11].
Figure 15 - Full-time first degree IB qualifiers by class of degree and IB points, 2008/09
5.7% 4.7% 9.9% 12.3% 17.0% 20.0% 27.3%1.6% 0.8%
60.4%47.0%
38.0%27.0%
44.2%46.4%
36.3%48.7%53.5%
58.6%65.1%62.9%
60.3%
52.8%51.2%
0%
10%
20%
30%
40%
50%60%
70%
80%
90%
100%
<24 24 -25
26 -27
28 -29
30 -31
32 -33
34 -35
36 -37
38 -39
40 -41
42 -43
44 -45
Uppersecondclasshonours
Firstclasshonours
Insufficient numbers of IB qualifiers means that further analysis of IB qualifiers attainment by subject area could not be supported by the data.
Page 14 of 25
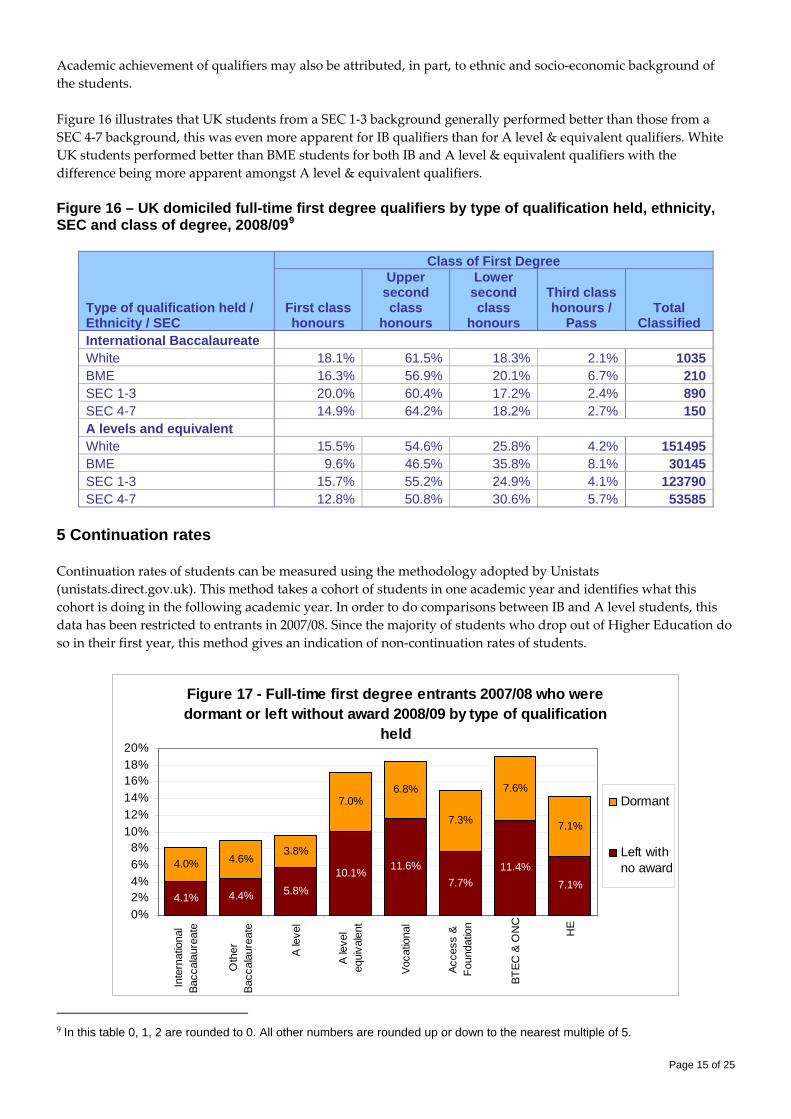
Academic achievement of qualifiers may also be attributed, in part, to ethnic and socio‐economic background of the students. Figure 16 illustrates that UK students from a SEC 1‐3 background generally performed better than those from a SEC 4‐7 background, this was even more apparent for IB qualifiers than for A level & equivalent qualifiers. White UK students performed better than BME students for both IB and A level & equivalent qualifiers with the difference being more apparent amongst A level & equivalent qualifiers. Figure 16 – UK domiciled full-time first degree qualifiers by type of qualification held, ethnicity, SEC and class of degree, 2008/099
Type of qualification held / Ethnicity / SEC
Class of First Degree
First class honours
Upper second class
honours
Lower second class
honours
Third class honours /
Pass Total
Classified International Baccalaureate White 18.1% 61.5% 18.3% 2.1% 1035BME 16.3% 56.9% 20.1% 6.7% 210SEC 1-3 20.0% 60.4% 17.2% 2.4% 890SEC 4-7 14.9% 64.2% 18.2% 2.7% 150A levels and equivalent White 15.5% 54.6% 25.8% 4.2% 151495BME 9.6% 46.5% 35.8% 8.1% 30145SEC 1-3 15.7% 55.2% 24.9% 4.1% 123790SEC 4-7 12.8% 50.8% 30.6% 5.7% 53585
5 Continuation rates Continuation rates of students can be measured using the methodology adopted by Unistats (unistats.direct.gov.uk). This method takes a cohort of students in one academic year and identifies what this cohort is doing in the following academic year. In order to do comparisons between IB and A level students, this data has been restricted to entrants in 2007/08. Since the majority of students who drop out of Higher Education do so in their first year, this method gives an indication of non‐continuation rates of students.
Figure 17 - Full-time first degree entrants 2007/08 who were dormant or left without award 2008/09 by type of qualification
held
4.4% 5.8%10.1% 11.6%
7.7%11.4%
7.1%
4.0% 4.6%3.8%
7.0%6.8%
7.3%
7.6%
7.1%
4.1%0%2%4%6%8%
10%12%14%16%18%20%
Inte
rnat
iona
lBa
ccal
aure
ate
Oth
erBa
ccal
aure
ate
A le
vel
A le
vel
equi
vale
nt
Voca
tiona
l
Acce
ss &
Foun
datio
n
BTEC
& O
NC
HE
Dormant
Left withno award
9 In this table 0, 1, 2 are rounded to 0. All other numbers are rounded up or down to the nearest multiple of 5.
Page 15 of 25
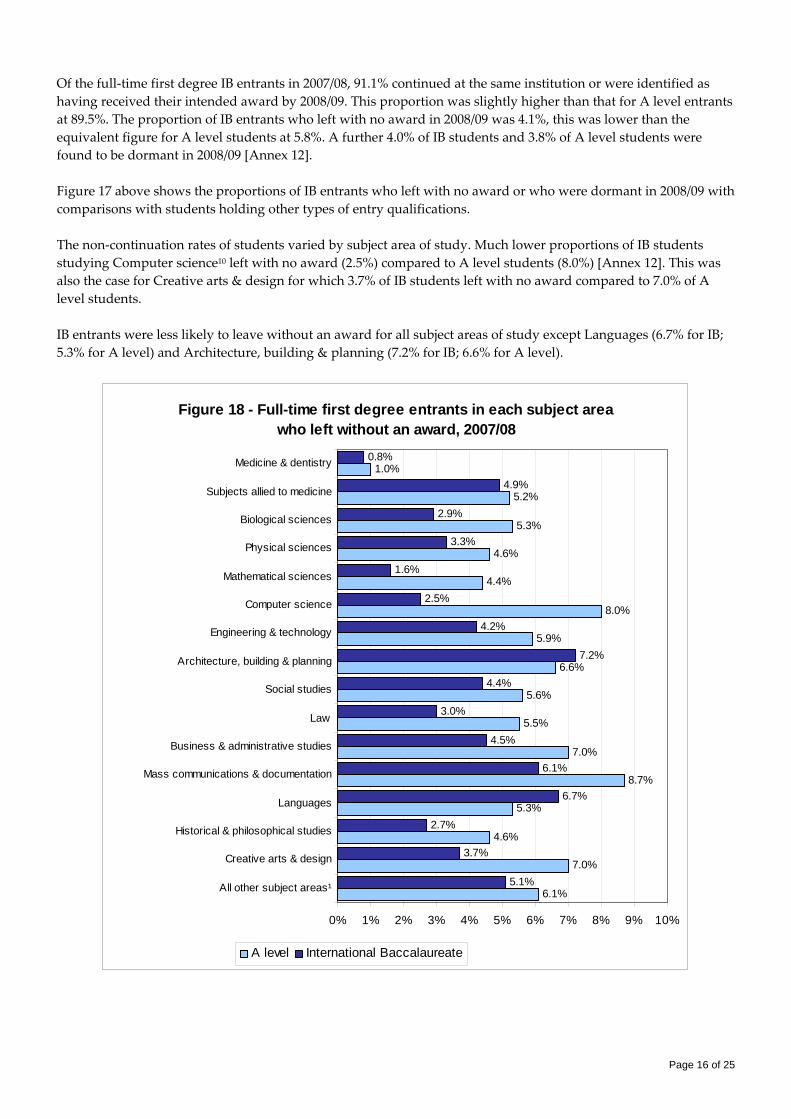
Of the full‐time first degree IB entrants in 2007/08, 91.1% continued at the same institution or were identified as having received their intended award by 2008/09. This proportion was slightly higher than that for A level entrants at 89.5%. The proportion of IB entrants who left with no award in 2008/09 was 4.1%, this was lower than the equivalent figure for A level students at 5.8%. A further 4.0% of IB students and 3.8% of A level students were found to be dormant in 2008/09 [Annex 12]. Figure 17 above shows the proportions of IB entrants who left with no award or who were dormant in 2008/09 with comparisons with students holding other types of entry qualifications. The non‐continuation rates of students varied by subject area of study. Much lower proportions of IB students studying Computer science10 left with no award (2.5%) compared to A level students (8.0%) [Annex 12]. This was also the case for Creative arts & design for which 3.7% of IB students left with no award compared to 7.0% of A level students. IB entrants were less likely to leave without an award for all subject areas of study except Languages (6.7% for IB; 5.3% for A level) and Architecture, building & planning (7.2% for IB; 6.6% for A level).
Figure 18 - Full-time first degree entrants in each subject area who left without an award, 2007/08
6.1%
7.0%
4.6%
5.3%
8.7%
7.0%
5.5%
5.6%
6.6%
5.9%
8.0%
4.4%
4.6%
5.3%
5.2%
1.0%
5.1%
3.7%
2.7%
6.7%
6.1%
4.5%
3.0%
4.4%
4.2%
2.5%
1.6%
3.3%
2.9%
4.9%
0.8%
7.2%
0% 1% 2% 3% 4% 5% 6% 7% 8% 9% 10%
All other subject areas¹
Creative arts & design
Historical & philosophical studies
Languages
Mass communications & documentation
Business & administrative studies
Law
Social studies
Architecture, building & planning
Engineering & technology
Computer science
Mathematical sciences
Physical sciences
Biological sciences
Subjects allied to medicine
Medicine & dentistry
A level International Baccalaureate
Page 16 of 25
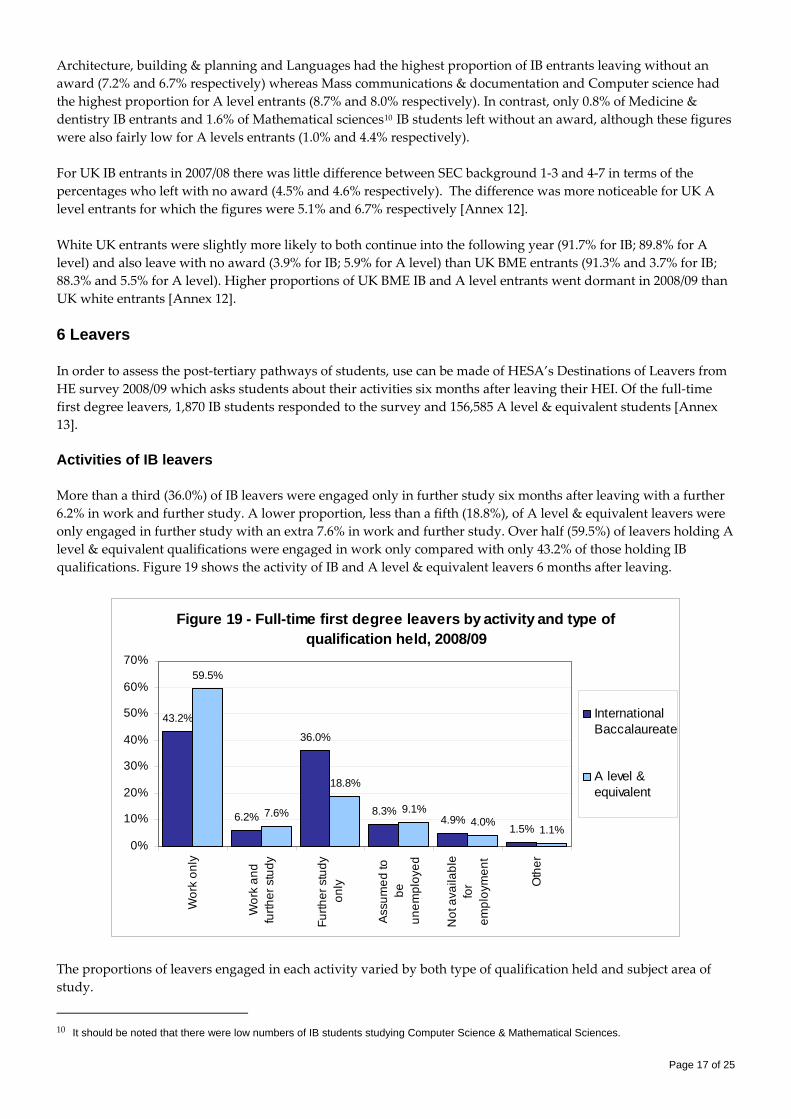
Architecture, building & planning and Languages had the highest proportion of IB entrants leaving without an award (7.2% and 6.7% respectively) whereas Mass communications & documentation and Computer science had the highest proportion for A level entrants (8.7% and 8.0% respectively). In contrast, only 0.8% of Medicine & dentistry IB entrants and 1.6% of Mathematical sciences10 IB students left without an award, although these figures were also fairly low for A levels entrants (1.0% and 4.4% respectively). For UK IB entrants in 2007/08 there was little difference between SEC background 1‐3 and 4‐7 in terms of the percentages who left with no award (4.5% and 4.6% respectively). The difference was more noticeable for UK A level entrants for which the figures were 5.1% and 6.7% respectively [Annex 12]. White UK entrants were slightly more likely to both continue into the following year (91.7% for IB; 89.8% for A level) and also leave with no award (3.9% for IB; 5.9% for A level) than UK BME entrants (91.3% and 3.7% for IB; 88.3% and 5.5% for A level). Higher proportions of UK BME IB and A level entrants went dormant in 2008/09 than UK white entrants [Annex 12]. 6 Leavers In order to assess the post‐tertiary pathways of students, use can be made of HESA’s Destinations of Leavers from HE survey 2008/09 which asks students about their activities six months after leaving their HEI. Of the full‐time first degree leavers, 1,870 IB students responded to the survey and 156,585 A level & equivalent students [Annex 13]. Activities of IB leavers More than a third (36.0%) of IB leavers were engaged only in further study six months after leaving with a further 6.2% in work and further study. A lower proportion, less than a fifth (18.8%), of A level & equivalent leavers were only engaged in further study with an extra 7.6% in work and further study. Over half (59.5%) of leavers holding A level & equivalent qualifications were engaged in work only compared with only 43.2% of those holding IB qualifications. Figure 19 shows the activity of IB and A level & equivalent leavers 6 months after leaving.
Figure 19 - Full-time first degree leavers by activity and type of qualification held, 2008/09
43.2%
6.2%
36.0%
8.3%4.9%
1.5%
59.5%
7.6%
18.8%
9.1%4.0%
1.1%0%
10%
20%
30%
40%
50%
60%
70%
Wor
k on
ly
Wor
k an
dfu
rther
stu
dy
Furth
er s
tudy
only
Ass
umed
tobe
unem
ploy
ed
Not
ava
ilabl
efo
rem
ploy
men
t
Oth
er
InternationalBaccalaureate
A level &equivalent
The proportions of leavers engaged in each activity varied by both type of qualification held and subject area of study.
10 It should be noted that there were low numbers of IB students studying Computer Science & Mathematical Sciences.
Page 17 of 25
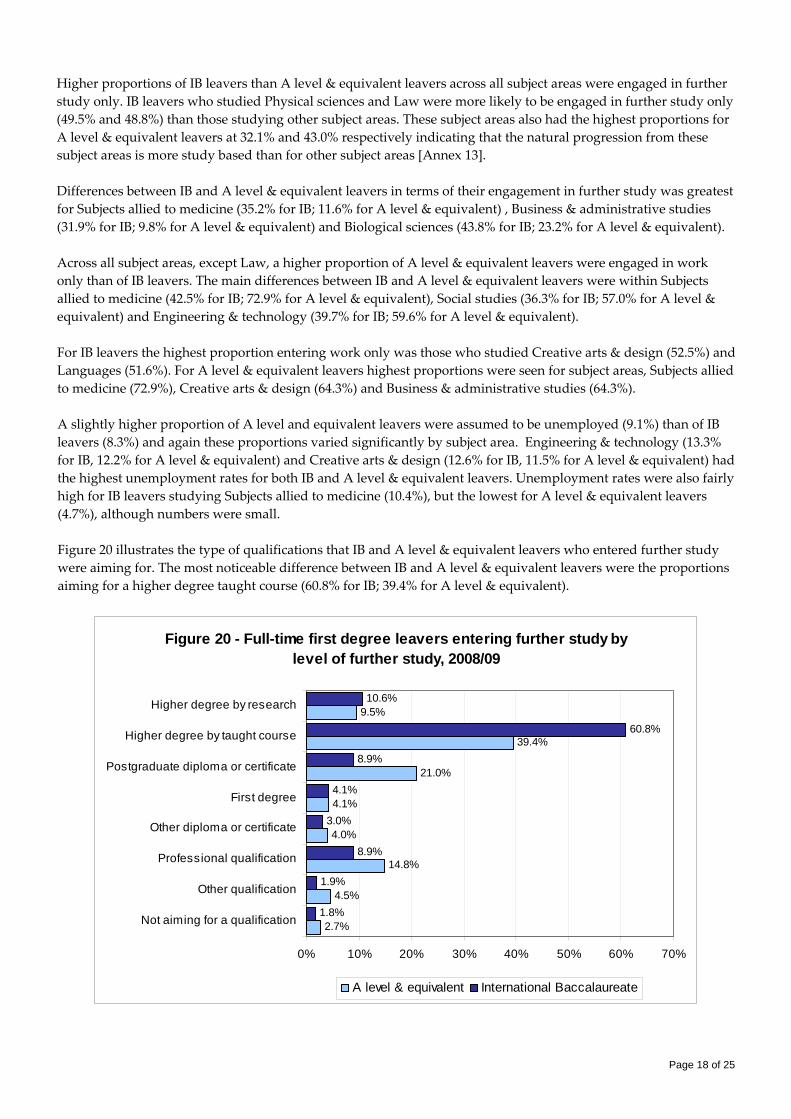
Higher proportions of IB leavers than A level & equivalent leavers across all subject areas were engaged in further study only. IB leavers who studied Physical sciences and Law were more likely to be engaged in further study only (49.5% and 48.8%) than those studying other subject areas. These subject areas also had the highest proportions for A level & equivalent leavers at 32.1% and 43.0% respectively indicating that the natural progression from these subject areas is more study based than for other subject areas [Annex 13]. Differences between IB and A level & equivalent leavers in terms of their engagement in further study was greatest for Subjects allied to medicine (35.2% for IB; 11.6% for A level & equivalent) , Business & administrative studies (31.9% for IB; 9.8% for A level & equivalent) and Biological sciences (43.8% for IB; 23.2% for A level & equivalent). Across all subject areas, except Law, a higher proportion of A level & equivalent leavers were engaged in work only than of IB leavers. The main differences between IB and A level & equivalent leavers were within Subjects allied to medicine (42.5% for IB; 72.9% for A level & equivalent), Social studies (36.3% for IB; 57.0% for A level & equivalent) and Engineering & technology (39.7% for IB; 59.6% for A level & equivalent). For IB leavers the highest proportion entering work only was those who studied Creative arts & design (52.5%) and Languages (51.6%). For A level & equivalent leavers highest proportions were seen for subject areas, Subjects allied to medicine (72.9%), Creative arts & design (64.3%) and Business & administrative studies (64.3%). A slightly higher proportion of A level and equivalent leavers were assumed to be unemployed (9.1%) than of IB leavers (8.3%) and again these proportions varied significantly by subject area. Engineering & technology (13.3% for IB, 12.2% for A level & equivalent) and Creative arts & design (12.6% for IB, 11.5% for A level & equivalent) had the highest unemployment rates for both IB and A level & equivalent leavers. Unemployment rates were also fairly high for IB leavers studying Subjects allied to medicine (10.4%), but the lowest for A level & equivalent leavers (4.7%), although numbers were small. Figure 20 illustrates the type of qualifications that IB and A level & equivalent leavers who entered further study were aiming for. The most noticeable difference between IB and A level & equivalent leavers were the proportions aiming for a higher degree taught course (60.8% for IB; 39.4% for A level & equivalent).
Figure 20 - Full-time first degree leavers entering further study by level of further study, 2008/09
2.7%
4.5%
14.8%
4.0%
4.1%
21.0%
39.4%
9.5%
1.8%
1.9%
8.9%
3.0%
4.1%
8.9%
60.8%
10.6%
0% 10% 20% 30% 40% 50% 60% 70%
Not aiming for a qualification
Other qualification
Professional qualification
Other diploma or certificate
First degree
Postgraduate diploma or certificate
Higher degree by taught course
Higher degree by research
A level & equivalent International Baccalaureate
Page 18 of 25
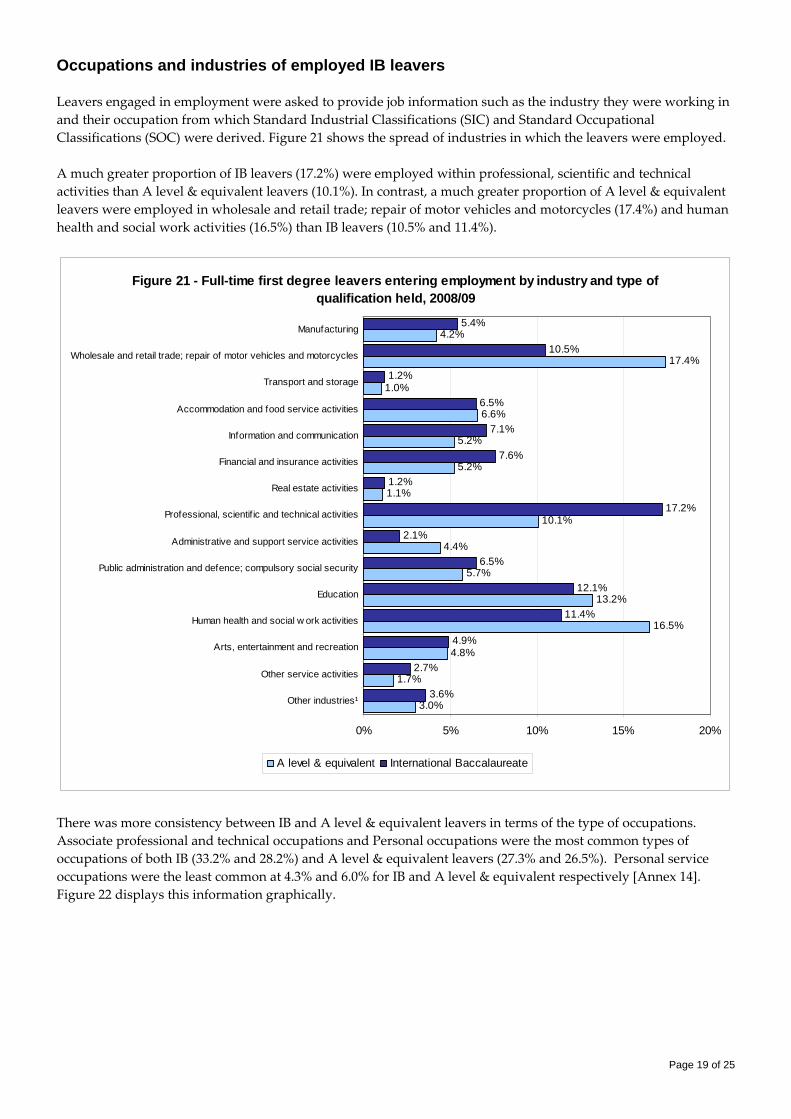
Occupations and industries of employed IB leavers Leavers engaged in employment were asked to provide job information such as the industry they were working in and their occupation from which Standard Industrial Classifications (SIC) and Standard Occupational Classifications (SOC) were derived. Figure 21 shows the spread of industries in which the leavers were employed. A much greater proportion of IB leavers (17.2%) were employed within professional, scientific and technical activities than A level & equivalent leavers (10.1%). In contrast, a much greater proportion of A level & equivalent leavers were employed in wholesale and retail trade; repair of motor vehicles and motorcycles (17.4%) and human health and social work activities (16.5%) than IB leavers (10.5% and 11.4%).
Figure 21 - Full-time first degree leavers entering employment by industry and type of qualification held, 2008/09
3.0%
1.7%
4.8%
16.5%
13.2%
5.7%
4.4%
10.1%
1.1%
5.2%
5.2%
6.6%
1.0%
17.4%
4.2%
3.6%
2.7%
4.9%
11.4%
12.1%
6.5%
2.1%
17.2%
1.2%
7.6%
7.1%
6.5%
1.2%
10.5%
5.4%
0% 5% 10% 15% 20%
Other industries¹
Other service activities
Arts, entertainment and recreation
Human health and social w ork activities
Education
Public administration and defence; compulsory social security
Administrative and support service activities
Professional, scientif ic and technical activities
Real estate activities
Financial and insurance activities
Information and communication
Accommodation and food service activities
Transport and storage
Wholesale and retail trade; repair of motor vehicles and motorcycles
Manufacturing
A level & equivalent International Baccalaureate
There was more consistency between IB and A level & equivalent leavers in terms of the type of occupations. Associate professional and technical occupations and Personal occupations were the most common types of occupations of both IB (33.2% and 28.2%) and A level & equivalent leavers (27.3% and 26.5%). Personal service occupations were the least common at 4.3% and 6.0% for IB and A level & equivalent respectively [Annex 14]. Figure 22 displays this information graphically.
Page 19 of 25
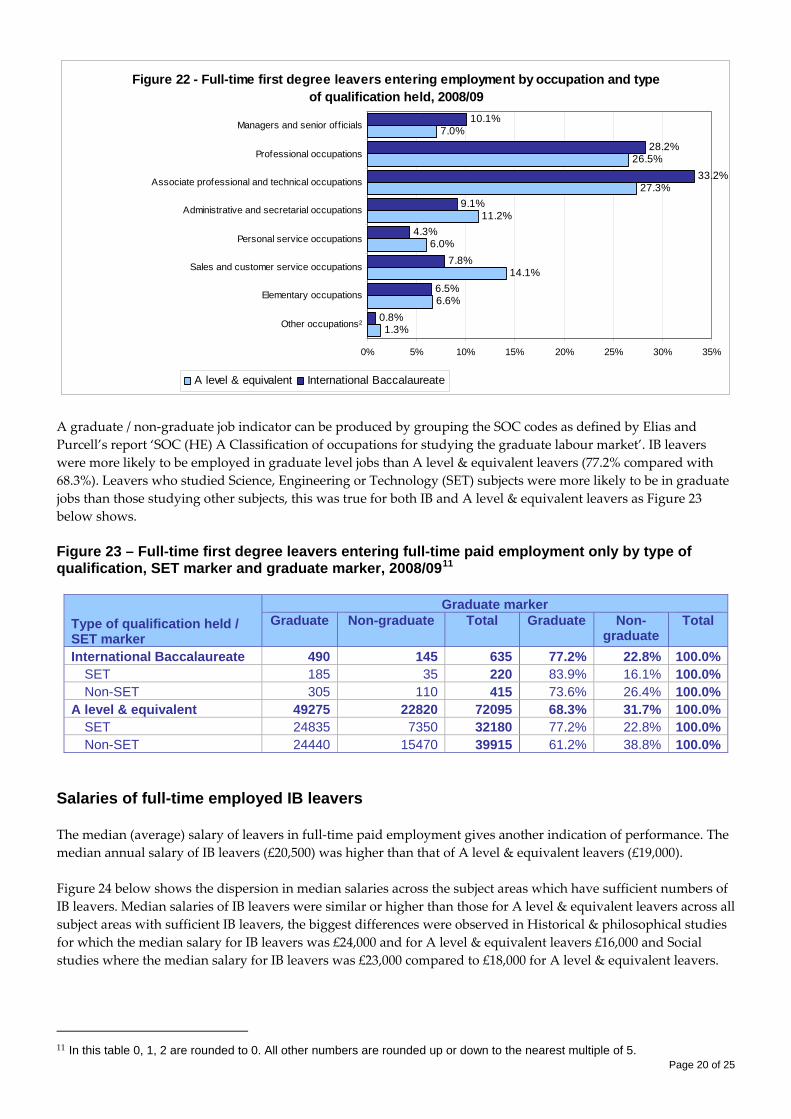
Figure 22 - Full-time first degree leavers entering employment by occupation and type of qualification held, 2008/09
1.3%
6.6%
14.1%
6.0%
11.2%
27.3%
26.5%
7.0%
0.8%
6.5%
7.8%
4.3%
9.1%
33.2%
28.2%
10.1%
0% 5% 10% 15% 20% 25% 30% 35%
Other occupations²
Elementary occupations
Sales and customer service occupations
Personal service occupations
Administrative and secretarial occupations
Associate professional and technical occupations
Professional occupations
Managers and senior off icials
A level & equivalent International Baccalaureate
A graduate / non‐graduate job indicator can be produced by grouping the SOC codes as defined by Elias and Purcell’s report ‘SOC (HE) A Classification of occupations for studying the graduate labour market’. IB leavers were more likely to be employed in graduate level jobs than A level & equivalent leavers (77.2% compared with 68.3%). Leavers who studied Science, Engineering or Technology (SET) subjects were more likely to be in graduate jobs than those studying other subjects, this was true for both IB and A level & equivalent leavers as Figure 23 below shows. Figure 23 – Full-time first degree leavers entering full-time paid employment only by type of qualification, SET marker and graduate marker, 2008/0911
Type of qualification held / SET marker
Graduate marker Graduate Non-graduate Total Graduate Non-
graduate Total
International Baccalaureate 490 145 635 77.2% 22.8% 100.0%SET 185 35 220 83.9% 16.1% 100.0%Non-SET 305 110 415 73.6% 26.4% 100.0%
A level & equivalent 49275 22820 72095 68.3% 31.7% 100.0%SET 24835 7350 32180 77.2% 22.8% 100.0%Non-SET 24440 15470 39915 61.2% 38.8% 100.0%
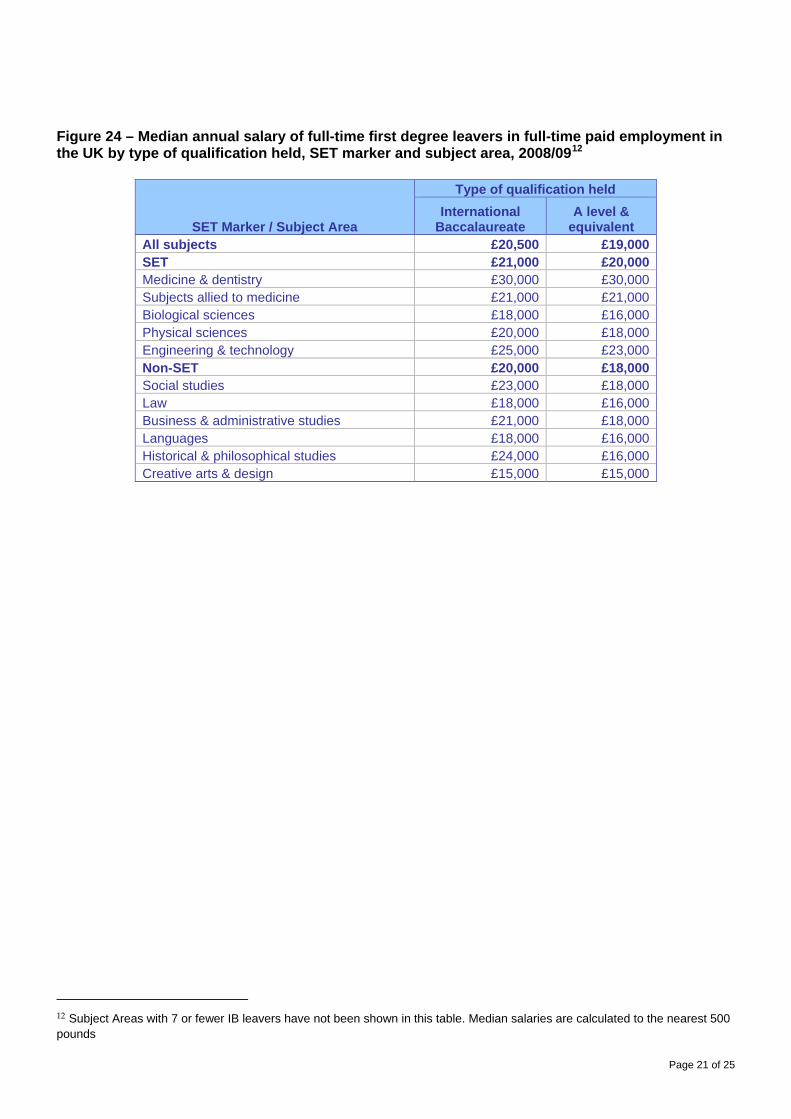
Salaries of full-time employed IB leavers The median (average) salary of leavers in full‐time paid employment gives another indication of performance. The median annual salary of IB leavers (£20,500) was higher than that of A level & equivalent leavers (£19,000). Figure 24 below shows the dispersion in median salaries across the subject areas which have sufficient numbers of IB leavers. Median salaries of IB leavers were similar or higher than those for A level & equivalent leavers across all subject areas with sufficient IB leavers, the biggest differences were observed in Historical & philosophical studies for which the median salary for IB leavers was £24,000 and for A level & equivalent leavers £16,000 and Social studies where the median salary for IB leavers was £23,000 compared to £18,000 for A level & equivalent leavers.
11 In this table 0, 1, 2 are rounded to 0. All other numbers are rounded up or down to the nearest multiple of 5.
Page 20 of 25
Page 21 of 25
Figure 24 – Median annual salary of full-time first degree leavers in full-time paid employment in the UK by type of qualification held, SET marker and subject area, 2008/0912
SET Marker / Subject Area
Type of qualification held International
Baccalaureate A level &
equivalent All subjects £20,500 £19,000 SET £21,000 £20,000 Medicine & dentistry £30,000 £30,000 Subjects allied to medicine £21,000 £21,000 Biological sciences £18,000 £16,000 Physical sciences £20,000 £18,000 Engineering & technology £25,000 £23,000 Non-SET £20,000 £18,000 Social studies £23,000 £18,000 Law £18,000 £16,000 Business & administrative studies £21,000 £18,000 Languages £18,000 £16,000 Historical & philosophical studies £24,000 £16,000 Creative arts & design £15,000 £15,000
12 Subject Areas with 7 or fewer IB leavers have not been shown in this table. Median salaries are calculated to the nearest 500 pounds
Page 22 of 25
Glossary of terms HESA standard populations Higher education (HE) students are those students on courses for which the level of instruction is above that of level 3 of the Qualifications and Curriculum Authority (QCA) National Qualifications Framework (NQF) (e.g. courses at the level of Certificate of HE and above). HESA student population is a count of the number of HE student instances active at a reporting institution in the reporting period 1 August to 31 July. Dormant students (those who have ceased studying but have not formally de‐registered); incoming visiting and exchange students; students where the whole of the programme of study is outside of the UK; students on sabbatical, and writing‐up students are excluded from the population. HESA qualifiers population is a count of student instances associated with the award of an HE qualification (excluding HE institutional credits) during the HESA reporting period 1 August to 31 July. This includes qualifications awarded from dormant, writing‐up and sabbatical status, but excludes incoming visiting and exchange students. HESA Destinations of Leavers from Higher Education (DLHE) population contains all United Kingdom (UK) and European Union (EU) domiciled students reported to HESA for the reporting period 1 August to 31 July as obtaining relevant qualifications. Awards from dormant status are not included in the population. DLHE data is based on an instance of engagement. Qualifications held Type of qualification held. Combines highest qualification on entry data held by HESA and IB data held by the IBO. It should be noted that a studentʹs highest qualification on entry HESA data is not necessarily that which was required for entry to the programme of study. The IB data identifies students known to hold an IB qualification, but this may not be their highest qualification held. In 2007/08, the HESA student record went through some major restructuring and from this point on, richer entry qualification information was collected for entrants allowing individual qualifications to be identified within other level 3 qualifications. Therefore, where possible for entrants, A level students and A level equivalent students have been shown separately. International Baccalaureate (IB) students have been identified using data supplied by the International Baccalaureate organization which has been linked to the HESA student data. Any student known to hold an IB qualification has been categorised as an IB student regardless of other qualifications they may hold. In addition, any students known to hold an IB according to the HESA student data have been categorised as an IB student. It should be noted that students holding an IB qualification in the HESA record can only be identified if they entered their HEI from 2007/08 onwards, so data for non‐entrants may undercount the number of IB students. Other Baccalaureate includes all students whose highest qualification on entry is a Baccalaureate according to the HESA student data, but who have not been identified as holding an International Baccalaureate. This includes European Baccalaureate and France Baccalaureate qualifications. A level students are those students whose highest qualification on entry is a level 3 qualification and are known to hold A level or Higher qualifications. Any student who holds and IB qualification in addition to an A level or Higher have been categorised as being an IB student. Vocational students are those students whose highest qualification on entry is a level 3 qualification and are known to hold at least one of the following qualifications: VCE Advanced, VCE Advanced Subsidiary, VCE Advanced Double Award, GNVQ/GSVQ level 3, NVQ/SVQ level 3.
Page 23 of 25
A level equivalent students are those whose highest qualification on entry is an A level equivalent qualification or combinations of level 3 qualifications excluding those who have been categorised above. A level & equivalent students are A level students plus A level equivalent students. IB Points indicates the total number of points awarded from International Baccalaureate qualifications held by IB students. The maximum number of points awarded is 45. Students with 24 or more points may be eligible for an International Baccalaureate Diploma. A level tariff points indicates the total number of tariff points (as defined by UCAS: http://www.ucas.ac.uk/students/ucas_tariff/tarifftables) held by A level students. This includes points from the A levels and Highers held plus additional points from qualifications which HEIs receive electronically from UCAS. Other terminology
Activity. Describes the activity of a leaver in the DLHE return. Work only includes those who reported that they were in full‐time paid work only (including self‐employed), part‐time paid work only plus voluntary/unpaid work only.
Classification of first degree indicates the qualification class obtained. Certain qualifications obtained at first degree level are not subject to classification of award, notably medical and general degrees. These, together with ordinary degrees and aegrotat qualifications have been included within Unclassified. Third class honours, fourth class honours and the pass have been aggregated as Third class/pass. Lower second and undivided second class honours have been aggregated as Lower second class.
Domicile data indicates the location of the studentʹs permanent or home address prior to entry to the course. UK domicile students are those whose normal residence is in the UK, and for the purposes of this publication includes Guernsey, Jersey and the Isle of Man. Entrants are those who commenced their instance in the relevant reporting period. Ethnicity. Students domiciled in England, Wales, Scotland, Northern Ireland, Guernsey, Jersey and the Isle of Man are required to report their ethnic origin. Data on the ethnicity of students has therefore been restricted to UK domiciled students. The coding frame is that recommended by the Office for National Statistics (ONS) for UK‐wide data collection. Other (including mixed) includes: Mixed ‐ White and Black Caribbean; Mixed ‐ White and Black African; Mixed ‐ White and Asian; Other mixed background; Other ethnic background. Not known includes: Not known; Information refused. Black and minority ethnic (BME) includes all non‐white categories. First degree includes first degrees (including eligibility to register to practice with a health or social care or veterinary statutory regulatory body), first degrees with Qualified Teacher Status (QTS)/registration with a General Teaching Council (GTC), enhanced first degrees, first degrees obtained concurrently with a diploma and intercalated first degrees. Full‐time students are those normally required to attend an institution for periods amounting to at least 24 weeks within the year of study, on thick or thin sandwich courses, and those on a study‐related year out of their institution. During that time students are normally expected to undertake periods of study, tuition or work experience which amount to an average of at least 21 hours per week. For qualifiers and leavers this includes writing‐up status where the mode of study was previously full‐time and students changing to dormant status previously full‐time. Graduate / non‐graduate employment marker. As defined in Elias & Purcell’s report ‘SOC (HE) A Classification of occupations for studying the graduate labour market’, uses a grouping of the SOC2000 codes. Graduate / non‐graduate data has been restricted to leavers in full‐time paid work only (including self‐employed).
Page 24 of 25
Non‐continuation marker. This has been created for full‐time first degree entrants in 2007/08 who, where possible, have been linked to 2008/09. This method is consistent with that used within the Unistats data: http://unistats.direct.gov.uk Continuing / Gained intended award. Defined as all students who are progressing into their following year of study at the same institution and fall within the HESA student population. It also includes those students who are not progressing into their following year of study and who have achieved a qualification in one of the two comparison years with that qualification deemed as being equivalent to or higher than the qualification aimed for. Gained other award. Those students who are not progressing into their following year of study and who have achieved a qualification in one of the two comparison years with that qualification deemed as being lower than the qualification aimed for. Left with no award. Those students who are not continuing into their following year of study and have not been awarded a qualification in either of the two comparison years. Dormant. Those students who have not obtained an award and are not active or have dormant or writing‐up mode. Salary. Describes the annual salary to the nearest thousand pounds before tax, for leavers employed in full‐time paid work, excluding those who were self‐employed, returned a zero salary or refused to give this information. Median salaries are displayed to the nearest £500. School type is created for all students who previous institution attended returned. This data is compulsory for undergraduate students entering through UCAS, although generic unknown school type codes may be returned. Students with known school type have been catagorised as either having attended a state‐funded school, this includes colleges and publicly funded HEIs, or a privately funded school. Percentages are based on those students with known school type. SET marker. Identifies students studying Science, engineering and technology (SET) subject areas: Medicine & dentistry; Subjects allied to medicine; Biological sciences; Veterinary science; Agriculture & related subjects; Physical sciences; Mathematical sciences; Computer science; Engineering & technology; Architecture, building & planning. Non‐SET subject areas include: Social studies; Law; Business & administrative studies; Mass communications & documentation; Languages; Historical & philosophical studies; Creative arts & design; Education; Combined. Socio‐economic classification (SEC) is used to identify the socio‐economic classification of students participating in HE. This data is compulsory for undergraduate students entering through UCAS. ʹNot classifiedʹ is a valid code and includes students; occupations not stated or inadequately described and not classifiable for other reasons. In line with the Performance Indicators (http://www.hesa.ac.uk/pi), SEC data has been grouped into categories: SEC 1‐3: 1 Higher managerial and professional occupations; 2 Lower managerial and professional occupations; 3 Intermediate occupations SEC 4‐7: 4 Small employers and own account workers; 5 Lower supervisory and technical occupations; 6 Semi‐routine occupations; 7 Routine occupations SEC N/A: 8 Never worked & long‐term unemployed; 9 Not classified Percentages are based on those students with classified known SEC data.
Standard Industrial Classification (SIC). Describes the employing organisations of those HE leavers who were employed, using the UK Standard Industrial Classification of Economic Activities 2007 (SIC 2007). Standard industry codes for economic activity are used to describe the relationship between the inputs and outputs of such activity. In cases where multiple activities take place, classification usually relates to the single most important activity. In the case of DLHE statistics, this will usually be the most important activity undertaken by an employer (or self‐employed person). Economic activities are measured by enquiring into the nature of an employerʹs (or self‐employed personʹs) business.
SIC groups with 10 or fewer IB leavers have been grouped as ‘Other industries’, these include: Agriculture, forestry and fishing; Mining and quarrying; Electricity, gas, steam and air conditioning supply; Water supply, sewerage, waste management and remediation activities; Construction; Activities of households as employers;
Page 25 of 25
undifferentiated goods and services producing activities of households for own use; Activities of extraterritorial organisations and bodies.
Standard Occupational Classification (SOC). Describes the types of job of those HE leavers who were employed, using the SOC2000 Standard Occupational Classification. SOC groups with 10 or fewer IB leavers have been grouped as ‘Other occupations’, these include: Skilled trades occupations and Process, plant and machine operatives.
Subject areas. Uses the JACS2 subject coding frame (www.hesa.ac.uk/jacs2). Additionally, a procedure of apportionment is used. Under apportionment, each student instance is, where necessary, divided in a way that in broad‐brush terms reflects the pattern of a split course. For split courses not involving an ITT component, institutions assign their own percentages based on a broad assessment of the relative contribution of subjects to a course, rather than detailed analysis of the contributions of subjects to individual studentsʹ courses of study. The recommended standard percentages are: 50% for each of the two subjects for balanced combinations; 67% and 33% for major – minor combinations and 34%, 33% and 33% for triple combinations. The sum of the proportion allocated to each subject studied on a course must equal 100. ITT students at undergraduate level who also have specialism subjects recorded (typically, secondary ITT students) are apportioned 50% to the ‘Education’ subject area and the remaining 50% is further assigned according to the percentages recommended above. Where no subject other than education is recorded, or where the student is on a PGCE course, apportionment is 100% to the ‘Education’ subject area. In analysis where percentages have been calculated within each subject area, those subject areas which have 52 or less IB students have been grouped up into an ‘all other subjects’ category. Top 20 HEIs. Although there is no standard measure of the ‘top’ HEIs in the UK, various league tables have been published by media which attempt to rank the HEIs based on various factors. For the purpose of this report, a ‘top 20’ has been created by combining the top 16 HEIs from the following publicly available league tables: The Guardian, University guide 2011: http://www.guardian.co.uk/education/table/2010/jun/04/university‐league‐table and The complete university, University league table 2011: http://www.thecompleteuniversityguide.co.uk Year of student indicates the year number that the student is in since enrolling for a course leading to the studentʹs qualification aim (whether or not the intended subject or class has changed). This could be different from the year of course if the student has changed course or retaken a year. Data protection Rounding strategy. Due to the provisions of the Data Protection Act 1998 and the Human Rights Act 1998, HESA implements a strategy in published and released tabulations designed to prevent the disclosure of personal information about any individual. This strategy involves rounding all numbers to the nearest multiple of 5. This rounding strategy is also applied to total figures, the consequence of which is that the sum of numbers in each row or column rarely matches the total shown precisely. Average values and proportions values prepared by HESA are not usually affected by the above strategy, and have been calculated on precise raw numbers. However, percentages calculated on populations which contain 52 or fewer individuals have been suppressed and represented as ʹ..ʹ as have averages based on populations of 7 or fewer.