Ambient Nitrogen Oxide Concentrations During Peak Tourist ...
Ambient Air Quality Research Project
(1996–2001)
Internal working paper no. 3
Ambient Concentrations of Polycyclic Aromatic Hydrocarbon Species in NSW

This report was prepared by staff of the Atmospheric Science Section of the Department of Environment and Conservation, Sydney. For further information about this report, phone the Director, Atmospheric Science on (02) 9995 5000. This is an internal working paper and has not been reviewed by experts in the field who are independent of the study or of the Department of Environment and Conservation. The original research contained herein is being submitted to a peer-reviewed scientific journal for publication. Department of Environment and Conservation (NSW) 59�61 Goulburn Street, Sydney PO Box A290 Sydney South NSW 1232 Phone: (02) 9995 5000 (main switchboard) Phone: 131 555 (NSW only�information and publication requests) Sydney Air Pollution Index: 1300 130 520 Fax: (02) 9995 5999 TTY: (02) 9211 4723 Email: [email protected] Website: www.environment.nsw.gov.au DEC 2004/40 ISBN 1 74137 055 8

iii
Executive Summary In September 2003, the EPA became part of the Department of Environment and
Conservation (NSW). Since the research in this report was conducted before September 2003, the organisation is referred to as the EPA throughout.
The purpose of this study was to measure the ambient concentrations of 19 polycyclic aromatic hydrocarbons (PAHs) in particulate matter only. This study was one of four studies on groups of air pollutants that together form the Ambient Air Quality Research Project (1996�2001) (NSW EPA 2002). PAHs are chemical compounds of carbon and hydrogen containing at least two six-sided (benzene) carbon rings. They are formed during the combustion of organic matter (e.g. coal, wood and diesel). There is international concern about exposure to a number of PAHs and their associated health effects. The carcinogenic potency of benzo(a)pyrene (BaP), which is a five-ring PAH, has been widely reported in the international literature. This survey was designed to determine which PAHs were present and to provide indicative concentrations of those found. The focus of the study was to collect samples during winter, when conditions are conducive to higher concentrations. Limited additional sampling conducted at other times of the year confirmed that PAH concentrations in NSW were higher in winter. Although different PAHs may exist in the atmosphere as either particles or gases, only the concentrations of PAHs in the particulate phase were measured in this study. Particulate matter with an aerodynamic equivalent diameter of less than ten micrometres (PM10) was collected using a high-volume sampler in accordance with AS 3580.9.6-1990. Analysis of PAHs was done in accordance with US EPA Method 3545. �Total PAH� concentrations in this report represent the sum of eleven PAHs, which are found predominantly in the particulate phase. Since the remaining eight PAHs occur predominantly in the vapour phase, it was not possible to estimate their total ambient concentration from the concentrations measured in the particulate phase. Sampling was undertaken at a number of sites, including the Sydney, Illawarra and lower Hunter regions, South Coast (Nowra) and the Great Dividing Range (Lithgow, Cooma, Armidale, Tumut and Orange), where the use of solid fuels for domestic heating is common. The regional variation in concentrations for measurements made in winter was large. Average total PAH concentrations (ng/m3) in the Great Dividing Range sites in winter were 7.16 at Tumut, 7.68 at Cooma, 8.62 at Armidale and 23.8 at Lithgow. The Sydney region reported 4.47 ng/m3, the lower Hunter 2.68, the Illawarra 1.71 and the South Coast 0.92. Concentrations of individual PAHs were within the ranges found in observational programs elsewhere. In particular, average concentrations were similar to those reported for Birmingham, UK (Harrison et al. 1996). The inter-seasonal variation was also large, with winter concentrations at the sites ranging from two to more than twenty times higher than those in summer. Higher winter concentrations of PAHs have also been reported overseas, particularly in the UK and Italy (Harrison et al. 1996; Menichini et al. 1999).
iv
Using published toxicity factors showed that BaP dominates the estimated total toxicity for the PAH species sampled. While there is no internationally recognised goal for total PAH, the UK and the European Commission (EC) recommend the use of BaP as a surrogate for total PAH for the development of goals. The EC has adopted an annual goal of 1.0 ng BaP/m3, while the UK has adopted a more stringent annual goal of 0.25 ng BaP/m3 to be achieved by 2010. As these goals are expressed as annual averages it is not possible to directly compare them with concentrations measured in NSW, as sampling was conducted primarily in winter rather than throughout the year. However, seasonal averages of BaP do provide indications of sites that could potentially exceed these goals. The average winter concentrations of BaP (ng/m3) in each region were 0.07 on the South Coast, 0.46 in Sydney, 0.16 in the Illawarra, 0.30 in the lower Hunter, 1.12 in Tumut and Cooma, 1.30 in Armidale and 4.21 in Lithgow. On the basis of the winter averages and the observed inter-seasonal variation, it is likely that all but one of the sites sampled would meet the EC annual goal of 1.0 ng BaP/m3. The Sydney CBD, Earlwood and the four Great Dividing Range sites would exceed the more stringent UK annual goal of 0.25 ng BaP/m3. From the strong regional and seasonal variation, it was deduced that the domestic use of solid fuels was a significant source of PAH particles in the atmosphere. Programs to reduce emissions from this source are already in place. Continued monitoring would allow assessment of the effectiveness of these programs.

v
Table of Contents
Executive Summary iii
Table of Contents v
List of Figures vii
List of TablesVII
Glossary of Terms and Acronyms viii
1 Introduction 1
1.1 Project Design and Objectives 1 1.2 Target PAH Species 2
2 Materials and Methods 5
2.1 Site Location and Characteristics 5 2.2 Sampling Schedule 7 2.3 Sampling and Analysis Procedure 8 2.4 Treatment of Concentrations Below the Detection Limit 8 2.5 Uncertainty of the Measurement Method 8 2.6 Data Analysis Method 9
3 Results 10
3.1 General Description of the Data 10 3.2 Summary of Total PAH 11
3.2.1 Analysis of PAH Results 13 3.3 Summary of BaP 15 3.4 Toxicity�BaP Equivalence 18
4 Conclusions 21
5 References 22
Further Reading 24
Appendix 1 Ring structures of Polycyclic Aromatic Hydrocarbons 26
Appendix 2 Detailed location of the sampling sites 27
Appendix 3 Detailed Methodology 30
3.1 Sampling Procedure 30 3.2 Sample Details 30 3.3 Analytical Method 30
3.3.1 Sample Extraction 30 3.3.2 Materials and Instruments 31 3.3.3 Limit of Detection 32

vi
Appendix 4 Sensitivity to Treatment of Species with Concentrations Below the Detection Limit 33
Comparison of Differing Assumptions for Concentrations Below the Detection Limit 33
Appendix 5 Summary Totals by Site 34
5.1 Summary Total PAH 34 5.2 Summary of BaP 37
Appendix 6 PAH Concentrations in Orange 39

vii
List of Figures Figure 1: Sampling locations in the Sydney region 5 Figure 2: Sampling locations in the Illawarra region 6 Figure 3: Sampling locations in the lower Hunter region 6 Figure 4: Regional sampling locations 7 Figure 5: Seasonal variations in total PAH (derived from 24-hour samples: ng/m3)
�Sydney, Illawarra and lower Hunter regions and all other sites 12 Figure 6: Seasonal variations in total PAH (derived from 24-hour samples: ng/m3)
�Sydney sites 13 Figure 7: Seasonal variations in BaP�Sydney, Illawarra and lower Hunter regions
and all other sites 17 Figure 8: Seasonal variations in BaP�Sydney sites 17 Figure 9: Average winter BaP concentration and annual goals 18 Figure 10: Average BaP equivalence by site and season 20 Figure 11: Seasonal average contribution to TEQ 20
List of Tables Table 1: PAH species sampled 4 Table 2: Aggregate sample count per site for August 1997 to February 2001 7 Table 3: Frequency of detection of each PAH 10 Table 4: Total PAH (derived from 24-hour samples: ng/m3) in winter and summer
�Sydney, Illawarra and lower Hunter regions and all other sites 11 Table 5: Total PAH (derived from 24-hour samples: ng/m3) in winter and summer
�Sydney sites 12 Table 6: Comparison of seasonal average concentration 14 Table 7: Fuel use in New South Wales 15 Table 8: Average minimum temperature�winter 2002 15 Table 9: BaP (derived from 24-hour samples: ng/m3) in winter and summer
�Sydney, Illawarra and lower Hunter regions and all other sites 16 Table 10: BaP (derived from 24-hour samples: ng/m3) in winter and summer
�Sydney sites 16 Table 11: Potency equivalence factors 19

viii
Glossary of Terms and Acronyms ABARE Australian Bureau of Agricultural and Resource Economics ASE accelerated solvent extractor BHP Broken Hill Proprietary Limited CARB California Air Resources Board CBD central business district GC/MS gas chromatography/mass spectrometry IUPAC International Union of Pure and Applied Chemistry ng nanogram NSW EPA New South Wales Environment Protection Authority PAH polycyclic aromatic hydrocarbons (polynuclear aromatic
hydrocarbons) PEF potency equivalence factor PM10 particulate matter with aerodynamic diameter of 10 microns or
less QC quality control TEQ toxicity equivalent US EPA United States Environmental Protection Agency

Ambient Air Quality Research Project: Ambient concentrations of polycyclic aromatic hydrocarbon species in NSW 1.
1 Introduction Polycyclic aromatic hydrocarbons (PAHs) are chemical compounds of carbon and hydrogen containing at least two six-sided (benzene) carbon rings. They may contain many fused rings, some of which may not be six-sided. Hundreds of PAHs have been identified in atmospheric particles (Lao et al. 1973; Lee et al. 1976). PAHs are formed during the combustion of organic matter. Sources of PAHs include diesel and gasoline engines, solid fuels (e.g. coal and wood for heating and cooking), industrial processes (e.g. coke ovens used for steel manufacture, aluminium smelters and oil refining) and the burning of vegetation (e.g. stubble burning, bushfire hazard reduction and bushfires). There is international concern about exposure to a number of PAHs and their associated health effects. The carcinogenic potency of benzo(a)pyrene (BaP), which is a five-ring PAH, has been widely reported in the international literature. The US EPA (1988) has identified sixteen priority PAHs based on concerns that they cause or might cause cancer in animals and humans. The International Agency for Research on Cancer and the US EPA have classified some of the PAH species as known or suspected carcinogens (Table 1). 1.1 Project Design and Objectives This study was designed as a screening survey of the ambient concentrations of 19 PAHs in the PM10 fraction at a number of urban and rural sites in NSW. In winter, some parts of Sydney and a number of larger towns located in the Great Dividing Range suffer from visibly high levels of smoke, which are largely due to domestic use of solid fuel heaters and still weather conditions. The objectives of the study were to determine which PAHs were present in ambient air and to provide indicative concentrations, with a focus on collecting samples during winter, when conditions are conducive to higher concentrations, particularly in these problem areas. Limited additional sampling conducted during other seasons confirmed that PAH concentrations are higher in winter. Higher winter concentrations of particulate PAHs have been reported elsewhere (Harrison et al. 1996). Menichini et al. (1999) also reported that concentrations of PAHs measured at a site in Rome, Italy, tended to be about one order of magnitude higher in winter than in summer (cited in European Commission 2001). Factors contributing to higher concentrations of PAHs in winter include: • less mixing in the atmosphere in winter due to stronger and more frequent temperature
inversions, which can trap pollutants in a shallow layer at ground level; and still conditions, which further limit the dispersion of pollutants
• higher overall emissions in winter from wood and coal burning in solid fuel heaters • slower removal of PAHs from the atmosphere in winter due to reduced degradation by
photo-oxidation and reaction with hydroxyl radicals (European Commission 2001). In this study, samples were collected from twenty-two sites in the major cities and selected rural centres of NSW. Sites in the Sydney, Illawarra and lower Hunter regions and in Nowra were selected to cover a range of urban conditions; sites in the Great Dividing Range (Lithgow, Cooma, Armidale, Tumut and Orange) were chosen to represent areas with significant use of domestic solid fuel heaters. A number of different methods are used internationally to sample and analyse PAHs in ambient air. The list of PAH species targeted and the phase collected (vapour and/or

Ambient Air Quality Research Project: Ambient concentrations of polycyclic aromatic hydrocarbon species in NSW 2.
particulate) also varies. In studies conducted in Germany and Italy, for example, only the particulate phase PAHs were collected, whereas both the particulate and vapour phases were collected in studies in the UK and France (European Commission 2001). In this study, concentrations of PAHs in the particulate phase were measured, while concentrations in the vapour phase were excluded (see discussion in section 1.2). Particulate matter with an aerodynamic equivalent diameter of less than ten micrometres (PM10) represents those particles that can pass beyond the larynx and deposit in the airways and in the deep lung. Because lung cancer is the main risk associated with inhaled PAHs, and this disease occurs in both the large airways and the deep lung, PM10 is an appropriate measurement basis for PAHs (European Commission 2001). PM10 was collected using a high-volume sampler in accordance with AS 3580.9.6-1990, while analysis of PAHs was done in accordance with US EPA Method 3545 (see Appendix 3). While there is no internationally recognised goal for PAHs, the UK and the European Commission (EC) recommend the use of benzo(a)pyrene (BaP) as a surrogate for total PAH for the development of goals. The EC has adopted an annual BaP goal of 1.0 ng/m3 measured in the PM10 fraction (European Commission 2003). Note that NSW EPA (2002) was published before the EC's goal for BaP was finalised and as a result contains the draft goal. The EC reports that BaP can be used as a marker of the carcinogenic risk of airborne PAHs, despite not necessarily being the most potent carcinogen present. BaP has been shown to make a consistent contribution to the total carcinogenic activity of predominantly particle-bound PAHs on the basis of carcinogenic potency factors and measured annual average concentrations at a wide range of European sites, including the UK, Italy, Netherlands and Sweden (European Commission 2001). On the basis of the knowledge of physical and chemical removal processes, BaP appears to be a suitable marker for total PAH for most atmospheric conditions appropriate to Europe (European Commission 2001). The UK has adopted a more stringent annual goal of 0.25 ng BaP/m3 to be achieved by 2010 (DEFRA 2003). This UK goal is based on research that indicates that: • the relative proportion of BaP in total PAH in each sample does not vary greatly • even though found at modest concentrations, BaP was the largest contributor to total
carcinogenic activity of the seven PAHs considered. The other six being benz(a)anthracene, dibenz(a,h)anthracene, benzo(b)fluoranthene, benzo(k)fluoranthene, indeno(1,2,3-c,d)pyrene and chrysene (DEFRA 1999).
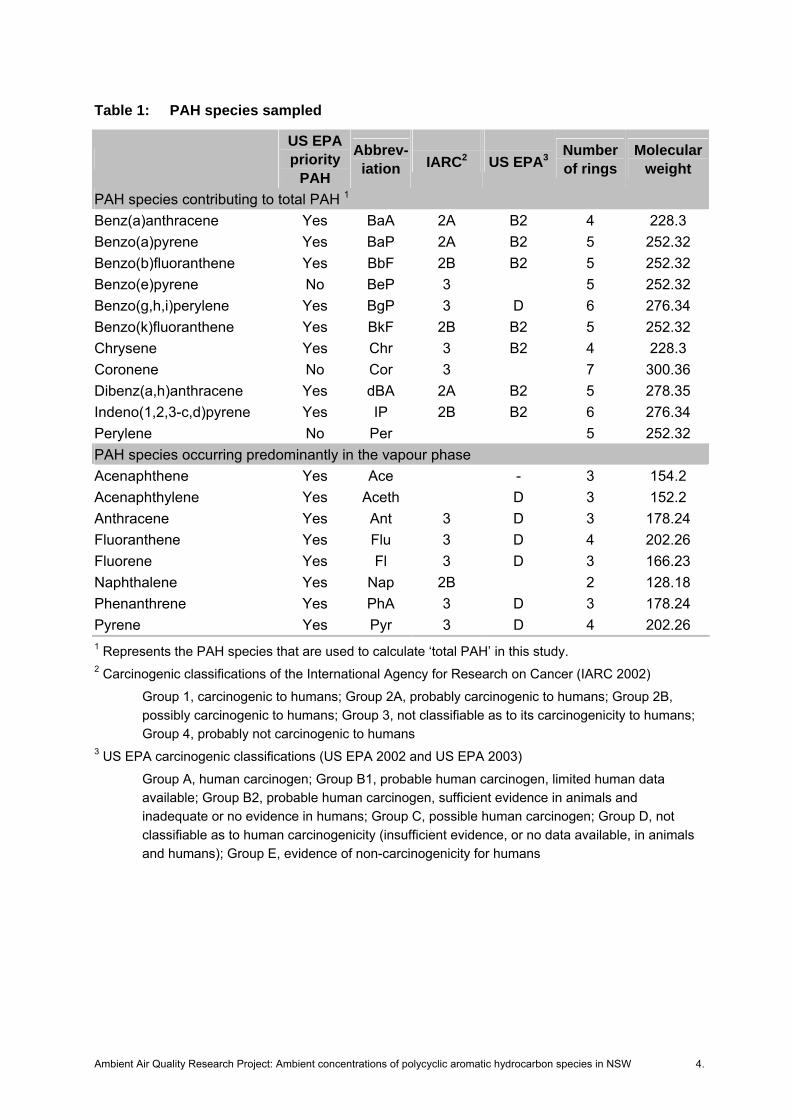
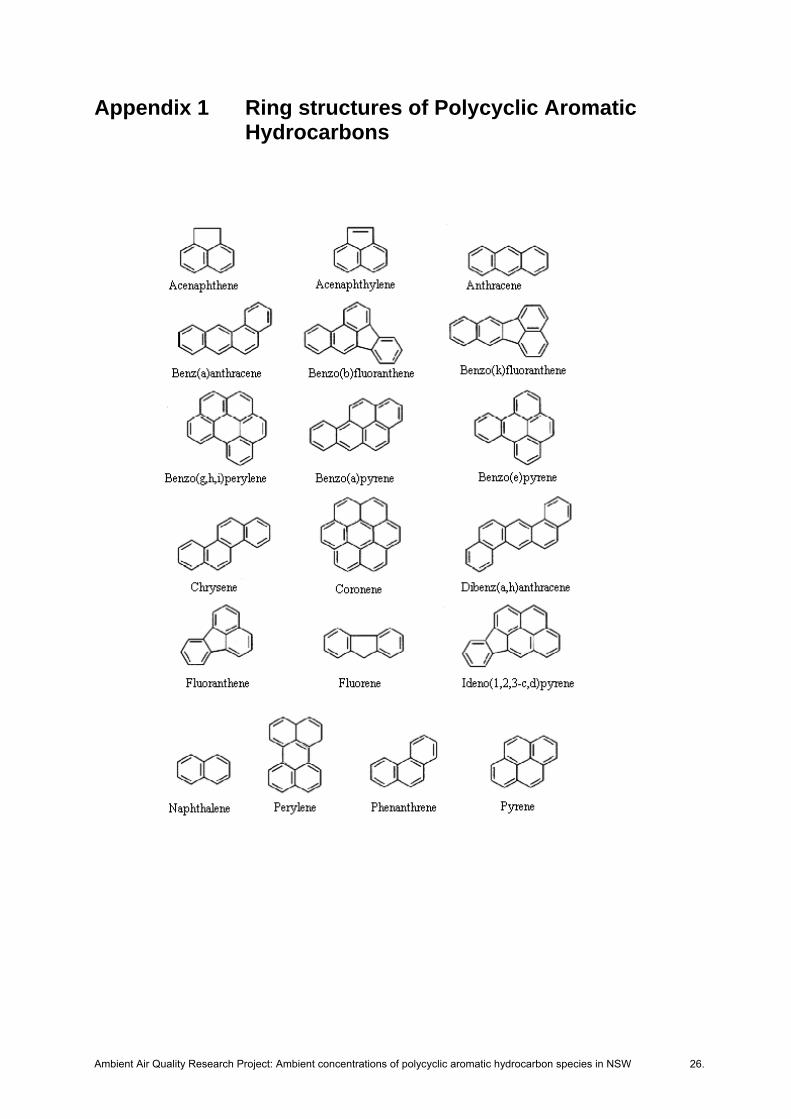
As these goals are expressed as annual averages it is not possible to directly compare them with concentrations measured in NSW, as sampling was primarily conducted in winter rather than throughout the year. However, seasonal averages of BaP indicate sites that could exceed these goals. 1.2 Target PAH Species Table 1 presents the nineteen PAH species measured in this study, referred to by their International Union of Pure and Applied Chemistry (IUPAC) names and abbreviations, which are used throughout this report. The physical and chemical properties of PAHs are dependent on the number of aromatic rings and the molecular mass (see Appendix 1 for the ring structure of selected PAHs).
Ambient Air Quality Research Project: Ambient concentrations of polycyclic aromatic hydrocarbon species in NSW 3.
At usual ambient temperatures, PAHs exist in the atmosphere as a gas, or adsorbed onto solid particles, or as particles (Finlayson-Pitts and Pitts 2000). Lighter PAHs (lower molecular weight, fewer rings) are more likely to be in the gas (or vapour) phase rather than in the particle phase. The lightest member of the PAH family is naphthalene, a two-ring species, and is found in the vapour phase in the atmosphere. PAHs with three to five rings may have vapour pressures in an intermediate range and are present �in part in the gas phase and partially associated with particles� (ibid). Such species are referred to as semivolatile. PAHs with five or more rings tend to be solids adsorbed onto other particulate matter in the atmosphere. Park et al. (2001) collected both particulate and gaseous PAHs in Galveston (Texas, USA) and found that on average, for the two and three-ring species less than 5% of PAHs was in the particle phase. Of the four-ring species, fluoranthene and pyrene also had less than 5% in the particle phase, while chrysene had on the order of 25%, and benz(a)anthracene about 45%. PAH species with five rings or more had greater than 50% in the particle phase. These are indicative percentages based on the average of the weekly daytime sampling for a six-month period from February to August. In this study, eight of the nineteen PAHs targeted generally occur predominantly in the vapour phase; namely naphthalene, acenaphthene, acenaphthylene, fluorene, anthracene, phenanthrene, fluoranthene and pyrene. For these eight PAHs, the fraction in the particle phase varies with temperature and with the chemical and physical properties of the particles present. Since these eight PAHs occur predominantly in the vapour phase, it was not possible to estimate their total concentration just from the concentration measured in the particulate phase only. The remaining eleven PAHs targeted in this study are found predominantly in the particulate phase; namely benz(a)anthracene, benzo(a)pyrene, benzo(b)fluoranthene, benzo(e)pyrene, benzo(g,h,i)perylene, benzo(k)fluoranthene, chrysene, coronene, dibenz(a,h)anthracene, indeno(1,2,3-c,d)pyrene and perylene. The �total PAH� values presented in this report are the sum of these eleven PAH species. Of the nineteen PAHs targeted in this study, sixteen have been identified as priority PAHs by the US EPA on the basis of concerns that they cause or might cause cancer in animals and humans (see Table 1). These sixteen PAHs also form the subject group for PAH monitoring in the USA, UK, Austria, France (Paris), Greece and Luxembourg (European Commission 2001). The analytical methodology used in this study allowed for the determination of an additional three PAHs (benzo(e)pyrene, coronene and perylene).
Ambient Air Quality Research Project: Ambient concentrations of polycyclic aromatic hydrocarbon species in NSW 4.
Table 1: PAH species sampled
US EPA priority
PAH
Abbrev-iation
IARC2
US EPA3 Number
of rings Molecular
weight
PAH species contributing to total PAH 1 Benz(a)anthracene Yes BaA 2A B2 4 228.3 Benzo(a)pyrene Yes BaP 2A B2 5 252.32 Benzo(b)fluoranthene Yes BbF 2B B2 5 252.32 Benzo(e)pyrene No BeP 3 5 252.32 Benzo(g,h,i)perylene Yes BgP 3 D 6 276.34 Benzo(k)fluoranthene Yes BkF 2B B2 5 252.32 Chrysene Yes Chr 3 B2 4 228.3 Coronene No Cor 3 7 300.36 Dibenz(a,h)anthracene Yes dBA 2A B2 5 278.35 Indeno(1,2,3-c,d)pyrene Yes IP 2B B2 6 276.34 Perylene No Per 5 252.32 PAH species occurring predominantly in the vapour phase Acenaphthene Yes Ace - 3 154.2 Acenaphthylene Yes Aceth D 3 152.2 Anthracene Yes Ant 3 D 3 178.24 Fluoranthene Yes Flu 3 D 4 202.26 Fluorene Yes Fl 3 D 3 166.23 Naphthalene Yes Nap 2B 2 128.18 Phenanthrene Yes PhA 3 D 3 178.24 Pyrene Yes Pyr 3 D 4 202.26 1 Represents the PAH species that are used to calculate �total PAH� in this study. 2 Carcinogenic classifications of the International Agency for Research on Cancer (IARC 2002)
Group 1, carcinogenic to humans; Group 2A, probably carcinogenic to humans; Group 2B, possibly carcinogenic to humans; Group 3, not classifiable as to its carcinogenicity to humans; Group 4, probably not carcinogenic to humans
3 US EPA carcinogenic classifications (US EPA 2002 and US EPA 2003) Group A, human carcinogen; Group B1, probable human carcinogen, limited human data available; Group B2, probable human carcinogen, sufficient evidence in animals and inadequate or no evidence in humans; Group C, possible human carcinogen; Group D, not classifiable as to human carcinogenicity (insufficient evidence, or no data available, in animals and humans); Group E, evidence of non-carcinogenicity for humans

Ambient Air Quality Research Project: Ambient concentrations of polycyclic aromatic hydrocarbon species in NSW 5.
2 Materials and Methods 2.1 Site Location and Characteristics PAHs were sampled at twenty-two sites in NSW, in the urban areas of Sydney, the Illawarra and the lower Hunter, and in selected regional centres. Six sites were in the Sydney region, seven in the Illawarra region, and three in the lower Hunter region. Five sites were located in the Great Dividing Range�Lithgow, Cooma, Armidale, Tumut and Orange. The remaining site was Nowra, located on the South Coast. The sampling locations are shown in Figures 1 to 4. Sites consisted of the current NSW EPA ambient air quality monitoring network of PM10 samplers. These monitoring stations are located according to AS 2922, the Australian Standard for the siting of sampling units (Standards Australia 1987). The locations of each site are detailed in Appendix 2.
Figure 1: Sampling locations in the Sydney region
250 275 300 325 350 3756200
6225
6250
6275
6300
Rozelle
LindfieldBlacktown
Earlwood
Richmond
Sydney CBD
0
100
200
300
400
500
600
700
800
900
1000
1100
1200
Height abovesea level
(m)
Nor
thin
g AM
B (k
m)
Easting AMG (km)

Ambient Air Quality Research Project: Ambient concentrations of polycyclic aromatic hydrocarbon species in NSW 6.
Figure 2: Sampling locations in the Illawarra region
Figure 3: Sampling locations in the lower Hunter region
Nor
thin
g AM
B (k
m)
275 285 295 305 315 3256160
6170
6180
6190
6200
Wattle Street
Kembla StreetWarrawong
Wollongong
Kembla Grange
Albion Park
Military Road
0
100
200
300
400
500
600
Height abovesea level
(m)
Easting AMG (km)
Nor
thin
g AM
G (k
m)
0
100
200
300
400
500
600
350 360 370 380 390 400 4106340
6350
6360
6370
6380
6390 Height above sea level
(m)
LakeMacquarie
KooragangIsland
TASMANSEA
Beresfield
Wallsend Newcastle
Easting AMG (km)

Ambient Air Quality Research Project: Ambient concentrations of polycyclic aromatic hydrocarbon species in NSW 7.
Figure 4: Regional sampling locations
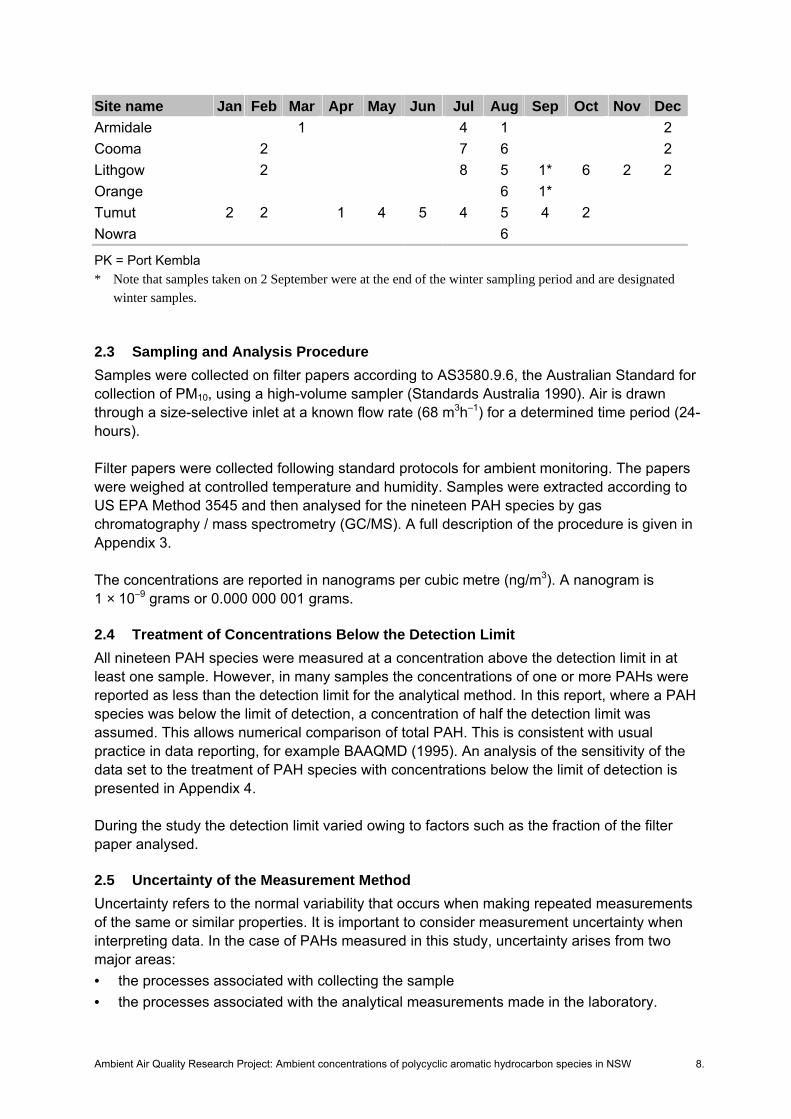
2.2 Sampling Schedule Samples were collected from August 1997 to February 2001, mainly in winter. The aggregate sample count, per site and per month, for the four years is shown in Table 2. Table 2: Aggregate sample count per site for August 1997 to February 2001
Site name Jan Feb Mar Apr May Jun Jul Aug Sep Oct Nov DecBlacktown 2 3 7 2 Earlwood 4 6 2 Lindfield 5 7 Richmond 2 2 6 2 Rozelle 2 4 4 2 Sydney CBD 4 Albion Park 4 7 Kembla Grange 2 6 Kembla St (PK) 2 6 Military Rd (PK) 5 Warrawong 2 4 6 2 Wattle St (PK) 2 5 Wollongong 2 4 6 2 Beresfield 2 4 6 1 Newcastle 2 5 6 2 Wallsend 2 3 7 2
Ambient Air Quality Research Project: Ambient concentrations of polycyclic aromatic hydrocarbon species in NSW 8.
Site name Jan Feb Mar Apr May Jun Jul Aug Sep Oct Nov DecArmidale 1 4 1 2 Cooma 2 7 6 2 Lithgow 2 8 5 1* 6 2 2 Orange 6 1* Tumut 2 2 1 4 5 4 5 4 2 Nowra 6
PK = Port Kembla * Note that samples taken on 2 September were at the end of the winter sampling period and are designated
winter samples. 2.3 Sampling and Analysis Procedure Samples were collected on filter papers according to AS3580.9.6, the Australian Standard for collection of PM10, using a high-volume sampler (Standards Australia 1990). Air is drawn through a size-selective inlet at a known flow rate (68 m3h�1) for a determined time period (24-hours). Filter papers were collected following standard protocols for ambient monitoring. The papers were weighed at controlled temperature and humidity. Samples were extracted according to US EPA Method 3545 and then analysed for the nineteen PAH species by gas chromatography / mass spectrometry (GC/MS). A full description of the procedure is given in Appendix 3. The concentrations are reported in nanograms per cubic metre (ng/m3). A nanogram is 1 × 10�9 grams or 0.000 000 001 grams. 2.4 Treatment of Concentrations Below the Detection Limit All nineteen PAH species were measured at a concentration above the detection limit in at least one sample. However, in many samples the concentrations of one or more PAHs were reported as less than the detection limit for the analytical method. In this report, where a PAH species was below the limit of detection, a concentration of half the detection limit was assumed. This allows numerical comparison of total PAH. This is consistent with usual practice in data reporting, for example BAAQMD (1995). An analysis of the sensitivity of the data set to the treatment of PAH species with concentrations below the limit of detection is presented in Appendix 4. During the study the detection limit varied owing to factors such as the fraction of the filter paper analysed. 2.5 Uncertainty of the Measurement Method Uncertainty refers to the normal variability that occurs when making repeated measurements of the same or similar properties. It is important to consider measurement uncertainty when interpreting data. In the case of PAHs measured in this study, uncertainty arises from two major areas: • the processes associated with collecting the sample • the processes associated with the analytical measurements made in the laboratory.
Ambient Air Quality Research Project: Ambient concentrations of polycyclic aromatic hydrocarbon species in NSW 9.
Overall uncertainty is calculated by obtaining the contribution from each source of uncertainty separately (EURACHEM 2000). The European Commission (2001) approximates overall uncertainty for sampling and analysis of PAHs as ±35%. For this calculation, the following sources were identified as contributing to overall uncertainty in the measurement of PAHs: standards, reference materials, sampling uncertainties (such as flow rates), extraction efficiencies, calibration and storage. 2.6 Data Analysis Method The screening survey is intended to provide current ambient concentrations at a variety of locations in NSW. Data for each of the six Sydney sites, Nowra, Cooma, Armidale, Tumut and Lithgow are presented separately. Data from sites in the Sydney, Illawarra and lower Hunter regions have been amalgamated to produce regional averages, maximums and medians. Appendix 5 presents data collected during each season from each site. Summary statistics are presented for the derived total PAH (the sum of the eleven PAH species shown in Table 1) and BaP. Concentrations of BaP are compared to international goals for this pollutant. Total toxic equivalence is calculated on the basis of seven PAHs by using factors from current literature, and the contribution to total toxic equivalence from each is noted. t-Tests were used to determine whether seasonal differences in average total PAH concentrations were statistically significant at each site.

Ambient Air Quality Research Project: Ambient concentrations of polycyclic aromatic hydrocarbon species in NSW 10.
3 Results 3.1 General Description of the Data During the project, 268 samples of PM10 were collected from twenty-two sites in NSW. A total of 261 samples were collected over the standard 24-hour period. Given that the remaining seven samples were collected at Orange over a 16-hour period overnight (from 1600 one day to 0800 the next), they have been treated separately in this report (see Appendix 6). Each of the nineteen PAHs was detected in at least one sample. Table 3 shows the frequency of detection of each PAH species. The four light PAHs (acenaphthylene, acenaphthene, fluorene and anthracene) were the least frequently detected, being detected in fewer than 4% of samples. These low frequencies of detection and low concentrations of these lighter PAHs are consistent with their being found predominantly in the vapour phase. The next lowest frequency of detection was for dibenz(a,h)anthracene, which was detected in 16% of samples. Benzo(g,h,i)perylene was the PAH most frequently detected, occurring in 82% of the samples. Table 3: Frequency of detection of each PAH
PAH species Percentage of samples in which PAH species were detected
PAH species contributing to total PAH in this study
%
Benz(a)anthracene 20 Benzo(a)pyrene 52 Benzo(b)fluoranthene 65 Benzo(e)pyrene 59 Benzo(g,h,i)perylene 82 Benzo(k)fluoranthene 23 Chrysene 35 Coronene 68 Dibenz(a,h)anthracene 16 Indeno(1,2,3-c,d)pyrene 71 Perylene 26 PAH species occurring predominantly in the vapour phase
%
Acenaphthene 2 Acenaphthylene 3 Anthracene 4 Fluoranthene 28 Fluorene 2 Naphthalene 34 Phenanthrene 31 Pyrene 31
Note: Total number of samples was 261 (Orange data were excluded)
Ambient Air Quality Research Project: Ambient concentrations of polycyclic aromatic hydrocarbon species in NSW 11.
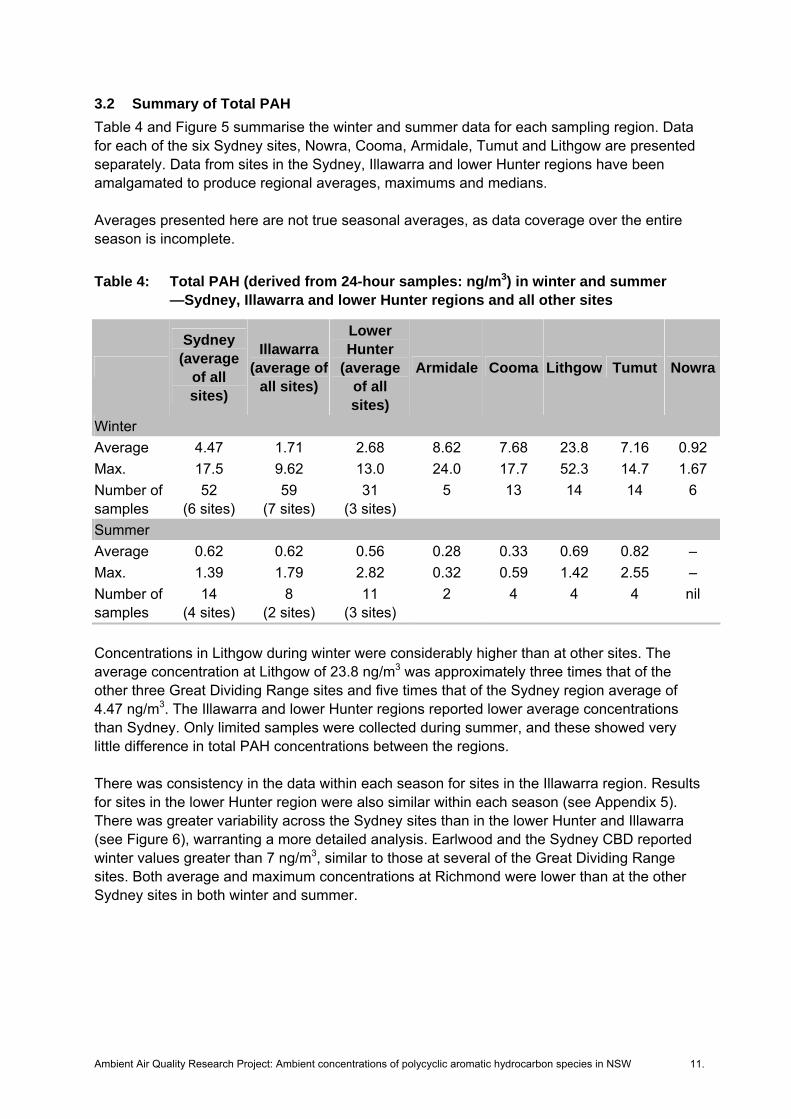
3.2 Summary of Total PAH Table 4 and Figure 5 summarise the winter and summer data for each sampling region. Data for each of the six Sydney sites, Nowra, Cooma, Armidale, Tumut and Lithgow are presented separately. Data from sites in the Sydney, Illawarra and lower Hunter regions have been amalgamated to produce regional averages, maximums and medians. Averages presented here are not true seasonal averages, as data coverage over the entire season is incomplete. Table 4: Total PAH (derived from 24-hour samples: ng/m3) in winter and summer
—Sydney, Illawarra and lower Hunter regions and all other sites
Sydney (average
of all sites)
Illawarra (average of
all sites)
Lower Hunter
(average of all sites)
Armidale Cooma Lithgow Tumut Nowra
Winter Average 4.47 1.71 2.68 8.62 7.68 23.8 7.16 0.92 Max. 17.5 9.62 13.0 24.0 17.7 52.3 14.7 1.67 Number of samples
52 (6 sites)
59 (7 sites)
31 (3 sites)
5 13 14 14 6
Summer Average 0.62 0.62 0.56 0.28 0.33 0.69 0.82 � Max. 1.39 1.79 2.82 0.32 0.59 1.42 2.55 � Number of samples
14 (4 sites)
8 (2 sites)
11 (3 sites)
2 4 4 4 nil
Concentrations in Lithgow during winter were considerably higher than at other sites. The average concentration at Lithgow of 23.8 ng/m3 was approximately three times that of the other three Great Dividing Range sites and five times that of the Sydney region average of 4.47 ng/m3. The Illawarra and lower Hunter regions reported lower average concentrations than Sydney. Only limited samples were collected during summer, and these showed very little difference in total PAH concentrations between the regions. There was consistency in the data within each season for sites in the Illawarra region. Results for sites in the lower Hunter region were also similar within each season (see Appendix 5). There was greater variability across the Sydney sites than in the lower Hunter and Illawarra (see Figure 6), warranting a more detailed analysis. Earlwood and the Sydney CBD reported winter values greater than 7 ng/m3, similar to those at several of the Great Dividing Range sites. Both average and maximum concentrations at Richmond were lower than at the other Sydney sites in both winter and summer.

Ambient Air Quality Research Project: Ambient concentrations of polycyclic aromatic hydrocarbon species in NSW 12.
Table 5: Total PAH (derived from 24-hour samples: ng/m3) in winter and summer —Sydney sites
Blacktown Earlwood Lindfield Richmond Rozelle Sydney CBD
Winter Average 4.29 7.35 3.59 1.56 3.97 7.17 Max. 14.3 17.5 13.2 3.07 11.4 14.3 Number of samples 10 10 12 8 8 4 Summer Average 0.67 0.97 � 0.22 0.80 � Max. 0.92 1.30 � 0.29 1.39 � Number of samples 4 2 nil 4 4 nil
0
10
20
30
40
50
Sydney Illawarra LowerHunter
Armidale Cooma Lithgow Tumut Nowra
Con
cent
ratio
n (n
g/m
3 )
Avg of Winter samples
Avg of Summer samples
Winter maximum
Summer maximum
Figure 5: Seasonal variations in total PAH (derived from 24-hour
samples: ng/m3)—Sydney, Illawarra and lower Hunter regions and all other sites
0
10
20
30
40
50
Sydney Illawarra LowerHunter
Armidale Cooma Lithgow Tumut Nowra
Con
cent
ratio
n (n
g/m
3 )
Avg of Winter samples
Avg of Summer samples
Winter maximum
Summer maximum

Ambient Air Quality Research Project: Ambient concentrations of polycyclic aromatic hydrocarbon species in NSW 13.
Figure 6: Seasonal variations in total PAH (derived from 24-hour samples: ng/m3)—Sydney sites
Overall, the average winter total PAH concentrations were two to ten times higher than the summer concentrations at the urban sites, but between eight and thirty-five times higher in the colder Great Dividing Range sites. The concentrations in autumn (Armidale, one sample; Tumut, five samples) and spring (Lithgow, eight samples; Tumut, six samples) were much lower than winter concentrations of PAHs (see Appendix 5). This limited sampling conducted in other seasons confirmed that ambient PAH concentrations are higher in winter. 3.2.1 Analysis of PAH Results
Even though the sample size differed significantly between summer and winter, the seasonal differences are clear and statistically robust. Table 6 presents the results of t-tests of the seasonal difference in average total PAH concentration using log-transformed data for each site, each region, and the data as a whole. Table 6 shows that the average total PAH concentration for summer is significantly less than that for winter (P ≤ 0.05) for all but three sites. Average total PAH concentrations for summer were less than for winter at Earlwood, Newcastle and Wollongong, but these differences were not statistically significant (P ≥ 0.056, P ≥ 0.082 and P ≥ 0.232 respectively). Given the low sample size and measurement uncertainty, detection of inter-seasonal variation was not possible in this study for these three sites.
0
2
4
6
8
10
12
14
16
18
20
Blacktown Earlwood Lindfield Richmond Rozelle SydneyCBD
Con
cent
ratio
n (n
g/m
3 )
Avg of Summer samples
Avg of Winter samples
Summer maximum
Winter maximum

Ambient Air Quality Research Project: Ambient concentrations of polycyclic aromatic hydrocarbon species in NSW 14.
Table 6: Comparison of seasonal average concentration
Site Average total PAH (derived from 24-hour samples)
(ng/m3)
Summer Winter Ratio P (t ≤ T)1
Blacktown 0.67 4.29 6.4 < 0.001 Earlwood 0.97 7.35 7.6 0.056 Richmond 0.22 1.56 7.0 < 0.001 Rozelle 0.80 3.97 5.0 0.021 Warrawong 0.50 2.63 5.2 0.021 Wollongong 0.73 1.24 1.7 0.232 Beresfield 0.42 1.49 3.6 0.048 Newcastle 0.86 2.93 3.4 0.082 Wallsend 0.35 3.59 10.2 < 0.001 Armidale 0.28 8.62 31.1 0.019 Cooma 0.33 7.68 23.3 < 0.001 Lithgow 0.69 23.80 34.6 < 0.001 Tumut 0.82 7.16 8.7 0.015 Sydney region 0.62 4.46 7.2 < 0.001 Illawarra region 0.62 1.93 3.1 0.007 Lower Hunter region 0.56 2.68 4.8 < 0.001 All data 0.59 6.46 11.0 < 0.001
1. Probability that the means come from the same population�P values >0.05 are in bold and indicate where the difference is not significant at the 0.05 level. t-Tests of means with unequal variance were performed on the log-transformed data. The noted differences between summer and winter may in part be explained by the different emission sources present in the cooler part of the year. The most significant of these is likely to be domestic solid fuel heaters. Burning of solid fuels for home heating is widespread throughout NSW, particularly in cooler regions such as the Great Dividing Range sites. Table 7 summarises estimates of fuel usage from the Australian Bureau of Agricultural and Resource Economics (ABARE). The table shows that per capita wood fuel usage is considerably greater in rural areas than in the major urban centres. In addition, Kamens et al. (1986) showed that the PAHs in wood smoke decay in sunlight at different rates according to temperature. The half-life of various PAHs is 30 to 60 minutes at 20°C, whereas it could be hours or days at �7°C. The Great Dividing Range sites are generally colder than Sydney during the winter (see Table 8), so greater usage of home heating would be expected. This is consistent with the higher concentrations of PAHs measured at these sites. The exceptions are the Sydney CBD and Earlwood sites, with averages similar to those at Armidale, Cooma and Tumut. One possible explanation could be the elevated emissions from vehicles due to the colder days, coupled with the traffic volume in these dense urban areas.
Ambient Air Quality Research Project: Ambient concentrations of polycyclic aromatic hydrocarbon species in NSW 15.
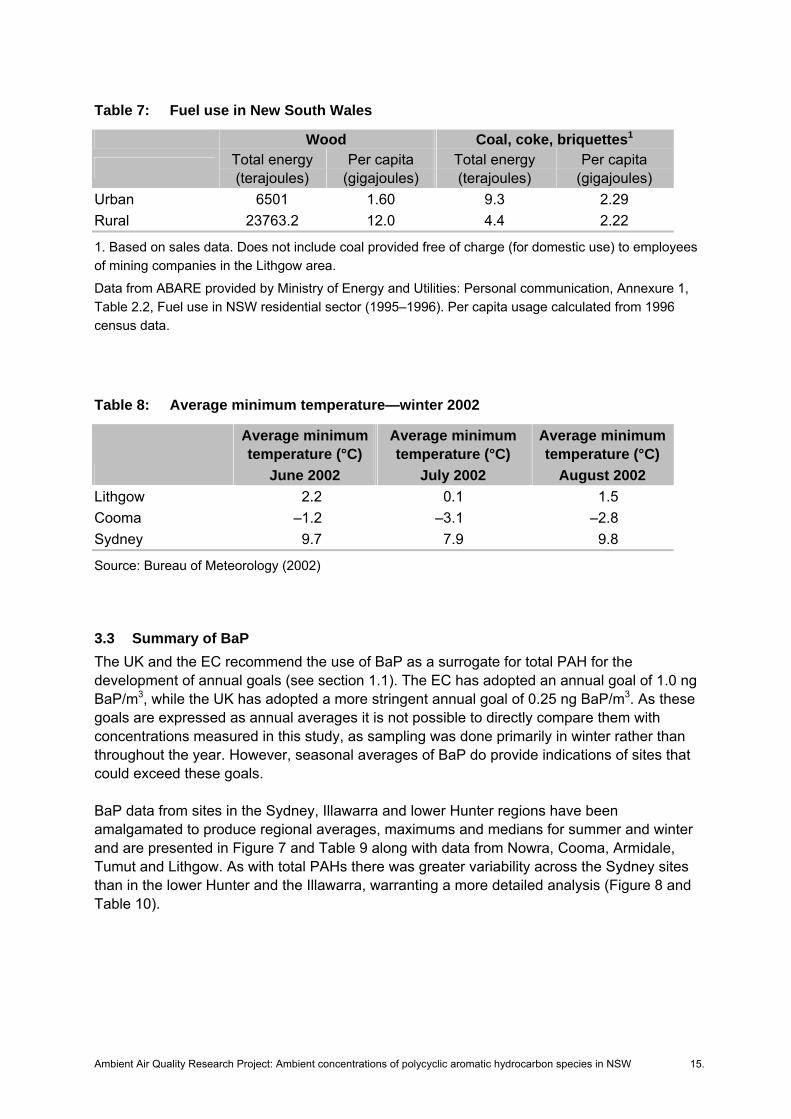
Table 7: Fuel use in New South Wales
Wood Coal, coke, briquettes1
Total energy (terajoules)
Per capita (gigajoules)
Total energy (terajoules)
Per capita (gigajoules)
Urban 6501 1.60 9.3 2.29 Rural 23763.2 12.0 4.4 2.22
1. Based on sales data. Does not include coal provided free of charge (for domestic use) to employees of mining companies in the Lithgow area. Data from ABARE provided by Ministry of Energy and Utilities: Personal communication, Annexure 1, Table 2.2, Fuel use in NSW residential sector (1995�1996). Per capita usage calculated from 1996 census data. Table 8: Average minimum temperature—winter 2002
Average minimum temperature (°C)
June 2002
Average minimum temperature (°C)
July 2002
Average minimum temperature (°C)
August 2002 Lithgow 2.2 0.1 1.5 Cooma �1.2 �3.1 �2.8 Sydney 9.7 7.9 9.8
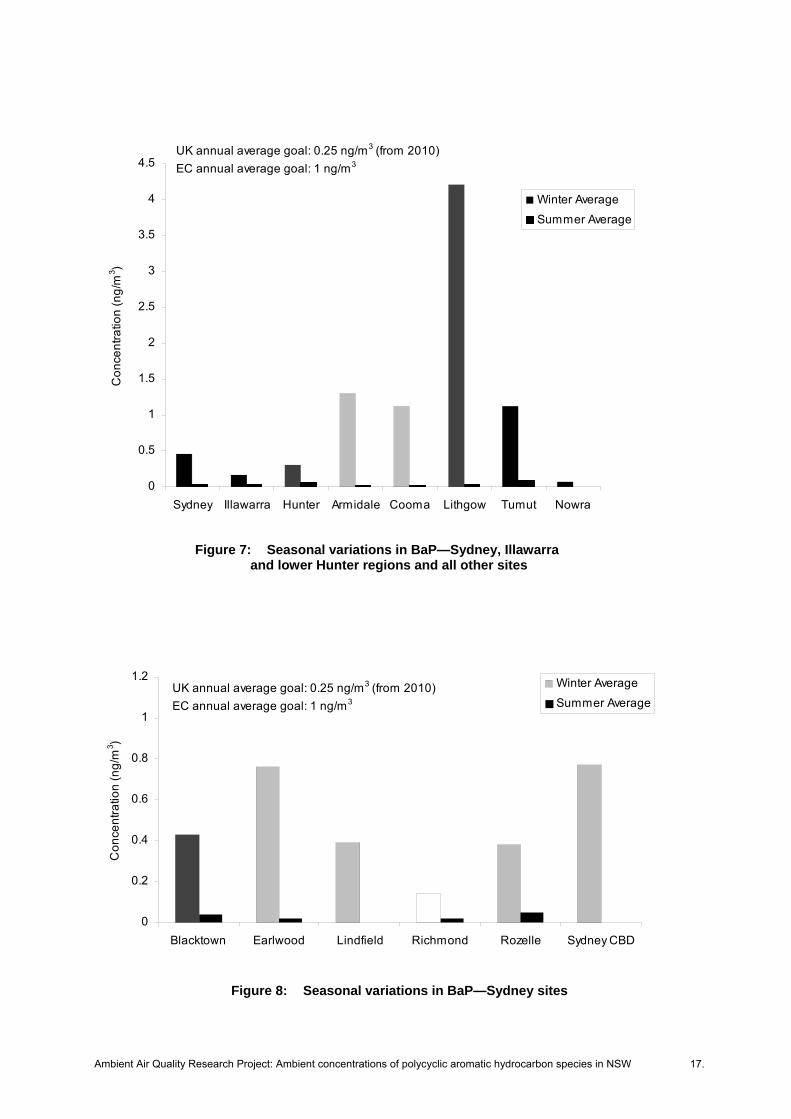
Source: Bureau of Meteorology (2002) 3.3 Summary of BaP The UK and the EC recommend the use of BaP as a surrogate for total PAH for the development of annual goals (see section 1.1). The EC has adopted an annual goal of 1.0 ng BaP/m3, while the UK has adopted a more stringent annual goal of 0.25 ng BaP/m3. As these goals are expressed as annual averages it is not possible to directly compare them with concentrations measured in this study, as sampling was done primarily in winter rather than throughout the year. However, seasonal averages of BaP do provide indications of sites that could exceed these goals. BaP data from sites in the Sydney, Illawarra and lower Hunter regions have been amalgamated to produce regional averages, maximums and medians for summer and winter and are presented in Figure 7 and Table 9 along with data from Nowra, Cooma, Armidale, Tumut and Lithgow. As with total PAHs there was greater variability across the Sydney sites than in the lower Hunter and the Illawarra, warranting a more detailed analysis (Figure 8 and Table 10).

Ambient Air Quality Research Project: Ambient concentrations of polycyclic aromatic hydrocarbon species in NSW 16.
Table 9: BaP (derived from 24-hour samples: ng/m3) in winter and summer —Sydney, Illawarra and lower Hunter regions and all other sites
Sydney (average
of all sites)
Illawarra (average
of all sites)
Lower Hunter
(average of all sites)
Armidale Cooma Lithgow Tumut Nowra
Winter Average 0.46 0.16 0.30 1.30 1.12 4.21 1.12 0.07 Max. 2.25 1.21 1.92 3.77 3.02 8.99 3.06 0.07 Number of samples
52 (6 sites)
59 (7 sites)
31 (3 sites) 5 13 14 14 6
Summer Average 0.03 0.03 0.06 0.02 0.03 0.03 0.09 - Max. 0.07 0.07 0.40 0.02 0.04 0.07 0.27 - Number of samples
14 (4 sites)
8 (2 sites)
11 (3 sites) 2 4 4 4 Nil
Table 10: BaP (derived from 24-hour samples: ng/m3) in winter and summer
—Sydney sites
Blacktown Earlwood Lindfield Richmond Rozelle Sydney CBD
Winter Average 0.43 0.76 0.39 0.14 0.38 0.77 Max. 1.92 2.25 1.67 0.32 1.35 1.68 Number of samples 10 10 12 8 8 4 Summer Average 0.04 0.02 � 0.02 0.05 � Max. 0.07 0.02 � 0.02 0.07 � Number of samples 4 2 Nil 4 4 Nil There is strong seasonality in the BaP concentrations and substantial regional differences, with the results following a similar trend to total PAHs. The Great Dividing Range sites show higher concentrations of BaP, especially in winter. This is most pronounced for Lithgow, where the average winter concentration was 4.21 ng/m3. Given the strong seasonality in the concentrations, annual concentrations are likely to be between a quarter and a half of those in winter. Figure 9 shows the median, average and maximum concentrations of BaP at each site in winter. The data trend suggests that an extrapolated annual average for Nowra and all sites in the Illawarra and lower Hunter would meet the UK goal of 0.25 ng/m3. Similarly, extrapolations for most sites in Sydney would also meet the UK goal, except possibly Earlwood and the Sydney CBD. It is anticipated that all Great Dividing Range sites would exceed the UK goal given that each reported an average winter concentration greater than four times the goal. On the basis of the winter averages and the observed inter-seasonal variation, it is likely that all sites, except Lithgow, would meet the EC annual goal of 1.0 ng BaP/m3.
Ambient Air Quality Research Project: Ambient concentrations of polycyclic aromatic hydrocarbon species in NSW 17.
Figure 7: Seasonal variations in BaP—Sydney, Illawarra and lower Hunter regions and all other sites
Figure 8: Seasonal variations in BaP—Sydney sites
0
0.2
0.4
0.6
0.8
1
1.2
Blacktown Earlwood Lindfield Richmond Rozelle Sydney CBD
Con
cent
ratio
n (n
g/m
3 )
Winter AverageSummer Average
UK annual average goal: 0.25 ng/m3 (from 2010)EC annual average goal: 1 ng/m3
0
0.5
1
1.5
2
2.5
3
3.5
4
4.5
Sydney Illawarra Hunter Armidale Cooma Lithgow Tumut Nowra
Con
cent
ratio
n (n
g/m
3 )
Winter AverageSummer Average
UK annual average goal: 0.25 ng/m3 (from 2010)EC annual average goal: 1 ng/m3

Ambient Air Quality Research Project: Ambient concentrations of polycyclic aromatic hydrocarbon species in NSW 18.
Figure 9: Average winter BaP concentration and annual goals
Although concentrations of total PAHs at Armidale, Cooma, Lithgow, Tumut, Sydney CBD and Earlwood were similar, total PAH concentrations at Armidale, Cooma, Lithgow and Tumut comprised a relatively higher proportion of BaP than in the Sydney CBD and Earlwood. Analysis of the composition of emissions from motor vehicles (Pistikopoulos et al. 1990) and wood smoke (Freeman and Cattell 1990) shows a greater proportion of BaP in wood smoke. Therefore, the greater proportion of BaP found at the Great Dividing Range sites is consistent with the greater use of solid fuel heaters in those areas. The lower proportion of BaP found in the Sydney CBD and at Earlwood indicates that emissions come from a greater range of sources in the city, with motor vehicles potentially having a greater influence. 3.4 Toxicity—BaP Equivalence The significance to human health of PAHs lies not only in the concentration found, but also in their relative toxicity. Finlayson-Pitts and Pitts (2000) summarised potency equivalence factors (PEF) from two works (see Table 11). The two estimates of PEF are different for some PAHs, although both use BaP as a reference compound, setting its PEF to 1.0. In this report, BaP equivalence is calculated by using the PEF values from the California Air Resources Board (CARB), which provides more PEFs than Nielson (Table 11). The toxicity equivalent (TEQ) for a sample is the sum of the toxicities of the contributing species. The concentration of each contributing species is multiplied by its PEF, and these are then summed. Of the PAHs for which CARB report PEF, seven were included in this study. TEQ has been calculated from these seven PAH species. Figure 10 shows the average BaP equivalence by site and season. Figure 11 shows the average contribution from the seven
0.0
1.0
2.0
3.0
4.0
5.0
6.0
7.0
8.0
9.0
10.0
Blac
ktow
n
Earlw
ood
Lind
field
Ric
hmon
d
Roz
elle
Sydn
ey C
BD
Albi
on P
ark
Kem
bla
Gra
nge
Kem
bla
Stre
et
Mili
tary
Roa
d
War
raw
ong
Wat
tle S
treet
Wol
long
ong
Bere
sfie
ld
New
cast
le
Wal
lsen
d
Arm
idal
e
Coo
ma
Lith
gow
Tum
ut
Now
ra
Con
cent
ratio
n (n
g/m
3 )Median Average Maximum
UK annual average goal: 0.25 ng/m3 (from 2010) EC annual average goal: 1 ng/m3

Ambient Air Quality Research Project: Ambient concentrations of polycyclic aromatic hydrocarbon species in NSW 19.
PAH species to TEQ. Contributions to TEQ, presented in Figure 11, were calculated from all samples collected at all sites (except Orange) in winter (194) and summer (47). From the scale on Figure 11, it is clear that BaP dominates the TEQ, contributing to 53% in summer and 62% in winter for the regionally aggregated data. This is consistent with findings used in the development of the UK goal, where BaP was also found to be the largest contributor to overall toxicity. BaP has been shown to make a consistent contribution to the total carcinogenic activity of predominantly particle-bound PAHs on the basis of carcinogenic potency factors and measured annual average concentrations at a wide range of European sites, including the UK, Italy, the Netherlands and Sweden (European Commission 2001). Table 11: Potency equivalence factors
PAH PEF
(Nielsen et al. 1996)1 PEF
(CARB 1994)1 5-Methylchrysene - 1.0 Benz(a)anthracene 0.005 0.1 BaP 1.0 1.0 Benzo(b)fluoranthene 0.05 0.1 Benzo(g,h,i)perylene 0.02 � Benzo(j)fluoranthene 0.05 0.1 Benzo(k)fluoranthene 0.05 0.1 Chrysene 0.03 0.01 Cyclopenta(c,d)pyrene 0.02 � Dibenz(a,h)anthracene � 0.4 Dibenzo(a,e)pyrene � 1.0 Dibenzo(a,h)pyrene � 10.0 Dibenzo(a,i)pyrene � 10.0 Dibenzo(a,l)pyrene � 10.0 Indeno(1,2,3-c,d)pyrene 0.1 0.1
1. Transcribed from Finlayson-Pitts and Pitts (2000)

Ambient Air Quality Research Project: Ambient concentrations of polycyclic aromatic hydrocarbon species in NSW 20.
Figure 10: Average BaP equivalence by site and season
Figure 11: Seasonal average contribution to TEQ
0.0
1.0
2.0
3.0
4.0
5.0
6.0
Blac
ktow
n
Earlw
ood
Lind
field
Ric
hmon
d
Roz
elle
Sydn
ey C
BD
Albi
on P
ark
Kem
bla
Gra
nge
Kem
bla
Stre
et
Mili
tary
Roa
d
War
raw
ong
Wat
tle S
treet
Wol
long
ong
Bere
sfie
ld
New
cast
le
Wal
lsen
d
Arm
idal
e
Coo
ma
Lith
gow
Tum
ut
Now
ra
Con
cent
ratio
n (n
g/m
3 equ
ival
ent B
aP)
Winter Summer
0%
10%
20%
30%
40%
50%
60%
70%
80%
90%
100%
Summer Winter
Per
cent
of t
otal
TE
Q
Chrysene
Benz(a)anthracene
Benzo(k)fluoranthene
Indeno(1,2,3-c,d)pyrene
Benzo(b)fluoranthene
Dibenz(a,h)anthracene
Benzo(a)pyrene

Ambient Air Quality Research Project: Ambient concentrations of polycyclic aromatic hydrocarbon species in NSW 21.
4 Conclusions This screening survey of PAH concentrations in NSW provides an initial description of the concentrations of particulate PAH species. Although caution is needed when analysing the results owing to the small number of samples, the survey has shown that: • There is significant variation in concentrations between regions in winter; the Great
Dividing Range sites show significantly higher winter averages. This is likely to be due to the greater use of solid fuels for heating in these regions.
• Despite the lack of samples in summer months, the strong seasonal variation is statistically significant, with winter concentrations between two and more than twenty times greater than the summer concentrations.
• While annual averages cannot be calculated from these data, the BaP winter average is sufficiently large at some regional sites to exceed some international annual goals.
• From the use of potency equivalence factors derived by CARB, BaP predominates among the seven PAHs contributing to TEQ, contributing from 53% in summer to 62% in winter.

Ambient Air Quality Research Project: Ambient concentrations of polycyclic aromatic hydrocarbon species in NSW 22.
5 References BAAQMD. 1995. Toxic Air Contaminant Control Program: Annual Report 1994, Volume 1. Bay
Area Air Quality Management District, San Francisco, CA, USA.
Bureau of Meteorology. 2002. Monthly weather review (June, July and August 2002 issues) New South Wales. Commonwealth of Australia.
CARB (California Air Resources Board). 1994. Benzo(a)pyrene as a toxic air contaminant. http://www.arb.ca.gov/toxics/summary/bap.pdf
DEFRA (Department for Environment, Food & Rural Affairs, UK). 1999. Polycyclic aromatic hydrocarbons. http://www.defra.gov.uk/environment/airquality/aqs/poly/6.htm
DEFRA (Department for Environment, Food & Rural Affairs, UK). 2003. The Air Quality Strategy for England, Scotland, Wales and Northern Ireland: Addendum. http://www.defra.gov.uk/environment/airquality/strategy/addendum/pdf/aqs_addendum.pdf
EURACHEM. 2000. EURACHEM/CITAC Guide—Quantifying Uncertainty in Analytical Measurement, Second Edition, 2000, www.measurementuncertainty.org/mu/guide/index.html, 2000
European Commission. 2001. Ambient air pollution by polycyclic aromatic hydrocarbons (PAH) position paper (and annexes). Office for Official Publications of the European Communities, Luxembourg. http://europa.eu.int/comm/environment/air/pdf/pp_pah.pdf, http://europa.eu.int/comm/environment/air/pdf/annex_pah.pdf
European Commission. 2003. Proposal For a Directive of The European Parliament and of the Council Relating to Arsenic, Cadmium, Mercury, Nickel and Polycyclic Aromatic Hydrocarbons in Ambient Air. Brussels. 16.7.2003 COM (2003) 423 Final. 2003/0164 (COD). http://europa.eu.int/eur-lex/en/com/pdf/2003/com2003_0423en01.pdf
Finlayson-Pitts B J, Pitts JN Jr. 2000. Chemistry of the Upper and Lower Atmosphere— Theory, Experiments, and Applications. Academic Press, San Diego.
Freeman DJ, Cattell CR. 1990. Woodburning as a source of atmospheric polycyclic aromatic hydrocarbons. Environ. Sci. Technol. 24: 1581�1585.
Harrison RM, Smith DJT, Luhana L. 1996. Source apportionment of atmospheric polycyclic aromatic hydrocarbons collected from an urban location in Birmingham, UK. Environ. Sci. Technol. 30: 825�832.
IARC (International Agency for Research on Cancer). 2002 Overall Evaluations of Carcinogenicity to Humans. http://193.51.164.11/monoeval/crthall.html, 4 December 2002.
Kamens RM, Fulcher JN, Zhishi G. 1986. Effects of temperature on wood soot PAH decay in atmospheres with sunlight and low NOx. Atmospheric Environment 20(8): 1579�1587.
Lao RC, Thomas RS, Oja H, Dubois L. 1973. Application of gas chromatograph�mass spectrometer�data processor combination to the analysis of polycyclic aromatic hydrocarbons and polychlorinated biphenyls. Anal. Chem. 65: 338�344.

Ambient Air Quality Research Project: Ambient concentrations of polycyclic aromatic hydrocarbon species in NSW 23.
Lee ML, Novotny M, Bartle KD. 1976. Gas chromatography/mass spectrometric and nuclear magnetic resonance determination of polynuclear aromatic hydrocarbons in airborne particulates. Anal. Chem. 48: 1566�1572.
Menichini E, Bertolaccini MA, Taggi F, Falleni F, Monfredini F. 1999. A 3-years study of relationships among atmospheric concentrations of polycyclic aromatic hydrocarbons, carbon monoxide and nitrogen oxides at an urban site. Sci. Total Environ. 241: 27�37.
Nielsen T, Jorgensen HE, Larsen JC, Poulsen, M. 1996. City air pollution of PAH and other mutagens: occurrence, sources, and health effects. Sci. Total Environ. 190: 41�49.
NSW EPA. 2002. Ambient Air Quality Research Project (1996�2001) Dioxins, organics, polycyclic aromatic hydrocarbons and heavy metals. New South Wales Environment Protection Authority, 2002/35, http://www.epa.nsw.gov.au/air/dopahhm/.
Park J-S, Wade TL, Sweet S. 2001. Atmospheric distribution of polycyclic aromatic hydrocarbons and deposition to Galveston Bay, Texas, USA. Atmos. Env. 35: 3241�3249.
Pistikopoulos P, Masclet P, Mouvier G. 1990. A receptor model adapted to reactive species: polycyclic aromatic hydrocarbons; evaluation of source contributions in an open urban site�I. Particle compounds. Atmos. Env. 24A: 1189�1197.
Standards Australia. 1987. AS 2922-1987�Australian Standard�Ambient Air�Guide for the Siting of Sampling Units.
Standards Australia. 1990. AS 3580.9.6-1990�Australian Standard�Methods for Sampling and Analysis of Ambient Air�Determination of Suspended Particulate Matter�PM10 High Volume Sampler With Size-Selective Inlet�Gravimetric Method.
US EPA. 1988. Second supplement to Compendium of Methods for the Determination of Toxic Organic Compounds in Ambient Air. Atmospheric Research and Exposure Laboratory, Research Triangle Park, NC, USA. EPA-600/4-89-018 pp. TO-13�97.
US EPA. 1996. Method 3545-1996, Revision 0, December 1996 http://www.epa.gov/SW-846/3545.pdf
US EPA. 2002. Office of Air Quality Planning and Standards, Health Effects Fact Sheets, http://www.epa.gov/ttn/atw/hapindex.html, 17 July 2002.
US EPA. 2003. Integrated risk information system. http://www.epa.gov/iris/subst/index.html, 8 January 2003.

Ambient Air Quality Research Project: Ambient concentrations of polycyclic aromatic hydrocarbon species in NSW 24.
Further Reading Berko H. 1999. State of Knowledge Report on PAHs in Australia. Department of Environment
Protection, Perth.
Brasser LJ. 1980. Polycyclic aromatic hydrocarbon concentrations in the Netherlands. VDI-Berichte 348: 171�180.
Daisey JM, Cheney JL, Lioy PJ. 1986. Profiles of organic particulate emissions from air pollution sources: status and needs for receptor source apportionment modeling. J. Air Poll. Contr. Assoc. 36: 17�33.
de Raat WK, Bakker GL, de Meijere FA. 1990. Comparison of filter materials used for sampling of mutagens and polycyclic aromatic hydrocarbons in ambient airborne particles. Atmos. Env. 24A: 2875�2887.
Environment Canada. 1998. Ambient Air measurements of polycyclic aromatic hydrocarbons (PAH), polychlorinated dibenzo-p-dioxins (PCDD) and polychlorinated dibenzofurans in Canada (1987�1997). Environmental Technology Centre Report Series No. AAQD 98�3.
Guenther FR, Chesler SN, Gordon GE, Zoller WH. 1988. Residential wood combustion: a source of atmospheric polycyclic aromatic hydrocarbons. J. High Res. Chromat. & Chromat. Commun. 11: 761�766.
International Programme on Chemical Safety. 1998. Selected Non-heterocyclic Polycyclic Aromatic Hydrocarbons. Environmental Health Criteria 202, International Programme on Chemical Safety, WHO, Geneva.
Jaklin J, Krenmeyer P. 1985. A routine method for the quantitative determination of polycyclic aromatic hydrocarbons (PAHs) in urban air. Int. J. Environ. Anal. Chem. 21: 33�42.
Khalili N R, Scheff PA, Holsen TM. 1995. PAH source fingerprints for coke ovens, diesel and gasoline engines, highway tunnels, and wood combustion emissions. Atmos. Env. 29: 533�542.
Kirten PJ, Ellis J, Crisp PT. 1991. The analysis of organic matter in coke oven emissions. Fuel 70: 1383�1389.
Lithgow City Council. 1993. Draft Solid Fuel Burning Strategy. Environmental Service Division, Greater Lithgow City Council, December.
Lithgow City Council. 1997. Agenda, ordinary meeting of council 10 June 1997; Item 57, Ray Darney, Manager Environmental & Planning (IRG). File: 16870:OR/PRM/03/02, June 1997.
Louisiana State. 2001. Title 33 Environmental Regulatory Code, State of Louisiana 10 November 2001. http://www.deq.state.la.us/planning/regs/title33/index.htm.
Mader BT, Pankow JF. 2001. Gas/solid partitioning of semivolatile organic compounds (SOCs) to air filters. 2. Partitioning of polychlorinated dibenzodioxins, polychlorinated dibenzofurans, and polycyclic aromatic hydrocarbons to quartz fiber filters. Atmos Env. 35: 1217�1223.

Ambient Air Quality Research Project: Ambient concentrations of polycyclic aromatic hydrocarbon species in NSW 25.
Marr LC, Kirchstetter TW, Harley RA, Miguel AH, Hering SV, Hammond SK. 1997. Characterization of polycyclic aromatic hydrocarbons in motor vehicle fuels and exhaust emissions. Environ. Sci. Technol. 33: 3091�3099.
Oda J, Maeda I, Mori T, Yasuhara A, Saito Y. 1998. The relative proportions of polycyclic aromatic hydrocarbons and oxygenated derivatives in accumulated organic particulates as affected by air pollution sources. Environ. Tech. 19: 961�976.
Oda J, Nomura S, Yasuhara A, Shibamoto T. 2001. Mobile sources of atmospheric polycyclic aromatic hydrocarbons in a roadway tunnel. Atmos. Env. 35: 4819�4827.
Petry T, Schmid P, Schlatter C. 1996. The use of toxic equivalency factors in assessing occupational and environmental health risk associated with exposure to airborne mixtures of polycyclic aromatic hydrocarbons (PAHs). Chemosphere 32: 639�648.
Pio CA, Santos IM, Anacleto TD, Nunes TV, Leal RM. 1991. Particulate and gaseous air pollutant levels at the Portuguese west coast. Atmos. Env. 25A: 669�680.
Schnelle-Kreis J, Gebefugi I, Welzl G, Jaensch T, Kettrup A. 2001. Occurrence of particle-associated polycyclic aromatic compounds in ambient air of the city of Munich. Atmos. Env. 35: S71�S81.
Yang H-H, Lee W-J, Chen S-J, Lai S-O. 1998. PAH emission from various stacks. J. Haz. Mat. 60: 159�174.
Ambient Air Quality Research Project: Ambient concentrations of polycyclic aromatic hydrocarbon species in NSW 26.
Appendix 1 Ring structures of Polycyclic Aromatic Hydrocarbons

Ambient Air Quality Research Project: Ambient concentrations of polycyclic aromatic hydrocarbon species in NSW 27.
Appendix 2 Detailed location of the sampling sites Sydney Region
Blacktown
The Blacktown monitoring station is in the car park within the Blacktown Council Depot on Swinson Road. Solvents are stored on site. Houses and small buildings surround the area. Roads near the site carry traffic from the Western Motorway (3 km south of the site) into Blacktown. Elevation above sea level is 75 m.
Earlwood
The Earlwood monitoring station is on Riverview Road, in a residential area. Elevation above sea level is 7 m.
Lindfield
The Lindfield monitoring station is in the grounds of the National Measurement Laboratory, Bradfield Road. The station is on lawns within the grounds, between Bradfield Road and Lady Game Drive. Trees are scattered around the area, and there are no major roads nearby. Elevation above sea level is 60 m.
Richmond
The Richmond monitoring station is within the grounds of the University of Western Sydney. The station is located in an open, flat, grassy paddock within the University farm, about 50 m from a car park. Elevation above sea level is 21 m.
Rozelle
The Rozelle monitoring station is in the grounds of Rozelle Hospital on Balmain Road. Monitoring is conducted at the north-western end of the hospital grounds, some 300 m from Victoria Road and Darling St. Elevation above sea level is 22 m.
Sydney
The Sydney CBD monitoring station is on the corner of George and Market Streets, adjacent to a very a high traffic area. Until May 2000 sampling was undertaken on the awning of the Gowings building. Since May 2000 sampling has been conducted on the awning of the Grace Brothers building on the opposite side of the intersection.
Illawarra Region
Albion Park
The Albion Park monitoring station is on Croom Rd, within the grounds of the Croom Sporting Complex. It is surrounded by residential and rural areas. Elevation above sea level is 28 m.
Kembla Grange
The Kembla Grange monitoring station is within the grounds of Kembla Grange Racecourse, Princes Highway, in a residential/rural area. The station is approximately 500 m from the Princes Highway and the Southern Freeway. Elevation above sea level is 5 m.
Kembla Street, Port Kembla
The Kembla Street monitoring site is within the grounds of St Patrick�s Convent. It is expected that the nearby BHP complex (less than 1km away) would contribute to levels at this site.

Ambient Air Quality Research Project: Ambient concentrations of polycyclic aromatic hydrocarbon species in NSW 28.
Military Road, Port Kembla
The Military Road monitoring site is in the grounds of the fire station. It is expected that the nearby BHP complex (less than 1km away) would contribute to levels at this site.
Wattle Street, Port Kembla
The Wattle Street monitoring site is in the grounds of the electricity sub-station. It is expected that the nearby BHP complex (less than 1km away) would contribute to levels at this site.
Warrawong
The Warrawong monitoring station is in the grounds of Darcy Wentworth Park on Carlotta Crescent. It is within a residential area approximately 2 km south of the Port Kembla industrial area. Elevation above sea level is 14 m.
Wollongong
The Wollongong monitoring station is in the Australian Army Depot on Gipps St. This is in a residential area, approximately 1 km north-west of the Wollongong city centre. Elevation above sea level is 15 m.
Lower Hunter Region
Beresfield
The Beresfield monitoring station is in the grounds of Francis Greenway High School, Lawson Avenue, Woodberry. This is a rural/residential area with no major roads nearby. Elevation above sea level is 14 m.
Newcastle
The Newcastle monitoring station is in the grounds of the Athletics Field on Dumaresq Street, Hamilton South. This is a residential area approximately 2 km from the Newcastle city centre. Elevation above sea level is 5 m.
Wallsend
The Wallsend monitoring station is within the grounds of the swimming pool on the corner of Frances St and John St, in a residential/open area. Elevation above sea level is 8 m.
Great Dividing Range
Armidale
Armidale is a regional centre on the Northern Tablelands of NSW, 550 km north of Sydney. It has a population of 20 000 and is located in a relatively narrow shallow valley, with the majority of residential areas situated on the valley slopes. Sampling was conducted close to the bottom of the valley in the grounds of the local swimming pool. Domestic wood combustion is the major source of fine particles. Elevation above sea level is approximately 1000 m.
Cooma
Cooma is a major regional town at the northern end of the Australian Alps, approximately 325 km south-south-west of Sydney. It has a population of 7500. Domestic wood combustion is the major source of fine particles. Elevation above sea level is 1038 m.
Ambient Air Quality Research Project: Ambient concentrations of polycyclic aromatic hydrocarbon species in NSW 29.
Lithgow
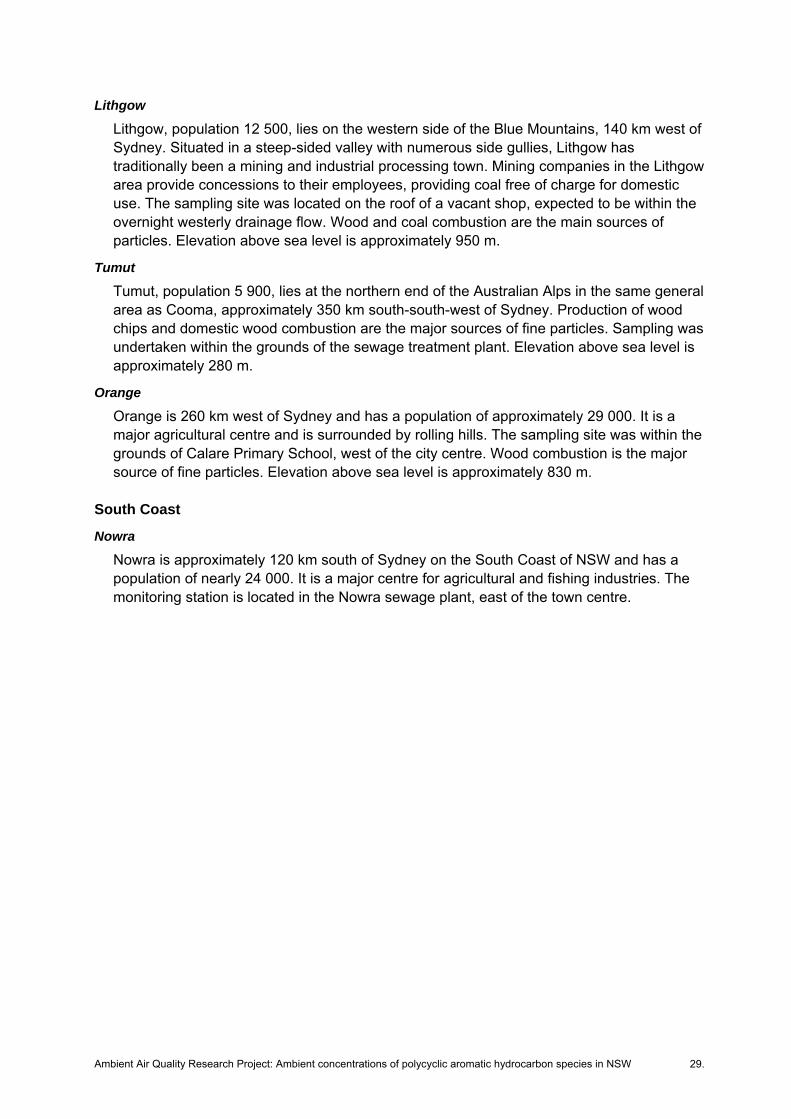
Lithgow, population 12 500, lies on the western side of the Blue Mountains, 140 km west of Sydney. Situated in a steep-sided valley with numerous side gullies, Lithgow has traditionally been a mining and industrial processing town. Mining companies in the Lithgow area provide concessions to their employees, providing coal free of charge for domestic use. The sampling site was located on the roof of a vacant shop, expected to be within the overnight westerly drainage flow. Wood and coal combustion are the main sources of particles. Elevation above sea level is approximately 950 m.
Tumut
Tumut, population 5 900, lies at the northern end of the Australian Alps in the same general area as Cooma, approximately 350 km south-south-west of Sydney. Production of wood chips and domestic wood combustion are the major sources of fine particles. Sampling was undertaken within the grounds of the sewage treatment plant. Elevation above sea level is approximately 280 m.
Orange
Orange is 260 km west of Sydney and has a population of approximately 29 000. It is a major agricultural centre and is surrounded by rolling hills. The sampling site was within the grounds of Calare Primary School, west of the city centre. Wood combustion is the major source of fine particles. Elevation above sea level is approximately 830 m.
South Coast
Nowra
Nowra is approximately 120 km south of Sydney on the South Coast of NSW and has a population of nearly 24 000. It is a major centre for agricultural and fishing industries. The monitoring station is located in the Nowra sewage plant, east of the town centre.

Ambient Air Quality Research Project: Ambient concentrations of polycyclic aromatic hydrocarbon species in NSW 30.
Appendix 3 Detailed Methodology 3.1 Sampling Procedure Sample air was drawn at a flow rate of approximately 68 m3h�1 through a Teflon filter paper (Pallflex Products Corporation; 20.5 cm × 25.5 cm Teflon-backed glass fibre filters) using a High Volume Sampler (model: Ecotech 2000) to which a size-selective inlet had been attached. The inlet makes use of the aerodynamic properties of particles to direct only those with a diameter less than 10 µm to the filter paper (Australian Standard 3580.9.6). The filter paper is mounted beneath a protective hood to prevent material falling directly onto the paper. Sampling was carried out continuously over 24-hour periods. The filter papers were equilibrated at constant relative humidity for at least 24 hours before and after exposure. Each paper was weighed before and after exposure in a temperature- and humidity-controlled environment in accordance with Australian Standard 3580.9.6. The mass of the unexposed filter paper is subtracted from the final mass to determine the mass of the sample collected. These data, together with the total volume of air drawn through the paper in the 24-hour period, yield the concentration (Australian Standard 2724.4). 3.2 Sample Details The high-volume samplers were generally operated for a calendar day (24-hour period starting at midnight). Seven samples collected at Orange were the only exception, with a 16-hour sample period, starting at 1600 hours and ending at 0800 hours the following morning (see Appendix 6). 3.3 Analytical Method
3.3.1 Sample Extraction The filter papers were extracted by an accelerated solvent extractor (ASE) with a mixture of dichloromethane/acetone (1:1) as per US EPA Method 3545 (US EPA 1996). Extract analysis and quantitation are done by GC/MS operated in selected ion monitoring mode, scanning three characteristic ions for each of the nineteen PAHs of interest. Quality control (QC) procedures used during the extraction and analysis included: • the spiking of all samples with phenanthrene-d10 (to monitor extraction efficiency) • incorporating a QC spike and method blank with each sample batch • analysing a duplicate with each sample batch where practicable • imposing control limits for surrogate recovery and matrix spike recoveries as a condition
for acceptance of data • further monitoring of extraction efficiency in conjunction with instrument calibration, by the
inclusion of a spiked reference sample material in each analytical batch. The reference material contained acenaphthylene, benz(a)anthracene, benz(b)fluoranthene, benzo(g,h,i)perylene, benzo(a)pyrene, dibenz(a,h)anthracene, fluoranthene, and phenanthrene.

Ambient Air Quality Research Project: Ambient concentrations of polycyclic aromatic hydrocarbon species in NSW 31.
3.3.2 Materials and Instruments dichloromethane: nanograde (Mallinckrodt # 3023 or equiv.) acetone: nanograde (Mallinckrodt # 0018 or equiv.) cyclohexane: nanograde (Mallinckrodt # 2941 or equiv.) pentane: pesticide grade (Mallinckrodt # 6145 or equiv.) diethyl ether: pesticide grade (Mallinckrodt # 3434 or equiv.) hexane: pesticide grade (Mallinckrodt # 4159 or equiv.) extraction solvent: a 10:90 mixture of ether:hexane ASE solvent: a 1:1 mixture of dichloromethane:acetone elution solvent: a 60:40 mixture of pentane:dichloromethane sodium sulfate, anhydrous: Ajax cat # 137 or equiv. Heat for 4 hours at 400°C reagent grade water: 18 megohm water
Silica:
100�200 mesh Davidson grade 923 (Supelco cat # 2-0296 or equiv.). Heat at 130°C for 16 hours.
Tetrabutyl-ammonium sulfite:
Dissolve 3.39 g of tetrabutyl-ammonium hydrogen sulfate (Ajax cat # 1180876 or equiv.) in 100 mL reagent water. Extract the solution 3 times with 20-mL aliquots of hexane. Discard the organic extracts and add 25 g sodium sulfite (Ajax cat # 510 or equiv.) to the aqueous solution. Store in an amber bottle at room temperature. Remake each month.
Sodium sulfate solution:
Add 25 g sodium sulfate to a 5-litre flask and make up to the mark with reagent water. Boiling chips:
(BDH 33009 or equiv.) Rinse with dichloromethane. Heat at 450°C for one hour. Vials:
12 mm × 32 mm 2-mL screw-top autosampler type (Varian 392604210 or equiv.). QC test solution:
Acenaphthene and phenanthrene 1000 µg/mL; benz(a)anthracene, benzo(b)fluoranthene, benzo(g,h,i)perylene, benzo(a)pyrene, fluoranthene, dibenz(a,h)anthracene 100 µg/mL. (Ultra PAH Mixture EPA � 2139N, or Supelco 4-1839 or equiv.)
Diatomaceous earth:
Hydromatrix or equivalent. Furnace at 400°C for 3 hours before use. ASE filters:
Dionex 049458, or Advantec GC50 20 mm or equivalent. Pre-extract in ASE with ASE solvent.
Filters:
For PM10: Laboratory blank and QC: glass microfibre. Whatman GF/F 4 cm or equivalent. Rinse with dichloromethane before use.

Ambient Air Quality Research Project: Ambient concentrations of polycyclic aromatic hydrocarbon species in NSW 32.
GC/MS systems: Integrated systems using a direct capillary interface between the GC/MS detector were used with a data system capable of data acquisition, storage and retrieval, peak integration and calibration, and ion profiling. The instruments used were the Hewlett Packard GC/MS 5890/5970 and 6840/5973 and the Varian 3400/Saturn 2000. The GC column used was a J&W DB-5MS 30 m × 0.25 mm × 0.25 µm or equivalent.
3.3.3 Limit of Detection Detection limits were adjusted as necessary to reflect dilutions of extract or proportion of filter paper used. These varied throughout the sampling period. Thus the limits of detection were: • 400 ng/filter samples in July 1997 (1/8 filter paper used) • 200 ng/filter samples in winter 1998 (1/4 filter paper used) • 100 ng/filter samples in August 1997 (1/2 filter paper used) • 50 ng/filter samples in 1999, 2000 and 2001 (whole filter paper used).
Ambient Air Quality Research Project: Ambient concentrations of polycyclic aromatic hydrocarbon species in NSW 33.
Appendix 4 Sensitivity to Treatment of Species with Concentrations Below the Detection Limit
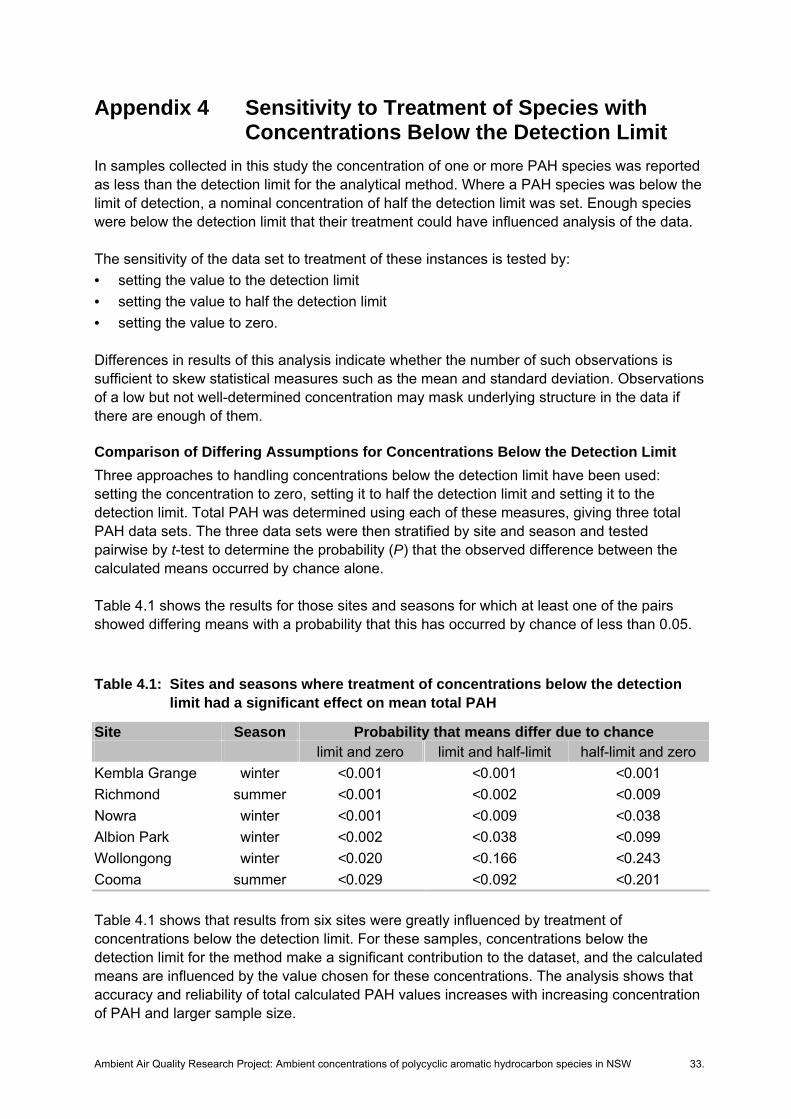
In samples collected in this study the concentration of one or more PAH species was reported as less than the detection limit for the analytical method. Where a PAH species was below the limit of detection, a nominal concentration of half the detection limit was set. Enough species were below the detection limit that their treatment could have influenced analysis of the data. The sensitivity of the data set to treatment of these instances is tested by: • setting the value to the detection limit • setting the value to half the detection limit • setting the value to zero. Differences in results of this analysis indicate whether the number of such observations is sufficient to skew statistical measures such as the mean and standard deviation. Observations of a low but not well-determined concentration may mask underlying structure in the data if there are enough of them. Comparison of Differing Assumptions for Concentrations Below the Detection Limit Three approaches to handling concentrations below the detection limit have been used: setting the concentration to zero, setting it to half the detection limit and setting it to the detection limit. Total PAH was determined using each of these measures, giving three total PAH data sets. The three data sets were then stratified by site and season and tested pairwise by t-test to determine the probability (P) that the observed difference between the calculated means occurred by chance alone. Table 4.1 shows the results for those sites and seasons for which at least one of the pairs showed differing means with a probability that this has occurred by chance of less than 0.05. Table 4.1: Sites and seasons where treatment of concentrations below the detection
limit had a significant effect on mean total PAH
Site Season Probability that means differ due to chance limit and zero limit and half-limit half-limit and zero Kembla Grange winter <0.001 <0.001 <0.001 Richmond summer <0.001 <0.002 <0.009 Nowra winter <0.001 <0.009 <0.038 Albion Park winter <0.002 <0.038 <0.099 Wollongong winter <0.020 <0.166 <0.243 Cooma summer <0.029 <0.092 <0.201 Table 4.1 shows that results from six sites were greatly influenced by treatment of concentrations below the detection limit. For these samples, concentrations below the detection limit for the method make a significant contribution to the dataset, and the calculated means are influenced by the value chosen for these concentrations. The analysis shows that accuracy and reliability of total calculated PAH values increases with increasing concentration of PAH and larger sample size.

Ambient Air Quality Research Project: Ambient concentrations of polycyclic aromatic hydrocarbon species in NSW 34.
Appendix 5 Summary Totals by Site 5.1 Summary Total PAH Tables 5.1 to 5.4 present the median, mean and maximum concentrations of total PAH (based on the 11 PAH species referred to in section 1.2) at each site and aggregated by region for spring, summer, autumn and winter respectively. Table 5.1: Summary of results, total PAH—spring
Sites Number of samples
Median ng/m3
Mean ng/m3
Maximum ng/m3
Great Dividing Range Lithgow 8 3.95 6.65 13.81 Tumut 6 1.69 3.21 7.19
Table 5.2: Summary of results, total PAH—summer
Sites Number of samples
Median ng/m3
Mean ng/m3
Maximum ng/m3
Sydney 14 0.58 0.62 1.39 Blacktown 4 0.69 0.67 0.92 Earlwood 2 0.97 0.97 1.30 Richmond 4 0.21 0.22 0.29 Rozelle 4 0.77 0.80 1.39 Illawarra 8 0.36 0.62 1.79 Warrawong 4 0.36 0.50 1.11 Wollongong 4 0.41 0.73 1.79 Lower Hunter 11 0.33 0.56 2.82 Beresfield 3 0.49 0.42 0.58 Newcastle 4 0.22 0.86 2.82 Wallsend 4 0.36 0.35 0.51 Great Dividing Range Armidale 2 0.28 0.28 0.32 Cooma 4 0.27 0.33 0.59 Lithgow 4 0.47 0.69 1.42 Tumut 4 0.27 0.82 2.55

Ambient Air Quality Research Project: Ambient concentrations of polycyclic aromatic hydrocarbon species in NSW 35.
Table 5.3: Summary of results, total PAH—autumn
Sites Number of samples
Median ng/m3
Mean ng/m3
Maximum ng/m3
Great Dividing Range Armidale 1 0.23 0.23 0.23 Tumut 5 1.93 4.89 14.23
Table 5.4: Summary of results, total PAH—winter
Sites Number of samples
Median ng/m3
Mean ng/m3
Maximum ng/m3
Sydney 52 2.32 4.47 17.48 Blacktown 10 2.82 4.29 14.3 Earlwood 10 6.01 7.35 17.48 Lindfield 12 1.60 3.59 13.18 Richmond 8 1.28 1.56 3.07 Rozelle 8 2.06 3.97 11.35 Sydney CBD 4 6.13 7.17 14.3 Illawarra 59 0.87 1.71 9.62 Albion Park 11 0.73 1.15 2.62 Kembla Grange 8 0.70 0.77 1.15 Kembla Street 8 1.17 1.94 6.44 Military Road 5 2.50 3.43 8.21 Warrawong 10 1.02 2.63 9.62 Wattle Street 7 1.03 1.54 4.13 Wollongong 10 0.77 1.24 3.57 Lower Hunter 31 1.60 2.68 13.03 Beresfield 10 0.84 1.49 4.12 Newcastle 11 2.02 2.93 8.83 Wallsend 10 2.75 3.59 13.03 Great Dividing Range Armidale 5 2.16 8.62 24.01 Cooma 13 6.32 7.68 17.69 Lithgow 14 24.73 23.80 52.27 Tumut 14 6.38 7.16 14.7 South Coast 6 0.77 0.92 1.67 Nowra 6 0.77 0.92 1.67
Tables 5.1 to 5.4 show that there are differences in concentrations between sites and between seasons. These are explored further in section 3.2. Figures 5.1 and 5.2 show the median, average and maximum for each site in summer and winter respectively.

Ambient Air Quality Research Project: Ambient concentrations of polycyclic aromatic hydrocarbon species in NSW 36.
Figure 5.1: Total PAH by site for summer
Figure 5.2: Total PAH by site for winter
0.0
0.5
1.0
1.5
2.0
2.5
3.0
3.5
4.0Bl
ackt
own
Earlw
ood
Ric
hmon
d
Roz
elle
War
raw
ong
Wol
long
ong
Bere
sfie
ld
New
cast
le
Wal
lsen
d
Arm
idal
e
Coo
ma
Lith
gow
Tum
ut
Con
cent
ratio
n (n
g/m
3 )
Median Average Maximum
0.0
10.0
20.0
30.0
40.0
50.0
60.0
Blac
ktow
n
Earlw
ood
Lind
field
Ric
hmon
d
Roz
elle
Sydn
ey C
BD
Albi
on P
ark
Kem
bla
Gra
nge
Kem
bla
Stre
et
Milit
ary
Roa
d
War
raw
ong
Wat
tle S
treet
Wol
long
ong
Bere
sfie
ld
New
cast
le
Wal
lsen
d
Arm
idal
e
Coo
ma
Lith
gow
Tum
ut
Now
ra
Con
cent
ratio
n (n
g/m
3 )
Median Average Maximum

Ambient Air Quality Research Project: Ambient concentrations of polycyclic aromatic hydrocarbon species in NSW 37.
5.2 Summary of BaP Tables 5.5 to 5.8 present the median, average and maximum concentrations of BaP at each site for spring, summer, autumn, and winter respectively. Sites are grouped by geographic region. Table 5.5: Summary of results, BaP—spring
Sites Number of samples
Median ng/m3
Mean ng/m3
Maximum ng/m3
Great Dividing Range Lithgow 8 0.39 0.75 1.85 Tumut 6 0.14 0.40 1.10
Table 5.6: Summary of results, BaP—summer
Sites Number of samples
Median ng/m3
Mean ng/m3
Maximum ng/m3
Sydney 14 0.02 0.03 0.07 Blacktown 4 0.04 0.04 0.07 Earlwood 2 0.02 0.02 0.02 Richmond 4 0.02 0.02 0.02 Rozelle 4 0.05 0.05 0.07 Illawarra 8 0.02 0.03 0.07 Warrawong 4 0.02 0.02 0.05 Wollongong 4 0.02 0.03 0.07 Lower Hunter 11 0.02 0.06 0.40 Beresfield 3 0.02 0.03 0.05 Newcastle 4 0.02 0.11 0.40 Wallsend 4 0.02 0.02 0.04 Great Dividing Range Armidale 2 0.02 0.02 0.02 Cooma 4 0.02 0.03 0.04 Lithgow 4 0.02 0.03 0.07 Tumut 4 0.03 0.09 0.27

Ambient Air Quality Research Project: Ambient concentrations of polycyclic aromatic hydrocarbon species in NSW 38.
Table 5.7: Summary of results, BaP—autumn
Sites Number of samples
Median ng/m3
Mean ng/m3
Maximum ng/m3
Great Dividing Range Armidale 1 0.02 0.02 0.02 Tumut 5 0.04 0.67 2.45
Table 5.8: Summary of results, BaP—winter
Sites Number of samples
Median ng/m3
Mean ng/m3
Maximum ng/m3
Sydney 52 0.19 0.46 2.25 Blacktown 10 0.22 0.43 1.92 Earlwood 10 0.55 0.76 2.25 Lindfield 12 0.06 0.39 1.67 Richmond 8 0.06 0.14 0.32 Rozelle 8 0.16 0.38 1.35 Sydney CBD 4 0.64 0.77 1.68 Illawarra 59 0.06 0.16 1.21 Albion Park 11 0.06 0.09 0.26 Kembla Grange 8 0.06 0.06 0.07 Kembla Street 8 0.08 0.18 0.65 Military Road 5 0.22 0.32 0.87 Warrawong 10 0.06 0.27 1.21 Wattle Street 7 0.05 0.12 0.38 Wollongong 10 0.06 0.11 0.38 Lower Hunter 31 0.13 0.30 1.92 Beresfield 10 0.07 0.15 0.52 Newcastle 11 0.20 0.29 1.09 Wallsend 10 0.26 0.45 1.92 Great Dividing Range Armidale 5 0.14 1.30 3.77 Cooma 13 0.84 1.12 3.02 Lithgow 14 4.45 4.21 8.99 Tumut 14 1.01 1.12 3.06 South Coast 6 0.06 0.07 0.07 Nowra 6 0.06 0.07 0.07

Ambient Air Quality Research Project: Ambient concentrations of polycyclic aromatic hydrocarbon species in NSW 39.
Appendix 6 PAH Concentrations in Orange Seven overnight samples were collected at Orange in the winter of 1997. Samples from Orange were collected over 16-hour periods starting at 1600 hours and ending at 0800 hours the following morning. As with the 24-hour samples, air was drawn at a flow rate of approximately 68 m3h�1 through a Teflon filter paper. Average total PAH for these samples was 10.9 ng/m3, which was greater than at the Great Dividing Range sites of Armidale, Cooma and Tumut, but considerably less than at Lithgow. The maximum total PAH concentration from a 16-hour sample was 30.7 ng/m3. The average concentration of BaP measured at Orange was 1.46 ng/m3, and the maximum was 4.34 ng/m3. These overnight samples are expected to measure higher concentrations than the 24-hour samples collected elsewhere in this study, as they cover hours of less atmospheric dispersion and often greater use of heaters. During daytime hours (from 0900 to 1500) lower concentrations would be expected as mixing heights increase.