Interim Report 2009 - Hang Seng Bank · PDF fileOperating profit excluding loan impairment...
104
Transcript of Interim Report 2009 - Hang Seng Bank · PDF fileOperating profit excluding loan impairment...


CONTENTS Page
Results in Brief 1
Chairman’s Statement * 2
Chief Executive’s Report * 3
Financial Review 5
Risk and Capital Management (unaudited) 16
- Risk Management
- Capital Management
Condensed Consolidated Income Statement (unaudited) 39
Condensed Consolidated Statement of Comprehensive Income (unaudited) 40
Condensed Consolidated Balance Sheet (unaudited) 41
Condensed Consolidated Statement of Changes in Equity (unaudited) 42
Condensed Consolidated Cash Flow Statement (unaudited) 44
Notes on the Condensed Consolidated Financial Statements (unaudited) 45
Review Report 90
Supplementary Notes on the Condensed Consolidated Financial Statements
(unaudited) 91
Additional Information 94
* Where possible, percentages in this section have been rounded to the nearest percentage
point to facilitate easy reading. Percentage-based indicators remain at 1 or 2 decimal places as
appropriate.
The abbreviations ‘HK$m’ and ‘HK$bn’ represent millions and billions of Hong Kong dollars
respectively.

RESULTS IN BRIEF
30 June 30 June
2016 2015
For the half-year ended
HK$m HK$m
Operating profit excluding loan impairment charges 10,237 11,414
Operating profit 9,516 10,820
Profit before tax1
9,499 21,720
Profit attributable to shareholders1
8,005 20,048
% %
Return on average ordinary shareholders' equity1
12.4 31.0
Cost efficiency ratio 32.7 31.0
Average liquidity coverage ratio (quarter ended 30 Jun) 257.1 221.6
Average liquidity coverage ratio (quarter ended 31 Mar) 257.1 167.4
HK$ HK$
Earnings per share1
4.19 10.49
Dividends per share 2.20 2.20
At 30 June At 31 December
2016 2015
At period-end
HK$m HK$m
Shareholders' funds 136,713 141,981
Total assets 1,321,367 1,334,429
% %
Capital ratios under Basel III
- Common Equity Tier 1 ("CET1") Capital Ratio 16.8 17.7
- Tier 1 Capital Ratio 18.1 19.1
- Total Capital Ratio 21.2 22.1
Half-year Half-year
ended ended
30 June 2016 30 June 2015
Profit before tax (HK$m) 9,499 11,084
Profit attributable to shareholders (HK$m) 8,005 9,412
Earnings per share (HK$) 4.19 4.92
Return on average ordinary shareholders' equity (%) 12.4 14.5
1 Partial disposal of shareholding in Industrial Bank Co., Ltd. ("Industrial Bank") in the first half of 2015
Reported results for the first half of 2015 include a gain on partial disposal of the ordinary shares of Industrial Bank of
HK$10,636m. Figures quoted as "excluding the gain on partial disposal of Industrial Bank" have been adjusted for the
above item. Excluding the gain on partial disposal of Industrial Bank, key financial results and performance metrics are
set out below for comparison purpose:
1

2
CHAIRMAN’S STATEMENT
The international economy was characterised by weak growth in the first half of 2016. In the US, growth
was only 1% and concerns over the strength of the labour market led the Federal Reserve to scale back
its planned cycle of interest rate hikes. In Europe, the uncertainty and financial market volatility created
by the UK referendum on EU membership cast a cloud over the economic outlook for the region.
Against this backdrop, Hang Seng leveraged its competitive strengths to maintain momentum for long-
term growth.
Due mainly to the active investment market’s impact on the Bank’s bottom line in the first half of 2015,
profit attributable to shareholders and earnings per share were down 15% year on year at HK$8,005m
and HK$4.19 per share respectively after excluding the 2015 HK$10,636m gain on the partial disposal
of our holding in Industrial Bank. Compared with the second half of 2015, profit attributable to
shareholders grew by 8% and earnings per share were up 12%.
The Directors have declared a second interim dividend of HK$1.10 per share, bringing the total
distribution for the first half of 2016 to HK$2.20 per share, the same as in the first half of 2015.
Economic Environment
The slowdown in Mainland growth and rising signs of softness in the global recovery are posing
downside risks for the economic performance of Hong Kong. GDP growth in the first quarter of 2016
hit a four-year low of 0.8%. In particular, consumer concerns over the uncertain economic outlook saw
private consumption expenditure, which has been a primary driver of growth in recent years, ease to
1.1% – its slowest rate since the third quarter of 2009. Given the current economic challenges, our
forecast for Hong Kong’s 2016 full-year GDP growth is 1.3%.
On the Mainland, the process of economic deleveraging is continuing to moderate the pace of
expansion. GDP growth was 6.7% in the second quarter, the same as in the first quarter. The shift from
an economy driven largely by investment and exports to one that is more reliant on consumption and
services will remain a drag on growth in the months ahead, although scope exists for the authorities to
implement macroeconomic policies that will minimise the risk of a sharper slowdown. We expect 2016
full-year GDP growth on the Mainland to be 6.7%.
Volatility in the international markets and the ongoing effects of the Mainland’s economic transition
will remain as challenges to economic growth in Asia in the short-to-medium term. However, the further
opening up of the financial sector on the Mainland as well as its push to extend and strengthen regional
and international economic ties, particularly as part of the ‘One Belt, One Road’ initiative, will generate
new opportunities for business growth.
In an increasingly uncertain global economic environment, our strong market position and solid capital
base will support our ability to drive forward with our long-term growth strategy and meet the diverse
needs of our client base. We will leverage our competitive strengths and deploy our resources to enhance
efficiency, deepen relationships with customers and acquire new business to achieve increasing value
for shareholders.
Raymond Ch’ien
Chairman
Hong Kong, 3 August 2016

3
CHIEF EXECUTIVE’S REPORT
In challenging operating conditions, Hang Seng Bank returned solid results in the first half of 2016.
Profitability and income were down against the high baseline created by the buoyant investment sector
and exceptional market conditions in the first half of 2015, but we recorded satisfactory growth in net
operating income, operating profit and profit attributable to shareholders compared with the second half
of 2015.
We maintained a healthy liquidity position and strong capital base to enable us to proactively manage
evolving regulatory requirements and support future growth.
With increasing pressure on lending spreads, net interest margin was maintained through effective
management of our asset liability structure and improved returns from the balance sheet management
portfolio.
Enhancements to the distribution network further expanded our target customer base and deepened
customer engagement. We maintained our competitive cost structure with upgrades to technology and
our digital platform.
We stepped up cross-border connectivity initiatives to capitalise on business opportunities arising from
policy developments in mainland China. In February this year, our Hang Seng China H-Share Index
Fund was among the first batch of northbound funds offered to Mainland investors under the Mainland-
Hong Kong Mutual Recognition of Funds initiative. In June, we received approval to establish the
Mainland’s first onshore foreign-majority-owned joint venture fund management company in Qianhai.
Financial Performance
Operating profit before loan impairment charges fell by 10% year on year to HK$10,237m and
operating profit was down 12% to HK$9,516m. Compared with the second half of 2015, however,
operating profit before loan impairment charges and operating profit were up 12% and 10%
respectively.
Excluding the impact of HK$10,636m gain on the partial disposal of our holding in Industrial Bank in
the first half of 2015, profit attributable to shareholders fell by 15% to HK$8,005m, earnings per share
were down 15% at HK$4.19 and profit before tax declined by 14% to HK$9,499m. Compared with the
second half of 2015, profit attributable to shareholders grew by 8%, earnings per share increased by
12% and profit before tax was up 8%. On a reportable basis, year-on-year profit attributable to
shareholders and earnings per share were both down 60% and profit before tax fell by 56%, reflecting
the impact of the Industrial Bank disposal gain.
A 6% rise in average interest-earning assets supported 5% growth in net interest income to
HK$11,003m. Net interest margin was 1.85%, compared with 1.86% and 1.80% for the first and second
halves of 2015.
Non-interest income fell by 31% to HK$4,214m, mainly reflecting the significant decline in investment
market activity versus the buoyant investment environment in the first half of 2015. Compared with the
second half of 2015, non-interest income was up 12%, due primarily to an improvement in returns from
the life insurance funds investment portfolio.
Operating expenses were HK$4,980m, down 3% year on year and 7% compared with the second half
of 2015. Our cost efficiency ratio was 32.7%.
At 30 June 2016, our total capital ratio was 21.2%, compared with 22.1% at 31 December 2015. Our
common equity tier 1 capital ratio was 16.8% and our tier 1 capital ratio was 18.1%, compared with
17.7% and 19.1% respectively at the end of last year.

4
The ‘Ever-growing Bank’
Operating conditions will remain challenging with the uncertain global environment and economic
adjustment on the Mainland.
To sustain Hang Seng’s ‘Ever-growing Bank’ objective, we will continue to sharpen our competitive
edge by leveraging our leading domestic bank's attributes to grow stable and quality earnings.
Based on our strong capital and healthy liquidity, we are well positioned to pursue our sustainable
growth strategies. Our integrated wholesale and retail banking propositions will continue to anchor
quality deposits, maintain funding competitiveness and maximise income from cross-selling
opportunities.
Hang Seng’s loyal customer base of 3.5 million is our most valuable asset. Our focus in strengthening
analytics and refining client segmentation has been rewarded by an increase in target Prestige Banking
customers, driving revenue growth. At the same time, we are able to offer our retail customers greater
convenience and enhanced service as we deepen our knowledge about their needs and behaviour.
The upgrade of our branch network, digital and mobile platforms have strengthened customer
engagement and enhanced our operational cost effectiveness.
We offer time-to-market wealth propositions in response to volatile market developments and
increasing customer preference for principal-protected, well-diversified investment options with stable
yields.
The industrial, commerce, retail and service sectors are the pillars of the Hong Kong economy. Our
Commercial Banking teams have been enhancing their sector expertise to support our corporate clients
by offering timely market information, and tailored funding, investment, liquidity and risk management
propositions.
As the leading domestic bank, Hang Seng has greatly benefitted from policy developments under
CEPA. In addition to Hang Seng Bank (China) Ltd’s branch network, Hang Seng has developed a
‘mixed business’ model in the Pearl River Delta, with the establishment of our securities investment
advisory joint venture, GZHS Research Co. Ltd.; our recently approved majority foreign owned asset
management joint venture in Qianhai; and the launch of the northbound Hang Seng China H-Share
Index Fund. Leveraging our exclusive partnership, we are working closely with Bupa to expand our
integrated health services proposition. We will ride on our successful experience to further develop
cross-border investment and insurance initiatives.
I would like to thank my colleagues for their dedication in driving our customer-focused strategy. We
are committed to embedding a value-based corporate culture that recognises, nurtures and rewards
talent.
Currently ranked by IMD as the most competitive economy in the world, Hong Kong is an important
international centre for finance and trade, and a primary gateway for cross-border commercial activities
between the Mainland and the international community. As the leading local bank in our home market,
we will leverage our competitive strengths and unique market position to sustain growth and deliver
service excellence for customers and value for shareholders.
Rose Lee
Vice-Chairman and Chief Executive
Hong Kong, 3 August 2016

5
FINANCIAL REVIEW
FINANCIAL PERFORMANCE
Income Analysis
Summary of financial performance
Half-year ended Half-year ended Half-year ended
Figures in HK$m 30 June
201630 June
2015 31 December 2015
Total operating income 21,851 24,675 19,346Operating expenses 4,980 5,136 5,346Operating profit 9,516 10,820 8,619Profit before tax 9,499 21,720 8,768Profit attributable to shareholders 8,005 20,048 7,446Earnings per share (in HK$) 4.19 10.49 3.73
First half of 2016 compared with first half of 2015
In the challenging global market conditions, Hang Seng Bank Limited (‘the Bank’) and its subsidiaries (‘the Group’) returned solid results in the first half of 2016 and maintained broad-based business momentum, reflecting the success of our customer-focused strategy for sustainable growth. Operating profit excluding loan impairment charges and other credit risk provisions was HK$10,237m, down 10% on the first half of 2015, due mainly to the reduction in wealth management income against the high baseline created by the favourable investment market sentiment in the first half of 2015. The decline in wealth management income was partially offset by higher net interest income resulting from initiatives to leverage our strong balance sheet and success with efforts to contain operating expenses at a lower level than in the same period in 2015.
Net interest income rose by HK$562m, or 5%, to HK$11,003m, driven mainly by the 6% increase in average interest-earning assets and the increased interest income from the life insurance funds investment portfolio.
Half-year ended Half-year ended Half-year ended30 June 30 June 31 December
Figures in HK$m 2016 2015 2015
Net interest income/(expense) arising from: - financial assets and liabilities that are not at fair value through profit and loss 11,488 11,270 11,372- trading assets and liabilities (467 ) (819) (631) - financial instruments designated at fair value (18 ) (10) (17)
11,003 10,441 10,724
Average interest-earning assets 1,199,059 1,132,121 1,180,549
Net interest spread 1.74 % 1.72 % 1.69 %Net interest margin 1.85 % 1.86 % 1.80 %

6
Average interest-earning assets increased by HK$67bn, or 6%, compared with the same period last year. Average customer lending increased by 1%, mainly affected by subdued loan demand together with the decrease in cross-border funding activities and early repayments of foreign currency loans. Average financial investments increased by 34% partly offset by the 32% fall in interbank placement.
Net interest margin narrowed by one basis point to 1.85% whilst the net interest spread increased by two basis points to 1.74%. Average loan spread on customer lending reduced, notably on corporate and commercial term lending. Higher balance sheet management income was recorded as a result of Treasury’s active management of the interest rate risk and efforts to enhance returns on commercial surplus. Customer deposits spread also widen as a result of the change in deposit mix, with low cost savings balance increased.
The contribution from net free funds fell by three basis points to 0.11%, reflecting the decrease in the average market interest rates.
Compared with the second half of 2015, net interest income grew by HK$279m, or 3%, mainly supported by 2% increase in average interest-earning assets, notwithstanding more calendar days in the second half. The net interest margin increased by five basis points.
The HSBC Group reports interest income and interest expense arising from financial assets and financial liabilities held for trading as ‘Net trading income’. Income arising from financial instruments designated at fair value through profit and loss is reported as ‘Net income from financial instruments designated at fair value’ (other than for debt securities in issue and subordinated liabilities, together with derivatives managed in conjunction with them).
The table below presents the net interest income of the Group, as included in the HSBC Group financial statements:
Half-year ended Half-year ended Half-year ended30 June 30 June 31 December
Figures in HK$m 2016 2015 2015
Net interest income and expense reported as ‘Net interest income’
- Interest income 13,161 13,482 13,261- Interest expense (1,693 ) (2,227 ) (1,908 ) - Net interest income 11,468 11,255 11,353
Net interest income and expense reported as ‘Net trading income’ (467 ) (819 ) (631 )
Net interest income and expense reported as ‘Net income from financial instruments 2 5 2 designated at fair value’
Average interest-earning assets 1,153,941 1,092,097 1,139,761
Net interest spread 1.91 % 1.96 % 1.87 %Net interest margin 2.00 % 2.08 % 1.98 %
Net fee income decreased by HK$1,031m, or 27%, to HK$2,853m, driven by lower wealth management business income as investment sentiment weakened in the unfavourable market conditions. Income from securities broking dropped by 53%, reflecting the decline in stock market trading turnover. Income from retail investment fund sales declined by 29%. However, income from credit card, insurance, account services and remittances grew by 3%, 5%, 6% and 13% respectively.
Net trading income decreased by HK$922m, or 67%, to HK$455m. Foreign exchange income was down by HK$698m, or 56%, as increased revenue from higher customer activity was more than offset by reduced

7
demand for foreign exchange-linked structured treasury products – particularly renminbi-linked structured products – and lower income from funding swaps. Income from securities, derivatives and other trading activities recorded a loss of HK$113m, compared with a gain of HK$141m for the same period last year, mainly reflecting the unfavourable movement in equity options trading under the life insurance business investment portfolio and the movement in market interest rates.
Net income/(loss) from financial instruments designated at fair value recorded net loss of HK$30m, compared with a net gain of HK$721m for the first half 2015, reflecting the fair value changes of assets held by the life insurance business due mainly to a favourable equity market movements in the first half of 2015. To the extent that this fair value (loss)/gain is attributable to policyholders, there is an offsetting movement reported under ‘net insurance claims and benefits paid and movement in liabilities to policyholders’ or ‘movement in present value of in-force long-term insurance business (‘PVIF’)’. Compared with second half of 2015, the net loss reduced by HK$809m, or 96%, reflecting a more stable fair value movement since last year-end.
Analysis of income from wealth management business
Half-year ended Half-year ended Half-year ended30 June 30 June 31 December
Figures in HK$m 2016 2015 2015
Investment income: - retail investment funds 741 1,051 712
- structured investment products 209 538 122- securities broking and related services 529 1,143 686- margin trading and others 52 50 50
1,531 2,782 1,570Insurance income: - life insurance 1,759 2,104 1,019- general insurance and others 139 138 121
1,898 2,242 1,140Total 3,429 5,024 2,710
Income from structured investment products includes income reported under net fee income on the sales of third-party structured investment products. It also includes profits generated from the selling of structured investment products in issue, reported under net trading income.
In challenging operating conditions, wealth management business income fell by HK$1,595m, or 32%, to HK$3,429m. Investment income fell by 45%, mainly due to the decrease in income from retail investment funds, structured investment products and securities broking and related services as investment sentiment weakened. Insurance business income decreased by 15%, reflecting a more favourable market conditions in the first half of 2015.
Compared with the second half of 2015, wealth management business income grew by 27%, driven by the increase of 66% in insurance income which benefitted from a less volatile market conditions while investment income remained intact.

8
Analysis of insurance business income
Half-year ended Half-year ended Half-year ended30 June 30 June 31 December
Figures in HK$m 2016 2015 2015
Life insurance:- net interest income and fee income 1,759 1,553 1,677- investment return on life insurance funds (including share of associate’s profit and
surplus on property revaluation backing insurance contracts) (394 ) 918 (1,070)- net insurance premium income 5,608 6,247 3,598- net insurance claims and benefits paid and movement in liabilities to policyholders (6,634 ) (8,125 ) (4,843)- movement in present value of in-force
long-term insurance business 1,420 1,511 1,6571,759 2,104 1,019
General insurance and others 139 138 121Total 1,898 2,242 1,140
Income from insurance business was HK$1,898m, down 15% on the first half of 2015, but up 66% on the second half. Net interest income and fee income from life insurance business grew by 13% compared with the first half of 2015, driven by the increase in average debt securities portfolios. The investment return on life insurance business recorded a loss of HK$394m compared with a gain of HK$918m for the first half of 2015, reflecting the unfavourable market conditions. To the extent that these investment returns were attributable to policyholders, there was an offsetting movement in net insurance claims and benefits paid and movement in liabilities to policyholders or present value of in-force long-term insurance business (‘PVIF’).
Net insurance premium income decreased by 10% due mainly to the combined effect of the decrease in new and renewal premiums and increased reinsurance premiums on new treaty arrangements for the in-force portfolio. Total policies in-force rose by 2% year-on-year. The decline in insurance premiums resulted in a corresponding decrease in net insurance claims and benefits paid and movement in liabilities to policyholders.
The movement in PVIF decreased by 6%, due mainly to the unfavourable change in market conditions update during the first half of 2016. The decrease was partly offset by an increase in the value of new business written. General insurance income was broadly in line with that for same period last year.

9
Loan impairment charges and other credit risk provisions increased by HK$127m, or 21%, to HK$721m, reflecting the more challenging credit environment in mainland China. Gross impaired loans and advances increased by HK$977m, or 36%, to HK$3,714m against last year-end, due mainly to certain corporate exposures in mainland China. Gross impaired loans and advances as a percentage of gross loans and advances to customers stood at 0.55% at the end of June 2016, compared with 0.43% at the end of June 2015 and 0.40% at the end of December 2015. Overall credit quality remained sound and we remain alert and monitor portfolio indicators for early signs of weakness.
Half-year ended Half-year ended Half-year ended30 June 30 June 31 December
Figures in HK$m 2016 2015 2015
Net charge for impairment of loans and advances to customers:Individually assessed impairment allowances: - new allowances 379 334 260- releases (35) (34) (16)- recoveries (5) (6) (10 )
339 294 234Net charge for collectively assessed impairment allowances 382 300 280Loan impairment charges and other credit risk provisions 721 594 514
Individually assessed impairment charges increased by HK$45m, or 15%, to HK$339m, mainly due to the downgrade of certain numbers of individually assessed impairments in Commercial Banking in Hong Kong and mainland China due to a more challenging credit environment in mainland China.
Collectively assessed impairment charges increased by HK$82m, or 27%, to HK$382m, mainly reflecting the increase in the collective impairment charges on the credit card portfolio. Impairment allowances for loans not individually identified as impaired remained relatively stable. The Group maintains a cautious outlook on the credit environment and will proactively enhance asset quality by continuing our conservative approach in growing our loan portfolio.
Total loan impairment allowances as a percentage of gross loans and advances to customers are as follows:
At 30 June At 30 June At 31 December2016 2015 2015
% % %
Loan impairment allowances: - individually assessed 0.13 0.18 0.12- collectively assessed 0.12 0.12 0.12Total loan impairment allowances 0.25 0.30 0.24
Operating expenses decreased by HK$156m, or 3%, to HK$4,980m, reflecting careful cost control. Staff costs were down by 4%, reflecting lower performance-related pay expenses, which were partly offset by the annual salary increment. The Group will continue to grow its digital capabilities and realise efficiency gains through increased automation and enhancement of our operational infrastructure. We will also step up training to build a more flexible and productive workforce to drive efficient growth.
Depreciation charges were up 19%, reflecting higher depreciation charges on business premises following the upward commercial property revaluation last year and branch renovation costs, which partly offset by the 7% decrease in general and administrative expenses.

10
The Group continued to focus on enhancing operational efficiency while maintaining growth momentum. The cost efficiency ratio rose by 1.7 percentage points to 32.7% when compared with the first half of 2015. The combined effect of the 5% increase in net operating income before loan impairment charges and the 7% reduction in operating expenses contributed to a 4.2-percentage-points improvement in the cost efficiency ratio compared to the 36.9% recorded in the second half of 2015.
Full-time equivalent staff numbers At 30 June At 30 June At 31 December by region 2016 2015 2015Hong Kong and others 7,919 7,993 8,306Mainland China 1,719 1,837 1,835Total 9,638 9,830 10,141
Operating profit decreased by HK$1,304m, or 12%, to HK$9,516m when compared with first half of 2015.
Profit before tax decreased by HK$12,221m, or 56%, to HK$9,499m (down 14% after excluding the gain on partial disposal of Industrial Bank in the first half of 2015) after taking the following major items into account:
• the gain on partial disposal of Industrial Bank of HK$10,636m in the first half of 2015; • a revaluation deficit of HK$77m in the first half of 2016 compared with a revaluation surplus of
HK$178m in the first half of 2015 in net surplus on property revaluation; and • a HK$26m decrease in share of profits from associates, mainly from a property investment company.
Property revaluation
Half-year ended Half-year ended Half-year ended30 June 30 June 31 December
Figures in HK$m 2016 2015 2015
Net (deficit) / surplus on property revaluation (77) 178 83
The Group’s premises and investment properties were revalued at 30 June 2016 by DTZ Debenham Tie Leung Limited. The valuation was carried out by qualified persons who are members of the Hong Kong Institute of Surveyors. The basis of the valuation of property was market value which is consistent with the definition of fair value under HKFRS 13 ‘Fair Value Measurement’ and takes into account the highest and best use of the property from the perspective of market participants. The highest and best use takes into account the use of the property that is physically possible, legally permissible and financially feasible as described in HKFRS 13. The net revaluation surplus for Group premises amounted to HK$277m was credited to the premises revaluation reserve. The related deferred tax provision for Group premises was HK$47m. Excluding the fair value gain on properties backing insurance contracts, revaluation deficit of HK$77m on investment properties were recognised through the condensed consolidated income statement.
First half of 2016 compared with second half of 2015
Against the second half of 2015, the Group continued to made good progress and achieved sustainable growth in revenues to return solid results for first half of 2016. Operating profit excluding loan impairment charges and other credit risk provisions increased by HK$1,104m, or 12%, driven by the increase in both net interest income and non-interest income and the reduction in operating expenses.
Net interest income grew by HK$279m, or 3%, due mainly to a 2% increase in average interest earning assets and a stable net interest margin despite continuous downward pressure in the wake of continued challenging market conditions and more calendar days in the second-half.
Non-interest income increased by HK$435m, or 12%, contributed by the strong growth of 27% in wealth management income. Investment income was broadly in line with second half of 2015, with higher income from retail investment funds and structured investment products more than offset by lower brokerage income as a result of sluggish equity markets. Income from life insurance business achieved good growth, reflecting

11
the decrease in net loss on the investment return from life insurance funds, benefiting from a less volatile fair value movement in global equity market.
Operating expenses dropped by 7%, largely attributable to decreased headcount through increased automation and enhancement of our operational infrastructure, reduced performance-related pay expenses and good cost containment in general and administrative expenses.
Operating profit was up 10%, despite higher loan impairment charges. Profit attributable to shareholders grew by 8%, to HK$8,005m in the first half of 2016, after taking into account the revaluation deficit on property revaluation in first half of 2016 compared with a revaluation gain for second half of 2015.

12
Segmental Analysis
The table below set out the profit before tax contributed by the business segments at the periods stated.
Retail Banking Global Banking
and Wealth Commercial andFigures in HK$m Management Banking Markets Other Total
Half-year ended 30 June 2016
Profit before tax 4,460 2,492 2,474 73 9,499
Share of profit before tax 47.0 % 26.2 % 26.0 % 0.8 % 100.0 %
Half-year ended 30 June 2015
Profit before tax 5,454 2,715 2,252 11,299 21,720
Share of profit before tax 25.1 % 12.5 % 10.4 % 52.0 % 100.0 %
Share of profit before tax (excluding the gain on partial
disposal of Industrial Bank) 49.2 % 24.5 % 20.3 % 6.0 % 100.0 %
Half-year ended 31 December 2015
Profit before tax 3,796 2,497 2,254 221 8,768
Share of profit before tax 43.3 % 28.5 % 25.7 % 2.5 % 100.0 %
Retail Banking and Wealth Management (‘RBWM’) recorded a 16% year-on-year decline in operating profit before loan impairment charges to HK$4,766m, an 18% drop in operating profit to HK$4,400m and an 18% decrease in profit before tax to HK$4,460m. This mainly reflects the higher level of market activity in the first half of 2015, as well as the adverse impact of the subsequent downturn in global investment sentiment on wealth management business. Compared with the second half of 2015, operating profit before loan impairment charges increased by 18%, operating profit rose by 18% and profit before tax was up 17%.
In the uncertain economic environment, we made good use of our extensive network and trusted brand to achieve solid balance sheet growth. Together with improved returns from fixed-income investments in our insurance investment portfolio, this balance sheet growth drove a 9% year-on-year increase in net interest income to HK$6,016m. Customer deposits grew by 3% and the lending portfolio remained the same compared with 2015 year-end, notwithstanding the seasonal impact of card receivables.
The poor investment market sentiment compared with the upbeat conditions in the first half of 2015 led to a 47% year-on-year decline in non-interest income to HK$1,836m. Wealth management business income fell by 32% to HK$2,901m. Compared with the second half of 2015, however, we recorded increases in non-interest income and wealth management income of 16% and 18% respectively.
Unsecured lending continued to be a stable revenue driver. With effective marketing campaigns and a good quality credit card customer base, card spending achieved year-on-year growth of 3% in Hong Kong. We retained our position as Hong Kong’s second-largest and third-largest card issuer for VISA and MasterCard cards respectively. Supported by strong customer analytics and enhancements to our digital services platform, we grew the personal loan portfolio in Hong Kong by 2% compared with 2015 year-end.
In a slow property market during the first half of 2016, we sustained our top-three position for mortgage business in Hong Kong, with a market share of 16% in terms of new mortgage registrations. Mortgage balances remained the same in Hong Kong and grew by 2% on the Mainland compared with 2015 year-end.

13
The unfavourable global investment market conditions had an adverse impact on investment income in the first half of 2016, which dropped by 41%. In line with the slump in equities market transactions against the high base of the first half of 2015, our securities turnover and revenue declined by 65% and 57% respectively. Retail investment funds turnover and revenue dropped by 41% and 29% respectively. We capitalised on our time-to-market strength to accommodate the increase in customer demand for capital-protected products. We continued to capture cross-border business opportunities created by ongoing policy relaxation on the Mainland. The Hang Seng China H-Share Index Fund was among the first batch of northbound funds offered to retail investors on the Mainland under the Mainland-Hong Kong Mutual Recognition of Funds scheme.
Insurance income decreased by 21% compared with the first half of 2015, due mainly to lower returns from the insurance investment portfolio. Leveraging our broad range of insurance products we grew new annualised premium by 9% year-on-year. The distribution of the Hang Seng Bupa PreciousHealth Series continued to underpin our ability to provide tailored ‘wealth-and-health’ solutions to customers. We launched the PreciousWay Education Life Insurance Plan to assist customers with planning for the future education needs of their younger family members.
Strong customer analytics enabled us to improve customer segmentation and needs-based selling. We leveraged our high-value proposition and tailored products and services to drive a 32% increase in the number of premium clients within our Prestige Banking customer base in Hong Kong.
We continued to invest in new technology and expand our digital services to deepen and broaden customer engagement by providing a wider range of products and bringing better value through interactive lifestyle partnerships. Recent initiatives include adding online document submission for lending products to our personal mobile banking app and e-banking platform. We also introduced an online ‘Investment Corner’ service that includes timely commentaries on market developments to help customers better plan their investment strategies.
Commercial Banking (‘CMB’) reported a 4% year-on-year drop in operating profit before loan impairment charges to HK$2,864m and an 8% decline in both operating profit and profit before tax to HK$2,492m. Compared with the second half of 2015, operating profit before loan impairment charges grew by 4%, and operating profit and profit before tax were both broadly unchanged.
In the challenging economic conditions, net interest income grew by 1% compared with a year earlier and was up 2% against the second half of 2015, driven by higher current and savings deposit balances particularly for small and medium-sized enterprises (SMEs). Customer loans were down by 4% compared with last year-end as a result of softer loan demand in Hong Kong and on the Mainland.
Non-interest income declined by 15%, due mainly to a reduction in income from renminbi-related business and a fall in wealth management income due to market volatility. A reduction in hedging activities by customers as a result of renminbi exchange fluctuations led to an 86% drop in structured foreign exchange income. Income from securities trading also fell by 12% due to lower market turnover. These drops were partly offset by good growth in insurance, remittances and vanilla foreign exchange transactions. Insurance income recorded a 31% increase, reflecting efficient and collaborative sales distribution efforts. Effective marketing drove a 15% growth in remittance income. Income from vanilla foreign exchange transactions rose by 31%, reflecting focused efforts to deepen relationships with customers. Compared with the second half of 2015, non-interest income was up by 2%.
SME business continued to be an important driver of sustainable revenue growth. Acquiring quality new customers remained a key focus, with mainland customers representing 61% of newly acquired SME customers in the first half of 2016. Net interest income from SME business reported satisfactory growth of 7%, due mainly to a rise in average customer deposits. Remittances and account-related fees achieved good growth of 15%. We further enriched our SME service propositions with the launch of Business Insurance Solutions (BIS), a packaged general insurance product covering 10 different insurance classes, that provides SME customers with a flexible one-stop insurance solution. We continued to upgrade our digital services to offer greater convenience to customers. SME customers that apply for Business Loans or Commercial Cards can now submit applications and upload supporting documents through our Business e-Banking website.

14
We focused on enhancing our cash management capabilities to further differentiate our offerings from our peers and capture an increased share of our customers’ banking business. We implemented a two-way cross-border renminbi sweeping solution to help customers better manage their liquidity needs. On the Mainland, we are one of the first foreign banks to provide retailers with support for collection consumer payments through Apple Pay and WeChat.
Approval to open free-trade accounts for commercial customers enabled us to offer a wider range of financial solutions to clients engaged in cross-border business.
Credit quality remained robust as we continued to proactively manage credit risk and asset quality. We also enhanced our portfolio management to optimise returns on risk-weighted assets.
Our continued efforts to provide dedicated services has been recognised by a number of awards, including ‘Best in Treasury and Working Capital - SMEs, Hong Kong’ in The Asset Triple A Treasury, Trade and Risk Management Awards 2016 and ‘The Best Payment Bank in Hong Kong’ in The Asian Banker Transaction Banking Awards 2016. We were also named ‘Best Trade Finance Product Innovation Bank’ at the fifth China Trade Finance Annual Conference.
Global Banking and Markets reported year-on-year growth of 8% in operating profit before loan impairment charges to HK$2,457m and a 10% rise in operating profit and profit before tax to HK$2,474m. Compared with the second half of 2015, operating profit before loan impairment charges grew by 12%, and operating profit and profit before tax were both up 10%.
Global Banking (‘GB’) recorded a 1% year-on-year decline in total operating income to HK$1,157m. Operating profit before loan impairment charges also dropped by 1% to HK$936m. A net release in loan impairment charges resulted in 2% growth of profit before tax to HK$953m.
Net interest income increased by 1% to HK$988m. Customer advances grew by 1% compared with 2015 year-end. Customer deposits were down by 9%.
Non-interest income fell by 12% to HK$169m, due mainly to the decline in fee income from credit-related activities.
Global Markets (‘GM’) reported a 15% year-on-year rise in both operating profit and profit before tax to HK$1,521m.
We achieved a 42% increase in net interest income to HK$1,032m, driven mainly by higher returns resulting from effective balance sheet management.
Non-interest income fell by 16% to HK$709m, due primarily to the 19% drop in trading income. Reduced customer demand for foreign-exchange structured products was partly offset by an increase in income from vanilla foreign exchange products.
Under the challenging and low interest rate environment, we focused on growing non-fund income. Leveraging the Bank’s strong relationships with customers, we collaborated closely with RBWM and CMB to increase cross-selling of GM products.
In response to further liberalisation in renminbi-related business, we strived to provide timely market information and products to meet customer needs in the volatile foreign exchange market.
In response to PBOC’s announcement of introducing qualified foreign players at the end of last year, the Bank has submitted the application for China Interbank FX Market membership to China Foreign Exchange Trade System (CFETS) in the first half of 2016. In early July, CFETS officially approved the Bank’s application for the membership, which will enable us to conduct foreign exchange transactions through CFETS directly for renminbi purchases and sales business.

15
Balance Sheet Analysis
Assets
Total assets were HK$1,321bn at 30 June 2016, maintaining broadly the same level as last year-end.
Cash and sight balances at central banks increased by HK$9bn, or 87%, to HK$19bn, reflecting the increase in the commercial surplus placed with the Hong Kong Monetary Authority.
Trading assets rose by HK$12bn, or 29%, to HK$52bn, primarily as a result of the switching of interbank lending to treasury bills and government securities, mainly Exchange Fund Bills and Notes.
Customer loans and advances decreased by HK$11bn, or 2%, to HK$678bn, since the end of 2015 in the wake of subdued credit demand. Loan for use in Hong Kong increased by 2%, primarily in property development and investment, financial concerns, information technology and working capital financing for certain large corporate customers. Lending to individuals maintained broadly the same level as last year end. The Group continued to maintain its market share for the mortgage business and grew its residential mortgage lending compared with the end of 2015. Trade finance declined by 13% against last year-end due mainly to the contraction in cross-border lending activities and sluggish market conditions leading to drop in trade finance coupled with keen pricing competition amongst banks. Loans and advances for use outside Hong Kong fell by 8% compared with the end of 2015, attributable to the decline in cross-border funding activities and early repayment of loans granted by Hong Kong Office and our mainland banking subsidiary. Overall credit quality remained sound.
Financial investments increased by HK$3bn, or 1%, to HK$375bn, reflecting the increased deployment of commercial surplus in debt securities given the subdued credit demand. The increase was also contributed by the growth in life insurance business during the period.
Customer deposits
Customer deposits, including certificates of deposit and other debt securities in issue, decreased marginally by HK$7bn, or 1%, to HK$991bn compared with last year-end. There was an increase in savings and current deposit accounts more than offset by the decrease in time deposit. At 30 June 2016, the advances-to-deposits ratio was 68.5%, compared with 69.1% at 31 December 2015.
Equity
At 30 June 2016, shareholders’ funds were HK$137bn, fell by HK$5bn, or 4%, against last year-end. Retained profits decreased by HK$5bn, or 5%, reflecting profit accumulation more than offset by the payment of 2016 first interim dividend and 2015 special and fourth interim dividends. The premises revaluation reserve remained relatively stable. The available-for-sale investment reserve decreased by HK$0.2bn, or 12%, against last year-end, mainly reflecting the fair value movement of the Group’s investment in Industrial Bank.

Risk and Capital Management
(Figures expressed in millions of Hong Kong dollars unless otherwise indicated)
(unaudited)
Risk Management
(a) Credit Risk
- formulating credit policies on approval process, post disbursement monitoring, recovery process and large exposure;
- controlling exposures to selected industries, counterparties, countries and portfolio types etc by setting limits;
- managing and directing credit-related systems initiatives; and
- providing advice and guidance to business units on various credit-related issues.
Risk appetite statement is a key component of risk management framework. The Group’s Risk Appetite Statement for 2016 was approved by the
Board as advised by the Risk Committee, which describes the types and amount of risk that the Bank is prepared to accept in achieving our medium
and long-term strategic goals.
The RMC regular reviews and monitors the Group’s risk appetite profile against the limits set out in the Risk Appetite Statement and determine
appropriate management action if material deviation from approved limits. The risk appetite profile is also reported to the Risk Committee and
Board from Chief Risk Officer including material deviation and management action where required.
All the Group's activities involve the analysis, evaluation, measurement, acceptance and management of some degree of risk or combination of
risks. The principal types of risk faced by the Group are credit risk, liquidity risk, market risk, insurance risk, operational risk and reputational risk.
There have been no material changes to our policies and practices regarding risk management and governance as described in the Group's Annual
Report 2015.
The Group's risk management policy is designed to identify and analyse risks, to set appropriate risk limits and to monitor these risks exposures
continually by means of reliable and up-to-date management information systems. The Group's risk management framework/policies policies and
risk appetite statement or major risk limits are approved by the Board of Directors and they are monitored and reviewed regularly by various Board
or management committees, including the Executive Committee, Risk Committee, Asset and Liability Management Committee ("ALCO") and Risk
Management Committee ("RMC").
Robust risk governance and accountability are embedded throughout the Group through an established framework that ensures appropriate
oversight of and accountability for the effective management of risk at all levels of the organization and across all risk types.
The Board has ultimate responsibility for approving the Group's risk appetite statement and the effective management of risk. The Risk Committee
advises the Board on risk appetite and its alignment with strategy, risk governance and internal controls and high-level risk related matters.
The ongoing monitoring, assessment and management of the risk environment and the effectiveness of risk management policies resides with the
Risk Management Committee.
For new products and services, in addition to the existing due diligence process, a Product Oversight Committee reporting to the RMC and
comprising senior executives from Risk, Legal, Compliance, Finance, and Operations/IT, is responsible for reviewing and approving the launch of
such new products and services. Each new service and product launch is also subject to an operational risk self-assessment process, which includes
identification, evaluation and mitigation of risk arising from the new initiative. Internal Audit is consulted on the internal control aspect of new
products and services in development prior to implementation.
The following information described the Group's management and control of risks, in particular, those associated with its use of financial
instruments ("financial risks"). Major types of risks to which the Group was exposed include credit risk, liquidity risk, market risk, insurance risk
and operational risk.
Credit risk is the risk that financial loss arises from the failure of a customer or counterparty to meet its obligations under a contract. It arises
principally from lending, trade finance, and treasury businesses. The Group has dedicated standards, policies and procedures in place to
control and monitor risk from all such activities.
There are dedicated functions, reported to Chief Risk Officer, responsible for centralised management of credit risk through:
- issuing guidelines on lending to specified market sectors, industries and products; the acceptability of specific classes of collateral or risk
mitigations and valuation parameters for collateral;
- undertaking an independent review and objective assessment of credit risk for all commercial non-bank credit facilities prior to the facilities
being committed to customers;
- maintaining and developing credit risk rating/facility grading process to categorise exposures and facilitate focused management;
- reporting to senior executives and various committees on aspects of the Group loan portfolio;
16

Risk and Capital Management (continued)
Risk Management (continued)
(a) Credit Risk (continued)
Impaired loan management and recovery
Risk rating framework
Collateral and other credit enhancements
- in the personal sector, charges over the properties, securities, investment funds and deposits;
- in the commercial real estate sector, charges over the properties being financed.
Settlement risk
Concentration of credit risk
The Group undertakes ongoing credit analysis and monitoring at several levels. Special attention is paid to problem loans. Loan impairment
allowances are made promptly where necessary and need to be consistent with established guidelines. Recovery units are established by the
Group to provide the customers with intensive support in order to maximise recoveries of doubtful debts. Management regularly performs an
assessment of the adequacy of the established impairment provisions by conducting a detailed review of the loan portfolio, comparing
performance and delinquency statistics against historical trends and undertaking an assessment of current economic conditions.
A risk rating framework on counterparty credit risk based on default probability and loss estimates is implemented across the Group. The rating
methodology based upon a wide range of financial analytics. This approach will allow a more granular analysis of risk and trends. The
information generated from the risk rating framework is mainly, but not exclusively, applied to credit approval, credit monitoring, pricing, loan
classification and capital adequacy assessment. The Group also has control mechanisms in place to validate the performance and accuracy of
the risk rating framework.
To measure and manage the risk in these exposures, both to individually assessed customers and to those aggregated into portfolios, the Group
employs diverse risk rating systems and methodologies.
The Group has implemented guidelines on the acceptability of specific classes of collateral or credit risk mitigation, and determined the
valuation parameters. Such parameters are established prudently and are reviewed regularly in light of changing market environment and
empirical evidence. Security structures and legal covenants are subject to regular review to ensure that they continue to fulfill their intended
purpose and remain in line with local market practice. While collateral is an important mitigant to credit risk, it is the Group’s policy to
establish that loans are within the customer’s capacity to repay rather than to rely excessively on security. Facilities may be granted on
unsecured basis depending on the customer’s standing and the type of product. The principal collateral types are as follows:
- in the commercial and industrial sector, charges over business assets such as properties, stock, debtors, investment funds, deposits and
machinery; and
Repossessed assets are non-financial assets acquired in exchange for loans in order to achieve an orderly realisation, and are reported in the
condensed consolidated balance sheet within "Other assets" at the lower of fair value (less costs to sell) and the carrying amount of the loan
(net of any impairment allowance). If excess funds arise after the debt has been repaid, they are made available either to repay other secured
lenders with lower priority or are returned to the customer. The Group does not generally occupy repossessed properties for its business use.
Collateral held as security for financial assets other than loans and advances is determined by the nature of the instrument. Debt securities,
treasury and other eligible bills are generally unsecured.
Settlement risk arises where a payment in cash, securities or equities is made in the expectation of a corresponding receipt in cash, securities or
equities. Daily Settlement Limits are established to cover the settlement risk arising from the Group’s trading transactions on any single day.
Settlement risk on many transactions, particularly those involving securities and equities, is substantially mitigated when effected via assured
payment systems, or on a delivery-versus-payment basis.
The International Swaps and Derivatives Association ("ISDA") Master Agreement is the Group’s preferred agreement for documenting
derivative activities. It provides the contractual framework within which dealing activity across a full range of over-the-counter ("OTC”)
products is conducted and contractually binds both parties to apply close-out netting across all outstanding transactions covered by an
agreement, if either party defaults or following other pre-agreed termination events. It is common, and our preferred practice, for the parties to
execute a Credit Support Annex ("CSA") in conjunction with the ISDA Master Agreement. Under a CSA, collateral is passed between the
parties to mitigate the counterparty risk inherent in outstanding positions. The majority of our CSAs are with financial institutional clients.
Concentration of credit risk exists when changes in geographic, economic or industry factors similarly affect groups of counterparties whose
aggregate credit exposure is material in relation to the Group’s total exposures. The Group’s portfolio of financial instrument is diversified
along geographic, industry and product sectors. Analysis of geographical concentration of the Group’s assets is disclosed in note 16 on the
condensed consolidated financial statements and credit risk concentration of respective financial assets is disclosed in notes 20, 21, 23 and 24
on the condensed consolidated financial statements.
17

Risk and Capital Management (continued)
Risk Management (continued)
(a) Credit Risk (continued)
(i) Maximum exposure to credit risk before collateral held or other credit enhancements
At 30 June At 30 June At 31 December
2016 2015 2015
Cash and sight balances at central banks 18,938 40,317 10,118
Placings with and advances to banks 97,307 152,767 123,990
Trading assets 52,063 44,772 40,352
Financial assets designated at fair value 419 70 1,136
Derivative financial instruments 9,084 6,004 11,595
Reverse repurchase agreements-non-trading - 1,904 -
Loans and advances to customers 678,442 673,022 688,946
Financial investments 371,196 323,181 367,630
Other assets 18,677 19,976 18,876
Financial guarantees and other credit related contingent liabilities 17,352 14,892 16,500
Loan commitments and other credit related commitments 496,484 520,714 512,729
1,759,962 1,797,619 1,791,872
(ii) Credit quality
Impaired loans and advances
Impairment assessment
Special attention is paid to problem loans and appropriate action is initiated to protect the Group’s position on a timely basis and to ensure that
loan impairment methodologies result in losses being recognised when they are incurred.
A summary of the five classifications and risk rating scales describing the credit quality of the Group’s lending and debt securities portfolios
are provided on page 45 of the Annual Report 2015.
The Group’s policy for recognising and measuring impairment allowances on both individually assessed advances and those which are
collectively assessed on a portfolio basis is described in note 3(d) on the consolidated financial statements for the year ended 31 December
2015.
Analysis of impairment allowances at 30 June 2016 and the movement of such allowances during the periods are disclosed in note 23 on the
condensed consolidated financial statements.
Impaired loans and advances are those that meet any of the following criteria:
- wholesale loans and advances classified as CRR 9 or CRR 10. These grades are assigned when the bank considers that either the customer is
unlikely to pay its credit obligations in full, without recourse to security, or when the customer is past due 90 days or more on any material
credit obligation to the Group;
- retail loans and advances:
- classified as EL 9 or EL 10;
- classified as EL 1 to EL 8 with 90 days and over past due;
- have been restructured with 90 days and over past due or with economic loss incurred by the Group irrespective of the delinquency status;
- renegotiated loans and advances that have been subject to a change in contractual cash flows as a result of a concession which the lender
would not otherwise consider, and where it is probable that without the concession the borrower would be unable to meet its contractual
payment obligations in full, unless the concession is insignificant and there are no other indicators of impairment. Renegotiated loans remain
classified as impaired until there is sufficient evidence to demonstrate a significant reduction in the risk of non-payment of future cash flows,
and there are no other indicators of impairment. For loans that are assessed for impairment on a collective basis, the evidence to support
reclassification as no longer impaired typically comprises a history of payment performance against the original or revised terms, depending on
the nature and volume of renegotiation and the credit risk characteristics surrounding the renegotiation. For loans that are assessed for
impairment on an individual basis, all available evidence is assessed on a case by case basis.
It is Group’s policy that each operating company in the Group creates impairment allowances for impaired loans promptly and appropriately.
For details of our impairment policies on loans and advances and financial investments, see notes 3(d) and 3(s) on the consolidated financial
statements for the year ended 31 December 2015.
18

Risk and Capital Management (continued)
Risk Management (continued)
(a) Credit Risk (continued)
Historical loss methodology is applied to estimate the collective impairment allowances under wholesale portfolio which have been incurred
but not individually identified. Loss rates are derived from the observed contractual write-off net of recoveries over a defined period of at least
60 months. The net contractual write-off rate is the actual amount of loss experienced after realisation of collateral and receipt of recoveries.
These historical loss rates are adjusted by an economic factor which adjusts the historical averages to better represent current economic
conditions affecting the portfolio. In order to reflect the likelihood of a loss event not being identified and assessed, an emergence period
assumption is applied. This reflects the period between a loss occurring and its identification. The emergence period is estimated by local
management for each identified portfolio. The factors that may influence this estimation include economic and market conditions, customer
behavior, credit management techniques and collection and recovery experiences in the market. A fixed range for the period between a loss
occurring and its identification is not defined across the Group and as it is assessed empirically on a periodic basis, it may vary over time as
these factors change.
The existence of collateral has an impact when calculating impairment on individually assessed impaired loans. When we no longer expect to
recover the principal and interest due on a loan in full or in accordance with the original terms and conditions, it is assessed for impairment. If
exposures are secured, the current net realisable value of the collateral will be taken into account when assessing the need for an impairment
allowance. No impairment allowance is recognised in cases where all amounts due are expected to be settled in full on realisation of the
security.
Personal lending portfolios are generally assessed for impairment on a collective basis as the portfolios typically consist of large groups of
homogeneous loans. Two methods are used to calculate allowances on a collective basis: a roll rate methodology or a more basic formulaic
approach based on historical losses.
The historical loss methodology is typically used to calculate collective impairment allowances for secured, or low default portfolios such as
mortgages, until the point at which they are individually identified and assessed as impaired. For loans which are collectively assessed using
historical loss methodology, the historical loss rate is derived from the average contractual write-off net of recoveries over a defined period.
The net contractual write-off rate is the actual amount of loss experienced after the realisation of collateral and receipt of recoveries.
A roll rate methodology is more commonly adopted for unsecured portfolios when there are sufficient volumes of empirical data to develop
robust statistical models.
The nature of the collective allowance assessment prevents individual collateral values or LTV ratios from being included within the
calculation. However, the loss rates used in the collective assessment are adjusted for the collateral realisation experiences which will vary
depending on the LTV composition of the portfolio.
Impairment and credit risk mitigation
19

Risk and Capital Management (continued)
Risk Management (continued)
(b) Liquidity and funding risk
It is the responsibility of the Group’s management to ensure compliance with local regulatory requirements and limits set by ALCO.
Liquidity is managed on a daily basis by the Bank's treasury functions and overseas treasury sites.
The purpose of liquidity and funding management is to ensure sufficient cash flows to meet all financial commitment and to capitalise on
opportunities for business expansion. This includes the Group’s ability to meet deposit withdrawals either on demand or at contractual
maturity, to repay borrowings as they mature, to comply with the statutory liquidity ratio, and to make new loans and investments as
opportunities arise. The Group maintains a stable and diversified funding base of core retail and corporate customer deposits as well as
portfolios of highly liquid assets.
As part of our Asset, Liability and Capital Management structure, we have established Asset and Liability Management Committee
("ALCO") at Group level and in operating entities. The terms of reference of all ALCOs include the monitoring and control of liquidity and
funding. Management of liquidity is carried out both at Group and Bank levels as well as in individual branches and subsidiaries. The
Group requires branches and subsidiaries to maintain a strong liquidity position and to manage the liquidity structure of their assets,
liabilities and commitments so that cash flows are approximately balanced and all funding obligations are met when due.
The Board is ultimately responsible for determining the types and magnitude of liquidity risk that the Group is able to take and ensure that
there is an appropriate organisation structure for managing this risk. Under authorities delegated by the Executive Committee, the Group
ALCO is responsible for managing all Asset, Liability and Capital Management issues including liquidity and funding risk management.
The Group ALCO delegates to the Group Tactical Asset and Liability Management Committee ("TALCO") the task of reviewing various
analyses of the Group pertaining to site liquidity and funding. TALCO's primary responsibilities include but are not limited to:
- reviewing the funding structure of operating entities and the allocation of liquidity among them;
- managing contingent liquidity commitment exposures within pre-determined limits;
- reviewing operating entities' list of liquid securities and documented proof that a deep and liquid market exists; and
- monitoring liquidity and funding limit breaches and providing direction to those operating entities that have not been able to rectify
breaches on a timely basis.
Compliance with liquidity and funding requirements is monitored by the ALCO and is reported to the Risk Management Committee
("RMC"), Executive Committee, Risk Committee and the Board of Directors on a regular basis. This process includes:
- maintaining compliance with relevant regulatory requirements of the reporting entity;
- projecting cash flows under various stress scenarios and considering the level of liquid assets necessary in relation thereto;
- monitoring balance sheet liquidity and advances to core funding ratios against internal and regulatory requirements;
- maintaining a diverse range of funding sources with adequate back-up facilities;
- managing the concentration and profile of debt maturities;
- managing debt financing plans;
- monitoring of depositor concentration in order to avoid undue reliance on large individual depositors and ensuring a satisfactory overall
funding mix; and
- maintaining liquidity and funding contingency plans. These plans identify early indicators of stress conditions and describe actions to be
taken in the event of difficulties arising from systemic or other crises, while minimising adverse long-term implications for the business.
20

Risk and Capital Management (continued)
Risk Management (continued)
(b) Liquidity and funding risk (continued)
Liquidity information
Quarter
ended
30 June
2016
Quarter
ended
31 March
2016
Quarter
ended
30 June
2015
Quarter
ended
31 March
2015
257.1% 257.1% 221.6% 167.4%
Quarter
ended
30 June
2016
Quarter
ended
31 March
2016
Quarter
ended
30 June
2015
Quarter
ended
31 March
2015
Level 1 assets 290,202 249,886 215,120 166,084
Level 2A assets 16,139 14,492 10,177 7,391
Level 2B assets 599 589 1,214 1,097
Total weighted amount of HQLA 306,940 264,967 226,511 174,572
The Banking (Liquidity) Rules ("BLR"), effective on 1 January 2015, signified the implementation of Liquidity Coverage Ratio ("LCR")
for category 1 Institution under Basel III liquidity standards in Hong Kong.
The Group is required under rule 11(1) of the BLR to calculate its LCR on a consolidated basis, under the Basel III LCR standard which
came into effect from 1 January 2015. During the year of 2016, the Group is required to maintain a LCR of not less than 70%, increasing to
not less than 100% by January 2019. The average LCR for the reportable periods are as follows:
Average Liquidity Coverage Ratio
The composition of the Group's high quality liquid assets ("HQLA") as defined under Schedule 2 of the BLR is shown as below. The
majority of the HQLA held by the Group are Level 1 assets which mainly consist of government debt securities.
Under the Banking (Liquidity) Rules, the average LCR was 257.1% for both the quarters ended 30 June and 31 March 2016 respectively,
compared with 221.6% and 167.4% for the quarters ended 30 June and 31 March 2015. The liquidity position of the Group remained
strong for the first half of 2016 as the Group has deployed the commercial surplus in high quality liquid assets given the subdued credit
demand.
To comply with the Banking (Disclosure) Rules, the details of liquidity information can be found in the Regulatory Disclosures section of
our website www.hangseng.com.
Weighted amount (Average value)
21
Risk and Capital Management (continued)
Risk Management (continued)
(b) Liquidity and funding risk (continued)
Wholesale debt monitoring
Sources of funding
Contingent liquidity risk
Most of the Group’s derivative transactions are exchange rate contracts and interest rate contracts. Under the terms of our current collateral
obligations under derivative contracts (which are ISDA compliant CSA contracts), in the event of a three-notch downgrade in credit
ratings, the additional collateral required to post is immaterial.
Operating entities provide customers with committed and standby facilities. These facilities increase the funding requirements of the Group
when customers drawdown. The liquidity risk associated with the potential drawdown on non-cancellable committed facilities is factored
into our stressed scenarios and limits are set for these facilities.
Currency mismatch
The Group allows currency mismatches to provide some flexibility in managing the balance sheet structure and to carry out foreign
exchange trading, on the basis that there is sufficient liquidity in the swap market to support currency conversion in periods of stress. The
Group sets limits on cash flow projection for all material currencies based on liquidity in the swap markets. These limits are approved and
monitored by ALCO.
The Group’s primary sources of funding are customer current accounts and customer savings deposits payable on demand or at short
notice. The Group also accesses wholesale funding markets by issuing senior unsecured debt securities (publicly and privately) and
borrowing from the secured repo markets against high quality collateral, in order to supplement our customer deposits, change the currency
mix and maturity profile, and maintain a presence in local wholesale markets.
Additional contractual obligations
Where wholesale debt term markets are accessed to raise funding, ALCO is required to ensure that there is no concentration of maturities of
these term debts.
22

Risk and Capital Management (continued)
Risk Management (continued)
(c) Market risk
Market risk governance
Monitoring and limiting market risk exposures
Our control of market risk in the trading and non-trading portfolios is based on a policy of restricting trading within a list of
permissible instruments authorised for each business lines, of enforcing new product approval procedures, and of restricting
trading in the more complex derivative products only to business line with appropriate levels of product expertise and robust
control systems.
The Group’s objective is to manage and control market risk exposures while maintaining a market profile consistent with the
Group’s risk appetite.
An independent market risk management and control function is responsible for measuring, monitoring and reporting market
risk exposures against the prescribed limits on a daily basis.
The Group uses a range of tools to monitor and limit market risk exposures including sensitivity analysis, value at risk
("VAR"), and stress testing.
The management of market risk is principally undertaken in Global Markets using risk limits allocated from the risk appetite,
which is subject to the Board’s approval. Limits are set for portfolios, products and risk types where appropriate, with market
liquidity and business need being primary factors in determining the level of limits set.
• Trading portfolios comprise positions arising from market-making and warehousing of customer-derived positions.
• Non-trading portfolios comprise positions that primarily arise from the interest rate management of our retail and
commercial banking assets and liabilities, and financial investments designated as available-for-sale.
Where appropriate, the Group applies similar risk management policies and measurement techniques to both trading and non-
trading portfolios. The Group’s objective is to manage and control market risk exposures in order to optimise return on risk
while maintaining a market profile consistent with the status as a professional banking and financial services organisation.
Model risk is governed through Model Oversight Committee ("MOC") at the Wholesale Credit and Market Risk ("WCMR")
level. The MOC has direct oversight on traded risk models utilised for risk measurement and management and stress testing to
ensure that they remain within our risk appetite and business plans.
Market risk is the risk that movements in market factors, including foreign exchange rates and commodity prices, interest
rates, credit spreads and equity prices, will reduce our income or the value of our portfolios.
There were no significant changes to our policies and practices for the management of market risk for the first half of 2016.
Exposure to market risk is separated into two portfolios:
The nature of the hedging and risk mitigation strategies range from the use of traditional market instruments, such as interest
rate swaps, to more sophisticated hedging strategies to address a combination of risk factors arising at portfolio level.
Market risk is managed and controlled through limits approved by the Group’s Risk Management Committee. These limits are
allocated across business lines and to the Group’s legal entities, including Hang Seng Bank (China) Limited.
23

Risk and Capital Management (continued)
Risk Management (continued)
(c) Market risk (continued)
Sensitivity analysis
Value at risk ("VAR")
• Standard VAR is calculated to a 99% confidence level and use a one-day holding period scaled to 10 days.
The historical simulation models used incorporate the following features:
• historical market rates and prices are calculated with reference to foreign exchange rates and commodity prices, interest
rates, equity prices and the associated volatilities;
• potential market movements utilised for VAR are calculated with reference to those historical data; and
Standard VAR is calculated at a 99% confidence level for a one-day holding period while stressed VAR uses a 10-day
holding period and a 99% confidence interval based on a continuous one-year historical significant stress period. The VAR
models used by the Group are based predominantly on historical simulation. These models derive plausible future scenarios
from past series of recorded market rates and prices, taking into account inter-relationships between different markets and
rates such as interest rates and foreign exchange rates. The models also incorporate the effect of option features on the
underlying exposures.
The nature of the VAR models means that an increase in observed market volatility will lead to an increase in VAR without
any changes in the underlying positions.
VAR is a technique that estimates the potential losses on risk positions as a result of movements in market rates and prices
over a specified time horizon and to a given level of confidence. The use of VAR is integrated into market risk management
and is calculated for all trading positions regardless of how the Group capitalises those exposures. Where there is no approved
internal model, the Group uses the appropriate local rules to capitalise exposures.
In addition, the Group calculates VAR for non-trading portfolios in order to have a complete picture of market risk. Where
VAR is not calculated explicitly, alternative tools are used.
Sensitivity analysis measures the impact of individual market factor movements on specific instruments or portfolios
including interest rates, foreign exchange rates and equity prices. The Group uses sensitivity measures to monitor the market
risk positions within each risk type, for example, the present value of a basis point movement in interest rates for interest rate
risk.
Sensitivity limits are set for portfolios, products and risk types, with the depth of the market being one of the principal factors
in determining the level of limits set.
24

Risk and Capital Management (continued)
Risk Management (continued)
(c) Market risk (continued)
VAR model limitations
Risk not in VAR ("RNIV") framework
RNIV is not viewed as being a material component of the Group’s market risk capital requirement. Risks covered by RNIV
represent 0.7% of market risk RWAs for models with regulatory approval.
Risk factors are reviewed on a regular basis and either incorporated directly in the VAR models, where possible, or quantified
through the VAR-based RNIV approach or a stress test approach within the RNIV framework. The severity of the scenarios is
calibrated to be in line with the capital adequacy requirements.
• Standard VAR is unlikely to reflect loss potential on exposures that only arise under significant market movements.
The Group’s VAR model is designed to capture significant basis risks such as asset swap spreads and cross-currency basis.
Other basis risks which are not completely covered in VAR, such as the LIBOR tenor basis, are complemented by RNIV
calculations and are integrated into the capital framework.
The RNIV framework aims to manage and capitalise material market risks that are not adequately covered in the VAR model.
In such instances the RNIV framework uses stress tests to quantify the capital requirement. For the average of the first half of
2016, the capital requirement derived from these stress tests represented 0.7% of the total internal model-based market risk
requirement.
• the use of historical data as a proxy for estimating future events may not encompass all potential events, particularly those
which are extreme in nature;
• the use of a holding period assumes that all positions can be liquidated or the risks offset during that period. This may not
fully reflect the market risk arising at times of severe illiquidity, when the holding period may be insufficient to liquidate or
hedge all positions fully;
• the use of a 99% confidence level, by definition does not take into account losses that might occur beyond this level of
confidence;
• VAR is calculated on the basis of exposures outstanding at the close of business and therefore does not necessarily reflect
intra-day exposures; and
Although a valuable guide to risk, VAR should always be viewed in the context of its limitations. For example:
25

Risk and Capital Management (continued)
Risk Management (continued)
(c) Market risk (continued)
Stress testing
Trading portfolios
VAR of the trading portfolios
Trading VAR predominantly resides within Global Markets. The VAR for trading activity at 30 June 2016 was lower than at
30 June 2015, mainly led by foreign exchange trading activities.
• historical scenarios incorporate historical observations of market movements during previous periods of stress which would
not be captured within VAR.
Market Risk Reverse stress tests are undertaken based upon the premise that there is a fixed loss. The stress test process
identifies which scenarios lead to this loss. The rationale behind the reverse stress test is to understand scenarios which are
beyond normal business settings that could have contagion and systemic implications.
Stressed VAR and stress testing, together with reverse stress testing, provide management with insights regarding the "tail
risk" beyond VAR for which the Group appetite is limited.
• single risk factor stress scenarios that are unlikely to be captured within the VAR models, such as the break of a currency
peg;
• technical scenarios consider the largest move in each risk factor without consideration of any underlying market correlation;
• hypothetical scenarios consider potential macroeconomic events, for example, the slowdown in mainland China and the
potential effects of a sovereign debt default, including its wider contagion effects; and
Stress testing is an important tool that is integrated into the Group’s market risk management tool to evaluate the potential
impact on portfolio values of more extreme, although plausible, events or movements in a set of financial variables. In such
abnormal scenarios, losses can be much greater than those predicted by VAR modelling.
Stress testing is implemented at the legal entity and the overall Group levels. Scenarios are tailored in order to capture the
relevant events or market movements. A scoring framework is in place for management to effectively assess the severity of the
potential stress losses and the likelihood of occurrence of the stress scenarios.
The process is governed by the HSBC Stress Testing Review Group forum which the Group being a participating member
determines the scenarios to be applied at portfolio and consolidated level, as follows:
26

Risk and Capital Management (continued)
Risk Management (continued)
(c) Market risk (continued)
Trading, 99% 1 day
Minimum Maximum
At 30 June during during Average
2016 the year the year for the year
VAR
Trading 29 17 45 33
Foreign exchange trading 19 6 21 13
Interest rate trading 29 17 48 32
Portfolio diversification (19) - - (12)
Stressed VAR
Trading 129 103 220 151
Foreign exchange trading 33 3 42 23
Interest rate trading 138 115 226 159
Minimum Maximum
At 30 June during during Average
2015 the year the year for the year
VAR
Trading 42 12 52 29
Foreign exchange trading 44 6 48 26
Interest rate trading 15 8 18 14
Portfolio diversification (17) - - (11)
Stressed VAR
Trading 174 25 219 116
Foreign exchange trading 188 18 226 112
Interest rate trading 49 22 94 50
Minimum Maximum
At 31 December during during Average
2015 the year the year for the year
VAR
Trading 28 12 52 29
Foreign exchange trading 5 5 48 22
Interest rate trading 28 8 32 18
Portfolio diversification (5) - - (11)
Stressed VAR
Trading 188 25 219 136
Foreign exchange trading 3 1 226 78
Interest rate trading 222 22 246 110
The Group’s trading VAR for the period ended 30 June 2016 is shown in the table below.
27

Risk and Capital Management (continued)
Risk Management (continued)
(c) Market risk (continued)
Non-trading portfolios
VAR of the non-trading portfolios
Non-trading VAR, 99% 1 day
Minimum Maximum
At 30 June during during Average
2016 the year the year for the year
VAR
Non-trading 46 33 68 52
Interest rate non-trading 38 28 52 40
Credit spread non-trading 27 19 38 29
Portfolio diversification (19) - - (17)
Minimum Maximum
At 30 June during during Average
2015 the year the year for the year
VAR
Non-trading 36 29 46 35
Interest rate non-trading 30 24 39 31
Credit spread non-trading 17 9 21 13
Portfolio diversification (10) - - (9)
Minimum Maximum
At 31 December during during Average
2015 the year the year for the year
VAR
Non-trading 36 28 50 36
Interest rate non-trading 32 24 39 32
Credit spread non-trading 19 9 30 16
Portfolio diversification (15) - - (12)
The Group’s non-trading VAR for the period ended 30 June 2016 is shown in the table below.
In measuring, monitoring and managing risk in our non-trading portfolios, VAR is just one of the tools used. The
management of interest rate risk in the banking book is described further in "Non-trading interest rate risk" below, including
the role of BSM.
Non-trading VAR excludes equity risk on available-for-sale securities, structural foreign exchange risk, and interest rate risk
on fixed rate securities issued by HSBC Holdings, the management of which is described in the relevant sections below.
Non-trading VAR of the Group predominantly relates to Balance Sheet Management ("BSM"). Contributions to non-trading
VAR are driven by interest rates and credit spread risks. There is no commodity risk in the non-trading portfolios.
28

Risk and Capital Management (continued)
Risk Management (continued)
(c) Market risk (continued)
Non-trading VAR, 99% 1 day (continued)
Credit spread risk for available-for-sale debt securities
Interest rate exposure
Trading interest rate risk
Non-trading interest rate risk
Non-trading interest rate risk in non-trading portfolios arises principally from mismatches between the future yield on assets
and their funding cost, as a result of interest rate changes.
Analysis of this risk is complicated by having to make assumptions on embedded optionality within certain product areas,
such as the incidence of mortgage prepayments, and from behavioural assumptions regarding the economic duration of
liabilities which are contractually repayable on demand, such as current accounts, and the re-pricing behaviour of managed
rate products.
In order to manage this risk optimally, non-trading interest rate risks is transferred to BSM or to separate books managed
under the supervision of the Asset, Liability and Capital Management Committee (‘ALCO’). The transfer of market risk to
books managed by BSM or supervised by ALCO is usually achieved by a series of internal deals between the business units
and these books. When the behavioural characteristics of a product differ from its contractual characteristics, the behavioural
characteristics are assessed to determine the true underlying interest rate risk. ALCO regularly monitors all such behavioural
assumptions and interest rate risk positions, to ensure they comply with interest rate risk limits established by senior
management.
The increase in credit spread VAR at 30 June 2016 compared with 30 June 2015 was mainly due to the expanded credit
spread delta position during the year.
Interest rate risks comprise those originating from Global Markets activities, both trading and non-trading portfolios which
include structural interest rate exposures. Global Markets manages interest rate risks within the limits approved by the RMC
and under the monitoring of both ALCO and RMC.
The Group’s control of market risk is based on restricting individual operations to trading within VAR and underlying
sensitivity limits including foreign exchange position limits, present value of a basis point limits and option limits, and a list
of permissible instruments authorised by the RMC, and enforcing rigorous new product approval procedures. In particular,
trading in the derivative products is supported by robust control systems whereas more complicated derivatives are mainly
traded on back-to-back basis. Analysis of VAR for trading portfolio is disclosed in "Value at Risk" section.
The Group’s control of market risk in the non-trading portfolios is based on transferring the assessed market risk of non-
trading assets and liabilities created outside BSM or Global Markets, to the books managed by BSM, provided the market risk
can be neutralised. The net exposure is typically managed by BSM through the use of fixed rate government bonds (liquid
asset held in available-for-sale books) and interest rate swaps. The interest rate risk arising from fixed rate government bonds
held within available-for-sale portfolios is reflected within the Group’s non-trading VAR. Interest rate swaps used by BSM
are typically classified as either a fair value hedge or a cash flow hedge and included within the Group’s non-trading VAR.
Any market risk that cannot be neutralised in the market is managed by local ALCO in segregated ALCO books.
The risk associated with movements in credit spreads is primarily managed through sensitivity limits, stress testing and VAR.
The credit spread VAR is derived from a one-day movement in credit spreads over a two-year period, calculated to a 99%
confidence interval.
The credit spreads VAR on our available-for-sale debt securities was HK$27 million (at 30 June 2015 : HK$17 million) at 30
June 2016.
29

Risk and Capital Management (continued)
Risk Management (continued)
(c) Market risk (continued)
Sensitivity of net interest income
Foreign exchange exposure
The Group’s gross structural foreign exchange exposure is represented by the net asset value of the Group’s foreign currency
investments in subsidiaries, branches and associates, and the fair value of the Group’s long-term foreign currency equity
investments. The Group’s structural foreign currency exposures are managed by the Group’s ALCO with the primary
objective of ensuring, where practical, that the Group’s and the Bank’s capital ratios are protected from the effect of changes
in exchange rates.
A principal part of the Group’s management of interest rate risk in non-trading portfolios is to monitor the sensitivity of
projected net interest income under varying interest rate scenarios (simulation modelling) quarterly, or more frequent should
the situation requires.
The Group’s foreign exchange exposures mainly comprise foreign exchange dealing by Global Markets and currency
exposures originated by its banking business. The latter are transferred to Global Markets where they are centrally managed
within foreign exchange position limits approved by the RMC. The net options position is calculated on the basis of delta-
weighted positions of all foreign exchange options contracts.
30

Risk and Capital Management (continued)
Risk Management (continued)
(c) Market risk (continued)
Foreign exchange exposure (continued)
The tables below summarise the net structural and non-structural foreign currency positions of the Group.
Other Total
foreign foreign
USD RMB currencies currencies
At 30 June 2016
Non-structural position
Spot assets 180,635 131,142 132,201 443,978
Spot liabilities (158,187) (114,052) (67,832) (340,071)
Forward purchases 395,772 179,633 43,793 619,198
Forward sales (415,813) (196,786) (108,086) (720,685)
Net options position 202 (60) (237) (95)
Net long/(short) non-
structural position 2,609 (123) (161) 2,325
Structural position - 14,536 895 15,431
At 30 June 2015
Non-structural position
Spot assets 190,834 169,403 103,328 463,565
Spot liabilities (153,429) (144,863) (64,860) (363,152)
Forward purchases 292,420 123,125 61,251 476,796
Forward sales (327,490) (136,603) (99,772) (563,865)
Net options position 179 (257) 40 (38)
Net long/(short) non-
structural position 2,514 10,805 (13) 13,306
Structural position - 14,215 750 14,965
At 31 December 2015
Non-structural position
Spot assets 204,267 148,933 137,573 490,773
Spot liabilities (169,779) (128,759) (66,796) (365,334)
Forward purchases 320,566 153,574 35,151 509,291
Forward sales (355,062) (170,630) (106,024) (631,716)
Net options position 212 (328) 121 5
Net long non-
structural position 204 2,790 25 3,019
Structural position - 15,238 816 16,054
Equities exposure
At 30 June 2016, the US dollar ("USD") was the currency in which the Group had non-structural foreign currency position
that was not less than 10% of the total net position in all foreign currencies. The Group also had a Chinese renminbi ("RMB")
structural foreign currency position, which was not less than 10% of the total net structural position in all foreign currencies.
The Group’s equities exposures in 2016 and 2015 are mainly long-term equity investments which are reported as "Financial
investments" set out in note 24 on the condensed consolidated financial statements. Equities held for trading purpose are
included under "Trading assets" set out in note 20 on the condensed consolidated financial statements. These are subject to
trading limit and risk management control procedures and other market risk regime.
31

Risk and Capital Management (continued)
Risk Management (continued)
(d) Insurance risk
Risk management objectives and policies for management of insurance risk
Asset/liability management
Underwriting strategy
Reinsurance strategy
Concentration of insurance risks
Financial risks
The Group's insurance businesses are exposed to a range of financial risks, including market risk, credit risk and liquidity risk.
The Group is also exposed to investment return guarantee risk for certain investment contracts issued to policyholders. The risk is that the
yield on the assets held by the Group to meet these guarantees may fall short of the guaranteed return. The framework for the management of
this risk is to adopt a matching approach whereby assets held are managed to meet the liability to policyholders. An additional provision is
established where analysis indicates that, over the life of the contracts, the returns from the designated assets may not be adequate to cover the
related liabilities.
The Group uses several methods to assess and monitor insurance risk exposures both for individual types of risks insured and overall risks.
These methods include internal risk measurement models, sensitivity analyses, scenario analyses and stress testing.
The theory of probability is applied to the pricing and provisioning for a portfolio of insurance contracts. The principal risk is that the timing
and severity of claims is different from expected. Insurance events are, by their nature, incorporated with certain degree of randomness, and
the actual number and size of events during any one year may vary from those estimated using established statistical techniques.
Within the insurance process, concentrations of risk may arise where a particular event or series of events could impact heavily upon the
Group’s liabilities. Such concentrations may arise from a single insurance contract or through a number of related contracts, and relate to
circumstances where liabilities could arise.
The Group is subject to concentration risk arising from claims relating to common carriers, epidemics, natural disasters, etc, that affect the
properties, physical conditions and lives of the policyholders insured by the Group. To mitigate some of these risks, catastrophe reinsurance
arrangements have been made by the Group.
The Group actively manages its assets using an approach that considers asset quality, risk profile, diversification, asset/liability matching,
liquidity and target investment return. The goal of the investment process is to achieve the target level of investment return with minimum
volatility. The Investment Committee of the Group's insurance subsidiary review and approve the investment policy including asset allocation,
investment guidelines and limits on a periodic basis, while the Asset and Liability Management Committee provides oversight of the
asset/liability management process.
The Group establishes the investment policy for each major insurance product category according to specific product requirements and local
regulatory requirement. The investment policy defines the asset allocations and restrictions with an aim to achieve the target investment return
in the long term. The estimates and assumptions used in determining the approximate amounts and timing of payments to or on behalf of
policyholders for insurance liabilities are regularly re-evaluated. Actual results may deviate from the estimate and assumption and could
impact the Group’s ability to achieve its asset/liability management goals and objectives.
The Group’s underwriting strategy seeks diversity to ensure a balanced portfolio and is based on a large portfolio of similar risks over a
number of years and, as such, it is believed that this reduces the variability of the outcome.
The Group is exposed to the uncertainty surrounding the timing and severity of insurance claims under its insurance contracts. The Group also
has exposure to market risk through its insurance and investment activities.
The Group manages its insurance risk through asset and liability management, underwriting limits, approval procedures for transactions that
involve new products or that exceed set limits, risk diversification, pricing guidelines, reinsurance and monitoring of emerging issues, taking
into account where appropriate local market conditions and regulatory requirements apply.
Through its insurance subsidiaries, the Group offers comprehensive insurance products, including life and non-life insurance, to both personal
and commercial customers. These insurance operating subsidiaries are subject to the supervision of the Office of the Commissioner of
Insurance and are required to observe the relevant compliance requirements stipulated by the Insurance Commissioner.
The Group reinsures a portion of the insurance risks it underwrites in order to control its exposures to losses and protect capital resources.
These reinsurance agreements transfer part of the risk and limit the exposure from each life insured. The amount of each risk retained depends
on the Group's evaluation of the specific risk, subject in certain circumstances, to maximum limits based on characteristics of coverage. Under
the terms of the reinsurance agreements, the reinsurer agrees to reimburse the ceded amount in the event the claim is paid. The Group buys a
combination of proportionate and non-proportionate reinsurance to reduce the retained sum-at-risk so that it falls within specified insurance
risk appetite. The Group also utilises reinsurance to manage the risk arising from guarantees provided to the policyholders under the non-
linked traditional non-participating insurance product. In addition, the Group uses reinsurance agreements with non-affiliated reinsurers to
manage its exposure to losses resulting from certain catastrophes. However, the Group remains liable to its policyholders with respect to ceded
insurance if any reinsurer fails to meet the obligations it assumes.
32

Management Discussion and Analysis (continued)
Risk Management (continued)
(e) Operational risk
Operational risk management framework
Key Components of the Operational Risk Management Framework
Three lines of defence
- The first line of defence is accountable for managing and monitoring operational risk in the business.
- The second line is responsible for providing risk oversight, challenge, advice and insights to the business.
- The third line of defence independently assures that the Bank is managing operational risk effectively.
Activity to strengthen our operational risk culture and to better embed the use of our ORMF continued in 2016. In particular, we
continued to streamline our operational risk management processes, procedures and tool sets to provide more forward-looking risk
insights and more effective operation of the ORMF. A diagrammatic representation of the ORMF is presented above.
Articulating our risk appetite for material operational risks helps the organisation understand the level of risk the Bank is willing to
accept. The operational risk appetite is approved annually by the Risk Management Committee. Monitoring operational risk
exposure against risk appetite on a regular basis and implementing our risk acceptance process drives risk awareness in a forward-
looking manner. It assists management in determining whether further action is required.
The Three Lines of Defence model is essential to delivering strong risk management within the Bank. It defines who is responsible
to do what to identify, assess, measure, manage, monitor, and mitigate operational risks, encouraging collaboration and enabling
efficient coordination of risk and control activities.
Having a strong Three Lines of Defence model in operation across the Bank enables us to identify and effectively manage
operational risks.
Operational risk is relevant to every aspect of our business and covers a wide spectrum of issues, in particular legal, compliance,
security and fraud. Losses arising from breaches of regulation and law, unauthorised activities, error, omission, inefficiency, fraud,
systems failure or external events all fall within the definition of operational risk.
Responsibility for minimising operational risk lies with HASE’s management and staff in particular every employee plays a role in
managing operational risk at HASE. Accountability for managing and controlling risks lies directly with individual risk owners.
HASE’s Operational Risk Management Framework (ORMF) is our overarching approach for managing operational risk in
accordance with our business and operational risk strategies. The purpose of the ORMF is to make sure we fully identify and
manage our operational risks in an effective manner and maintain our targeted levels of operational risk within the Bank’s risk
appetite, as defined by the Board. HASE adopts the HSBC Group’s ORMF which comprises the 14 key components set below.
33

Risk and Capital Management (continued)(Figures expressed in millions of Hong Kong dollars unless otherwise indicated)
Capital Management
There are no relevant capital shortfalls in any of the Group’s subsidiaries at 30 June 2016 (31 December 2015: nil) which are not included in its
consolidation group for regulatory purposes.
The following tables show the capital ratios, capital buffers, risk-weighted assets and capital base as contained in the "Capital Adequacy Ratio" return
required to be submitted to the Hong Kong Monetary Authority ("HKMA") by the Bank on a consolidated basis that is specified by the HKMA under
the requirements of section 3C(1) of the Banking (Capital) Rules.
The Group uses the advanced internal ratings-based approach to calculate its credit risk for the majority of its non-securitisation exposures. For market
risk, the Group uses an internal models approach to calculate its general market risk for the risk categories of interest rate and foreign exchange
(including gold bullion) exposures and the standardised (market risk) approach for calculating other market risk positions. For operational risk, the
Group uses the standardised (operational risk) approach to calculate its operational risk.
The Bank and its subsidiaries maintain a regulatory reserve to satisfy the provisions of the Banking Ordinance and local regulatory requirements for
prudential supervision purposes. At 30 June 2016, the effect of this requirement is to restrict the amount of reserves which can be distributed to
shareholders by HK$5,823m (31 December 2015: HK$6,610m).
The Banking (Capital) (Amendment) Rules 2014 came into effect on 1 January 2015 to implement the Basel III capital buffer requirements in Hong
Kong. The changes include the phase-in from 2016 to 2019 of the Capital Conservation Buffer ("CCB") which is designed to ensure banks build up
capital outside periods of stress of 2.5% of risk-weighted assets ("RWAs"), the Countercyclical Capital Buffer ("CCyB") which is set on an individual
country basis and is built up during periods of excess credit growth to protect against future losses, and the Higher Loss Absorbency ("HLA")
requirements for Domestic Systemically Important Banks ("D-SIB"). On 27 January 2015 and 14 January 2016, the HKMA announced a CCyB for
Hong Kong of 0.625% and 1.25% of RWAs from 1 January 2016 and 1 January 2017 respectively under the phase-in arrangements of Basel III,
equivalent to 2.5% once fully phased in. On 16 March 2015 and 31 December 2015, the HKMA announced its designation of the Bank as a D-SIB in
Hong Kong and required the Bank to establish 0.375% and 0.75% of RWAs for HLA from 1 January 2016 and 1 January 2017 respectively under the
phase-in arrangement, equivalent to 1.5% on full implementation.
During the period, the Group has complied with all of the externally imposed capital requirements by the HKMA.
34

Risk and Capital Management (continued)
Capital Management (continued)
Capital Base
At 30 June At 30 June At 31 December
2016 2015 2015
Common Equity Tier 1 ("CET1") Capital
Shareholders' equity 114,350 119,201 120,963
- Shareholders' equity per condensed consolidated balance sheet 136,713 139,474 141,981
- Additional Tier 1 ("AT1") perpetual capital instrument (6,981) (6,981) (6,981)
- Unconsolidated subsidiaries (15,382) (13,292) (14,037)
Regulatory deductions to CET1 capital (29,783) (29,975) (30,687)
- Cash flow hedging reserve (8) (22) (11)
- Changes in own credit risk on fair valued liabilities (17) (7) (6)
- Property revaluation reserves* (23,042) (22,654) (23,135)
- Regulatory reserve (5,823) (6,382) (6,610)
- Intangible assets (421) (433) (421)
- Defined benefit pension fund assets (22) (34) (35)
- Deferred tax assets net of deferred tax liabilities (142) (104) (115)
- Valuation adjustments (308) (339) (354)
Total CET1 Capital 84,567 89,226 90,276
AT1 Capital
Total AT1 capital before and after regulatory deductions 6,981 6,981 6,981
- Perpetual capital instrument 6,981 6,981 6,981
Total AT1 Capital 6,981 6,981 6,981
Total Tier 1 ("T1") Capital 91,548 96,207 97,257
Tier 2 ("T2") Capital
Total T2 capital before regulatory deductions 15,651 18,000 15,746
- Term subordinated debt 2,328 4,767 2,325
- Property revaluation reserves* 10,368 10,194 10,411
- Impairment allowances and regulatory reserve eligible
for inclusion in T2 capital 2,955 3,039 3,010
Regulatory deductions to T2 capital (315) (315) (315)
- Significant capital investments in unconsolidated financial sector entities (315) (315) (315)
Total T2 Capital 15,336 17,685 15,431
Total Capital 106,884 113,892 112,688
*
The following table sets out the composition of the Group's capital base under Basel III at 30 June 2016, 30 June 2015 and 31 December 2015. A more
detailed breakdown of the capital position is available in the Regulatory Disclosures section of our website www.hangseng.com.
Includes the revaluation surplus on investment properties which is reported as part of retained profits and related adjustments made in
accordance with the Banking (Capital) Rules issued by the HKMA.
35

Risk and Capital Management (continued)
Capital Management (continued)
Capital Base (continued)
Risk-weighted assets by risk type
At 30 June At 30 June At 31 December
2016 2015 2015
Credit risk 444,700 453,899 446,753
Market risk 9,876 20,028 13,698
Operational risk 50,180 47,516 49,023
Total 504,756 521,443 509,474
Market risk-weighted assets
At 30 June At 30 June At 31 December
2016 2015 2015
Internal models approach
Value at Risk ("VAR") 3,913 4,956 3,553
Stressed VAR 5,589 13,654 8,811
Standardised approach
Specific interest rate exposures 374 1,418 1,334
Total 9,876 20,028 13,698
Capital ratios (as a percentage of risk-weighted assets)
The capital ratios on a consolidated basis calculated in accordance with the Banking (Capital) Rules are as follows:
At 30 June At 30 June At 31 December
2016 2015 2015
CET1 capital ratio 16.8% 17.1% 17.7%
Tier 1 capital ratio 18.1% 18.5% 19.1%
Total capital ratio 21.2% 21.8% 22.1%
Capital buffers (as a percentage of risk-weighted assets)
At 30 June
2016
Capital conservation buffer ratio 0.625%
Higher loss absorbency ratio 0.375%
Countercyclical capital buffer ("CCyB") ratio 0.537%
Total 1.537%
The Basel III rules set out the minimum capital requirements, to be phased in sequentially from 1 January 2013 and become fully effective on 1 January
2019. On a pro-forma basis that takes no account of, for example, any future profits or management action and any change in the current regulations or
their application before full implementation, the Group’s capital ratios at Basel III end point are the same as above as at 30 June 2016. The pro-forma
Basel III end point basis position is a mechanical application of the current rules to the capital base as at 30 June 2016, it is not a projection.
With effect from 1 January 2016, the following capital buffers are phased-in and the applicable ratios to the Group on a consolidated basis are as
follows:
The geographical breakdown of risk-weighted assets in relation to private sector credit exposures and the applicable CCyB ratio for each jurisdiction
using the standard template as specified by the HKMA can be viewed in the Regulatory Disclosures section of our website www.hangseng.com.
36

Risk and Capital Management (continued)
Capital Management (continued)
Principal subsidiaries and basis of consolidation
Principal activities Total assets* Total equity* Total assets* Total equity*
Hang Seng Futures Ltd Futures brokerages 102 102 102 102
Hang Seng Investment Management Ltd Fund management 1,146 1,075 946 910
Hang Seng Investment Services Ltd Provision of investment
commentaries 9 9 9 9
Hang Seng Securities Ltd Stockbroking 3,257 1,656 2,493 1,596
Hang Seng Insurance Co. Ltd Retirement benefits
and its subsidiaries and life assurance 118,050 9,074 112,857 9,139
* Prepared in accordance with HKFRS
Capital instruments
The following is a summary of the Group’s CET1, AT1 and T2 capital instruments issued by the Bank.
At 30 June At 30 June At 31 December
2016 2015 2015
CET1 capital instruments
Ordinary shares:
1,911,842,736 issued and fully paid ordinary shares 9,658 9,658 9,658
AT1 capital instruments
Perpetual capital instrument (nominal value: US$900m) 6,981 6,981 6,981
T2 capital instruments
Subordinated loan due 2021 (nominal value: US$450m) - 2,441 -
Subordinated loan due 2022 (nominal value: US$300m) 2,328 2,326 2,325
The basis of consolidation for financial accounting purposes is in accordance with Hong Kong Financial Reporting Standards ("HKFRS"), as described
in note 3 on the condensed consolidated financial statements.
The basis of consolidation for regulatory purposes is different from that for accounting purposes. Subsidiaries included in the consolidation for
regulatory purposes are specified in a notice from the HKMA in accordance with section 3C(1) of the Banking (Capital) Rules.
Subsidiaries not included in consolidation for regulatory purposes are securities and insurance companies that are authorised and supervised by a
regulator and are subject to supervisory arrangements regarding the maintenance of adequate capital to support business activities comparable to those
prescribed for authorised institutions under the Banking (Capital) Rules and the Banking Ordinance. The capital invested by the Group in these
subsidiaries is deducted from the capital base as determined in accordance with Part 3 of the Banking (Capital) Rules.
A list of these subsidiaries is shown below:
At 31 December 2015At 30 June 2016
As at 30 June 2016, there are no subsidiaries which are included within both the accounting scope of consolidation and the regulatory scope of
consolidation but the method of consolidation differs.
There are also no subsidiaries which are included within the regulatory scope of consolidation but not included within the accounting scope of
consolidation.
For insurance entities, the figures shown above exclude deferred acquisition cost assets as these are derecognised for consolidation purpose due to the
recognition of the present value of in-force long-term insurance business (‘PVIF’) on long-term insurance contracts and investment contracts with
discretionary participation features at group level. The PVIF asset of HK$12,851m (31 December 2015: HK$11,431m) and the related deferred tax
liability, however, are recognised at the consolidated group level only, and are therefore also not included in the asset or equity positions for the
standalone entities shown above.
The Group operates subsidiaries in different territories where capital is governed by local rules and there may be restrictions on the transfer of
regulatory capital and funds between members of the Group.
Amount recognised in regulatory capital
A description of the main features and the full terms and conditions of the Group’s capital instruments can be found in the Regulatory Disclosures
section of our website www.hangseng.com.
37

Risk and Capital Management (continued)
Capital Management (continued)
Leverage ratio
At 30 June At 30 June At 31 December
2016 2015 2015
Leverage ratio 7.4% 7.7% 7.8%
Figures in HK$m
T1 capital 91,548 96,207 97,257
Exposure measure 1,236,337 1,255,187 1,248,642
Additional information
The Leverage Ratio ('LR') was introduced into the Basel III framework as a non-risk based backstop limit, to supplement risk-based capital
requirements. The ratio is a volume-based measure calculated as Basel III T1 capital divided by exposure measure representing total on and off
balance sheet exposures. In accordance with the Basel III framework, there will be a parallel run period for the LR from 2013 to 2017. The Group is
required under section 24A(6) of the Banking (Disclosure) Rules to disclose its LR calculated on a consolidated basis.
Detailed breakdown of the Group's leverage exposure measure and a summary comparison table reconciling the assets of the Group’s accounting
balance sheet with the leverage exposure measure using the standard templates as specified by the HKMA can be viewed in the Regulatory
Disclosures section of our website www.hangseng.com.
A full reconciliation between the Group’s accounting and regulatory balance sheets can be viewed in the Regulatory Disclosures section of our website
www.hangseng.com.
The decrease in the LR from 31 December 2015 to 30 June 2016 was mainly due to a decrease in T1 capital, attributed to the payment of special
interim dividend for 2015.
38

CONDENSED CONSOLIDATED FINANCIAL STATEMENTS
unaudited
(Expressed in millions of Hong Kong dollars)
Condensed Consolidated Income Statement Half-year Half-year Half-year
ended ended ended
30 June 30 June 31 December
2016 2015 2015
note
Interest income 4 13,303 13,645 13,418
Interest expense 5 (2,300) (3,204) (2,694)
Net interest income 11,003 10,441 10,724
Fee income 3,776 4,638 3,986
Fee expense (923) (754) (832)
Net fee income 6 2,853 3,884 3,154
Net trading income 7 455 1,377 653
Net income/(loss) from financial instruments
designated at fair value 8 (30) 721 (839)
Dividend income 9 174 125 17
Net insurance premium income 5,608 6,247 3,598
Other operating income 10 1,788 1,880 2,039
Total operating income 21,851 24,675 19,346
Net insurance claims and benefits paid and
movement in liabilities to policyholders (6,634) (8,125) (4,843)
Net operating income before
loan impairment charges
and other credit risk provisions 15,217 16,550 14,503
Loan impairment charges and other credit risk provisions 11 (721) (594) (514)
Net operating income 14,496 15,956 13,989
Employee compensation and benefits (2,441) (2,537) (2,356)
General and administrative expenses (1,937) (2,081) (2,441)
Depreciation of premises, plant and equipment (551) (462) (495)
Amortisation of intangible assets (51) (56) (54)
Operating expenses 12 (4,980) (5,136) (5,346)
Impairment loss on intangible assets - - (24)
Operating profit 9,516 10,820 8,619
Net gain on partial disposal of Industrial Bank - 10,636 -
Net surplus/(deficit) on property revaluation (77) 178 83
Share of profits from associates 60 86 66
Profit before tax 9,499 21,720 8,768
Tax expense 13 (1,494) (1,672) (1,322)
Profit for the period 8,005 20,048 7,446
Profit attributable to shareholders 8,005 20,048 7,446
(Figures in HK$)
Earnings per share - basic and diluted 14 4.19 10.49 3.73
Details of dividends payable to shareholders of the Bank attributable to the profit for the half year are set out in note 15.
The notes on pages 45 to 89 form part of these condensed consolidated financial statements.
39

CONDENSED CONSOLIDATED FINANCIAL STATEMENTS
unaudited (continued)
(Expressed in millions of Hong Kong dollars)
Condensed Consolidated Statement of Comprehensive Income Half-year Half-year Half-year
ended ended ended
30 June 30 June 31 December
2016 2015 2015
Profit for the period 8,005 20,048 7,446
Other comprehensive income
Items that will be reclassified subsequently
to the condensed consolidated income statement
when specific conditions are met:
Available-for-sale investment reserve:
- fair value changes taken to equity:
-- on debt securities 839 (9) (407)
-- on equity shares (356) 406 (223)
- fair value changes transferred to condensed
consolidated income statement:
-- on hedged items (564) 11 80
-- on disposal (75) (14,786) 27
- share of changes in equity of associates:
-- fair value changes - - (5)
- deferred taxes (27) (25) 44
- exchange difference and others (48) (40) (146)
Cash flow hedging reserve:
- fair value changes taken to equity (1,165) 157 34
- fair value changes transferred to condensed
consolidated income statement 1,145 (139) (49)
- deferred taxes 3 (3) 2
Exchange differences on translation of:
- financial statements of overseas branches,
subsidiaries and associates (257) (6) (534)
Items that will not be reclassified subsequently
to the condensed consolidated income statement:
Premises:
- unrealised surplus on revaluation of premises 277 1,103 775
- deferred taxes (47) (184) (130)
- exchange difference (4) - (7)
Defined benefit plans:
- actuarial (losses)/gains on defined benefit plans (688) 292 130
- deferred taxes 113 (48) (22)
Share-based payments 6 2 -
Other comprehensive income for the period, net of tax (848) (13,269) (431)
Total comprehensive income for the period 7,157 6,779 7,015
Total comprehensive income for the period
attributable to shareholders 7,157 6,779 7,015
40

CONDENSED CONSOLIDATED FINANCIAL STATEMENTS
unaudited (continued)
(Expressed in millions of Hong Kong dollars)
Condensed Consolidated Balance Sheet At 30 June At 30 June At 31 December
2016 2015 2015
note
ASSETS
Cash and sight balances at central banks 18 18,938 40,317 10,118
Placings with and advances to banks 19 97,307 152,767 123,990
Trading assets 20 52,091 44,772 40,373
Financial assets designated at fair value 21 9,897 8,218 7,903
Derivative financial instruments 22 9,084 6,004 11,595
Reverse repurchase agreements – non-trading - 1,904 -
Loans and advances to customers 23 678,442 673,022 688,946
Financial investments 24 375,403 328,198 372,272
Interest in associates 25 2,291 2,258 2,275
Investment properties 26 10,329 9,899 10,075
Premises, plant and equipment 27 26,074 25,664 26,186
Intangible assets 28 13,641 10,577 12,221
Other assets 29 27,870 27,838 28,475
Total assets 1,321,367 1,331,438 1,334,429
LIABILITIES AND EQUITY
Liabilities
Current, savings and other deposit accounts 30 951,545 947,495 959,228
Repurchase agreements – non-trading 1,761 3,032 2,315
Deposits from banks 14,159 13,964 18,780
Trading liabilities 31 58,156 77,543 62,917
Financial liabilities designated at fair value 32 4,004 4,027 3,994
Derivative financial instruments 22 11,590 5,877 9,988
Certificates of deposit and other debt securities
in issue 33 6,416 7,738 5,191
Other liabilities 34 23,817 22,887 20,891
Liabilities under insurance contracts 104,425 96,986 101,817
Current tax liabilities 1,546 1,906 185
Deferred tax liabilities 4,907 4,695 4,817
Subordinated liabilities 35 2,328 5,814 2,325
Total liabilities 1,184,654 1,191,964 1,192,448
Equity
Share capital 9,658 9,658 9,658
Retained profits 100,615 102,085 105,363
Other equity instruments 37 6,981 6,981 6,981
Other reserves 19,459 20,750 19,979
Shareholders' funds 36 136,713 139,474 141,981
Total equity and liabilities 1,321,367 1,331,438 1,334,429
The notes on pages 45 to 89 form part of these condensed consolidated financial statements.
41

CONDENSED CONSOLIDATED FINANCIAL STATEMENTS
unaudited (continued)
(Expressed in millions of Hong Kong dollars)
Condensed Consolidated Statement of Changes in Equity Retained Available- Total
Other profits and Premises for-sale Cash flow Foreign share-
Share equity proposed revaluation investment hedge exchange holders'
capital instruments dividend reserve reserve reserve reserve Others equity
At 1 January 2016 9,658 6,981 105,363 16,777 1,939 (9) 600 672 141,981
Profit for the period - - 8,005 - - - - - 8,005
Other comprehensive income (net of tax) - - (569) 226 (231) (17) (257) - (848)
Available-for-sale investments - - - - (231) - - - (231)
Cash flow hedges - - - - - (17) - - (17)
Property revaluation - - - 226 - - - - 226
Actuarial losses on defined benefit plans - - (575) - - - - - (575)
Share of other comprehensive income of associates - - - - - - - - -
Exchange differences and others - - 6 - - - (257) - (251)
Total comprehensive income for the period - - 7,436 226 (231) (17) (257) - 7,157
Dividends paid - - (12,427) - - - - - (12,427)
Coupon paid to holder of AT1 capital instrument - - - - - - - - -
Movement in respect of share-based payment arrangements - - - - - - - 2 2
Transfers - - 243 (243) - - - - -
At 30 June 2016 9,658 6,981 100,615 16,760 1,708 (26) 343 674 136,713
At 1 January 2015 9,658 6,981 88,064 15,687 17,012 (11) 1,140 662 139,193
Profit for the period - - 20,048 - - - - - 20,048
Other comprehensive income (net of tax) - - 246 919 (14,443) 15 (6) - (13,269)
Available-for-sale investments - - - - (14,443) - - - (14,443)
Cash flow hedges - - - - - 15 - - 15
Property revaluation - - - 919 - - - - 919
Actuarial gains on defined benefit plans - - 244 - - - - - 244
Share of other comprehensive income of associates - - - - - - - - -
Exchange differences and others - - 2 - - - (6) - (4)
Total comprehensive income for the period - - 20,294 919 (14,443) 15 (6) - 6,779
Dividends paid - - (6,500) - - - - - (6,500)
Coupon paid to holder of AT1 capital instrument - - - - - - - - -
Movement in respect of share-based payment arrangements - - - - - - - 2 2
Transfers - - 227 (227) - - - - -
At 30 June 2015 9,658 6,981 102,085 16,379 2,569 4 1,134 664 139,474
Other reserves
42
42
43899592
Text Box

CONDENSED CONSOLIDATED FINANCIAL STATEMENTS
unaudited (continued)
(Expressed in millions of Hong Kong dollars)
Condensed Consolidated Statement of Changes in Equity (continued) Retained Available- Total
Other profits and Premises for-sale Cash flow Foreign share-
Share equity proposed revaluation investment hedge exchange holders'
capital instruments dividend reserve reserve reserve reserve Others equity
At 1 July 2015 9,658 6,981 102,085 16,379 2,569 4 1,134 664 139,474
Profit for the period - - 7,446 - - - - - 7,446
Other comprehensive income (net of tax) - - 108 638 (630) (13) (534) - (431)
Available-for-sale investments - - - - (625) - - - (625)
Cash flow hedges - - - - - (13) - - (13)
Property revaluation - - - 638 - - - - 638
Actuarial gains on defined benefit plans - - 108 - - - - - 108
Share of other comprehensive income of associates - - - - (5) - - - (5)
Exchange differences and others - - - - - - (534) - (534)
Total comprehensive income for the period - - 7,554 638 (630) (13) (534) - 7,015
Dividends paid - - (4,206) - - - - - (4,206)
Coupon paid to holder of AT1 capital instrument - - (310) - - - - - (310)
Movement in respect of share-based payment arrangements - - - - - - - 8 8
Transfers - - 240 (240) - - - - -
At 31 December 2015 9,658 6,981 105,363 16,777 1,939 (9) 600 672 141,981
Other reserves
43
43
43899592
Text Box

CONDENSED CONSOLIDATED FINANCIAL STATEMENTS
unaudited (continued)
(Expressed in millions of Hong Kong dollars)
Condensed Consolidated Cash Flow Statement Half-year Half-year
ended ended
30 June 30 June
2016 2015
note
Net cash inflow from operating activities 38(a) 14,821 38,787
Cash flows from investing activities
Purchase of available-for-sale investments (50,857) (45,623)
Purchase of held-to-maturity debt securities (383) (1,283)
Proceeds from sale or redemption of available-for-sale investments 49,802 72,058
Proceeds from redemption of held-to-maturity debt securities 709 105
Net cash inflow from sale of loan portfolio - 3,981
Purchase of properties, plant and equipment and intangible assets (550) (454)
Proceeds from sale of properties, plant and equipment and assets held for sale 1 1
Interest received from available-for-sale investments 1,325 964
Dividends received from available-for-sale investments 175 125
Net cash inflow from investing activities 222 29,874
Cash flows from financing activities
Dividends paid (12,427) (6,500)
Interest paid for subordinated liabilities (102) (91)
Net cash outflow from financing activities (12,529) (6,591)
Increase in cash and cash equivalents 2,514 62,070
Cash and cash equivalents at 1 January 104,335 105,350
Effect of foreign exchange rate changes (2,703) (521)
Cash and cash equivalents at 30 June 38(b) 104,146 166,899
The notes on pages 45 to 89 form part of these condensed consolidated financial statements.
44

NOTES ON THE CONDENSED CONSOLIDATED FINANCIAL STATEMENTS (unaudited)
(Figures expressed in millions of Hong Kong dollars unless otherwise indicated)
1 Basis of preparation
2 Accounting policies
- Amendments to HKAS 1 “Disclosure Initiative”
- Amendments to HKAS 16 “ Property, Plant and Equipment” and HKAS 38 “Intangible Assets”
- Amendments to HKAS 27 “Separate Financial Statements”
- Amendments to Hong Kong Financial Reporting Standard (“HKFRS”) 10, HKFRS 12 and HKAS 28 “Investment Entities”
- Amendments to HKFRS 11 “Joint Arrangements”
3 Basis of consolidation
Except as described below, the accounting policies applied in preparing these condensed consolidated financial statements are the same as those
applied in preparing the consolidated financial statements for the year ended 31 December 2015, as disclosed in the 2015 Annual Report.
During the period, the Group has adopted the following amendments to standards which have insignificant or no effect on the condensed
consolidated financial statements:
These condensed consolidated financial statements cover the consolidated positions of Hang Seng Bank Limited (“the Bank”) and all its
subsidiaries (“the Group”), unless otherwise stated, and include the attributable share of the results and reserves of its associates. For regulatory
reporting, the basis of consolidation is different from the basis of consolidation for accounting purposes. They are disclosed under the “Risk and
Capital Management” section.
Information on future accounting developments and their potential effect on the condensed consolidated financial statements of the Group are
provided in note 1 on the consolidated financial statements of the Bank’s 2015 Annual Report.
In addition, in May 2016, the HKICPA issued HKFRS 16 “Leases”. The standard is effective for annual periods beginning on or after 1 January
2019 with early application permitted. The Group is currently assessing the impact of this standard but it is not practicable to quantify the effect
as at the date of the publication of these condensed consolidated financial statements.
These condensed consolidated financial statements have been prepared in accordance with the applicable disclosure provisions of the Rules
Governing the Listing of Securities on The Stock Exchange of Hong Kong Limited and in compliance with Hong Kong Accounting Standard
(“HKAS”) 34, Interim Financial Reporting, issued by the Hong Kong Institute of Certified Public Accountants (“HKICPA”). It also contains
the disclosure information required under the Banking (Disclosure) Rules made under section 60A of the Banking Ordinance. The condensed
consolidated financial statements were authorised for issue on 3 August 2016.
The preparation of the condensed consolidated financial statements in conformity with HKAS 34 requires management to make judgements,
estimates and assumptions that affect the application of policies and reported amounts of assets and liabilities, income and expenses on a year to
date basis. Actual results may differ from these estimates. In preparing the condensed consolidated financial statements, the significant
judgement made by management in applying the Group’s accounting policies and the key sources of estimation uncertainty were the same as
those that applied to the consolidated financial statements for the year ended 31 December 2015.
The condensed consolidated financial statements are unaudited, but have been reviewed by PricewaterhouseCoopers (“PwC”) in accordance
with Hong Kong Standards on Review Engagements 2410, Review of Interim Financial Information Performed by the Independent Auditor of
the Entity, issued by HKICPA. PwC’s independent review report to the Board of Directors is included on page 90.
The condensed consolidated financial statements should be read in conjunction with the consolidated financial statements for the year ended 31
December 2015, which have been prepared in accordance with Hong Kong Financial Reporting Standards (“HKFRSs”).
45

NOTES ON THE CONDENSED CONSOLIDATED FINANCIAL STATEMENTS (unaudited) (continued)
4 Interest income
Half-year Half-year Half-year
ended ended ended
30 June 30 June 31 December
2016 2015 2015
Interest income arising from:
- financial assets that are not at fair value through profit and loss 13,161 13,482 13,261
- trading assets 140 158 155
- financial assets designated at fair value 2 5 2
13,303 13,645 13,418
of which:
- interest income from impaired financial assets 30 21 20
5 Interest expense
Half-year Half-year Half-year
ended ended ended
30 June 30 June 31 December
2016 2015 2015
Interest expense arising from:
- financial liabilities that are not at fair value through profit and loss 1,673 2,212 1,889
- trading liabilities 607 977 786
- financial liabilities designated at fair value 20 15 19
2,300 3,204 2,694
of which:
- interest expense from debt securities in issue maturing after five years - - -
- interest expense from customer accounts maturing after five years - - -
- interest expense from subordinated liabilities 55 91 65
46

NOTES ON THE CONDENSED CONSOLIDATED FINANCIAL STATEMENTS (unaudited) (continued)
6 Net fee income
Half-year Half-year Half-year
ended ended ended
30 June 30 June 31 December
2016 2015 2015
- securities broking and related services 545 1,167 705
- retail investment funds 741 1,051 712
- insurance 262 249 223
- account services 229 216 223
- remittances 234 208 236
- cards 1,180 1,146 1,240
- credit facilities 204 204 216
- trade services 209 231 260
- other 172 166 171
Fee income 3,776 4,638 3,986
Fee expense (923) (754) (832)
2,853 3,884 3,154
of which:
Net fee income, other than amounts included in determining the
effective interest rate, arising from financial assets or financial
liabilities that are not held for trading nor designated at fair value 1,084 1,207 1,294
- fee income 1,846 1,816 1,963
- fee expense (762) (609) (669)
Net fee income on trust and other fiduciary activities where the
Group holds or invests on behalf of its customers 391 533 455
- fee income 473 610 539
- fee expense (82) (77) (84)
7 Net trading income
Half-year Half-year Half-year
ended ended ended
30 June 30 June 31 December
2016 2015 2015
Dealing profits 428 1,380 653
- foreign exchange 541 1,239 861
- interest rate derivatives (64) (47) 15
- debt securities 49 75 -
- equities and other trading (98) 113 (223)
Net gain/(loss) from hedging activities 27 (3) -
- fair value hedges
-- net gain/(loss) on hedged items attributable to the hedged risk 564 (11) (80)
-- net (loss)/gain on hedging instruments (556) 8 80
- cash flow hedges
-- net hedging gain 19 - -
455 1,377 653
47

NOTES ON THE CONDENSED CONSOLIDATED FINANCIAL STATEMENTS (unaudited) (continued)
8 Net income/(loss) from financial instruments designated at fair value
Half-year Half-year Half-year
ended ended ended
30 June 30 June 31 December
2016 2015 2015
Net (loss)/income on assets designated at fair value
which back insurance and investment contracts (26) 716 (855)
Net change in fair value of other financial instruments
designated at fair value (4) 5 16
(30) 721 (839)
of which dividend income from:
- listed investments 73 92 38
- unlisted investments - - 1
73 92 39
9 Dividend income
Half-year Half-year Half-year
ended ended ended
30 June 30 June 31 December
2016 2015 2015
Dividend income:
- listed investments 120 119 4
- unlisted investments 54 6 13
174 125 17
10 Other operating income
Half-year Half-year Half-year
ended ended ended
30 June 30 June 31 December
2016 2015 2015
Rental income from investment properties 181 191 191
Movement in present value of in-force long-term insurance business 1,420 1,511 1,657
Gains less losses from financial investments and fixed assets 65 35 (29)
Others 122 143 220
1,788 1,880 2,039
48

NOTES ON THE CONDENSED CONSOLIDATED FINANCIAL STATEMENTS (unaudited) (continued)
11 Loan impairment charges and other credit risk provisions
Half-year Half-year Half-year
ended ended ended
30 June 30 June 31 December
2016 2015 2015
Net charge for impairment of loans and
advances to customers (note 23(b)):
Individually assessed impairment allowances:
- new allowances 379 334 260
- releases (35) (34) (16)
- recoveries (5) (6) (10)
339 294 234
Net charge for collectively assessed
impairment allowances 382 300 280
Loan impairment charges and other credit risk provisions 721 594 514
12 Operating expenses
Half-year Half-year Half-year
ended ended ended
30 June 30 June 31 December
2016 2015 2015
Employee compensation and benefits:
- salaries and other costs 2,232 2,316 2,132
- retirement benefit costs
- defined benefit scheme 110 130 129
- defined contribution scheme 99 91 95
2,441 2,537 2,356
General and administrative expenses:
- rental expenses 342 346 350
- other premises and equipment 585 570 631
- marketing and advertising expenses 215 389 513
- other operating expenses 795 776 947
1,937 2,081 2,441
Depreciation of premises, plant and equipment (note 27) 551 462 495
Amortisation of intangible assets 51 56 54
4,980 5,136 5,346
There were no impairment charges for the first half of 2016 (nil for the first and second halves of 2015) provided for available-for-sale debt
securities, held-to-maturity debt securities and placings with and advances to banks by the Group.
49

NOTES ON THE CONDENSED CONSOLIDATED FINANCIAL STATEMENTS (unaudited) (continued)
13 Tax expense
Taxation in the consolidated income statement represents:
Half-year Half-year Half-year
ended ended ended
30 June 30 June 31 December
2016 2015 2015
Current tax - provision for Hong Kong profits tax
Tax for the period 1,354 1,558 1,334
Adjustment in respect of prior periods - (31) (25)
1,354 1,527 1,309
Current tax - taxation outside Hong Kong
Tax for the period 38 38 12
Adjustment in respect of prior periods (1) - -
37 38 12
Deferred tax
Origination and reversal of temporary differences 103 107 1
Total tax expense 1,494 1,672 1,322
14 Earnings per share - basic and diluted
The current tax provision is based on the estimated assessable profit for the first half of 2016, and is determined for the Bank and its
subsidiaries operating in the Hong Kong SAR by using the Hong Kong profits tax rate of 16.5 per cent (2015: 16.5 per cent). For subsidiaries
and branches operating in other jurisdictions, the appropriate tax rates prevailing in the relevant countries are used. Deferred tax is calculated at
the tax rates that are expected to apply in the period when the liability is settled or the asset is realised.
The calculation of basic and diluted earnings per share for the first half of 2016 is based on earnings of HK$8,005m (HK$20,048m for the first
half of 2015 and HK$7,136m for the second half of 2015 after deducting the coupon paid on AT1 capital instrument of HK$310m) and on the
weighted average number of ordinary shares in issue of 1,911,842,736 shares (unchanged from the first and second halves of 2015).
50

NOTES ON THE CONDENSED CONSOLIDATED FINANCIAL STATEMENTS (unaudited) (continued)
15 Dividends per share
(a) Dividend to ordinary shareholders
Half-year ended Half-year ended Half-year ended
30 June 2016 30 June 2015 31 December 2015
HK$ HK$ HK$
per share HK$m per share HK$m per share HK$m
First interim 1.10 2,103 1.10 2,103 - -
Second interim 1.10 2,103 1.10 2,103 - -
Third interim - - - - 1.10 2,103
Fourth interim - - - - 2.40 4,588
Special interim dividend - - - - 3.00 5,736
2.20 4,206 2.20 4,206 6.50 12,427
(b) Distribution to holder of AT1 capital instrument classified as equity
Half-year ended Half-year ended Half-year ended
30 June 2016 30 June 2015 31 December 2015
HK$m HK$m HK$m
Coupon paid on AT1 capital instrument - - 310
16 Segmental analysis
-
-
-
-
For the purpose of segmental analysis, the allocation of revenue reflects the benefits of capital and other funding resources allocated to the
business segments by way of internal capital allocation and fund transfer-pricing mechanisms. Cost allocation is based on the direct costs
incurred by the respective business segments and apportionment of management overheads. Bank-owned premises are reported under the
‘Other’ segment. When these premises are utilised by Global Businesses, notional rent will be charged to the relevant business segments based
on market rates.
Hong Kong Financial Reporting Standard 8 (‘HKFRS 8’) requires segmental disclosure to be based on the way that the Group’s chief operating
decision maker regards and manages the Group, with the amounts reported for each reportable segment being the measures reported to the
Group’s chief operating decision maker for the purpose of assessing segmental performance and making decisions about operating matters. To
align with the internal reporting information, the Group has presented the following four reportable segments.
(a) Segmental result
Retail Banking and Wealth Management activities offer a broad range of products and services to meet the personal banking, consumer
lending and wealth management needs of individual customers. Personal banking products typically include current and savings accounts,
mortgages and personal loans, credit cards, insurance and wealth management;
Commercial Banking activities offer a comprehensive suite of products and services to corporate, commercial and SME customers –
including corporate lending, trade and receivable finance, payments and cash management, treasury and foreign exchange, general
insurance, key-person insurance, investment services and corporate wealth management;
Global Banking and Markets provides tailored financial solutions to major corporate and institutional clients. Undertaking a long-term
relationships management approach, its services include general banking, corporate lending, interest rates, foreign exchange, money
markets, structured products and derivatives, etc. Global Banking and Markets also manages the funding and liquidity positions of the Bank
and other market risk positions arising from banking activities;
Other mainly represents management of shareholders’ funds and investments in premises, investment properties, equity shares and
subordinated debt funding.
51

NOTES ON THE CONDENSED CONSOLIDATED FINANCIAL STATEMENTS (unaudited) (continued)
16 Segmental analysis (continued)
(a) Segmental result (continued)
Retail
Banking Global
and Wealth Commercial Banking
Management Banking and Markets Other Total
Half-year ended 30 June 2016
Net interest income/(expense) 6,016 3,011 2,020 (44) 11,003
Net fee income 1,788 828 143 94 2,853
Net trading (loss)/income (282) 14 702 21 455
Net loss from
financial instruments
designated at fair value (22) (3) (4) (1) (30)
Dividend income 1 - - 173 174
Net insurance premium income 5,222 386 - - 5,608
Other operating income 1,460 142 37 149 1,788
Total operating income 14,183 4,378 2,898 392 21,851
Net insurance claims and
benefits paid and movement in
liabilities to policyholders (6,331) (303) - - (6,634)
Net operating income before
loan impairment charges
and other credit risk provisions 7,852 4,075 2,898 392 15,217
Loan impairment (charges)/releases
and other credit risk provisions (366) (372) 17 - (721)
Net operating income 7,486 3,703 2,915 392 14,496
Operating expenses * (3,086) (1,211) (441) (242) (4,980)
Operating profit 4,400 2,492 2,474 150 9,516
Net deficit on property revaluation - - - (77) (77)
Share of profits from associates 60 - - - 60
Profit before tax 4,460 2,492 2,474 73 9,499
Share of profit before tax 47.0% 26.2% 26.0% 0.8% 100.0%
Operating profit excluding loan
impairment charges and
other credit risk provisions 4,766 2,864 2,457 150 10,237
* Depreciation/amortisation included
in operating expenses (14) (3) (1) (584) (602)
At 30 June 2016
Total assets 398,830 288,496 555,052 78,989 1,321,367
Total liabilities 775,100 233,755 151,925 23,874 1,184,654
Interest in associates 2,276 15 - - 2,291
52

NOTES ON THE CONDENSED CONSOLIDATED FINANCIAL STATEMENTS (unaudited) (continued)
16 Segmental analysis (continued)
(a) Segmental result (continued)
Retail
Banking Global
and Wealth Commercial Banking
Management Banking and Markets Other Total
Half-year ended 30 June 2015
Net interest income 5,503 2,991 1,705 242 10,441
Net fee income 2,803 844 147 90 3,884
Net trading income/(loss) 286 249 863 (21) 1,377
Net income from
financial instruments
designated at fair value 715 - - 6 721
Dividend income 1 - - 124 125
Net insurance premium income 5,874 373 - - 6,247
Other operating income 1,622 86 24 148 1,880
Total operating income 16,804 4,543 2,739 589 24,675
Net insurance claims and
benefits paid and movement in
liabilities to policyholders (7,819) (306) - - (8,125)
Net operating income before
loan impairment charges
and other credit risk provisions 8,985 4,237 2,739 589 16,550
Loan impairment charges
and other credit risk provisions (299) (278) (17) - (594)
Net operating income 8,686 3,959 2,722 589 15,956
Operating expenses * (3,317) (1,245) (470) (104) (5,136)
Operating profit 5,369 2,714 2,252 485 10,820
Net gain on partial disposal of
Industrial Bank - - - 10,636 10,636
Net surplus on property revaluation - - - 178 178
Share of profits from associates 85 1 - - 86
Profit before tax 5,454 2,715 2,252 11,299 21,720
Share of profit before tax 25.1% 12.5% 10.4% 52.0% 100.0%
Share of profit before tax (excluding
the gain on partial disposal
of Industrial Bank) 49.2% 24.5% 20.3% 6.0% 100.0%
Operating profit excluding loan
impairment charges and
other credit risk provisions 5,668 2,992 2,269 485 11,414
* Depreciation/amortisation included
in operating expenses (27) (14) (3) (474) (518)
At 30 June 2015
Total assets 377,134 291,505 541,001 121,798 1,331,438
Total liabilities 751,324 236,701 178,054 25,885 1,191,964
Interest in associates 2,245 13 - - 2,258
53

NOTES ON THE CONDENSED CONSOLIDATED FINANCIAL STATEMENTS (unaudited) (continued)
16 Segmental analysis (continued)
(a) Segmental result (continued)
Retail
Banking Global
and Wealth Commercial Banking
Management Banking and Markets Other Total
Half-year ended 31 December 2015
Net interest income 5,778 2,938 1,793 215 10,724
Net fee income 2,061 828 173 92 3,154
Net trading (loss)/income (214) 161 713 (7) 653
Net (loss)/income from
financial instruments
designated at fair value (847) (8) - 16 (839)
Dividend income - - - 17 17
Net insurance premium income 3,492 106 - - 3,598
Other operating income/(loss) 1,848 41 (2) 152 2,039
Total operating income 12,118 4,066 2,677 485 19,346
Net insurance claims and
benefits paid and movement in
liabilities to policyholders (4,756) (87) - - (4,843)
Net operating income before
loan impairment charges
and other credit risk provisions 7,362 3,979 2,677 485 14,503
Loan impairment (charges)/releases
and other credit risk provisions (321) (246) 53 - (514)
Net operating income 7,041 3,733 2,730 485 13,989
Operating expenses * (3,306) (1,236) (476) (328) (5,346)
Impairment loss on intangible assets (5) - - (19) (24)
Operating profit 3,730 2,497 2,254 138 8,619
Net surplus on property revaluation - - - 83 83
Share of profits from associates 66 - - - 66
Profit before tax 3,796 2,497 2,254 221 8,768
Share of profit before tax 43.3% 28.5% 25.7% 2.5% 100.0%
Operating profit excluding loan
impairment charges and
other credit risk provisions 4,051 2,743 2,201 138 9,133
* Depreciation/amortisation included
in operating expenses (30) (13) (3) (503) (549)
At 31 December 2015
Total assets 392,667 302,086 571,178 68,498 1,334,429
Total liabilities 753,208 253,626 167,178 18,436 1,192,448
Interest in associates 2,261 14 - - 2,275
54

NOTES ON THE CONDENSED CONSOLIDATED FINANCIAL STATEMENTS (unaudited) (continued)
16 Segmental analysis (continued)
(b) Geographic information
Mainland Inter-segment
Hong Kong China Others elimination Total
Half-year ended 30 June 2016
Income and expense
Total operating income 20,736 1,029 130 (44) 21,851
Profit before tax 9,359 55 85 - 9,499
At 30 June 2016
Total assets 1,240,205 101,653 19,294 (39,785) 1,321,367
Total liabilities 1,106,309 90,040 18,619 (30,314) 1,184,654
Equity 133,896 11,613 675 (9,471) 136,713
Share capital 9,658 9,873 - (9,873) 9,658
Interest in associates 2,290 1 - - 2,291
Non-current assets* 49,019 1,005 20 - 50,044
Contingent liabilities and commitments 343,595 42,276 5,963 - 391,834
Half-year ended 30 June 2015
Income and expense
Total operating income 23,662 946 115 (48) 24,675
Profit before tax 21,627 14 79 - 21,720
At 30 June 2015
Total assets 1,235,776 116,241 17,635 (38,214) 1,331,438
Total liabilities 1,099,668 105,912 17,097 (30,713) 1,191,964
Equity 136,108 10,329 538 (7,501) 139,474
Share capital 9,658 8,697 12 (8,709) 9,658
Interest in associates 2,237 21 - - 2,258
Non-current assets* 45,025 1,111 4 - 46,140
Contingent liabilities and commitments 317,051 41,795 4,832 - 363,678
Half-year ended 31 December 2015
Income and expense
Total operating income 18,144 1,112 134 (44) 19,346
Profit before tax 8,597 87 84 - 8,768
At 31 December 2015
Total assets 1,244,606 113,718 19,260 (43,155) 1,334,429
Total liabilities 1,105,668 101,806 18,655 (33,681) 1,192,448
Equity 138,938 11,912 605 (9,474) 141,981
Share capital 9,658 10,093 - (10,093) 9,658
Interest in associates 2,272 3 - - 2,275
Non-current assets* 47,414 1,046 22 - 48,482
Contingent liabilities and commitments 334,682 38,545 5,645 - 378,872
* Non-current assets consist of properties, plant and equipment, goodwill and other intangible assets.
The geographical regions in this analysis are classified by the location of the principal operations of the subsidiary companies or, in the case of the Bank itself,
by the location of the branches responsible for reporting the results or advancing the funds. Consolidation adjustments made in preparing the Group’s financial
statements upon consolidation are included in the "Inter-segment elimination".
55

NOTES ON THE CONDENSED CONSOLIDATED FINANCIAL STATEMENTS (unaudited) (continued)
17 Analysis of assets and liabilities by remaining maturity
One Over
month one month Over three Over one
Repayable or less but within months but year but Over No
on but not three within within five five contractual
demand on demand months one year years years Trading maturity Total
Assets
Cash and sight balances at central banks 18,938 - - - - - - - 18,938
Placings with and advances to banks 15,578 47,005 29,560 2,920 1,251 993 - - 97,307
Trading assets - - - - - - 52,091 - 52,091
Financial assets designated at fair value - - - - 10 409 - 9,478 9,897
Derivative financial instruments - - - 138 131 - 8,815 - 9,084
Reverse repurchase agreements - non trading - - - - - - - - -
Loans and advances to customers 13,833 53,254 54,194 125,276 234,945 196,940 - - 678,442
Financial investments:
- available-for-sale investments - 39,015 95,873 74,769 71,517 5,388 - 4,810 291,372
- held-to-maturity debt securities - - 1,292 4,809 31,461 46,469 - - 84,031
Interest in associates - - - - - - - 2,291 2,291
Investment properties - - - - - - - 10,329 10,329
Premises, plant and equipment - - - - - - - 26,074 26,074
Intangible assets - - - - - - - 13,641 13,641
Other assets 9,684 5,494 3,325 1,573 6,867 199 - 728 27,870
At 30 June 2016 58,033 144,768 184,244 209,485 346,182 250,398 60,906 67,351 1,321,367
At 30 June 2015 100,136 181,500 186,021 205,035 306,507 239,412 50,454 62,373 1,331,438
At 31 December 2015 48,087 149,792 196,460 245,687 331,671 248,349 51,476 62,907 1,334,429
Liabilities
Current, savings and
other deposit accounts 732,722 95,332 81,253 41,185 1,053 - - - 951,545
Repurchase agreements - non trading - 1,761 - - - - - - 1,761
Deposits from banks 5,931 8,228 - - - - - - 14,159
Trading liabilities - - - - - - 58,156 - 58,156
Financial liabilities designated at fair value 4 - - - 3,508 492 - - 4,004
Derivative financial instruments - 205 115 632 1,243 69 9,326 - 11,590
Certificates of deposit and other debt
securities in issue:
- certificates of deposit in issue - 1,250 - 4,000 - - - - 5,250
- other debt securities in issue - - - - 1,166 - - - 1,166
Other liabilities 9,083 7,153 3,542 1,239 136 2 - 2,662 23,817
Liabilities under insurance contracts - - - - - - - 104,425 104,425
Current tax liabilities - - 9 1,527 10 - - - 1,546
Deferred tax liabilities - - - - - - - 4,907 4,907
Subordinated liabilities - - - - - 2,328 - - 2,328
At 30 June 2016 747,740 113,929 84,919 48,583 7,116 2,891 67,482 111,994 1,184,654
At 30 June 2015 686,587 148,911 105,289 46,878 11,007 6,390 82,894 104,008 1,191,964
At 31 December 2015 718,091 151,013 90,582 38,653 10,347 2,862 72,313 108,587 1,192,448
The maturity analysis is based on the remaining contractual maturity at the balance sheet date, with the exception of the trading portfolio that may be sold before maturity and is
accordingly recorded as "Trading".
56

NOTES ON THE CONDENSED CONSOLIDATED FINANCIAL STATEMENTS (unaudited) (continued)
17 Analysis of assets and liabilities by remaining maturity (continued)
One Over
month one month Over three Over one
Repayable or less but within months but year but Over No
on but not three within within five five contractual
demand on demand months one year years years Trading maturity Total
of which:
Certificates of deposit included in:
- trading assets - - - - - - - - -
- financial assets
designated at fair value - - - - - - - - -
- available-for-sale investments - 1,473 674 3,606 303 - - - 6,056
- held-to-maturity debt securities - - 182 320 2,301 1,280 - - 4,083
At 30 June 2016 - 1,473 856 3,926 2,604 1,280 - - 10,139
At 30 June 2015 - 611 1,618 5,055 2,566 2,202 - - 12,052
At 31 December 2015 - 282 2,325 4,877 2,990 1,579 - - 12,053
Debt securities included in:
- trading assets - - - - - - 51,502 - 51,502
- financial assets
designated at fair value - - - - 10 409 - - 419
- available-for-sale investments - 37,542 95,199 71,163 71,214 5,388 - 603 281,109
- held-to-maturity debt securities - - 1,110 4,489 29,160 45,189 - - 79,948
At 30 June 2016 - 37,542 96,309 75,652 100,384 50,986 51,502 603 412,978
At 30 June 2015 - 47,383 66,063 77,404 77,018 43,115 41,534 216 352,733
At 31 December 2015 - 36,509 83,881 103,310 84,244 48,746 38,080 23 394,793
Certificates of deposit in issue included in:
- trading liabilities - - - - - - - - -
- financial liabilities
designated at fair value - - - - 3,508 - - - 3,508
- issued at amortised cost - 1,250 - 4,000 - - - - 5,250
At 30 June 2016 - 1,250 - 4,000 3,508 - - - 8,758
At 30 June 2015 - - - 2,492 7,510 - - - 10,002
At 31 December 2015 - - - - 7,491 - - - 7,491
57

NOTES ON THE CONDENSED CONSOLIDATED FINANCIAL STATEMENTS (unaudited) (continued)
18 Cash and sight balances at central banks
At 30 June At 30 June At 31 December
2016 2015 2015
Cash in hand 4,640 4,642 5,259
Sight balances at central banks 14,298 35,675 4,859
18,938 40,317 10,118
19 Placings with and advances to banks
At 30 June At 30 June At 31 December
2016 2015 2015
Balances with banks 13,689 30,079 13,446
Placings with and advances to banks
maturing within one month 48,894 71,315 56,163
Placings with and advances to banks
maturing after one month
but less than one year 32,480 49,218 52,182
Placings with and advances to banks
maturing after one year 2,244 2,155 2,199
97,307 152,767 123,990
of which:
Placings with and advances to central banks 10,900 11,368 10,305
20 Trading assets
At 30 June At 30 June At 31 December
2016 2015 2015
Treasury bills 36,651 24,405 21,405
Other debt securities 14,851 17,129 16,675
Debt securities 51,502 41,534 38,080
Investment funds 28 23 21
Total trading securities 51,530 41,557 38,101
Other* 561 3,215 2,272
Total trading assets 52,091 44,772 40,373
Debt securities:
Issued by public bodies:
- central governments and central banks 50,868 37,699 35,386
50,868 37,699 35,386
Issued by other bodies:
- banks 330 718 768
- corporate entities 304 3,117 1,926
634 3,835 2,694
51,502 41,534 38,080
Investment funds:
Issued by corporate entities 28 23 21
Total trading securities 51,530 41,557 38,101
* This represents the amount receivable from counterparties on trading transactions not yet settled.
There were no overdue advances, impaired advances and rescheduled advances to banks for the periods indicated.
58

NOTES ON THE CONDENSED CONSOLIDATED FINANCIAL STATEMENTS (unaudited) (continued)
21 Financial assets designated at fair value
At 30 June At 30 June At 31 December
2016 2015 2015
Treasury bills - - 1,070
Other debt securities 419 70 66
Debt securities 419 70 1,136
Equity shares 4,453 4,258 1,838
Investment funds 5,025 3,890 4,929
9,897 8,218 7,903
Debt securities:
Issued by public bodies:
- central governments and central banks - - 1,070
- other public sector entities 1 1 1
1 1 1,071
Issued by other bodies:
- banks - 12 6
- corporate entities 418 57 59
418 69 65
419 70 1,136
Equity shares:
Issued by banks 721 751 423
Issued by public sector entities 140 10 6
Issued by corporate entities 3,592 3,497 1,409
4,453 4,258 1,838
Investment funds:
Issued by corporate entities 5,025 3,890 4,929
5,025 3,890 4,929
9,897 8,218 7,903
59

NOTES ON THE CONDENSED CONSOLIDATED FINANCIAL STATEMENTS (unaudited) (continued)
22 Derivative financial instruments
At 30 June 2016 At 30 June 2015 At 31 December 2015
Contract Derivative Derivative Contract Derivative Derivative Contract Derivative Derivative
amounts assets liabilities amounts assets liabilities amounts assets liabilities
Derivatives held for trading
Exchange rate contracts:
- spot and forward foreign exchange 763,117 4,408 5,175 618,719 2,986 2,802 623,963 5,572 4,066
- currency swaps 89,223 1,262 1,366 47,353 237 255 62,549 1,516 1,399
- currency options purchased 43,979 1,349 - 117,659 1,025 - 68,008 2,787 -
- currency options written 44,071 - 1,362 114,836 - 1,009 64,812 - 2,808
940,390 7,019 7,903 898,567 4,248 4,066 819,332 9,875 8,273
Interest rate contracts:
- interest rate swaps 239,074 1,216 1,283 183,267 1,047 1,022 207,984 873 867
- interest rate options written 6,514 - - 4,287 - - 4,482 - -
- other interest rate contracts 1,819 2 3 1,141 1 1 948 2 -
247,407 1,218 1,286 188,695 1,048 1,023 213,414 875 867
Equity and other contracts:
- equity swaps 3,858 6 62 4,439 2 141 2,687 2 92
- equity options purchased 11,628 336 - 9,839 353 - 11,599 351 -
- equity options written 7,317 - 75 4,761 - 121 9,204 - 162
- spot and forward contracts and others 2,181 236 - 690 7 - 411 - 2
24,984 578 137 19,729 362 262 23,901 353 256
Total derivatives held for trading 1,212,781 8,815 9,326 1,106,991 5,658 5,351 1,056,647 11,103 9,396
Derivatives managed in conjunction
with financial assets
designated at fair value
Interest rate contracts:
- interest rate swaps 3,500 30 - 3,500 24 - 3,500 20 -
Cash flow hedge derivatives
Exchange rate contracts:
- currency swaps 20,804 222 1,294 7,034 255 32 15,359 388 163
Interest rate contracts:
- interest rate swaps 4,890 15 3 32,286 59 13 28,259 44 10
25,694 237 1,297 39,320 314 45 43,618 432 173
Fair value hedge derivatives
Interest rate contracts:
- interest rate swaps 42,064 2 967 22,982 8 481 29,381 40 419
Total derivatives 1,284,039 9,084 11,590 1,172,793 6,004 5,877 1,133,146 11,595 9,988
Derivative financial instruments are held for trading, as financial instruments designated at fair value, or designated as either fair value hedges or cash flow hedges. The Group
primarily traded over-the-counter derivatives and also participated in exchange traded derivatives. The following table shows the nominal contract amounts and marked-to-market
value of assets and liabilities by class of derivatives.
The above derivative assets and liabilities, being the positive or negative marked-to-market value of the respective derivative contracts, represent gross replacement costs.
60

NOTES ON THE CONDENSED CONSOLIDATED FINANCIAL STATEMENTS (unaudited) (continued)
23 Loans and advances to customers
(a) Loans and advances to customers
At 30 June At 30 June At 31 December
2016 2015 2015
Gross loans and advances to customers 680,184 675,086 690,561
Less: loan impairment allowances
- individually assessed (896) (1,223) (807)
- collectively assessed (846) (841) (808)
678,442 673,022 688,946
Total loan impairment allowances as a percentage of gross loans and advances to customers are as follows:
At 30 June At 30 June At 31 December
2016 2015 2015
% % %
Loan impairment allowances:
- individually assessed 0.13 0.18 0.12
- collectively assessed 0.12 0.12 0.12
Total loan impairment allowances 0.25 0.30 0.24
(b) Loan impairment allowances against loans and advances to customers
Individually Collectivelyassessed assessed Total
At 1 January 2016 807 808 1,615
Amounts written off (222) (371) (593)
Recoveries of loans and advances written off
in previous years 5 36 41
New impairment allowances charged
to condensed consolidated income statement (note 11) 379 418 797
Impairment allowances released to
condensed consolidated income statement (note 11) (40) (36) (76)
Unwinding of discount of loan impairment allowances
recognised as "interest income" (27) (3) (30)
Exchange difference (6) (6) (12)
At 30 June 2016 896 846 1,742
At 1 January 2015 999 839 1,838
Amounts written off (56) (331) (387)
Recoveries of loans and advances written off
in previous years 6 36 42
New impairment allowances charged
to condensed consolidated income statement (note 11) 334 342 676
Impairment allowances released to
condensed consolidated income statement (note 11) (40) (42) (82)
Unwinding of discount of loan impairment allowances
recognised as "interest income" (18) (3) (21)
Exchange difference (2) - (2)
At 30 June 2015 1,223 841 2,064
At 1 July 2015 1,223 841 2,064
Amounts written off (620) (343) (963)
Recoveries of loans and advances written off
in previous years 10 40 50
New impairment allowances charged
to condensed consolidated income statement (note 11) 260 370 630
Impairment allowances released to
condensed consolidated income statement (note 11) (26) (90) (116)
Unwinding of discount of loan impairment allowances
recognised as "interest income" (18) (2) (20)
Exchange difference (22) (8) (30)
At 31 December 2015 807 808 1,615
61

NOTES ON THE CONDENSED CONSOLIDATED FINANCIAL STATEMENTS (unaudited) (continued)
23 Loans and advances to customers (continued)
(c) Impaired loans and advances to customers and allowances
At 30 June At 30 June At 31 December
2016 2015 2015
Gross impaired loans and advances 3,714 2,871 2,737
Individually assessed allowances (896) (1,223) (807)
Net impaired loans and advances 2,818 1,648 1,930
Individually assessed allowances as a percentage of gross impaired loans and advances 24.1% 42.6% 29.5%
Gross impaired loans and advances as a percentage of gross loans and advances to customers 0.55% 0.43% 0.40%
At 30 June At 30 June At 31 December
2016 2015 2015
Gross individually assessed impaired loans and advances 3,483 2,696 2,505
Individually assessed allowances (896) (1,223) (807)
2,587 1,473 1,698
Gross individually assessed impaired loans and advances as a percentage of gross loans and advances to customers 0.51% 0.40% 0.36%
Amount of collateral which has been taken into account
in respect of individually assessed impaired loans and advances to customers 2,086 1,095 1,651
Impaired loans and advances to customers are those loans and advances where objective evidence exists that full repayment of
principal or interest is considered unlikely.
Collateral includes any tangible security that carries a fair market value and is readily marketable. This includes (but is not limited
to) cash and deposits, stocks and bonds, mortgages over properties and charges over other fixed assets such as plant and equipment.
Where collateral values are greater than gross loans and advances to customers, only the amount of collateral up to the gross loans
and advances is included.
62

NOTES ON THE CONDENSED CONSOLIDATED FINANCIAL STATEMENTS (unaudited) (continued)
23 Loans and advances to customers (continued)
(d) Overdue loans and advances to customers
At 30 June At 30 June At 31 December
2016 2015 2015
% % %
Gross loans and advances which
have been overdue with respect to
either principal or interest for periods of:
- more than three months
but not more than six months 680 0.1 557 0.1 696 0.1
- more than six months
but not more than one year 740 0.1 937 0.1 543 0.1
- more than one year 1,185 0.2 590 0.1 912 0.1
2,605 0.4 2,084 0.3 2,151 0.3
of which:
- individually impaired allowances (627) (1,136) (759)
- covered portion of overdue loans
and advances 1,778 549 1,141
- uncovered portion of overdue loans
and advances 827 1,535 1,010
- current market value of collateral held against
the covered portion of overdue loans
and advances 3,767 1,722 2,527
(e) Rescheduled loans and advances to customers
Rescheduled loans and advances to customers and their expression as a percentage of gross loans and advances to customers are as follows:
At 30 June At 30 June At 31 December
2016 2015 2015
% % %
Rescheduled loans and advances to customers 120 - 296 - 140 -
Loans and advances to customers that are more than three months overdue and their expression as a percentage of gross loans and advances to
customers are as follows:
Collateral held with respect to overdue loans and advances is mainly residential properties, industrial properties, commercial properties and customer
deposits. The current market value of residential properties, industrial properties, commercial properties and customer deposits were HK$2,096m,
HK$262m, HK$129m and HK$1,123m respectively.
Loans and advances with a specific repayment date are classified as overdue when the principal or interest is overdue and remains unpaid at the
period-end. Loans and advances repayable by regular instalments are treated as overdue when an instalment payment is overdue and remains unpaid
at the period-end. Loans and advances repayable on demand are classified as overdue either when a demand for repayment has been served on the
borrower but repayment has not been made in accordance with the demand notice, or when the loans and advances have remained continuously
outside the approved limit advised to the borrower for more than the overdue period in question.
Rescheduled loans and advances to customers are those loans and advances that have been rescheduled or renegotiated for reasons related to the
borrower’s financial difficulties. This will normally involve the granting of concessionary terms and resetting the overdue account to non-overdue
status.
Rescheduled loans and advances to customers are stated net of any advances which have subsequently become overdue for more than three months
and which are included in "Overdue loans and advances to customers" (note 23d).
63

NOTES ON THE CONDENSED CONSOLIDATED FINANCIAL STATEMENTS (unaudited) (continued)
23 Loans and advances to customers (continued)
(f) Segmental analysis of loans and advances to customers by geographical area
Individually
Gross impaired Overdue Individually Collectively
loans and loans and loans and assessed assessed
advances advances advances allowances allowances
At 30 June 2016
Hong Kong 571,374 2,145 1,977 492 622
Mainland China 79,818 1,323 627 396 167
Others 28,992 15 1 8 57
680,184 3,483 2,605 896 846
At 30 June 2015
Hong Kong 560,975 1,671 1,117 570 690
Mainland China 88,762 1,018 964 652 126
Others 25,349 7 3 1 25
675,086 2,696 2,084 1,223 841
At 31 December 2015
Hong Kong 567,668 1,667 1,539 414 605
Mainland China 97,131 829 611 392 171
Others 25,762 9 1 1 32
690,561 2,505 2,151 807 808
(g) Gross loans and advances to customers by industry sector
At 30 June 2016 At 30 June 2015 At 31 December 2015
% of gross % of gross % of gross
advances advances advances
covered by covered by covered by
collateral collateral collateral
Gross loans and advances to customers for use
in Hong Kong
Industrial, commercial and financial sectors
- property development 48,178 42.9 44,861 46.0 43,951 46.7
- property investment 110,863 87.6 107,675 97.4 108,840 90.5
- financial concerns 6,731 44.7 5,342 40.1 5,556 28.7
- stockbrokers 183 83.6 1,532 1.9 32 96.9
- wholesale and retail trade 25,461 47.2 25,672 47.2 27,272 43.0
- manufacturing 20,098 42.1 20,833 55.4 21,478 43.2
- transport and transport equipment 8,920 65.1 9,011 70.6 9,608 68.5
- recreational activities 20 48.2 120 13.3 114 11.5
- information technology 5,342 18.6 3,048 31.3 3,821 18.1
- other 45,779 62.3 43,231 57.3 42,307 62.8
271,575 65.1 261,325 70.2 262,979 66.7
Individuals
- loans and advances for the purchase of flats under
the Government Home Ownership Scheme,
Private Sector Participation Scheme
and Tenants Purchase Scheme 16,973 100.0 16,095 100.0 16,446 100.0
- loans and advances for the purchase of other
residential properties 158,763 100.0 152,275 100.0 158,275 100.0
- credit card loans and advances 25,064 - 23,947 - 25,982 -
- other 20,124 40.8 19,372 42.4 19,737 40.6
220,924 83.3 211,689 83.4 220,440 82.9
Total gross loans and advances for use in
Hong Kong 492,499 73.2 473,014 76.1 483,419 74.1
Trade finance 40,593 24.8 40,484 26.0 46,885 22.0
Gross loans and advances for use outside
Hong Kong 147,092 33.6 161,588 23.2 160,257 31.0
Gross loans and advances to customers 680,184 61.8 675,086 60.5 690,561 60.6
The analysis of gross loans and advances to customers by industry sector based on categories and definitions used by the Hong Kong Monetary
Authority ("HKMA") is as follows:
Loans and advances to customers by geographical area are classified according to the location of the counterparties after taking into account the
transfer of risk. In general, risk transfer applies when a loan is guaranteed by a party located in an area that is different from that of the counterparty.
64

NOTES ON THE CONDENSED CONSOLIDATED FINANCIAL STATEMENTS (unaudited) (continued)
24 Financial investments
At 30 June At 30 June At 31 December
2016 2015 2015
Financial investments:
- which may be repledged or resold
by counterparties 1,833 1,226 923
- which may not be repledged or resold
or are not subject to repledge or resale
by counterparties 373,570 326,972 371,349
375,403 328,198 372,272
Held-to-maturity debt securities at amortised cost 84,031 76,591 81,822
Available-for-sale at fair value:
- debt securities 287,165 246,590 285,808
- equity shares 4,207 5,007 4,633
- investment funds - 10 9
375,403 328,198 372,272
Treasury bills 151,383 139,176 152,014
Certificates of deposit 10,139 12,052 12,053
Other debt securities 209,674 171,953 203,563
Debt securities 371,196 323,181 367,630
Equity shares 4,207 5,007 4,633
Investment funds - 10 9
375,403 328,198 372,272
(a) Held-to-maturity debt securities
At 30 June At 30 June At 31 December
2016 2015 2015
Issued by public bodies:
- central governments and central banks 617 609 612
- other public sector entities 10,712 11,425 10,993
11,329 12,034 11,605
Issued by other bodies:
- banks 33,295 31,682 33,175
- corporate entities 39,407 32,875 37,042
72,702 64,557 70,217
84,031 76,591 81,822
Fair value of held-to-maturity debt securities: 88,717 79,210 84,571
There were no overdue debt securities at 30 June 2016 and the comparative periods for the Group. The Group did not
hold any asset-backed securities, mortgage-backed securities and collateralised debt obligations.
There were no held-to-maturity debt securities determined to be impaired at 30 June 2016 and the comparative
periods for the Group.
65

NOTES ON THE CONDENSED CONSOLIDATED FINANCIAL STATEMENTS (unaudited) (continued)
24 Financial investments (continued)
(b) Available-for-sale debt securities
At 30 June At 30 June At 31 December
2016 2015 2015
Issued by public bodies:
- central governments and central banks 217,563 191,346 222,977
- other public sector entities 17,315 14,113 14,966
234,878 205,459 237,943
Issued by other bodies:
- banks 48,249 36,099 42,665
- corporate entities 4,038 5,032 5,200
52,287 41,131 47,865
287,165 246,590 285,808
(c) Available-for-sale equity shares
At 30 June At 30 June At 31 December
2016 2015 2015
Issued by banks 3,533 4,505 4,096
Issued by corporate entities 674 502 537
4,207 5,007 4,633
(d) Available-for-sale investment funds
At 30 June At 30 June At 31 December
2016 2015 2015
Issued by corporate entities - 10 9
(e)
At 30 June At 30 June At 31 December
2016 2015 2015
AA- to AAA 271,183 246,941 277,556
A- to A+ 89,551 66,558 79,526
B+ to BBB+ 7,704 7,402 8,136
Unrated 2,758 2,280 2,412
371,196 323,181 367,630
For the periods indicated, there were no available-for-sale debt securities determined to be impaired on the basis
that there was objective evidence of impairment in the value of the debt securities for the Group.
For the periods indicated, there were no available-for-sale equity securities determined to be impaired for the
Group.
For the periods indicated, there were no available-for-sale investment funds determined to be impaired for the
Group.
The following table presents an analysis of debt securities by rating agency designation at the balance sheet dates,
based on Standard and Poor's ratings or their equivalent to the respective issues of the financial securities. If major
rating agencies have different ratings for the same debt securities, the securities are reported against the lower
rating. In the absence of such issue ratings, the ratings designated for the issuers are reported.
66

NOTES ON THE CONDENSED CONSOLIDATED FINANCIAL STATEMENTS (unaudited) (continued)
25 Interest in associates
At 30 June At 30 June At 31 December
2016 2015 2015
Share of net assets 2,291 2,258 2,275
26 Investment properties
Half-year Half-year Half-year
ended ended ended
30 June 30 June 31 December
2016 2015 2015
Beginning of the period 10,075 11,732 9,899
Additions - 699 -
(Deficit)/Surplus on revaluation (charged)/credited
to condensed consolidated income statement (50) 216 201
Transfer from/(to) premises (note 27) 304 (2,748) (25)
End of the period 10,329 9,899 10,075
Representing:
- measure at valuation 10,329 9,899 10,075
27 Premises, plant and equipment
Movement of premises, plant and equipment
Plant and
Premises equipment Total
Cost or valuation:
At 1 January 2016 25,108 4,505 29,613
Additions 147 351 498
Disposals - (135) (135)
Elimination of accumulated depreciation on revalued premises (378) - (378)
Surplus on revaluation:
- credited to premises revaluation reserve 277 - 277
Transfer to investment properties (note 26) (304) - (304)
Exchange difference (19) (12) (31)
At 30 June 2016 24,831 4,709 29,540
Accumulated depreciation:
At 1 January 2016 - (3,427) (3,427)
Charge for the period (note 12) (378) (173) (551)
Written off on disposal - 124 124
Elimination of accumulated depreciation on revalued premises 378 - 378
Exchange difference - 10 10
At 30 June 2016 - (3,466) (3,466)
Net book value at 30 June 2016 24,831 1,243 26,074
Representing:
- measure at cost - 1,243 1,243
- measure at valuation 24,831 - 24,831
24,831 1,243 26,074
67

NOTES ON THE CONDENSED CONSOLIDATED FINANCIAL STATEMENTS (unaudited) (continued)
27 Premises, plant and equipment (continued)
Movement of premises, plant and equipment (continued)
Plant and
Premises equipment Total
Cost or valuation:
At 1 January 2015 21,073 4,163 25,236
Additions - 386 386
Disposals - (135) (135)
Elimination of accumulated depreciation on revalued premises (320) - (320)
Surplus on revaluation:
- credited to premises revaluation reserve 1,103 - 1,103
Transfer from investment properties (note 26) 2,748 - 2,748
Exchange difference - - -
At 30 June 2015 24,604 4,414 29,018
Accumulated depreciation:
At 1 January 2015 - (3,338) (3,338)
Charge for the period (note 12) (320) (142) (462)
Written off on disposal - 126 126
Elimination of accumulated depreciation on revalued premises 320 - 320
Exchange difference - - -
At 30 June 2015 - (3,354) (3,354)
Net book value at 30 June 2015 24,604 1,060 25,664
Representing:
- measure at cost - 1,060 1,060
- measure at valuation 24,604 - 24,604
24,604 1,060 25,664
Cost or valuation:
At 1 July 2015 24,604 4,414 29,018
Additions 84 185 269
Disposals - (66) (66)
Elimination of accumulated depreciation on revalued premises (340) - (340)
Surplus on revaluation:
- credited to premises revaluation reserve 775 - 775
Transfer from investment properties (note 26) 25 - 25
Exchange difference (40) (28) (68)
At 31 December 2015 25,108 4,505 29,613
Accumulated depreciation:
At 1 July 2015 - (3,354) (3,354)
Charge for the period (note 12) (340) (155) (495)
Written off on disposal - 62 62
Elimination of accumulated depreciation on revalued premises 340 - 340
Exchange difference - 20 20
At 31 December 2015 - (3,427) (3,427)
Net book value at 31 December 2015 25,108 1,078 26,186
Representing:
- measure at cost - 1,078 1,078
- measure at valuation 25,108 - 25,108
25,108 1,078 26,186
68

NOTES ON THE CONDENSED CONSOLIDATED FINANCIAL STATEMENTS (unaudited) (continued)
28 Intangible assets
At 30 June At 30 June At 31 December
2016 2015 2015
Present value of in-force long-term insurance business 12,851 9,774 11,431
Internally developed software 409 387 379
Acquired software 52 87 82
Goodwill 329 329 329
13,641 10,577 12,221
29 Other assets
At 30 June At 30 June At 31 December
2016 2015 2015
Items in the course of collection from other banks 8,433 7,177 6,922
Bullion 1,945 3,854 3,536
Prepayments and accrued income 3,644 3,946 3,717
Acceptances and endorsements 4,224 6,326 5,724
Reinsurers' share of liabilities under insurance contracts 6,882 3,717 5,782
Other accounts 2,742 2,818 2,794
27,870 27,838 28,475
30 Current, savings and other deposit accounts
At 30 June At 30 June At 31 December
2016 2015 2015
Current, savings and other deposit accounts:
- as stated in condensed consolidated balance sheet 951,545 947,495 959,228
- structured deposits reported as trading liabilities (note 31) 25,624 36,715 27,440
977,169 984,210 986,668
By type:
- demand and current accounts 92,844 83,459 86,644
- savings accounts 638,640 580,379 615,135
- time and other deposits 245,685 320,372 284,889
977,169 984,210 986,668
There were no significant impaired, overdue or rescheduled other assets at the period-ends.
Other accounts included "Assets held for sale" of HK$39m (30 June 2015: HK$11m, 31 December 2015: HK$33m). It also
included "Retirement benefit assets" of HK$27m (30 June 2015: HK$41m, 31 December 2015: HK$42m).
69

NOTES ON THE CONDENSED CONSOLIDATED FINANCIAL STATEMENTS (unaudited) (continued)
31 Trading liabilities
At 30 June At 30 June At 31 December
2016 2015 2015
Other structured debt securities in issue (note 33) 3,822 4,680 2,351
Structured deposits (note 30) 25,624 36,715 27,440
Short positions in securities and others 28,710 36,148 33,126
58,156 77,543 62,917
32 Financial liabilities designated at fair value
At 30 June At 30 June At 31 December
2016 2015 2015
Certificates of deposit in issue (note 33) 3,508 3,510 3,491
Liabilities to customers under investment contracts 496 517 503
4,004 4,027 3,994
33 Certificates of deposit and other debt securities in issue
At 30 June At 30 June At 31 December
2016 2015 2015
Certificates of deposit and other debt securities in issue:
- as stated in condensed consolidated balance sheet 6,416 7,738 5,191
- certificates of deposit in issue
designated at fair value (note 32) 3,508 3,510 3,491
- other structured debt securities in issue
reported as trading liabilities (note 31) 3,822 4,680 2,351
13,746 15,928 11,033
By type:
- certificates of deposit in issue 8,758 10,002 7,491
- other debt securities in issue 4,988 5,926 3,542
13,746 15,928 11,033
34 Other liabilities
At 30 June At 30 June At 31 December
2016 2015 2015
Items in the course of transmission to other banks 10,588 8,563 7,586
Accruals 2,833 3,463 3,531
Acceptances and endorsements 4,224 6,326 5,724
Retirement benefit liabilities 1,728 1,380 1,013
Other 4,444 3,155 3,037
23,817 22,887 20,891
70

NOTES ON THE CONDENSED CONSOLIDATED FINANCIAL STATEMENTS (unaudited) (continued)
35 Subordinated liabilities
At 30 June At 30 June At 31 December
2016 2015 2015
Nominal value Description
Amounts owed to HSBC Group undertakings
US$450 million Floating rate subordinated
loan due July 2021 (1)
- 3,488 -
US$300 million Floating rate subordinated
loan due July 2022 (2)
2,328 2,326 2,325
2,328 5,814 2,325
Representing:
- measured at amortised cost 2,328 5,814 2,325
(1)
(2)
The Bank exercised its option to redeem the subordinated loan at par of US$450 million.
Interest rate at three-month US dollar LIBOR plus 4.06 per cent per annum, payable quarterly, to the maturity date.
The outstanding subordinated loan serves to help the Bank maintain a balanced capital structure and support business growth.
The Group has not had any defaults of principal, interest or other breaches with respect to its debt securities for the periods
indicated.
71

NOTES ON THE CONDENSED CONSOLIDATED FINANCIAL STATEMENTS (unaudited) (continued)
36 Shareholders' funds
At 30 June At 30 June At 31 December
2016 2015 2015
Share capital 9,658 9,658 9,658
Retained profits 100,615 102,085 105,363
Other equity instruments 6,981 6,981 6,981
Premises revaluation reserve 16,760 16,379 16,777
Cash flow hedging reserve (26) 4 (9)
Available-for-sale investment reserve
- on debt securities 225 277 23
- on equity securities 1,483 2,292 1,916
Other reserves 1,017 1,798 1,272
Total reserves 127,055 129,816 132,323
Shareholders' funds 136,713 139,474 141,981
Return on average ordinary shareholders' equity* 12.4% 31.0% 10.6%
37 Other equity instruments
At 30 June At 30 June At 31 December
2016 2015 2015
Nominal value Description
US$900 million Floating rate perpetual
capital instrument callable
from December 2019 (1)
6,981 6,981 6,981
(1)
* For the half-year ended
To satisfy the provisions of the Hong Kong Banking Ordinance and local regulatory requirements for prudential supervision
purposes, the Group has earmarked a "regulatory reserve" directly from retained profits. As at 30 June 2016, the effect of this
requirement is to restrict the amount of reserves which can be distributed by the Group to shareholders by HK$5,823m
(HK$6,382m and HK$6,610m at 30 June 2015 and 31 December 2015 respectively).
Coupon rate at one-year US dollar LIBOR plus 3.84 per cent.
The additional tier 1 capital instruments are perpetual and subordinated, and the coupon payments may be cancelled at the sole
discretion of the Bank. The capital instruments will be written down at the point of non-viability on the occurrence of a trigger
event as defined in the Banking (Capital) Rules. They rank higher than ordinary shares in the event of a winding-up.
72

NOTES ON THE CONDENSED CONSOLIDATED FINANCIAL STATEMENTS (unaudited) (continued)
38 Reconciliation of cash flow statement
(a) Reconciliation of operating profit to net cash flow from operating activities
Half-year Half-year
ended ended
30 June 30 June
2016 2015
Operating profit 9,516 10,820
Net interest income (11,003) (10,441)
Dividend income (174) (125)
Loan impairment charges and other credit risk provisions 721 594
Depreciation 551 462
Amortisation of intangible assets 51 56
Amortisation of available-for-sale investments 223 25
Amortisation of held-to-maturity debt securities - (1)
Loans and advances written off net of recoveries (552) (345)
Movement in present value of in-force long-term insurance business (1,420) (1,511)
Interest received 11,799 12,727
Interest paid (1,964) (2,841)
Operating profit before changes in working capital 7,748 9,420
Change in treasury bills and certificates of deposit with
original maturity more than three months (965) (16,986)
Change in placings with and advances to banks maturing after one month 19,702 5,824
Change in trading assets (9,861) (2,198)
Change in financial assets designated at fair value 62 -
Change in derivative financial instruments 3,972 832
Change in reverse repurchase agreements - non-trading - (608)
Change in loans and advances to customers 10,347 (18,227)
Change in other assets 254 (1,104)
Change in financial liabilities designated at fair value 18 517
Change in current, savings and other deposit accounts (7,683) 50,974
Change in repurchase agreements - non-trading (554) 3,032
Change in deposits from banks (4,068) 4,953
Change in trading liabilities (4,761) 4,956
Change in certificates of deposit and other debt securities in issue 1,225 (4,664)
Change in other liabilities 187 3,739
Elimination of exchange differences and other non-cash items (774) (1,651)
Cash generated from operating activities 14,849 38,809
Taxation paid (28) (22)
Net cash inflow from operating activities 14,821 38,787
(b) Analysis of the balances of cash and cash equivalents
At 30 June At 30 June
2016 2015
Cash and sight balances at central banks 18,938 40,317
Balances with banks 13,689 30,079
Items in the course of collection from other banks 8,433 7,177
Placings with and advances to banks maturing within one month 48,233 69,578
Treasury bills 24,777 28,311
Certificates of deposit 664 -
Less: items in the course of transmission to other banks (10,588) (8,563)
104,146 166,899
The balances of cash and cash equivalents included cash and sight balances at central banks, balances with banks and
placings with and advances to banks maturing within one month that are subject to exchange control and regulatory
restrictions, amounting to HK$17,199m at 30 June 2016 (HK$36,466m at 30 June 2015).
73

NOTES ON THE CONDENSED CONSOLIDATED FINANCIAL STATEMENTS (unaudited) (continued)
39 Contingent liabilities, commitments and derivatives
At 30 June At 30 June At 31 December
2016 2015 2015
Contingent liabilities and commitments
Contract amounts
Direct credit substitutes 6,849 4,552 7,558
Transaction-related contingencies 4,442 3,108 3,336
Trade-related contingencies 10,137 13,541 11,217
Commitments that are unconditionally cancellable without prior notice 327,535 303,965 323,270
Commitments which have an original maturity of not more than one year 4,071 6,391 2,642
Commitments which have an original maturity of more than one year 28,353 24,275 22,126
381,387 355,832 370,149
Risk-weighted amounts 39,414 32,568 36,227
Risk-
Contract weighted Fair
amounts amounts value
Derivative transactions
At 30 June 2016
Exchange rate contracts:
- foreign exchange 666,790 1,295 832
- currency swaps 110,664 356 68
- currency options purchased 42,812 2,526 1,307
820,266 4,177 2,207
Interest rate contracts:
- interest rate swaps 289,328 240 173
- other interest rate contracts 1,362 - 1
290,690 240 174
Equity and other contracts:
- equity swaps 3,857 33 5
- equity options purchased 13,557 311 344
17,414 344 349
The table above gives the nominal contract amounts and risk-weighted amounts of contingent liabilities and commitments. The information is
consistent with that in the "Capital Adequacy Ratio" return submitted to the HKMA by the Group. The return is prepared on a consolidated
basis as specified by the HKMA under the requirements of section 3C(1) of the Banking (Capital) Rules.
For accounting purposes, acceptances and endorsements are recognised on the condensed consolidated balance sheet in "Other assets" and
"Other Liabilities" in accordance with HKAS 39 "Financial Instruments: Recognition and Measurement". For the purpose of the Banking
(Capital) Rules, acceptances and endorsements are included in the capital adequacy calculation as if they were contingencies.
Contingent liabilities and commitments are credit-related instruments. Contractual amounts represent the amounts at risk should contracts be
fully drawn upon and clients default. Since a significant portion of guarantees and commitments are expected to expire without being drawn
upon, the total of the contractual amounts is not representative of expected future liquidity requirements.
74

NOTES ON THE CONDENSED CONSOLIDATED FINANCIAL STATEMENTS (unaudited) (continued)
39 Contingent liabilities, commitments and derivatives (continued)
Risk-
Contract weighted Fair
amounts amounts value
At 30 June 2015
Exchange rate contracts:
- foreign exchange 525,622 1,168 1,104
- currency swaps 54,650 383 306
- currency options purchased 117,196 4,336 1,016
697,468 5,887 2,426
Interest rate contracts:
- interest rate swaps 242,035 430 356
- other interest rate contracts 318 - -
242,353 430 356
Equity and other contracts:
- equity swaps 4,439 37 2
- equity options purchased 6,604 323 187
11,043 360 189
At 31 December 2015
Exchange rate contracts:
- foreign exchange 556,913 1,365 1,858
- currency swaps 78,350 416 372
- currency options purchased 67,947 5,080 2,712
703,210 6,861 4,942
Interest rate contracts:
- interest rate swaps 268,924 263 32
- other interest rate contracts 948 - -
269,872 263 32
Equity and other contracts:
- equity swaps 2,687 22 2
- equity options purchased 12,894 396 246
15,581 418 248
The netting benefits represent amounts where the Group has in place legally enforceable rights of offset with individual counterparties to
offset the gross amount of positive mark-to-market assets with any negative mark-to-market liabilities with the same customer. These offsets
are recognised by the HKMA in the calculation of risk-weighted amounts for the capital adequacy ratio.
The table above gives the contract amounts, riskweighted amounts and fair value of derivative transactions. The information is consistent
with that in the ‘Capital Adequacy Ratio’ return submitted to the HKMA. The return is prepared on a consolidated basis as specified by the
HKMA under the requirements of section 3C(1) of the Banking (Capital) Rules.
The contract amounts of derivatives indicate the nominal value of transactions outstanding at the balance sheet date; they do not represent
amounts at risk.
Fair value is a close approximation of the credit risk for these contracts at the balance sheet date. Credit risk for risk-weighting is measured as
the sum of positive fair values and an estimate for the future fluctuation risk, using a future risk factor. Fair value is calculated after taking
into account the effect of valid bilateral netting agreements amounting to HK$5,765m at 30 June 2016 (30 June 2015: HK$2,404m, 31
December 2015: HK$5,840m).
75

NOTES ON THE CONDENSED CONSOLIDATED FINANCIAL STATEMENTS (unaudited) (continued)
40 Material related-party transactions
41 Fair value of financial instruments
(a) Fair value of financial instruments carried at fair value
WithQuoted Using significant Amounts
market observable unobservable Third with
price inputs inputs party HSBC
Level 1 Level 2 Level 3 total entities * Total
Recurring fair value measurements
At 30 June 2016
Assets
Trading assets 49,582 2,509 - 52,091 - 52,091
Financial assets designated at fair value 5,183 4,116 598 9,897 - 9,897
Derivative financial instruments 509 6,418 7 6,934 2,150 9,084
Available-for-sale financial investments 188,107 102,097 1,168 291,372 - 291,372
Liabilities
Trading liabilities 28,380 29,615 161 58,156 - 58,156
Financial liabilities designated at fair value - 4,004 - 4,004 - 4,004
Derivative financial instruments 57 8,525 2 8,584 3,006 11,590
At 30 June 2015
Assets
Trading assets 36,316 8,456 - 44,772 - 44,772
Financial assets designated at fair value 5,785 1,764 669 8,218 - 8,218
Derivative financial instruments 632 4,703 21 5,356 648 6,004
Available-for-sale financial investments 163,166 87,115 1,326 251,607 - 251,607
Liabilities
Trading liabilities 35,704 41,789 50 77,543 - 77,543
Financial liabilities designated at fair value - 4,027 - 4,027 - 4,027
Derivative financial instruments 109 4,284 2 4,395 1,482 5,877
At 31 December 2015
Assets
Trading assets 34,513 5,860 - 40,373 - 40,373
Financial assets designated at fair value 3,330 4,026 547 7,903 - 7,903
Derivative financial instruments 494 9,796 13 10,303 1,292 11,595
Available-for-sale financial investments 197,686 91,603 1,161 290,450 - 290,450
Liabilities
Trading liabilities 33,062 29,828 27 62,917 - 62,917
Financial liabilities designated at fair value - 3,994 - 3,994 - 3,994
Derivative financial instruments 44 6,770 3 6,817 3,171 9,988
There were no changes in the related party transactions described in the 2015 Annual Report that have had a material effect on the financial position or
performance of the Group in the half-year to 30 June 2016. All related party transactions that took place in the half-year to 30 June 2016 were similar in
nature to those disclosed in the 2015 Annual Report.
Fair value is the price that would be received to sell an asset or paid to transfer a liability in an orderly transaction between market participants at the
measurement date. The following tables set out the financial instruments carried at fair value.
Valuation techniques
* Included structured instruments and derivative contracts transacted with HSBC entities which were mainly classified within Level 2 of the valuation
hierarchy.
76

NOTES ON THE CONDENSED CONSOLIDATED FINANCIAL STATEMENTS (unaudited) (continued)
41 Fair value of financial instruments (continued)
(a) Fair value of financial instruments carried at fair value (continued)
Control framework
• the extent to which prices may be expected to represent genuine traded or tradeable prices;
• the degree of similarity between financial instruments;
• the degree of consistency between different sources;
• the process followed by the pricing provider to derive the data;
• the elapsed time between the date to which the market data relates and the balance sheet date; and
• the manner in which the data was sourced.
Determination of fair value
Fair values are determined according to the following hierarchy:
(i) Level 1: Quoted market price
(ii) Level 2: Valuation technique using observable inputs
(iii) Level 3: Valuation technique with significant unobservable inputs
Transfers between levels of the fair value hierarchy are deemed to occur at the end of the reporting period.
During the six months ended 30 June 2016, there were no material transfers between Level 1 and Level 2.
Fair values are subject to a control framework designed to ensure that they are either determined or validated by a function independent of the risk-
taker.
Financial instruments with quoted prices for identical instruments in active markets that the Group can access at the measurement date.
Financial instruments with quoted prices for similar instruments in active markets or quoted prices for identical or similar instruments in inactive
markets and financial instruments valued using models where all significant inputs are observable.
Financial instruments valued using models where one or more significant inputs are unobservable.
For all financial instruments where fair values are determined by reference to externally quoted prices or observable pricing inputs to models,
independent price determination or validation is utilised. In inactive markets, direct observation of a traded price may not be possible. In these
circumstances, the Group will source alternative market information to validate the financial instrument’s fair value, with greater weight given to
information that is considered to be more relevant and reliable. The factors that are considered in this regard are, inter alia :
For fair values determined using a valuation model, the control framework include, as applicable, development or validation by independent support
functions of (i) the logic within valuation models; (ii) the inputs to those models; (iii) any adjustments required outside the valuation models; and (iv)
where possible, model outputs. Valuation models are subject to a process of due diligence and calibration before becoming operational and are
calibrated against external market data on an ongoing basis.
To this end, ultimate responsibility for the determination of fair values lies with Finance. Finance establishes the accounting policies and procedures
governing valuation, and is responsible for ensuring compliance with all relevant accounting standards.
The best evidence of fair value is a quoted price in an actively traded market. The fair values of financial instruments that are quoted in active markets
are based on bid prices for assets held and offer prices for liabilities issued. Where a financial instrument has a quoted price in an active market and it
is part of a portfolio, the fair value of the portfolio is calculated as the product of the number of units and quoted price. In the event that the market for a
financial instrument is not active, a valuation technique is used.
The judgement as to whether a market is active may include, but is not restricted to, the consideration of factors such as the magnitude and frequency
of trading activity, the availability of prices and the size of bid/offer spreads. The bid/offer spread represents the difference in prices at which a market
participant would be willing to buy compared with the price at which they would be willing to sell. In inactive markets, obtaining assurance that the
transaction price provides evidence of fair value or determining the adjustments to transaction prices that are necessary to measure the fair value of the
instrument requires additional work during the valuation process.
77

NOTES ON THE CONDENSED CONSOLIDATED FINANCIAL STATEMENTS (unaudited) (continued)
41 Fair value of financial instruments (continued)
(a) Fair value of financial instruments carried at fair value (continued)
Determination of fair value (continued)
- Debt securities, Treasury and eligible bills, and Equities
- Structured notes
- Derivatives
Fair value adjustments
The majority of valuation techniques employ only observable market data. However, certain financial instruments are valued on the basis of valuation
techniques that feature one or more significant market inputs that are unobservable, and for them the measurement of fair value is more judgmental. An
instrument in its entirety is classified as valued using significant unobservable inputs if, in the opinion of management, a significant proportion of the
instrument’s inception profit ("day 1 gain or loss") or greater than 5% of the instrument’s carrying value is driven by unobservable inputs.
"Unobservable" in this context means that there is little or no current market data available from which to determine the price at which an arm’s length
transaction would be likely to occur. It generally does not mean that there is no market data available at all upon which to base a determination of fair
value (consensus pricing data may, for example, be used). All fair value adjustments are included within the levelling determination.
The types of financial instruments carried at fair values are as follows:
These instruments are valued based on quoted market prices from an exchange, dealer, broker, industry group or pricing service, where available.
Where unavailable, fair value is determined by reference to quoted market prices for similar instruments, or in the case of certain unquoted equities,
valuation techniques using inputs derived from observable and unobservable market data.
The fair value of structured notes valued using a valuation technique is derived from the fair value of the underlying debt security, and the fair value of
the embedded derivative is determined as described in the paragraph below on derivatives.
Trading liabilities valued using a valuation technique with significant unobservable inputs principally comprised equity-linked structured notes, which
are issued by the Group and provide the counterparty with a return that is linked to the performance of certain equity securities, and other portfolios.
The notes are classified as level 3 due to the unobservability of parameters such as long-dated equity volatilities and correlations between equity prices,
between equity prices and interest rates and between interest rates and foreign exchange rates.
Valuation techniques incorporate assumptions about factors that other market participants would use in their valuations. A range of valuation
techniques is employed, dependent upon the instrument type and available market data. Most valuation techniques are based upon discounted cash flow
analysis, in which expected future cash flows are calculated and discounted to present value using a discounting curve. Prior to consideration of credit
risk, the expected future cash flows may be known, as would be the case for the fixed leg of an interest rate swap, or may be uncertain and require
projection, as would be the case for the floating leg of an interest rate swap. Projection utilises market forward curves, if available. In option models,
the probability of different potential future outcomes must be considered. In addition, the value of some products are dependent upon more than one
market factor, and in these cases it will typically be necessary to consider how movements in one market factor may impact the other market factors.
The model inputs necessary to perform such calculations include interest rate yield curves, exchange rates, volatilities, correlations, prepayment and
default rates.
Movements in the level of fair value adjustments do not necessarily result in the recognition of profits or losses within the income statement. For
example, as models are enhanced, fair value adjustments may no longer be required. Similarly, fair value adjustments will decrease when the related
positions are unwound, but this may not result in profit or loss.
OTC (i.e. non-exchange traded) derivatives are valued using valuation models. Valuation models calculate the present value of expected future cash
flows, based upon "no-arbitrage" principles. For many vanilla derivative products, such as interest rate swaps and European options, the modelling
approaches used are standard across the industry. For more complex derivative products, there may be some discrepancies in practice. Inputs to
valuation models are determined from observable market data wherever possible, including prices available from exchanges, dealers, brokers or
providers of consensus pricing. Certain inputs may not be observable in the market directly, but can be determined from observable prices via model
calibration procedures. Finally, some inputs are not observable, but can generally be estimated from historical data or other sources.
Examples of inputs that are generally observable include foreign exchange spot and forward rates, benchmark interest rate curves and volatility surfaces
for commonly traded option products. Examples of inputs that may be unobservable include volatility surfaces, in whole or in part, for less commonly
traded option products, and correlations between market factors, such as foreign exchange rates, interest rates and equity prices.
Fair value adjustments are adopted when the Group considers that there are additional factors that would be considered by a market participant that are
not incorporated within the valuation model. The Group classifies fair value adjustments as either 'risk-related' or 'model-related'. The majority of these
adjustments relate to Global Markets.
78

NOTES ON THE CONDENSED CONSOLIDATED FINANCIAL STATEMENTS (unaudited) (continued)
41 Fair value of financial instruments (continued)
(a) Fair value of financial instruments carried at fair value (continued)
Risk-related adjustments:
- Bid-offer
- Uncertainty
- Credit valuation adjustment
- Debit valuation adjustment
- Funding fair value adjustment
Model-related adjustments:
- Model limitation
- Inception profit (Day 1 P&L reserves)
Financial instruments measured at fair value using a valuation technique with significant unobservable inputs - Level 3
Designated Designated
at fair value at fair value
Available- Held for through Held for through
for-sale trading profit or loss Derivatives trading profit or loss Derivatives
At 30 June 2016
Private equity 1,168 - 598 - - - -
Structured notes - - - - 161 - -
Derivatives - - - 7 - - 2
1,168 - 598 7 161 - 2
At 30 June 2015
Private equity 1,326 - 669 - - - -
Structured notes - - - - 50 - -
Derivatives - - - 21 - - 2
1,326 - 669 21 50 - 2
At 31 December 2015
Private equity 1,161 - 547 - - - -
Structured notes - - - - 27 - -
Derivatives - - - 13 - - 3
1,161 - 547 13 27 - 3
The major fair value adjustment categories being regularly reviewed by the Group are as follow:
HKFRS 13 requires use of the price within the bid-offer spread that is most representative of fair value. Valuation models will typically generate mid-
market values. The bid-offer adjustment reflects the extent to which bid-offer cost would be incurred if substantially all residual net portfolio market
risks were closed using available hedging instruments or by disposing of or unwinding the position.
The funding fair value adjustment is calculated by applying future market funding spreads to the expected future funding exposure of any
uncollateralised component of the OTC derivative portfolio. This includes the uncollateralised component of collateralised derivatives in addition to
derivatives that are fully uncollateralised. The expected future funding exposure is calculated by a simulation methodology, where available. The
expected future funding exposure is adjusted for events that may terminate the exposure such as the default of the Group or the counterparty. The
funding fair value adjustment and debit valuation adjustment are calculated independently.
Models used for portfolio valuation purposes may be based upon a simplifying set of assumptions that do not capture all material market
characteristics. Additionally, markets evolve, and models that were adequate in the past may require development to capture all material market
characteristics in current market conditions. In these circumstances, model limitation adjustments are adopted. As model development progresses,
model limitations are addressed within the valuation models and a model limitation adjustment is no longer needed.
Inception profit adjustments are adopted where the fair value estimated by a valuation model is based on one or more significant unobservable inputs.
Certain model inputs may be less readily determinable from market data, and/or the choice of model itself may be more subjective. In these
circumstances, there exists a range of possible values that the financial instrument or market parameter may assume and an adjustment may be
necessary to reflect the likelihood that in estimating the fair value of the financial instrument, market participants would adopt more conservative values
for uncertain parameters and/or model assumptions than those used in the valuation model.
The credit valuation adjustment is an adjustment to the valuation of OTC derivative contracts to reflect within fair value the possibility that the
counterparty may default and that the Group may not receive the full market value of the transactions.
The debit valuation adjustment is an adjustment to the valuation of OTC derivative contracts to reflect within fair value the possibility that the Group
may default, and that the Group may not pay full market value of the transactions.
Assets Liabilities
79

NOTES ON THE CONDENSED CONSOLIDATED FINANCIAL STATEMENTS (unaudited) (continued)
41 Fair value of financial instruments (continued)
(a) Fair value of financial instruments carried at fair value (continued)
Movement in Level 3 financial instruments
Designated Designated
at fair value at fair value
Available- Held for through Held for through
for-sale trading profit or loss Derivatives trading profit or loss Derivatives
At 1 January 2016 1,161 - 547 13 27 - 3
Total gains or losses
recognised
in profit or loss
- trading income - - - (6) (2) - (1)
- net income
from other financial
instruments designated
at fair value - - 66 - - - -
- gains less losses from
financial investments - - - - - - -
Total gains or losses
recognised in other
comprehensive
income
- fair value gains 7 - - - - - -
- exchange differences - - - - - - -
Purchases - - 1 - - - -
Issues/deposit taking - - - - 143 - -
Sales - - - - - - -
Settlements - - (16) - (6) - -
Transfers out - - - - (1) - -
Transfers in - - - - - - -
At 30 June 2016 1,168 - 598 7 161 - 2
Unrealised gains or losses
recognised in profit or loss
relating to those assets and
liabilities held at the end of
the reporting period
- trading income - - - 1 2 - -
- net income
from other financial
instruments designated
at fair value - - 66 - - - -
Assets Liabilities
80

NOTES ON THE CONDENSED CONSOLIDATED FINANCIAL STATEMENTS (unaudited) (continued)
41 Fair value of financial instruments (continued)
(a) Fair value of financial instruments carried at fair value (continued)
Movement in Level 3 financial instruments (continued)
Designated Designated
at fair value at fair value
Available- Held for through Held for through
for-sale trading profit or loss Derivatives trading profit or loss Derivatives
At 1 January 2015 1,234 - 701 32 89 - 1
Total gains or losses
recognised
in profit or loss
- trading income - - - 9 (1) - 1
- net income
from other financial
instruments designated
at fair value - - 34 - - - -
- gains less losses from
financial investments - - - - - - -
Total gains or losses
recognised in other
comprehensive
income
- fair value gains 92 - - - - - -
- exchange differences - - - - - - -
Purchases - - 80 - - - -
Issues/deposit taking - - - - 51 - -
Sales - - (11) - - - -
Settlements - - (106) - (71) - -
Transfers out - - (29) (20) (18) - -
Transfers in - - - - - - -
At 30 June 2015 1,326 - 669 21 50 - 2
Unrealised gains or losses
recognised in profit or loss
relating to those assets and
liabilities held at the end of
the reporting period
- trading income - - - 11 1 - (2)
- net income
from other financial
instruments designated
at fair value - - 33 - - - -
Assets Liabilities
81
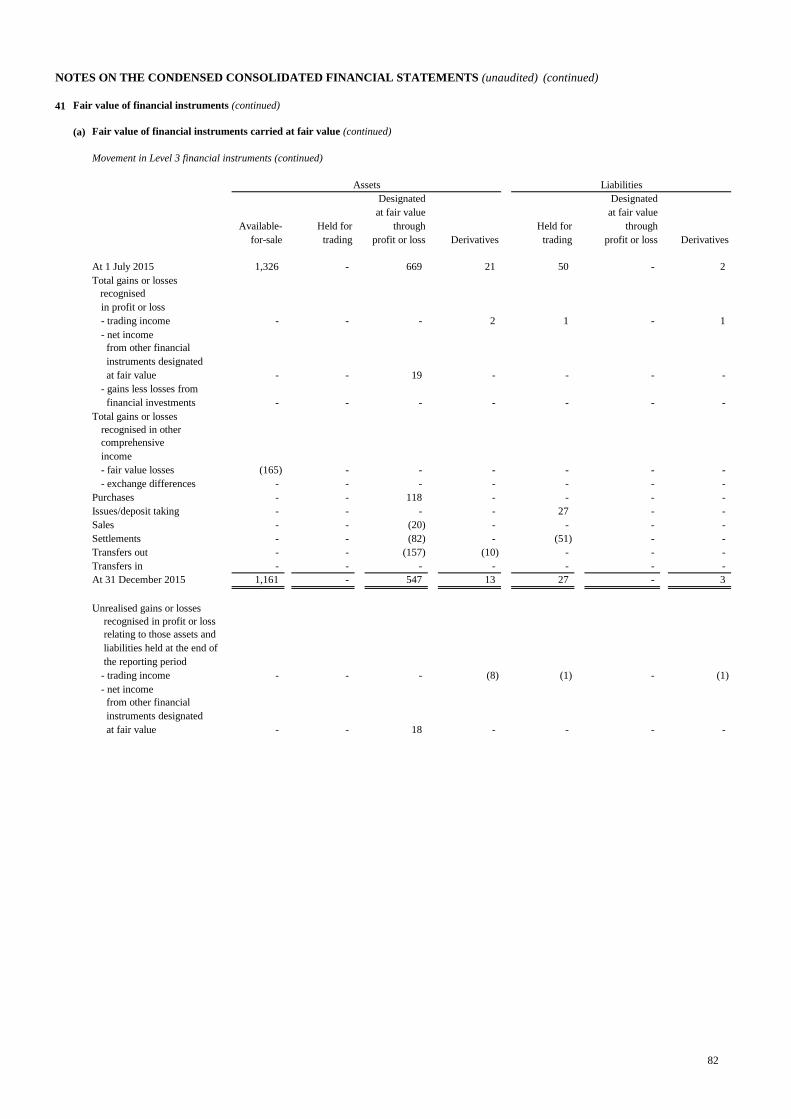
NOTES ON THE CONDENSED CONSOLIDATED FINANCIAL STATEMENTS (unaudited) (continued)
41 Fair value of financial instruments (continued)
(a) Fair value of financial instruments carried at fair value (continued)
Movement in Level 3 financial instruments (continued)
Designated Designated
at fair value at fair value
Available- Held for through Held for through
for-sale trading profit or loss Derivatives trading profit or loss Derivatives
At 1 July 2015 1,326 - 669 21 50 - 2
Total gains or losses
recognised
in profit or loss
- trading income - - - 2 1 - 1
- net income
from other financial
instruments designated
at fair value - - 19 - - - -
- gains less losses from
financial investments - - - - - - -
Total gains or losses
recognised in other
comprehensive
income
- fair value losses (165) - - - - - -
- exchange differences - - - - - - -
Purchases - - 118 - - - -
Issues/deposit taking - - - - 27 - -
Sales - - (20) - - - -
Settlements - - (82) - (51) - -
Transfers out - - (157) (10) - - -
Transfers in - - - - - - -
At 31 December 2015 1,161 - 547 13 27 - 3
Unrealised gains or losses
recognised in profit or loss
relating to those assets and
liabilities held at the end of
the reporting period
- trading income - - - (8) (1) - (1)
- net income
from other financial
instruments designated
at fair value - - 18 - - - -
Assets Liabilities
82

NOTES ON THE CONDENSED CONSOLIDATED FINANCIAL STATEMENTS (unaudited) (continued)
41 Fair value of financial instruments (continued)
(a) Fair value of financial instruments carried at fair value (continued)
Movement in Level 3 financial instruments (continued)
Effect of changes in significant unobservable assumptions to reasonably possible alternatives
Sensitivity of fair values to reasonably possible alternative assumptions
Favourable Unfavourable Favourable Unfavourable
changes changes changes changes
At 30 June 2016
Private equity 30 (30) 84 (84)
Structured notes - - - -
Derivatives - - - -
30 (30) 84 (84)
At 30 June 2015
Private equity 67 (67) 134 (134)
Structured notes - - - -
Derivatives - - - -
67 (67) 134 (134)
At 31 December 2015
Private equity 27 (27) 74 (74)
Structured notes - - - -
Derivatives 1 (1) - -
28 (28) 74 (74)
Transfer out of Level 3 held for trading liabilities predominately resulted from the increase in observability of correlations between equity and equity
index during the period.
The fair value of financial instruments are, in certain circumstances, measured using valuation techniques that incorporate assumptions which are not
evidenced by prices from observable current market transactions in the same instrument and are not based on observable market data. The following
table shows the sensitivity of these fair values to reasonably possible alternative assumptions:
Reflected in other
Reflected in profit or loss comprehensive income
When the fair value of a financial instrument is affected by more than one unobservable assumption, the above table reflects the most favourable or the
most unfavourable change from varying the assumptions individually.
For private equity, favourable and unfavourable changes are determined on the basis of 5% changes (30 June 2015: 10%; 31 December 2015: 5%) in
the value of the instrument as a result of varying the levels of the unobservable parameters using statistical techniques. When parameters are not
amendable to statistical analysis, quantification of uncertainty is judgemental.
83

NOTES ON THE CONDENSED CONSOLIDATED FINANCIAL STATEMENTS (unaudited) (continued)
41 Fair value of financial instruments (continued)
(a) Fair value of financial instruments carried at fair value (continued)
Quantitative information about significant unobservable inputs in Level 3 valuations
Valuation Unobservable Range
technique(s) input(s)
Assets
Private equity Net asset value N/A N/A
Market-comparable Earnings Multiple 24 - 34
approach (30 Jun 2015: 24 - 34)
(31 Dec 2015: 27 - 37)
P/B ratios 0.70 - 1.22
(30 Jun 2015: 1.07 - 2.26)
(31 Dec 2015: 0.89 - 1.58)
Liquidity Discount 10% - 30%
(30 Jun 2015: 10% - 30%)
(31 Dec 2015: 10% - 30%)
Derivatives Option model Equity Volatility 31.89% - 48.80%
(30 Jun 2015: 17.00% - 49.00%)
(31 Dec 2015: 33.11% - 52.46%)
FX Volatility 5.06% - 13.79%
(30 Jun 2015: 1.95% - 12.41%)
(31 Dec 2015: 6.44% - 13.80%)
Discounted cash flow model IR Curve 0.98% - 4.40%
(30 Jun 2015: 3.00% - 3.96% )
(31 Dec 2015: 1.76% - 5.46% )
Liabilities
Structured notes Option model FX Volatility 4.83% - 13.79%
(30 Jun 2015: 8.47% - 17.33%)
(31 Dec 2015: 7.10% - 13.80%)
Equity and 0.17 - 0.20
Equity Index Correlation (30 Jun 2015: 0.28 - 0.28)
(31 Dec 2015: 0.26 - 0.26)
Derivatives Option model Equity Volatility 31.89% - 48.80%
(30 Jun 2015: N/A)
(31 Dec 2015: N/A)
FX Volatility 5.06% - 13.79%
(30 Jun 2015: 7.82% - 12.41%)
(31 Dec 2015: 6.44% - 13.80%)
Discounted cash flow model IR Curve 0.98% - 4.40%
(30 Jun 2015: 3.00% - 3.96%)
(31 Dec 2015: 1.76% - 5.46%)
Key unobservable inputs to Level 3 financial instruments
The table above lists the key unobservable inputs to Level 3 financial instruments, and provides the range of those inputs as at 30 June 2016. A further
description of the categories of key unobservable inputs is given as follows.
84

NOTES ON THE CONDENSED CONSOLIDATED FINANCIAL STATEMENTS (unaudited) (continued)
41 Fair value of financial instruments (continued)
(a) Fair value of financial instruments carried at fair value (continued)
Key unobservable inputs to Level 3 financial instruments (continued)
Private equity
Volatility
Correlation
The Group’s private equity includes investment funds and unlisted equity shares, which are classified as designated at fair value through profit or loss
or available-for-sale and are not traded in active markets. In the absence of an active market, the investment’s fair value is estimated on the basis of an
analysis of the investee’s financial position and results, risk profile, prospects and other factors, as well as by reference to market valuations for similar
entities quoted in an active market, or the price at which similar companies have changed ownership.
Investment funds are valued using their net asset value. Higher net asset value results in higher fair value, and vice versa. Given the bespoke nature of
the analysis, it is not practical to quote a range of key unobservable inputs.
For unlisted available-for-sale equity shares, the fair values are determined with reference to multiples of comparable listed companies, such as
price/earning or price/book ratios of comparables, adjusted for a liquidity discount to reflect the fact that the shares are not actively traded. An increase
in the ratio in isolation will result in favourable movement in the fair values, while an increase in liquidity discount in isolation will result in
unfavourable movement.
The range of unobservable volatilities quoted in the table reflects the wide variation in volatility inputs by reference to market price. For any single
unobservable volatility, the uncertainty in the volatility determination is significantly less than the range quoted above.
Correlation is a measure of the inter-relationship between two market prices. Correlation is a number between minus one and one. A positive
correlation implies that the two market prices tend to move in the same direction, with a correlation of one implying that they always move in the same
direction. A negative correlation implies that the two market prices tend to move in opposite directions, with a correlation of minus one implying that
the two market prices always move in opposite directions.
Correlation is used to value more complex instruments where the payout is dependent upon more than one market price. Correlation may be
unobservable. Unobservable correlations may be estimated based upon a range of evidence, including consensus pricing services, the Group’s trade
prices, proxy correlations and examination of historical price relationships.
Volatility is a measure of the anticipated future variability of a market price. Volatility tends to increase in stressed market conditions, and decrease in
calmer market conditions. Volatility is an important input in the pricing of options. In general, the higher the volatility, the more expensive the option
will be. This reflects both the higher probability of an increased return from the option, and the potentially higher costs that the Group may incur in
hedging the risks associated with the option. If option prices become more expensive, this will increase the value of the Group's long option positions
(i.e. the positions in which the Group has purchased options), while the Group’s short option positions (i.e. the positions in which the Group has sold
options) will suffer losses.
Volatility varies by underlying reference to market price, and by strike and maturity of the option. Volatility also varies over time. As a result, it is
difficult to make general statements regarding volatility levels.
Certain volatilities, typically those of a longer-dated nature, are unobservable. The unobservable volatility is then estimated from observable data.
The range of unobservable correlations quoted in the table reflects the wide variation in correlation inputs by market price pair. For any single
unobservable correlation, the uncertainty in the correlation determination is likely to be less than the range quoted above.
85

NOTES ON THE CONDENSED CONSOLIDATED FINANCIAL STATEMENTS (unaudited) (continued)
41 Fair value of financial instruments (continued)
(b) Fair value of financial instruments not carried at fair value
Carrying Fair Carrying Fair Carrying Fair
Amount Value Amount Value Amount Value
Financial Assets
Placings with and advances to banks 97,307 97,430 152,767 152,831 123,990 124,316
Reverse repurchase agreements – non-trading - - 1,904 1,904 - -
Loans and advances to customers 678,442 677,700 673,022 670,626 688,946 690,248
Held-to-maturity debt securities 84,031 88,717 76,591 79,210 81,822 84,571
Financial Liabilities
Current, savings and other
deposit accounts 951,545 951,585 947,495 947,501 959,228 959,216
Repurchase agreements – non-trading 1,761 1,761 3,032 3,032 2,315 2,315
Deposits from banks 14,159 14,159 13,964 13,964 18,780 18,780
Certificates of deposit and other debt
securities in issue 6,416 6,442 7,738 7,801 5,191 5,223
Subordinated liabilities 2,328 2,887 5,814 6,864 2,325 2,915
(i) Loans and advances to banks and customers
(ii) Financial investments
(iii) Deposits by banks and customer accounts
At 30 June 2016 At 30 June 2015 At 31 December 2015
The following table provides an analysis of the fair value of financial instruments not measured at fair value on the condensed consolidated balance
sheet. For all other instruments, the fair value is equal to the carrying value.
Loans are grouped, as far as possible, into homogeneous groups and stratified by loans with similar characteristics to improve the accuracy of estimated
valuation outputs. The stratification of a loan book considers all material factors, including vintage, origination period, estimates of future interest rates,
prepayment speeds, delinquency rates, loan-to-value ratios, the quality of collateral, default probability, and internal credit risk ratings.
Valuation techniques are calibrated on a regular basis and tested for validity using prices from observable current market transactions in the same
instrument, without modification or repackaging, or are based on any available observable market data.
The fair value of a loan reflects both loan impairments at the balance sheet date and estimates of market participants’ expectations of credit losses over
the life of the loans, and the fair value impact of repricing between origination and the balance sheet date. For impaired loans, fair value is estimated by
discounting the future cash flows over the time period they are expected to be recovered.
The calculation of fair values of financial instruments that are not carried at fair value is described below.
The calculation of fair value incorporates the Group’s estimate of the price that would be received to sell an asset or paid to transfer a liability in an
orderly transaction between market participants at the measurement date. It does not reflect the economic benefits and costs that the Group expects to
flow from the instruments’ cash flows over their expected future lives.
The fair value of loans and advances is based on observable market transactions, where available. In the absence of observable market transactions, fair
value is estimated using valuation models that incorporate a range of input assumptions. These assumptions may include value estimates from third
party brokers which reflect over-the-counter trading activity; forward looking discounted cash flow models using assumptions which the Group believes
are consistent with those which would be used by market participants in valuing such loans; and trading inputs from other market participants which
includes observed primary and secondary trades.
The fair values of listed financial investments are determined using bid market prices. The fair values of unlisted financial investments are determined
using valuation techniques that take into consideration the prices and future earnings streams of equivalent quoted securities.
For the purpose of estimating fair value, deposits by banks and customer accounts are grouped by remaining contractual maturity. Fair values are
estimated using discounted cash flows, applying current rates offered for deposits of similar remaining maturities. The fair value of a deposit repayable
on demand is assumed to be the amount payable on demand at the balance sheet date.
86

NOTES ON THE CONDENSED CONSOLIDATED FINANCIAL STATEMENTS (unaudited) (continued)
41 Fair value of financial instruments (continued)
(b) Fair value of financial instruments not carried at fair value (continued)
(iv) Debt securities in issue and subordinated liabilities
Assets
Cash and sight balances at central banks
Items in the course of collection from other banks
Acceptances and Endorsements
Short-term receivables within "Other assets"
Liabilities
Items in the course of transmission to other banks
Acceptances and Endorsements
Short-term payables within "Other liabilities"
Accruals
The fair values in this note are stated at a specific date and may be significantly different from the amounts which will actually be paid on the maturity
or settlement dates of the instruments. In many cases, it would not be possible to realise immediately the estimated fair values given the size of the
portfolios measured. Accordingly, these fair values do not represent the value of these financial instruments to the Group as a going concern.
The following table lists financial instruments for which their carrying amounts are reasonable approximations of their fair values because, for
example, they are short-term in nature or reprice to current market rates frequently:
Fair values are determined using quoted market prices at the balance sheet date where available, or by reference to quoted market prices for similar
instruments.
87

NOTES ON THE CONDENSED CONSOLIDATED FINANCIAL STATEMENTS (unaudited) (continued)
42 Condensed consolidated financial statements and statutory financial statements
43 Major transaction – Partial disposal of the Bank’s shareholding in Industrial Bank
As Reported
Variance Variance Variance
against against against
Half-year Half-year half year Half-year half year half year
ended ended ended ended ended Half-year ended
30 June 30 June 30 June 31 December 31 December ended 30 30 June
2016 2015 2015 * 2015 2015 * June 2015 2015 *
Attributable profit 8,005 20,048 -60% 7,446 +8% 9,412 -15%
Profit before tax 9,499 21,720 -56% 8,768 +8% 11,084 -14%
Return on average ordinary
shareholders' equity (%) 12.4 31.0 -18.6pp 10.6 +1.8pp 14.5 -2.1pp
Return on average total
assets (%) 1.2 3.1 -1.9pp 1.1 +0.1pp 1.5 -0.3pp
Earnings per share (HK$) 4.19 10.49 -60% 3.73 +12% 4.92 -15%
*Change in "pp" represents change in percentage points.
Excluding the gain on
partial disposal of
Industrial Bank in the first
half of 2015
Since there are significant financial implications as a result of the recognition of the gain on partial disposal in the condensed consolidated income
statement for the first half of 2015, the key financial results and performance metrics for the first half of 2016 are not directly comparable. For
comparison, we have prepared the following key financial results and performance metrics by excluding the partial disposal gain in the first half of
2015.
The financial information relating to the year ended 31 December 2015 that is included in these condensed consolidated financial statements does not
constitute the Bank's statutory financial statements for that year but is extracted from those financial statements which have been delivered to the
Registrar of Companies as required by section 662(3) of, and Part 3 of Schedule 6 to, the Hong Kong Companies Ordinance (Cap. 622) and to the
Hong Kong Monetary Authority.
The auditor has reported on those financial statements. The auditor's report was unqualified; did not include a reference to any matters to which the
auditor drew attention by way of emphasis without qualifying its report; and did not contain a statement under sections 406(2), 407(2) or (3) of the
Hong Kong Companies Ordinance (Cap. 622).
The Annual Report for the year ended 31 December 2015, which includes the statutory financial statements, can be obtained on request from the
Company Secretarial Services Department, Level 10, 83 Des Voeux Road Central, Hong Kong; or from the Bank's website www.hangseng.com.
During the first half of 2015, the Bank has sold 9.99% (representing 1,903,316,838 ordinary shares) of its shareholding of the ordinary shares of
Industrial Bank Co., Ltd. (‘Industrial Bank’), and recognised a gain of HK$10,636m for the first half of 2015.
88

NOTES ON THE CONDENSED CONSOLIDATED FINANCIAL STATEMENTS (unaudited) (continued)
44 Property revaluation
45 Immediate and ultimate holding companies
46 Comparative figures
Certain comparative figures have been adjusted to conform with the current period’s presentation.
The immediate and ultimate holding companies of the Bank are The Hongkong and Shanghai Banking Corporation Limited (incorporated in Hong
Kong) and HSBC Holdings plc (incorporated in England) respectively.
The Group’s premises and investment properties were revalued at 30 June 2016 by DTZ Debenham Tie Leung Limited. The valuation was carried out
by qualified persons who are members of the Hong Kong Institute of Surveyors. The basis of the valuation of property was market value which is
consistent with the definition of fair value under HKFRS 13 "Fair Value Measurement" and takes into account the highest and best use of the property
from the perspective of market participants. The highest and best use takes into account the use of the property that is physically possible, legally
permissible and financially feasible as described in HKFRS 13. The net revaluation surplus for Group premises amounted to HK$277m was credited
to the premises revaluation reserve. The related deferred tax provision for Group premises was HK$47m. Excluding the fair value gain on properties
backing insurance contracts, revaluation defict of HK$77m on investment properties were recognised through the condensed consolidated income
statement.
89

90
REPORT ON REVIEW OF CONDENSED CONSOLIDATED FINANCIAL STATEMENTS TO THE BOARD OF DIRECTORS OF HANG SENG BANK LIMITED (incorporated in Hong Kong with limited liability) Introduction We have reviewed the condensed consolidated financial statements set out on pages 45 to 89, which comprises the condensed consolidated balance sheet of Hang Seng Bank Limited (the “Bank”) and its subsidiaries (together, the “Group”) as at 30 June 2016 and the related condensed consolidated income statement, condensed consolidated statement of comprehensive income, condensed consolidated statement of changes in equity and condensed consolidated cash flows statement for the six-month period then ended, and a summary of significant accounting policies and other explanatory notes. The Rules Governing the Listing of Securities on The Stock Exchange of Hong Kong Limited require the preparation of a report on condensed consolidated financial statements to be in compliance with the relevant provisions thereof and Hong Kong Accounting Standard 34 “Interim Financial Reporting” issued by the Hong Kong Institute of Certified Public Accountants. The directors of the Bank are responsible for the preparation and presentation of these condensed consolidated financial statements in accordance with Hong Kong Accounting Standard 34 “Interim Financial Reporting”. Our responsibility is to express a conclusion on these condensed consolidated financial statements based on our review and to report our conclusion solely to you, as a body, in accordance with our agreed terms of engagement and for no other purpose. We do not assume responsibility towards or accept liability to any other person for the contents of this report. Scope of Review We conducted our review in accordance with Hong Kong Standard on Review Engagements 2410, “Review of Interim Financial Information Performed by the Independent Auditor of the Entity” issued by the Hong Kong Institute of Certified Public Accountants. A review of condensed consolidated financial statements consists of making inquiries, primarily of persons responsible for financial and accounting matters, and applying analytical and other review procedures. A review is substantially less in scope than an audit conducted in accordance with Hong Kong Standards on Auditing and consequently does not enable us to obtain assurance that we would become aware of all significant matters that might be identified in an audit. Accordingly, we do not express an audit opinion. Conclusion Based on our review, nothing has come to our attention that causes us to believe that the condensed consolidated financial statements are not prepared, in all material respects, in accordance with Hong Kong Accounting Standard 34 “Interim Financial Reporting”. PricewaterhouseCoopers Certified Public Accountants Hong Kong, 3 August 2016

SUPPLEMENTARY NOTES ON THE CONDENSED CONSOLIDATED FINANCIAL STATEMENTS (unaudited)
1 Basis of preparation
(a)
(b)
2 Disclosure for selected exposures
Involvement with Special Purpose Entities ("SPEs")
3
Individually Collectively Advances
assessed loan assessed loan New written off
Gross Overdue Impaired impairment impairment impairment during
advances advances advances allowances allowances allowances the period
At 30 June 2016
Residential mortgages 181,659 119 184 (4) (3) - -
Commercial, industrial and international trade 154,366 1,987 2,836 (871) (541) 432 220
Commercial real estate 82,241 208 21 (1) (4) 1 -
Other property-related lending 134,853 100 397 (6) (13) 6 -
At 30 June 2015
Residential mortgages 174,634 134 192 (10) (3) 4 -
Commercial, industrial and international trade 155,333 1,748 2,206 (1,193) (589) 460 54
Commercial real estate 85,971 39 66 - (3) 1 -
Other property-related lending 130,301 1 189 (1) (18) 3 -
At 31 December 2015
Residential mortgages 181,461 112 177 (10) (4) 4 -
Commercial, industrial and international trade 164,391 1,671 1,970 (787) (536) 855 670
Commercial real estate 86,006 208 50 (1) (3) 2 1
Other property-related lending 134,486 - 284 - (14) 3 -
These notes set out on pages 91 to 93 are supplementary to and should be read in conjunction with the condensed consolidated financial statements set out on pages
45 to 89. The condensed consolidated financial statements and these supplementary notes taken together comply with the Banking (Disclosure) Rules ("Disclosure
Rules") made under section 60A of the Banking Ordinance.
Except where indicated otherwise, the financial information contained in these supplementary notes has been prepared on a consolidated basis in
accordance with Hong Kong Financial Reporting Standards.
The accounting policies applied in preparing these supplementary notes are the same as those applied in preparing the condensed consolidated financial
statements for the period ended 30 June 2016 as set out in note 2 on the condensed consolidated financial statements.
Analysis of gross loans and advances to customers by categories based on internal classification used by the Group
Gross advances, overdue advances, impaired advances, individually assessed and collectively assessed loan impairment allowances, the amount of new
impairment allowances charged to condensed consolidated income statement, and the amount of impaired loans and advances written off during the year in
respect of industry sectors which constitute not less than 10 per cent of gross loans and advances to customers are analysed as follows:
From time to time, the Group enters into certain transactions with customers in the ordinary course of business which involve the establishment of SPEs. The
use of SPEs is not a significant part of the Group’s activities and the Group is not reliant on SPEs for any material part of its business operations or
profitability.
91

SUPPLEMENTARY NOTES ON THE CONDENSED CONSOLIDATED FINANCIAL STATEMENTS (unaudited) (continued)
4 Mainland activities exposures
On-balance Off-balance
sheet sheet Total
exposure exposure exposures
At 30 June 2016
Types of Counterparties
1. Central government, central government-owned entities
and their subsidiaries and joint ventures (JVs) 51,427 8,727 60,154
2. Local governments, local government-owned entities
and their subsidiaries and JVs 19,163 5,743 24,906
3. PRC nationals residing in Mainland China or other entities
incorporated in Mainland China and their subsidiaries and JVs 54,708 22,420 77,128
4. Other entities of central government not reported in item 1 above 4,307 1,585 5,892
5. Other entities of local governments not reported in item 2 above 2,702 130 2,832
6. PRC nationals residing outside Mainland China or
entities incorporated outside Mainland China where
the credit is granted for use in Mainland China 49,373 2,372 51,745
7. Other counterparties where the exposures are considered by
the reporting institution to be non-bank Mainland China exposures 12,107 788 12,895
Total 193,787 41,765 235,552
Total assets after provision 1,209,897
On-balance sheet exposures as
percentage of total assets 16.02%
At 30 June 2015
Types of Counterparties
1. Central government, central government-owned entities
and their subsidiaries and joint ventures (JVs) 57,942 7,418 65,360
2. Local governments, local government-owned entities
and their subsidiaries and JVs 25,764 4,986 30,750
3. PRC nationals residing in Mainland China or other entities
incorporated in Mainland China and their subsidiaries and JVs 54,580 20,176 74,756
4. Other entities of central government not reported in item 1 above 3,991 756 4,747
5. Other entities of local governments not reported in item 2 above 3,530 690 4,220
6. PRC nationals residing outside Mainland China or
entities incorporated outside Mainland China where
the credit is granted for use in Mainland China 42,672 1,658 44,330
7. Other counterparties where the exposures are considered by
the reporting institution to be non-bank Mainland China exposures 8,914 10 8,924
Total 197,393 35,694 233,087
Total assets after provision 1,232,737
On-balance sheet exposures as
percentage of total assets 16.01%
At 31 December 2015
Types of Counterparties
1. Central government, central government-owned entities
and their subsidiaries and joint ventures (JVs) 48,144 9,643 57,787
2. Local governments, local government-owned entities
and their subsidiaries and JVs 26,278 5,002 31,280
3. PRC nationals residing in Mainland China or other entities
incorporated in Mainland China and their subsidiaries and JVs 60,665 21,172 81,837
4. Other entities of central government not reported in item 1 above 3,514 1,513 5,027
5. Other entities of local governments not reported in item 2 above 4,486 168 4,654
6. PRC nationals residing outside Mainland China or
entities incorporated outside Mainland China where
the credit is granted for use in Mainland China 48,518 3,158 51,676
7. Other counterparties where the exposures are considered by
the reporting institution to be non-bank Mainland China exposures 10,611 24 10,635
Total 202,216 40,680 242,896
Total assets after provision 1,231,738
On-balance sheet exposures as
percentage of total assets 16.42%
The analysis of mainland activities exposures is based on the categories of non-bank counterparties and the type of direct exposures defined by the Hong
Kong Monetary Authority ("HKMA") under the Banking (Disclosure) Rules with reference to the HKMA Return of Mainland activities - (MA(BS)20). This
includes the mainland activities exposures extended by the Bank's Hong Kong offices and its wholly owned banking subsidiary in mainland China.
92

SUPPLEMENTARY NOTES ON THE CONDENSED CONSOLIDATED FINANCIAL STATEMENTS (unaudited) (continued)
5 International claims
Non Bank Non-Financial
Official Financial Private
Banks Sector Institution Sector Others Total
As at 30 June 2016
Developed countries 59,937 84,288 13,518 35,810 - 193,553
Offshore centres 10,162 1,516 13,412 107,265 - 132,355
of which : Hong Kong SAR 3,204 1,381 4,739 80,368 89,692
Developing Asia and Pacific 68,517 12,265 6,351 52,388 - 139,521
of which : China 43,750 12,211 5,087 47,909 - 108,957
As at 30 June 2015
Developed countries 60,524 55,036 8,696 34,322 - 158,578
Offshore centres 34,870 5,626 12,175 109,219 - 161,890
of which : Hong Kong SAR 20,097 1,289 5,049 85,124 - 111,559
Developing Asia and Pacific 92,368 12,651 7,552 50,557 - 163,128
of which : China 60,936 12,593 6,271 43,528 - 123,328
At 31 December 2015
Developed countries 74,451 91,609 12,047 39,007 - 217,114
Offshore centres 16,110 2,244 12,924 112,334 - 143,612
of which : Hong Kong SAR 2,589 1,353 3,728 87,461 - 95,131
Developing Asia and Pacific 82,746 10,675 6,425 53,685 - 153,531
of which : China 54,388 10,619 5,177 46,620 - 116,804
The Group’s country risk exposures in the table below are prepared in accordance with the Hong Kong Monetary Authority's (HKMA) Return of
International Banking Statistics - (MA(BS)21) guidelines. International claims are on-balance sheet exposures to counterparties based on the location
of the counterparties after taking into account the transfer of risk, and represent the sum of cross-border claims in all currencies and local claims in
foreign currencies.
The table shows claims on individual countries and territories or areas, after recognised risk transfer, amounting to not less than 10% of the group’s
total international claims.
93

94
ADDITIONAL INFORMATION
The Code for Securities Transactions by Directors The Bank has adopted a Code for Securities Transactions by Directors on terms no less exacting than
the required standards as set out in the Model Code for Securities Transactions by Directors of Listed
Issuers (as set out in Appendix 10 to the Rules Governing the Listing of Securities on The Stock
Exchange of Hong Kong Limited (“Listing Rules”)). Specific enquiries have been made with all
Directors who have confirmed that they have complied with the Bank’s Code for Securities
Transactions by Directors throughout the six months ended 30 June 2016.
Changes in Directors’ Details Changes in Directors’ details since the date of the Annual Report 2015 of the Bank and up to the date
of release of the interim results of the Bank which are required to be disclosed pursuant to Rule
13.51(2) and Rule 13.51B(1) of the Listing Rules, are set out below.
Dr Raymond CH’IEN Kuo Fung GBS, CBE, JP
Cessation of appointment
University of Pennsylvania, USA (Trustee)
Ms Rose LEE Wai Mun JP
New appointment
The Community Chest of Hong Kong (Deputy Chairman of Executive Committee)
Cessation of appointments
The Community Chest of Hong Kong (Second Vice President; Chairman of Campaign Committee;
Member of Executive Committee)
Mr Nixon CHAN Lik Sang
Re-designation
Hang Seng Bank Limited( 1 ) (Non-executive Director)
Cessation of appointments
Employers’ Federation of Hong Kong (Elected Member of General Committee; Chairman of
Banking and Financial Services Group)
EPS Company (Hong Kong) Limited (Director)
Hang Seng Bank Limited( 1 ) (Head of Retail Banking and Wealth Management; Member of
Executive Committee)
Hang Seng Bank (Trustee) Limited (Director)
Hang Seng Credit Limited (Director)
Hang Seng Finance Limited (Director)
Hang Seng Futures Limited (Director)
Hang Seng Indexes Company Limited (Member of Hang Seng Index Advisory Committee)
Hang Seng Insurance Company Limited (Director)
Hang Seng Management College (Governor)
Hang Seng School of Commerce (Director)
Hang Seng Securities Limited (Director)
Hang Seng Security Management Limited (Director)
Haseba Investment Company Limited (Director)
TransUnion Limited (Director)

95
Mr Patrick CHAN Kwok Wai
New appointments
Hang Seng Bank (China) Limited (Non-executive Director; Member of Executive Committee)
Cessation of appointment
The Community Chest of Hong Kong (Board Member)
Mr Andrew FUNG Hau Chung JP
Cessation of appointment
Securities and Futures Commission (Member of Products Advisory Committee)
Dr HU Zuliu, Fred
Cessation of appointment
Armada Holdings Limited( 1 ) (formerly known as “SCMP Group Limited”) (Independent Non-
executive Director)
Ms Irene LEE Yun Lien
New appointments
The Hongkong and Shanghai Banking Corporation Limited (Chairman of Audit Committee;
Member of Risk Committee)
Mr Kenneth NG Sing Yip
Cessation of appointments
The Hongkong and Shanghai Banking Corporation Limited (General Counsel, Asia Pacific)
The Law Society of Hong Kong (Council Member)
Mr Peter WONG Tung Shun JP
New appointment
Hong Kong General Chamber of Commerce (Vice Chairman)
Mr Michael WU Wei Kuo
Cessation of appointments
The Community Chest of Hong Kong (Board Member; Member of Executive Committee)
Notes:
(1) The securities of these companies are listed on a securities market in Kong Kong or overseas.
(2) Updated biographical details of the Bank’s Directors are also available on the website of the
Bank.
Other than those disclosed above, there is no other information required to be disclosed pursuant to
Rule 13.51B(1) of the Listing Rules.

96
Directors’ and Alternate Chief Executives’ Interests As at 30 June 2016, the interests of the Directors and Alternate Chief Executives in the shares,
underlying shares of equity derivatives and debentures of the Bank and its associated corporations (all
within the meaning of Part XV of the Securities and Futures Ordinance (“SFO”)) disclosed in
accordance with the Listing Rules were detailed below.
Interests in shares
Personal
Interests
(held as
beneficial
owner)
Family
Interests
(interests
of spouse
or child
under 18)
Corporate
Interests
(interests of
controlled
corporation)
Other
Interests
Total
Interests
Total
Interests
as % of
the
relevant
shares in
issue/
issued
share
capital
Number of ordinary shares
in the Bank
Director:
Dr John C C Chan 1,000(1) - - - 1,000 0.00
Number of ordinary shares
of US$0.50 each in HSBC
Holdings plc
Directors:
Dr Raymond K F Ch’ien 57,814 - - - 57,814 0.00
Ms Rose W M Lee 432,635 1,668 - 184,282(3) 618,585 0.00
Dr John C C Chan 24,605(1) - - - 24,605 0.00
Mr Nixon L S Chan 115,556 - - 32,096(3) 147,652 0.00
Mr Patrick K W Chan 89,783 - - - 89,783 0.00
Mr Andrew H C Fung 123,327 - - 32,757(3) 156,084 0.00
Ms Irene Y L Lee 10,000 - - - 10,000 0.00
Ms Sarah C Legg 217,358 2,695 - 100,620(3) 320,673 0.00
Dr Eric K C Li - 52,132 - - 52,132 0.00
Mr Kenneth S Y Ng 402,113 - - 37,581(3) 439,694 0.00
Mr Peter T S Wong 875,382 22,079 - 2,269,993(3) 3,167,454 0.02
Alternate Chief
Executives:
Mrs Eunice L C Y Chan 17,459 - - 13,045(3) 30,504 0.00
Mr Donald Y S Lam 78,520 - - 17,945(3) 96,465 0.00
Mr Andrew W L Leung 30,744 - - 21,983(3) 52,727 0.00
Number of perpetual non-
cumulative preference
shares of US$0.01 each
in HSBC Holdings plc
Director:
Ms Rose W M Lee - 131,000(2) - 75,075(2) 206,075 0.14

97
Interests in debentures of associated corporation of the Bank
Name of
debenture
Name of
Director
Personal
Interests
(held as
beneficial
owner)
Family
Interests
(interests
of spouse
or child
under 18)
Corporate
Interests
(interests of
controlled
corporation)
Other
Interests
Total
Interests
8.00%
perpetual
subordinated
capital
securities,
series 2
issued by
HSBC
Holdings plc
Ms Rose
W M
Lee
- US$
3,275,000(2)
- US$
1,876,875(2)
US$
5,151,875
Notes:
(1) 1,000 shares in the Bank and 4,371 shares in HSBC Holdings plc were jointly held by Dr John C
C Chan and his wife.
(2) Ms Rose W M Lee was a beneficiary of a trust, which had interests in the total principal amount of
US$1,876,875 of the 8.00% perpetual subordinated capital securities, series 2. Her spouse also had
interests in the total principal amount of US$3,275,000 of the 8.00% perpetual subordinated
capital securities, series 2. These perpetual subordinated capital securities were exchangeable at
the option of HSBC Holdings plc to 75,075 and 131,000 perpetual non-cumulative preference
shares respectively of US$0.01 each in HSBC Holdings plc. Ms Lee’s interests set out in the table
under “Interests in shares” and the table under “Interests in debentures of associated corporation of
the Bank” represented the same interests.
(3) These included interests in conditional awards of ordinary shares of US$0.50 each in HSBC
Holdings plc under the HSBC Share Plans made in favour of Directors and Alternate Chief
Executives.
Conditional Awards of Shares
As at 30 June 2016, the interests of the Directors and Alternate Chief Executives in the conditional
awards of ordinary shares of US$0.50 each in HSBC Holdings plc made in favour of them under
various HSBC Share Plans were as follows:
Awards
held as at
1 January 2016
Awards made
during
the Director’s/
Alternate
Chief Executive’s
term of office in
the first half of
the year
Awards released
during
the Director’s/
Alternate
Chief Executive’s
term of office in
the first half of
the year
Awards
held as at
30 June
2016
Directors:
Ms Rose W M Lee 137,241 123,320 83,532 184,282(1)
Mr Nixon L S Chan 26,216 44,445 40,018 32,096(1)
Mr Andrew H C Fung 29,723 42,855 41,369 32,757(1)
Ms Sarah C Legg 68,781 75,809 47,910 100,620(1)
Mr Kenneth S Y Ng 38,903 46,405 49,628 37,581(1)
Mr Peter T S Wong 1,222,917 330,451 338,746 1,260,724(1)

98
Awards
held as at
1 January 2016
Awards made
during
the Director’s/
Alternate
Chief Executive’s
term of office in
the first half of
the year
Awards released
during
the Director’s/
Alternate
Chief Executive’s
term of office in
the first half of
the year
Awards
held as at
30 June
2016
Alternate Chief
Executives:
Mrs Eunice L C Y Chan 12,818(2) - - 13,045(1)
Mr Donald Y S Lam 12,635 26,666 22,126 17,945(1)
Mr Andrew W L Leung 11,318 36,840 27,033 21,983(1)
Note:
(1) This included additional shares arising from scrip dividends.
(2) This represented the awards held by Mrs Eunice L C Y Chan on 11 April 2016 when she was
appointed an Alternate Chief Executive of the Bank.
During the first half of 2016, Ms Sarah C Legg, Mrs Eunice L C Y Chan and Mr Donald Y S Lam also
acquired and were awarded ordinary shares of HSBC Holdings plc under the HSBC International
Employee Share Purchase Plan. Their interests in ordinary shares of HSBC Holdings plc under this
plan have been included in their “Personal Interests” disclosed in the table under “Interests in shares”.
All the interests stated above represented long positions. As at 30 June 2016, no short positions were
recorded in the Register of Directors’ and Alternate Chief Executives’ Interests and Short Positions
required to be kept under section 352 of the SFO.
Other than those disclosed above, no right to subscribe for equity or debt securities of the Bank has
been granted by the Bank to, nor have any such rights been exercised by, any person during the six
months ended 30 June 2016.
Substantial Interests in Share Capital The register maintained by the Bank pursuant to the SFO recorded that, as at 30 June 2016, the
following corporations had interests or short positions in the shares or underlying shares (as defined in
the SFO) in the Bank set opposite their respective names:
Name of Corporation
Number of Ordinary Shares
in the Bank
(Percentage of total)
The Hongkong and Shanghai Banking
Corporation Limited
1,188,057,371 (62.14%)
HSBC Asia Holdings BV 1,188,057,371 (62.14%)
HSBC Asia Holdings (UK) Limited 1,188,057,371 (62.14%)
HSBC Holdings BV 1,188,057,371 (62.14%)
HSBC Finance (Netherlands) 1,188,057,371 (62.14%)
HSBC Holdings plc 1,188,057,371 (62.14%)
The Hongkong and Shanghai Banking Corporation Limited is a wholly-owned subsidiary of HSBC
Asia Holdings BV, which is a wholly-owned subsidiary of HSBC Asia Holdings (UK) Limited, which
in turn is a wholly-owned subsidiary of HSBC Holdings BV. HSBC Holdings BV is a wholly-owned
subsidiary of HSBC Finance (Netherlands), which in turn is a wholly-owned subsidiary of HSBC
Holdings plc. Accordingly, the interests of The Hongkong and Shanghai Banking Corporation Limited

99
are recorded as the interests of HSBC Asia Holdings BV, HSBC Asia Holdings (UK) Limited, HSBC
Holdings BV, HSBC Finance (Netherlands) and HSBC Holdings plc.
The Directors regard HSBC Holdings plc to be the beneficial owner of 1,188,057,371 ordinary shares
in the Bank (62.14%).
All the interests stated above represented long positions. As at 30 June 2016, no short positions were
recorded in the Register of Interests in Shares and Short Positions required to be kept under section
336 of the SFO.
Purchase, Sale or Redemption of the Bank’s Listed Securities There was no purchase, sale or redemption by the Bank, or any of its subsidiaries, of the Bank’s listed
securities during the first half of 2016.
Remuneration and Staff Development There have been no material changes to the information disclosed in the Annual Report 2015 in
respect of the remuneration of employees, remuneration policies and staff development.
Corporate Governance Principles and Practices The Bank is committed to maintaining and upholding high standards of corporate governance with a
view to safeguarding the interests of shareholders, customers, employees and other stakeholders. The
Bank has followed the module on “Corporate Governance of Locally Incorporated Authorised
Institutions” under the Supervisory Policy Manual issued by the Hong Kong Monetary Authority. The
Bank has also fully complied with all the code provisions and most of the recommended best practices
set out in the Corporate Governance Code contained in Appendix 14 of the Listing Rules throughout
the six months ended 30 June 2016. The Bank also constantly reviews and enhances its corporate
governance framework to ensure that it is in line with international and local corporate governance
best practices.
The Audit Committee of the Bank has reviewed the results of the Bank for the six months ended 30
June 2016.
2016 Second Interim Dividend Announcement date 3 August 2016
Ex-dividend date 19 August 2016
Book close and record date 23 August 2016
Payment date 13 September 2016
Register of Shareholders The Register of Shareholders of the Bank will be closed on Tuesday, 23 August 2016, during which
no transfer of shares can be registered. To qualify for the second interim dividend, all transfers,
accompanied by the relevant share certificates, must be lodged with the Bank’s Registrar,
Computershare Hong Kong Investor Services Limited, at Shops 1712-1716, 17th Floor, Hopewell
Centre, 183 Queen’s Road East, Wanchai, Hong Kong, for registration not later than 4:30 pm on
Monday, 22 August 2016.

100
Board and Committees
Board
Independent Non-executive Chairman
Raymond CH’IEN Kuo Fung
Executive Directors
Rose LEE Wai Mun (Vice-Chairman and Chief Executive)
Patrick CHAN Kwok Wai
Andrew FUNG Hau Chung
Non-executive Directors
Nixon CHAN Lik Sang
Sarah Catherine LEGG
Vincent LO Hong Sui
Kenneth NG Sing Yip
Peter WONG Tung Shun
Independent Non-executive Directors
John CHAN Cho Chak
Henry CHENG Kar Shun
CHIANG Lai Yuen
HU Zuliu, Fred
Irene LEE Yun Lien
Eric LI Ka Cheung
Richard TANG Yat Sun
Michael WU Wei Kuo
Committees
Executive Committee
Rose LEE Wai Mun (Chairman)
Eunice CHAN
Ivy CHAN Shuk Pui
Patrick CHAN Kwok Wai
Walter CHEUNG Shu Wai
Andrew FUNG Hau Chung
Margaret KWAN Wing Han
Donald LAM Yin Shing
Gordon LAM Wai Chung
LEE Sai Kit
Andrew LEUNG Wing Lok
LI Chi Chung
Elaine WANG Yee Ning
Katie YIP Kay Chun
Audit Committee
Eric LI Ka Cheung (Chairman)
Irene LEE Yun Lien
Richard TANG Yat Sun
Michael WU Wei Kuo
Remuneration Committee
John CHAN Cho Chak (Chairman)
CHIANG Lai Yuen
Raymond CH’IEN Kuo Fung

101
Risk Committee
Irene LEE Yun Lien (Chairman)
HU Zuliu, Fred
Eric LI Ka Cheung
Nomination Committee
Raymond CH’IEN Kuo Fung (Chairman)
John CHAN Cho Chak
Rose LEE Wai Mun
Peter WONG Tung Shun
Michael WU Wei Kuo
Notes:
(1) Terms of Reference of the Bank’s Audit Committee, Remuneration Committee, Risk Committee
and Nomination Committee are available on the websites of the Bank and Hong Kong Exchanges
and Clearing Limited (“HKEx”).
(2) List of Directors identifying their role and function is available on the websites of the Bank and
HKEx.

102
Registered Office 83 Des Voeux Road Central, Hong Kong
Website: www.hangseng.com
Email: [email protected]
Stock Code The Stock Exchange of Hong Kong Limited: 11
Registrar Computershare Hong Kong Investor Services Limited
Shops 1712-1716, 17th Floor, Hopewell Centre
183 Queen’s Road East, Wanchai, Hong Kong
Depositary* BNY Mellon Shareowner Services
PO Box 30170
College Station, TX 77842-3170, USA
Telephone: 1-888-BNY-ADRS
Website: www.mybnymdr.com
Email: [email protected]
* The Bank offers investors in the United States a Sponsored Level-1 American Depositary Receipts
Programme through The Bank of New York Mellon Corporation.
Interim Report 2016 This Interim Report 2016 in both English and Chinese is now available in printed form and on the
Bank’s website (www.hangseng.com) and the website of HKEx (www.hkexnews.hk).
Shareholders who:
A) browse this Interim Report 2016 on the Bank’s website and wish to receive a printed copy; or
B) receive this Interim Report 2016 in either English or Chinese and wish to receive a printed copy in
the other language version,
may send a request form, which can be obtained from the Bank’s Registrar or downloaded from the
Bank’s website (www.hangseng.com) or HKEx’s website (www.hkexnews.hk), to the Bank’s
Registrar:
Computershare Hong Kong Investor Services Limited
17M Floor, Hopewell Centre
183 Queen’s Road East
Wanchai, Hong Kong
Facsimile: (852) 2529 6087
Email: [email protected]
If shareholders who have chosen (or deemed to have chosen) to read this Interim Report 2016 on the
Bank’s website have difficulty in reading or gaining access to this Interim Report 2016 via the Bank’s
website for any reason, the Bank will promptly send this Interim Report 2016 in printed form free of
charge upon the shareholders’ request.
Shareholders may change their choice of means of receipt or language of the Bank’s future corporate
communications at any time, free of charge, by giving the Bank c/o the Bank’s Registrar reasonable
notice in writing or by email to [email protected].