Interdisciplinary Workshop Case Study Valley Creek Watershed near Philadelphia, PA Claire Welty UMBC...
42
Interdisciplinary Workshop Case Study ley Creek Watershed near Philadelphia, Claire Welty UMBC (University of Maryland Baltimore County) Center for Urban Environmental Research and Education & Dept. of Civil and Environmental Engineering July 19, 2005
-
date post
21-Dec-2015 -
Category
Documents
-
view
215 -
download
2
Transcript of Interdisciplinary Workshop Case Study Valley Creek Watershed near Philadelphia, PA Claire Welty UMBC...
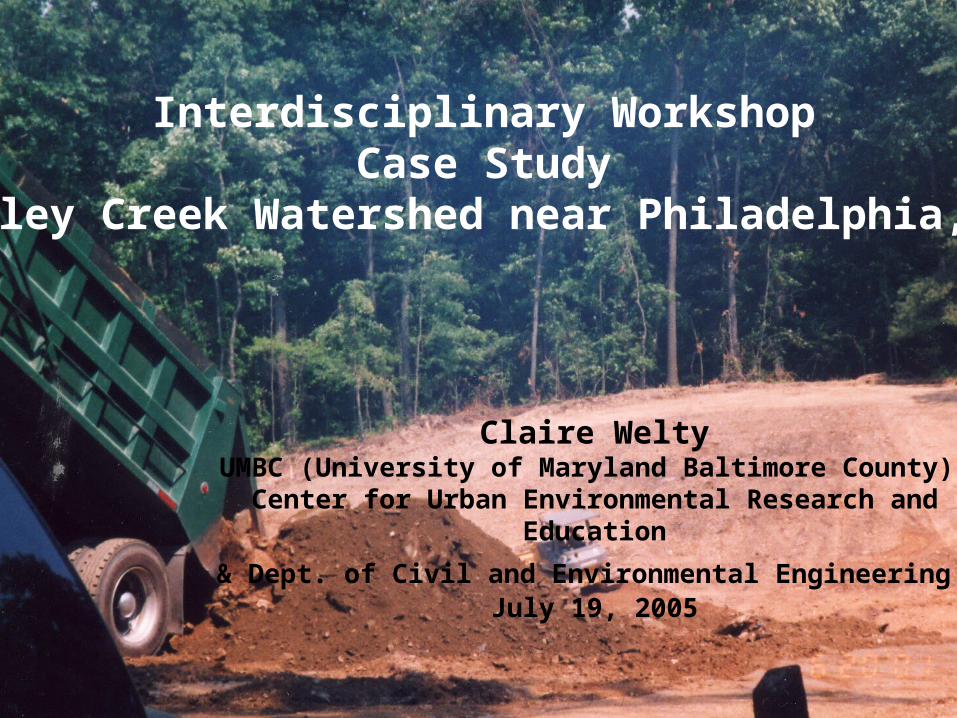
Interdisciplinary WorkshopCase Study
Valley Creek Watershed near Philadelphia, PA
Claire WeltyUMBC (University of Maryland Baltimore County)
Center for Urban Environmental Research and Education
& Dept. of Civil and Environmental Engineering July 19, 2005
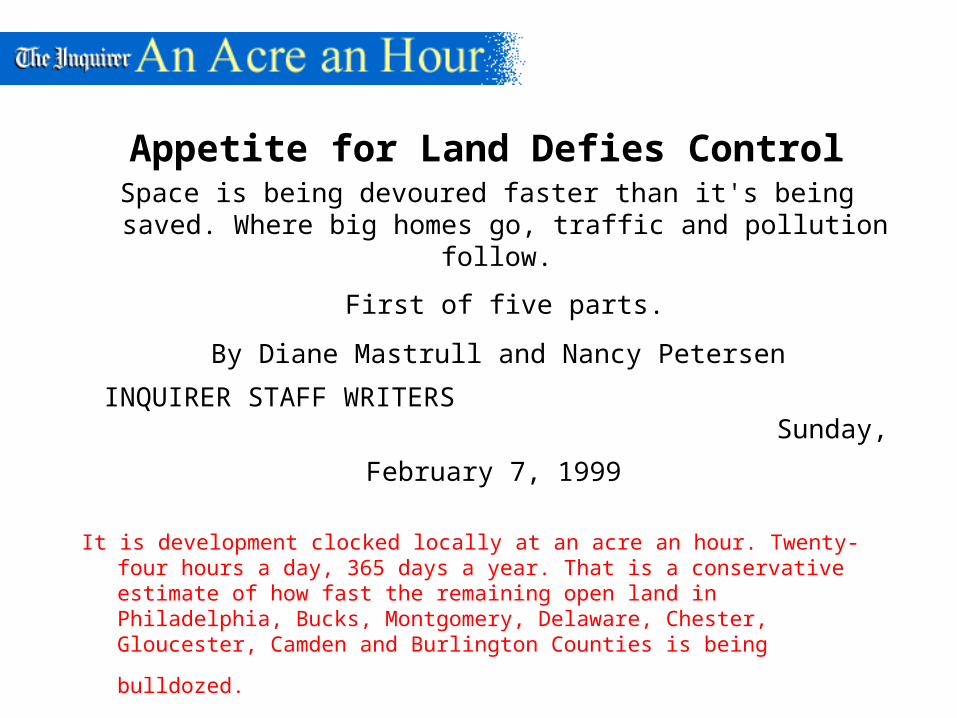
Appetite for Land Defies ControlSpace is being devoured faster than it's being saved. Where big
homes go, traffic and pollution follow.
First of five parts.
By Diane Mastrull and Nancy Petersen
INQUIRER STAFF WRITERS
Sunday, February 7, 1999
It is development clocked locally at an acre an hour. Twenty-four hours a day, 365 days a year. That is a conservative estimate of how fast the remaining open land in Philadelphia, Bucks, Montgomery, Delaware, Chester, Gloucester, Camden and
Burlington Counties is being bulldozed.
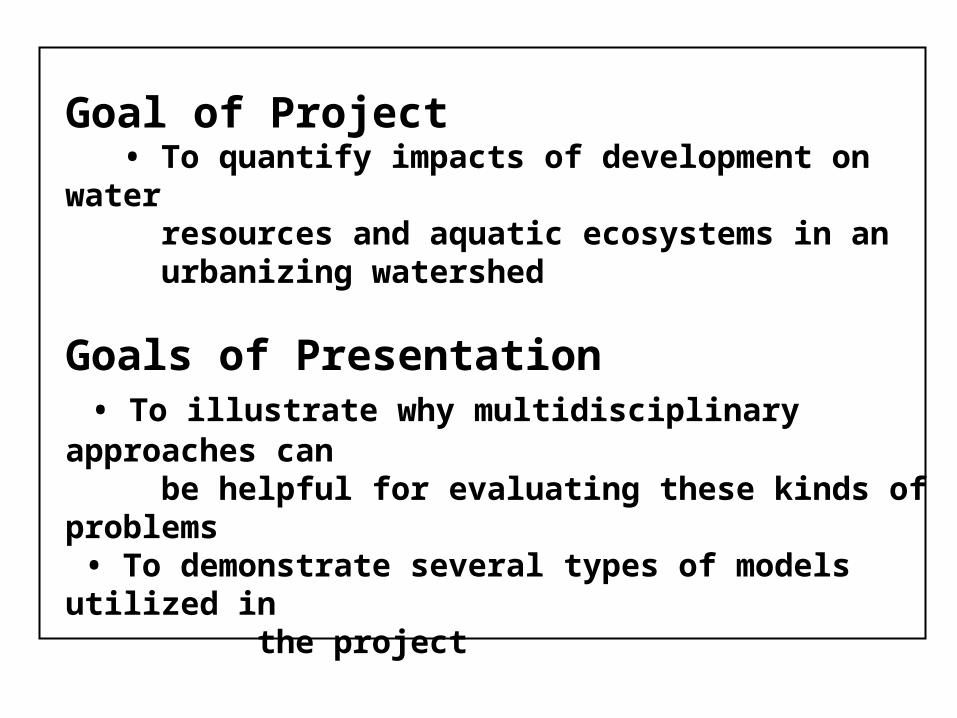
Goal of Project • To quantify impacts of development on water
resources and aquatic ecosystems in anurbanizing watershed
Goals of Presentation • To illustrate why multidisciplinary approaches can
be helpful for evaluating these kinds of problems • To demonstrate several types of models utilized in the project
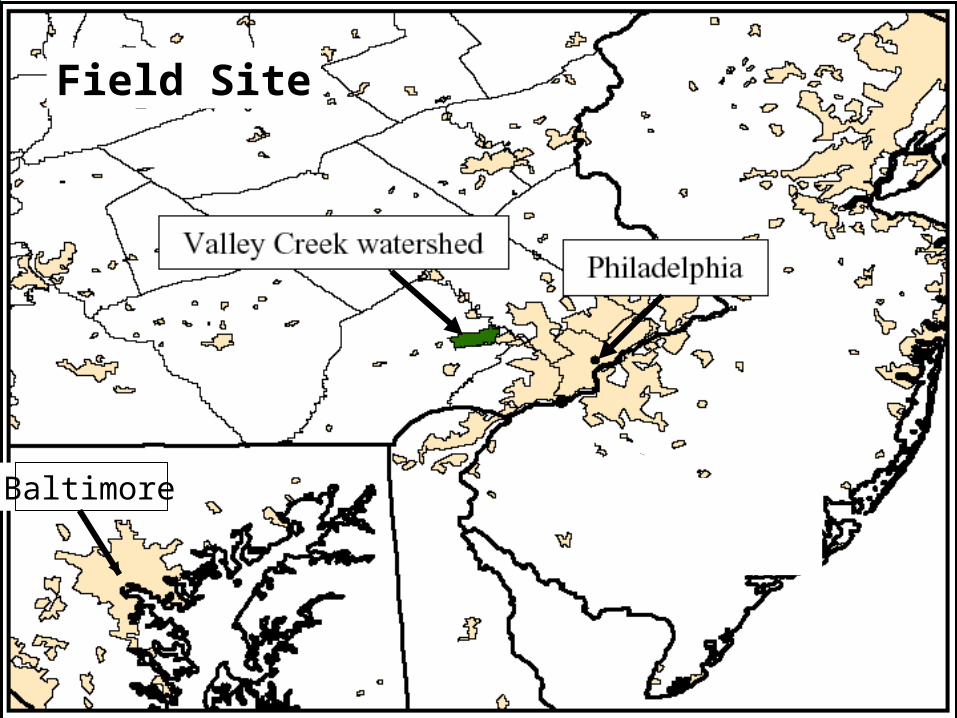
Baltimore
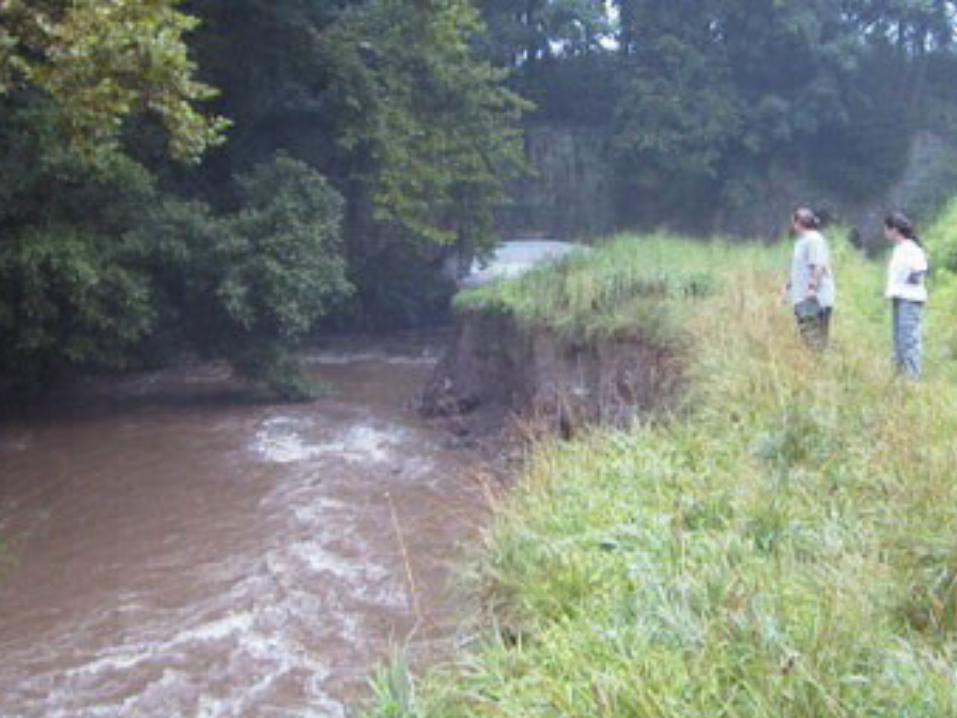
Field Site
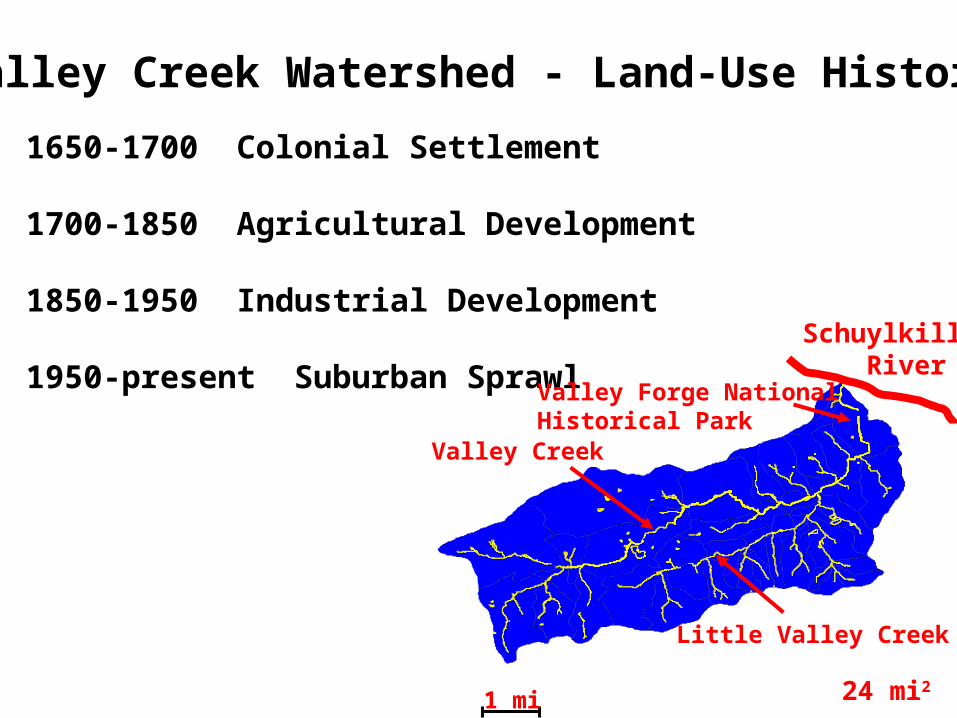
Valley Creek Watershed - Land-Use History
1650-1700 Colonial Settlement
1700-1850 Agricultural Development
1850-1950 Industrial Development
1950-present Suburban Sprawl
Valley Creek
Little Valley Creek
Valley Forge National Historical Park
Schuylkill River
1 mi 24 mi2
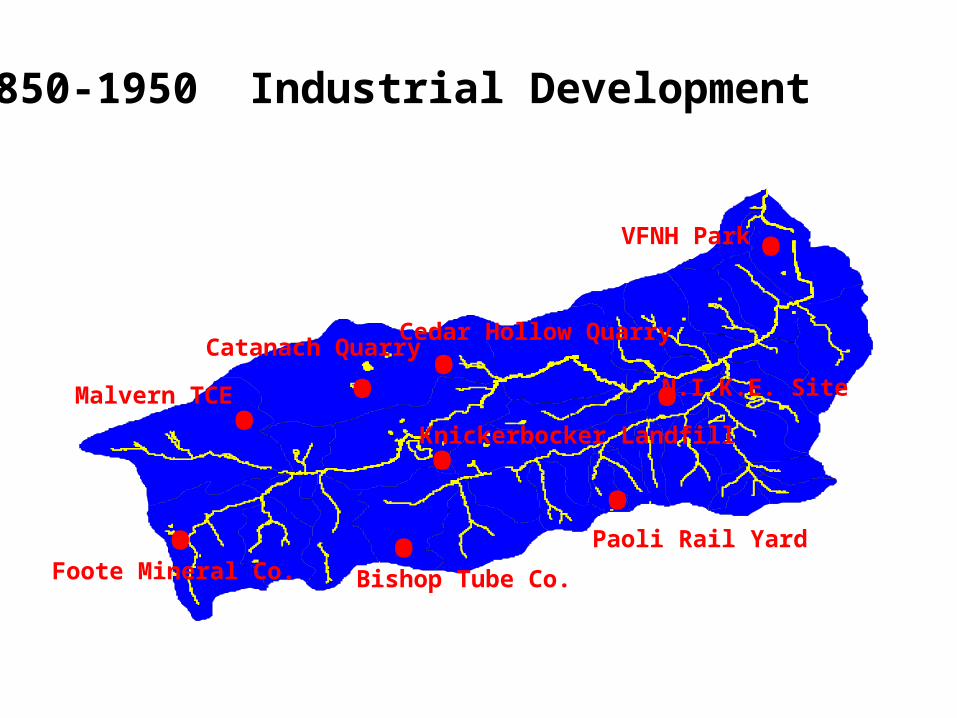
Paoli Rail Yard
• •
••
••
•
Bishop Tube Co.Foote Mineral Co.
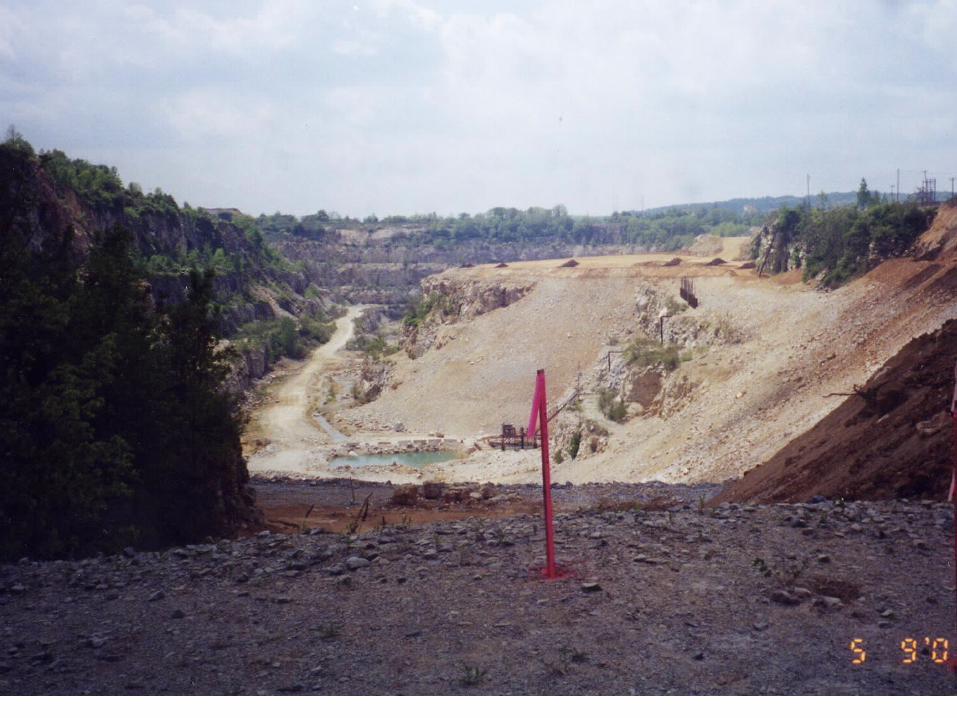
Cedar Hollow QuarryCatanach Quarry
Malvern TCE
Knickerbocker Landfill• N.I.K.E. Site
1850-1950 Industrial Development
VFNH Park •
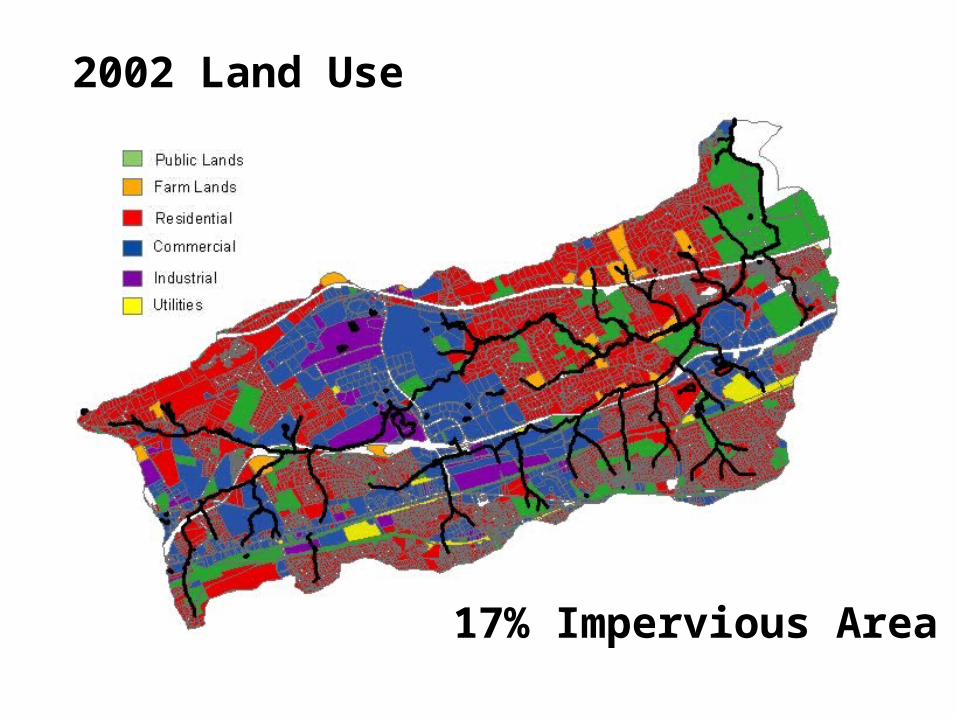
2002 Land Use
17% Impervious Area
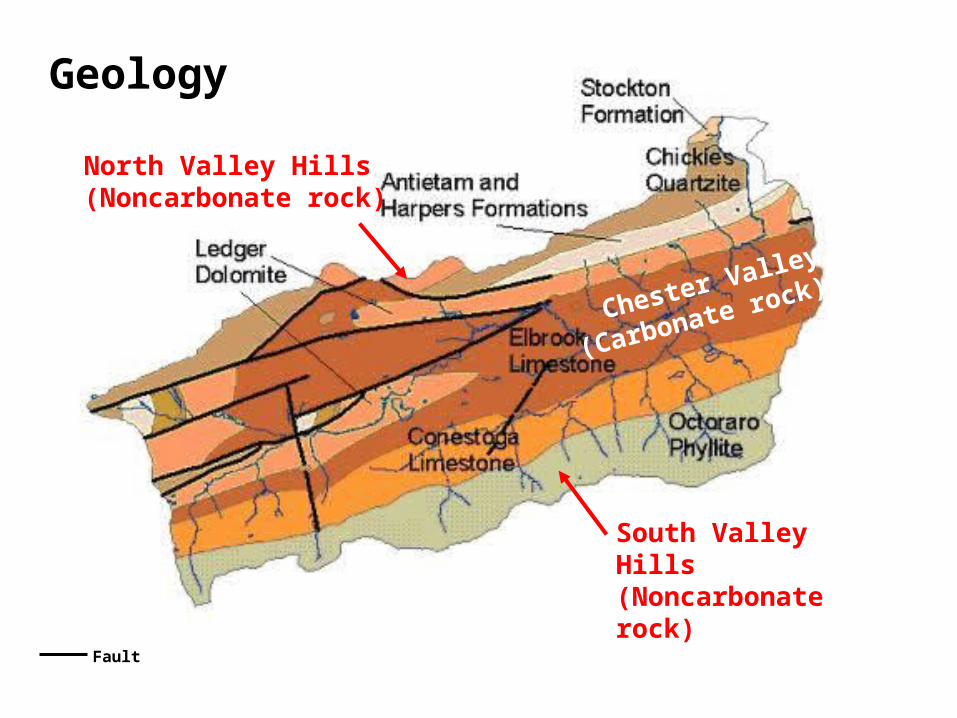
Geology
South Valley Hills(Noncarbonate rock)
Chester Valley
(Carbonate rock)
North Valley Hills(Noncarbonate rock)
Fault
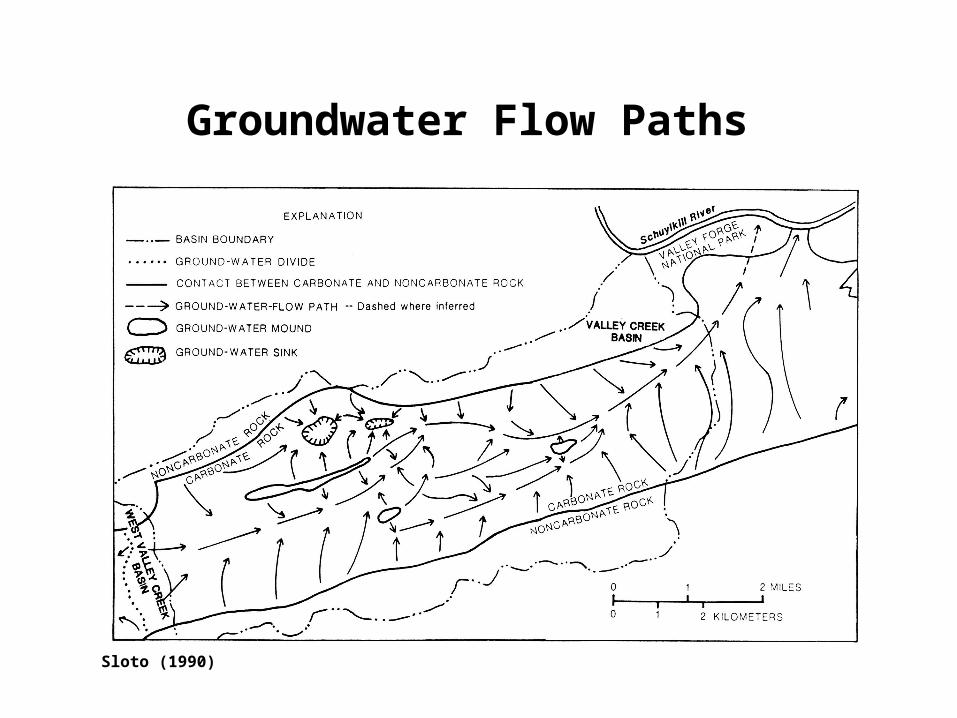
Groundwater Flow Paths
Sloto (1990)
•
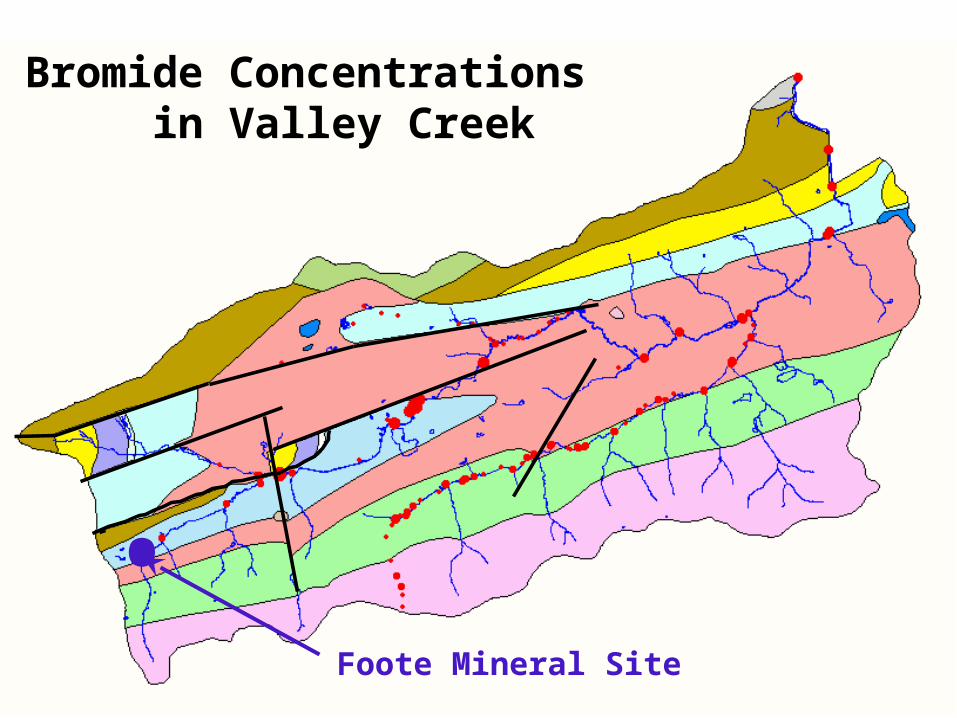
Bromide Concentrations in Valley Creek
Foote Mineral Site

•
USGS Gauge
Q (
cfs)
Quarry Trib

Hyporheic Zone
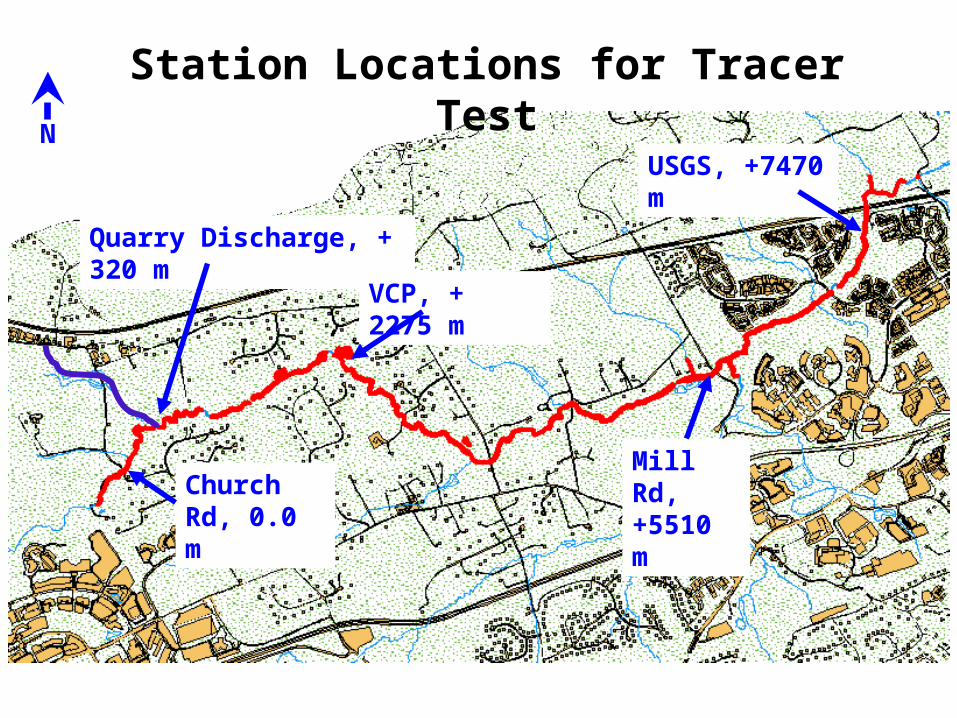
Church Rd, 0.0 m
Quarry Discharge, + 320 m
VCP, + 2275 m
Mill Rd, +5510 m
USGS, +7470 m
N
Station Locations for Tracer Test

Valley Creek Natural TracerAt Valley Creek Preserve
0.20
0.30
0.40
0.50
0.60
12:00 14:00 16:00 18:00 20:00 22:00 0:00 2:00 4:00 6:00 8:00 10:00 12:00 14:00
Time of Day
Br, mg/L
08/07/01 08/08/01
Quarry Tributary
Bromide Source
VCP
Mill Rd
USGS
•
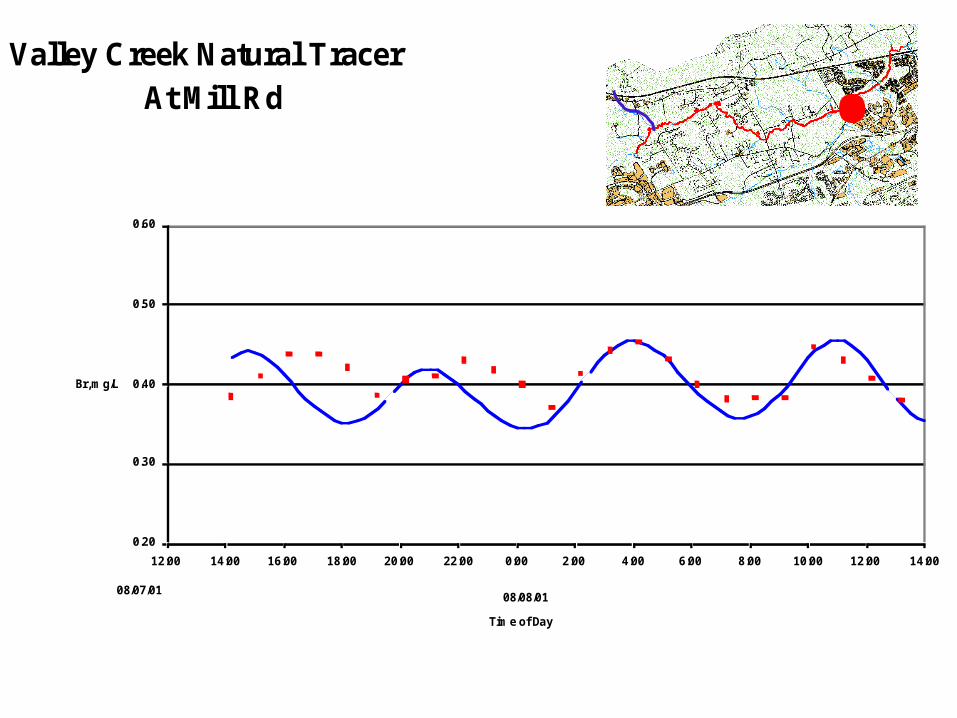
Valley Creek Natural TracerAt Mill Rd
0.20
0.30
0.40
0.50
0.60
12:00 14:00 16:00 18:00 20:00 22:00 0:00 2:00 4:00 6:00 8:00 10:00 12:00 14:00
Time of Day
Br, mg/L
08/07/0108/08/01
Quarry Tributary
Bromide Source
VCPMill Rd
USGS
•

Valley Creek Natural Tracer At Gauge Station
0.2
0.3
0.4
0.5
0.6
12:00 14:00 16:00 18:00 20:00 22:00 0:00 2:00 4:00 6:00 8:00 10:00 12:00 14:00
Time of Day
Br, mg/L
08/07/0108/08/01
Quarry Tributary
Bromide Source
VCPMill Rd
USGS•
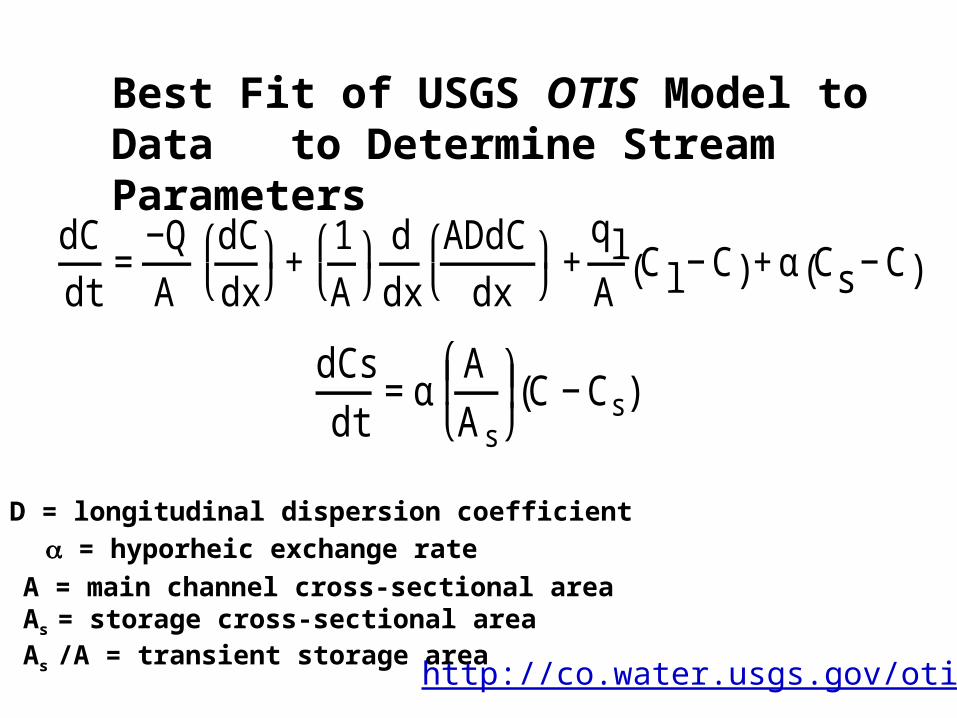
Best Fit of USGS OTIS Model to Data to Determine Stream Parameters
dCdt
=−QA
dCdx
⎛ ⎝
⎞ ⎠ +
1A
⎛ ⎝
⎞ ⎠
ddx
ADdCdx
⎛ ⎝
⎞ ⎠ +
qlA
Cl −C( )+α Cs−C( )
dCsdt
=αAAs
⎛
⎝ ⎜ ⎞
⎠ ⎟ C −Cs( )
D = longitudinal dispersion coefficient
= hyporheic exchange rate
A = main channel cross-sectional areaAs = storage cross-sectional areaAs /A = transient storage area
http://co.water.usgs.gov/otis/
REACH
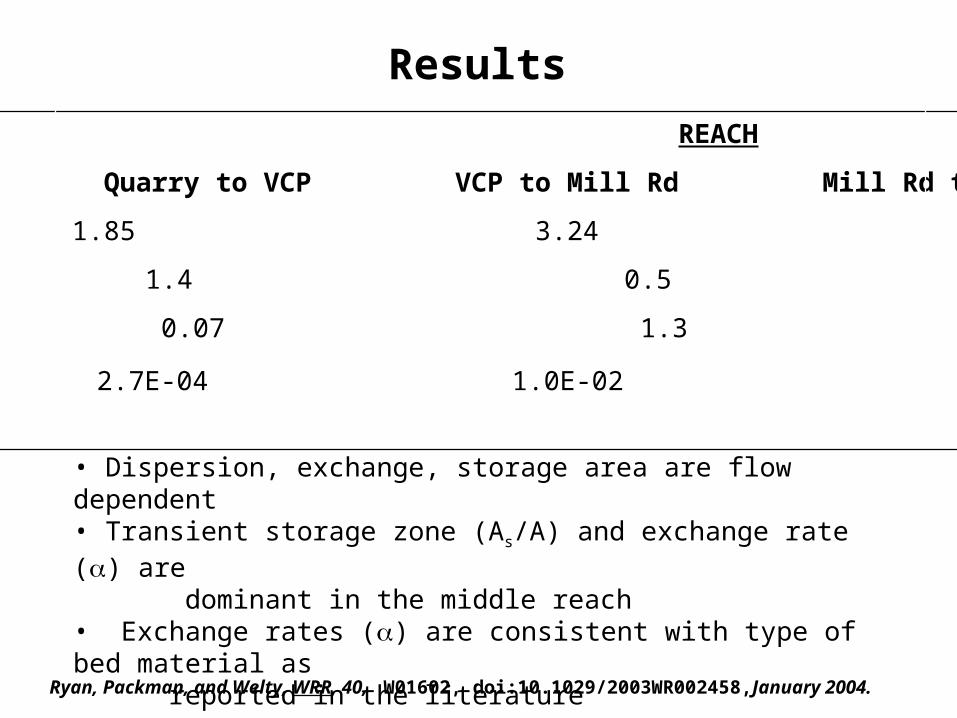
Quarry to VCP VCP to Mill Rd Mill Rd to USGS
Length, km 1.85 3.24 1.96
D, m2/s 1.4 0.5 0.7
As/A 0.07 1.3 0.03
, s-1 2.7E-04 1.0E-02 8.7E-06
Results
• Dispersion, exchange, storage area are flow dependent• Transient storage zone (As/A) and exchange rate () are dominant in the middle reach • Exchange rates () are consistent with type of bed material as
reported in the literature
Ryan, Packman, and Welty, WRR, 40, W01602, doi:10.1029/2003WR002458,January 2004.
••
••
••
•••
•••
••
•
7
1
2
3
45
6
8910
11 12
14
13
15
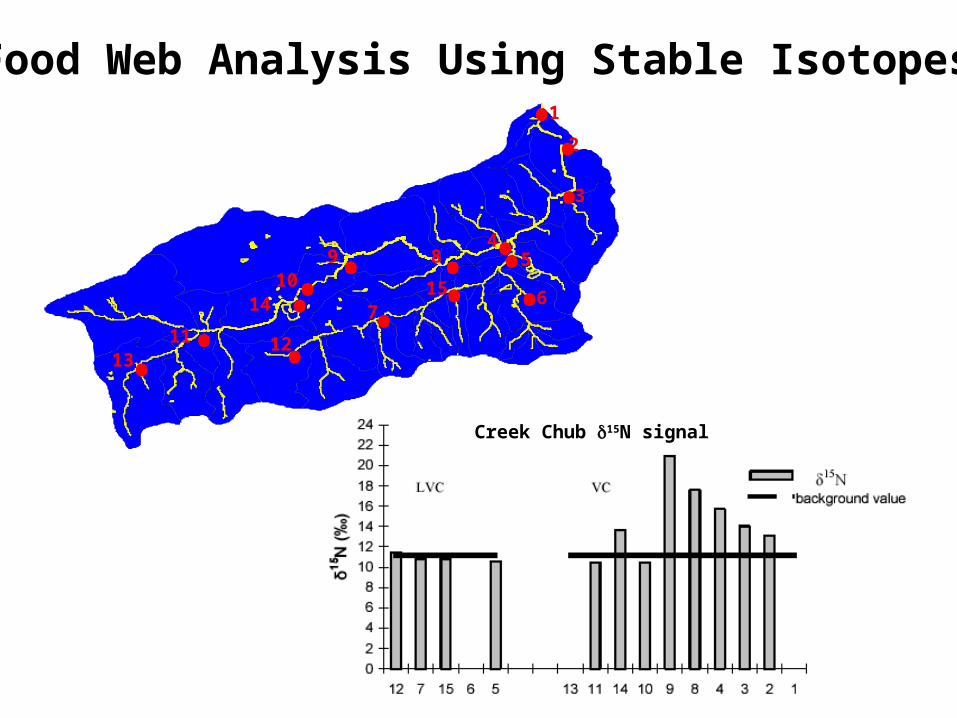
Creek Chub 15N signal
Food Web Analysis Using Stable Isotopes

Septic System
Steffy and Kilham, Ecological Applications, 14(3), 637-641, June 2004.
Creek Chub 15N signal

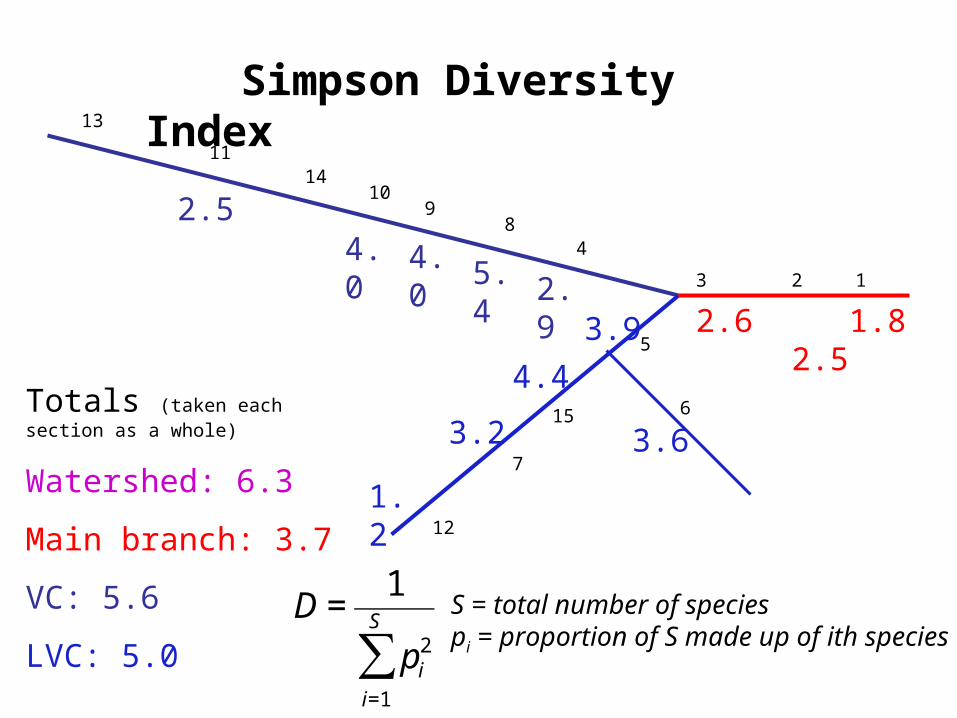
Fish DiversityFish Diversity
123
48
910
1411
13
5
615
7
12
2.6 1.8 2.52.95.44.04.0
2.5
3.9
4.4
3.63.2
1.2
Simpson Diversity Index
Totals (taken each section as a whole)
Watershed: 6.3
Main branch: 3.7
VC: 5.6
LVC: 5.0
S = total number of speciespi = proportion of S made up of ith species
€
D =1
pi2
i=1
S
∑

?
Steffy and Kilham, Urban Ecosystems In review

15
7
5
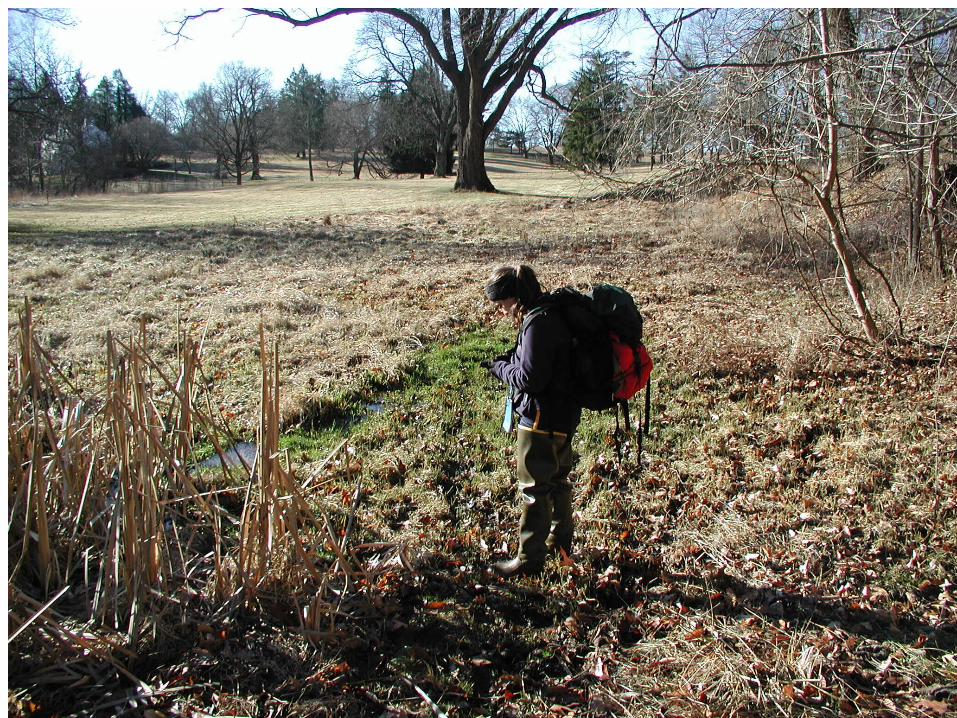
Springs in Valley Creek Watershed
• 108 sampleable springs• Flow rates and major ions measured
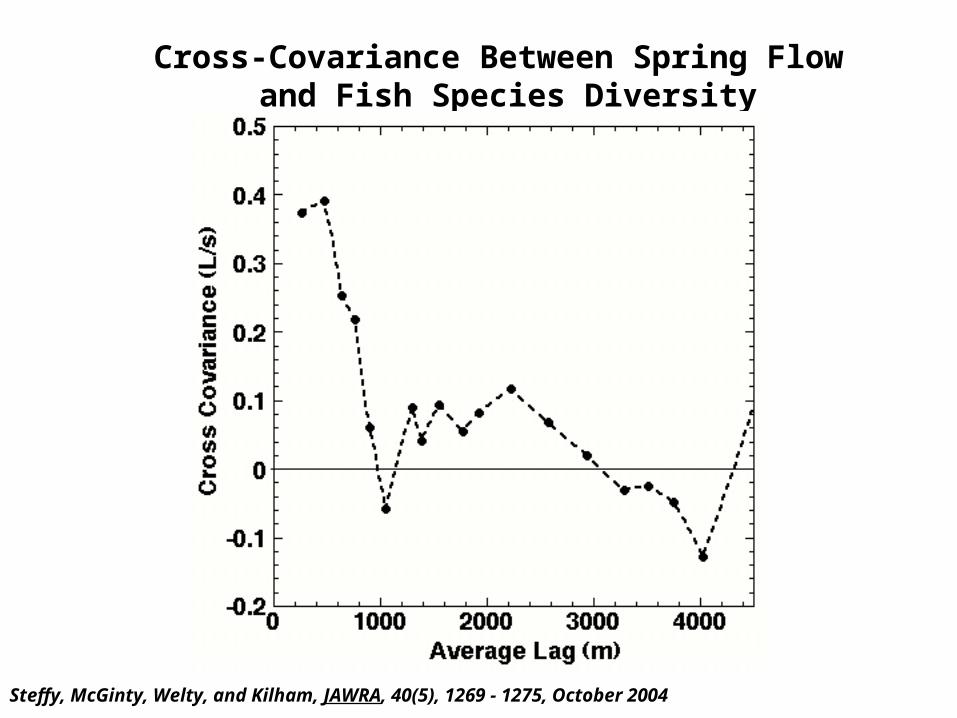
Cross-Covariance Between Spring Flow and Fish Species Diversity
Steffy, McGinty, Welty, and Kilham, JAWRA, 40(5), 1269 - 1275, October 2004
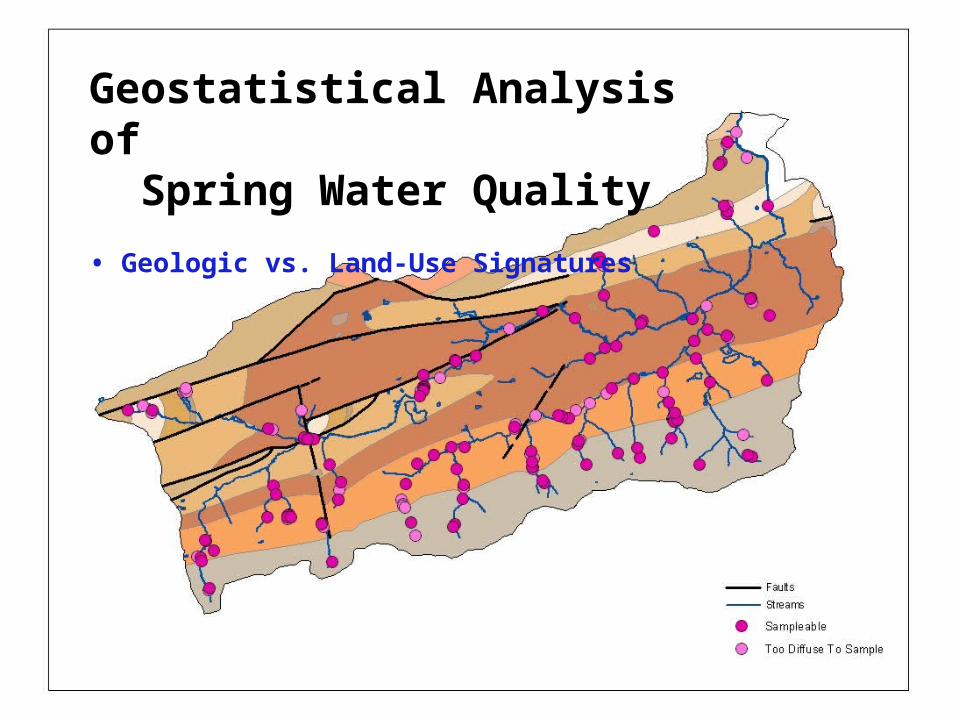
Geostatistical Analysis of Spring Water Quality
• Geologic vs. Land-Use Signatures
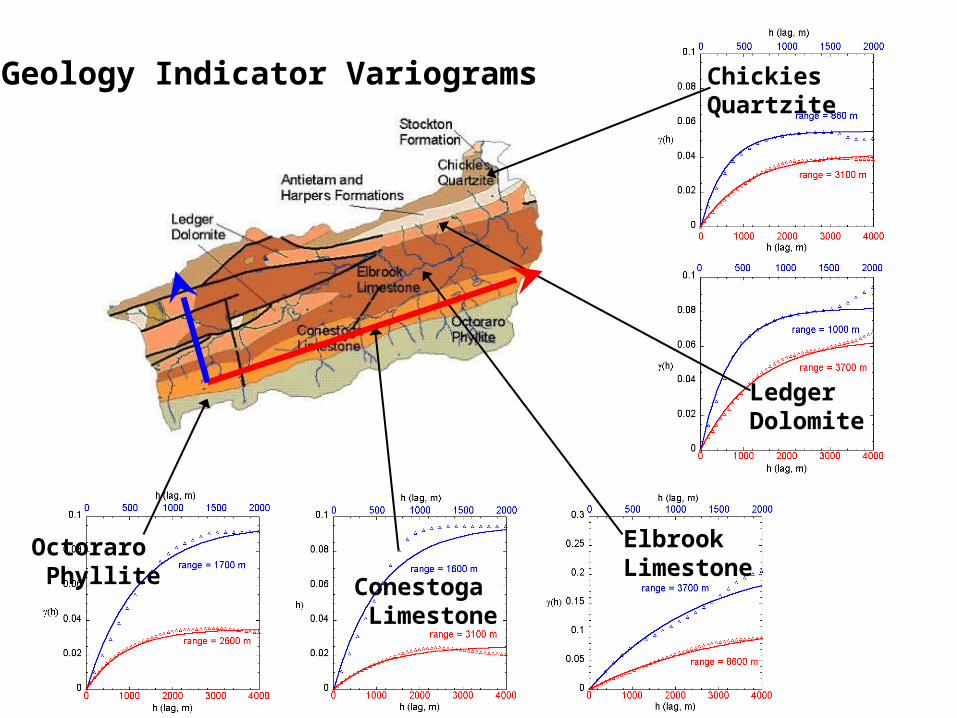
Geology Indicator Variograms ChickiesQuartzite
LedgerDolomite
Elbrook Limestone
Conestoga Limestone
Octoraro Phyllite

Water Quality Variograms Related to Geology
pH Calcium
5.0 - 8.3 0.1 - 190 mg/L
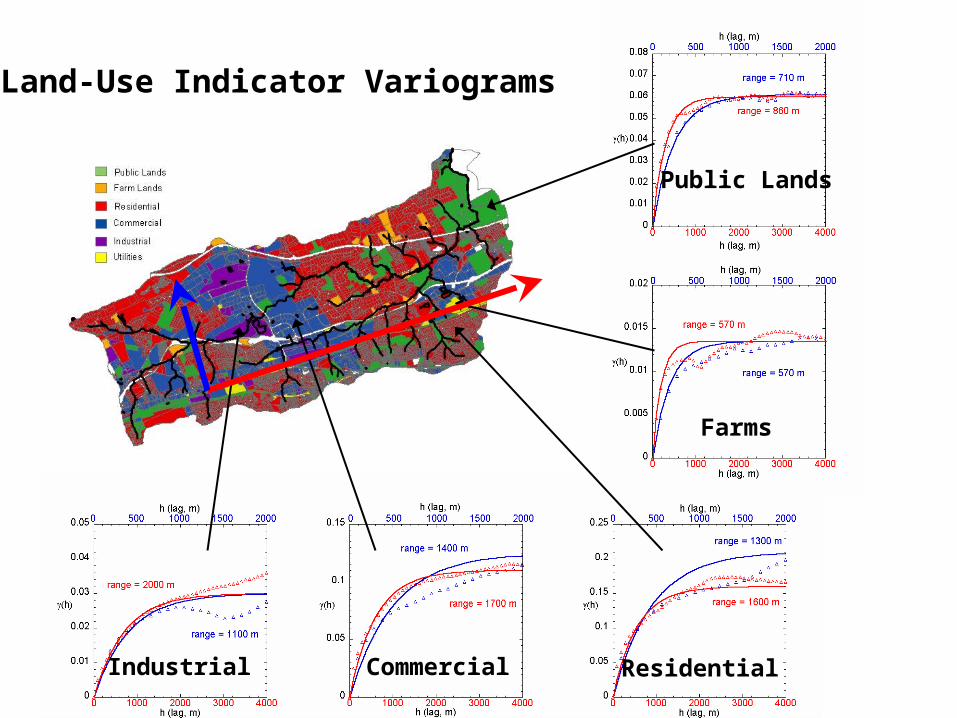
Land-Use Indicator Variograms
Public Lands
Farms
Residential Industrial Commercial
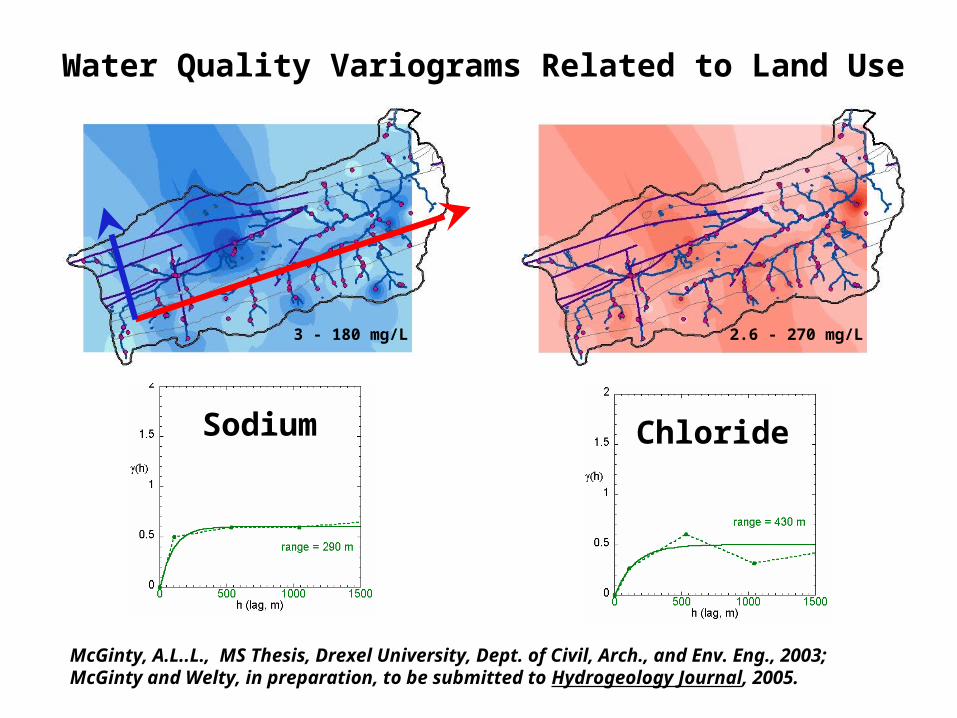
Water Quality Variograms Related to Land Use
ChlorideSodium
3 - 180 mg/L 2.6 - 270 mg/L
McGinty, A.L..L., MS Thesis, Drexel University, Dept. of Civil, Arch., and Env. Eng., 2003; McGinty and Welty, in preparation, to be submitted to Hydrogeology Journal, 2005.

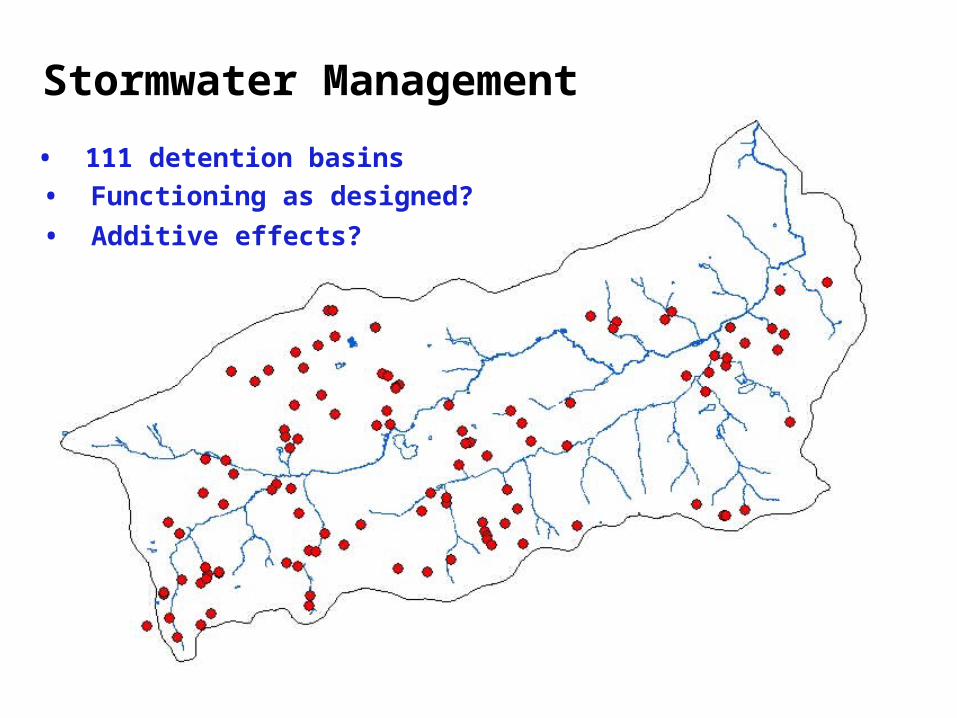
Stormwater Management
• 111 detention basins
• Functioning as designed?
• Additive effects?


Assessment Approach: Stormwater Modeling
Mathematical Model
Rainfall
GeologyLand Slopes
InputsDetention Basin Surveys
Soils
PercentageImpervious Area
Time
Str
eam
flo
w r
ate
Output
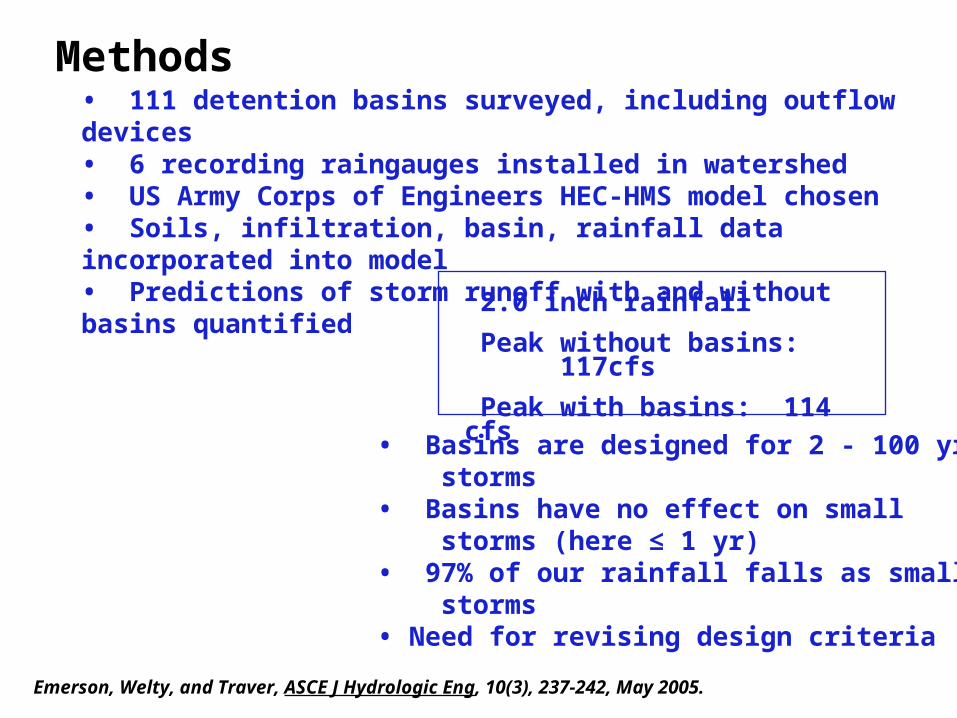
Methods• 111 detention basins surveyed, including outflow devices• 6 recording raingauges installed in watershed• US Army Corps of Engineers HEC-HMS model chosen• Soils, infiltration, basin, rainfall data incorporated into model• Predictions of storm runoff with and without basins quantified
2.0 inch rainfall
Peak without basins: 117cfs
Peak with basins: 114 cfs
• Basins are designed for 2 - 100 yr storms• Basins have no effect on small storms (here ≤ 1 yr) • 97% of our rainfall falls as small storms• Need for revising design criteria
Emerson, Welty, and Traver, ASCE J Hydrologic Eng, 10(3), 237-242, May 2005.

Summary
• Watershed-scale research> importance of recognizing spatial and temporal
heterogeneity > natural vs anthropogenic characteristics
• Utilization of existing conditions and data for process-based, quantitative assessments where possible

![Semantic Technology Chris Welty IBM Research · performance [Welty, et al, 2004]performance [Welty, et al, 2004] 18% . 18% f. f--improvement in searchimprovement in search Cleanup](https://static.fdocuments.net/doc/165x107/606c2bf9a970da04853ddb71/semantic-technology-chris-welty-ibm-research-performance-welty-et-al-2004performance.jpg)