MGS Radio Science electron density profiles: Interannual variability ...

CLIMATE RESEARCHClim Res
Vol. 32: 49–62, 2006 Published August 10
1. INTRODUCTION
Rainfall in Zambia is highly irregular in space andtime, which makes cultivation of crops such as maizedifficult. Small differences in the amounts and timingof rain at a particular site may determine the successor failure of critical stages in maize production, whichis the nation’s staple food. With a relatively large andimpoverished rural population that largely relies onrain-fed agriculture, Zambia is vulnerable to the im-pacts of rainfall variability, posing challenges for foodsecurity and planning (Vogel & O’Brien 2003).
Research into rainfall variability has tended to con-sider anomalies in seasonal totals as the focus for study.Similarly, seasonal forecasts often predict rainfall overlarge regions—i.e. whether the rainfall for the forth-
coming season will be below, near, or above average(e.g. Vogel & O’Brien 2003, Johnston et al. 2004). How-ever, as emphasized at regional climate meetings(such as the Southern African Regional Outlook Forum,SARCOF, run by the Drought Monitoring Centre forsouthern Africa), more specific information is requiredby operational meteorologists and decision makers(e.g. farming, health and water-resource managers) onthe likely onset and end dates of rainy seasons, as wellas on the number and intensity of dry and wet spellswithin it. For example, a good crop yield is more likelywith uniformly spread light rains than with a few spellsof heavy rains interrupted by dry periods (Usman &Reason 2004). At SARCOF meetings, consensus fore-casts (in terms of the probability of above, below, ornear average rainfall totals) for the early and late sum-
© Inter-Research 2006 · www.int-res.com*Corresponding author. Email: [email protected]
Interannual variability in dry and wet spellcharacteristics over Zambia
S. Hachigonta, C. J. C. Reason*
Dept. of Oceanography, University of Cape Town, Rondebosch, 7701, South Africa
ABSTRACT: We studied the variability of dry and wet spell frequency over Zambia during the coreof the rainy season (December to February, DJF), and associated circulation anomalies. Zambia’slarge rural population depends critically on rain-fed agriculture; in general, the southern part of Zam-bia is prone to a high number of dry spells during DJF, and to wet spells of short duration, while thenorthern regions of the country more typically have a large number of wet spells during DJF, whichcan lead to flooding. Good rainfall over southern Zambia is typically associated with low level con-vergence of moisture emanating from the tropical southeast Atlantic Ocean and the tropical westernIndian Ocean. During seasons with increased numbers of dry spells over Zambia, low level easterlyanomalies typically exist over Zambia, thereby reducing moisture from the tropical southeastAtlantic. Seasons with reduced dry spell frequency and more wet spells tend to be characterised bylow level westerly anomalies over southern Angola and western Zambia. Furthermore, DJF seasonsoccurring during the mature phase of El Niño (La Niña) events tend to show above (below) averagedry spell frequency. All El Niño seasons during the period of study showed reduced frequency of wetspells over Zambia, but not all La Niña events were associated with above average wet spell fre-quency. In fact, wet spell frequency over Zambia during several neutral seasons was greater than thatobserved during some La Niña events. A relatively strong relationship between anomalies in dryspell frequency and Niño 3.4 sea surface temperature (SST) was found. Relationships with IndianOcean SST anomalies were also explored, but these were weaker than those found for Niño 3.4 SST.
KEY WORDS: Dry spell frequency · Zambia · ENSO · Interannual variability
Resale or republication not permitted without written consent of the publisher

Clim Res 32: 49–62, 2006
mer rainy seasons over each southern African country(such as Zambia) are issued based on the outputs fromSST(sea surface temperature)–regional rainfall regres-sion models and General Circulation Model (GCM)products obtained from the South African WeatherService, the UK Meteorological Office, the EuropeanCentre for Medium-Range Weather Forecasts and theInternational Research Institute. However, the need byuser groups for information about onset dates anddry/wet spells needs to be specifically addressed, par-ticularly for regions depending on predominantlyrain-fed subsistence agriculture such as Zambia. Thus,Zambia and the southern African region urgently needmore tailor-made applications-oriented seasonal fore-casts (e.g. Klopper 1999, Johnston et al. 2004).
However, improved forecasting relies on betterunderstanding of the climate variability of the regionand on assessing what rainy season characteristicsmight have some predictability. Possible relationshipsbetween large-scale climate modes or identifiableregional circulation anomalies and dry and wet spellcharacteristics need to be investigated. Furthermore,better understanding of how rainfall is distributed interms of dry and wet spells through the core months ofthe summer rains (December–February, DJF), and thevarious circulation anomalies responsible for this vari-ability, could help to improve long range forecasts overZambia, thus helping agricultural extension officersprovide advice to subsistence farmers.
Rainy seasons that have unusually high numbers ofdry spells have helped cause economic, social, and en-vironmental problems over many parts of Africa. Inyears with anomalously high number of dry spells dur-ing the rainy season, crop production is typically verypoor. On the other hand, too many—or too intense—wet spells quite frequently lead to flood-induced cropfailure (e.g. Reason et al. 2005). In a study over EastAfrica, Stewart (1988) found that dry spell-induced cropshortages occurred once or twice every 5 yr. Previouswork on wet and dry spells in southern Africa hasexamined their characteristics for Zimbabwe (Matarira& Jury 1992), and the interannual variability in summerdry spell frequency over southern Africa as a whole(Usman & Reason 2004) and over the Limpopo region ofnorthern South Africa (Reason et al. 2005). However,very little research has been done on the variability ofrainfall during the rainy season over Zambia. There-fore, one of the objectives of this paper is to investigatewet and dry spell characteristics over Zambia and toidentify global and regional climatic features that in-fluence the frequency of these dry and wet spells.Although summer rainfall totals are typically below(above) average over much of southern Africa during ElNiño (La Niña) (Allan et al. 1996, Reason et al. 2000), itis not known how the El Niño Southern Oscillation
(ENSO) affects the characteristics of dry and wet spellsthat make up the summer rainy season over Zambia.
During the summer rainy season, the Inter-tropicalConvergence Zone (ITCZ) migrates southwards to liemeridionally over the northern and eastern parts ofZambia with another convergence zone extendingwest across the country and into the heat low (AngolaLow) that exists in the summer half of the year over SEAngola and NE Namibia. The Angola Low facilitateslow level moisture influx from the tropical SE Atlantic(Cook et al. 2004) and if this moisture is able to signifi-cantly penetrate into Zambia and then converge withmoisture emanating from the tropical western IndianOcean, good rains are expected. East of Zambia, theITCZ typically lies more or less zonally across northernMozambique before exiting southern Africa out acrossthe western Indian Ocean. At upper levels, the tropicaleasterly jet dominates the circulation over low latitudeAfrica and the subtropical westerly jet dominates southof ~30° S. Associated with this ITCZ distribution, theDJF moisture flux climatology over southern Africa(Fig. 1) is characterized at low levels by a NE mon-soonal flow from the NW Indian Ocean, a SE flowover Zimbabwe and southern Mozambique from theSW Indian Ocean and a cyclonic flow over southernAngola and northern Namibia (the Angola Low) ema-nating from the tropical SE Atlantic. These 3 low levelmoisture inflows tend to converge over central Zambiaand contribute to summer rainfall over the country.They are noticeably weaker in December than in Jan-uary or February and this helps explain why there is asignificant increase in average Zambian rainfall fromDecember to January. The moisture inflows, and henceZambian rainfall, are affected by ENSO and also byIndian Ocean and South Atlantic SST and circulationanomalies (e.g. Behera & Yamagata 2001, Reason2002, Rouault et al. 2003).
A better understanding of the variability of Zambiansummer rainfall is needed, and thus a further objectiveof this study was to investigate the spatial–temporalpatterns of dry and wet spell occurrence. Potentialrelationships between anomalies in dry and wet spellfrequencies and anomalies in Niño 3.4 SST and inIndian Ocean SST are also considered to assess thepredictability of rainy season rainfall based on the stateof ENSO. A final objective was to better understandthe circulation anomalies responsible for anomalousnumbers of dry/wet spells during the rainy season.
2. DATA AND METHODOLOGY
The analysis of dry and wet spells focused on theDJF period (i.e. the core of the summer rainy season),as these months are critical for maize cultivation and
50

Hachigonta & Reason: Dry and wet spells over Zambia
also usually correspond to the time of maximum rain-fall. In the present study, a dry spell (following Usman& Reason 2004) was defined as a pentad (5 d) whichreceives <5 mm rainfall, and a wet spell as a pentadreceiving >20 mm rainfall. Note that the Famine EarlyWarning System uses a similar dry spell definition(<4.25 mm per pentad; Usman & Reason 2004). Con-secutive dry pentads were counted as a single dry spell,and thus the duration of dry spells was variable.
Two rainfall data sets were used for the analysisof dry and wet spells over Zambia: (1) The ClimatePrediction Center (CPC) Merged Analysis ofPrecipitation (CMAP) mean pentad rainfall data(Xie & Arkin 1997), updated to July 2002. TheCMAP rainfall data are precipitation estimatesobtained from the merging of observations fromrain gauges and rainfall estimates from satellite,and are produced on a global grid with a horizon-tal resolution of 2.5 × 2.5°. The CMAP data setused here extends over 1979 to 2002, and hasbeen used in recent southern African studies (e.g.Usman & Reason 2004, Reason et al. 2005, Tadrosset al. 2005). (2) Daily rainfall station data obtainedfrom the Zambian Meteorological Department(see Fig. 2 for station locations). Station data wasused in this study in order to demonstrate therobustness of the results where the 2 datasetsagreed, or to caution against drawing firm conclu-sions where the datasets differed. These data werederived from 28 daily weather stations over theZambia and cover 1979–2000 period.
A time series of area-averaged dry and wet spellsover the region was created from the gridded
CMAP and station data sets and usedto assess the dry and wet spell variabil-ity. On the basis of the dry spell timeseries, seasons with anomalously highfrequencies of dry spells and wet spellswere identified for further study, andthe series as a whole further analysedby relating them to the Niño 3.4 timeseries index and to Indian Ocean SST.
To assess regional circulation anom-alies associated with seasons of well-above average numbers of dry orwet spells, NCEP-NCAR reanalyses(Kalnay et al. 1996) were used. Some ofthe anomalies in re-analysis para-meters were plotted directly fromthe CDC website (www.cdc.noaa.gov/HistData). Moisture transport oversouthern Africa and the adjacentoceans was calculated from theNCEP reanalysis data as the productof specific humidity (q) and winds
(u, v), giving a vector (qu, qv) for 8 pressure levels from1000 hPa to 300 hPa. In this study, the 850 hPa and350 hPa level data were used to analyse the low andupper level moisture fluxes during seasons of anom-alous number of wet and dry spells. Anomaly plotswere calculated using a 20 yr monthly climatology(1979–1999), since the NCEP data are less reliable be-fore 1979 due to a paucity of observations over the
51
0.08°E/W
°N/S
10
5
0
5
10
15
20
25
30
35
4010 0 10 20 30 50 60 7040 80
Fig. 1. Mean moisture flux at 850 hPa over southern Africa for December toFebruary (DJF), 1979–2000. Arrow below panel: scale vector (kg kg–1 m s–1).
Zambia shaded grey
Fig. 2. Location of rainfall stations in Zambia

Clim Res 32: 49–62, 2006
Southern Hemisphere (Kalnay et al. 1996). Compositesof SST and atmospheric circulation anomalies wereconstructed for seasons showing anomalously highdry/wet spell frequency.
3. DRY SPELL CHARACTERISTICS
Fig. 3 shows a comparison of annual rainfall totalsbetween northern and southern Zambia for 1979 to1999, derived from station rainfall data. For every yearduring the period, the northern part of Zambia (8 to15° S) received more rainfall than the southern region(15 to 18° S) and generally displayed less interannualvariability. The mean ± SD rainfall for the northernregion is 1204 ± 121 mm, whereas for the southernregion the corresponding values are 659 ± 131 mm.Furthermore, the total rainfall during the wettest yearin the south is still substantially less than that duringthe driest year in the north. The higher totals and lessvariable rainfall in the north are mainly due to theinfluence of the ITCZ, which is located over northernZambia in summer. In addition to the much greaterinterannual variability in the south, anomalously dry orwet years in the south only sometimes correspond toyears with the same sign of rainfall anomaly in thenorth. Several cases of anomalously dry years in thesouth and anomalously wet years in the north exist(e.g. 1979/80, 1982/83) and vice versa. This result sug-gests that the 2 regions need to be considered sepa-
rately and that different mechanisms apply ineach case. In general, the rains in the southare often poorly distributed within the season.To examine this distribution in more detail,pentad CMAP and station data were used.
The mean DJF dry spell frequency duringthe period 1979–2001 is shown in Fig. 4(CMAP and station data). Cressman interpola-tion (Cressman 1959) was used to plot the dryspell climatology derived from station data onthe same 2.5 × 2.5° grid as the CMAP-derivedvalues. Some differences exist between the 2data sets, particularly for the grid boxes nearthe Congo and Tanzanian borders. Neverthe-less, dry spell frequencies can be categorizedinto 2 regions across Zambia depending ontheir frequency. On average, the highest fre-quencies are observed over the southernmostpart of the country, between latitudes 15 and18° S whereas the northern part (8 to 15° S)has the least numbers of dry spells duringthe summer, consistent with the ITCZ beinglocated over this region. The results overZambia are consistent with those plotted oversouthern Africa as a whole by Usman &
Reason (2004). Re-examination of the results of Usman& Reason (2004) suggests that, in terms of summerdry spell frequency, Zambia is located in a transitionregion between the low dry spell area of the Congobasin (which includes eastern Angola and northernZambia) and the drought corridor defined by theseauthors as extending across southern Africa between20 and 25° S.
Fig. 5 shows the relationship between normalisedDJF Niño 3.4 SST anomalies and dry spell frequencyanomalies averaged over Zambia during the 1979/80to 2001/02 (1979/80 to 1999/2000) periods derived fromCMAP (station) data. A strong relationship betweenanomalies in dry spell frequency and Niño 3.4 SST isapparent for both rainfall data sets. Correlations be-tween the dry spell and Niño 3.4 anomalies range fromabout 0.6 to 0.8 when calculated using a 10 yr runningwindow (Fig. 6). The El Niño years of 1982/83,1986/87, 1991/92, 1994/95 and 1997/98 all show in-creased dry spell frequency over Zambia, whereasthe La Niña years of 1988/89, 1995/96, 1998/99 and2000/01 all show decreased dry spell frequency. Yearswith anomalously large number of dry spells (>0.5 SD)are not only observed during all the El Niño years butalso the non-El Niño seasons of 1979/80 and 1999/2000. The latter was a La Niña year when the mainrainy belt shifted further south to lie over southernMozambique and Zimbabwe (Reason & Keibel 2004),and hence Zambia was drier than might have other-wise been expected. There is a general consistency
52
1600
1400
1200
1000
800
600
400
200
0
19
79
19
80
19
81
19
82
19
83
19
84
19
85
19
86
19
87
19
88
19
89
19
90
19
91
19
92
19
93
19
94
19
95
19
96
19
97
19
98
19
99
Year
Tota
l rai
nfa
ll (m
m)
Northern
Southern
Fig. 3. Time series of station rainfall data in the northern (8 to 15° S) and southern (15 to 18° S) parts of Zambia for 1979–1999

Hachigonta & Reason: Dry and wet spells over Zambia
between anomalous dry spell years calculated from the2 data sets, although the year with the largest numberof dry spells in the CMAP time series corresponds to1997/98, whereas from the station time series it is1982/83. Although some differences exist between theCMAP- and station data-derived dry spell time series,
the general relationship with Niño 3.4 is coherent androbust in both data sets. Note that the time axis is notthe same, as the station data only extends to 1999/2000, whereas the CMAP data goes to 2001/02.
When the drier southern and wetter northern parts ofthe country are considered separately, there is a muchstronger relationship with Niño 3.4 SST in both station-and CMAP-derived data for southern Zambia (correla-tion coefficients are 0.73 for both the station andCMAP, p ≤ 0.01) (Fig. 7). This result suggests that thesouthern region is considerably more prone to ENSOimpacts on rainfall. It is also located on the margins ofthe ‘drought corridor’ across southern Africa in the 20to 25° S band, based on analysis of rainfall data across
53
Fig. 4. Mean DJF dry spell frequency for Zambia, averagedover (a) 1979/80–2001/02 for CMAP (Climate PredictionCentre Merged Analysis of Precipitation) and (b) 1979/80–
1999/2000 for station data
2
1.5
1
0.5
0
–0.5
–1
–1.5
2
1.5
1
0.5
0
–0.5
–1
–1.5
–2
1980 1982 1984 1986 1988 1990 1992 1994 1996 1998 2000
1980 1982 1984 1986 1988 1990 1992 1994 1996 1998 2000
2002
a
b
CMAP
Station
Ano
mal
yA
nom
aly
Year
Fig. 5. Standardised DJF dry spell frequency anomalies overZambia (continuous line) against Niño 3.4 SST anomalytime series (1979–2000) (dashed line) calculated for1979/80–2001/02 using (a) CMAP data and (b) station data

Clim Res 32: 49–62, 2006
Africa south of the equator (Usman & Reason 2004). Onthe other hand, northern Zambia is located near theCongo rainforest and typically the ITCZ lies across theformer in DJF. These factors, plus the fact that the high(low) pressure anomalies that establish themselvesover southern Africa during El Niño (La Niña) yearstypically do not extend deep into the tropics (Lindesay1988, Reason et al. 2000), may explain the reducedsensitivity to ENSO over the northern part of the coun-try. Consistent with this proposition, the relationshipbetween Niño 3.4 SSTs and dry spell frequency anom-aly is far weaker for the northern region (Fig. 7a)(correlation coefficient 0.12).
Further support for the reduced impact of ENSO onthe northern region can be seen in Table 1, whichshows dry spell durations and dry spell frequenciesduring 5 El Niño seasons calculated from daily data forvarious stations across Zambia. Daily rainfall datawere used in order to assess the duration of dry/wetspells. Computed across the country as a whole, eachof the 5 El Niño seasons studied showed above-average numbers of dry spells. Stations in the southernregion (Livingstone and Choma) were most affected byEl Niño, while those in the northern region (Isoka andKasama) were least affected (Table 1). The impactsincluded an increase in dry spell frequency, and oftenin the duration of a given dry spell. In some cases, theduration of the longest dry spell was as much as 3 or 4pentads. Stations in the western and eastern regions
54
Table 1. Number and duration of dry spells over variousregions across Zambia. Mean no. of dry spells (± SD) shown
for each location. P: pentads
Region No. of dry Dry spell duration (P)Year spells (P) Mean Max.
Southern RegionLivingstone (4 ± 1.4)
1982–1983 4 1.6 2.11986–1987 5 2.0 3.21991–1992 4 2.3 2.81994–1995 5 1.9 2.41997–1998 6 1.8 3.0
Choma (3.2 ± 1.5)1982–1983 3 1.9 3.01986–1987 4 2.5 3.01991–1992 5 2.7 4.61994–1995 6 1.3 1.81997–1998 8 1.4 2.2
Eastern RegionChipata (2.3 ± 1.1)
1982–1983 2 1.7 2.11986–1987 2 1.1 1.11991–1992 2 2.4 3.21994–1995 3 1.6 3.31997–1998 3 1.3 1.6
Lundazi (2.5 ± 2.5)1982–1983 4 1.2 3.51986–1987 2 3 21991–1992 3 1.2 1.61994–1995 1 1 11997–1998 1 1 1
Northern RegionIsoka (1.0 ± 0.9)
1982–1983 2 1.9 2.21986–1987 0 0 01991–1992 2 1.0 1.21994–1995 1 1.8 1.81997–1998 0 0 0
Kasama (0.7 ± 1.0)1982–1983 0 0 01986–1987 0 0 01991–1992 1 1 11994–1995 0 0 01997–1998 0 0 0
Western RegionKaoma (1.4 ± 1.0)
1982–1983 4 1.1 1.21986–1987 2 2.6 3.21991–1992 1 1.2 1.21994–1995 3 1.5 2.21997–1998 2 1.8 2
Kabompo (1.9 ± 1.6)1982–1983 4 1.6 2.81986–1987 1 1.4 1.41991–1992 4 1.2 1.61994–1995 2 1.5 1.41997–1998 1 1.4 1.4
1
0.8
0.6
0.4
0.2
0
1
0.8
0.6
0.4
0.2
0
1980
1981
1982
1983
1984
1985
1986
1987
1988
1989
1990
b
a
Year
Station
CMAP
Cor
rela
tion
Fig. 6. Correlation between DJF dry spell frequency anom-alies over Zambia and Niño 3.4 SST anomalies, calculatedusing a 10 yr running window and after both series werestandardised. Dry spells were calculated from (a) CMAPdata and (b) station data. Note: 1980 indicates correlation for
1980–1990, 1981 correlation for 1981–1991, etc.

Hachigonta & Reason: Dry and wet spells over Zambia
tended to show increased dry spell frequencies in mostEl Niño years and sometimes a lengthening of dry spellduration to reach a maximum of about 3 pentads in afew cases. It is also clear from Table 1 that impacts ofindividual El Niño events differ across the regions, sothat, with the exception of the southern stations, theseevents do not always have a robust and consistentcountrywide effect on dry spell characteristics. To fur-ther illustrate the temporal distribution of rains duringEl Niño, Fig. 8 plots daily rainfall at a representativestation in southern Zambia (Choma) and northernZambia (Kasama) for 2 events. These events are cho-sen to indicate how southern Zambia, while almostalways anomalously dry during El Niño events, canexperience either relatively short and weak rainfallevents that are well spread out in time (e.g. 1994/95) ora season with 1 very significant wet spell and some
extensive dry periods (e.g. 1982/83). By contrast, atnorthern stations such as Kasama, the distribution ofrainfall is much more even during El Niño events,although dry spells do occur during the season.
In addition to ENSO, modes of variability in the In-dian Ocean such as the Indian Ocean Zonal DipoleMode (ZDM; Saji et al. 1999, Webster et al. 1999) andthe Subtropical South Indian Ocean Dipole SST pattern(Behera & Yamagata 2001, Reason 2001, Hermes &Reason 2005) may also be related to dry spell frequen-cies over Zambia. Comparison of the ZDM index ofSaji et al. (1999) with the dry spell frequency time seriesreveals that the 2 series track together fairly closely forthe southern Zambian case except during 1986/87 and1998–2002 (not shown). By contrast, Fig. 7b indicatesthat the Niño 3.4 index tracks the dry spell index rela-tively well during this period. Although the ZDM index
55
2.5
2
1.5
1
0.5
0
–0.5
–1
–1.5
–2
2.5
2
1.5
1
0.5
0
–0.5
–1
–1.5
1980 1982 1984 1986 1988 1990 1992 1994 1996 1998 20001980 1982 1984 1986 1988 1990 1992 1994 1996 1998 20022000
a
b
CMAP
Ano
mal
yA
nom
aly
Year
Station
Fig. 7. Regional DJF dry spell frequency anomalies against standardised regional DJF Niño 3.4 SST anomalies (dashed) for (a) northern and (b) southern Zambia

Clim Res 32: 49–62, 2006
is closer to the 1983–1984 dry spell frequency indexthan is the Niño 3.4 index, the 1979–2002 correlation ofthe ZDM index with the dry spells (0.61) is weaker thanthat found earlier for the Niño 3.4 index (0.73). Similarlyweaker correlation coefficients for the ZDM index thanfor the Niño 3.4 index are found when monthly cor-relations lagged by 1 to 3 mo are calculated with thedry spell index. In addition, relationships between thedry spell index and the Subtropical South Indian OceanDipole SST pattern (calculated as in Hermes & Reason2005) during 1979–2002 were also investigated, butwere found to be weaker (r = –0.48 for 1979–2002) thanthose found between the dry spell index and either theZDM or Niño 3.4 SST. In sum, it appears that the rela-tionship between the dry spell frequencies and Niño3.4 SST is stronger than that existing for the IndianOcean SST modes.
4. WET SPELL CHARACTERISTICS
When calculated over the country as a whole, andusing a criterion of 20 mm per pentad, the summersexperiencing the largest number of wet spells were
1985/86, 1988/89, 1989/90, 1992/93, 1995/96, 1996/97and 2000/01 (Fig. 9a). During these seasons, thehighest number of wet spells tended to occur over thenorthwestern (22 to 30° E, 8 to 15° S) and northeastern(30 to 34° E, 8 to 15° S) regions of the country.
Fig. 9b suggests that an inverse relationship existsbetween normalised anomalies in the DJF frequencyof wet spells averaged over Zambia and Niño 3.4 SSTanomalies for 1979–2001 (correlation coefficient be-tween the 2 series = –0.50). A reduced number ofwet spells was observed during the 5 El Niño seasonswhereas increased frequencies of wet spells occurredduring the 1988/89, 1995/96 and 2000/01 La Niñaseasons. However, the 1998/99 and 1999/2000 La Niñasummers were characterised by average and below-average frequency of wet spells, respectively. In addi-
56
1 6
40
30
20
10
0
40
30
20
10
0
40
30
20
10
0
30
20
10
0
11 16 21 26 31Days
a Choma (southern region)
b Kasama (northern region)
1982/1983
1994/1995
1994/1995
1982/1983Rai
nfal
l (m
m)
36 41 46 51 56 61 66 71 76 81 86
1 6 11 16 21 26 31 36 41 46 51 56 61 66 71 76 81 86
Fig. 8. Daily rainfall time series (DJF) for 2 El Niño eventsrecorded at: (a) Choma (southern Zambia) and (b) Kasama
(northern Zambia)
1.5
1
0.5
0
–0.5
–1
–1.5
–2
–2.5
WSF >2 mm d–1
WSF >3 mm d–1
WSF >4 mm d–1
DJF WSFNiño 3.4 SST anomalies
2.5
2
1.5
1
0.5
0
–0.5
–1
–1.5
–2
–2.5
–31980 1982 1984 1986 1988 1990 1992 1994 1996 1998 2000 2002
b
a
Year
Ano
mal
yA
nom
aly
Fig. 9. Standardised DJF wet spell frequency anomalies(WSF) over Zambia, 1979/80–2001/02 (a) using the definitionof wet spell as >2, >3 or >4 mm d–1; (b) vs DJF Niño 3.4 SST
anomalies

Hachigonta & Reason: Dry and wet spells over Zambia
tion, not all seasons of above-average wet spell fre-quency are associated with La Niña events, suggestingthat other factors may be important. Fig. 10 plots nor-malised anomalies in Niño 3.4 SST anomalies and DJFwet spells for 4 different areas of Zambia, to illustrateregional differences in this relationship. Similar towhat was found for dry spell characteristics, a strongerrelationship is observed for the southern regions (cor-relation coefficient with Niño 3.4 SST anomaly series =–0.66 [southwestern Zambia] and –0.71 [southeasternZambia]) but less coherent signals are seen for thenorth. For the 2 northern regions, the Niño 3.4 seriesand rainfall series are sometimes in phase and some-times out of phase (correlation coefficient = –0.22[northwest] and 0.04 [northeast]).
To investigate potential mechanisms associated withthe apparent ENSO relationships with dry and wet
spell frequencies, the next section considers circula-tion anomalies derived for seasons with anomalouslyhigh numbers of dry/wet spells.
5. CIRCULATION ANOMALIES DURINGANOMALOUS SEASONS
5.1. Dry spell circulation
During DJF El Niño seasons with anomalously highdry spells, low-level moisture flux plots (Fig. 11) showsoutheasterly anomalies in the Mozambique Channeland a strong cyclonic (anticyclonic) anomaly over thesubtropical S Indian (central tropical Indian) Ocean. Asimilar low level anomaly pattern was also found for ElNiño years by Goddard & Graham (1999). These pat-
57
2.5
2
1.5
1
0.5
0
–0.5
–1
–1.5
–2
–2.5
–3
–3.5
2.5
2
1.5
1
0.5
0
–0.5
–1
–1.5
–2
–2.5
–3
–3.5
2.5
2
1.5
1
0.5
0
–0.5
–1
–1.5
–2
–2.5
–3
2.5
2
1.5
1
0.5
0
–0.5
–1
–1.5
–2
–2.5
–31980 1982 1984 1986 1988 1990
Northwest (15–8°S, 22–30°E)
Ano
mal
yA
nom
aly
Southwest (18–15°S, 22–30°E) Southeast (18–15°S, 30–34°E)
Northeast (15–8°S, 30–34°E)
1992 1994 1996 1998 2000 2002
DJF wet spell frequency anomaliesNiño 3.4 SST anomalies
1980 1982 1984 1986 1988 1990 1992 1994 1996 1998 2000 2002
1980 1982 1984 1986 1988 1990 1992 1994 1996 1998 2000 2002
Year
1980 1982 1984 1986 1988 1990 1992 1994 1996 1998 2000 2002
Year
a c
db
Fig. 10. Standardised DJF wet spell frequency anomalies vs DJF Niño 3.4 SST anomalies for Zambian regions
Clim Res 32: 49–62, 2006
terns reflect the high-pressure anomaly that extendsfrom Australia during the El Niño mature phase(Kiladis & Mo 1998, Reason et al. 2000) and suggestthat the ascending branch of the Walker circulation isshifted offshore, consistent with the warm SST anom-alies that develop in the tropical SW Indian Ocean (notshown). The velocity potential anomalies for DJF(Fig. 12) suggest that the main branch of the Walkercirculation shifts eastward from northern Australia/Indonesia into the central Pacific. In the African region,relative ascent is seen over the western Indian Ocean.
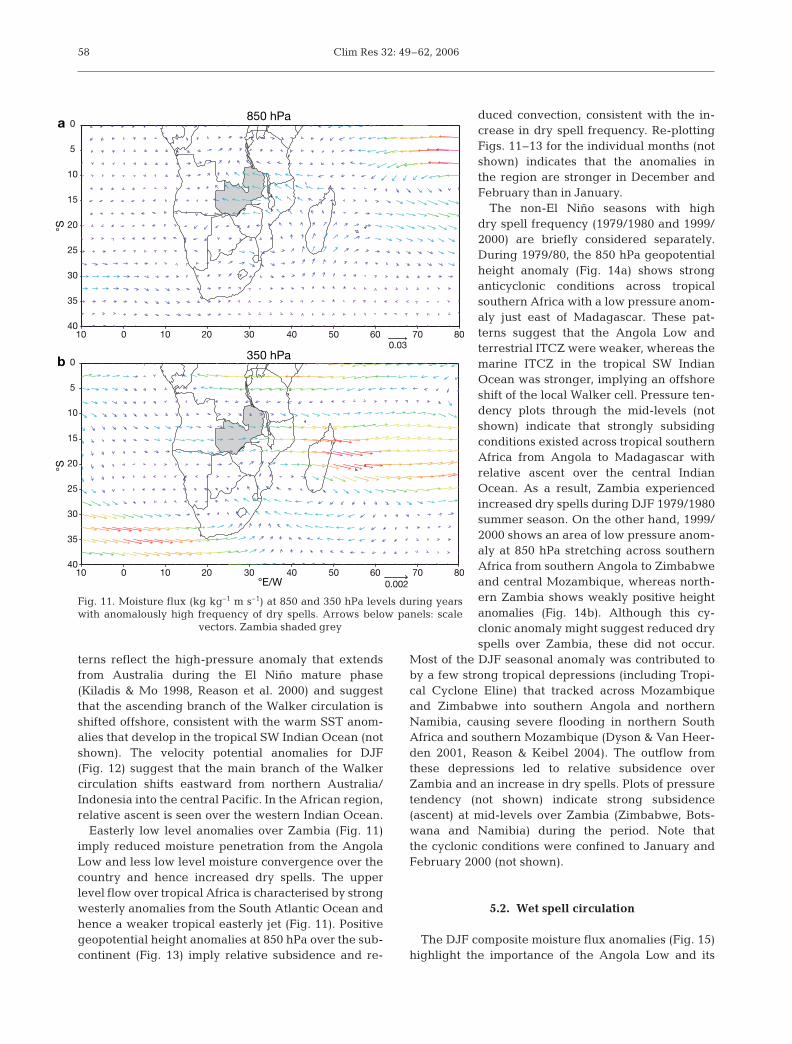
Easterly low level anomalies over Zambia (Fig. 11)imply reduced moisture penetration from the AngolaLow and less low level moisture convergence over thecountry and hence increased dry spells. The upperlevel flow over tropical Africa is characterised by strongwesterly anomalies from the South Atlantic Ocean andhence a weaker tropical easterly jet (Fig. 11). Positivegeopotential height anomalies at 850 hPa over the sub-continent (Fig. 13) imply relative subsidence and re-
duced convection, consistent with the in-crease in dry spell frequency. Re-plottingFigs. 11–13 for the individual months (notshown) indicates that the anomalies inthe region are stronger in December andFebruary than in January.
The non-El Niño seasons with highdry spell frequency (1979/1980 and 1999/2000) are briefly considered separately.During 1979/80, the 850 hPa geopotentialheight anomaly (Fig. 14a) shows stronganticyclonic conditions across tropicalsouthern Africa with a low pressure anom-aly just east of Madagascar. These pat-terns suggest that the Angola Low andterrestrial ITCZ were weaker, whereas themarine ITCZ in the tropical SW IndianOcean was stronger, implying an offshoreshift of the local Walker cell. Pressure ten-dency plots through the mid-levels (notshown) indicate that strongly subsidingconditions existed across tropical southernAfrica from Angola to Madagascar withrelative ascent over the central IndianOcean. As a result, Zambia experiencedincreased dry spells during DJF 1979/1980summer season. On the other hand, 1999/2000 shows an area of low pressure anom-aly at 850 hPa stretching across southernAfrica from southern Angola to Zimbabweand central Mozambique, whereas north-ern Zambia shows weakly positive heightanomalies (Fig. 14b). Although this cy-clonic anomaly might suggest reduced dryspells over Zambia, these did not occur.
Most of the DJF seasonal anomaly was contributed toby a few strong tropical depressions (including Tropi-cal Cyclone Eline) that tracked across Mozambiqueand Zimbabwe into southern Angola and northernNamibia, causing severe flooding in northern SouthAfrica and southern Mozambique (Dyson & Van Heer-den 2001, Reason & Keibel 2004). The outflow fromthese depressions led to relative subsidence overZambia and an increase in dry spells. Plots of pressuretendency (not shown) indicate strong subsidence(ascent) at mid-levels over Zambia (Zimbabwe, Bots-wana and Namibia) during the period. Note thatthe cyclonic conditions were confined to January andFebruary 2000 (not shown).
5.2. Wet spell circulation
The DJF composite moisture flux anomalies (Fig. 15)highlight the importance of the Angola Low and its
58
850 hPa
350 hPa
a
b
°S°S
0
5
10
15
20
25
30
35
40
0
5
10
15
20
25
30
35
40
10 0 10 20 30 50 60 700.03
40 80
°E/W10 0 10 20 30 50 60 7040 80
0.002
Fig. 11. Moisture flux (kg kg–1 m s–1) at 850 and 350 hPa levels during yearswith anomalously high frequency of dry spells. Arrows below panels: scale
vectors. Zambia shaded grey

Hachigonta & Reason: Dry and wet spells over Zambia
linkage with the meridional arm of theITCZ over Zambia for seasons withabove average wet spells. In addition,positive SST anomalies (not shown) overparts of the tropical SE Atlantic areevident during this period, implying in-creased evaporation of moisture off thisocean region leading to more moistureimport by the Angola Low. Strong west-erly moisture flux anomalies are evidentat 850 hPa (Fig. 15a) thereby transportingmoisture over Zambia. These westerlyanomalies oppose the mean flow overeastern Zambia, Zimbabwe and Mozam-bique, implying low-level convergence,favourable for an increase in wet spells.Consistent with these factors, the lowlevel divergence plot (Fig. 16a) showsan area of strong relative convergenceacross southern and central Zambiastretching west to an enhanced AngolaLow and east to an enhanced ITCZ overnorthern Mozambique.
A region of strong ascent at mid-levels(Fig. 16b; note that negative values ofthe omega field imply relative ascent,and positive values a relative descent) iscentred over southwestern Zambia andthe Angola Low, and extends over mostof Zambia, further reinforcing the condi-tions that favour increased frequenciesof wet spells. These conditions of lowlevel convergence and ascent throughthe lower and middle atmosphere areeven stronger if the 3 La Niña seasonsare removed from the composite, indi-cating that this mode is not the princi-pal cause of the observed patterns. At350 hPa, the tropical easterly jet isweakened (Fig. 15) implying that rain-fall-producing weather systems will tendto move less slowly than averagethrough Zambia, consistent with in-creased numbers of wet spells. Thevelocity potential anomalies (Fig. 17)show substantially increased uplift atlow levels over southern Africa, as wellas upper level divergence, implying thatthe ascending limb of the local Walkercirculation is over southern Africa, con-sistent with the high number of wetspells over Zambia. Over the tropicalwestern Indian Ocean, an anticyclonicanomaly is present in the 850 hPa mois-ture flux plot, leading to weaker low
59
°E
.995 sigma
.2101 sigma
°N/S
°N/S
20
15
10
5
0
5
10
15
20
25
30
35
40
20
15
10
5
0
5
10
15
20
25
30
35
40
0
–1.8
–4 4–3 3–2 2–1 10
1.8–1.2 1.2–0.6 0.60
10 20 30 50 60 7040 80 90 100 110 120 130 140
°E0 10 20 30 50 60 7040 80 90 100 110 120 130 140
NOAA-CIRES/Climate Diagnostics Center
NOAA-CIRES/Climate Diagnostics Center
°S
0
5
10
15
20
25
30
35
40
45
50
°E/W
NOAA-CIRES/Climate Diagnostic Center
10 0
–15 –12 –9 –6 –3 0 3 6 9 12 15
10 20 30 50 60 7040 80
Fig. 13. DJF 850 hPa geopotential height composite anomalies (m) during yearswith anomalously high frequency of dry spells (1983, 1987, 1992, 1995, 1998)
Fig. 12. Lower and upper level velocity potential (106 m2 s–1) during yearswith anomalously high frequency of dry spells (1983, 1987, 1992, 1995, 1998)

Clim Res 32: 49–62, 2006
level monsoonal westerlies. As a result,less moisture from the NE monsoon isadvected away from East Africa bythese westerlies implying more low levelmoisture present over tropical southernAfrica and favourable rainfall condi-tions.
6. CONCLUSIONS
Dry/wet spell characteristics for Zam-bia and their associated circulationanomalies were analysed. The southernpart of Zambia is frequently subjectedto seasons with increased dry spellfrequency, whereas northern Zambiatypically has relatively few dry spellsduring the austral summer (DJF) rainyseason. This decrease in dry spells overthe north is likely due to the position ofthe ITCZ, which is located over the areaduring the summer. An increase in dryspell frequency is observed over southernZambia during all El Niño years, reflect-ing the influence of this climate mode onZambia. However, not all seasons withanomalously high dry spell frequencycorrespond to El Niño. Although La Niñagenerally leads to favourable rainy condi-tions over Zambia, anomalously high dryspells over the country occurred duringthe 1999/2000 La Niña summer. In thisparticular case, it seemed that a few verystrong tropical storms caused very wet
60
a
b
0
5
10
15
20
25
30
35
40
0
5
10
15
20
25
30
35
40
°E/W
850 hPa
350 hPa
°S°S
10 0 10 20 30 500.001
0.01
60 7040 80
10 0 10 20 30 50 60 7040 80
a b
°S
0
5
10
15
20
25
30
35
40
45
50
0
5
10
15
20
25
30
35
40
45
5010 0
–14 –10 –6 –2 2 –30 –20 –10 0 10 20 306 10 14
10 20 30 50 60 7040 80°W/E°W/E
10 0 10 20 30 50 60 7040 80
NOAA-CIRES/Climate Diagnostics Center NOAA-CIRES/Climate Diagnostics Center
Fig. 14. DJF 850 hPa geopotential height anomalies (m) for non-El Niño seasons with anomalously high frequency in dry spell anomalies. (a) 1979/1980, (b) 1999/2000
Fig. 15. Moisture flux anomalies (kg kg–1 m s–1) at (a) 850 and (b) 350 hPa levelsduring years with anomalously high frequency of wet spells. Arrows below
panel: scale vectors. Zambia shaded grey

Hachigonta & Reason: Dry and wet spells over Zambia
conditions south of Zambia and the subsid-ing outflow from these led to increased dryspells over Zambia itself.
The northern region of the country typ-ically experiences a large number of wetspells during the summer season. Seasonswith above average number of wet spellstend to be those with an enhanced AngolaLow importing more moisture off the trop-ical SE Atlantic Ocean into the region andlow level westerly anomalies over Zambia.The importance of the latter feature is thatit opposes the mean easterly flow over thesouthern part of the country, leading tolow level convergence of moisture ema-nating from the SE Atlantic with that orig-inating from the western Indian Ocean. Inaddition, there is often a link between thisfeature and the ITCZ, as well as a re-duction in the export of moisture awayfrom East Africa over the tropical IndianOcean by weaker than average mon-soonal westerlies during seasons with in-creased wet spell frequency. As a result,there is more low level moisture conver-gence over tropical southern Africa, andhence an increase in the number of wetspells. During seasons with more wetspells, the tropical easterly jet is weaker,suggesting that rain-producing systemswill track more slowly across tropicalsouthern Africa leading to more wet spellsover Zambia.
61
a b°S °S
0
5
10
15
20
25
30
35
40
0
5
10
15
20
25
30
35
400 10 20 30 50405
–4 4–3 3–2 2–1 10 –0.021 –0.015 –0.009 –0.003 0.003 0.009 0.015 0.021
15 25 35 45 0 10 20 30 50405 15 25 35 45
NOAA-CIRES/Climate Diagnostics Center NOAA-CIRES/Climate Diagnostics Center
°E °E
Fig. 16. (a) DJF low level divergence (10–6 s–1); (b) omega (Pa s–1) at the 500 hPa level, during years with anomalously high frequencies of wet spells (1986, 1989, 1990, 1993, 1996, 1997, 2001)
°N/S
°N/S
20
15
10
5
0
5
10
15
20
25
30
35
40
20
15
10
5
0
5
10
15
20
25
30
35
40
–1.8 –1.2 –0.6 0
0–0.1 0.1–0.2 0.2–0.3 0.3–0.4 0.4–0.5 0.5
0.6 1.2 1.8
NOAA-CIRES/Climate Diagnostics Center
NOAA-CIRES/Climate Diagnostics Center
°E0 10 20 30 50 60 7040 80 90 100 110 120 130 140
°E
.995 sigma
.2101 sigma
0 10 20 30 50 60 7040 80 90 100 110 120 130 140
Fig. 17. Lower and upper level velocity potential (106 m2 s–1) during years withanomalously high frequency of wet spells (1986, 1989, 1990, 1993, 1996, 1997, 2001)

Clim Res 32: 49–62, 2006
The frequencies of both dry and wet spells overZambia during the main summer rainy season show astrong statistical relationship with the Niño 3.4 SSTindex, particularly for the southern part of the country.Relationships with Indian Ocean SST anomalies werealso explored, but these were weaker than those foundfor Niño 3.4 SST. The physical relationship betweenNiño 3.4 SST and dry spell frequencies results from thePacific SST anomalies generating regional atmos-pheric circulation anomalies over southern Africa, assummarised in the previous 2 paragraphs. Given thatthis relationship appears to exist, it may be possible touse the state of Niño 3.4 in the austral spring or evenwinter to predict behaviour of wet and dry spells dur-ing the summer rainy season across (at least) southernZambia prior to the start of the rains. This possibilityneeds to be fully explored in future research, given thegreat importance of these fundamental aspects ofZambian climate for core user groups in agriculture,water resources, health, tourism and wildlife manage-ment.
Acknowledgements. This work arises from part of the firstauthor’s MSc thesis. Partial funding from the NationalResearch Foundation is gratefully acknowledged. We thankM. Tadross for helpful discussions and D. Jagadheesha forprogramming assistance.
LITERATURE CITED
Allan RJ, Lindesay JA, Parker DE (1996) El Niño SouthernOscillation and climatic variability. CSIRO Press, Colling-wood
Behera SK, Yamagata T (2001) Subtropical SST dipole eventsin the southern Indian Ocean. Geophys Res Lett 28:327–330
Cook C, Reason CJC, Hewitson H (2004) Wet and dry spellswithin particularly wet and dry summers in the SouthAfrican summer rainfall region. Clim Res 26:17–31
Cressman GP (1959) An operational objective analysis system.Mon Weather Rev 87:367–374
Dyson LL, van Heerden J (2001) The heavy rainfall and floodsover the northeastern interior of South Africa duringFebruary 2000. S Afr J Sci 97:80–86
Goddard L, Graham NE (1999) The importance of the IndianOcean for simulating rainfall anomalies over eastern andsouthern Africa. J Geophys Res 104:19099–19116
Hermes JC, Reason CJC (2005) Ocean model diagnosis ofinterannual co-evolving SST variability in the South Indianand Atlantic Oceans. J Clim 18:2864–2882
Johnston PA, Archer ERM, Vogel CH, Bezuidenhout CN,Tennant WJ, Kuschke R (2004) Review of seasonal fore-casting in South Africa: producer to end-user. Clim Res28:67–82
Kalnay E, Kanamitsu M, Kistler R, Collins W and 18 others(1996) The NCEP/NCAR 40-year reanalysis project. BullAm Meteorol Soc 77:437–471
Kiladis GN, Mo KC (1998) Interannual and intraseasonalvariability in the Southern Hemisphere. In: KarolyDJ, Vincent DG (eds) Meteorology of the SouthernHemisphere. Am Meteorol Soc Monogr, Boston, MA,p 307–336
Klopper E (1999) The use of seasonal forecasts in South Africaduring the 1997/98 rainfall season. Water SA 25(3):311–316
Lindesay JA (1988) South African rainfall, the SouthernOscillation and a Southern Hemisphere semi-annualcycle. J Clim 8:17–30
Matarira CH, Jury MR (1992) Contrasting meteorologicalstructure of intra-seasonal wet and dry spells in Zim-babwe. Int J Climatol 12:165–176
Reason CJC (2001) Subtropical Indian Ocean SST dipoleevents and southern African rainfall. Geophys Res Lett 28:225–228
Reason CJC (2002) Sensitivity of the southern African circula-tion to dipole SST patterns in the South Indian Ocean. IntJ Climatol 22:377–393
Reason CJC, Keibel A (2004) Tropical Cyclone Eline and itsunusual penetration and impacts over southern Africa.Weather Forecast 19(5):789–805
Reason CJC, Allan RJ, Lindesay JA, Ansell TJ (2000) ENSOand climatic signals across the Indian Ocean basin in theglobal context. Part I. Interannual composite patterns. IntJ Climatol 20:1285–1327
Reason CJC, Hachigonta S, Phaladi RF (2005) Interannualvariability in rainy season characteristics over the Lim-popo region of southern Africa. Int J Climatol 25(14):1835–1853
Rouault M, Florenchie P, Fauchereau N, Reason CJC (2003)South East Atlantic warm events and southern Africanrainfall. Geophys Res Lett 30(5):8009, doi:10.1029/2002GL014840
Saji NH, Goswami BN, Vinayachandran PN, Yamagata T(1999) A dipole mode in the tropical Indian Ocean. Nature401:360–363
Stewart JI (1988) Response farming in rain-fed agriculture.The Wharf Foundation Press, Davis, CA
Tadross M, Hewitson BC, Usman MT (2005) The inter-annualvariability of the onset of the growing season over south-ern Africa. J Clim 18(16):3356–3372
Usman MT, Reason CJC (2004) Dry spell frequencies andtheir variability over southern Africa. Clim Res 26:199–211
Vogel C, O’Brien K (2003) Climate forecasts in southernAfrica. In: O’Brien K, Vogel C (eds) Coping with climatevariability: the use of seasonal forecasts in southernAfrica. Ashgate, Aldershot, p 75–96
Webster PJ, Loschnigg JP, Moore AM, Leben RR (1999) Thegreat Indian Ocean warming of 1997–1998: evidenceof coupled oceanic-atmospheric instabilities. Nature 401:356–360
Xie P, Arkin PA (1997) Global precipitation: a 17-yearmonthly analysis based on gauge observations, satelliteestimates and numerical model outputs. Bull Am MeteorolSoc 78:2539–2558
62
Editorial responsibility: Madhar L. Khandekar, Unionville, Ontario, Canada
Submitted: August 5, 2005; Accepted: March 11, 2006Proofs received from author(s): July 24, 2006