
INTERACTION OF SYMPATHETIC NERVOUS SYSTEM AND RENIN...
49
INTERACTION OF SYMPATHETIC NERVOUS SYSTEM AND RENIN ANGIOTENSIN SYSTEM IN RENAL HAEMODYNAMICS OF RENAL FAILURE, HYPERTENSIVE AND RENAL FAILURE HYPERTENSIVE RATS FATHIHAH BINTI BASRI UNIVERSITI SAINS MALAYSIA 2009
Transcript of INTERACTION OF SYMPATHETIC NERVOUS SYSTEM AND RENIN...
INTERACTION OF SYMPATHETIC NERVOUS
SYSTEM AND RENIN ANGIOTENSIN SYSTEM IN
RENAL HAEMODYNAMICS OF RENAL FAILURE,
HYPERTENSIVE AND RENAL FAILURE
HYPERTENSIVE RATS
FATHIHAH BINTI BASRI
UNIVERSITI SAINS MALAYSIA
2009
INTERACTION OF SYMPATHETIC NERVOUS SYSTEM AND RENIN ANGIOTENSIN SYSTEM IN RENAL HAEMODYNAMICS OF RENAL
FAILURE, HYPERTENSIVE AND RENAL FAILURE HYPERTENSIVE RATS
FATHIHAH BINTI BASRI
UNIVERSITI SAINS MALAYSIA
2009
INTERACTION OF SYMPATHETIC NERVOUS SYSTEM AND RENIN ANGIOTENSIN SYSTEM IN RENAL HAEMODYNAMICS OF RENAL
FAILURE, HYPERTENSIVE AND RENAL FAILURE HYPERTENSIVE RATS
by
FATHIHAH BINTI BASRI
Thesis submitted in fulfillment of the requirements for the degree of
Master of Science
March 2009
INTERAKSI ANTARA SISTEM SARAF SIMPATETIK DAN RENIN ANGIOTENSIN KE ATAS HEMODINAMIK GINJAL DALAM KEGAGALAN
GINJAL, HIPERTENSI DAN GABUNGAN KEGAGALAN GINJAL DAN HIPERTENSI
oleh
FATHIHAH BINTI BASRI
Tesis yang diserahkan untuk memenuhi keperluan bagi Ijazah Sarjana Sains
March 2009
ii
ACKNOWLEDGEMENTS
Allah has blessed me abundantly. It is because of Him that this work was possible.
It was a labour of love and took the combined effort of many special people. I
especially wish to acknowledge the following:
My father and mother, Encik Basri bin Abdul Rani and Puan Asnah binti
Karim@Abdullah, who I’m indebted to for life, raised me with love and
understanding while giving me as many opportunities as they could find and provide.
Through my mother and father, Allah gave me Suriani and Nur Syifa. While my
mother and father are the foundation of my life, my sisters act as the backbone.
They’re own successes and continued support give me the strength to continue to
reach goal’s that are unimaginable. THANK YOU for being my role models and
support. I LOVE YOU more than you can imagine.
I am enormously grateful to my sponsor, National Science Fellowship and Universiti
Sains Malaysia. Thanks to Associate Professor (Dr.) Syed Azhar Syed Sulaiman, the
Dean of School of Pharmaceutical Sciences, Universiti Sains Malaysia.
Professor Dr. Munavvar, having you as a mentor and ‘ayah angkat’ has meant the
world to me. I’m especially thankful for your patience, guidance, loving and genuine
support to this naughty ‘anak angkat’. To Professor Dr. Nor Azizan, thank you for
the unmeasured guidance, expert feedback and advice.
Research can be particularly difficult which is why I’m overwhelmingly thankful for
the greatest laboratory mates I could ask for during my graduate career. First, to Dr
Md Abdul Hye Khan (Tito), thank you for the support, encouragement, and
entertainment. To my big, grumpy, ‘bulat’ brother Dr Hassaan Rathore, you were
always there to scold, listened and motivated me, from which I always benefit. Thus
this little sister will be continuing to bother you often. Raisa, Anand, Mohammad and
Ibrahim, thank you for your continuous support and sharing adventure and laugh
with me.
iii
I thank Dr Aidi and his wife, Dr Lilis for your inspired support at the beginning until
completion of this study. Your positive spirit, help, motivation has supported me
through my difficult times.
NurJannah Mohamad Hussein, thank you so much for keeping a smile on my face.
You led me to believe that everything was going great even when things weren’t
working at all. It’s because of you that failure never found its way into my spirit. I
could not ask for a better sounding board and friend. Thank you for her continued
friendship of almost 10 years.
Lastly I’d also like to thank a host of friends for their support during this time:
Haniza, Husna, Hanan, Dr Anisa, Dr Liyana, Dr Farah, Dr Aspa, Hasnida, Farah,
Omar Al-Aadhamy, Renuga, Nadiyah, Umair, Firdaus, my usrah friend, thank you
for the smiles and stress relieving laughter and all the staff at School of
Pharmaceutical Sciences, USM especially Encik Hadi, Mrs Yong, Mr Wan, Pakcik
Hassan, Pakcik Yusof, Mr Tan, Pakcik Rosli, Pakcik Suhaimi, Mr Basri, Encik
Firdaus, Encik Farid, Encik Nizam, Mrs Chan, Selva, Su, Kak Ida, Kak Norisah, Kak
Mahfuzah and Hani for their continued responsiveness to my needs.
Thanks for the memories
Fathihah Basri
March 09’
iv
TABLE OF CONTENTS
Page
Acknowledgements ii
Table of Contents iv
List of Tables xi
List of Figures xiii
List of Symbols and Abbreviations xvi
Abstrak xix
Abstract xxi
CHAPTER 1 – LITERATURE REVIEW 1
1.1. The Kidney 1
1.1.1. Basic Anatomy 1
1.1.1.a. Juxtaglomerular Apparatus 2
1.1.2 Renal Functions 3
1.1.3 Renal Haemodynamics 3
1.1.4. Renal Autoregulation 5
1.2. Acute Renal Failure 11
1.2.1. Vascular Component 15
1.2.2. Tubular Component 16
1.2.3. Cisplatin Induced Acute Renal Failure 22
1.3. Hypertension 26
1.4. Adrenoceptors 30
1.4.1 α adrenoceptors 31
1.4.2 α1-adrenoceptors 32
v
1.4.3 α2-adrenoceptors 35
1.5. Renin Angiotensin System (RAS) 37
1.5.1 Losartan (AT1 receptor antagonist) 42
1.6 Sympathetic Nervous System 46
1.6.1 Renal Sympathetic Nerve Activity (RSNA) 49
1.6.2 Sympathectomy 51
1.6.3 Interaction between Sympathetic Nervous System
(SNS) and Renin-Angiotensin System (RAS) 54
1.7 Objectives 56
CHAPTER 2 – MATERIALS AND METHODS 57
2.1. Experimental Animals 57
2.2. Experimental Groups 58
2.2.1 Development of Cisplatin induced ischemic acute
renal failure model 59
2.2.2 Preparation of sympathectomized rats 60
2.2.3 Preparation of losartan-treated rats 62
2.2.4 Preparation of 6-OHDA in combination with 63
losartan treated-rats
2.3. Acute Study 65
2.3.1. Determination of Mean Arterial Pressure (MAP)
and Renal Blood Flow (RBF) Basal Values 68
2.3.2. Acute Renal Vasoconstrictor Responses 68
2.3.3. Termination of the Experiment 69
2.4. Time Control 69
vi
2.5. Urine and Plasma Sodium (UNa and PNa) Estimation 70
2.6. Creatinine Analysis 70
2.6.1 Urine Creatinine Analysis 71
2.6.2 Plasma Creatinine Estimation 72
2.7. Renal Functional Parameter 72
2.8. Determination of Kidney Index 73
2.9. Statistical Analysis 74
2.10. Lists of Chemicals 75
2.11. Lists of Equipments 76
CHAPTER 3 – RESULTS 78
3.1. Body Weight 78
3.2. 24 hourly Water Intake 79
3.3. 24 hourly Urinary Output 80
3.4. 24 hourly Urinary Sodium Excretion (UNa) 81
3.5. Plasma Sodium (PNa) 82
3.6. 24 hourly Urinary Creatinine (UCr) 82
3.7. Plasma Creatinine (PCr) 83
3.8. Fractional excretion of sodium (FENa ) 83
3.9. Creatinine Clearance 84
3.10. Kidney index 84
3.11. Baseline Values of Mean Arterial Pressure (MAP) 85
a) Comparison between different pre-treatment
within each disease 85
vii
b) Comparison between different pathological states
within each pre-treatment 86
3.12. Baseline Values of Renal Blood Flow (RBF) 86
a) Comparison between different pre-treatment
within each disease 86
b) Comparison between different pathological states
within each pre-treatment 88
3.13 Acute renal vasoconstrictor responses 97
a) Acute renal vasoconstrictor response in the renal
vasculature of rats with different pre-treatments
(control, 6OHDA, Losartan, 6OHDA+Losartan) 97
3.13.1. Non-renal failure WKY 97
3.13.1.1. Renal Nerve Stimulation 97
3.13.1.2. Noradrenaline 99
3.13.1.3. Phenylephrine 100
3.13.1.4. Methoxamine 101
3.13.1.5. Angiotensin II 102
3.13.2. Renal failure WKY 104
3.13.2.1. Renal Nerve Stimulation 104
3.13.2.2. Noradrenaline 105
3.13.2.3. Phenylephrine 106
3.13.2.4. Methoxamine 107
3.13.2.5. Angiotensin II 109
3.13.3. Non-renal failure SHR 110
3.13.3.1. Renal Nerve Stimulation 110
viii
3.13.3.2. Noradrenaline 111
3.13.3.3. Phenylephrine 112
3.13.3.4. Methoxamine 114
3.13.3.5. Angiotensin II 115
3.13.4. Renal Failure SHR 116
3.13.4.1. Renal Nerve Stimulation 116
3.13.4.2. Noradrenaline 117
3.13.4.3. Phenylephrine 118
3.13.4.4. Methoxamine 119
3.13.4.5. Angiotensin II 120
b) Acute renal vasoconstrictor response in the renal
vasculature of rats with different pathological
states (non-renal failure, renal failure, hypertension,
renal failure associated hypertension) 144
3.13.5. CONTROL 144
3.13.5.1. Renal Nerve Stimulation 144
3.13.5.2. Noradrenaline 145
3.13.5.3. Phenylephrine 146
3.13.5.4. Methoxamine 148
3.13.5.5. Angiotensin II 149
3.13.6. Treatment with 6OHDA 150
3.13.6.1. Renal Nerve Stimulation 150
3.13.6.2. Noradrenaline 151
3.13.6.3. Phenylephrine 152
3.13.6.4. Methoxamine 153
ix
3.13.6.5. Angiotensin II 155
3.13.7. Treatment with LOSARTAN 156
3.13.7.1. Renal Nerve Stimulation 156
3.13.7.2. Noradrenaline 157
3.13.7.3. Phenylephrine 158
3.13.7.4. Methoxamine 159
3.13.7.5. Angiotensin II 160
3.13.8. Treatment with combination of
6OHDA and LOSARTAN 161
3.13.8.1. Renal Nerve Stimulation 161
3.13.8.2. Noradrenaline 163
3.13.8.3. Phenylephrine 164
3.13.8.4. Methoxamine 165
3.13.8.5. Angiotensin II 166
CHAPTER 4 – DISCUSSION 173
4.1. Animals and pathological model 174
4.2. Metabolic studies 175
4.3. Rationale of drugs and doses 178
4.4. Renal vasoconstrictor responses 180
4.4.1. Comparison between different pre-treatment
(control, 6OHDA, losartan and 6OHDA + losartan)
within each disease 180
4.4.2. Comparison between different pathological states
x
(non-renal failure, renal failure, hypertension,
renal failure associated hypertension) within
each pre-treatment. 186
CHAPTER 5 – CONCLUSION 192
BIBLIOGRAPHY 194
APPENDICES
PUBLICATION LIST
xi
LIST OF TABLES
Page
Table 1.1 Pathophysiologic consequences of acute renal failure. 21
Table 1.2 Classification of Blood Pressure for Adults Aged >/= 18
Years: JNC 7 vs JNC 6
29
Table 1.3
Identification of adrenoceptor subtypes in some large
arteries, veins and resistance vessels as demonstrated by
functional assays, receptor binding methods mRNA
analysis
34
Table 2.1 Experimental regime for non-renal failure and renal
failure WKY and SHR
60
Table 2.2 Experimental regime for non-renal failure and renal
failure sympathectomized WKY and SHR
61
Table 2.3 Experimental regime for non-renal failure and renal
failure losartan-treated WKY and SHR
62
Table 2.4 Experimental regime for non-renal failure and renal
failure sympathectomized losartan-treated WKY and
SHR
63
Table 2.5 Doses of the vasoconstrictor agents administered
intrarenally
69
Table 2.6 Urine creatinine analysis 71
Table 3.1 Body weight in control, 6OHDA, losartan and
6OHDA+losartan treated non-renal failure and renal
failure WKY and SHR
89
Table 3.2 24 hourly water intake in control, 6OHDA, losartan and
6OHDA+losartan treated non-renal failure and renal
failure WKY and SHR
90
Table 3.3 24 hourly urine output in control, 6OHDA, losartan and
6OHDA+losartan treated non-renal failure and renal
failure WKY and SHR
91
Table 3.4
24 hourly urine sodium excretion in control, 6OHDA,
losartan and 6OHDA+losartan treated non-renal failure
and renal failure WKY and SHR
92
Table 3.5
Urinary creatinine in control, 6OHDA, losartan and
93
xii
6OHDA+losartan treated non-renal failure and renal
failure WKY and SHR
Table 3.6 Plasma sodium and plasma creatinine in control,
6OHDA, losartan and 6OHDA+losartan treated non-
renal failure and renal failure WKY and SHR
94
Table 3.7 Creatinine clearance and fractional excretion of sodium
in renal failure WKY and SHR rats of D0 (before
induction of renal failure) and D4(after induction of
renal failure)
95
Table 3.8 Kidney index of control, 6OHDA, losartan and
6OHDA+losartan treated non-renal failure and renal
failure WKY and SHR
95
Table 3.9 Mean arterial pressure (mmHg) in control, 6OHDA,
losartan and 6OHDA+losartan treated non-renal failure
and renal failure WKY and SHR
96
Table 3.10 Baseline value of renal blood flow in control, 6OHDA,
losartan and 6OHDA+losartan treated non-renal failure
and renal failure WKY and SHR
96
Table 3.11 Overall percentage decrease in renal blood flow to RNS
in control, 6OHDA, Losartan and 6OHDA+Losartan
treated WKY and SHR
142
Table 3.12 Overall percentage decrease in renal blood flow to NA
in control, 6OHDA, Losartan and 6OHDA+Losartan
treated WKY and SHR
142
Table 3.13 Overall percentage decrease in renal blood flow to PE
in control, 6OHDA, Losartan and 6OHDA+Losartan
treated WKY and SHR
142
Table 3.14 Overall percentage decrease in renal blood flow to ME
in control, 6OHDA, Losartan and 6OHDA+Losartan
treated WKY and SHR
143
Table 3.15 Overall percentage decrease in renal blood flow to Ang
II in control, 6OHDA, Losartan and 6OHDA+Losartan
treated WKY and SHR
143
xiii
LIST OF FIGURES
Page
Figure 1.1 Proposed classification scheme for acute renal failure
(ARF).
12
Figure 1.2 Classification and major causes of acute renal failure 14
Figure 1.3 Tubular changes in the pathophysiology of ischaemic
acute tubular necrosis
18
Figure 1.4 Overview of the pathophysiological events in cisplatin
nephrotoxicity
24
Figure 1.5 Pathogenesis of essential hypertension 27
Figure 1.6 The renin-angiotensin system with representative
plasma concentrations
37
Figure 2.1 Experimental groups 58
Figure 2.2 Simplified experimental protocol for metabolic data
collection
64
Figure 2.3 Experimental protocol during acute study of renal
haemodynamics
67
Figure 3.1 Renal vasoconstrictor responses to RNS in control,
6OHDA, Losartan and combination of
6OHDA+Losartan in non-renal failure WKY
122
Figure 3.2 Renal vasoconstrictor responses to NA in control,
6OHDA, Losartan and combination of
6OHDA+Losartan in non-renal failure WKY
123
Figure 3.3 Renal vasoconstrictor responses to PE in control,
6OHDA, Losartan and combination of
6OHDA+Losartan in non-renal failure WKY
124
Figure 3.4 Renal vasoconstrictor responses to ME in control,
6OHDA, Losartan and combination of
6OHDA+Losartan in non-renal failure WKY
125
Figure 3.5 Renal vasoconstrictor responses to Ang II in control,
6OHDA, Losartan and combination of
6OHDA+Losartan in non-renal failure WKY
126
xiv
Figure 3.6 Renal vasoconstrictor responses to RNS in control,
6OHDA, Losartan and combination of
6OHDA+Losartan in renal failure WKY
127
Figure 3.7 Renal vasoconstrictor responses to NA in control,
6OHDA, Losartan and combination of
6OHDA+Losartan in renal failure WKY
128
Figure 3.8 Renal vasoconstrictor responses to PE in control,
6OHDA, Losartan and combination of
6OHDA+Losartan in renal failure WKY
129
Figure 3.9 Renal vasoconstrictor responses to ME in control,
6OHDA, Losartan and combination of
6OHDA+Losartan in renal failure WKY
130
Figure 3.10 Renal vasoconstrictor responses to Ang II in control,
6OHDA, Losartan and combination of
6OHDA+Losartan in renal failure WKY
131
Figure 3.11 Renal vasoconstrictor responses to RNS in control,
6OHDA, Losartan and combination of
6OHDA+Losartan in non-renal failure SHR
132
Figure 3.12 Renal vasoconstrictor responses to NA in control,
6OHDA, Losartan and combination of
6OHDA+Losartan in non-renal failure SHR
133
Figure 3.13 Renal vasoconstrictor responses to PE in control,
6OHDA, Losartan and combination of
6OHDA+Losartan in non-renal failure SHR
134
Figure 3.14 Renal vasoconstrictor responses to ME in control,
6OHDA, Losartan and combination of
6OHDA+Losartan in non-renal failure SHR
135
Figure 3.15 Renal vasoconstrictor responses to Ang II in control,
6OHDA, Losartan and combination of
6OHDA+Losartan in non-renal failure SHR
136
Figure 3.16 Renal vasoconstrictor responses to RNS in control,
6OHDA, Losartan and combination of
6OHDA+Losartan renal failure SHR
137
Figure 3.17 Renal vasoconstrictor responses to NA in control,
6OHDA, Losartan and combination of
6OHDA+Losartan in renal failure SHR
138

xv
Figure 3.18 Renal vasoconstrictor responses to PE in control,
6OHDA, Losartan and combination of
6OHDA+Losartan in renal failure SHR
139
Figure 3.19 Renal vasoconstrictor responses to ME in control,
6OHDA, Losartan and combination of
6OHDA+Losartan in renal failure SHR
140
Figure 3.20 Renal vasoconstrictor responses to Ang II in control,
6OHDA, Losartan and combination of
6OHDA+Losartan in renal failure SHR
141
Figure 3.21 Overall percentage decrease in renal blood flow to RNS
in control, 6OHDA, Losartan and 6OHDA+Losartan
treated WKY and SHR
168
Figure 3.22 Overall percentage decrease in renal blood flow to NA
in control, 6OHDA, Losartan and 6OHDA+Losartan
treated WKY and SHR
169
Figure 3.23 Overall percentage decrease in renal blood flow to PE
in control, 6OHDA, Losartan and 6OHDA+Losartan
treated WKY and SHR
170
Figure 3.24 Overall percentage decrease in renal blood flow to ME
in control, 6OHDA, Losartan and 6OHDA+Losartan
treated WKY and SHR
171
Figure 3.25 Overall percentage decrease in renal blood flow to Ang
II in control, 6OHDA, Losartan and 6OHDA+Losartan
treated WKY and SHR
172
xvi
LIST OF SYMBOLS AND ABREVIATIONS
% percent
%age percentage
6OHDA 6-hydroxydopamine
alpha
β beta
µg microgram
ANOVA analysis of variance
ANP atrial natriuretic peptide
Ang angiotensin
Ang I angiotensin I
Ang II angiotensin II
ACE angiotensin converting enzyme
ACEi angiotensin converting enzyme inhibitor
ACTH adrenocorticothropic hormone
AT1 angiotensin II receptor subtype type 1
ATN acute tubular necrosis
ATP adenosine triphosphate
ATPase adenosine triphosphatase
ARB angiotensin receptor blocker
ARF acute renal failure
BP blood pressure
BW body weight
cAMP cyclic adenosine monophosphate
CEC chloroethylclonidine
cGMP cyclic guanine monophosphate
Ccr creatinine clearance
CHF congestive heart failure
CNS central nervous system
CRF chronic renal failure
Ctr1 copper transport system
ECF extracellular fluid
eNOS endothelial nitric oxide synthase
ESKD end stage kidney disease
ESRF end stage renal failure
et al. and others
FENA fractional excretion of sodium
g gram
xvii
GFR glomerular filtration rate
IL-1 interleukin-1
iNOS inducible nitric oxide synthase
i.p. intraperitoneally
i.v. intravenously
IGF insulin-like growth factor
IP3 inositol triphosphate
JGC juxtaglomerular cell
kg kilogram
L-NAME N(G)-nitro-L-arginine methyl ester
L/min liter per minute
MAP mean arterial pressure
MAPK mitogen-activated protein kinase
MBF medullary blood flow
MC metabolic cage
ME methoxamine
mg milligram
mg.dl-1
milligram per deciliter
mg.kg-1
milligram per kilogram
ml Milliliter
ml.min-1
.kg-1
milliliter per minute per kilogram
mmHg millimeter mercury
MR myogenic response
mRNA messenger ribonucleic acid
n number of animals
NaCl sodium chloride
NA noradrenaline
NEP neutral-endopeptidase
ng nanogram
NO nitric oxide
NOS nitric oxide synthase
NRFSHRCONTROL non-renal failure SHR (control)
NRFSHR6OHDA 6OHDA treated non-renal failure SHR
NRFSHRLOS losartan treated non-renal failure SHR
NRFSHR6OHDALOS 6OHDA and losartan combination treated non-renal failure
SHR
NRFWKYCONTROL non-renal failure WKY (control)
NRFWKY6OHDA 6OHDA treated non-renal failure WKY
NRFWKYLOS losartan treated non-renal failure WKY
NRFWKY6OHDALOS 6OHDA and losartan combination treated non-renal failure
WKY
xviii
PE phenylephrine
PNa
plasma sodium
PNS peripheral nervous system
RAP renal arterial pressure
RAS renin angiotensin system
RBF renal blood flow
RIFLE Risk of renal dysfunction, Injury to the kidney, Failure of
kidney function, Loss of kidney function and End-stage
kidney disease
RF Renal failure
RFSHRCONTROL renal failure SHR (control)
RFSHR6OHDA 6OHDA treated renal failure SHR
RFSHRLOS losartan treated renal failure SHR
RFSHR6OHDALOS 6OHDA and losartan combination treated renal failure
SHR
RFWKYCONTROL renal failure WKY (control)
RFWKY6OHDA 6OHDA treated renal failure WKY
RFWKYLOS losartan treated renal failure WKY
RFWKY6OHDALOS 6OHDA and losartan combination treated renal failure
WKY
RGD Arg-Gly-Asp sequence
RNS renal nerve stimulation
ROS reactive oxygen species
RPP renal perfusion pressure
RRT renal replacement therapy
RSNA renal sympathetic nerve activity
RT-PCR reverse transcriptase-polymerase chain reaction
RVLM rostral excitory region of the ventrolateral medulla
RVR renal vascular resistance
S3 segment of the proximal tubule and the thick ascending
limb of the Henle loop
SCreat serum creatinine
SHR spontaneously hypertensive rat
SNS sympathetic nervous system
TGF tubuloglomerular feedback
TGF tumor growth factor
UNa
urinary sodium
UO urine output
WB 4101 2-(2,6-Dimethoxyphenoxyethyl)aminomethyl-1,4-
benzodioxa ne hydrochloride
WI water intake
WKY Wistar Kyoto
xix
INTERAKSI ANTARA SISTEM SARAF SIMPATETIK DAN RENIN
ANGIOTENSIN KE ATAS HEMODINAMIK GINJAL DALAM
KEGAGALAN GINJAL, HIPERTENSI DAN GABUNGAN KEGAGALAN
GINJAL DAN HIPERTENSI
ABSTRAK
Adrenoseptor α1 dan reseptor subjenis angiotensin jenis 1 (AT1) memainkan peranan
penting dalam pengawalaturan hemodinamik. Aktiviti simpatetik yang melampau
ialah punca penyakit yang selalu menyebabkan kegagalan ginjal kepada komplikasi
yang seterusnya. Kajian ini membincangkan peranan fungsi adrenoseptor α1 dan
reseptor subjenis angiotensin jenis 1 (AT1) dalam pengantaraan pengecutan salur
darah berintangan di dalam hemodinamik ginjal untuk penyakit kegagalan ginjal,
hipertensi dan gabungan kedua-dua keadaan patologikal dengan penumpuan kepada
interaksi antara sistem saraf simpatetik (SNS) dan sistem renin angiotensin (RAS).
Tikus normotensif WKY dan hipertensi SHR telah digunakan. Kegagalan ginjal
diaruhkan dengan cisplatin (5 mg/kg i.p). Tikus-tikus WKY dan SHR tanpa
kegagalan ginjal dan kegagalan ginjal dibahagikan mengikut rawatan awalan
masing-masing iaitu kawalan, denervasi oleh 6OHDA, losartan (10 mg/kg/day)
(LOS) dan gabungan 6OHDA dan losartan (6OHDALOS). Losartan diberikan secara
oral selama 7 hari sebelum kajian akut. Berat badan, jumlah air yang diminum,
jumlah pengeluaran air kencing, kandungan natrium dan kreatinin dalam air kencing
dan plasma, penyingkiran kreatinin, perkumuhan terpecah natrium dan indeks bacaan
ginjal diukur. Dalam kajian akut, tikus-tikus ini dibiuskan dengan menggunakan
natrium pentobarbiton (60 mg/kg i.p) untuk pengukuran tekanan darah dan
pengaliran darah ginjal. Pengurangan pengaliran darah ginjal terhadap rangsangan
elektrik saraf ginjal, pemberian noradrenalina, fenilefrina, metoksamina dan
angiotensin II secara intra ginjal ditentukan. Data dirakam dengan menggunakan
sistem perolehan data berkomputer dan diekspresikan sebagai purata ± s.e.m serta
xx
dianalisakan dengan ANOVA dua hala diikuti dengan post-hoc Bonferroni pada
tahap signifikasi 5 %. Pengurangan secara signifikan dalam berat badan dan jumlah
air yang diminum, peningkatan dalam jumlah pengeluaran air kencing dan
perkumuhan terpecah natrium serta pengurangan terhadap penyingkiran kreatinin
telah didapati dalam tikus dengan kegagalan ginjal. Dari respon vasokonstriktor
ginjal, saraf ginjal yang sempurna sangat penting dalam pengawalaturan
hemodinamik ginjal. Didapati bahawa fungsi adrenoseptor α1B / α1D dalam interaksi
silang positif dengan reseptor AT1 dipengaruhi dengan kuat oleh simpatektomi dan
losartan. Tambahan lagi, sekatan terhadap RAS telah menghasilkan interaksi positif
dengan SNS. Kajian ini mengukuhkan lagi fakta yang menyatakan aktiviti simpatetik
yang terlampau yang berlaku dalam tikus yang berpenyakit dan keadaan ini lebih
teruk dalam tikus yang mempunyai penyakit berganda. Lagipun di bawah pengaruh
kegagalan ginjal dan hipertensi, terdapat perubahan sumbangan fungsi subjenis
adrenoseptor α1 dalam keadaan aktiviti simpatetik yang terlampau. Kesimpulannya,
kajian ini mencadangkan kemungkinan wujud hubungan silang yang positif antara
adrenoseptor α1 dan reseptor AT1 dan hubungan ini amat dipengaruhi oleh keadaan
patologi kegagalan ginjal dan hipertensi.
xxi
INTERACTION OF SYMPATHETIC NERVOUS SYSTEM AND RENIN
ANGIOTENSIN SYSTEM IN RENAL HAEMODYNAMICS OF RENAL
FAILURE, HYPERTENSIVE AND RENAL FAILURE HYPERTENSIVE
RATS
ABSTRACT
α1-adrenoceptors and angiotensin type 1 (AT1) receptor subtypes play a key role in
the regulation of renal haemodynamics. Sympathetic overactivity is the common
pathogenesis that aggravates renal failure into further complications. This study
discusses the functional role of α1-adrenoceptors and AT1 receptor in mediating the
vasoconstriction of renal resistance vessels in renal haemodynamics of renal failure,
hypertension and combination of both pathological states emphasizing on the
interaction between sympathetic nervous system (SNS) and renin-angiotensin system
(RAS). Normotensive WKY and hypertensive SHR were utilized. Cisplatin (5 mg/kg
i.p) was used to induce renal failure. Non-renal failure and renal failure WKY and
SHR were grouped according to their pre-treament which were control, denervation
by 6-hydroxydopamine (6OHDA), losartan (10 mg/kg/day) (LOS) and a combination
of losartan and 6OHDA (6OHDALOS). Losartan was given orally for 7 days prior to
the acute study. Body weight, water intake, urine output, urine and plasma sodium,
creatinine clearance, fractional excretion of sodium and kidney index were measured.
In acute study, the animals were anesthetized (60 mg/kg i.p. sodium pentobarbitone)
for blood pressure and renal blood flow (RBF) measurements. Reductions in RBF to
electrical stimulation of renal nerve and intrarenal administration of noradrenaline,
phenylephrine, methoxamine and angiotensin II were determined. Data were
recorded using a computerized data acquisition system and expressed as mean ±
s.e.m and analysed by 2-way ANOVA followed by Bonferronni post-hoc test with a
significance level at 5%. Significant reductions in the body weight and water intake,
xxii
increased urine output and fractional excretion of sodium as well as a marked
decrease in the creatinine clearance were observed in the renal failure rats. From the
renal vasoconstrictor responses, an intact renal nerve is very important in regulation
of renal haemodynamics. It seems that functionality of α1B / α1D adrenoceptors in the
positive crosstalk with AT1 receptor was greatly influenced by sympathectomy and
losartan. Furthermore blockade of RAS produced a positive interaction with SNS.
This study further supported that the fact there is exaggerated sympathetic activity in
diseased animals and its severity increases in multiple diseased states. Moreover,
under the influence of renal failure and hypertensive conditions, there was a shift in
functional contributions of α1 adrenoceptors subtype in enhanced sympathetic
conditions. Collectively it is suggested that there was a positive crosstalk relationship
between 1- adrenoceptors and AT1 receptors, and this is greatly influenced by the
pathological conditions of renal failure and hypertension.
1
CHAPTER 1
LITERATURE REVIEW
1.1 The kidney
1.1.1 Basic anatomy
The kidneys are retroperitoneal organs, meaning they lie against the posterior
abdominal wall just behind the peritoneum and can be found on each side of the
spine, specifically located between 12th
thoracic and 3rd
lumbar vertebrae. They are
partially secured by the lower ribs, closely held by a connective tissue renal fascia
and is surrounded by a thick layer of adipose tissue called perirenal fat. The kidneys
are roughly bean shape with an indentation called the hilum, where the renal artery
enters while the renal vein and ureter leave the kidney. Kidney has a granular
appearance. Each kidney is enclosed in a fibrous capsule and composed of cortex and
inner medulla. The cortex and medulla form the parenchyma, which is the functional
tissue of the kidney (Applegate, 2000).
The functional units in the kidney are nephrons. There are over a million nephrons in
each kidney. Each nephron consists of a renal corpuscle, an initial filtering
component and renal tubule. Kidneys’ granular-like appearance is due to the renal
corpucles that are located in the cortex of the kidney. The renal corpuscle filters
blood free from cells and proteins by its component, the glomerulus, a compact tuft
of interconnected capillary. The glomeruli are surrounded by a fluid-filled capsule
called Bowman’s capsule. Blood enters the glomerulus via afferent arterioles and
leaves through efferent arterioles. As blood flows throughout the glomerulus, a
portion of plasma is filtered into Bowman’s capsule, which is continuous with the
renal tubule. Reabsorbtion or excretion process occurs as the filtrate flows all the
2
way through the tubules. Ultimately, all the fluid from all the nephrons exit the
kidneys as urine. The very narrow hollow renal tubules consist of three different
regions which are proximal convoluted tubule, loop of Henle and distal convoluted
tubule. Drains from the Bowman’s capsule are the highly coiled proximal convoluted
tubule. The next portion is loop of Henle which is the sharp hairpin-like loop
consisting of a descending and ascending limb leading to the next tubular segment,
the distal convoluted tubule (Applegate, 2000; Vander et al., 2001).
From the nephrons, urine flow into collecting duct. The distal convoluted tubules
from various nephrons join with each collecting duct. All the way from Bowman’s
capsule to the collecting duct system, each nephron is completely separate from the
others. This separation ends when multiple collecting ducts merge into the minor
calyces that surround the renal papillae. Then the completed urine draws off into the
kidney’s central cavity, the renal pelvis that is continuous with ureter draining the
contents into the bladder (Applegate, 2000; Vander et al., 2001).
1.1.1a Juxtaglomerular apparatus
Areas near the end of ascending limb of nephron loop that are continuous with distal
convoluted tubule converge with glomerular afferent arterioles of that nephron. At
this point the cells of the ascending limb are modified into macula densa and those in
the wall of the afferent arteriole are modified to form the juxtaglomerular cells. The
combination of both cells makes up the juxtaglomerular apparatus where their
function is to secrete renin and monitors blood pressure (Applegate, 2000).
3
1.1.2 Renal functions
First and foremost, the kidneys are one of the decisive organs of fluid balance. This
is because they precisely regulate very hard to keep the balance among the water
concentration, inorganic-ion composition and volume of the internal environment in
the body. Secondly, the kidney is responsible for removal of metabolic waste
products such as urea, uric acid, creatinine and many others from the blood into the
urine as quickly as they are produced. This is to prevent the toxic waste products
from being accumulated in the body. Next is the elimination of the foreign chemicals
like drugs, pesticides, food additives and their metabolites from the blood and urine.
Fourth, kidneys are accountable for gluconeogenesis. Gluconeogenesis is a
biochemical process where glucose, the source of energy synthesised from non-
carbohydrate source like amino acids. Ultimately, the kidneys function as endocrine
glands. They secrete three hormones. These are erythropoietin, renin and 1, 25-
dihydroxyvitamin D3 (Vander et al., 2001).
1.1.3 Renal haemodynamics
Blood flows through the kidney at an approximate rate of 1200 millimeters per
minute. Renal arteries are branched from abdominal aorta. They carry about 20-25%
of total resting cardiac output (5 L/min) into the kidney which is about 1.2 L/min
(Murphy and Robinson, 2006). At the hilum, the renal arteries are divided into
segmental arteries that pass through the renal sinus. Segmental arteries are bifurcated
into interlobular arteries, traverse the renal column and split to form arcuate arteries,
which pass over the base of the pyramids. Subsequently, arcuate arteries divide into
interlobular arteries that extend to the cortex of the kidney and ascend to the afferent
arterioles. From the afferent arterioles, the blood enters the capillaries in the
4
glomerulus and finally exit through efferent arterioles. The renal circulation consist
of two sets of arterioles (afferent and efferent arterioles) and two sets of capillaries
that are glomerulus and peritubular capillaries. The afferent arterioles are also known
as preglomerular arterioles that divide into the tangled capillary network, glomerulus,
which then coalesce to form the efferent arterioles (postglomerular arterioles). Next,
each of efferent arteriole diverges to develop an extensive capillary network, called
peritubular capillaries around the tubular region (proximal and distal convoluted
tubules) of the nephron or form a long hairpin loop of capillaries, known as vasa
rectae. Vasa rectae is another part of peritubular capillaries that loop deep down to
medulla alongside the loop of Henle. Eventually, the peritubular capillaries reunite to
form interlobular veins. From there, the blood flows through the arcuate veins,
interlobular veins, segmental veins and into renal veins, which return the blood to the
inferior vena cava (Ganong, 1999; Applegate, 2000). Approximately, 90% of the
renal blood flow remains in the renal cortex and perfuses the peritubular capillaries.
The remaining 10% of the blood flow perfuses the renal medulla via vasa rectae
(Kriz, 1981; Zimmerhackl et al., 1987; Cupples et al., 1988).
Intrarenal haemodynamics determine the construction of glomerular filtrate, the
reabsorbtion of fluid by peritubular capillaries and the maintenance of a
hyperosmotic medullary environment (Arendshorst and Navar, 2001). There are
several factors either intrinsic or extrinsic to the kidneys that regulate the renal blood
flow. Those major mechanisms intrinsic to kidney are the autoregulatory mechanism,
intrarenal renin-angiotensin mechanism, renal prostaglandin or eicosanoids and
kinins while the extrinsic factors are such as circulating vasoactive agents namely
nitric oxides (NO), purinergic agents such as ATP and adenosine, other peptide
5
hormones including endothelin and atrial natriuretic peptide (ANP) and renal
sympathetic nerve activity (Arendshorst and Navar, 2001).
1.1.4 Renal autoregulation
Autoregulation can be experimentally defined by a rapidly-acting mechanism by the
vascular bed to functionally maintain its perfusion constant from perturbation of
blood pressure that may cause an acute change in renal blood flow (RBF) and
glomerular filtration rate (GFR) (Loutzenhiser et al., 2006). This function is present
in almost all tissues but is particularly pronounced in some organs, such as brain and
kidney (Just, 2007). One of the most striking criteria of the renal circulation is the
competency of the kidney to maintain a constant RBF and GFR as perfusion pressure
fluctuates (Loutzenhiser et al., 2006). There is accrued evidence, which indicates that
autoregulatory response plays a concurrent role in protecting the kidney from
hypertensive injury (Bidani and Griffin, 2004; 2002). Evidence suggests that in the
presence of intact autoregulation, less injury happens in spite of substantial
hypertension. Conversely, susceptibility to hypertensive renal damage is greatly
increased and injury with even moderate hypertension is seen when there is
diminished autoregulatory response. Moreover, when the renal autoregulation is
impaired, there is no evidence of disturbed volume regulation. This shows that intact
renal autoregulation is not an obligate requirement for adequate volume control but it
is important for normal renal protection (Loutzenhiser et al., 2006).
Autoregulation of renal blood flow (RBF) has long been recognized. RBF
autoregulation is believed to be mediated by two mechanisms, the renal myogenic
response (MR) and the tubulo-glomerular feedback (TGF). These two mechanisms
6
either act in concert or differently in their primary role to stabilize renal function by
preventing pressure-induced fluctuations in RBF, GFR and the delivery of filtrate to
the distal tubule (distal delivery). The current view is that when accentuation of
blood pressure occurs, these two mechanisms act parri passu to achieve a precise
regulation of GFR and RBF (Loutzenhiser et al., 2006).
Myogenic response (MR) involves a direct vasoconstriction of the afferent arteriole
in response to stretching forces. A rise in intra-luminal pressure induces
vasoconstriction in vascular smooth muscle. This effect prevails over the passive
distension of the elastic vascular wall and also reduces the diameter of small
resistance vessels below the one at lower pressure. This causes an increased vascular
resistance at higher pressure, thus allowing autoregulation to take place (Just, 2007).
It has been suggested that the primary purpose of MR is to protect the kidney against
the damaging effects of hypertension. This is due to its kinetic attributes which allow
the afferent arterioles to sense elevations in the rapidly oscillating systolic BP and
adjust tone to this signal. Nevertheless this postulation deserves critical evaluation
(Loutzenhiser et al., 2006).
Tubuloglomerular feedback (TGF) is a more complicated mechanism specific to the
kidney. Macula densa senses a flow-dependent signal and alters tone in the adjacent
segment of afferent arteriole via a mechanism that likely involves adenosine and/or
ATP (Castrop et al., 2004(a); Insco et al., 2003; Sun et al., 2001). This leads the
afferent arterioles to contract in response to an increase in the sodium chloride
(NaCl) concentration at the macula densa in the early distal tubule (Komlosi et al.,
2005; Schnermann et al., 1998). At the ascending part of Henle’s Loop, the
7
reabsorption of salts is active and is a rate-limited process. The concentration of
NaCl reaching the macula densa is dependent on the tubular flow rate. Enhanced
tubular flow in response to an increase in arterial pressure raises the NaCl
concentration at macula densa, thus causing vasoconstriction of afferent arteriole.
These actions provide restoration of filtration and autoregulation of RBF (Just,
2007).
It is thought today, perhaps a third regulatory mechanism, that is independent of TGF
but slower than MR, also contributes to a smaller extent of role in mediating renal
autoregulation (Just, 2007). However, much less is known about the contribution of
the third additional mechanism. Since the detection of the third regulating
mechanism has been complicated due to difficulty in eliminating MR without
affecting TGF, Just and Arendshorst (2003) suggested an alternative approach, that
is, by distinguishing between the responsible mechanisms based on their dynamics
and relative contributions. In the experimental setup, continuous inhibition of TGF
by furosemide, it can be seen that based on the response times, the primary increase
in renal vascular resistance (RVR) is due to action of MR and secondary to TGF. It
also establishes evidence for a slow third regulatory component (Just, 2007; Just and
Arendshorst, 2003). However, the underlying nature of the third mechanism awaits
further investigation although possibilities may include angiotensin II (Ang II)
(Cupples, 1993), ATP acting on P2X1 and slow TGF-independent regulation
reflecting a slow component of MR (Just, 2007). Several reports have suggested that
the third regulatory element is more readily noticeable and more significant at lower
pressures than at resting pressure levels which are relatively small and depending on
the complete inhibition of TGF. This element may represent either a fading
8
vasodilator or an accumulating constricting substance with rising renal arterial
pressure (RAP) (Just and Arendshorst, 2003). Other important findings were, in the
absence of TGF, both the strength and speed of the MR were augmented indicating a
negative interaction linking TGF and MR. The enhancement and its acceleration lead
to a more rapid achievement of the steady-state level of autoregulation (Just and
Arendshorst, 2003).
Other regulatory mechanisms may slightly play essential roles in RBF autoregulation
which might impair rather than support the maintenance of a constant flow of blood
by vascular bed. They also may impinge on overall renal function through
modulation of MR or TGF (Just, 2007).
The relative contribution of the responsible mechanisms was estimated based on
initial changes in renal vascular resistance (RVR) which represent that MR is
considerably faster than TGF and the third regulatory mechanism (Just and
Arendshorst, 2003). In the kidney vasculature, MR requires less than 10 seconds for
completion of autoregulatory action. The total response time of TGF is 30-60
seconds and the third regulatory component may contribute 30-60 seconds for the
overall autoregulation of RBF (Just, 2007). Consequently in the study by Just and
Arendshorst (2003), they conclude RBF autoregulation is mediated by each of the
triumvirate: MR, TGF, and the ill-defined third regulatory mechanism are 55%, 35-
45% and 0-12% respectively in response to a rise in renal arterial pressure (RAP)
whilst 73%, 18-27% and 0-9% correspondingly during response to falling RAP in
euvolemic rat. The rationale behind this remains open for exploration. Due to
differences in their response time (kinetic differences), the speed of the overall
9
autoregulation can get affected. Their relative contributions determine the size and
range of pressure fluctuation reaching glomeruli, peritubular capillaries and
medullary perfusion, which therefore will impact on filtration, reabsorption, and
hypertensive renal damage (Just and Arendshorst, 2003).
The balance among the triumvirate contributing to RBF autoregulation can be
influenced by the interaction between them and subjected to modulation, most likely
by Ang II and nitric oxide (NO). A positive interaction has been observed where
activation of TGF causes vasoconstriction on its own and induces the autoregulatory
vasoconstrictor response of MR (Schnermann and Briggs, 1989). Whereas, inhibition
of TGF might not only impair the autoregulation in the segment immediately
affected by TGF but also in upstream part of the vascular tree (Moore and Casellas,
1990).
Ang II is a strong modulator of TGF. It is a very potent vasoconstrictor and has a
strong effect on the baseline level of RBF. Yet the steady-state autoregulation is
neither affected by Ang II infusion (Kiil et al., 1969) and antagonism by angiotensin
converting enzyme inhibitor (ACEi) (Arendshorst and Finn, 1977; Hall et al., 1979;
Persson et al., 1988) nor Ang II receptor antagonists (Hall et al., 1979; Persson et al.,
1988). It also does not influence the balance of each triumvirate contribution of MR,
TGF and the third regulatory mechanism (Just, 2007).
Nitric oxide (NO) strongly modulates TGF by its attenuating influence on the
vasoconstrictor response elicited by high tubular perfusion rates or NaCl
concentration. Nevertheless it does not affect TGF at low perfusion rates (Ito and
10
Ren, 1993). There is evidence that the speed of MR is accelerated in the absence of
NO (Just and Arendshorst, 2005). The nature of this underlying mechanism is still in
ambiguity. For the predominance of MR during inhibition of NO, it is suggested that
MR might naturally dominate the autoregulatory function due to the speed and
upstream location to TGF and the third regulatory mechanism. Therefore, it can
minimize any error signal from reaching the latter mechanisms (Just, 2007). Despite
a strong and continuous vasodilator influence of endogenous NO on baseline RBF,
steady-state autoregulation is typically not affected by inhibition of NO production
(Baumann et al., 1992; Beierwaltes et al., 1992; Majid and Navar, 1992).
In summary, RBF autoregulation is primarily mediated by rapid MR and TGF,
contributing ~50% and 35-50% respectively and even more sluggish third regulatory
mechanism appears to contribute < 15% at resting arterial pressure (Just, 2007; Just
and Arendshorst, 2003).

11
1.2 Acute renal failure
Acute renal failure (ARF) can be characterized as an abrupt deterioration of the
glomerular filtration rate (GFR) over a period of hours to days resulting in the failure
of the kidney to excrete neither nitrogenous (urea and creatinine) nor non-
nitrogenous waste products and to maintain fluid and electrolytes homeostasis
(Lameire et al., 2005).
Acute renal failure (ARF) is a common complication of critical illness and occurs
anywhere depending on the population being studied and the criteria used to define
its presence. Due to extensively contrasting definitions of ARF, trials of prevention
and therapies are not parallel and hence, have complicated the research about ARF
(Bellomo et al., 2004; Mehta et al., 2007). It is increasingly recognized to be a broad
clinical entity rather than a specific diagnosis (Murphy and Robinson, 2006). There
are more than 30 separate definition of ARF found in the literature that is
objectionable. ARF definition can range from severe to slight increases in serum
creatinine concentration. Therefore a practical definition of ARF is acute and
sustained increase in serum creatinine concentration of 44.2 μmol/ L if the baseline is
less than 221 μmol/ L, or an increase in serum creatinine concentration of more than
20% if the baseline is more than 221 μmol/ L ( Singri et al., 2003).
A multilevel definition and classification in a recent attempt at defining renal failure
has been advocated by the Acute Dialysis Quality Initiative group viz. the RIFLE
system (http://www.ccforum.com/content/8/4/R204) (Figure 1.1), which uses a
combination of creatinine and urine output compared with baseline measurements.
These measurements define three severity categories whether the patient is at risk,
12
has an injury, has failure and two clinical outcomes loss of function, or is at end-
stage kidney disease (ESKD). The purpose of this is to acknowledge the important
adaptations that happen in ESKD but not in persistent ARF. Persistent ARF (loss)
mean necessitation for renal replacement therapy (RRT) for more than 4 weeks
whilst ESKD is defined by dialysis requirement for longer than 3 months (Bellomo et
al., 2004).
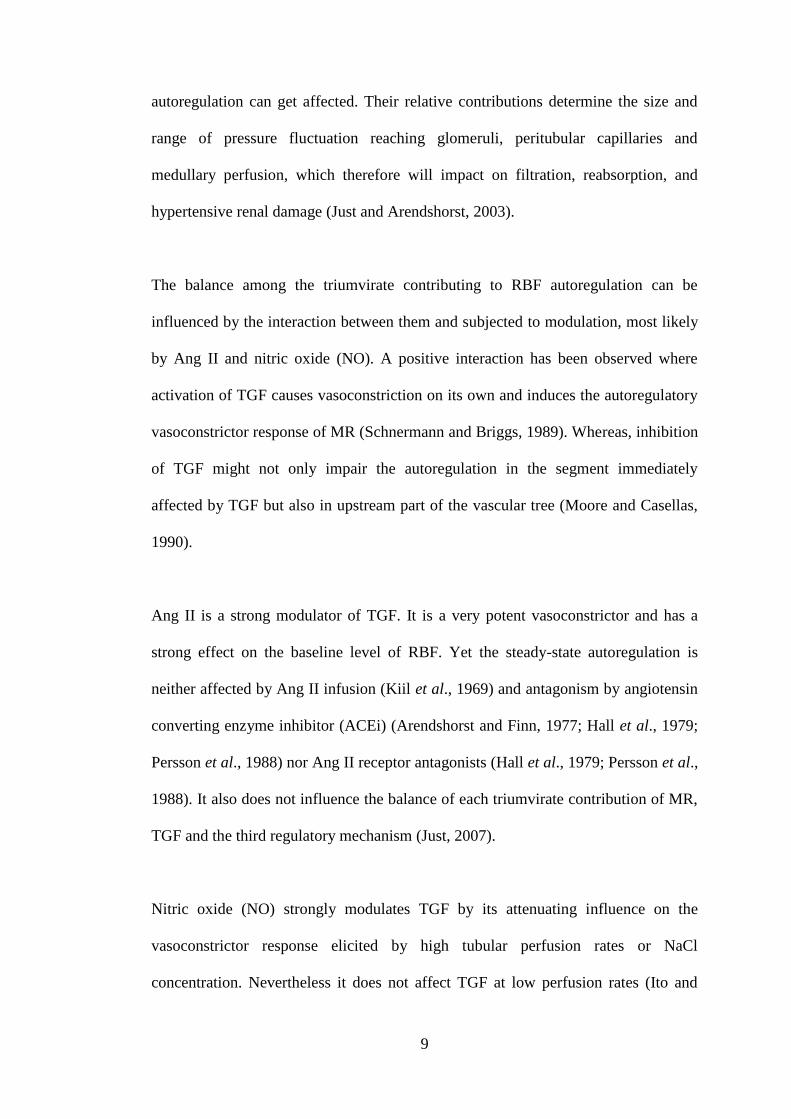
Figure 1.1: Proposed classification scheme for acute renal failure (ARF). The
classification system includes separate criteria for creatinine and urine output (UO).
A patient can fulfill the criteria through changes in serum creatinine (SCreat) or
changes in UO, or both. The criteria that lead to the worst possible classification
should be used. Note that the F component of RIFLE (Risk of renal dysfunction,
Injury to the kidney, Failure of kidney function, Loss of kidney function and End-
stage kidney disease) is present even if the increase in SCreat is under threefold as
long as the new SCreat is greater than 4.0 mg/dl (350 μmol/l) in the setting of an
acute increase of at least 0.5 mg/dl (44 μmol/l). The designation RIFLE-FC should be
used in this case to denote 'acute-on chronic' disease. Similarly, when the RIFLE-F
classification is achieved by UO criteria, a designation of RIFLE-FO should be used
to denote oliguria. The shape of the figure denotes the fact that more patients (high
sensitivity) will be included in the mild category, including some without actually
having renal failure (less specificity). In contrast, at the bottom of the figure the
criteria are strict and therefore specific, but some patients will be missed. *GFR =
Glomerular Filtration Rate; ARF= Acute Renal Failure (Adapted from Bellomo et
al., 2004).
Urine Output Criteria GFR Criteria*
Risk
Injury
Failure
Loss
ESKD
High
Specificity
End Stage Kidney Disease
(>3months)
Persistent ARF*=complete loss of kidney
function >4weeks
Increased SCreatx1.5 or
GFR decrease >25% UO<.5ml/kg/h x 6hr
Increased SCreatx2 or
GFR decrease >50% UO<.5ml/kg/h x 12hr
Increased SCreatx3or
GFR decrease >75%
OR SCreat >4mg/dl Acute rise >0.5mg/dl
UO<.5ml/kg/h x 24hr or
Anuria x 12hrs
(Oliguria)
High
Sensitivity
13
Traditionally, classifications of ARF aetiologies have been identified as prerenal,
postrenal and intrinsic renal azotaemia (Figure 1.2). Prerenal azotaemia (acute
prerenal failure) is a physiological response to renal hypoperfusion which leads to a
reduction in GFR. In the prerenal form, there is a reversible increase in serum
creatinine and blood urea concentrations. It contributes 30-60% of all cases of ARF
and is frequently community-acquired especially affecting aged population. In this
acute prerenal failure, the integrity of the renal tissue is preserved. However it can
complicate any disease characterized by either true hypovolaemia or a reduction in
the effective circulating volume viz. low cardiac output, systemic vasodilation or
intrarenal vasoconstriction (Lameire et al., 2005). Persistent renal hypoperfusion
may progress into ischemic acute tubular necrosis. Prerenal azotaemia and ischemic
acute tubular necrosis are part of a continuum of renal hypoperfusion and together
account for 75% of the cases of acute renal failure (Lameire et al., 2005; 2004).
14
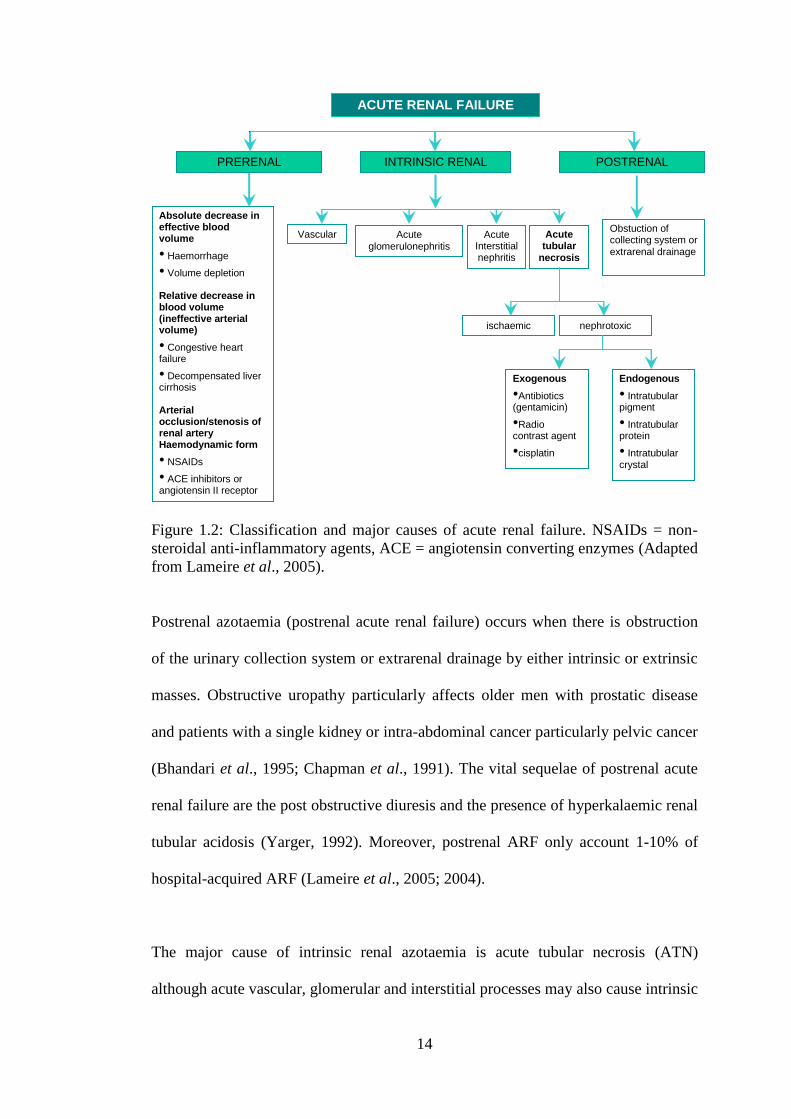
Figure 1.2: Classification and major causes of acute renal failure. NSAIDs = non-
steroidal anti-inflammatory agents, ACE = angiotensin converting enzymes (Adapted
from Lameire et al., 2005).
Postrenal azotaemia (postrenal acute renal failure) occurs when there is obstruction
of the urinary collection system or extrarenal drainage by either intrinsic or extrinsic
masses. Obstructive uropathy particularly affects older men with prostatic disease
and patients with a single kidney or intra-abdominal cancer particularly pelvic cancer
(Bhandari et al., 1995; Chapman et al., 1991). The vital sequelae of postrenal acute
renal failure are the post obstructive diuresis and the presence of hyperkalaemic renal
tubular acidosis (Yarger, 1992). Moreover, postrenal ARF only account 1-10% of
hospital-acquired ARF (Lameire et al., 2005; 2004).
The major cause of intrinsic renal azotaemia is acute tubular necrosis (ATN)
although acute vascular, glomerular and interstitial processes may also cause intrinsic
ACUTE RENAL FAILURE
PRERENAL INTRINSIC RENAL POSTRENAL
Absolute decrease in effective blood volume
• Haemorrhage
• Volume depletion Relative decrease in blood volume (ineffective arterial volume)
• Congestive heart failure
• Decompensated liver cirrhosis Arterial occlusion/stenosis of renal artery Haemodynamic form
• NSAIDs
• ACE inhibitors or angiotensin II receptor antagonist
Vascular Acute
glomerulonephritis
Acute Interstitial nephritis
Acute tubular
necrosis
Obstuction of collecting system or
extrarenal drainage
ischaemic nephrotoxic
Exogenous
•Antibiotics (gentamicin)
•Radio contrast agent
•cisplatin
Endogenous
• Intratubular pigment
• Intratubular protein
• Intratubular crystal
15
ARF. ATN is caused by ischemic or nephrotoxic injury to the kidney in 50% and
35% of all hospital- acquired ARF respectively. There is 30-50% established
decrease of RBF in clinical ATN. The pathophysiology of ATN involves the vascular
and tubular components (Lameire, 2005).
1.2.1 Vascular component
In most of experimental animals, acute ischemic injury has been shown to be
associated with a loss of renal autoregulation (Conger et al., 1988). In normal
autoregulatory response, renal vasodilatation by the vasodilating product of
arachidonic acid (prostaglandin) and nitric oxide will try to counterattack with the
decrease in renal perfusion pressure. However the ischemic kidney is associated with
renal vasoconstriction (Schrier, 2004). Renal vasoconstriction occurs as a result of an
increase in afferent and efferent arteriolar vascular resistance, reduced glomerular
plasma flow and a decrease in glomerular hydrostatic pressure (Conger, 2001).
Enhanced renal sympathetic tone has been observed in the setting of ischemic and
nephrotoxic ATN. Moreover, the vasoconstrictor response to exogenous
norepinephrine and circulating vasoconstrictors such as catecholamine, angiotensin II
and endothelin has been shown to be augmented in the acute ischemic insult. These
renal vascular abnormalities are related to the resultant increase in cytosolic calcium
observed in the afferent arterioles of the glomerulus. Therefore, administration of
calcium channel blockers may reverse the loss of autoregulation, thus reducing the
renal dysfunction of the acute ischemic kidney (Conger et al., 1988).
Outer medullary congestion of the kidney is another vascular hallmark of acute renal
ischaemia by worsening the relative hypoxia in the outer medulla (S3, segment of the
16
proximal tubule and the thick ascending limb of the loop of Henle) (Mason et al.,
1984). Endothelial damage due to increase oxidant injury is also associated with
acute renal ischemia which eventually may enhance the renal vasoconstrictor effect
of circulating pressor agents present in ARF. Oxidant injury results in decreased
endothelial nitric oxide synthase (eNOS) and prostaglandins but leads to increase in
endothelin (Molitoris et al., 2002). The defence action by vasodilating
pharmacological manoeuvres returns the renal blood flow to normal level but GFR
continues to fall (Lameire and Vanholder, 2004; Schrier et al., 2004).
1.2.2 Tubular component
There are three aspects of tubular abnormalities: structural changes, tubular
obstruction and tubuloglomerular balance and tubular fluid backleak in ischemic
acute renal failure. As for structural changes, ARF that is characterized by tubular
dysfunction with impaired sodium and water reabsorption is correlated with the
shedding and excretion of proximal tubule brush border membranes and epithelial
tubule cells into the urine (Thadani et al., 1996). Abnormalities in the proximal
tubule cytoskeleton are associated with translocation of Na+/K+-ATPase from the
basolateral to the apical membrane. This has been shown by in vitro studies using
chemical anoxia (Molitoris et al., 1989). Na+/K+-ATPase facilitates vectorial
sodium transport, thus its translocation by hypoxia or ischemia impedes the tubular
sodium reabsorption in ARF (Schrier et al., 2004).
There are potential pathways through which the loss of brush border membranes, loss
of viable and non-viable proximal tubule cells and less proximal tubule sodium
reabsorption may lead to diminished GFR during ARF. Brush borders that detach

17
from the basement membrane and the cellular debris may contribute to the
intraluminal aggregation of cells and protein resulting in tubular obstruction
(Thadani et al., 1996) (Figure 1.3). The occurrence of the obstructing cast may
explain the dilation of the tubules including collecting duct that have been revealed
upon the renal biopsy of ARF kidneys albeit GFR is less than 10% of normal
(Schrier et al., 2004). However, this remains open for discussion whether tubular
obstruction by cast is alone sufficient in reducing GRF correlated with clinical ARF.
Moreover, some micropuncture studies have shown that with normal tubular and
glomerular pressure, formerly obstructing luminal cast can be dislodged by the
proximal tubular flow rate in a single nephron whilst improved GFR in the same
nephron (Conger et al., 1984). Besides, during ischemic insult the cellular adhesions
of viable cells into the other tubular cells and extracellular matrix also happen to
cause tubular obstruction. This adherence involving integrin-mediated adhesion
molecules via binding to Arg-Gly-Asp (RGD) sequences. Thereby lesser tubular
obstruction was seen and increase in proximal tubular pressure has been reversed in
reperfusion period after synthetic cyclical RGD being induced (Noiri et al., 1994).
18
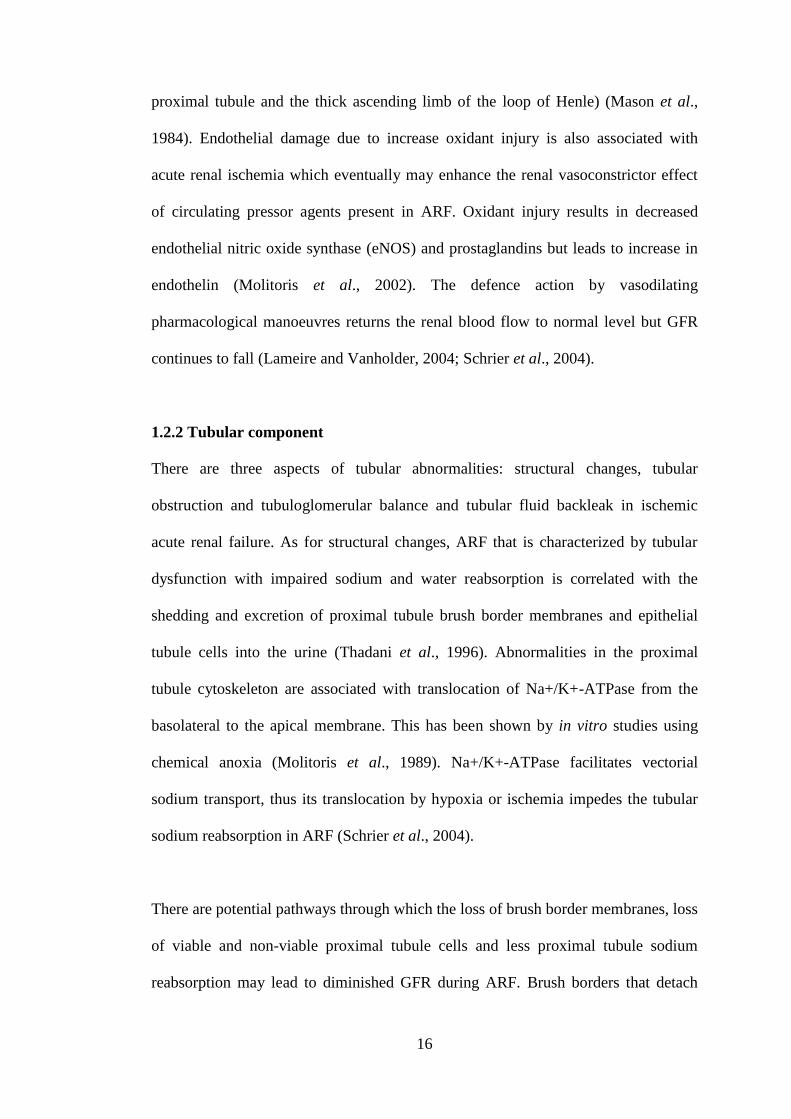
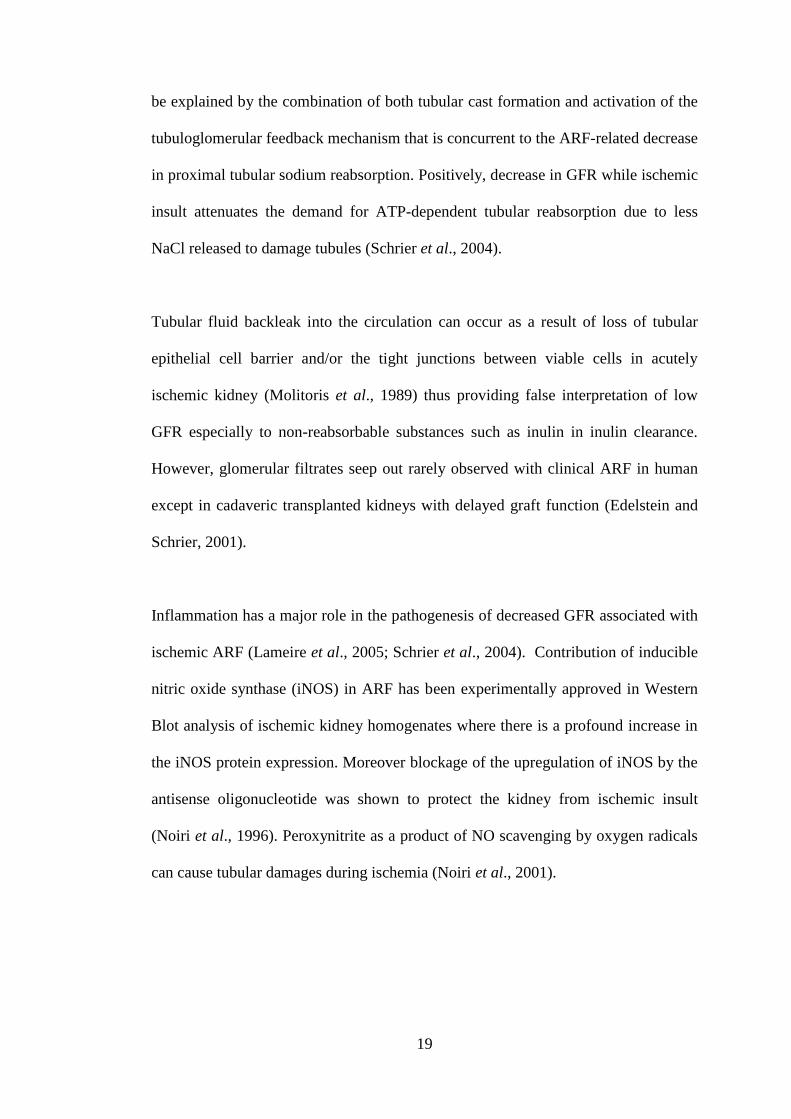
Figure 1.3: Tubular changes in the pathophysiology of ischaemic acute tubular
necrosis. After ischaemia and reperfusion, morphological changes occur in the
proximal tubules, including loss of polarity, loss of the brush border, and
redistribution of integrins and sodium/potassium ATPase to the apical surface.
Calcium and reactive oxygen species also have roles in these morphological changes,
in addition to subsequent cell death resulting from necrosis and apoptosis. Both
viable and non-viable cells are shed into the tubular lumen, resulting in the formation
of casts and luminal obstruction and contributing to the reduction in the GFR
(Reproduced with permission from Thadani et al., 1996).
Based on foregoing discussion of renal autoregulation, TGF will be activated when
there is any alteration in the sodium chloride (NaCl) delivery at the macula densa. In
acute ischemic kidney, less proximal tubular sodium reabsorption will increase the
NaCl concentration to the macula densa, thus allowing the vasoconstriction of the
glomerular arteriole which enhances the sensitivity of TGF and decreases GFR in
patients with clinical ARF (Schnermann, 2003). An abrupt fall of GFR in ARF can
19
be explained by the combination of both tubular cast formation and activation of the
tubuloglomerular feedback mechanism that is concurrent to the ARF-related decrease
in proximal tubular sodium reabsorption. Positively, decrease in GFR while ischemic
insult attenuates the demand for ATP-dependent tubular reabsorption due to less
NaCl released to damage tubules (Schrier et al., 2004).
Tubular fluid backleak into the circulation can occur as a result of loss of tubular
epithelial cell barrier and/or the tight junctions between viable cells in acutely
ischemic kidney (Molitoris et al., 1989) thus providing false interpretation of low
GFR especially to non-reabsorbable substances such as inulin in inulin clearance.
However, glomerular filtrates seep out rarely observed with clinical ARF in human
except in cadaveric transplanted kidneys with delayed graft function (Edelstein and
Schrier, 2001).
Inflammation has a major role in the pathogenesis of decreased GFR associated with
ischemic ARF (Lameire et al., 2005; Schrier et al., 2004). Contribution of inducible
nitric oxide synthase (iNOS) in ARF has been experimentally approved in Western
Blot analysis of ischemic kidney homogenates where there is a profound increase in
the iNOS protein expression. Moreover blockage of the upregulation of iNOS by the
antisense oligonucleotide was shown to protect the kidney from ischemic insult
(Noiri et al., 1996). Peroxynitrite as a product of NO scavenging by oxygen radicals
can cause tubular damages during ischemia (Noiri et al., 2001).
20
The other causes of acute renal failure include sepsis, hypovolaemia, pre-existing
renal impairment, and nephrotoxins such as aminoglycoside antibiotics and
radiological contrast agents (Uchino et al., 2005; 2004)
Acute renal failure is associated with a significant risk of mortality and morbidity.
Due to modern renal replacement modalities, there is an insistent belief that acute
renal failure (ARF) presents a rather harmless complication and that survival is
determined by the severity of the underlying disease process/accompanying
complications but not by renal dysfunction per se. However the evidence from the
experimental and recent research shows the opposite outcomes where ARF presents a
condition which exerts a fundamental impact on the course of the disease, the
advancement of associated complications and on prognosis, independently from the
type and severity of the underlying disease (Druml, 2004). ARF carries an
independent risk of death that patients are rather dying “of” than “with” ARF
(Kellum and Angus, 2002).
ARF is not restricted to kidney disease only, but it is a systemic disease that affects
all physiologic functions and organ systems of the body (Druml, 2004). Systemic
effects of ARF are manifolds. After several hour of ARF induction, there is increase
in the gene expression in experimental animals, non-renal tissues and other organs
e.g. lung, activation of circulating immunocompetent cells (Rabb et al., 2000) and
increase in vascular-permeability for proteins and alveolar micro-haemorrhage
mediated by neutrophils (Kramer et al., 1999). Furthermore, ARF can result in
pulmonary oedema, increase levels of tumour necrosis factor (TNF)-alpha,
interleukin-1 (IL-1) and intercellular adhesion molecule-1 mRNA in the heart
21
associated with functional changes in the heart 24 hours after renal ischemia such as
increase in the left ventricular end-diastolic and systolic diameter. Even unilateral
renal ischemia causes inflammation and injury in the contralateral kidney (Meldrum
et al., 2002).
Table 1.1: Pathophysiologic consequences of acute renal failure.
Cardiovascular Hypercirculation, cardiomyopathy, pericarditis
Pulmonary Lung edema, alveolitis, pneumonia, pulmonary hemorrhage
Gastrointestinal Impairment of motility, erosions, ulcerations, hemorrhage,
pancreatitis, colitis
Neuromuscular Neuropathy, myopathy, encelopathy
Immunologic Impairment of humoral and cellular immunity and
immunocompetence
Hematologic Anemia, thrombocytopenia hemorrhagic diathesis
Metabolic Insulin resistance, hyperlipidaemia, activation of protein
catabolism, depletion of antioxidants
(Adapted from Druml, 2004)
These multiple systemic consequences of ARF (Table 1.1) are mediated by the
acutely uremic state per se (“uremic intoxication”), by immunomodulatory effects
radiating from the injured organ kidney and by side effects associated with renal
replacement therapies. The kidneys in ARF initially are mostly “victims” of a
systemic disease process, such as a shock state or sepsis. Nevertheless, as the acutely
uremic state induces negative repercussions on the organism, the kidneys become
“offenders” (Druml, 2004).
22
1.2.3 Cisplatin induced acute renal failure
Cisplatin is one of the most remarkable successes in 'the war on cancer.' It is the most
potent chemotherapeutic drug and the most widely used for the treatment of several
human malignancies. It reveals one of the highest cure rates, over 90% in testicular
cancers. Cisplatin-based combination chemotherapy regimens and related platinum-
based therapeutics are currently used as front-line therapy in the treatment of
testicular cancer, head and neck, ovarian, cervical, bladder, non-small cell lung
carcinoma, and many other types of cancer (Pabla and Dong, 2008; Wang and
Lippard, 2005; Cohen and Lippard, 2001; Arany and Safirstein, 2003; Siddik, 2003).
Escalation of its dose significantly improves its therapeutic effects. However, to
maximize its antineoplastic effects by using high-dose therapy with cisplatin is
hindered due to its cumulative side effects in normal tissues and organs, notably its
nephrotoxicity in the kidneys (O’Dwyer et al., 1999). Its use is mainly limited by two
factors: acquired resistance to cisplatin and severe side effects in normal tissues,
which include neurotoxicity, ototoxicity, nausea, hearing loss, vomiting, and
nephrotoxicity (Loehrer and Einhorn, 1984; Ward and Fauvie, 1977; Pabla and
Dong, 2008). Still, cisplatin is the drug of choice in many platinum-based therapy
regimens and remains one of the most regularly used chemotherapeutic drugs
(Hanigan and Devarajan, 2003).
It has long been recognized that nephrotoxicity induced by cisplatin can result in
severe nephropathy leading to acute renal failure (Thadani et al., 1996; Kang et al.,
2004; Kawai et al., 2006). Prevalence of cisplatin nephrotoxicity is high, occurring in
about one-third of patient whereby having transient elevation of blood urea nitrogen
levels or other evidence of kidney damage in the days following cisplatin treatment
23
(Meyer and Madias, 1994; Beyer et al., 1997; Arany and Safirstein, 2003). Within
48–72 hours of cisplatin administration, decreased glomerular filtration rate has been
shown (Winston and Safirstein, 1985). Clinically, cisplatin nephrotoxicity is often
seen after 10 days of cisplatin administration. It is manifested as severe reduction in
the glomerular filtration rate, higher serum creatinine, severe reduction in the
creatinine clearance, increased fractional excretion of sodium, increased kidney
index, a variable fall in the renal blood flow and reduced serum magnesium and
potassium levels, (Kang et al., 2004; Lameire, 2005; Arany and Safirstein, 2003).
The long-term effects of cisplatin on renal function may lead to subclinical but
permanent reduction in glomerular filtration rate (Brillet, 1994).
Cisplatin is known to accumulate in mitochondria of renal epithelial cells (Singh
1989; Gemba and Fukuishi, 1991). Consequently, complex signaling pathways will
be activated when tubular cells are exposed to cisplatin, thus leading to tubular cell
injury and death. Meanwhile, stimulated robust inflammatory response occurs,
further exacerbating renal tissue damage. Cisplatin may also induce injury in renal
vasculature and result in decreased blood flow and ischemic injury of the kidneys,
contributing to a decline in glomerular filtration rate. These events act in concert,
culminating in the loss of renal function during cisplatin nephrotoxicity and
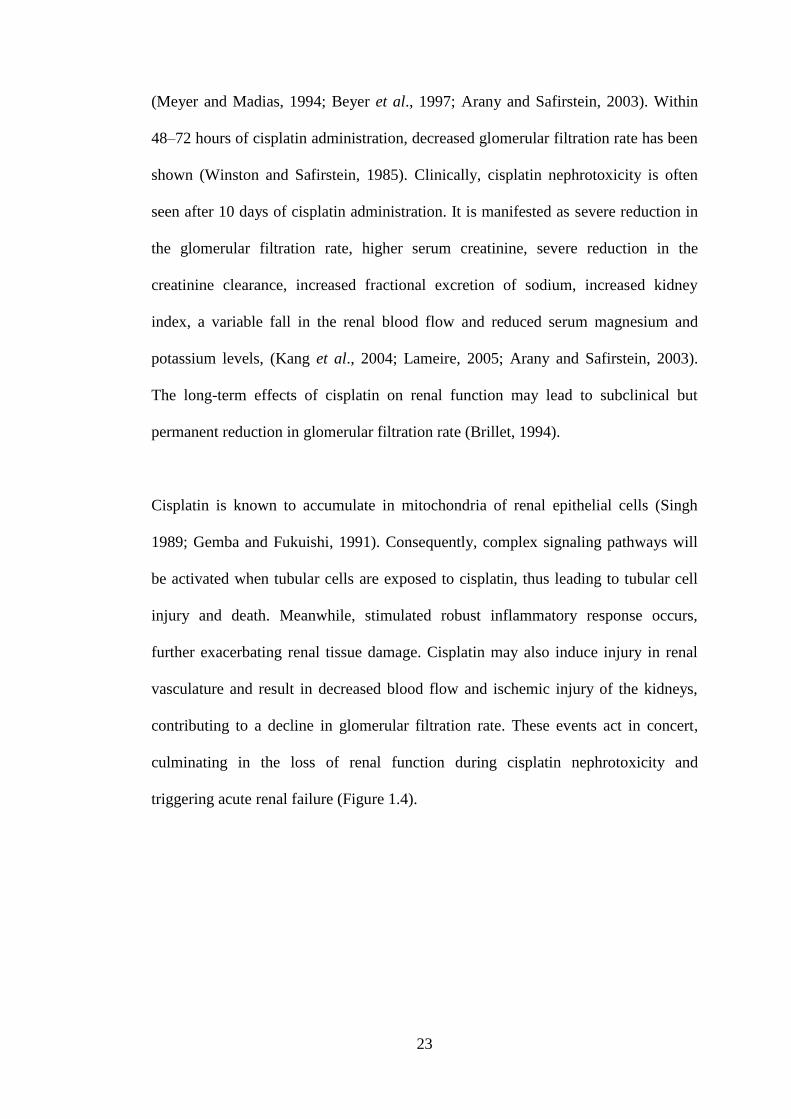
triggering acute renal failure (Figure 1.4).
24
Figure 1.4: Overview of the pathophysiological events in cisplatin nephrotoxicity.
Cisplatin enters renal cells by passive and/or facilitated mechanisms. Exposure of
tubular cells to cisplatin activates signaling pathways that are cell death promoting
(MAPK, p53, ROS, and so on) or cytoprotective (p21). Meanwhile, cisplatin induces
TNF- production in tubular cells, which triggers a robust inflammatory response,
further contributing to tubular cell injury and death. Cisplatin may also induce injury
in renal vasculature, leading to ischemic tubular cell death and decreased glomerular
filtration rate (GFR). Together, these pathological events culminate in acute renal
failure (Adapted from Pabla and Dong, 2008).
The acute renal failure caused by cisplatin in rat exhibits alterations in renal tubular
epithelial structure. Renal tubular cells suffer a continuum of cytotoxic injuries,
ranging from mild sublethal changes to a catastrophic necrotic death characterized by
swelling and rupture of cells and activation of an inflammatory response (Thadani et
al. 1996). There are at least two distinct mechanisms that may be responsible for
renal tubular cell death: cell death in the form of both necrosis and apoptosis (Pabla
and Dong, 2008). It is suggested that the dosage of cisplatin might determine
whether the cells die due to necrosis or apoptosis. While extensive injury with a high
concentration of cisplatin (millimolar) can lead to necrotic cell death, less severe
renal injuries associated with lower concentrations of cisplatin (micromolar) leads to


![Within the Brain: The Renin Angiotensin System€¦ · Renin angiotensin system (RAS) research has a long and rich history dating back to the discovery of renin in 1898 [1]. In the](https://static.fdocuments.net/doc/165x107/6060b8ac7a8e2361e061e02e/within-the-brain-the-renin-angiotensin-system-renin-angiotensin-system-ras-research.jpg)


![interaction of sympathetic nervous system and renin - [email protected]](https://static.fdocuments.net/doc/165x107/620394e2da24ad121e4b145d/interaction-of-sympathetic-nervous-system-and-renin-emailprotected.jpg)