Hypoxia and the Renin-Angiotensin System in Atherosclerosis
43
1 Hypoxia and the Renin-Angiotensin System in Atherosclerosis Master thesis in Medicine Cecilia Thalén Johansson Supervisor: Lillemor Mattsson Hultén Wallenberg Laboratory, Department of Molecular and Clinical Medicine, Institute of Medicine, Sahlgrenska Academy, University of Gothenburg, Sahlgrenska University Hospital, Gothenburg, Sweden Programme in Medicine Gothenburg, Sweden 2012
Transcript of Hypoxia and the Renin-Angiotensin System in Atherosclerosis

1
Hypoxia and the Renin-Angiotensin System
in Atherosclerosis
Master thesis in Medicine
Cecilia Thalén Johansson
Supervisor: Lillemor Mattsson Hultén
Wallenberg Laboratory, Department of Molecular and Clinical Medicine,
Institute of Medicine, Sahlgrenska Academy, University of Gothenburg,
Sahlgrenska University Hospital, Gothenburg, Sweden
Programme in Medicine
Gothenburg, Sweden 2012

2
Hypoxia and the
Renin-Angiotensin System
in Atherosclerosis
3
Abstract
Background – Cardiovascular disease is the leading cause of morbidity and mortality worldwide
and atherosclerosis is estimated to be the underlying cause of approximately 50% of all deaths
in western societies. Many aspects of the atherosclerotic disease are still incompletely
characterized; it is commonly believed that inflammation is the driving force in development
and progression of the disease and lately here has been increasing interest in the possible
interplay between hypoxia and inflammation as well as the renin-angiotensin system (RAS)
and inflammation.
Aim – To test the hypothesis that hypoxia leads to induction of the RAS, including angiotensin II
receptor type 1 (AT₁), and that this results in increased inflammation in the atherosclerotic
plaque. To investigate what cells would be involved in hypoxia-RAS interplay and to asses
effects of RAS interfering drugs in hypoxic environments.
Methods – Histological examination of human atherosclerotic plaques and comparative analysis
of plaques and serum proteins in patients treated with RAS interfering drugs and controls. In
vitro cell experiments conducted on primary human smooth muscle cells and macrophages
where cells were exposed to hypoxia, angiotensin II and RAS interfering drugs.
Results – Expression of AT₁ co localizes with expression of hypoxia marker HIF-1α in
macrophage rich areas of atherosclerotic plaques. Statistical analysis proved strong correlation
between expression of AT₁ and macrophage marker CD68 as well as between expression of
HIF-1α and CD68. In vitro cell experiments confirmed expression of AT₁ in macrophages.
Conclusions – This report presents evidence implicating hypoxia-RAS interplay via stabilization
of the protein HIF-1α. Further experiments are required to elucidate what effect this interplay
has on inflammatory profile of the atherosclerotic plaque.
Key words – Atherosclerosis, renin-angiotensin system (RAS), angiotensin II type 1 receptor
(AT₁), hypoxia inducible factor-1α (HIF-1α), macrophages.

4
Contents
Abstract ................................................................................................................................................... 3
Background ............................................................................................................................................. 6
Aim ........................................................................................................................................................ 11
Material and methods ............................................................................................................................ 12
Histological examination of atherosclerotic plaques – and – comparative analysis of plaque
morphology and serum markers of inflammation between patients receiving ARB treatment and
controls .............................................................................................................................................. 12
Study population ............................................................................................................................ 12
Study design ................................................................................................................................... 12
Atherosclerotic plaques ................................................................................................................. 14
Serum samples ............................................................................................................................... 15
In vitro examination of the effects of hypoxia and ARB treatment on expression of AT₁ and markers
of inflammation in cell culture .......................................................................................................... 15
Cell culture – smooth muscle cells ................................................................................................ 16
Cell culture – monocyte derived macrophages ............................................................................. 16
Real time reverse transcriptase polymerase chain reaction (Real Time RT-PCR) ....................... 16
Enzyme-linked immunosorbent assay (ELISA) .............................................................................. 17
Western Immunoblotting ............................................................................................................... 18
Statistics ............................................................................................................................................ 19
Results ................................................................................................................................................... 20
Expression of AT₁ co localizes with CD68 positive macrophages and HIF-1α expression in human
carotid atherosclerotic plaques .......................................................................................................... 20
Significant correlation between CD68 and AT₁ expression as well as HIF-1α and CD68 expression
in human carotid atherosclerotic plaques .......................................................................................... 23
Similar plaque morphology and levels of serum markers of inflammation in ARB treated patients
and controls ....................................................................................................................................... 24
SMC cell-culture experiments proved inconclusive as to the effects of hypoxia and ARB treatment
on AT₁ mRNA expression ................................................................................................................. 28
Expression of HIF-1α mRNA was reduced in SMCs exposed to hypoxia ........................................ 29
No change in secretion of cytokines, ACE or angiotensin II from SMCs exposed to hypoxia or
Candesartan compared to controls..................................................................................................... 30
Macrophage cell-culture experiments proved inconclusive as to the effects of exposure to hypoxia,
angiotensin II or Candesartan in AT₁ mRNA expression .................................................................. 30
Expression of AT₁ protein in macrophages verified with Western Immunoblotting......................... 31
Discussion ............................................................................................................................................. 32

5
Methodological considerations – problem analysis .......................................................................... 33
In summary ........................................................................................................................................ 36
Future studies .................................................................................................................................... 37
Conclusions and Implications ............................................................................................................... 38
Populärvetenskaplig sammanfattning .................................................................................................... 39
Acknowledgments ................................................................................................................................. 42
References ............................................................................................................................................. 42

6
Background
Cardiovascular disease is the leading cause of morbidity and mortality worldwide [1]. In this
group of diseases we find conditions such as coronary artery disease and cerebrovascular
disease; two common health problems, manifestations of which include myocardial infarction,
heart failure and ischemic stroke. The underlying cause of these conditions is atherosclerosis,
a disease of the large arteries characterized by the accumulation of lipids and fibrous elements
in the vessel wall leading to the development of lesions known as atherosclerotic plaques or
atheromata. Atherosclerosis is common and a major health problem in today´s western
societies where it has been estimated to be the underlying cause of approximately 50% of all
deaths [2].
The pathogenesis of atherosclerosis is complex with many contributory
factors. Formation of plaques starts with the accumulation of low density lipoproteins, LDL,
in the inner most layer of the vessel wall (the intima). Trapped in the intima the LDL is
subjected to various modifications, including oxidation. Accumulation of oxidized LDL leads
to inflammation and subsequent recruitment of monocytes and T-cells [3, 4]. Recruited
monocytes differentiate into macrophages that internalize the modified lipoproteins resulting
in the formation of so called foam cells; which denote lipid loaded macrophages. As the
atheroma progresses the foam cells are prone to undergo apoptosis or necrosis; as they die
they deposit their lipid-filled contents in the tissue thus forming the necrotic core of the
plaque [2]. Foam cells and T-cells will further the inflammatory response by secretion of
cytokines and growth factors mediating smooth muscle cell (SMC) migration, proliferation
and extracellular matrix production. This causes SMCs to migrate from the vessel media into
the growing atheroma where they undergo a phenotype shift, from a contractile phenotype to
a synthetic phenotype. These intimal SMCs then secrete extracellular matrix giving rise to the

7
fibrous cap, a layer of fibrous tissue encapsulating the core of the atheroma, resulting in a
fibrous plaque [2, 5].
With the accumulation of fibrous elements and smooth muscle cells the plaque
grows; initially the lesion expands towards the outer wall of the vessel (the adventitia) but
gradually it will start expanding inwards, encroaching on the vessel lumen. Though the plaque
is now starting to occlude the vessel many of these lesions are still asymptomatic.
Complications in form of myocardial infarction and ischemic stroke often occur when an
atherosclerotic plaque ruptures leading to the formation of an occlusive thrombosis or
subsequent embolus. How prone a plaque is to rupture, i.e. the vulnerability of the plaque,
depends on a large number of factors; vulnerable plaques generally display a histological
composition with an increased number of inflammatory cells and a thin fibrous cap [2].
Inflammation seems to be a driving force of plaque vulnerability.
Our understanding of the process of atherogenesis (i.e. the formation of
atherosclerotic plaques) has grown steadily over the years. Numerous works have highlighted
the importance of inflammation in this process [1, 2, 4, 6-8] and it is commonly believed that
inflammation is the driving force behind formation, progression and rupture of atherosclerotic
plaque. Macrophages have been a natural area of interest in this matter. We know that
macrophages are crucial in the atherogenic process, the differentiation of monocytes into
macrophages in the intima is a prerequisite for development of atheromata [4]. There have,
however, recently been implications that SMCs may also play an important part in the
inflammatory process in atherosclerosis. It is possible that SMCs recruited to the
atherosclerotic lesion may take on an inflammatory phenotype, secreting cytokines and
expressing cell adhesion molecules [5]. In this area much is still unknown, but stimuli such as
oxidized LDL and angiotensin II have been found to induce SMC secretion of Monocyte
Chemotactic Protein-1 (MCP-1), Interleukin-6 (IL-6), IL-8 and Tumor Necrosis Factor α
8
(TNFα) [5]. It is possible that SMCs may play an important role in maintaining the
inflammatory response in atherosclerosis. Still, on this matter, there are other contributory
factors to be taken into account.
In recent years we have gained an increased understanding of the importance of
hypoxia (insufficient levels of oxygen in the tissue) in plaque formation and progression.
Hypoxia is a common feature of the atherosclerotic tissue due to increased oxygen
consumption and decreased oxygen supply. The foam cells formed in the early stages of
athrogenesis are highly oxygen consuming [9], their accumulation leads to increased oxygen
consumption and oxygen demand in the tissue. As the atherosclerotic plaque grows the vessel
intima grows thicker. The intima relies on diffusion of oxygen from the blood flowing
through the vessel lumen for its oxygen supply and the maximum diffusion limit is
approximately 100–250 μm. The thickness of the plaque often exceeds 250 μm, indeed it can
often reach a thickness many times as great, and as a result oxygen supply to the tissue is
hampered [10]. This combination of increased oxygen consumption and decreased oxygen
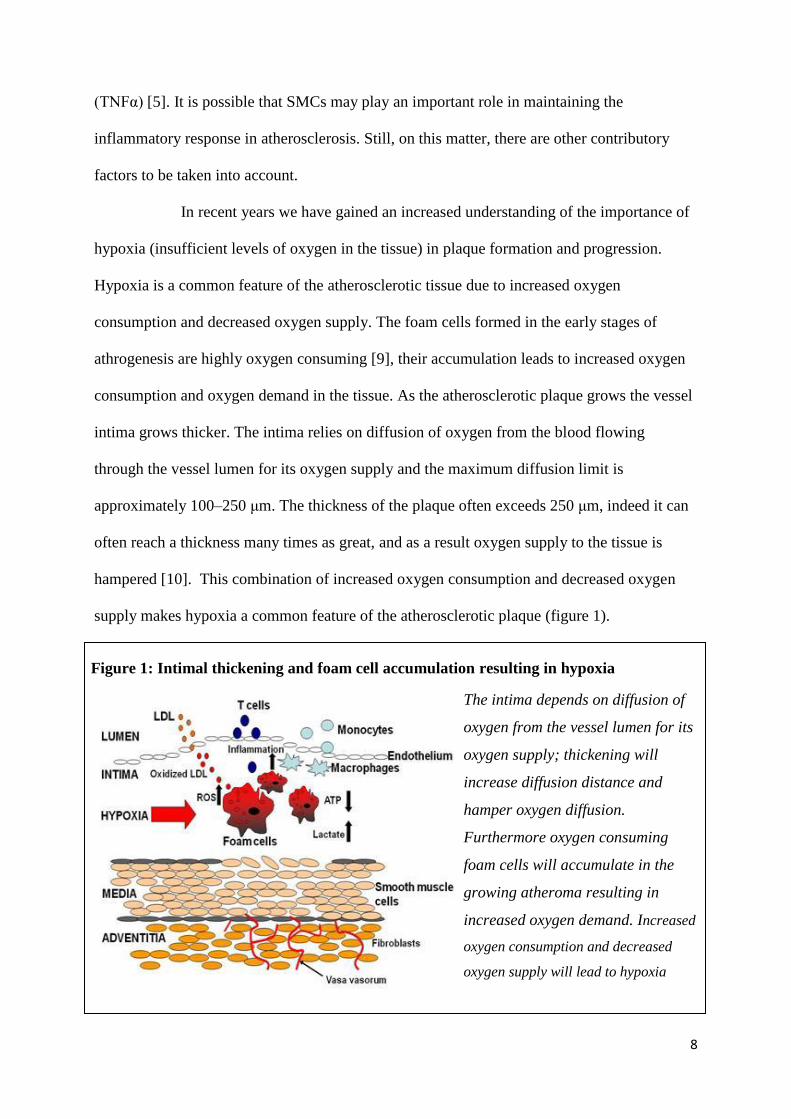
supply makes hypoxia a common feature of the atherosclerotic plaque (figure 1).
Figure 1: Intimal thickening and foam cell accumulation resulting in hypoxia
The intima depends on diffusion of
oxygen from the vessel lumen for its
oxygen supply; thickening will
increase diffusion distance and
hamper oxygen diffusion.
Furthermore oxygen consuming
foam cells will accumulate in the
growing atheroma resulting in
increased oxygen demand. Increased
oxygen consumption and decreased
oxygen supply will lead to hypoxia
9
Hypoxia has pronounced effects on many aspects of cell physiology [11, 12] and
has been indicated as a key factor in the progression of atherosclerotic plaques to advanced
lesions, by depletion of ATP (adenosine-tri-phosphate), promotion of lipid accumulation and
increased inflammation [13]. The link between hypoxia and inflammation is incompletely
characterized but evidence suggests that one of many important factors may be the protein
hypoxia inducible factor 1α (HIF-1α). HIF-1α is one of two subunits forming the transcription
factor hypoxia inducible factor 1 (HIF-1),the predominant mediator of responses to hypoxia in
all cell types [14]. The limiting factor in HIF-1 formation is the supply of HIF-1α; under
normoxic circumstances HIF-1α is subjected to hydroxylation and is subsequently rapidly
degraded. Under hypoxic circumstances lack of oxygen prevents hydroxylation of HIF-1α
from taking place and HIF-1 can be formed [12]. HIF-1α has been shown to mediate adaptive
responses to tissue hypoxia [12], however in environments of chronic continuous hypoxia or
chronic intermittent hypoxia HIF-1α mediates maladaptive responses and has been implicated
in development of tissue inflammation [15]. Recent evidence suggests significant crosstalk
between HIF-1α and the transcription factor nuclear factor kappa B (NF-κB) [15, 16] and that
NF-κB may regulate hypoxia-mediated inflammatory responses [16, 17]
Recently there has also been increased interest in the role of the Renin-
Angiotensin-System (RAS) in the development and progression of atherosclerosis. The
effecter molecule of the RAS is Angiotensin II, a protein formed by sequential enzymatic
cleavage of angiotensinogen, a protein produced by the liver; this occurs both in the blood
stream – circulation RAS, and in the tissue – tissue RAS (see figure 2). (R) Angiotensin II is a
potent vasoconstrictor and the RAS is best known for its role in regulation of blood pressure,
but lately attention has been directed to the RAS role in promoting atherosclerosis.
Angiotensin II has been shown to directly stimulate SMC growth and production of
extracellular matrix [2], important factors in development of fibrous lesions.

10
Furthermore, the RAS and angiotensin II have been frequently implicated as mediators of
inflammation [18-21]; angiotensin II has been shown to increase vascular permeability and
subsequent infiltration of inflammatory cells by mechanisms including cytokine release [22].
Current literature states that the main effect of the RAS on atherogenesis is mediated by its
role in promoting hypertension, insulin resistance and vascular as well as systemic
inflammation [23]. Furthermore it has been observed that elevated levels of tissue RAS
components are present in atherosclerosis, independently of blood pressure elevation [18].
Interestingly drugs inhibiting the RAS has been shown to reduce inflammation by
mechanisms independent of blood pressure [24]. Drugs inhibiting the RAS include both
sartans, which act by blockade of the Angiotensin II type 1 receptor (AT₁) – also known as
Figure 2: Angiotensinogen,
formed by the liver, is
sequentially cleaved to form
Angiotensin II.
Angiotensinogen is cleaved by
renin forming Angiotensin I.
Angiotensin I is the cleaved by
Angiotensin Converting
Enzyme (ACE) forming
Angiotensin II. This process
takes place locally in many
tissues as well as in the blood
stream.
Figure 2: Schematic illustration of the RAS
Circulating RAS Tissue RAS
Angiotensinogen
Renal renin Tissue renin
Angiotensin I
Lung ACE Tissue ACE
Angiotensin II
AT₁

11
angiotensin receptor blockers (ARB) – and Angiotensin-Converting-Enzyme-inhibitors
(ACEi), which act by preventing formation of angiotensin II.
The interactions between hypoxia and the RAS have previously been addressed
in the context of hypertension caused by periods of intermittent hypoxia in obstructive sleep
apnea. It has been shown that exposure to intermittent hypoxia can increase arterial blood
pressure in humans through RAS dependent mechanisms [25], one might argue that there
seems to exist some sort of connection. This raises the question of a possible interaction
between tissue hypoxia and the different components of the RAS locally in the atherosclerotic
plaque. A question this study means to address.
Aim
This study means to address the possibility of interactions between hypoxia and the RAS in
the process of atherogenesis; the hypothesis being that hypoxia leads to induction of the RAS
and that this leads to increased inflammation in the hypoxic atherosclerotic plaque. As part of
investigating this hypothesis the question of which cells that would mediate this possible
proinflammatory effect will be addressed, the hypothesis being that SMCs, in addition to
macrophages, may play an important part in mediating inflammation induced by angiotensin
II. Furthermore, effects of angiotensin II type 1 receptor blockade will be assessed in the
context of its possible effect modulating properties and anti-inflammatory effects in hypoxic
environments, the hypothesis being that RAB treatment may alter the composition of the
atherosclerotic plaque and reduce occurrence of proinflammatory molecules in vivo as well as
in vitro.

12
Material and methods
Histological examination of atherosclerotic plaques – and – comparative analysis of
plaque morphology and serum markers of inflammation between patients receiving
ARB treatment and controls
Study population
The study population consisted of 121 patients with symptomatic carotid stenosis recruited
within the Gothenburg Atheroma Study Group. Patients were characterized with respect to
medical history, physical examination, target organ damage and cardiovascular risk factors.
Information was collected through a medical history questionnaire and examination of patient
records. The study protocol was approved by the Ethical Committee of the University of
Gothenburg and all participating subjects gave written informed consent.
Study design
To investigate plaque morphology histological examination of human atherosclerotic plaques
was performed. 123 plaques were obtained from arteria carotis of the 121 patients constituting
the study population. Stained sections were characterized with respect to expression of AT₁,
hypoxia marker – HIF-1α, macrophage marker – CD68 and SMC marker – β-actin;
furthermore localization of said expression was characterised. Analysis was performed to
determine possible correlations between location as well as levels of expression.
To investigate effects of ARB treatment on plaque morphology
and serum markers of inflammation in patients with atherosclerotic disease comparative
analysis of different patient groups was performed. A retrospective cohort design was used.
Two cohorts were defined, all patients in the study population receiving ARB treatment
constituted the first (n=23); the second consisted of matched controls receiving no treatment
interfering with the RAS, neither ARB nor ACEi (n=23). Controls were individually matched

13
for each subject in the exposed group. When matching consideration was taken to possible
confounding factors, specifically: gender, age, diagnosed hypertension, diagnosed diabetes,
previous and present smoking habits as well as treatment with statins and acetyl-salicylic-acid
(ASA); table I show characteristics of patients used in comparative analysis. Comparison of
plaque morphology and serum markers of inflammation was performed.
Table 1: Characteristics of patients used for comparative analysis
Variable ARB therapy
Yes (n=23) No (n=23)
Women, n (%) 6 (26) 11 (48)
Age, years 68±14 68±12
mean 69 69
median 69 70
Clinical event
Stroke, n (%) 10 (43) 6 (26)
TIA*, n (%) 8 (35) 7 (30)
Amaurosis fugax, n (%) 5 (22) 10 (44)
Time since clinical event, days 124±114 105±77
mean 106 79
median 101 66
Hypertension, n (%) 22 (96) 19 (83)
Diabetes, n (%) 5 (22) 6 (26)
Previous smoker, n (%) 6 (26) 6 (26)
Current smoker, n (%) 3 (13) 3 (13)
ASA** therapy, n (%) 21 (91) 22 (96)
Statin therapy, n (%) 20 (87) 19 (83)
Blood pressure, mmHg
Systolic 155±25 160±40
Diastolic 80±10 80±20
* TIA = transient ischemic attack ** ASA=acetyl-salicylic-acid

14
Atherosclerotic plaques
123 atherosclerotic plaques from arteria carotis obtained during surgical endartherectomi (i.e.
removal of the atherosclerotic plaque) were used for histological examination. Specimens
were divided into 3 mm sections, fixed in formalin for 24 hours and embedded in paraffin
before 4 µm thick sections were taken for immunohistochemistry. Sections were
deparaffinised and antigens retrieved using DIVA Decloaker buffer (BioCare, Concord, CA,
USA). Thereafter sections were washed with Tris-buffered saline buffer (TBS – a solution of
0,20M Tris(hydroxymethyl)-aminomethane and 0,73M NaCl in Milli-Q H₂O, pH set to 6.8)
and incubated with blocking buffer (TBS with addition of 0.1 % Tween and 1 % Bovine
Serum Albumin (Sigma-Aldrich, St. Louis, Missouri, USA)) for 30 minutes before incubation
with primary antibody in blocking buffer or DaVinci Green (PD 900 M) (Biocare Medical,
California, USA) for one hour. The samples were washed before detection with MACH3 kit
(M3M532 H)(Biocare Medical, California, USA) and subsequently washed again before
detection with Vulcan Fast Red Chromogen kit 2 (FR805M) (Biocare Medical, California,
USA). Sections were stained with Mayers hematoxylin for 45 seconds before dehydration.
Primary antibodies used were: for AT1 – mouse monoclonal Anti-Angiotensin
II Type 1 Receptor antibody [1E10-1A9] (ab9391) (abcam, Cambrige Science Park,
Cambrige, UK) at dilution 1:30 in DaVinciGreen (PD 900 M) (Biocare Medical, California,
USA); for CD68 – lyophilized mouse monoclonal anti-CD68 (NCL-CD68-KP1) (Lecia
Novocastra, Kista, Sweden) at dilution 1:500 in blocking buffer; for HIF-1α – mouse
monoclonal anti-HIF-1 alpha antibody (ESEE122) (NB100-131) (Novus Biologicals, Atlanta,
USA) at dilution 1:400 in DaVinciGreen (PD 900 M) (Biocare Medical, California, USA); β-
actin – mouse monoclonal anti-human Muscle Actin (M0635, IR700) (DAKO, Glostrup,
Denmark) at dilution 1:400 in blocking buffer.

15
The BioPix 2.0 software (BioPix AB, Gothenburg, Sweden) was used to
quantify expression of AT₁, HIF-1α, CD68 and β-actin in stained serial sections of carotid
plaques. For each section the signal of interest was identified and the area of plaque were
signal was found calculated; total plaque area was calculated and by dividing area of signal
expression by total plaque area and multiplying by 100 the percentage of signal expression
per plaque was attained.
Furthermore, sections were characterized with respect to histological appearance
and classified according to the American Heart Association (AHA) classification [26] as
lesion type I-VI, where a higher number indicates a more advanced lesion.
Serum samples
Serum samples were collected from all patients and analyses of inflammatory markers were
preformed. Analyzed parameters were: Ultra sensitive C-reactive Protein (U-CRP) by use of
CRP High Sensitivity (981798) (Thermo Fischer Sientific, MA, USA); Monocyte
Chemotactic Protein-1 (MCP-1) by use of Quantikine ELISA human CCL2/MCP-1 (DCP00)
(R&D systems); IL-1β, IL-2, IL-4, IL-5, IL-6, IL-8, IL-10, IL-12, IL-13, interferon-γ (IFN-γ)
and tumor necrosis factor-α (TNF-α) by use of Human ProInflammatory 9-Plex Ultra-
Sensitive Kit (K15025C-1) (Meso Scale Discovery, Gaithersburg, Maryland, USA).
In vitro examination of the effects of hypoxia and ARB treatment on expression of AT₁
and markers of inflammation in cell culture
To elucidate the effects of hypoxia on the RAS and on inflammation at a cellular level, cell
culture experiments were conducted on primary human aortic SMCs and primary human
monocyte derived macrophages; these cell types were chosen as SMCs and macrophages
were primarily considered to be the cells of interest.

16
Cell culture – smooth muscle cells
Primary human aortic smooth muscle cells (Clonetics, Lonza, Basel, Switzerland) were
cultured in Waymouth’s medium (Gibco, Invitrogen, Carlsbad, CA, USA) with 10% human
serum, 10% fetal calf serum, 100 U/mL penicillin, 100 µg/mL streptomycin, and 2 mmol/L L-
glutamine. During experiments two different groups were used. The test group was
challenged with incubation under hypoxic conditions (1% O2); Controls were incubated at
normoxic conditions (21% O2). In both groups a subset of cells were incubated with the sartan
Candesartan (Astra Zeneca AB, Södertälje, Sweden), an AT₁ - blocker, at the concentration of
10ˉ⁷M. Experiments lasted for 24 hours before collection of medium and extraction of RNA.
In total 4 experiments were conducted on cells of passage 2, 4, 5 and 6 respectively.
Cell culture – monocyte derived macrophages
Buffy coats were obtained from the local blood bank at Kungälv Hospital, Sweden, and
human mononuclear cells were isolated by centrifugation in a discontinuous gradient of
Ficoll-Paque (GE Healthcare). Cells were seeded in Macrophage-SFM medium (Gibco)
containing granulocyte macrophage colony stimulating factor (GM-CSF). After 3 days, the
medium was changed to RPMI medium without GM-CSF and cells were cultured for 6 days
before experiments were started. During experiments cells were challenged with incubation
under hypoxic conditions, controls were incubated under normoxic conditions; in both the
hypoxic test group and the normoxic control group a subset of cells were stimulated with
either angiotensin II or Candesartan. Experiments lasted for 24 hours before collection of
medium and extraction of RNA.
Real time reverse transcriptase polymerase chain reaction (Real Time RT-PCR)
RNA was isolated from SMCs and macrophages with the RNeasy Mini Kit (Qiagen,
Valencia, CA, USA). For SMCs expression of AT₁, HIF-1α and β-actin mRNA was

17
determined, for macrophages expression of AT₁ and β-actin mRNA was determined. For
analysis all parameters were normalized to β-actin mRNA expression. The reverse
transcription reaction was set up using a cDNA reverse transcription kit (#4368814, Applied
Biosystems, Foster City, CA, USA) and performed with a Gene Amp PCR system 9700
(Applied Biosystems, Foster City, CA, USA). Real time PCR amplification was set up using
Taq man gene expression assays for AT₁ (Hs99999095_m1), HIF-1α (Hs 00153153_m1) and
ActB (Hs99999903_m1) respectively, in combination with TaqMan Universal PCR master
mix (#4324018) (Applied Biosystems, Foster City, CA, USA) and performed for 40 cycles on
an ABI PRISM 7700 sequence detection system.
Enzyme-linked immunosorbent assay (ELISA)
Secreted cytokines were analyzed in medium from cultured primary human SMCs. Analysis
of GM-CSF, interferon- γ (IFN-γ), Interleukin-1β (IL-1β), IL-10, IL-12 p70, IL-2, IL-6, IL-8,
Tumor necrosis factor- α (TNF-α) and IL-18 was performed using Human ProInflammatory
9-Plex Ultra-Sensitive Kit (K15025C-1) (Meso Scale Discovery, Gaithersburg, Maryland,
USA) and Human IL-18 ELISA Kit (7620) (MBL, Woburn, USA) according to
manufacturer’s instructions. Furthermore analysis of C-reactive protein (CRP), Intercellular
Adhesion Molecule-1 (ICAM-1), Serum Amyloid A (SAA) and Vascular Cell Adhesion
Molecule-1 (VCAM-1) was performed using Human Vascular Injury II Kit (K15136C-1)
(Meso Scale Discovery, Gaithersburg, Maryland, USA) according to manufacturer’s
instructions.
Analysis for secreted components of the RAS (Angiotensin II and ACE) was
performed using Angiotensin II Human/Rat ELISA (RA05880R) (BioVendor) and Human
ACE Immunoassay (DACE00) (R&D Systems) according to manufacturer’s instructions.

18
Western Immunoblotting
To investigate the occurrence of the protein AT₁ in macrophages Western Immunoblotting
technique was used. As the AT₁ protein and the β-actin protein were suspected to be
approximately the same size (40-45 kDa and 42 kDa respectively) sequential analysis was
used starting with detection of AT₁ followed by detection of β-actin.
Primary human monocytes exposed to hypoxia or normoxia were used.
Samples and ladder were loaded onto NuPAGE 4-12% Bis-Tris Gel 1.0mm X 10 well
(Invitrogen, Carlsbad, CA, USA) along with loading buffer (a solution of 50mM
Tris(hydroxymethyl)-aminomethane, 50mM dithiothreitol and 315mM sodium dodecyl
sulfate in Milli-Q H₂O 10% glycerol and 0,005% bromphenol blue) and separated by
electrophoresis at 200V for one hour. Proteins were subsequently transferred by electro
transfer at 30V for one hour to Immuno-Blot polyvinylidene fluoride (PVDF) membrane
(162-0177) (Bio-Rad, California, USA) using NuPAGE Transfer Buffer 20X (Invitrogen,
Carlsbad, CA, USA). The membrane was thereafter washed with TTBS (TBS with addition of
0.1 % Tween 20) and incubated in blocking buffer (TTBS with addition of 5 % non fat dry
milk) over night at 4°C. Following day the membrane was washed with TTBS before
incubation with primary antibody in antibody solution (TTBS with addition of 2 % non fat
dry milk) for one hour at room temperature with gentle shaking. For primary antibody mouse
monoclonal Anti-Angiotensin II Type 1 Receptor antibody [1E10-1A9] (ab9391) (abcam,
Cambrige Science Park, Cambrige, UK) was used at dilution 1:400. The membrane was
washed and incubated with secondary antibody in antibody solution for one hour at room
temperature with gentle shaking. For secondary antibody sheep anti-mouse IgG, peroxidase-
linked speies-specific whole antibody (ECL) NA931(GH healthcare life sciences, Little
Chalfont, UK) was used at dilution 1:5000. After washing, AT₁ was detected using

19
chemiluminiscence reaction with Immobilon Western Chemilumiscent HRP Substrate
(WBKLS0500) (Merck Millipore, Billerica, USA).
After detection of AT₁ the membrane was stripped from antibodies by
incubation with 0.2M NaOH solution for one hour at room temperature. After washing, the
membrane was incubated in blocking buffer for one hour at room temperature with gentle
shaking. There after detection of β-actin was performed by following the same protocol as for
AT₁ and by use of primary antibody: rabbit polyclonal anit-actin A2066 (Sigma-Aldrich, St.
Louis, Missouri, USA) at dilution 1:1250; and secondary antibody: Goat polyclonal anti-
rabbit IgG – H&L (HPR) (ab6721) (abcam, Cambrige Science Park, Cambrige, UK) at
dilution 1:3000.
Statistics
Data are plotted as mean and SEM unless stated otherwise. All analyses were performed
using GraphPad Prism version 5.01 for Windows (GraphPad Software, San Diego California
USA); a 95% confidence interval was used and P-values ≤ 0.05 were considered significant.
Differences between groups were determined using non-parametric two tailed T-test (Mann-
Whitney two tailed T-test). Correlations between groups were determined using non-
parametric two tailed correlation (Spearman two tailed correlation).

20
Results
Expression of AT₁ co localizes with CD68 positive macrophages and HIF-1α expression
in human carotid atherosclerotic plaques
Examination of carotid plaques proved expression of AT₁ to be co localized with expression
of CD68, a protein used as a macrophage marker, and with expression of HIF-1α, a protein
expressed under hypoxic conditions. No similar association was seen with β-actin, used as a
marker of SMCs. As can been seen in figures 3 and 4 signals on AT₁-stained sections appear
to coincide with signals on CD68 and HIF-1α stained sections.

21
Figure 3: Serial sections of an atherosclerotic plaque
3A: Section of a human atherosclerotic
plaque from arteria carotis stained for
expression of AT1. Pictures 3B-D
shows enlargement of the marked area
of the plaque.
3B: Three times magnification of area
of AT1 expression in the plaque
pictured in 3A.
3C: Three times magnification of area
of CD68 expression in the plaque
pictured in 3A.
3D: Three times magnification of area
of HIF-1α expression in the plaque
pictured in 3A.

22
Figure 4: Serial sections of an atherosclerotic plaque
4A: Section of a human atherosclerotic
plaque from arteria carotis stained for
expression of AT1. Pictures 4B-D
shows enlargement of the marked area
of the plaque.
4B: Two times magnification of area
of AT1 expression in the plaque
pictured in 4A.
4C: Two times magnification of area
of CD68 expression in the plaque
pictured in 4A.
4D: Two times magnification of area
of HIF-1α expression in the plaque
pictured in 4A.

23
Significant correlation between CD68 and AT₁ expression as well as HIF-1α and CD68
expression in human carotid atherosclerotic plaques
Expression of AT₁, CD68 and HIF-1α was quantified as percentage of expression per total
plaque area. Subsequent correlation analysis proved significant correlation between CD68 and
AT₁ expression: p < 0.0001, Spearman R = 0.4252 (fig. 5). As well as between HIF-1α and
CD68 expression: p = 0.0097, Spearman R = 0.2393 (fig. 6).
Figure 5: Correlation between expression of CD68 and AT₁
Levels of CD68 expression and AT₁ expression plotted against each other with CD68
expression in percent on the X-axis and AT₁ expression in percent on the Y-axis.
Correlation analysis using Spearman two tailed correlation revealed significant correlation:
p < 0.0001, 95% confidence interval 0.2566 to 0.5687, Spearman R = 0.4252

24
Similar plaque morphology and levels of serum markers of inflammation in ARB
treated patients and controls
Statistical analysis of collected patient and plaque data revealed no statistically significant
differences between the patient groups. Figure 7 shows differences in expression of AT₁, HIF-
1α, CD68 and β-actin between groups illustrated as fold change were the mean expression, of
Figure 6: Correlation between expression of HIF-1α and CD68
Levels of HIF-1α expression and CD68 expression plotted against each other with HIF-1α
expression in percent on the X-axis and CD68 expression in percent on the Y-axis.
Correlation analysis using Spearman two tailed correlation revealed significant correlation:
p = 0.0097, 95% confidence interval 0.05405 to 0.4085, Spearman R = 0.2393

25
each protein respectively, in the control group was set to one and then compared to the
expression in the ARB treated group. Distribution of morphological parameters between
groups is also shown in table II. Figure 8 shows levels of serum markers of inflammation
illustrated as fold change were the mean level, of each protein respectively, in the control
group was set to one and then compared to the expression in the ARB treated group.
Distribution of serum markers of inflammation between groups is also shown in table III.
Figure 7: Differences in expression of AT₁, CD68, HIF-1α and β-actin between
studied groups
Comparison of plaque morphology. The diagram shows differences in expression of
AT₁, CD68, HIF-1α and β-actin between ARB treated patients and controls. Differences
are illustrated as fold change. No statistically significant differences were found.

26
Table II: Distribution of morphological parameters between studied groups
Variable ARB therapy
Yes (n=24*) No (n=24*)
AHA-class
class 3, n (%) 2 (8) 1 (4)
class 4, n (%) 7 (29) 9 (39)
class 5, n (%) 4 (17) 2 (8)
class 6, n (%) 11 (46) 9 (39)
Area of AT₁ expression (%)
mean 0,72 0,71
medaian 0,54 0,56
standard deviation 0,52 0,55
Area of CD68 expression (%)
mean 1,46 2
medaian 1,39 0,82
standard deviation 1,12 2,9
Area of HIF-1α expression (%)
mean 2,92 2,57
medaian 2,24 1,32
standard deviation 2,21 3,3
Area of β-actin expression (%)
mean 4,29 4,58
medaian 3,56 3,74
standard deviation 3,79 3,65
* There were 23 patients in both groups; in each group one patient contributed
two plaques, from both the left and right carotid artery.

27
Figure 8: Differences in serum markers of inflammation between studied groups
Comparison of serum markers of inflammation. The diagram shows differences in serum
markers of inflammation between ARB treated patients and controls. Differences are
illustrated as fold change. No statistically significant differences were found.
Table III: Distribution of serum markers of inflammation between studied groups
Group U-CRP TNF-α MCP-1 IFN-γ IL-1β IL-2
ARB
Mean 2,04 3,46 264,76 0,54 0,28 0,17
Median 1,4 3,06 176,7 0,28 0,22 0,13
SD 1,78 1,4 380,54 0,93 0,23 0,15
Controls
Mean 3,43 3,37 280,62 0,5 0,39 0,19
Median 2,03 3,09 267,56 0,29 0,32 0,16
SD 4,68 1,21 121,11 0,83 0,3 0,18
Group IL-5 IL-8 IL-12 IL-13 IL-4 IL-10
ARB
Mean 0,35 3,55 1,31 2,24 0,07 1,05
Median 0,28 3,53 0,63 1,03 0,05 0,54
SD 0,26 0,93 2,65 3,23 0,07 1,41
Controls
Mean 1,24 3,63 2,93 2,39 0,1 1,72
Median 0,31 3,36 0,45 1,13 0,03 0,83
SD 3,05 1,58 9,34 4,47 0,16 3,31

28
SMC cell-culture experiments proved inconclusive as to the effects of hypoxia and ARB
treatment on AT₁ mRNA expression
Real Time RT-PCR was used to detect expression of AT₁ mRNA in SMCs exposed to
hypoxia, hypoxia in combination with ARB, normoxia and normoxia in combination with
ARB respectively. No significant effects of exposure to neither hypoxia nor ARB were
detected when all results were put together. Results varied notably between experiments
conducted on cells of different passage; figure 9 shows the results of measurements from the
first and last experiments respectively; as can be seen exposure to hypoxia and Candesartan
lead to increased AT₁ mRNA expression in experiment one (fig. 9A) and to decreased AT₁
mRNA expression in experiment four (fig. 9B).
Figure 9: Differences in AT₁ mRNA expression in SMC experiments
9A: SMC experiment 1 9B: SMC experiment 4
Primary human aortic smooth muscle cells were used. Diagrams show differences in AT₁ mRNA
expression between experiments conducted on cells of different passage. Cells in experiment 1 were
of passage 2 (shown in 9A); cells in experiment 4 were of passage 6 (shown in 9B). When
analyzing, levels of AT₁ expression was normalized to levels of β-actin expression.

29
Expression of HIF-1α mRNA was reduced in SMCs exposed to hypoxia
Real Time RT-PCR was used to detect expression of HIF-1α mRNA in SMCs exposed to
hypoxia, hypoxia in combination with ARB, normoxia and normoxia in combination with
ARB respectively. In all four experiments expression of HIF-1α mRNA was reduced by
exposure to hypoxia; exposure to Candesartan induced no difference in HIF-1α mRNA
expression. Results are shown in figure 10.
Figure 10: Difference in HIF-1α mRNA expression between SMCs exposed to hypoxia
and normoxia
Diagram shows differences
in HIF-1α mRNA
expression between SMCs
exposed to normoxia and
hypoxia respectively. As
can be seen exposure to
hypoxia markedly reduced
expression of HIF-1α
mRNA. When analyzing,
levels of HIF-1α expression
was normalized to levels of
β-actin expression.
30
No change in secretion of cytokines, ACE or angiotensin II from SMCs exposed to
hypoxia or Candesartan compared to controls
ELISA was used to analyze levels of proinflammtory substances in medium from SMC cell-
culture experiments. No significant differences could be seen between medium from different
groups of cells; though, as with expression of AT₁ mRNA, occurrence of proinflammatory
substances varied notably between experiments conducted on cells of different passage (not
shown).
Analysis of secreted components of the RAS proved low levels of ACE and
angiotensin II in all examined samples. No effect was seen of exposure to hypoxia or
Candesartan.
Macrophage cell-culture experiments proved inconclusive as to the effects of exposure to
hypoxia, angiotensin II or Candesartan in AT₁ mRNA expression
Real Time RT-PCR was used to detect expression of AT₁ mRNA in primary human monocyte
derived macrophages; cells had been incubated at either hypoxia or normoxia and a subset of
cells in environments were treated with angiotensin II or Candesartan. No significant effects
of exposure to hypoxia, angiotensin II or Candesartan were detected. In 21 out of 24 samples
mRNA levels were too low as to be determined. In the three samples that contained sufficient
levels too be detected cycle threshold (CT) levels were high, average 42 and 50 cycles were
used for detection.

31
Expression of AT₁ protein in macrophages verified with Western Immunoblotting
As expression of AT₁ in macrophages could not be shown by analysis of mRNA expression
with Real Time RT-PCR, Western Immunoblotting was performed to verify the expression of
the AT₁ protein. As can be seen in figure 11A a clear signal was found
corresponding to a protein size of approximately 60 kDa, which is consistent with expected
size of the AT₁ protein (approximately 40,45 or 60 kDa depending on the glycosylation of the
protein) . Figure 11B shows detection of β-actin on the same membrane after stripping of the
AT₁ antibodies.
Figure 11: Detection of AT₁ protein and β-actin protein in human monocyte derived
macrophages by Western Immunoblotting
Here shown is the detection of AT₁ protein (11A) and β-actin protein (11B) in primary human
monocyte derived macrophages by Western immunoblotting. The same membrane was stained
for detection of AT₁ and subsequently stripped of antibodies before staining for β-actin.
11A: Detection of AT₁ 11B: Detection of β-actin

32
Discussion
In summary, the main findings related in this thesis are: the observation that expression of
AT₁ co-localizes with expression of HIF-1α (a marker of hypoxia) in macrophage rich areas
of human atherosclerotic plaques, and the discovery of correlation between expression of
CD68 and AT₁ as well as HIF-1α and CD68 in the human atherosclerotic plaque. Verification
of expression of AT₁ protein in primary human monocyte derived macrophages by Western
immunoblotting further supports these findings.
Comparative analysis of the effects of ARB treatment on histological
appearance of carotid atherosclerotic plaques and markers of inflammation in serum samples,
performed on a study population consisting of patients with symptomatic* atherosclerotic
disease, proved no conclusive evidence supporting the hypothesis that ARB treatment would
affect the composition of the plaque and the occurrence of proinflammatory proteins in vivo.
Investigation of the potential role of SMCs in mediating hypoxia induced up regulation of the
RAS and subsequent inflammatory responses proved no conclusive evidence supporting the
hypothesis that hypoxia leads to induction of the RAS and that this leads to increased
inflammation nor for the hypothesis that exposure to ARB would decrease occurrence of
proinflammatory molecules in vitro.
Related results indicate that the primary cell type involved in RAS-inflammation
interplay in the atherosclerotic plaque would be macrophages. The co localization of
macrophages and expression of AT₁ in sections of atherosclerotic plaques has been previously
observed by others [27] and furthermore, other components of the RAS, such as ACE and
angiotensin II, have been found to be similarly expressed mainly in macrophage rich areas of
the plaque [27, 28]. In this thesis it is further observed that the macrophage rich areas
expressing AT₁ are also high in HIF-1α expression; this would indicate that hypoxia may have
* Symptomatic being defined as occurrence of transitory ischemic attack (TIA), amaurosis fugax or stroke

33
a part in inducing AT₁ expression in macrophages via stabilization of HIF-1α. This scenario
does not appear to be entirely farfetched as others have shown that hypoxia induces
expression of AT₁ in a HIF-1α dependent manner in other primary human cells, namely
pulmonary fibroblasts [29].
Methodological considerations – problem analysis
Comparative analysis of histological plaque appearance and serum markers of inflammation
were unable to establish any differences between patients treated with ARB and patients
receiving neither ARB nor ACEi treatment. This does not correspond well with other findings
that indicate that differences in inflammatory profile and plaque character does exist [24, 30].
However, our study contains a number of weaknesses that need to be addressed that might
explain these discrepancies. Firstly: our control group consisted of patients with symptomatic
atherosclerotic disease, which means to say they have all shown clinical manifestations of
unstable plaques; it is therefore unlikely that any difference in AHA class should be
observable. And as most unstable plaques display similar morphological features it is unlikely
that we should be able to detect any differences regarding histological appearance; it is
possible that small differences in plaque morphology does exist between the two studied
groups but the methods available for analysis are far to blunt for any small differences to be
detectable. The problem with the control group is however not very easy to get around,
assuming the study involves examination of atherosclerotic plaques. It is not ethically
justifiable to imperil asymptomatic patients by subjecting them to possibly lethal surgery; this
makes it difficult to retrieve plaques from asymptomatic patients. If one should only wish to
study ARB effect on serum markers it would however not be unmanageable to acquire a more
suitable control group. Or one can of course study plaque morphology indirectly by
examining occurrence of clinical manifestations indicating vulnerable plaques; to study this
one would ideally use a prospective cohort trial. Secondly: we used small cohorts which make

34
it further unlikely that any small differences would become apparent. Thirdly: no
consideration was taken to the time of ARB treatment. The statistical material collected
simply states whether or not the patient received ARB treatment at the time of the study. The
same is true for the statistical data on most of the possible confounders that were considered.
Ideally information on exposure to different drugs and risk factors would be more detailed.
Finally: we must also consider the fact that our patients were not randomized to specific
treatments. It is therefore likely that the selection of patients to treatment may be a
confounding factor in our study. In summary: the comparative study of ARB treatment effect
on plaque morphology and serum markers of inflammation was not ideally designed and
perhaps it is not surprising that it proved inconclusive.
The experiments conducted on primary human aortic SMCs proved difficult to
interpret due to the substantial differences in outcome between the different experiments,
indeed, outcomes of the first and the last experiments were completely opposite (fig. 9).
However, we must consider the fact that the environment in cell culture differs widely from
the one of the human aorta in vivo. It is well known that cells taken from their natural habitat
and placed in culture will adapt to the new environment; from literature we know that SMCs
possesses a high level of plasticity and are prone to change their phenotype in response to
outer stimuli [5]. It would not seem unlikely that the reason for the varying outcomes to our
experiments is the fact that the cells were of different passage in each experiment.
Considering that cells of a lower passage are most likely possessed a phenotype similar to that
of SMCs in vivo our conclusion was that the results of the first experiment (cells of passage 2)
are likely to be the most reliable ones; this indicates that the clear trend seen in the first
experiment, i.e. that expression of AT₁ is induced by Candesartan and further induced by
hypoxia, might be worth investigating. However no similar trend could be found for secreted
proinflammatory substances when analyzing the results of ELISA analysis of medium from

35
the first SMC experiment. Our results show no indication that the increased AT₁ expression
would lead to increased secretion of proinflammatory substances; however, this might
possibly be explained by lack of angiotensin II stimuli. Others have shown that angiotensin II
can stimulate SMC proliferation and migration as well as expression of IL-18 receptor [5]. It
is possible that new experiments, conducted on cells not exposed to cell culture environment
for too long, were cells are stimulated with angiotensin II would prove interesting in further
elucidating the possible role of SMCs in hypoxia-RAS-inflammation crosstalk.
When analyzing outcome of the SMC experiments we meant to
use Real Time RT-PCR detection of HIF-1α mRNA to establish that the cells were indeed in a
hypoxic state; however expression HIF-1α mRNA was consequently lower in cells exposed to
hypoxia (fig. 10). We know that hypoxia stabilizes HIF-1α by preventing proteosomal
degradation of the protein [12], so most likely expression of the HIF-1α protein is increased in
the SMCs subjected to hypoxia – though we cannot be sure as we did not investigate this.
Supposing HIF-1α protein levels are higher in SMC subjected to hypoxia this would correlate
with a decrease in HIF-1α mRNA, which in turn would suggest some kind of negative
feedback regulation of HIF-1α mRNA synthesis by the HIF-1α protein or other mechanisms
related to hypoxia. This might be something worth investigating but the value of such an
investigation in elucidating potential interactions between hypoxia and the RAS is
questionable. But what we can learn from this is that we cannot rely on Real Time RT-PCR
quantification of HIF-1α mRNA expression to establish that cells are expressing a hypoxic
phenotype; perhaps detection of the HIF-1α protein by, for example, western immunoblotting
would better serve this purpose.
Western immunoblotting confirmed that macrophages do indeed express AT₁,
results consistent with those of others [31]; but unlike many others we did not succeed in
conclusively establish AT₁ mRNA expression in macrophages in Real Time RT-PCR analysis.

36
The fact that we were unable to detect AT₁ mRNA but were able to detect the AT₁ protein
with Western immunoblotting lead us to believe that the primer we used for Real Time RT-
PCR might not be suitable to use in experiments conducted on primary human monocyte
derived macrophages. For potential future experiments one could try using another primer that
has been found adequate in similar situations by others, for example Guo F. et al [31]. We
also feel that, just as with the SMCs, one has to be aware of the fact that the macrophages we
conduct our experiments on are exposed to conditions that widely differs from the conditions
found in the human body and in the atherosclerotic plaque. One could try to minimize the
confounding effect this has by producing an environment more similar to the one of the
atherosclerotic plaque. In this study we used angiotensin II to stimulate macrophages;
angiotensin II has been shown to induce several components of the RAS, including AT₁ [27,
31]. It might of course seem strange to use a substance know to induce increased expression
of AT₁ when expression of AT₁ is the very thing we aim to study; but since our primary
interest lies in finding out how hypoxia effects AT₁ expression this might not be a big
problem. If our hypothesis holds true and hypoxia does induce increased expression of AT₁
this should be detectable even if cells are treated with angiotensin II. Other stimuli that might
be used could be inducers of inflammation, for example lipopolysacaride (LPS) and hypoxia.
Another possible solution to the fact that we were unable to detect sufficient levels of mRNA
might be to adjust the Real Time RT-PCR method used; possibly increasing the number of
cycles used for detection would prove helpful.
In summary
We set out to investigate the possibility of interactions between hypoxia and the RAS in the
process of atherogenesis as well as what cells would seem to participate in such an
interaction. Histological examination of human atherosclerotic plaques proved very useful in
this task; and we now feel we have clear indications suggesting that such an interaction does

37
exist and that the primary cells of interest are macrophages. In vitro cell-culture experiments
did however not prove very useful; though we now have a clear idea of how experiments may
be improved for future research.
We also wished to evaluate effects of ARB drugs in hypoxic environments. It is
likely the study population used for this comparative analysis was too small to detect any
differences in plaque morphology. As to the question of ARB effects on systemic
inflammation measured as serum markers of inflammation we can in retrospective see that our
patient material was not ideal for addressing this question; as earlier stated another study
design using a different study population should probably be used to address this question.
Cell culture experiments could prove helpful in further addressing our questions and, as
previously stated, we now have a clear idea of how experiments may be improved for future
research.
Future studies
There is need for further studies to fully understand the implications of hypoxia in the
atherosclerotic tissue and in what way the RAS is involved in mediating hypoxia induced
effects. We would like to continue investigating the potential interplay between hypoxia and
the RAS in macrophages as we feel this might prove useful in furthering our understanding of
atherogenesis. The hypothesis we intend to address is that hypoxia leads to induction of the
RAS and that this leads to increased inflammation, and we now feel we should focus our
interest on macrophages. The first step would be to establish if AT₁ expression in
macrophages is in fact increased by exposure to hypoxia and that this does in fact result in
increased inflammation. We hope to be able to conduct new in vitro experiments using
primary human monocyte derived macrophages and stimulate them in different ways to
mimic the environment of the atherosclerotic plaque. Thereafter we hope to be able to detect
expression of AT₁ mRNA with Real Time RT-PCR, using an adjusted protocol, and

38
subsequently quantify expression. Medium from cell experiments would be examined for
occurrence of pro-inflammatory substances and quantification of said substances preformed
by use of ELISA. If we can establish that our hypothesis holds true we can then examine
potential ways of preventing hypoxia induced inflammation mediated by the RAS.
Conclusions and Implications
In this thesis it is concluded that angiotensin II receptor type 1 is expressed in hypoxic,
macrophage rich areas of the human atherosclerotic plaque; this conclusion was made by
histological examination of atherosclerotic plaques. This is further supported by the finding
that levels of AT₁ expression are significantly correlated to CD68 expression ***, and that
levels of HIF-1α as well are correlated to CD68 expression **. This might perhaps lead to
increased interest in investigating the role of hypoxia in atherogenesis which might in turn
lead to important advances in our understanding of this complex process that is the underlying
cause of approximately 50% of all deaths in today’s western society.

39
Populärvetenskaplig sammanfattning
järt-kärlsjukdom är den ledande orsaken till död och sjuklighet i dagens
samhälle [1]; åderförkalkning, på medicinskt fackspråk kallat ateroskleros, är
den underliggande orsaken till många manifestationer av hjärt-kärlsjukdom och
har uppskattats vara orsak till ungefär 50 % av alla dödsfall i vårt västerländska samhälle [2].
Ateroskleros är en sjukdom som karakteriseras av bildandet av plack i kroppens blodkärl, det
är en långsam process som drabbar de flesta av oss så småningom. Det hela börjar med att
LDL-kolesterol (populärt kallat ”det onda kolesterolet”) ansamlas i det innersta lagret av
kärlväggen; detta leder till en skada på kärlet och som resultat uppstår inflammation i
vävnaden. Vi tror oss idag veta att det är inflammationen som är den drivande faktorn i
bildandet av och utvecklingen av aterosklerotiska plack [1, 2, 4, 6-8]. Inflammatoriska celler i
immunsystemet kommer dra sig till området för att försöka reparera skadan; bland dessa
celler återfinner vi makrofagerna (”storätarna”), en viktig komponent i immunsystemet som
bl.a. verkar genom att utsöndra signalmolekyler till andra celler i immunsystemet och agera
som en koordinator av det inflammatoriska svaret. Normalt sett är inflammationen en viktig
del i kroppens läkningssystem, när en vävnad skadas uppstår inflammation som bidrar till att
skadan läks och när läkning har skett klingar inflammationen av; men eftersom denna skada
inte kan repareras kommer inflammationen att fortsätta, öka och leda till större vävnadsskada
– inflammatoriska celler och LDL fortsätter ansamlas. Den brännande frågan i sammanhanget
är – vad är det som driver inflammationen? Detta är en stor och komplex fråga där mycket har
gjorts för att föra kunskapen framåt. Vi vet idag mycket om hur och varför inflammationen
uppstår, men långt ifrån allt. Det är just denna fråga som vår studie berör.
Vi har i denna studie funnit att det i områden av syrebrist i det humana
aterosklerotiska placket återfinns makrofager (inflammatoriska celler) som uttrycker
angiotensin II receptor typ 1 (AT₁). Angiotensin II och AT₁ är viktiga komponenter kroppens
H

40
system för att reglera blodtrycket (lägg till referens); men man har också på senare tid börjat
inse att stimulering av AT₁ med angiotensin II kan leda till inflammation (lägg till referens).
Det skulle alltså förefalla som om makrofager i aterosklerotiska plack uttrycker AT₁ vilket
skulle kunna bidra till inflammationen i placket. Det mest intressanta i vår upptäckt är att
dessa makrofager som uttrycker AT₁ uppvisar tecken på syrebrist. Detta antyder att det skulle
kunna finnas en koppling mellan syrebris och uttryck av AT₁. Något som ytterligare stödjer
detta är att när vi utför våra analyser ser vi att uttryck av syrebristmarkören HIF-1α (hypoxia
inducible factor-1α) korrelerar väl med förekomst av makrofager. Likaså korrelerar förekomst
av makrofager ytterst väl med uttryck av AT₁. Detta öppnar för spännande möjligheter till ny
forskning kring vilka effekter syrebrist och AT₁ uttryck i makrofager kan ha på inflammation
och utvecklingen av ateroskleros. Om vi kan förstå dessa processer är det möjligt att vi kan
lära oss att motverka dem och minska dödligheten och sjukligheten i hjärt-kärlsjukdom.
Redan idag finns det läkemedel som blockerar AT₁; om vi kan visa att stimulering av AT₁
driver utveckling av ateroskleros skulle användningen av dessa läkemedel kanske komma fler
till gagn.
Tillvägagångssätt
I vårt arbete har vi undersökt humana aterosklerotiska plack från frivilliga studiedeltagare
som genomgått operation med kirurgiskt avlägsnande av plack i halskärlen. Till vårt
förfogande hade vi 123 plack, dessa delade vi i mycket tunna snitt (4 mikrometer) som vi
sedan färgade in med specifika antikroppar och färger för att detektera uttryck av makrofager,
AT₁ och syrebristmarkören HIF-1α. Till varje färgning behöver man ett nytt snitt men
eftersom snitten är så tunna blir det fortfarande samma del av placket man tittar på trots att det
är ett nytt snitt. Efter färgning kunde vi fotografera placken i mikroskop för att sedan
analysera dem med hjälp av ett datorprogram specialframtaget för forskningsanalys av olika

41
vävnader. Genom att inspektera de olika färgningarna för varje plack kunde vi se att AT₁ och
syrebristmarkören HIF-1α båda uttrycks i områden där det finns rikligt med makrofager. När
vi sedan med hjälp av vårt datorprogram gör en uträkning för att se hur mycket AT₁, HIF-1α
och makrofager det finns i varje plack ser vi att mängden AT₁ korrelerar oerhört väl med
mängden makrofager, ju fler makrofager desto mer AT₁. Vi ser också att mängden HIF-1α
korrelerar väl med mängden makrofager, ju mer HIF-1α – det vill säga ju mer syrebrist –
desto mer makrofager.
För att försäkra oss om att det vi ser i placken verkligen skulle kunna stämma
undersökte vi humana makrofager som donerats av frivilliga givare och som vi placerade i
cell odling (dvs. cellerna tas från sin naturliga miljö i kroppen och odlas i värmeskåp i
näringsrik vätska). På dessa makrofager kunde vi sedan testa om de uttryckte AT₁ med hjälp
av en teknik som kallas western immunoblotting, som i korthet går ut på att proteiner från
celler separeras beroende på storlek och sedan färgas in med specifika antikroppar så att de
kan detekteras. På detta sätt kunde vi fastslå att humana makrofager mycket riktigt uttrycker
AT₁ och det vi observerat när vi undersökte placken skulle mycket väl kunna stämma.
Framtiden
Vi hoppas kunna forska vidare på vilken betydelse syrebrist, makrofager och AT₁ har för
utvecklandet av ateroskleros. Förhoppningsvis kan även andra tänkas intressera sig för ämnet
och hjälpa oss att undersöka detta. Visionen är givet vis att vi i framtiden skall kunna erbjuda
bättre behandling för denna vanliga och svåra sjukdom som ateroskleros är.

42
Acknowledgments
Special thanks to my supervisor Lillemor Mattsson Hultén and to my co-workers Christina
Ullström and Lisa Magnusson. Also thanks to Max Pertzol, Caroline Schmidt, Marie-Louise
Ekholm and Kerstin Thalén.
References
1. Mizuno, Y., R.F. Jacob, and R.P. Mason, Inflammation and the development of atherosclerosis. J Atheroscler Thromb, 2011. 18(5): p. 351-8.
2. Lusis, A.J., Atherosclerosis. Nature, 2000. 407(6801): p. 233-41. 3. Tabas, I., K.J. Williams, and J. Boren, Subendothelial lipoprotein retention as the initiating
process in atherosclerosis: update and therapeutic implications. Circulation, 2007. 116(16): p. 1832-44.
4. Hansson, G.K. and A. Hermansson, The immune system in atherosclerosis. Nat Immunol, 2011. 12(3): p. 204-12.
5. Orr, A.W., et al., Complex regulation and function of the inflammatory smooth muscle cell phenotype in atherosclerosis. J Vasc Res, 2010. 47(2): p. 168-80.
6. Ross, R., Atherosclerosis--an inflammatory disease. N Engl J Med, 1999. 340(2): p. 115-26. 7. Libby, P., Inflammation in atherosclerosis. Nature, 2002. 420(6917): p. 868-74. 8. Libby, P., et al., Inflammation in atherosclerosis: transition from theory to practice. Circ J,
2010. 74(2): p. 213-20. 9. Bjornheden, T. and G. Bondjers, Oxygen consumption in aortic tissue from rabbits with diet-
induced atherosclerosis. Arteriosclerosis, 1987. 7(3): p. 238-47. 10. Sluimer, J.C., et al., Hypoxia, hypoxia-inducible transcription factor, and macrophages in
human atherosclerotic plaques are correlated with intraplaque angiogenesis. J Am Coll Cardiol, 2008. 51(13): p. 1258-65.
11. Semenza, G.L., Regulation of physiological responses to continuous and intermittent hypoxia by hypoxia-inducible factor 1. Exp Physiol, 2006. 91(5): p. 803-6.
12. Semenza, G.L., Regulation of oxygen homeostasis by hypoxia-inducible factor 1. Physiology (Bethesda), 2009. 24: p. 97-106.
13. Hulten, L.M. and M. Levin, The role of hypoxia in atherosclerosis. Curr Opin Lipidol, 2009. 20(5): p. 409-14.
14. Semenza, G.L., Oxygen homeostasis. Wiley Interdiscip Rev Syst Biol Med, 2010. 2(3): p. 336-61.
15. Oliver, K.M., C.T. Taylor, and E.P. Cummins, Hypoxia. Regulation of NFkappaB signalling during inflammation: the role of hydroxylases. Arthritis Res Ther, 2009. 11(1): p. 215.
16. Taylor, C.T., Interdependent roles for hypoxia inducible factor and nuclear factor-kappaB in hypoxic inflammation. J Physiol, 2008. 586(Pt 17): p. 4055-9.
17. Rius, J., et al., NF-kappaB links innate immunity to the hypoxic response through transcriptional regulation of HIF-1alpha. Nature, 2008. 453(7196): p. 807-11.
18. Savoia, C., et al., Angiotensin II and the vascular phenotype in hypertension. Expert Rev Mol Med, 2011. 13: p. e11.

43
19. Jia, L., et al., Angiotensin II induces inflammation leading to cardiac remodeling. Front Biosci, 2012. 17: p. 221-31.
20. Capettini, L.S., et al., Role of renin-angiotensin system in inflammation, immunity and aging. Curr Pharm Des, 2012. 18(7): p. 963-70.
21. Limor, R., et al., Angiotensin II increases the expression of lectin-like oxidized low-density lipoprotein receptor-1 in human vascular smooth muscle cells via a lipoxygenase-dependent pathway. Am J Hypertens, 2005. 18(3): p. 299-307.
22. Suzuki, Y., et al., Inflammation and angiotensin II. Int J Biochem Cell Biol, 2003. 35(6): p. 881-900.
23. Durante, A., et al., Role of the renin-angiotensin-aldosterone system in the pathogenesis of atherosclerosis. Curr Pharm Des, 2012. 18(7): p. 981-1004.
24. Jankowski, P., M.E. Safar, and A. Benetos, Pleiotropic effects of drugs inhibiting the renin-angiotensin-aldosterone system. Curr Pharm Des, 2009. 15(5): p. 571-84.
25. Foster, G.E., et al., Intermittent hypoxia increases arterial blood pressure in humans through a Renin-Angiotensin system-dependent mechanism. Hypertension, 2010. 56(3): p. 369-77.
26. Stary, H.C., et al., A definition of advanced types of atherosclerotic lesions and a histological classification of atherosclerosis. A report from the Committee on Vascular Lesions of the Council on Arteriosclerosis, American Heart Association. Circulation, 1995. 92(5): p. 1355-74.
27. Schieffer, B., et al., Expression of angiotensin II and interleukin 6 in human coronary atherosclerotic plaques: potential implications for inflammation and plaque instability. Circulation, 2000. 101(12): p. 1372-8.
28. Fukuhara, M., et al., Angiotensin-converting enzyme expression in human carotid artery atherosclerosis. Hypertension, 2000. 35(1 Pt 2): p. 353-9.
29. Krick, S., et al., Hypoxia-driven proliferation of human pulmonary artery fibroblasts: cross-talk between HIF-1alpha and an autocrine angiotensin system. FASEB J, 2005. 19(7): p. 857-9.
30. Patarroyo Aponte, M.M. and G.S. Francis, Effect of Angiotensin-Converting Enzyme Inhibitors and Angiotensin Receptor Antagonists in Atherosclerosis Prevention. Curr Cardiol Rep, 2012.
31. Guo, F., et al., Role of angiotensin II type 1 receptor in angiotensin II-induced cytokine production in macrophages. J Interferon Cytokine Res, 2011. 31(4): p. 351-61.