
INTENSIVE TEMPERATURE AND DISSOLVED OXYGEN … · TABLE OF CONTENTS Section ... (Sample size is...
70
Yadkin-Pee Dee River Hydroelectric Project FERC No. 2206 INTENSIVE TEMPERATURE AND DISSOLVED OXYGEN STUDY OF THE PEE DEE RIVER BELOW THE TILLERY AND BLEWETT FALLS HYDROELECTRIC PLANTS WATER RESOURCES GROUP ISSUE NOS. 7 AND 8 - LAKE TILLERY AND BLEWETT FALLS LAKES AND TAILWATERS WATER QUALITY PROGRESS ENERGY NOVEMBER 2005 © 2005 Progress Energy
Transcript of INTENSIVE TEMPERATURE AND DISSOLVED OXYGEN … · TABLE OF CONTENTS Section ... (Sample size is...

Yadkin-Pee Dee River Hydroelectric Project FERC No. 2206
INTENSIVE TEMPERATURE AND DISSOLVED OXYGEN STUDY OF THE
PEE DEE RIVER BELOW THE TILLERY AND BLEWETT FALLS
HYDROELECTRIC PLANTS
WATER RESOURCES GROUP ISSUE NOS. 7 AND 8 - LAKE TILLERY AND BLEWETT FALLS
LAKES AND TAILWATERS WATER QUALITY
PROGRESS ENERGY
NOVEMBER 2005
© 2005 Progress Energy


i
TABLE OF CONTENTS
Section Title Page No. ACRONYM LIST ....................................................................................................AL-1 EXECUTIVE SUMMARY ..........................................................................................ES-1 SECTION 1 - INTRODUCTION .................................................................................... 1-1 SECTION 2 - STUDY OBJECTIVES ............................................................................. 2-1 SECTION 3 - SITE DESCRIPTION ............................................................................... 3-1 SECTION 4 - METHODS ............................................................................................ 4-1 4.1 Conduct of Study........................................................................................................... 4-1 4.2 Data Reduction and Analysis ........................................................................................ 4-2 4.3 Quality Assurance and Quality Control ........................................................................ 4-4 SECTION 5 - RESULTS AND DISCUSSION .................................................................. 5-1 5.1 River Channel Characteristics within Study Reaches ................................................... 5-1 5.2 Reach 1 (Tillery Dam to Turkey Top Creek) ................................................................ 5-1
5.2.1 Lake Tillery Temperature and DO Stratification Patterns .............................. 5-1 5.2.2 Longitudinal Characteristics of Temperature and DO in Reach 1.................. 5-1 5.2.3 Lateral Channel Characteristics of Temperature and DO in Reach 1........... 5-12 5.2.4 Comparison of Continuous Temperature and DO Monitor and Field Instrument Data in Reach 1........................................................................... 5-14
5.3 Reach 2 (Blewett Falls Dam to Cheraw, South Carolina)........................................... 5-14 5.3.1 Blewett Falls Lake Temperature and DO Stratification Patterns.................. 5-14 5.3.2 Longitudinal Characteristics of Temperature and DO in Reach 2................ 5-17 5.3.3 Lateral Channel Characteristics of Temperature and DO in Reach 2........... 5-23 5.3.4 Comparison of Continuous Temperature and DO Monitor and Field Instrument Data in Reach 2........................................................................... 5-26
SECTION 6 - SUMMARY ........................................................................................... 6-1 SECTION 7 - REFERENCES........................................................................................ 7-1

TABLE OF CONTENTS (Continued)
Section Title Page No.
ii
APPENDICES APPENDIX A - SUMMARY OF TEMPERATURE AND DO DATA COLLECTED BY
TRANSECT AND FLOW RELEASE PERIOD BELOW THE TILLERY AND BLEWETT FALLS HYDROELECTRIC PLANTS DURING THE INTENSIVE TEMPERATURE AND DO STUDY, AUGUST 2004
APPENDIX B - RELATIVE GAGE HEIGHT (CM) OF RIVER STAGE AT MONITORING STATIONS BELOW THE TILLERY AND BLEWETT FALLS HYDROELECTRIC PLANTS DURING THE INTENSIVE TEMPERATURE AND DO STUDY, AUGUST 2004

iii
LIST OF FIGURES
Figure Title Page No. Figure 3-1 Map of the Tillery Hydroelectric Development and Pee Dee River (Reach 1)
showing transects used in the intensive temperature and DO study during August 2004. ........................................................................................................ 3-2
Figure 3-2 Map of the Blewett Falls Hydroelectric Development and Pee Dee River (Reach 2) showing transects used in the intensive temperature and DO study during August 2004. ............................................................................................ 3-3
Figure 5-1 Water temperature and DO profiles at Station B2 in Lake Tillery prior to and after power generation during the intensive temperature and DO study below the Tillery Hydroelectric Plant, August 2004...................................................... 5-3
Figure 5-2 Lateral and longitudinal patterns of DO concentrations by transect and flow release period during the intensive temperature and DO study in Reach 1 of the Pee Dee River below the Tillery Hydroelectric Plant, August 2004. ............ 5-6
Figure 5-3 Frequency of DO concentrations by transect for the low-flow period during the intensive temperature and DO study in Reach 1 of the Pee Dee River below the Tillery Hydroelectric Plant, August 2004 (Sample size is given for each transect). ...................................................................................................... 5-7
Figure 5-4 Frequency of DO concentrations by transect for the power generation period during the intensive temperature and DO study in Reach 1 of the Pee Dee River below the Tillery Hydroelectric Plant, August 2004 (Sample size is given for each transect)........................................................................................ 5-8
Figure 5-5 Frequency of DO concentrations by transect for the no power generation period during the intensive temperature and DO study in Reach 1 of the Pee Dee River below the Tillery Hydroelectric Plant, August 2004 (Sample size is given for each transect). ................................................................................. 5-10
Figure 5-6 Comparison of DO concentrations collected by continuous temperature and DO monitors and field instruments at transects in Reach 1 during the intensive temperature and DO study of the Pee Dee River below the Tillery Hydroelectric Plant, August 2004...................................................................... 5-15
Figure 5-7 Water temperature and DO profiles at Station B2 in Blewett Falls Lake prior to and after power generation during the intensive temperature and DO study below the Blewett Falls Hydroelectric Plant, August 2004............................... 5-16
Figure 5-8 Lateral and longitudinal patterns of DO concentrations by transect and flow scenario during the intensive temperature and DO study in Reach 2 of the Pee Dee River below the Blewett Falls Hydroelectric Plant, August 2004. ............ 5-18
Figure 5-9 Frequency of DO concentrations by transect for the low flow period during the intensive temperature and DO study in Reach 2 of the Pee Dee River below the Blewett Falls Hydroelectric Plant, August 2004 (Sample size is given for each transect)...................................................................................... 5-20
Figure 5-10 Frequency of DO concentrations by transect for the power generation period during the intensive temperature and DO study in Reach 2 of the Pee Dee

LIST OF FIGURES (Continued)
Figure Title Page No.
iv
River below the Blewett Falls Hydroelectric Plant, August 2004 (Sample size is given for each transect). ................................................................................. 5-21
Figure 5-11 Frequency of DO concentrations by transect for the no power generation period during the intensive temperature and DO study in Reach 2 of the Pee Dee River below the Blewett Falls Hydroelectric Plant, August 2004 (Sample size is given for each transect). .......................................................................... 5-22
Figure 5-12 Comparison of DO concentrations collected by continuous temperature and DO monitors and field instruments at transects in Reach 2 during the intensive temperature and DO study of the Pee Dee River below the Blewett Falls Hydroelectric Plant, August 2004 (Sample size is given for each transect).............................................................................................................. 5-27
v
LIST OF TABLES
Table Title Page No. Table 3-1 Description of transect locations used in the intensive temperature and DO
study in Reaches 1 and 2 of the Pee Dee River below the Tillery and Blewett Falls Hydroelectric Plants during August 2004................................................... 3-1
Table 5-1 Transect GPS coordinates, channel widths, and channel depth statistics (mean with minimum and maximum values in parenthesis) by flow release period for Reaches 1 and 2 located below the Tillery and Blewett Falls Hydroelectric Plants during the intensive temperature and DO study, August 2004...................................................................................................................... 5-2
Table 5-2 Results of repeated measures analysis-of-variance for temperature and DO concentrations by transect for flow release periods during the intensive temperature and DO study in Reach 1 of the Pee Dee River below the Tillery Hydroelectric Plant, August 2004...................................................................... 5-11
Table 5-3 Results of repeated measures analysis-of-variance for temperature and DO concentrations by transect for channel segment during the intensive temperature and DO study in Reach 1 of the Pee Dee River below the Tillery Hydroelectric Plant, August 20041.................................................................... 5-13
Table 5-4 Results of repeated measures analysis-of-variance for temperature and DO concentrations by transect for flow release periods during the intensive temperature and DO study in Reach 2 of the Pee Dee River below the Blewett Falls Hydroelectric Plant, August 2004. .............................................. 5-24
Table 5-5 Results of repeated measures analysis-of-variance for temperature and DO concentrations by transect for channel segment during the intensive temperature and DO study in Reach 2 of the Pee Dee River below the Blewett Falls Hydroelectric Plant, August 20041. ............................................ 5-25

AL-1
Acronym List Federal/State Agencies Advisory Council on Historic Preservation (ACHP) Federal Aviation Administration (FAA) Federal Energy Regulatory Commission (FERC) National Park Service (NPS) National Marine Fisheries Service (NMFS) National Oceanic and Atmospheric Administration (NOAA) National Resource Conservation Service (NRCS) formerly known as Soil Conservation Service National Weather Service (NWS) North Carolina Department of Environment and Natural Resources (NCDENR) North Carolina Environmental Management Commission (NCEMC) North Carolina Department of Natural and Economic Resources, Division of Environmental Management (NCDEM) North Carolina Division of Parks and Recreation (NCDPR) North Carolina Division of Water Resources (NCDWR) North Carolina Division of Water Quality (NCDWQ) North Carolina Natural Heritage Program (NCNHP) North Carolina State Historic Preservation Officer (NCSHPO) North Carolina Wildlife Resources Commission (NCWRC) South Carolina Department of Natural Resources (SCDNR) South Carolina Department of Health and Environmental Control (SCDHEC) State Historic Preservation Office (SHPO) U.S. Army Corps of Engineers (ACOE) U.S. Department of Interior (DOI) U.S. Environmental Protection Agency (USEPA) U.S. Fish and Wildlife Service (USFWS) U.S. Geological Survey (USGS) U.S. Department of Agriculture (USDA) U.S. Forest Service (USFS) Other Entities Alcoa Power Generating, Inc., Yadkin Division (APGI) Progress Energy (Progress) University of North Carolina at Chapel Hill (UNCCH) Facilities/Places Yadkin - Pee Dee River Project (entire two-development project including both powerhouses, dams and impoundments) Blewett Falls Development (when referring to dam, powerhouse and impoundment) Blewett Falls Dam (when referring to the structure) Blewett Falls Hydroelectric Plant (when referring to the powerhouse) Blewett Falls Lake (when referring to the impoundment) Tillery Development (when referring to dam, powerhouse and impoundment) Tillery Dam (when referring to the structure)

Acronym List
AL-2
Tillery Hydroelectric Plant (when referring to the powerhouse) Lake Tillery (when referring to the impoundment) Documents 401 Water Quality Certification (401 WQC) Draft Environmental Assessment (DEA) Environmental Assessment (EA) Environmental Impact Statement (EIS) Final Environmental Assessment (FEA) Initial Consultation Document (ICD) Memorandum of Agreement (MOA) National Wetland Inventory (NWI) Notice of Intent (NOI) Notice of Proposed Rulemaking (NOPR) Preliminary Draft Environmental Assessment (PDEA) Programmatic Agreement (PA) Scoping Document (SD) Shoreline Management Plan (SMP) Laws/Regulations Clean Water Act (CWA) Code of Federal Regulations (CFR) Electric Consumers Protection Act (ECPA) Endangered Species Act (ESA) Federal Power Act (FPA) Fish and Wildlife Coordination Act (FWCA) National Environmental Policy Act (NEPA) National Historic Preservation Act (NHPA) Terminology Alternative Relicensing Process (ALP) Cubic feet per second (cfs) Degrees Celsius (C) Degrees Fahrenheit (F) Dissolved oxygen (DO) Feet (ft) Gallons per day (gpd) Geographic Information Systems (GIS) Gigawatt Hour (GWh) Global Positioning System (GPS) Grams (g) Horsepower (hp) Kilogram (kg) Kilowatts (kW) Kilowatt-hours (kWh) Mean Sea Level (msl)

Acronym List
AL-3
Megawatt (MW) Megawatt-hours (MWh) Meter (m) Micrograms per liter (µg/L) Milligrams per liter (mg/L) Millimeter (mm) Million gallons per day (mgd) National Geodetic Vertical Datum (NGVD) National Wetlands Inventory (NWI) Non-governmental Organizations (NGOs) Ounces (oz.) Outstanding Remarkable Value (ORV) Parts per billion (ppb) Parts per million (ppm) Pounds (lbs.) Power Factor (p.f.) Probable Maximum Flood (PMF) Project Inflow Design Flood (IDF) Rare, Threatened, and Endangered Species (RTE) Ready for Environmental Assessment (REA) Resource Work Groups (RWG) Revolutions per Minute (rpm) Rights-of-way (ROW) Stakeholders (federal and state resource agencies, NGOs, and other interested parties) Volts (V)

ES-1
Executive Summary An intensive temperature and dissolved oxygen (DO) study was conducted in the Pee Dee River tailwater reaches below the Tillery and Blewett Falls Hydroelectric Plants during August 10 to 12, 2004. The purpose of this study was to assess the spatial and temporal trends in temperature and DO concentrations in the Pee Dee River, downstream of the power plants during low flow conditions and typical power plant startup (i.e., power generation) and shutdown (i.e., no power generation) operational sequences. Study reaches and transects encompassed the river segments below each hydroelectric plant that have been listed by the North Carolina Division of Water Quality (NCDWQ) as impaired due to low DO concentrations under Section 303(d) of the Clean Water Act. There were longitudinal (upstream to downstream) and lateral (channel bank to channel bank) differences in the DO regime of the Pee Dee River below the Tillery Hydroelectric Plant. The DO concentrations generally increased from the immediate power plant tailrace to the lowermost transect located at the Turkey Top Creek confluence, approximately 15 miles downstream of the power plant. These spatial differences were most apparent during the low flow and power generation periods. The DO concentrations in the Pee Dee River below the Tillery Hydroelectric Plant were below the North Carolina instantaneous and daily average water quality DO standards of 4.0 mg/L and 5.0 mg/L, respectively, at transects located from 0.1 to 4.5 miles downstream of the power plant during the low flow and power generation periods. Mean DO concentrations generally increased above 5.0 mg/L at transects located downstream of the Rocky River confluence, approximately five miles downstream of the power plant. These increased DO concentrations indicated there was re-aeration as the water traveled downstream through a series of shoals and drops in the river channel gradient and that tributary inflow, largely from the Rocky River, helped to increase DO concentrations. However, the lowermost transect at the Turkey Top Creek confluence had a mean DO concentration less than 5.0 mg/L during the low-flow period which suggested that either tributary input or low DO water from a previous power generation event was influencing DO dynamics at this transect. During the no power generation period, mean DO concentrations were above 5.0 mg/L at four of the six monitored transects; the exceptions being the transects located in the immediate tailwaters area and 4.5 miles below the power plant. The North Carolina instantaneous water quality DO standard of 4.0 mg/L was not met at the three transects located above the Rocky River confluence during the no power generation period. No DO values were below the instantaneous standard at transects located below the Rocky River confluence during the no power generation period. There were lateral channel differences in DO concentrations in the Pee Dee River below the Tillery Hydroelectric Plant during the low flow, power generation, and no power generation periods. Generally, the DO concentrations were lower on the east side of the channel closest to the power plant tailrace and increased on the west side of the channel. The surface water spilled at the dam tainter gates, which had a greater DO concentration, tended to follow the west side of the channel thereby increasing the DO concentrations on that channel side. During the power generation period, the low DO water released from the Tillery Hydroelectric Plant followed the east side of the river channel. This “plume” of low DO water was detected on the east

Executive Summary
ES-2
side of the river channel from the transect in the immediate tailwaters to the transect located approximately 6 miles downstream of the power plant. There appeared to be further mixing in the river channel with increased distance downstream of the power plant as these lateral differences in DO concentrations were not as pronounced at transects located at 6 to 15 miles downstream of the power plant. Additional inflow and mixing from the Rocky River and other tributaries may have also helped dissipate this lateral channel gradient in DO concentrations at these downstream transects. In the Pee Dee River below the Blewett Falls Hydroelectric Plant, longitudinal differences were also observed for both temperature and DO concentrations at the low flow period but these differences were not evident during the power generation and no power generation periods. During the low flow period, the DO concentrations were below the North Carolina water quality instantaneous (<4.0 mg/L) and daily average (<5.0 mg/L) DO standards at transects located from 0.2 to 3.6 miles below the power plant. Low DO concentrations at these upstream transects may have been caused by algal respiration during the nighttime and early morning hours. Mean DO concentrations were above 5.0 mg/L at the three lowermost transects located 7.1 to 23.5 miles below the power plant. These spatial differences also indicated there was substantial aeration of water as it flowed through a series of shoals and drops in river channel gradient, particularly below the U.S. Highway 74 Bridge. Mean DO concentrations were >5.0 mg/L at all transects below the Blewett Falls Hydroelectric Plant during the power generation and no power generation periods. No DO values were less than 4.0 mg/L at transects located from 0.2 to 1.9 miles and from 7.1 to 23.5 miles downstream of the power plant during the power generation and no power generation periods. The lowest mean DO concentrations and the greatest percentage of DO values <4.0 mg/L during these flow periods occurred at the transect located 3.6 miles downstream of the power plant at the U.S. Highway 74 Bridge. The reason(s) for the lower DO concentrations at this transect was unclear but may have been related to movement of low DO water from upstream areas during power generation, biological or chemical oxygen demand, or inflow of low DO water from tributaries. There was a lateral (east bank to west bank) difference in mean DO concentrations during the low flow period at the transect located closest to the Blewett Falls Hydroelectric Plant. The mean DO concentrations were greater on the west channel side nearest the power plant tailrace compared to the mean concentrations at the mid channel and east channel side. There was apparently enough wicket gate seepage of reservoir water from the power plant to increase DO concentrations on the west channel side. Lower DO concentrations on the east channel side may have been related to DO depletion from algal respiration and little turnover of water on this channel side during the low flow period. Lower mean DO values occurred on the east channel side at 1.9 miles below the Blewett Falls Hydroelectric Plant during the power generation and no power generation periods but not during the low flow period. Lateral channel differences were also evident at the transect located 3.6 miles downstream at the U.S. Highway 74 Bridge. There were greater mean DO concentrations on the west channel side and mid channel compared to the east channel side for all three flow periods. Lateral channel differences in mean DO concentrations were not as evident at other transects located 7.1 to 23.5 miles downstream during the three flow periods. This lack of lateral channel DO differences at these downstream transects again indicated that there was mixing and re-aeration of water as it flowed through a series of shoals and drops in river channel gradient below the U.S. Highway 74 Bridge.

1-1
Section 1 - Introduction Progress Energy is currently relicensing the Tillery and Blewett Falls Hydroelectric Developments (i.e., Yadkin-Pee Dee River Hydroelectric Project No. 2206) with the Federal Regulatory Commission (FERC). As part of the relicensing process, Progress Energy established Resource Work Groups (RWGs) during May 2003 to identify environmental issues associated with project operations and develop study plans, if necessary, specific to project lands and associated lakes and tailwaters. The Water Resources Work Group (RWG) identified the need for additional water quality studies of the Project reservoirs and tailwaters (i.e., Progress Energy (2004a), Water RWG Issue Nos. 7 and 8, “Lake Tillery and Blewett Falls Lakes and Tailwaters Water Quality”). The purpose of these studies was to evaluate the water quality in the Project reservoirs and the Pee Dee River below the Tillery and Blewett Falls Hydroelectric Plants. Specifically, these water quality studies addressed: (1) meeting state water quality standards and supporting designated uses in the reservoirs and tailwaters; (2) evaluating the Project operation effects on the water quality in both reservoirs and downstream tailwaters; (3) cumulative effects of nutrient and sediment loading on reservoirs and tailwaters; and (4) water quality effects of Rocky River inflow. Three studies were developed to address the water quality issues: (1) a monthly sampling program at the Tillery and Blewett Falls Developments to characterize the existing water quality conditions in the Project reservoirs and downstream tailwaters, including the effects of the Rocky River tributary inflow; (2) an intensive assessment of the spatial and temporal patterns of temperature and dissolved oxygen (DO) concentrations in the Pee Dee River downstream of each power plant; and (3) a continuous monitoring study of water temperature and DO from May through November in the upper, mid, and lower areas of the North Carolina Division of Water Quality [NCDWQ]) designated 303(d) impaired river sections below each hydroelectric development dam. These studies also characterized the water quality of the Project tailwaters with and without power plant generation. This report addresses the intensive assessment of spatial and temporal patterns of temperature and DO concentrations in the Pee Dee River downstream of each power plant. The NCDWQ has listed sections of the Pee Dee River below each hydroelectric development as impaired for aquatic life due to low DO concentrations from the hydropower operations (NCDWQ 2004a). These sections are: (1) the 15.3-mile section of the Pee Dee River from Tillery Dam (i.e., Norwood Dam) to the confluence of Turkey Top Creek; and (2) the 6.3-mile section from Blewett Falls Dam to the confluence of Hitchcock Creek. The Pee Dee River from Tillery Dam to Blewett Falls Lake has a Class WS-V&B water quality classification and the Pee Dee River from Blewett Falls Lake to Hitchcock Creek has a Class C classification (NCDWQ 2004a). Class WS-V&B waters are designated as drinking water supplies and primary recreation while Class C are designated for propagation of aquatic life and secondary recreational uses.

2-1
Section 2 - Study Objectives The objective of this study was to intensively assess in-situ spatial and temporal trends of temperature and DO concentrations in the Pee Dee River, downstream of the Tillery and Blewett Falls Hydroelectric Plants during low flow conditions (i.e., no power plant operations) and typical power plant startup and shutdown operational sequences. The study evaluated the longitudinal (upstream to downstream areas) and lateral (channel cross-section) differences in the temperature and DO regimes in the Pee Dee River below the hydroelectric plants. In addition, vertical profiles of the reservoir temperatures and DO concentrations were determined in the vicinity of each power plant intake to document the stratification patterns present in both reservoirs during the study.

3-1
Section 3 - Site Description This study was conducted in two reaches of the Pee Dee River. The first reach (Reach 1), which was 15.3 miles in length, extended from the base of Tillery Dam to the confluence of Turkey Top Creek (Table 3-1 and Figure 3-1). The second reach (Reach 2), which was 23.5 miles in length, extended from the base of Blewett Falls Dam to just below U.S. Highway 1 at Cheraw, South Carolina (Table 3-1 and Figure 3-2). Six transects were established in the Pee Dee River downstream of each hydroelectric development in the upper, mid, and lower areas of the NCDWQ-designated 303(d) impaired river sections (Table 3-1). Additionally, two of the transects in Reach 2 (i.e., Transects BF5 and BF6) were located below the 303(d) impaired section of the river to further evaluate the longitudinal DO patterns downstream of the Blewett Falls Hydroelectric Plant. Table 3-1 Description of transect locations used in the intensive temperature and DO
study in Reaches 1 and 2 of the Pee Dee River below the Tillery and Blewett Falls Hydroelectric Plants during August 2004.
Transect Location Description (approximate river miles below each power plant dam) Reach 1 Tillery Hydroelectric Plant
TY1 Above the railroad trestle in the power plant tailrace (0.1 mile) TY2 Below N.C. Highway 731 bridge and just above shoal area (0.5 mile) TY3 Above Rocky River confluence (4.5 miles) TY4 Below Rocky River confluence at Leak Island (6.0 miles) TY5 Below N.C. Highway 109 Bridge (12.2 miles) TY6 Confluence of Turkey Top Creek above Blewett Falls Lake (15.3 miles)
Reach 2 Blewett Falls Hydroelectric Plant BF1 Slightly below peninsula separating the power plant tailrace and dam (0.2 mile) BF2 Below Big Island and Cartledge Creek confluence (1.9 miles) BF3 Below U.S. Highway 74 Bridge (3.6 miles) BF4 Below Hitchcock Creek confluence (7.1 miles) BF5 Below Mill Creek confluence and Jones Creek shoal (11.8 miles) BF6 Below U.S Highway 1 Bridge at Cheraw, SC (23.5 miles)
During the study, some transects were moved in each reach to better assess the influence of major tributary input on temperature and DO dynamics in the river. Transect TY3 in Reach 1 was originally located below an old dam weir location approximately two miles below the Tillery Hydroelectric Plant. This transect was dropped from the study and a new transect (Transect TY4) was added approximately 1.5 miles downstream of the Rocky River confluence (Figure 3-1). In Reach 2, Transect BF2 was moved downstream of Big Island and the Cartledge Creek confluence, and Transect BF5 was moved just downstream of the Mill Creek confluence (Figure 3-2). A station was established in each power plant reservoir near the intake structure to evaluate the temperature and DO stratification profiles of the reservoirs’ water column prior to and after power plant operations during the study (Figures 3-1 and 3-2). Each station was located in the mid-channel in the lower reservoir area. These stations were also used in the monthly reservoir water quality study (i.e., Stations TYB2 and BFB2).

Section 3 Site Description
3-2
Figure 3-1 Map of the Tillery Hydroelectric Development and Pee Dee River (Reach 1)
showing transects used in the intensive temperature and DO study during August 2004.

Section 3 Site Description
3-3
Figure 3-2 Map of the Blewett Falls Hydroelectric Development and Pee Dee River
(Reach 2) showing transects used in the intensive temperature and DO study during August 2004.
4-1
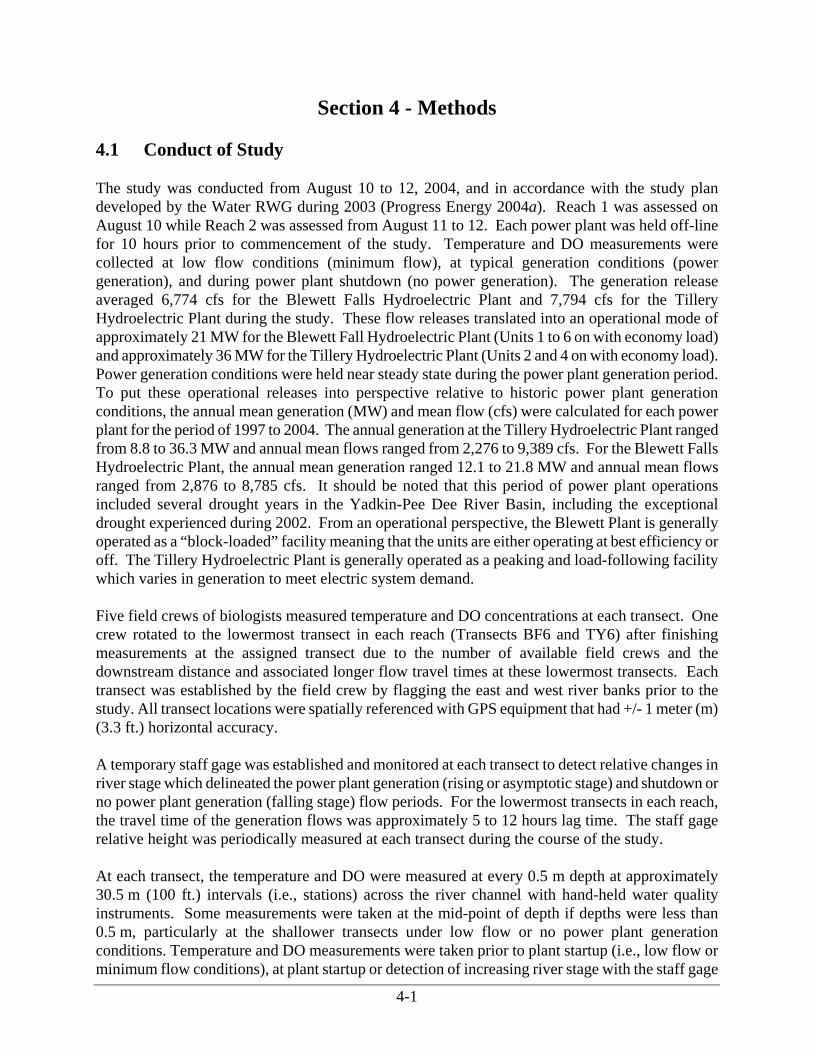
Section 4 - Methods 4.1 Conduct of Study The study was conducted from August 10 to 12, 2004, and in accordance with the study plan developed by the Water RWG during 2003 (Progress Energy 2004a). Reach 1 was assessed on August 10 while Reach 2 was assessed from August 11 to 12. Each power plant was held off-line for 10 hours prior to commencement of the study. Temperature and DO measurements were collected at low flow conditions (minimum flow), at typical generation conditions (power generation), and during power plant shutdown (no power generation). The generation release averaged 6,774 cfs for the Blewett Falls Hydroelectric Plant and 7,794 cfs for the Tillery Hydroelectric Plant during the study. These flow releases translated into an operational mode of approximately 21 MW for the Blewett Fall Hydroelectric Plant (Units 1 to 6 on with economy load) and approximately 36 MW for the Tillery Hydroelectric Plant (Units 2 and 4 on with economy load). Power generation conditions were held near steady state during the power plant generation period. To put these operational releases into perspective relative to historic power plant generation conditions, the annual mean generation (MW) and mean flow (cfs) were calculated for each power plant for the period of 1997 to 2004. The annual generation at the Tillery Hydroelectric Plant ranged from 8.8 to 36.3 MW and annual mean flows ranged from 2,276 to 9,389 cfs. For the Blewett Falls Hydroelectric Plant, the annual mean generation ranged 12.1 to 21.8 MW and annual mean flows ranged from 2,876 to 8,785 cfs. It should be noted that this period of power plant operations included several drought years in the Yadkin-Pee Dee River Basin, including the exceptional drought experienced during 2002. From an operational perspective, the Blewett Plant is generally operated as a “block-loaded” facility meaning that the units are either operating at best efficiency or off. The Tillery Hydroelectric Plant is generally operated as a peaking and load-following facility which varies in generation to meet electric system demand. Five field crews of biologists measured temperature and DO concentrations at each transect. One crew rotated to the lowermost transect in each reach (Transects BF6 and TY6) after finishing measurements at the assigned transect due to the number of available field crews and the downstream distance and associated longer flow travel times at these lowermost transects. Each transect was established by the field crew by flagging the east and west river banks prior to the study. All transect locations were spatially referenced with GPS equipment that had +/- 1 meter (m) (3.3 ft.) horizontal accuracy. A temporary staff gage was established and monitored at each transect to detect relative changes in river stage which delineated the power plant generation (rising or asymptotic stage) and shutdown or no power plant generation (falling stage) flow periods. For the lowermost transects in each reach, the travel time of the generation flows was approximately 5 to 12 hours lag time. The staff gage relative height was periodically measured at each transect during the course of the study. At each transect, the temperature and DO were measured at every 0.5 m depth at approximately 30.5 m (100 ft.) intervals (i.e., stations) across the river channel with hand-held water quality instruments. Some measurements were taken at the mid-point of depth if depths were less than 0.5 m, particularly at the shallower transects under low flow or no power plant generation conditions. Temperature and DO measurements were taken prior to plant startup (i.e., low flow or minimum flow conditions), at plant startup or detection of increasing river stage with the staff gage

Section 4 Methods
4-2
(i.e., power generation), and then at approximate 30-minute intervals for a 4-hour period. A 4-hour period was sufficient to produce steady state flow conditions at each transect and to detect any changes in temperature and DO concentrations. Temperature and DO measurements were also taken at approximate 30-minute intervals for another 4 hours on the declining stage of flow (i.e., no power generation). The only exception was Transect TY6 where measurements were taken over one hour of rising stage and one hour of falling stage. Each discrete set of lateral channel measurements (i.e., bank to bank) at stations located along each transect and flow stage was termed a “run.” The numbers of runs performed at each transect and flow stage varied due to the different channel widths (i.e., number of stations) and depths at each transect. This resulted in unequal sample sizes at each transect. Reservoir temperature and DO vertical profiles were measured at the surface (0.2 m) and 1-m depth intervals to the bottom at each reservoir station. A vertical profile was obtained prior to power plant startup and then after power plant shutdown. These profiles evaluated the relative degree of reservoir stratification and anoxic (i.e., no or very low DO concentrations ≤2 mg/L) conditions present in the hypolimnion in each power plant reservoir before and after power generation. Temperature and DO concentrations were measured with YSI® Model 650, YSI® Model 55, or YSI®
Model 57 instruments. YSI® Models 55 and 650 are digital instruments, and the YSI® Model 57 is an analog instrument. Instruments were calibrated in the laboratory against known standards prior to use and field-calibrated for DO prior to use. Calibration of instruments and field use followed Progress Energy's standard operating field procedures (Progress Energy 2004b). 4.2 Data Reduction and Analysis The complexity of the spatial and temporal dimensions of this study and the dynamic nature of temperature and DO required several different approaches in data reduction to provide meaningful study results. These approaches were utilized to meet the study objectives of evaluating longitudinal and lateral channel differences in the temperature and DO regimes within each study reach. Data were initially reduced by averaging to yield mean values. Ranges (minimum and maximum values) and coefficients of variation (CV) (standard deviation divided by the mean value x 100) were used to describe the relative variation in the data at each transect and flow release period. Finally, frequency analysis (histograms) was used to classify DO values based on the concentrations observed at each transect and flow release period. The observed DO concentrations were evaluated against the North Carolina water quality instantaneous (4.0 mg/L) and daily average (5.0 mg/L) DO standards (NCDWQ 2004b) to determine the percentage of values below the two standards. The South Carolina DO standards of a daily average value not less than 5.0 mg/L with a low value of 4.0 mg/L (SCDHEC 2004) were evaluated for the DO data at the lowermost transect in Reach 2, Transect BF6, which is located in South Carolina waters. The temperature and DO data from each transect were categorized into three discrete analysis periods based on staff gage height and power plant operations. The periods were: (1) low flow conditions (no power plant operations or minimum flow conditions); (2) power generation period (rising or asymptotic river stage); and (3) no power generation (falling river stage). Because depth varied at each transect with each analysis period, the temperature and DO concentrations were averaged over depth to yield average conditions encountered in the water column. For example,

Section 4 Methods
4-3
depth at a specified point along a transect may have been 0.5 m at the low flow condition, gradually increased to 1.5 m with power plant generation, and then decreased to 0.5 m under no power generation. This data reduction approach did result in different sample sizes at each transect under each flow scenario. Inspection of the depth data prior to averaging indicated minimal temperature and DO differences in the water column at a particular station point along each transect. Continuous DO monitor data in Reach 1 (three stations) and Reach 2 (four stations) were also evaluated during the study period to help evaluate longitudinal patterns in DO concentrations during the three flow periods. For Reach 1, the continuous temperature and DO monitors were located at: (1) N.C. Highway 731 Bridge (Station TYCM1); (2) above Rocky River confluence (Station TYCM2); and (3) at N.C. Highway 109 Bridge (Station TYCM3) (Figure 3-1). The continuous monitor at the confluence of Turkey Top Creek (Station TYCM4) was not used in this comparison because the instrument was out-of-service during the intensive study period. For Reach 2, the monitors were located at: (1) power plant tailrace (Station BFCM1); (2) below power plant and dam (Station BFCM1A); (3) U.S. Highway 74 Bridge (Station BFCM2); and (4) below Hitchcock Creek confluence (Station BFCM3) (Figure 3-2). Field instrument measurements made at 0.5 m depth at the transect-station closest to the continuous monitor station location were used in the comparisons. The continuous monitor stations were usually close to the monitored transects during this intensive study. A t-test was used to evaluate whether there were differences in DO concentrations measured with the continuous monitor vs. field instruments used in this study. A Type I error rate of 5 percent (α = 0.05) was used to judge the significance of the t-tests1. Lateral channel differences in temperature and DO concentrations were evaluated using each transect channel cross-section data with the east river bank as the reference point. Additionally, the station measurement points (100-ft intervals) along each transect were trisected into east channel, mid channel, and west channel segments to provide another spatial perspective on the temperature and DO dynamics. If there were an odd number of stations present at a transect, the odd number was lumped into the mid channel section (e.g., 11 stations along a transect with three stations each in east and west channel sections and five stations in the mid channel section). The Tillery Hydroelectric Plant tailrace is located on the east river bank while the Blewett Falls Hydroelectric Plant tailrace is located on the west river bank (Figures 3-1 and 3-2). A repeated measures analysis-of-variance (ANOVA) was used to test for temperature and DO concentration differences for flow release periods and channel segments by transect. The repeated measures ANOVA was blocked on station to account for station-to-station variation, and multiple variable measurements at different depths were treated as individual observations in the model. Because repeated measures were taken for both variables over time (i.e., runs) and such time-dependent variable measurements can show a high error correlation, the repeated measures ANOVA was the appropriate model for testing statistical differences (Maceina et al. 1994; Littell et al. 2002). The least squares means procedure was used to analyze for differences in mean temperature and DO concentrations due to the unequal sample sizes. The least squares means procedure was only
1 Significance used in the text from here forward refers to the probability of an error in the conclusions drawn around
a statistical finding or result. For example, if the difference between the mean score on a test for one group vs. another group was statistically significant at the 0.05 level, it would mean that the probability of error in the judgment that the two groups truly differ in their scores is 5 out of 100.

Section 4 Methods
4-4
employed if the repeated measures ANOVA model was significant. The General Linear Models Procedure of the Statistical Analysis System (SAS Institute, Inc. 1990) was used to perform the statistical tests. A Type I error rate of five percent (α = 0.05) was used to judge the significance of the tests1. 4.3 Quality Assurance and Quality Control All water quality data were collected in accordance with Progress Energy’s Quality Assurance/Quality Control (QA/QC) Program (Progress Energy 2004b, 2004c). In addition, Progress Energy filed a Quality Assurance Project Plan (QAPP) with the NCDWQ (Progress Energy 2004d) regarding its relicensing water quality studies. The QAPP specifies the QA/QC framework that was followed during the conduct of these studies. Progress Energy is certified by the NCDWQ and the South Carolina Department of Health and Environmental Control to collect water quality and biological samples through Standard Operating Procedures. Specific procedures for instrument calibration and water quality sampling are detailed in Progress Energy’s QA/QC Program and the QAPP.

5-1
Section 5 - Results and Discussion 5.1 River Channel Characteristics within Study Reaches Table 5-1 lists the GPS latitude and longitude coordinates, channel widths, and channel depth statistics (mean and range) by flow release period for each transect within each study reach. The mean depths at transects in Reach 1 ranged from 0.3 to 2.0 m during low flow period; from 0.9 to 3.2 m during the power generation period; and from 0.4 to 2.8 m during the no power generation period. Transects TY1, TY2, and TY3 were located in shallow run habitat and Transects TY4, TY5, and TY6 were located in deep run or pool habitat. Correspondingly, Transects TY4, TY5, and TY6 had greater mean depths and maximum depth values during the low flow, power generation, and no power generation periods. For Reach 2, mean depths ranged from 0.4 to 3.8 m during the low flow period; from 1.3 to 4.1 m during the power generation period; and from 0.6 to 3.8 m during the no power generation period. Transects BF1, BF2, and BF4 were located in shallow or deep run habitat and Transects BF3, BF5, and BF6 were located in pool habitat. As observed in Reach 1, the pool transects in Reach 2 had greater mean depths. Flow and depth conditions were changing constantly during the power generation and no power generation periods and; therefore, provided further justification to average the temperature and DO concentrations over depths for the data analyses. 5.2 Reach 1 (Tillery Dam to Turkey Top Creek) 5.2.1 Lake Tillery Temperature and DO Stratification Patterns Lake Tillery was not thermally stratified prior to power generation during the study (Figure 5-1). Water temperatures ranged from 26.8ºC at 18 m to 27.9ºC at the surface prior to power generation. The lake showed a slight temperature stratification between 17 and 18 m after power generation which may have reflected intake of deeper, cooler waters from the submerged river channel within the reservoir. DO depletion in the hypolimnion was present prior to and after power generation during the study. Anoxic conditions (i.e., DO concentrations less than 2 mg/L) were present from 10 to 18 m prior to power generation. There was an upward shift in the anoxic conditions in the water column stratum after the power generation period. The DO concentrations were at or below 2 mg/L from 7 to 18 m (Figure 5 1). The intake tunnel opening extends from 12 to 19 m below the water surface in the lake. 5.2.2 Longitudinal Characteristics of Temperature and DO in Reach 1 Temperature and DO data summaries (i.e., mean, range, sample size, and coefficient of variation) of each transect under low flow, power generation, and no power generation periods are provided in Appendix A (Tables A-1 to A-6). These summaries include longitudinal and lateral channel characteristics of the data. The relative gage height, expressed in centimeters, of the river stage at each monitoring transect in Reach 1 (i.e., Transects TY1 to TY6) is given in Appendix B. The gage height data at each transect provided the basis for demarcating the various operational periods for data analysis (i.e., no flow, power generation, and no power generation periods) relative to the stage of river discharge.

Section 5 Results and Discussions
5-2
Table 5-1 Transect GPS coordinates, channel widths, and channel depth statistics (mean with minimum and maximum values in parenthesis) by flow release period for Reaches 1 and 2 located below the Tillery and Blewett Falls Hydroelectric Plants during the intensive temperature and DO study, August 2004.
Channel Depth (m) Reach/Transect
East Bank (latitude/ longitude)
West Bank (latitude/ longitude)
Channel Width
(m) Low Flow Power Generation
No Power Generation
Reach 1 TY1 35º 12' 21.01"
80º 03' 49.39" 35º 12' 17.13"
80º 04' 03.07" 362 0.3 (0.2-0.5) 1.0 (0.5-1.5) 0.5 (0.5-1.0)
TY2 35º 12' 00.59"
80º 03' 38.24" 35º 11' 58.92"
80º 03' 46.10" 213 0.4 (0.2-0.5) 1.1 (0.5-1.5) 0.4 (0.2-1.0)
TY3 35º 09' 37.28"
80º 03' 32.39" 35º 09' 40.30"
80º 03' 38.38" 176 0.4 (0.2-0.5) 0.9 (0.5-1.5) 0.6 (0.2-1.0)
TY4 35º 06' 45.44"
80º 04' 04.24" 35º 06' 42.68"
80º 04' 06.86" 100 2.0 (0.5-4.0) 3.2 (1.0-5.0) 2.8 (1.5-4.5)
TY5 35º 05' 10.53"
79º 59' 54.83" 35º 05' 05.11"
79º 59' 55.90" 180 1.4 (0.5-2.0) 2.0 (1.0-2.5) 1.8 (1.0-2.5)
TY6 35º 07' 02.90"
79º 57' 04.66" 35º 06' 58.11"
79º 57' 01.83" 160 1.5 (0.5-2.0) 1.8 (1.0-2.5) 1.6 (1.0-2.0)
Reach 2 BF1 34º 59' 11.47"
79º 52' 26.69" 34º 58' 58.36"
79º 52' 29.88" 444 0.4 (0.2-1.0) 1.3 (0.5-2.0) 0.6 (0.2-1.5)
BF2 34º 58' 03.20"
79º 51' 55.70" 34º 58' 04.51"
79º 52' 03.54" 217 1.5 (0.2-3.0) 1.9 (0.5-3.5) 1.8 (0.2-3.5)
BF3 34º 56' 45.90"
79º 52' 10.22" 34º 56' 44.68"
79º 52' 17.42" 183 2.5 (1.0-4.0) 3.0 (1.5-5.0) 2.5 (1.0-4.5)
BF4 34º 53' 49.56"
79º 51' 01.80" 34º 53' 52.78"
79º 51' 07.84" 185 1.3 (0.5-2.5) 2.1 (0.5-4.0) 1.9 (0.5-3.5)
BF5 34º 51' 00.05"
79º 54' 13.32" 34º 51' 01.83"
79º 54' 19.66" 172 3.8 (1.5-5.0) 4.1 (1.5-5.5) 3.8 (1.5-5.5)
BF6 34º 42' 26.74"
79º 52' 28.13" 34º 42' 24.87"
79º 52' 31.19" 92 1.5 (1.0-2.0) 2.0 (1.5-2.5) 1.8 (1.5-2.0)

Section 5 Results and Discussions
5-3
0 .0
1 .0
2 .0
3 .0
4 .0
5 .0
6 .0
7 .0
0.2
2.0
4.0
6.0
8.0
10.0
12.0
14.0
16.0
18.0
D e p th (m e te rs )
Dis
solv
ed o
xyge
n (m
g/L)
2 4 .02 4 .52 5 .02 5 .52 6 .02 6 .52 7 .02 7 .52 8 .02 8 .5
0.2
2.0
4.0
6.0
8.0
10.0
12.0
14.0
16.0
18.0
D e p th (m e te rs )
Tem
pera
ture
(C)
B e fo re P o w e r G e n e ra tio n A fte r P o w e r G e n e ra tio n
T o p o f In ta k e
Figure 5-1 Water temperature and DO profiles at Station B2 in Lake Tillery prior to and after power generation during the intensive temperature and DO study below the Tillery Hydroelectric Plant, August 2004.

Section 5 Results and Discussions
5-4
There were spatial differences in temperature and DO concentrations with increasing distance from Transect TY1 in the Tillery Hydroelectric Plant tailrace to Transect TY6 located at the Turkey Top Creek confluence (Figure 5-2 and Appendix A, Tables A-1 to A-3). These spatial differences were most apparent during the low flow and power generation periods. There was a general increase in water temperatures from Transect TY1 to the lowermost downstream Transect TY6 during low flow (Table A-1). Mean temperatures increased by 2.2ºC from Transect TY1 to TY6 during low flow conditions, and there was an increase in temperatures at the two lowermost transects located below the N.C. Highway 109 Bridge (Table A-1). Longitudinal differences in the temperature regime were observed during the low flow period but the spatial pattern was not as explicit as during the power generation period. The spatial differences in the temperature regime gradually decreased during the power generation period and disappeared by the no power generation period with afternoon solar heating, particularly at the shallower transects located near the power plant (Tables A-2 and A-3). The mean DO concentrations ranged from 3.3 mg/L at Transect TY3 to 5.8 mg/L at Transect TY4 during the low flow period (Figure 5-2 and Table A-1). The mean DO concentrations were below 5.0 mg/L at Transects TY1, TY2, and TY3, which were located at the Tillery Hydroelectric Plant tailrace to 4.5 miles downstream. Mean DO concentrations (5.6 to 5.8 mg/L) were above 5.0 mg/L at Transects TY4 and TY5 located below the Rocky River and Brown Creek confluences, respectively (Figure 5-2 and Table A-1). However, the mean DO concentration at the lowermost transect, Transect TY6, was below 5.0 mg/L during the low flow period. The lateral profile of DO concentrations indicated that DO concentrations declined from the east bank to west bank at Transect TY6 during the low flow period (Figure 5-2 and Table A-4). The observed spatial differences at low flow conditions suggested that tributary input downstream of N.C. Highway 109 may have contributed to the low DO concentrations at Transect TY6 during the low flow period. Another possible factor contributing to low DO concentrations at Transect TY6 may have been residual low DO water from a previous power generation event. Several tributaries enter Reach 1 on the west bank of the river in the vicinity of Transect TY6 and include Brown Creek, Cedar Creek, Turkey Top Creek, and Savannah Creek (Figure 3-1). Of these four tributaries, the confluences of Brown Creek and Cedar Creek are located upstream of Transect TY6. The Turkey Top Creek confluence is located at Transect TY6 and the Savannah Creek confluence is located downstream of the transect. Inflows from Brown Creek, Cedar Creek, and Turkey Top Creek may have contributed to low DO concentrations at Transect TY6 during the low flow period of this study. The NCDWQ (2004a) listed Brown Creek as impaired with low DO as a main contributor to the impairment. The NCDWQ (2002) also noted in the Yadkin-Pee Dee River basinwide assessment report that 28 percent of the DO measurements (n = 54) at its Brown Creek monitoring station were less than the 4 mg/L instantaneous DO standard and 37 percent of the DO measurements were less than 5 mg/L daily average standard. During August 2003, Progress Energy (2005a) measured DO concentrations from 4.3 to 5.1 mg/L at four fishery survey stations in Brown Creek located from U.S. Highway 52 to N.C. State Road 1634 at the Pee Dee National Wildlife Refuge. Progress Energy (2005b) also measured a low DO concentration (1.5 mg/L) in Cedar Creek during a mussel survey of the tributary in August 2004. Progress Energy also evaluated DO concentrations in several tributaries of Reach 1 during a synoptic water quality survey on August 19,

Section 5 Results and Discussions
5-5
2005 (Progress Energy unpublished data). The following tributaries and corresponding instantaneous DO measurements were: (1) Brown Creek - 4.9 mg/L; (2) Cedar Creek - 3.7 mg/L; (3) Turkey Top Creek - 2.9 mg/L; and Savannah Creek - 1.9 mg/L. Any inflow of low DO water from these tributaries would likely influence DO dynamics in this lower segment of Reach 1 (including Transect TY6) the most during low-flow, non-power generation periods in the warm summer months, when the flow contribution from the power plant would be minimal. Frequency analysis of DO concentrations indicated that 50 to 100 percent of the concentrations at Transects TY1-TY3 were less than the North Carolina instantaneous water quality standard (<4.0 mg/L) during the low flow period (Figure 5-3). Additionally, 71 to 100 percent of the DO concentrations were less than 5.0 mg/L during this same period (Figure 5-3). No DO concentrations were less than the instantaneous water quality standard of 4.0 mg/L at Transects TY4 and TY5 and only 6 to 12 percent of the DO concentrations were less than 5.0 mg/L at these same transects. At Transect TY6, 5 percent of the DO concentrations were below the instantaneous water quality standard while all DO concentrations were below 5.0 mg/L. Mean DO concentrations ranged from 2.4 mg/L at Transect TY1 to 5.8 mg/L at Transect TY5 during the power generation period (Figure 5-2 and Table A-2). The mean DO concentrations were less than 5.0 mg/L at Transects TY1, TY2, and TY3 but increased above 5.0 mg/L at transects (5.5 to 5.8 mg/L) located below the Rocky River confluence (Figure 5-2). The mean DO concentrations increased above 5.0 mg/L between 4.5 and 6.0 miles downstream of the power plant during the power generation period. The spatial differences indicated re-aeration occurred with increased distance from the power plant as the flow traveled through a series of shoals and subsequent drops in river channel gradient. For example, the mean DO concentrations increased by 1.8 mg/L from Transect TY1 to TY3. Moreover, there was an additional input of oxygenated water from the Rocky River which helped increase the DO concentrations at transects located below the river confluence. Frequency analysis indicated a large percentage of DO concentrations were less than the North Carolina instantaneous (4.0 mg/L) water quality standard at transects located 0.1 to 4.5 miles from the power plant during the power generation period (Figure 5-4). A corresponding large percentage of DO concentrations were also less than 5.0 mg/L at these same transects. No DO concentrations were less than the instantaneous water quality standard at Transects TY4, TY5, and TY6, while the percentage of DO values less than 5.0 mg/L ranged from < 1 to 26 percent at these same transects (Figure 5-4).

Section 5 Results and Discussions
5-6
0.0
1.0
2.0
3.0
4.0
5.0
6.0
7.0
8.0
100
200
300
400
500
600
700
800
900
1000
1100
1200
Station Distance (Ft)East Bank to We st Bank
Dis
solv
ed o
xyg
en (
mg
/
Low Flow Period
0.0
1.0
2.0
3.0
4.0
5.0
6.0
7.0
8.0
100
200
300
400
500
600
700
800
900
1000
1100
1200
Station Distance (Ft)East Bank to We st Bank
Dis
solv
ed o
xyg
en (
mg
/
Power Generation Period
0.0
1.0
2.0
3.0
4.0
5.0
6.0
7.0
8.0
100
200
300
400
500
600
700
800
900
1000
1100
1200
Station Distance (Ft)East Bank to We st Bank
Dis
solv
ed o
xyg
en (
mg
/
No Power Generation Period
TY1 TY2 TY3TY4 TY5 TY6
0.0
1.0
2.0
3.0
4.0
5.0
6.0
7.0
8.0
100
200
300
400
500
600
700
800
900
1000
1100
1200
Station Distance (Ft)East Bank to We st Bank
Dis
solv
ed o
xyg
en (
mg
/
Low Flow Period
0.0
1.0
2.0
3.0
4.0
5.0
6.0
7.0
8.0
100
200
300
400
500
600
700
800
900
1000
1100
1200
Station Distance (Ft)East Bank to We st Bank
Dis
solv
ed o
xyg
en (
mg
/
Power Generation Period
0.0
1.0
2.0
3.0
4.0
5.0
6.0
7.0
8.0
100
200
300
400
500
600
700
800
900
1000
1100
1200
Station Distance (Ft)East Bank to We st Bank
Dis
solv
ed o
xyg
en (
mg
/
No Power Generation Period
TY1 TY2 TY3TY4 TY5 TY6TY1 TY2 TY3TY4 TY5 TY6
Figure 5-2 Lateral and longitudinal patterns of DO concentrations by transect and flow
release period during the intensive temperature and DO study in Reach 1 of the Pee Dee River below the Tillery Hydroelectric Plant, August 2004.

Section 5 Results and Discussions
5-7
020406080
100
0-2 2-3 3-4 4-5 5-6 6-7 7-8 8-9
020406080
100
0-2 2-3 3-4 4-5 5-6 6-7 7-8 8-9
020406080
100
0-2 2-3 3-4 4-5 5-6 6-7 7-8 8-9
020406080
100
0-2 2-3 3-4 4-5 5-6 6-7 7-8 8-9
020406080
100
0-2 2-3 3-4 4-5 5-6 6-7 7-8 8-9
Transect TY1
Transect TY2
Transect TY3
Transect TY4
Transect TY5
020406080
100
0-2 2-3 3-4 4-5 5-6 6-7 7-8 8-9
Transect TY6
n = 14
n = 9
n = 7
n = 47
n = 51
n = 20
50.0% < 4 mg/L71.4% < 5 mg/L
66.7% < 4 mg/L
100% < 4 mg/L
0% < 4 mg/L
0% < 4 mg/L
5.0% < 4 mg/L
88.9% < 5 mg/L
100% < 5 mg/L
6.4% < 5 mg/L
11.8% < 5 mg/L
100% < 5 mg/L
Dissolved oxygen (mg/L)
Per
cen
t
020406080
100
0-2 2-3 3-4 4-5 5-6 6-7 7-8 8-9
020406080
100
0-2 2-3 3-4 4-5 5-6 6-7 7-8 8-9
020406080
100
0-2 2-3 3-4 4-5 5-6 6-7 7-8 8-9
020406080
100
0-2 2-3 3-4 4-5 5-6 6-7 7-8 8-9
020406080
100
0-2 2-3 3-4 4-5 5-6 6-7 7-8 8-9
Transect TY1
Transect TY2
Transect TY3
Transect TY4
Transect TY5
020406080
100
0-2 2-3 3-4 4-5 5-6 6-7 7-8 8-9
Transect TY6
n = 14
n = 9
n = 7
n = 47
n = 51
n = 20
50.0% < 4 mg/L71.4% < 5 mg/L
66.7% < 4 mg/L
100% < 4 mg/L
0% < 4 mg/L
0% < 4 mg/L
5.0% < 4 mg/L
88.9% < 5 mg/L
100% < 5 mg/L
6.4% < 5 mg/L
11.8% < 5 mg/L
100% < 5 mg/L
Dissolved oxygen (mg/L)
Per
cen
t
Figure 5-3 Frequency of DO concentrations by transect for the low-flow period during
the intensive temperature and DO study in Reach 1 of the Pee Dee River below the Tillery Hydroelectric Plant, August 2004 (Sample size is given for each transect).

Section 5 Results and Discussions
5-8
020406080
100
0-2 2-3 3-4 4-5 5-6 6-7 7-8 8-9
020406080
100
0-2 2-3 3-4 4-5 5-6 6-7 7-8 8-9
020406080
100
0-2 2-3 3-4 4-5 5-6 6-7 7-8 8-9
020406080
100
0-2 2-3 3-4 4-5 5-6 6-7 7-8 8-9
020406080
100
0-2 2-3 3-4 4-5 5-6 6-7 7-8 8-9
Transect TY1
Transect TY2
Transect TY3
Transect TY4
Transect TY5
020406080
100
0-2 2-3 3-4 4-5 5-6 6-7 7-8 8-9
Transect TY6
n = 213
n = 228
n = 98
n = 191
n = 178
n = 67
99.1% < 4 mg/L
100% < 5 mg/L
90.4% < 4 mg/L
38.8% < 4 mg/L
0% < 4 mg/L
0% < 4 mg/L
0% < 4 mg/L
96.9% < 5 mg/L
91.8% < 5 mg/L
25.7% < 5 mg/L
0.6% < 5 mg/L
7.5% < 5 mg/L
Per
cent
Dissolved oxygen (mg/L)
020406080
100
0-2 2-3 3-4 4-5 5-6 6-7 7-8 8-9
020406080
100
0-2 2-3 3-4 4-5 5-6 6-7 7-8 8-9
020406080
100
0-2 2-3 3-4 4-5 5-6 6-7 7-8 8-9
020406080
100
0-2 2-3 3-4 4-5 5-6 6-7 7-8 8-9
020406080
100
0-2 2-3 3-4 4-5 5-6 6-7 7-8 8-9
Transect TY1
Transect TY2
Transect TY3
Transect TY4
Transect TY5
020406080
100
0-2 2-3 3-4 4-5 5-6 6-7 7-8 8-9
Transect TY6
n = 213
n = 228
n = 98
n = 191
n = 178
n = 67
99.1% < 4 mg/L
100% < 5 mg/L
90.4% < 4 mg/L
38.8% < 4 mg/L
0% < 4 mg/L
0% < 4 mg/L
0% < 4 mg/L
96.9% < 5 mg/L
91.8% < 5 mg/L
25.7% < 5 mg/L
0.6% < 5 mg/L
7.5% < 5 mg/L
Per
cent
Dissolved oxygen (mg/L) Figure 5-4 Frequency of DO concentrations by transect for the power generation period
during the intensive temperature and DO study in Reach 1 of the Pee Dee River below the Tillery Hydroelectric Plant, August 2004 (Sample size is given for each transect).

Section 5 Results and Discussions
5-9
Mean DO concentrations generally increased during the no power generation period, especially at the upstream transects, and ranged from 4.4 mg/L at Transect TY1 to 5.8 mg/L at Transect TY4 (Figure 5-2 and Table A-3). The mean DO concentration was only below 5.0 mg/L at Transects TY1 and TY3 during the no power generation period. These transects were located 0.1 and 4.5 miles, respectively, below the power plant. The mean DO concentration was at or above 5.0 mg/L at transects located at 0.5 and from 6.0 to 15.3 miles downstream of the power plant. A similar pattern was observed in the frequency distribution of DO concentrations at the transects during the no generation period (Figure 5-5). The percentage of DO concentrations below the North Carolina instantaneous water quality standard (4.0 mg/L) decreased during the no power generation period when compared to the percentage of concentrations during the power generation scenario (Figures 5-4 and 5-5). This was most evident for Transects TY1, TY2, and TY3 where 8 to 47 percent of the DO concentrations were less than the 4.0 mg/L while 39 to 63 percent of the DO concentrations were less than 5.0 mg/L (Figure 5-5). No DO concentrations were less than 4.0 mg/L at Transects TY4, TY5, and TY6. Approximately 2 to 10 percent of the DO concentrations were below 5.0 mg/L at these same transects. There were significant differences in the mean temperature and DO concentrations for transects and the flow release periods in Reach 1 (Table 5-2). Mean temperatures were significantly (P < 0.0001) lower during the low flow period followed by the power generation and no power generation periods for Transects TY1 through TY4. These statistical differences in mean temperatures were not apparent at the lowermost Transects TY5 and TY6 which may be related to mixing of warmer water from tributary inputs from the Rocky River, Brown Creek, and other smaller tributaries in the lower part of Reach 1. The mean DO concentrations were significantly less during the power generation period at Transects TY1, TY2, and TY4 when compared to mean concentrations during the low flow and no power generation periods. Conversely, the mean DO concentrations were significantly less at Transects TY3 and TY6 during the low flow period compared to mean concentrations during the power generation and no power generation periods. These longitudinal differences may have been related to: (1) algal respiration at Transect TY3; and (2) tributary inflow of low DO water below Brown Creek or the residual effect of prior power plant releases before the 10-hour shutdown period at the lowermost Transect TY6 (see Section 5.2.2). At Transect TY5, the mean DO concentration was significantly lower during the no power generation period compared to the low flow and power generation periods.

Section 5 Results and Discussions
5-10
020406080
100
0-2 2-3 3-4 4-5 5-6 6-7 7-8 8-9
020406080
100
0-2 2-3 3-4 4-5 5-6 6-7 7-8 8-9
020406080
100
0-2 2-3 3-4 4-5 5-6 6-7 7-8 8-9
020406080
100
0-2 2-3 3-4 4-5 5-6 6-7 7-8 8-9
020406080
100
0-2 2-3 3-4 4-5 5-6 6-7 7-8 8-9
Transect TY1
Transect TY2
Transect TY3
Transect TY4
Transect TY5
020406080
100
0-2 2-3 3-4 4-5 5-6 6-7 7-8 8-9
Transect TY6
n = 62
n = 77
n = 76
n = 166
n = 130
n = 65
46.7% < 4 mg/L62.9% < 5 mg/L
16.9% < 4 mg/L38.9% < 5 mg/L
7.9% < 4 mg/L
0% < 4 mg/L
0% < 4 mg/L
0% < 4 mg/L
57.9% < 5 mg/L
1.8% < 5 mg/L
10.0% < 5 mg/L
1.5% < 5 mg/L
Per
cent
Dissolved oxygen (mg/L)
020406080
100
0-2 2-3 3-4 4-5 5-6 6-7 7-8 8-9
020406080
100
0-2 2-3 3-4 4-5 5-6 6-7 7-8 8-9
020406080
100
0-2 2-3 3-4 4-5 5-6 6-7 7-8 8-9
020406080
100
0-2 2-3 3-4 4-5 5-6 6-7 7-8 8-9
020406080
100
0-2 2-3 3-4 4-5 5-6 6-7 7-8 8-9
Transect TY1
Transect TY2
Transect TY3
Transect TY4
Transect TY5
020406080
100
0-2 2-3 3-4 4-5 5-6 6-7 7-8 8-9
Transect TY6
n = 62
n = 77
n = 76
n = 166
n = 130
n = 65
46.7% < 4 mg/L62.9% < 5 mg/L
16.9% < 4 mg/L38.9% < 5 mg/L
7.9% < 4 mg/L
0% < 4 mg/L
0% < 4 mg/L
0% < 4 mg/L
57.9% < 5 mg/L
1.8% < 5 mg/L
10.0% < 5 mg/L
1.5% < 5 mg/L
Per
cent
Dissolved oxygen (mg/L) Figure 5-5 Frequency of DO concentrations by transect for the no power generation
period during the intensive temperature and DO study in Reach 1 of the Pee Dee River below the Tillery Hydroelectric Plant, August 2004 (Sample size is given for each transect).

Section 5 Results and Discussions
5-11
Table 5-2 Results of repeated measures analysis-of-variance for temperature and DO concentrations by transect for flow release periods during the intensive temperature and DO study in Reach 1 of the Pee Dee River below the Tillery Hydroelectric Plant, August 2004.
Flow Release Period Temperature
(ºC) Transect ANOVA F-test Least Squares Means Test1
TY1 < 0.0001 Low Flowa Plant Onb Plant Offc
(25.2) (27.4) (27.9) TY2 < 0.0001 Low Flowa Plant Onb Plant Offc
(25.1) (27.4) (28.0) TY3 < 0.0001 Low Flowa Plant Onb Plant Offc
(24.7) (27.5) (28.1) TY4 < 0.0001 Low Flowa Plant Onb Plant Offc
(25.5) (28.0) (28.2) TY5 < 0.0001 Plant Ona Low Flowb Plant Offc
(27.1) (27.6) (27.7) TY6 < 0.0001 Plant Offa Low Flowa Plant Onb
(27.3) (27.4) (27.8) Dissolved Oxygen
(mg/L) Transect ANOVA F-test Least Squares Means Test TY1 < 0.0001 Plant Ona Low Flowb Plant Offb
(2.4) (4.2) (4.4) TY2 < 0.0001 Plant Ona Low Flowb Plant Offc
(3.3) (4.1) (5.6) TY3 < 0.0001 Low Flowa Plant Onb Plant Offc
(3.3) (4.3) (5.0) TY4 0.002 Plant Ona Low Flowb Plant Offb
(5.5) (5.8) (5.8) TY5 < 0.0001 Plant Offa Low Flowb Plant Onc
(5.2) (5.6) (5.8) TY6 < 0.0001 Low Flowa Plant Onb Plant Offb
(4.5) (5.6) (5.6) 1 Mean values shown in the table are computed using the least squares means method which adjusted means for
unequal sample sizes among the flow release periods. These means may not match arithmetic-calculated means. Statistically significant (P ≤ 0.05) differences among mean values are indicated by different superscript letters.

Section 5 Results and Discussions
5-12
5.2.3 Lateral Channel Characteristics of Temperature and DO in Reach 1 There were lateral channel (east bank to west bank) differences in DO concentrations within the river channel during the low flow, power generation, and no power generation periods, particularly at Transects TY1, TY2, TY3, and TY4 (Figure 5-2 and Table A-4 to A-6). For example, during the low flow period at Transect TY1, the mean DO concentrations differed by 2.5 mg/L from the east to west side of the channel (Figure 5-2 and Table A-4). The DO concentrations were lower on the east side of the channel closest to the power plant tailrace and increased on the west side of the channel. The surface water spilled at the dam tainter gates, which had a greater DO concentration, tended to follow the west side of the channel thereby increasing the DO concentrations on that channel side. There appeared to be mixing of the power plant flow and the dam spillage water at mid channel as DO concentrations were usually intermediate to either channel bank. There may have been enough seepage of low DO hypolimnetic water through the power plant turbine wicket gates to minimize DO concentrations on the east and mid channel sides even during the low-flow period. Another factor that might have influenced DO concentrations on the east side and middle of the channel was algal respiration during the preceding nighttime period. The relative degree of effect of each of these two factors on DO concentrations could not be partitioned out in this study, but it appeared both factors may have influenced DO dynamics in the power plant tailwaters. During the power generation period, the low DO water discharged from the power plant tended to follow the east side of the river channel. This “plume” of low DO water was detected on the east side of the river channel from Transect TY1 to Transect TY4. There appeared to be mixing in the river channel with increased distance downstream from the plant as the lateral differences in DO concentrations were not evident at Transects TY5 and TY6 located below the Rocky River and Brown Creek confluences. The repeated measures ANOVA showed significant channel lateral differences in mean temperature and DO concentrations at monitored transects (Table 5-3). There was no consistent pattern of greater mean temperatures from one side to the other side of the river channel at all transects. Even though there were significant differences in mean temperatures, the differences among mean concentrations were not large.

Section 5 Results and Discussions
5-13
Table 5-3 Results of repeated measures analysis-of-variance for temperature and DO concentrations by transect for channel segment during the intensive temperature and DO study in Reach 1 of the Pee Dee River below the Tillery Hydroelectric Plant, August 20041.
Channel Segment Temperature
(ºC) Transect ANOVA F-test Least Squares Means Test TY1 < 0.0001 Mid Channela East Bankb West Bankc
(26.7) (26.8) (26.9) TY2 < 0.0001 East Banka Mid Channelb West Bankb
(26.6) (26.9) (27.0) TY3 0.03 East Banka West Bankab Mid Channelb
(26.7) (26.8) (26.9) TY4 0.0005 West Banka Mid Channelb East Bankb
(27.1) (27.3) (27.3) TY5 < 0.0001 East Banka West Bankb Mid Channelb
(27.3) (27.5) (27.6) TY6 0.009 Mid Channela East Banka West Bankb
(27.4) (27.5) (27.6) Dissolved Oxygen
(mg/L) Transect ANOVA F-test Least Squares Means Test TY1 < 0.0001 East Banka Mid Channela West Bankb
(3.4) (3.6) (4.0) TY2 < 0.0001 East Banka Mid Channelb West Bankc
(3.8) (4.3) (4.8) TY3 < 0.0001 East Banka Mid Channelb West Bankc
(3.7) (4.1) (4.7) TY4 0.0006 East Banka Mid Channelb West Bankb
(5.6) (5.9) (5.9) TY5 0.15
(not significant) East Bank Mid Channel West Bank
(5.5) (5.5) (5.6) TY6 < 0.0001 West Banka East Bankb Mid Channelc
(5.0) (5.2) (5.5) 1 Repeated measures analysis-of-variance for channel segment was structured to average temperature and DO
concentrations over the three flow release periods (i.e., low flow, power generation, and no power generation) for each transect. Statistically significant (P ≤ 0.05) differences among mean values are indicated by different superscript letters.
The mean DO concentrations did show a consistent channel lateral pattern. Significantly greater mean DO concentrations were observed on the west channel bank when compared to the mid channel or the east channel bank at Transects TY1 through TY4, located 0.1 to 6.0 miles downstream of the Tillery Hydroelectric Plant (Table 5-3). There were no significant channel lateral differences in mean DO concentrations at Transect TY5, located 11.8 miles downstream. For Transect TY6, the opposite pattern was observed from the upper transects with significantly lower mean DO concentration on the west channel bank compared to mid channel and east channel bank. As previously discussed, there appeared to be a tributary inflow source of low DO water above Transect TY6 which was responsible for this reversal in the observed channel lateral pattern.

Section 5 Results and Discussions
5-14
5.2.4 Comparison of Continuous Temperature and DO Monitor and Field Instrument Data in Reach 1
A comparison was made between DO data collected with continuous temperature and DO monitors installed in the vicinity of Transects TY2, TY3, and TY5 and field instruments used during the intensive study (Figure 5-6). The corresponding continuous monitor stations were Stations TYCM1, TYCM2, and TYCM3 (Figure 3-1). The continuous monitor at Station TYCM4 was out-of-service during the intensive study and therefore not used in this comparison. There was generally good agreement in DO measurements between the continuous monitors and field instruments at the transects during the course of the study. The average deviation between the continuous monitors and field instruments was 0.2 mg/L at Transects TY2 and TY5 and 0.7 mg/L at Transect TY3. A t-test indicated no significant differences (P > 0.05) between DO concentrations obtained with the continuous monitors and field instruments at Transects TY2 and TY5 (Figure 5-6). There was a significant difference (P = 0.02) in DO concentrations measured with the continuous monitor (Station TYCM2) and field instrument at Transect TY3 (Figure 5-6). This difference may have been related to several factors: (1) the distance between the location of continuous monitor and the downstream transect location for the intensive study (Figure 3-1); (2) an increase in DO concentrations with algal photosynthesis at Transect TY3 in the mid-morning hours prior to arrival of the power generation flows with lower DO concentrations; (3) the monitor was serviced and calibrated by the field crew after the initial low flow period measurement but prior to arrival of the power generation flow; and (4) the continuous monitor may not have been as responsive to the initial rapid changes in the DO concentrations with arrival of the power generation flow when compared to the field instrument. Although there was a significant difference between the continuous monitor and field instrument at Transect TY3, 8 of the 11 paired observations were in close agreement at Transect TY3. 5.3 Reach 2 (Blewett Falls Dam to Cheraw, South Carolina) 5.3.1 Blewett Falls Lake Temperature and DO Stratification Patterns Blewett Falls Lake was not thermally stratified prior to power generation during the study (Figure 5-7). Water temperatures ranged from 27.4ºC at 9 m to 27.7ºC at the surface prior to power generation. The lake showed a slight stratification between the surface (0.2 m) and 2 m after power generation which reflected solar heating of the upper water column during the study period. Slight DO depletion was present prior to and after power generation during the study. The DO depletion occurred between 5 and 6 m; however, there were no anoxic conditions (i.e., DO concentrations <2 mg/L) present at Station B2 prior to power generation. The lowest DO concentrations ranged from 4.2 to 4.6 mg/L near the lake bottom and most of the lake water column was well-oxygenated and above 5.0 mg/L. The intake tunnel opening extends from 6 to 10 m below the surface of the lake so a large portion of the water entrained through the power plant was

Section 5 Results and Discussions
5-15
0.01.02.03.04.05.06.07.08.09.0
10.0
8:00
9:00
10:00
11:00
12:00
13:00
14:00
15:00
16:00
17:00
18:00
19:00
20:00
21:00
Tim e
Dis
solv
ed O
xyge
n (m
g/L)
Pow er Plant O n
Pow er Plant O n
Pow er Plant O ff
N .C. Highw ay 731 Bridge (Transect TY2 and Station TYCM1)
t-test = not significantP = 0.99
0.01.02.03.04.05.06.07.08.09.0
10.0
8:00
9:00
10:00
11:00
12:00
13:00
14:00
15:00
16:00
17:00
18:00
19:00
20:00
21:00
Tim e
Dis
solv
ed O
xyge
n (m
g/L) Pow er Plant O n Pow er Plant O n
Pow er Plant O ff
Above Rocky River Confluence (Transect TY3 and Station TYCM 2)
t-test = significantP = 0.02
0.01.02.03.04.05.06.07.08.09.0
10.0
8:00
9:00
10:00
11:00
12:00
13:00
14:00
15:00
16:00
17:00
18:00
19:00
20:00
21:00
Tim e
Dis
solv
ed O
xyge
n (m
g/L)
Pow er Plant O n
Pow er Plant OnPow er Plant O ff
N .C. Highw ay 109 Bridge (Transect TY5 and Station TYCM3)
Continuous Monitor Field Instrum ent
t-test = not significantP = 0.20
0.01.02.03.04.05.06.07.08.09.0
10.0
8:00
9:00
10:00
11:00
12:00
13:00
14:00
15:00
16:00
17:00
18:00
19:00
20:00
21:00
Tim e
Dis
solv
ed O
xyge
n (m
g/L)
Pow er Plant O n
Pow er Plant O n
Pow er Plant O ff
N .C. Highw ay 731 Bridge (Transect TY2 and Station TYCM1)
t-test = not significantP = 0.99
0.01.02.03.04.05.06.07.08.09.0
10.0
8:00
9:00
10:00
11:00
12:00
13:00
14:00
15:00
16:00
17:00
18:00
19:00
20:00
21:00
Tim e
Dis
solv
ed O
xyge
n (m
g/L) Pow er Plant O n Pow er Plant O n
Pow er Plant O ff
Above Rocky River Confluence (Transect TY3 and Station TYCM 2)
t-test = significantP = 0.02
0.01.02.03.04.05.06.07.08.09.0
10.0
8:00
9:00
10:00
11:00
12:00
13:00
14:00
15:00
16:00
17:00
18:00
19:00
20:00
21:00
Tim e
Dis
solv
ed O
xyge
n (m
g/L)
Pow er Plant O n
Pow er Plant OnPow er Plant O ff
N .C. Highw ay 109 Bridge (Transect TY5 and Station TYCM3)
Continuous Monitor Field Instrum entContinuous MonitorContinuous Monitor Field Instrum entField Instrum ent
t-test = not significantP = 0.20
Figure 5-6 Comparison of DO concentrations collected by continuous temperature and
DO monitors and field instruments at transects in Reach 1 during the intensive temperature and DO study of the Pee Dee River below the Tillery Hydroelectric Plant, August 2004.

Section 5 Results and Discussions
5-16
0.0
2.0
4.0
6.0
8.0
10.0
12.0
0.2
1.0
2.0
3.0
4.0
5.0
6.0
7.0
8.0
9.0
Depth (meters)
Dis
solv
ed O
xyge
n (m
g/L)
26.5
27.0
27.5
28.0
28.5
29.0
29.5
0.2
1.0
2.0
3.0
4.0
5.0
6.0
7.0
8.0
9.0
Depth (meters)
Tem
pera
ture
(C)
Before Power Generation After Power Generation
Top of Intake
0.0
2.0
4.0
6.0
8.0
10.0
12.0
0.2
1.0
2.0
3.0
4.0
5.0
6.0
7.0
8.0
9.0
Depth (meters)
Dis
solv
ed O
xyge
n (m
g/L)
26.5
27.0
27.5
28.0
28.5
29.0
29.5
0.2
1.0
2.0
3.0
4.0
5.0
6.0
7.0
8.0
9.0
Depth (meters)
Tem
pera
ture
(C)
Before Power Generation After Power Generation
Top of Intake
Figure 5-7 Water temperature and DO profiles at Station B2 in Blewett Falls Lake prior
to and after power generation during the intensive temperature and DO study below the Blewett Falls Hydroelectric Plant, August 2004.

Section 5 Results and Discussions
5-17
4.0 mg/L or greater during the power generation period. There was an increase in DO concentrations throughout the water column, particularly near the lake bottom, after the power generation period. A greater DO concentration in the surface waters after power generation was attributed to the production of oxygen through algal photosynthesis. The lowest DO concentration was 5.1 mg/L at 8 m near the lake bottom. 5.3.2 Longitudinal Characteristics of Temperature and DO in Reach 2 Temperature and DO data summaries (i.e., mean, range, sample size, and coefficient of variation) of each transect under low flow, power generation, and no power generation periods are provided in Appendix A (Tables A-7 to A-12). These summaries include longitudinal and lateral channel characteristics of the data. There were longitudinal differences in temperature and DO concentrations during the low flow period (Figure 5-8 and Table A-7). The mean temperature and DO concentrations increased with distance from Transect BF1 in the Blewett Falls Hydroelectric Plant tailrace to Transect BF6 located at the U.S. Highway 1 Bridge at Cheraw, SC (Figure 5-8 and Table A-7). Spatial differences were not as apparent for temperature and DO concentrations during the power generation and no power generation periods (Figure 5-8 and Tables A-8 and A-9). There was a gradual warming trend from the upstream Transect BF1 to the lowermost downstream Transect BF6 during the low flow and power generation periods (Tables A-7 and A-8). Mean temperatures increased by 1.8º to 2.2ºC from Transect BF1 to Transect BF6 during the low flow and power generation periods. Longitudinal differences in the temperature regime were not apparent during the no power generation period. These differences likely reflected the release of cooler water from the lake (power generation period) and/or the time of measurements due to the lag in travel time of released water at transects located in Reach 2 (i.e., early morning at upstream transects vs. mid-morning, afternoon, or evening for downstream transects). The spatial differences in the temperature regime gradually decreased during the no power generation period with afternoon solar heating, particularly at the shallower transects located near the power plant (Table 5-1 and Table A-9). The mean DO concentrations ranged from 4.0 mg/L at Transect BF3 to 8.0 mg/L at Transect BF6 during the low flow period (Figure 5-8 and Table A-7). The mean DO concentrations were below 5.0 mg/L at Transects BF1, BF2, and BF3, which were located at the Blewett Falls Plant tailrace to 3.6 miles downstream. Mean DO concentrations (7.9 to 8.0 mg/L) were above 5.0 mg/L at Transects BF4, BF5, and BF6 (Figure 5-8 and Table A-7). The low DO concentrations at the upstream transects during low flow conditions may have been caused by algal respiration during the nighttime and early morning hours. This algal respiration may have subsequently lowered DO concentrations; especially at shallower transects, such as Transects BF1 and BF2, during the low-flow period. Furthermore, heavy filamentous algal mats were observed downstream of Hitchcock Creek during the summer months of 2004 which likely influenced DO dynamics in this segment of Reach 2.

Section 5 Results and Discussions
5-18
0.01.02.03.04.05.06.07.08.09.0
10.0
100
200
300
400
500
600
700
800
900
1000
1100
Station Distance (Ft)East Bank to We st Bank
Dis
solv
ed o
xyg
en (
mg
/
Low Flow Period
0.01.02.03.04.05.06.07.08.09.0
10.0
100
200
300
400
500
600
700
800
900
1000
1100
Station Distance (Ft)East Bank to We st Bank
Dis
solv
ed o
xyg
en (
mg
/
Power Generation Period
0.01.02.03.04.05.06.07.08.09.0
10.0
100
200
300
400
500
600
700
800
900
1000
1100
Station Distance (Ft)East Bank to We st Bank
Dis
solv
ed o
xyg
en (
mg
/
No Power Generation Period
BF1 BF2 BF3BF4 BF5 BF6
0.01.02.03.04.05.06.07.08.09.0
10.0
100
200
300
400
500
600
700
800
900
1000
1100
Station Distance (Ft)East Bank to We st Bank
Dis
solv
ed o
xyg
en (
mg
/
Low Flow Period
0.01.02.03.04.05.06.07.08.09.0
10.0
100
200
300
400
500
600
700
800
900
1000
1100
Station Distance (Ft)East Bank to We st Bank
Dis
solv
ed o
xyg
en (
mg
/
Power Generation Period
0.01.02.03.04.05.06.07.08.09.0
10.0
100
200
300
400
500
600
700
800
900
1000
1100
Station Distance (Ft)East Bank to We st Bank
Dis
solv
ed o
xyg
en (
mg
/
No Power Generation Period
BF1 BF2 BF3BF4 BF5 BF6
Figure 5-8 Lateral and longitudinal patterns of DO concentrations by transect and flow scenario during the intensive temperature and DO study in Reach 2 of the Pee Dee River below the Blewett Falls Hydroelectric Plant, August 2004.

Section 5 Results and Discussions
5-19
Frequency analysis of DO concentrations indicated that 8 to 43 percent of the concentrations at Transects BF1 to BF3 were less than the North Carolina instantaneous water quality standard (<4.0 mg/L) and 65 to 100 percent of the concentrations were less than 5 mg/L during the low flow period (Figure 5-9). No DO concentrations were less than the instantaneous water quality standard at Transects BF4 to BF6 during the low flow period. In fact, all DO concentrations were greater than 5.0 mg/L at these transects during the low flow period. These spatial differences indicated there was substantial aeration of water as it flowed through a series of shoals and drops in river channel gradient below Transect BF3. Mean DO concentrations ranged from 5.4 mg/L at Transect BF3 to 8.2 mg/L at Transect BF6 during the power generation period (Figure 5-8 and Table A-8). There was low to moderate variation in all observed DO concentrations as demonstrated by coefficients of variation ranging from 4.6 to 17.0 percent at all transects. The mean DO concentrations at all transects were also above 5.0 mg/L during the power generation period. The lower mean DO concentration at Transect BF3 during the power generation period may have been related to movement of low DO water from upstream areas as the power plant began generating. Other possible contributing factors to the lower DO concentration at Transect BF3 may have been biological or chemical oxygen demand or inflow of low DO water from tributaries. Additionally, this transect was located at the head of a large pool with a pronounced hydraulic control point created by a downstream shoal. This created an impoundment effect at this transect even during the power generation period. As observed during the low flow period, additional aeration occurred below Transect BF3 as the mean DO concentration increased by 1.6 mg/L between Transects BF3 and BF4 (Table A-8). Frequency analysis indicated that DO concentrations less than the North Carolina instantaneous (4.0 mg/L) water quality standard only occurred at Transect BF3 during the power generation period (2 percent of DO concentrations) (Figure 5-10). No DO concentrations were less than the instantaneous water quality standard at Transects BF1 and BF2 and only a small percentage (≤ 5 percent) was less than 5.0 mg/L. Approximately 42 percent of the DO values were less than 5.0 mg/L at Transect BF3. No DO concentrations were less than 5.0 mg/L at Transects BF4, BF5, and BF6 during the power generation period (Figure 5-10). All measured DO concentrations measured at Transect BF6, located in South Carolina waters, were above 5.0 mg/L. Mean DO concentrations generally increased during the no power generation period, particularly at the upstream transects, and ranged from 6.3 mg/L at Transect BF5 to 7.7 mg/L at Transect BF4 (Figure 5-8 and Table A-9). The mean DO concentrations at all transects were above 5.0 mg/L during the no power generation period. Frequency distributions showed that all measured DO concentrations were above 5.0 mg/L at all transects during the no power generation period (Figure 5-11).

Section 5 Results and Discussions
5-20
020406080
100
0-2 2-3 3-4 4-5 5-6 6-7 7-8 8-9 9-10
020406080
100
0-2 2-3 3-4 4-5 5-6 6-7 7-8 8-9 9-10
020406080
100
0-2 2-3 3-4 4-5 5-6 6-7 7-8 8-9 9-10
020406080
100
0-2 2-3 3-4 4-5 5-6 6-7 7-8 8-9 9-10
020406080
100
0-2 2-3 3-4 4-5 5-6 6-7 7-8 8-9 9-10
Transect BF1
Transect BF2
Transect BF3
Transect BF4
Transect BF5
020406080
100
0-2 2-3 3-4 4-5 5-6 6-7 7-8 8-9
Transect BF6
n = 17
n = 53
n = 60
n = 48
n = 60
n = 32
11.8% < 4 mg/L64.7% < 5 mg/L
7.6% < 4 mg/L
43.3% < 4 mg/L
0% < 4 mg/L
0% < 4 mg/L
0% < 4 mg/L
100% < 5 mg/L
100% < 5 mg/L
0% < 5 mg/L
0% < 5 mg/L
0% < 5 mg/L
Per
cen
t
Dissolved oxygen (mg/L)
020406080
100
0-2 2-3 3-4 4-5 5-6 6-7 7-8 8-9 9-10
020406080
100
0-2 2-3 3-4 4-5 5-6 6-7 7-8 8-9 9-10
020406080
100
0-2 2-3 3-4 4-5 5-6 6-7 7-8 8-9 9-10
020406080
100
0-2 2-3 3-4 4-5 5-6 6-7 7-8 8-9 9-10
020406080
100
0-2 2-3 3-4 4-5 5-6 6-7 7-8 8-9 9-10
Transect BF1
Transect BF2
Transect BF3
Transect BF4
Transect BF5
020406080
100
0-2 2-3 3-4 4-5 5-6 6-7 7-8 8-9
Transect BF6
n = 17
n = 53
n = 60
n = 48
n = 60
n = 32
11.8% < 4 mg/L64.7% < 5 mg/L
7.6% < 4 mg/L
43.3% < 4 mg/L
0% < 4 mg/L
0% < 4 mg/L
0% < 4 mg/L
100% < 5 mg/L
100% < 5 mg/L
0% < 5 mg/L
0% < 5 mg/L
0% < 5 mg/L
Per
cen
t
Dissolved oxygen (mg/L) Figure 5-9 Frequency of DO concentrations by transect for the low flow period during
the intensive temperature and DO study in Reach 2 of the Pee Dee River below the Blewett Falls Hydroelectric Plant, August 2004 (Sample size is given for each transect).

Section 5 Results and Discussions
5-21
020406080
100
0-2 2-3 3-4 4-5 5-6 6-7 7-8 8-9 9-10
020406080
100
0-2 2-3 3-4 4-5 5-6 6-7 7-8 8-9 9-10
020406080
100
0-2 2-3 3-4 4-5 5-6 6-7 7-8 8-9 9-10
020406080
100
0-2 2-3 3-4 4-5 5-6 6-7 7-8 8-9 9-10
020406080
100
0-2 2-3 3-4 4-5 5-6 6-7 7-8 8-9 9-10
Transect BF1
Transect BF2
Transect BF3
Transect BF4
Transect BF5
020406080
100
0-2 2-3 3-4 4-5 5-6 6-7 7-8 8-9 9-10
Transect BF6
n = 312
n = 217
n = 173
n = 146
n = 199
n = 166
0% < 4 mg/L
0% < 4 mg/L
0% < 4 mg/L
2.3% < 4 mg/L
0% < 4 mg/L
0% < 4 mg/L
0% < 5 mg/L
1.6% < 5 mg/L
4.6% < 5 mg/L
42.2% < 5 mg/L
0% < 5 mg/L
0% < 5 mg/L
Per
cent
Dissolved oxygen (mg/L)
020406080
100
0-2 2-3 3-4 4-5 5-6 6-7 7-8 8-9 9-10
020406080
100
0-2 2-3 3-4 4-5 5-6 6-7 7-8 8-9 9-10
020406080
100
0-2 2-3 3-4 4-5 5-6 6-7 7-8 8-9 9-10
020406080
100
0-2 2-3 3-4 4-5 5-6 6-7 7-8 8-9 9-10
020406080
100
0-2 2-3 3-4 4-5 5-6 6-7 7-8 8-9 9-10
Transect BF1
Transect BF2
Transect BF3
Transect BF4
Transect BF5
020406080
100
0-2 2-3 3-4 4-5 5-6 6-7 7-8 8-9 9-10
Transect BF6
n = 312
n = 217
n = 173
n = 146
n = 199
n = 166
0% < 4 mg/L
0% < 4 mg/L
0% < 4 mg/L
2.3% < 4 mg/L
0% < 4 mg/L
0% < 4 mg/L
0% < 5 mg/L
1.6% < 5 mg/L
4.6% < 5 mg/L
42.2% < 5 mg/L
0% < 5 mg/L
0% < 5 mg/L
Per
cent
Dissolved oxygen (mg/L) Figure 5-10 Frequency of DO concentrations by transect for the power generation period
during the intensive temperature and DO study in Reach 2 of the Pee Dee River below the Blewett Falls Hydroelectric Plant, August 2004 (Sample size is given for each transect).

Section 5 Results and Discussions
5-22
020406080
100
0-2 2-3 3-4 4-5 5-6 6-7 7-8 8-9 9-10
020406080
100
0-2 2-3 3-4 4-5 5-6 6-7 7-8 8-9 9-10
020406080
100
0-2 2-3 3-4 4-5 5-6 6-7 7-8 8-9 9-10
020406080
100
0-2 2-3 3-4 4-5 5-6 6-7 7-8 8-9 9-10
020406080
100
0-2 2-3 3-4 4-5 5-6 6-7 7-8 8-9 9-10
Transect BF1
Transect BF2
Transect BF3
Transect BF4
Transect BF5
020406080
100
0-2 2-3 3-4 4-5 5-6 6-7 7-8 8-9 9-10
Transect BF6
n = 134
n = 192
n = 153
n = 101
n = 121
n = 32
Per
cent
Dissolved oxygen (mg/L)
0% < 4 mg/L
0% < 4 mg/L
0% < 4 mg/L
0% < 4 mg/L
0% < 4 mg/L
0% < 4 mg/L
0% < 5 mg/L
0% < 5 mg/L
0% < 5 mg/L
0% < 5 mg/L
0% < 5 mg/L
0% < 5 mg/L
020406080
100
0-2 2-3 3-4 4-5 5-6 6-7 7-8 8-9 9-10
020406080
100
0-2 2-3 3-4 4-5 5-6 6-7 7-8 8-9 9-10
020406080
100
0-2 2-3 3-4 4-5 5-6 6-7 7-8 8-9 9-10
020406080
100
0-2 2-3 3-4 4-5 5-6 6-7 7-8 8-9 9-10
020406080
100
0-2 2-3 3-4 4-5 5-6 6-7 7-8 8-9 9-10
Transect BF1
Transect BF2
Transect BF3
Transect BF4
Transect BF5
020406080
100
0-2 2-3 3-4 4-5 5-6 6-7 7-8 8-9 9-10
Transect BF6
n = 134
n = 192
n = 153
n = 101
n = 121
n = 32
Per
cent
Dissolved oxygen (mg/L)
0% < 4 mg/L
0% < 4 mg/L
0% < 4 mg/L
0% < 4 mg/L
0% < 4 mg/L
0% < 4 mg/L
0% < 5 mg/L
0% < 5 mg/L
0% < 5 mg/L
0% < 5 mg/L
0% < 5 mg/L
0% < 5 mg/L
Figure 5-11 Frequency of DO concentrations by transect for the no power generation
period during the intensive temperature and DO study in Reach 2 of the Pee Dee River below the Blewett Falls Hydroelectric Plant, August 2004 (Sample size is given for each transect).

Section 5 Results and Discussions
5-23
There were significant differences in the mean temperature and DO concentrations for transects and the flow release periods in Reach 2 (Table 5-4). Mean temperatures were significantly (P < 0.0001) greater during the no power generation period followed by the power generation and low flow periods at Transects BF1 through BF4. This consistent statistical pattern was not observed at Transects BF5 and BF6 although the mean water temperature was also the lowest during the low flow period at Transect BF6. The mean DO concentrations were significantly less during the low flow period at Transects BF1, BF2, and BF3 when compared to mean concentrations during the power generation and no power generation periods (Table 5-4). Conversely, the mean DO concentrations were significantly greater at Transects BF4 and BF5 during the low flow period compared to mean concentrations in the power generation and no power generation periods. Significantly lower mean DO concentrations at Transects BF4 and BF5 during power generation and no power generation periods may have been related to the movement of residual low DO water from low flow conditions at the upstream stations. At Transect BF6, the mean DO concentrations were significantly greater during the power generation and low flow periods when compared to the mean concentration during the no power generation period. Another factor contributing to lower DO concentrations during the no power generation period may have been algal respiration. The DO measurements at Transects BF5 and BF6 continued well after sunset into the nighttime hours when algal respiration occurred. Although there were statistically significant differences at Transects BF4, BF5, and BF6, all mean DO concentrations were above 5.0 mg/L during all three flow periods. 5.3.3 Lateral Channel Characteristics of Temperature and DO in Reach 2 There was a lateral channel (east bank to west bank) difference in mean DO concentrations during the low flow period at Transect BF1 (Figure 5-8 and Table A-10). The mean DO concentration was greater on the west channel side (power plant tailrace) compared to the mean concentrations at the mid channel and east channel side. Apparently there was enough wicket gate seepage of reservoir water from the power plant to increase DO concentrations on the west channel side. Lower DO concentrations on the east channel side may have been related to DO depletion from algal respiration and little turnover of water on this channel side during the low flow period. As was the case with the Tillery tailwaters, the relative degree of effect of each of these two factors on DO concentrations could not be partitioned out in this study, but it appeared both factors may have influenced DO dynamics in the power plant tailwaters. Lateral channel differences were evident at Transect BF3 during all three flow periods with greater mean DO concentrations on the west channel side and mid channel compared to the east channel side (Figure 5-8 and Tables A-10 to A-12). Lower mean DO concentrations also occurred on the east channel side at Transect BF2 during the power generation and no power generation periods but not during the low flow period. Lateral channel differences in mean DO concentrations were not as evident at other transects located 7.1 to 23.5 miles downstream of the power plant during the three flow periods (Figure 5-8 and Tables A-10 to A-12).

Section 5 Results and Discussions
5-24
Table 5-4 Results of repeated measures analysis-of-variance for temperature and DO concentrations by transect for flow release periods during the intensive temperature and DO study in Reach 2 of the Pee Dee River below the Blewett Falls Hydroelectric Plant, August 2004.
Flow Release Period Temperature (°C)
Transect ANOVA F-test Least Squares Means Test BF1 < 0.0001 Low Flowa Plant Onb Plant Offc
(26.5) (27.6) (29.1) BF2 < 0.0001 Low Flowa Plant Onb Plant Offc
(26.3) (27.8) (28.5) BF3 < 0.0001 Low Flowa Plant Onb Plant Offc
(25.9) (27.2) (28.3) BF4 < 0.0001 Low Flowa Plant Onb Plant Offc
(27.1) (28.0) (28.7) BF5 < 0.0001 Plant Ona Plant Offb Low Flowc
(28.0) (28.1) (28.4) BF6 < 0.0001 Low Flowa Plant Offa Plant Onb
(28.8) (28.8) (29.5) Dissolved Oxygen
(mg/L) Transect ANOVA F-test Least Squares Means Test BF1 < 0.0001 Low Flowa Plant Onb Plant Offc
(4.7) (6.7) (7.2) BF2 < 0.0001 Low Flowa Plant Onb Plant Offc
(4.1) (6.9) (7.4) BF3 < 0.0001 Low Flowa Plant Onb Plant Offc
(4.0) (5.3) (6.4) BF4 < 0.0001 Plant Ona Plant Offb Low Flowb
(7.0) (7.7) (7.9) BF5 < 0.0001 Plant Offa Plant Onb Low Flowc
(6.2) (6.6) (7.8) BF6 < 0.0001 Plant Offa Low Flowb Plant Onc
(7.0) (7.9) (8.1) 1 Mean values shown in the table are computed using the least squares means method which adjusted means for
unequal sample sizes among the flow release periods. These means may not match arithmetic-calculated means. Statistically significant (P ≤ 0.05) differences among mean values are indicated by different superscript letters.

Section 5 Results and Discussions
5-25
Table 5-5 Results of repeated measures analysis-of-variance for temperature and DO concentrations by transect for channel segment during the intensive temperature and DO study in Reach 2 of the Pee Dee River below the Blewett Falls Hydroelectric Plant, August 20041.
Channel Segment Temperature
(°C) Transect ANOVA F-test Least Squares Means Test BF1 < 0.0001 West Banka Mid Channelb East Bankc
(27.5) (27.8) (28.0) BF2 < 0.0001 East Banka Mid Channelb West Bankb
(27.4) (27.6) (27.6) BF3 0.08
(not significant) East Bank Mid Channel West Bank
(27.1) (27.1) (27.2) BF4 < 0.0001 East Banka West Bankb Mid Channelc
(27.7) (28.0) (28.1) BF5 0.008 Mid Channela West Bankb East Bankb
(28.1) (28.2) (28.2) BF6 0.005 East Banka Mid Channela West Bankb
(29.1) (29.1) (28.9) Dissolved Oxygen
(mg/L) Transect ANOVA F-test Least Squares Means Test BF1 0.92
(not significant) East Bank Mid Channel West Bank
(6.2) (6.2) (6.2) BF2 < 0.0001 East Banka West Bankb Mid Channelb
(5.7) (6.3) (6.4) BF3 < 0.0001 East Banka Mid Channelb West Bankb
(5.0) (5.4) (5.4) BF4 0.04 West Banka Mid Channela East Bankb
(7.5) (7.5) (7.7) BF5 < 0.0001 West Banka Mid Channelb East Bankc
(6.6) (6.8) (7.1) BF6 < 0.0001 West Banka East Bankb Mid Channelc
(7.4) (7.6) (7.9) 1 Repeated measures analysis-of-variance for channel segment was structured to average temperature and DO
concentrations over the three flow release periods (i.e., low flow, power generation, and no power generation) for each transect. Statistically significant (P ≤ 0.05) differences among mean values are indicated by different superscript letters.

Section 5 Results and Discussions
5-26
The repeated measures ANOVA showed significant lateral channel differences in mean temperature and DO concentrations at transects when averaged across all flow periods (Table 5-5). However, there was no consistent pattern, with respect to power plant operations, of greater mean temperatures or DO concentrations from one side to the other side of the river channel at any of the transects. 5.3.4 Comparison of Continuous Temperature and DO Monitor and Field Instrument
Data in Reach 2 A comparison was made between DO data collected with continuous temperature and DO monitors installed in the vicinity of Transects BF1, BF2, BF3, and BF4 and field instruments used during the intensive study. The continuous monitors evaluated were at Stations BFCM1, BFCM1A, BFCM2, and BFCM3 (Figure 3-2). There was generally good agreement in DO measurements between the continuous monitors and field instruments at the transects during the course of the study when considering the instrument measurements were made some distance apart and not taken simultaneously in a side-by-side comparison fashion (Figure 5-12). The average deviation between the continuous monitors and field instruments ranged from 0.4 mg/L at Transect BF4 (i.e., continuous monitor at Station BFCM3) to 0.8 mg/L at Transect BF2 (i.e., continuous monitor at Station BFCM1A). A t-test indicated no significant differences (P > 0.05) between DO concentrations between the two instruments at three of the four continuous monitor stations (Stations BFCM1A, BFCM2, and BFCM3). However, there was a significant difference (P = 0.02) between the continuous monitor at Station BFCM1 and the field instrument used at Transect BF1. A comparison plot of the data indicated the field instrument was measuring DO concentrations slightly higher than the continuous monitor. The average deviation was 0.7 mg/L between the two instruments. Even though there was a significant difference, both instruments indicated the same temporal trend in DO concentrations during the three flow periods.

Section 5 Results and Discussions
5-27
0123456789
10
8:00
9:00
10:00
11:00
12:00
13:00
14:00
15:00
16:00
17:00
18:00
19:00
20:00
21:00
T im e
Dis
solv
ed o
xyge
n (m
g/L)
Pow er Plant OnPow er Plant Off
Power Plant Buoy Line (Transect BF1 and Station BFCM1)
t-test = significantP = 0.02
0.01.02.03.04.05.06.07.08.09.0
10.0
8:00
9:00
10:00
11:00
12:00
13:00
14:00
15:00
16:00
17:00
18:00
19:00
20:00
21:00
Tim e
Dis
solv
ed o
xyge
n (m
g/L)
Pow er Plant OnPow er Plant Off
M id Channel Below Blewett Falls Plant (Transect BF2 and Station BFCM1A)
t-test = not significantP = 0.75
0.01.02.03.04.05.06.07.08.09.0
10.0
8:00
9:00
10:00
11:00
12:00
13:00
14:00
15:00
16:00
17:00
18:00
19:00
20:00
21:00
Tim e
Dis
solv
ed o
xyge
n (m
g/L)
Pow er Plant On
Pow er Plant Off
U.S. Highw ay 74 Bridge (Transect BF3 and Station BFCM2)
Continuous Monitor Field Instrum ent
t-test = not significantP = 0.18
0.01.02.03.04.05.06.07.08.09.0
10.0
8:00
9:00
10:00
11:00
12:00
13:00
14:00
15:00
16:00
17:00
18:00
19:00
20:00
21:00
Tim e
Dis
solv
ed o
xyge
n (m
g/L)
Pow er Plant On
Pow er Plant Off
Below Hitchcock Creek Confluence (Transect BF4 and Station BFCM3)
t-test = not significantP = 0.65
0123456789
10
8:00
9:00
10:00
11:00
12:00
13:00
14:00
15:00
16:00
17:00
18:00
19:00
20:00
21:00
T im e
Dis
solv
ed o
xyge
n (m
g/L)
Pow er Plant OnPow er Plant Off
Power Plant Buoy Line (Transect BF1 and Station BFCM1)
t-test = significantP = 0.02
0.01.02.03.04.05.06.07.08.09.0
10.0
8:00
9:00
10:00
11:00
12:00
13:00
14:00
15:00
16:00
17:00
18:00
19:00
20:00
21:00
Tim e
Dis
solv
ed o
xyge
n (m
g/L)
Pow er Plant OnPow er Plant Off
M id Channel Below Blewett Falls Plant (Transect BF2 and Station BFCM1A)
t-test = not significantP = 0.75
0.01.02.03.04.05.06.07.08.09.0
10.0
8:00
9:00
10:00
11:00
12:00
13:00
14:00
15:00
16:00
17:00
18:00
19:00
20:00
21:00
Tim e
Dis
solv
ed o
xyge
n (m
g/L)
Pow er Plant On
Pow er Plant Off
U.S. Highw ay 74 Bridge (Transect BF3 and Station BFCM2)
Continuous Monitor Field Instrum entContinuous MonitorContinuous Monitor Field Instrum entField Instrum ent
t-test = not significantP = 0.18
0.01.02.03.04.05.06.07.08.09.0
10.0
8:00
9:00
10:00
11:00
12:00
13:00
14:00
15:00
16:00
17:00
18:00
19:00
20:00
21:00
Tim e
Dis
solv
ed o
xyge
n (m
g/L)
Pow er Plant On
Pow er Plant Off
Below Hitchcock Creek Confluence (Transect BF4 and Station BFCM3)
t-test = not significantP = 0.65
Figure 5-12 Comparison of DO concentrations collected by continuous temperature and
DO monitors and field instruments at transects in Reach 2 during the intensive temperature and DO study of the Pee Dee River below the Blewett Falls Hydroelectric Plant, August 2004 (Sample size is given for each transect).

6-1
Section 6 - Summary An intensive temperature and DO study was conducted in the Pee Dee River tailwater reaches below the Tillery and Blewett Falls Hydroelectric Plants during August 10 to 12, 2004. The purpose of this study was to assess the spatial and temporal trends in temperature and DO concentrations in the Pee Dee River downstream of the power plants during low flow conditions and typical power plant startup and shutdown operational sequences. Study reaches encompassed the river sections below each hydroelectric plant that have been listed by the NCDWQ as impaired due to low DO concentrations under Section 303(d) of the Clean Water Act. There were longitudinal (upstream to downstream) and lateral (channel bank to channel bank) differences in the DO regime of the Pee Dee River below the Tillery Hydroelectric Plant. The DO concentrations generally increased from the immediate power plant tailrace to the lowermost transect located at the Turkey Top Creek confluence, approximately 15 miles downstream of the power plant. These spatial differences were most apparent during the low flow and power generation periods. The DO concentrations in the Pee Dee River below the Tillery Hydroelectric Plant were below the North Carolina instantaneous and daily average water quality DO standards of 4.0 and 5.0 mg/L, respectively, at transects located from 0.1 to 4.5 miles downstream of the power plant during the low flow and power generation periods. Mean DO concentrations generally increased above 5.0 mg/L at transects located downstream of the Rocky River confluence, approximately 5.0 miles downstream of the power plant. These increased DO concentrations indicated there was re-aeration as the water traveled downstream through a series of shoals and drops in the river channel gradient and that inflow, mainly from the Rocky River, helped to increase DO concentrations. However, the lowermost transect at the Turkey Top Creek confluence had a mean DO concentration less than 5.0 mg/L during the low flow period which suggested that either tributary input or low DO water from a previous power generation event was influencing DO dynamics at this transect. During the no power generation period, mean DO concentrations were above 5.0 mg/L at four of the six monitored transects; the exceptions being the transects located in the immediate tailwaters area and 4.5 miles below the power plant. The North Carolina instantaneous water quality DO standard of 4.0 mg/L was not met at the three transects located above the Rocky River confluence during the no power generation period. No DO concentrations were below the instantaneous standard at transects located below the Rocky River confluence during the no power generation period. There were lateral channel differences in DO concentrations in the Pee Dee River below the Tillery Hydroelectric Plant during the low flow, power generation, and no power generation periods. Generally, the DO concentrations were lower on the east side of the channel closest to the power plant tailrace and increased on the west side of the channel. The surface water spilled at the dam tainter gates, which had a greater DO concentration, tended to follow the west side of the channel thereby increasing the DO concentrations on that channel side. There appeared to be mixing of water released from the power plant and water spilled at the dam at mid channel because DO concentrations were usually intermediate to either channel bank. There may have been enough seepage of low DO hypolimnetic water through the power plant turbines to minimize DO concentrations on the east and mid channel sides even during the low flow period. Another factor that might have influenced DO concentrations on the east side and middle of the channel was algal respiration during the nighttime hours prior to the low flow measurements.

Section 6 Summary
6-2
During the power generation period, the low DO water released from the Tillery Hydroelectric Plant followed the east side of the river channel. This “plume” of low DO water was detected on the east side of the river channel from the transect in the immediate tailwaters to the transect located approximately 6.0 miles downstream of the power plant. There appeared to be further mixing in the river channel with increased distance downstream of the power plant as these lateral differences in DO concentrations were not as pronounced at transects located at 6 to 15 miles downstream of the power plant. Additional inflow and mixing from the Rocky River and other tributaries may have also helped to dissipate this lateral channel gradient in DO concentrations at these downstream transects. One exception to this lateral channel pattern was at the lowermost transect at the Turkey Top Creek confluence where DO concentrations were lower on the west channel side at all three flow scenarios. Tributary inflow of low DO along the west river bank may have contributed to the lateral channel differences in DO concentrations at this transect. There was a general increase in water temperatures from the upstream to lowermost downstream transects in the Pee Dee River below the Tillery Hydroelectric Plant during the low flow period. Longitudinal differences in the temperature regime were observed during the power generation period but the spatial pattern was not as explicit as during the low flow period. The spatial differences in the temperature regime gradually decreased during the power generation period and disappeared by the no power generation period with afternoon solar heating, particularly at the shallower transects located near the power plant. In the Pee Dee River below the Blewett Falls Hydroelectric Plant, longitudinal differences were observed for both temperature and DO concentrations at the low flow period but these differences were not evident during the power generation and no power generation periods. During the low flow period, the DO concentrations were below the North Carolina water quality instantaneous (<4.0 mg/L) and daily average (<5.0 mg/L) DO standards at transects located from 0.2 to 3.6 miles below the power plant. Low DO concentrations at the upstream transects may have been caused by algal respiration during the nighttime and early morning hours. Dissolved oxygen concentrations were above the instantaneous and daily average water quality DO standards at the three lowermost transects located 7.1 to 23.5 miles below the power plant. These spatial differences indicated there was substantial aeration of water as it flowed through a series of shoals and drops in river channel gradient below the U.S. Highway 74 Bridge. Mean DO concentrations were above 5.0 mg/L at all transects during the power generation and no power generation periods. No DO values were less than 4.0 mg/L at transects located from 0.2 to 1.9 miles and from 7.1 to 23.5 miles downstream of the Blewett Falls Hydroelectric Plant during the power generation and no power generation periods. The lowest mean DO concentrations and the greatest percentage of DO values <4.0 mg/L during these flow periods occurred at the transect located 3.6 miles downstream of the plant at the U.S. Highway 74 Bridge. The reason(s) for the lower DO concentrations at this transect was unclear but may have been related to movement of low DO water from upstream areas during power generation, biological or chemical oxygen demand, or inflow of low DO water from tributaries. Additionally, this transect was located at the head of a large pool with a pronounced hydraulic control point located downstream at a shoal. This created an impoundment type of effect at this transect even during the power generation period.

Section 6 Summary
6-3
There was a lateral (east bank to west bank) difference in mean DO concentrations during the low flow period at the transect located closest to the Blewett Falls Hydroelectric Plant. The mean DO concentrations were greater on the west channel side nearest the power plant tailrace compared to the mean concentrations at the mid channel and east channel side. Apparently, there was enough wicket gate seepage of reservoir water from the power plant to increase DO concentrations on the west channel side. Lower DO concentrations on the east channel side may have been related to DO depletion from algal respiration and little turnover of water on this channel side during the low flow period. Lower mean DO values also occurred on the east channel side at Transect BF2 during the power generation and no power generation periods but not during the low flow period. Lateral channel differences were also evident at the transect located 3.6 miles downstream at the U.S. Highway 74 Bridge. There were greater mean DO concentrations on the west channel side and mid channel compared to the east channel side for all three flow periods. Lateral channel differences in mean DO concentrations were not as evident at other transects located from 7.1 to 23.5 miles downstream during the three flow periods. A comparison was made between DO data collected with continuous temperature and DO monitors and field instruments used in the intensive study. This comparison was made by pairing similar continuous monitor stations and intensive study transect-stations in both river reaches below the Tillery and Blewett Falls Hydroelectric Plants. Generally, there was good agreement between the continuous monitors and field instruments during the period of comparison during the intensive study. A t-test of the two data sets indicated few significant differences between the monitors and field instruments and that spatial and temporal trends during the three flow periods were accurately depicted by both types of equipment.

7-1
Section 7 - References Littell, R.C., W.W. Stroup, and R.J. Freund. 2002. SAS® for Linear Models, Fourth Edition. SAS
Institute, Inc. Cary, North Carolina. Maceina, M.J., P.W. Bettoli, and D.R. DeVries. 1994. Use of a split-plot analysis of variance
design for repeated measures fishery data. Fisheries 19(3): 14-20. North Carolina Division of Water Quality. 2002. Basinwide assessment report. Yadkin River
Basin. North Carolina Department of Environment, Health, and Natural Resources, Division of Water Quality, Water Quality Section, Environmental Services Branch, Raleigh, North Carolina. June 2002.
——. 2004a. North Carolina water quality assessment and impaired waters list (2004 integrated
305(b) and 303(d) report). North Carolina Department of Environment and Natural Resources, Division of Water Quality, Raleigh, North Carolina.
——. 2004b. NCDENR-Division of Water Quality “Redbook”. Surface waters and wetlands
standards. NC Administrative Code 15A NCAC 02B.0100, .0200 and .0300. Amended effective: August 1, 2004. North Carolina Department of Environment and Natural Resources, Division of Water Quality, Raleigh, North Carolina.
Progress Energy. 2004a. RWG meeting summary notes, templates, and study plans. Yadkin-Pee
Dee River Project FERC No. 2206. January 2004. Progress Energy. ——. 2004b. Biology Program Procedures Manual (Procedures EVC-TSDC-00058, EVC-TSDC-
00062, and EVC-TSDC-00069). Progress Energy Carolinas, Inc., Raleigh, North Carolina. ——. 2004c. Biology Program Quality Assurance Manual. Progress Energy Carolinas, Inc.,
Raleigh, North Carolina. ——. 2004d. Yadkin-Pee Dee Hydroelectric Project FERC Project No. 2206. Relicensing water
quality studies of the Pee Dee River and Project reservoirs. Quality Assurance Project Plan. December 2004.
——. 2005a. Fisheries survey of the Pee Dee National Wildlife Refuge. Investigations of Brown
Creek and associated tributaries and the Pee Dee River. U.S. Fish and Wildlife Service Challenge Cost-Share Agreement Number 1448-40181-02-G-251. Performed for the U.S. Fish and Wildlife Service, Pee Dee National Wildlife Refuge. Performed by Progress Energy Carolinas, Inc.
——. 2005b. Shallow water fish, crayfish, and mussel surveys of the Pee Dee River and tributaries.
Yadkin-Pee Dee Hydroelectric Project FERC No. 2206. Water Resources Group Issue No. 1: Describe current resident river aquatic resources of project area. Final report. Progress Energy. October 2005.

Section 7 References
7-2
SAS Institute, Inc. 1990. SAS/STAT User’s Guide, Version 6. 4th edition, Volumes 1 and 2. SAS Institute, Inc. Cary, North Carolina.

APPENDICES

APPENDIX A
SUMMARY OF TEMPERATURE AND DO DATA COLLECTED BY
TRANSECT AND FLOW RELEASE PERIOD BELOW THE TILLERY
AND BLEWETT FALLS HYDROELECTRIC PLANTS DURING THE
INTENSIVE TEMPERATURE AND DO STUDY, AUGUST 2004

Appendix A - 1
Table A-1 Temperature (°C) and DO (mg/L) summary statistics by transect for the low flow period (minimum flow) in Reach 1 below the Tillery Hydroelectric Plant during the intensive temperature and DO study, August 20041.
Tillery Hydroelectric Plant (Reach 1-Low Flow Period)
Transect Sample Size Range Mean Coefficient of Variation2
TY1 14 22.0-26.6
2.2-7.2 25.2 4.2
5.7 40.1
TY2 9 24.6-25.8
2.9-5.0 25.0 3.8
1.9 21.4
TY3 7 22.9-25.4
2.6-3.8 24.8 3.3
3.5 13.9
TY4 47 25.2-26.4
4.3-6.7 25.6 5.8
1.1 9.4
TY5 51 27.0-27.9
4.8-6.2 27.6 5.6
0.6 8.8
TY6 20 26.9-28.2
2.4-4.9 27.4 4.4
1.0 11.8
1 Temperatures values are listed on the top and DO values are listed on the bottom of each transect row. 2 Coefficient of variation = (standard deviation ÷ mean) x 100.

Appendix A - 2
Table A-2 Temperature (ºC) and DO (mg/L) summary statistics by transect for the power generation period in Reach 1 below the Tillery Hydroelectric Plant during the intensive temperature and DO study, August 20041.
Tillery Hydroelectric Plant (Reach 1-Power Generation Period)
Transect Sample Size Range Mean Coefficient of Variation2
TY1 213 27.2-27.9
2.0-4.1 27.4 2.4
0.4 12.9
TY2 228 24.5-27.8
2.4-7.0 27.4 3.2
1.8 23.2
TY3 98 26.2-28.1
3.5-6.6 27.5 4.2
1.7 13.7
TY4 191 26.2-28.7
4.7-8.3 28.0 5.6
2.1 16.4
TY5 178 26.4-28.0
4.9-6.5 27.1 5.8
1.9 6.2
TY6 67 27.5-28.0
4.7-6.0 27.8 5.5
0.6 6.3
1 Temperatures values are listed on the top and DO values are listed on the bottom of each transect row. 2 Coefficient of variation = (standard deviation ÷ mean) x 100.

Appendix A - 3
Table A-3 Temperature (ºC) and DO (mg/L) summary statistics by transect for the no power generation period in Reach 1 below the Tillery Hydroelectric Plant during the intensive temperature and DO study, August 20041.
Tillery Hydroelectric Plant-Reach 1 (No Power Generation Period)
Transect Sample Size Range Mean Coefficient of Variation2
TY1 62 26.9-29.2
2.3-7.6 27.9 4.4
1.6 35.6
TY2 77 27.0-29.6
3.0-9.0 27.9 5.5
2.1 26.7
TY3 76 27.6-28.5
3.9-6.4 28.1 4.9
0.8 13.6
TY4 166 27.7-28.5
4.9-6.7 28.3 5.8
0.9 7.6
TY5 130 27.3-28.1
4.3-5.7 27.8 5.2
0.7 4.0
TY6 65 27.1-27.9
4.9-6.0 27.3 5.6
0.9 5.8
1 Temperatures values are listed on the top and DO values are listed on the bottom of each transect row. 2 Coefficient of variation = (standard deviation ÷ mean) x 100.

Appendix A - 4
Table A-4 DO (mg/L) summary statistics (mean, range, sample size, and coefficient of variation) by transect and channel segment for the low flow period (minimum flow) in Reach 1 below the Tillery Hydroelectric Plant during the intensive temperature and DO study, August 20041,2.
Tillery Hydroelectric Plant (Reach 1-Low Flow Period)
Transect East Side Channel Mid Channel West Side Channel TY1 3.5 (2.2-4.8)
n = 5 CV =31.8%
3.3 (2.2-5.7) n = 5
CV = 41.5%
6.0 (4.8-7.2) n = 4
CV = 19.2% TY2 3.3 (2.9-3.8)
n = 6 CV = 9.7%
4.8 (4.6-5.0) n = 3
CV= 4.4%
-- (Dewatered)
TY3 3.1 (2.6-3.5)
n = 2 CV = 20.9%
3.3 (2.9-3.8) n = 3
CV = 14.5%
3.7 (3.5-3.8) n = 2
CV = 5.8% TY4 5.6 (4.3-6.2)
n = 21 CV = 11.2%
6.1 (5.5-6.7) n = 18
CV = 7.2%
5.8 (5.3-6.0) n = 8
CV = 3.9% TY5 5.6 (4.8-6.1)
n = 12 CV = 9.6%
5.7 (4.8-6.2) n = 27
CV = 8.3%
5.5 (4.9-6.1) n = 12
CV = 9.4% TY6 4.7 (4.3-4.9)
n = 6 CV = 4.8%
4.6 (4.4-4.8) n = 5
CV = 3.3%
4.1 (2.4-4.6) n = 9
CV = 16.1% 1 The range (minimum and maximum values) of DO values is given in parenthesis. 2 CV (coefficient of variation) = (standard deviation ÷ mean) x 100.

Appendix A - 5
Table A-5 DO (mg/L) summary statistics (mean, range, sample size, and coefficient of variation) by transect and channel segment for the power generation period in Reach 1 below the Tillery Hydroelectric Plant during the intensive temperature and DO study, August 20041,2.
Tillery Hydroelectric Plant-Reach 1 (Power Generation Period)
Transect East Side Channel Mid Channel West Side Channel TY1 2.3 (2.1-2.5)
n = 73 CV =5.0%
2.3 (2.0-2.6) n = 70
CV = 6.5%
2.7 (2.1-4.1) n = 70
CV = 15.3% TY2 2.9 (2.4-4.3)
n = 87 CV = 14.7%
3.2 (2.6-6.6) n = 75
CV= 19.9%
3.7 (3.0-7.0) n = 66
CV = 25.5% TY3 3.8 (3.5-4.1)
n = 31 CV = 5.1%
4.1 (3.8-4.8) n = 42
CV = 7.1%
4.9 (4.3-6.6) n = 25
CV = 12.9% TY4 5.2 (4.7-8.3)
n = 68 CV = 16.8%
5.6 (4.9-7.9) n = 74
CV = 17.0%
5.9 (5.2-7.3) n = 49
CV = 12.4% TY5 5.7 (5.2-6.1)
n = 45 CV = 4.6%
5.7 (4.9-6.5) n = 86
CV = 7.3%
5.8 (5.2-6.4) n = 47
CV = 5.2% TY6 5.5 (5.0-5.9)
n = 22 CV = 4.5%
5.9 (5.7-6.0) n = 16
CV = 2.1%
5.4 (4.7-5.9) n = 29
CV = 7.3% 1 The range (minimum and maximum values) of DO values is given in parenthesis. 2 CV (coefficient of variation) = (standard deviation ÷ mean) x 100.

Appendix A - 6
Table A-6 DO (mg/L) summary statistics (mean, range, sample size, and coefficient of variation) by transect and channel segment for the no power generation period in Reach 1 below the Tillery Hydroelectric Plant during the intensive temperature and DO study, August 20041,2.
Tillery Hydroelectric Plant (Reach 1-No Power Generation Period)
Transect East Side Channel Mid Channel West Side Channel TY1 3.8 (2.3-6.2)
n = 24 CV =31.8%
4.6 (2.4-7.6) n = 22
CV = 38.4%
4.8 (3.0-6.7) n = 16
CV = 31.8% TY2 4.9 (3.0-6.9)
n = 39 CV = 25.1%
5.9 (3.1-8.3) n = 28
CV= 25.2%
6.5 (4.9-9.0) n = 10
CV = 20.7% TY3 4.4 (3.9-5.7)
n = 23 CV = 12.9%
4.9 (4.0-6.2) n = 34
CV = 13.0%
5.2 (4.7-6.4) n = 19
CV = 10.3% TY4 5.8 (4.9-6.5)
n = 55 CV = 9.0%
6.0 (5.4-6.7) n = 67
CV = 7.0%
5.6 (5.4-5.9) n = 44
CV = 2.2% TY5 5.1 (4.7-5.7)
n = 30 CV = 4.6%
5.2 (4.7-5.5) n = 62
CV = 3.1%
5.3 (4.3-5.7) n = 38
CV = 4.5% TY6 5.6 (5.0-5.9)
n = 23 CV = 3.8%
5.9 (5.6-6.0) n = 15
CV = 2.3%
5.4 (4.9-6.0) n = 27
CV = 6.7% 1 The range (minimum and maximum values) of DO values is given in parenthesis. 2 CV (coefficient of variation) = (standard deviation ÷ mean) x 100.

Appendix A - 7
Table A-7 Temperature (ºC) and DO (mg/L) summary statistics by transect for low flow period (minimum flow) in Reach 2 below the Blewett Falls Hydroelectric Plant during the intensive temperature and DO study, August 20041.
Blewett Falls Hydroelectric Plant (Reach 2-Low Flow Period)
Transect Sample Size Range Mean Coefficient of Variation2
BF1 17 26.1-27.3
2.7-6.1 26.6 4.7
1.4 19.0
BF2 53 25.9-26.8
3.6-4.7 26.3 4.2
0.7 5.0
BF3 60 25.4-26.7
3.0-4.8 25.9 4.0
0.9 9.7
BF4 48 26.1-28.6
6.5-9.9 27.2 7.9
2.5 9.9
BF5 60 27.0-29.2
5.2-9.8 28.4 7.9
2.0 13.8
BF6 32 28.6-28.9
7.5-8.5 28.8 8.0
0.4 3.2
1 Temperatures values are listed on the top and DO values are listed on the bottom of each transect row. 2 Coefficient of variation = (standard deviation ÷ mean) x 100.

Appendix A - 8
Table A-8 Temperature (ºC) and DO (mg/L) summary statistics by transect for the power generation period in Reach 2 below the Blewett Falls Hydroelectric Plant during the intensive temperature and DO study, August 20041.
Blewett Falls Hydroelectric Plant (Reach 2-Power Generation Period)
Transect Sample Size Range Mean Coefficient of Variation2
BF1 312 26.8-29.4
4.6-8.2 27.7 6.7
1.6 10.1
BF2 217 26.1-28.2
4.1-7.8 27.8 6.9
1.6 11.9
BF3 173 26.0-28.0
3.7-6.8 27.2 5.4
2.1 17.0
BF4 146 27.2-29.1
5.9-9.2 28.0 7.0
1.4 12.8
BF5 199 27.2-29.1
5.2-8.0 28.0 6.6
1.4 8.4
BF6 166 28.2-30.0
7.1-8.9 29.5 8.2
1.3 4.6
1 Temperatures values are listed on the top and DO values are listed on the bottom of each transect row. 2 Coefficient of variation = (standard deviation ÷ mean) x 100.

Appendix A - 9
Table A-9 Temperature (ºC) and DO (mg/L) summary statistics by transect for the no power generation period in Reach 2 below the Blewett Falls Hydroelectric Plant during the intensive temperature and DO study, August 20041.
Blewett Falls Hydroelectric Plant (Reach 2-No Power Generation Period)
Transect Sample Size Range Mean Coefficient of Variation2
BF1 134 27.5-31.0
5.0-9.1 29.1 7.2
3.3 13.7
BF2 192 28.2-28.9
6.5-8.1 28.6 7.5
0.8 5.1
BF3 153 27.7-28.9
5.6-7.2 28.3 6.4
0.8 5.5
BF4 101 27.7-29.2
6.5-8.2 28.7 7.7
1.3 4.9
BF5 121 27.5-28.5
5.6-7.4 28.1 6.3
0.4 5.8
BF6 32 28.4-29.3
6.4-7.6 28.8 7.1
0.9 3.6
1 Temperatures values are listed on the top and DO values are listed on the bottom of each transect row. 2 Coefficient of variation = (standard deviation ÷ mean) x 100.

Appendix A - 10
Table A-10 DO (mg/L) summary statistics (mean, range, sample size, and coefficient of variation) by transect and channel segment for the low flow period (minimum flow) in Reach 2 below the Blewett Falls Hydroelectric Plant during the intensive temperature and DO study, August 20041,2.
Blewett Falls Hydroelectric Plant (Reach 2-Low Flow Period)
Transect East Side Channel Mid Channel West Side Channel BF1 4.2 (2.7-5.0)
n = 7 CV =18.6%
4.6 (4.0-5.0) n = 6
CV = 8.2%
6.0 (5.7-6.1) n = 4
CV = 2.9% BF2 4.2 (4.0-4.3)
n = 10 CV = 2.6%
4.3 (4.1-4.6) n = 33
CV= 2.8%
4.1 (3.6-4.7) n = 10
CV = 9.3% BF3 3.8 (3.3-4.5)
n = 18 CV = 9.8%
4.0 (3.7-4.4) n = 18
CV = 5.1%
4.2 (3.0-4.8) n = 24
CV = 10.4% BF4 7.5 (6.6-8.1)
n = 14 CV = 6.0%
7.8 (6.5-9.3) n = 26
CV = 9.4%
8.8 (7.7-9.9) n = 8
CV = 9.4% BF5 8.3 (5.9-9.6)
n = 27 CV = 9.2%
7.8 (5.2-9.8) n = 19
CV = 18.5%
7.1 (6.2-7.8) n = 14
CV = 7.6% BF6 7.9 (7.5-8.2)
n = 6 CV = 3.6%
8.1 (7.6-8.5) n = 18
CV = 2.8%
7.8 (7.6-8.0) n = 8
CV = 2.1% 1 The range (minimum and maximum values) of DO values is given in parenthesis. 2 CV (coefficient of variation) = (standard deviation ÷ mean) x 100.

Appendix A - 11
Table A-11 DO (mg/L) summary statistics (mean, range, sample size, and coefficient of variation) by transect and channel segment for the power generation period in Reach 2 below the Blewett Falls Hydroelectric Plant during the intensive temperature and DO study, August 20041,2.
Blewett Falls Hydroelectric Plant (Reach 2-Power Generation Period)
Transect East Side Channel Mid Channel West Side Channel BF1 6.5 (4.6-8.2)
n = 100 CV =12.8%
6.6 (4.7-8.0) n = 129
CV = 9.1%
7.0 (6.2-7.6) n = 83
CV = 6.0% BF2 6.4 (4.2-7.6)
n = 48 CV = 15.3%
7.1 (5.2-7.8) n = 132
CV= 7.8%
7.1 (4.1-7.8) n = 37
CV = 15.3% BF3 5.1 (3.7-6.2)
n = 49 CV = 13.2%
5.6 (4.1-6.7) n = 51
CV = 17.8%
5.4 (4.0-6.8) n = 73
CV = 17.7% BF4 7.4 (6.4-9.1)
n = 49 CV = 12.2%
6.8 (5.9-9.2) n = 72
CV = 12.8%
6.9 (6.2-8.5) n = 25
CV = 10.6% BF5 6.7 (5.9-7.6)
n = 81 CV = 7.6%
6.6 (5.2-7.4) n = 61
CV = 8.1%
6.4 (5.6-8.0) n = 57
CV = 8.9% BF6 8.0 (7.4-8.4)
n = 39 CV = 3.2%
8.4 (7.6-8.9) n = 85
CV = 3.9%
7.8 (7.1-8.3) n = 42
CV = 3.3% 1 The range (minimum and maximum values) of DO values is given in parenthesis. 2 CV (coefficient of variation) = (standard deviation ÷ mean) x 100.

Appendix A - 12
Table A-12 DO (mg/L) summary statistics (mean, range, sample size, and coefficient of variation) by transect and channel segment for the no power generation period in Reach 2 below the Blewett Falls Hydroelectric Plant during the intensive temperature and DO study, August 20041,2.
Blewett Falls Hydroelectric Plant (Reach 2-No Power Generation Period)
Transect East Side Channel Mid Channel West Side Channel BF1 7.5 (5.4-8.9)
n = 46 CV =14.0%
7.5 (5.8-9.1) n = 52
CV = 11.4%
6.4 (5.0-7.3) n = 36
CV = 9.6% BF2 6.9 (6.5-7.4)
n = 41 CV = 2.7%
7.6 (7.0-8.1) n = 116
CV= 3.6%
7.6 (7.2-7.8) n = 35
CV = 1.7% BF3 6.0 (5.6-6.6)
n = 40 CV = 4.4%
6.5 (6.2-6.8) n = 48
CV = 1.8%
6.6 (5.7-7.2) n = 65
CV = 5.1% BF4 7.8 (6.7-8.2)
n = 32 CV = 5.5%
7.8 (7.5-8.1) n = 53
CV = 1.9%
7.2 (6.5-8.0) n = 16
CV = 6.3% BF5 6.6 (6.0-7.4)
n = 48 CV = 5.1%
6.1 (5.7-6.9) n = 39
CV = 4.1%
6.1 (5.6-6.7) n = 34
CV = 4.8% BF6 7.2 (6.9-7.6)
n = 8 CV = 3.7%
7.1 (6.8-7.5) n = 16
CV = 2.8%
6.9 (6.4-7.4) n = 8
CV = 4.6% 1 The range (minimum and maximum values) of DO values is given in parenthesis. 2 CV (coefficient of variation) = (standard deviation ÷ mean) x 100.

APPENDIX B
RELATIVE GAGE HEIGHT (CM) OF RIVER STAGE AT MONITORING
STATIONS BELOW THE TILLERY AND BLEWETT FALLS
HYDROELECTRIC PLANTS DURING THE INTENSIVE
TEMPERATURE AND DO STUDY, AUGUST 2004

0.000.200.400.600.801.001.20
0700 0800 0900 1000 1100 1200 1300 1400 1500 1600
Hour
Rel
ativ
e G
age
Hei
ght (
cm) Transect TY1
0.000.200.400.600.801.001.20
0700 0800 0900 1000 1100 1200 1300 1400 1500 1600
Hour
Rel
ativ
e G
age
Hei
ght (
cm) Transect TY2
0.000.200.400.600.801.001.201.40
0800 0900 1000 1100 1200 1300 1400 1500 1600 1700 1800 1900
Hour
Rel
ativ
e G
age
Hei
ght (
cm) Transect TY3
0.00
0.20
0.40
0.60
0.80
1.00
0900 1000 1100 1200 1300 1400 1500 1600 1700 1800 1900 2000 2100
Hour
Rel
ativ
e G
age
Hei
ght (
cm) Transect TY4
0.000.200.400.600.801.001.20
1100 1200 1300 1400 1500 1600 1700 1800 1900 2000 2100
Hour
Rel
ativ
e G
age
Hei
ght (
cm) Transect TY5
0.000.100.200.300.400.500.60
1200 1300 1400 1500 1600 1700 1800 1900 2000 2100 2200
Hour
Rel
ativ
e G
age
Hei
ght (
cm) Transect TY6
0.000.200.400.600.801.001.20
0700 0800 0900 1000 1100 1200 1300 1400 1500 1600
Hour
Rel
ativ
e G
age
Hei
ght (
cm) Transect TY1
0.000.200.400.600.801.001.20
0700 0800 0900 1000 1100 1200 1300 1400 1500 1600
Hour
Rel
ativ
e G
age
Hei
ght (
cm) Transect TY2
0.000.200.400.600.801.001.201.40
0800 0900 1000 1100 1200 1300 1400 1500 1600 1700 1800 1900
Hour
Rel
ativ
e G
age
Hei
ght (
cm) Transect TY3
0.00
0.20
0.40
0.60
0.80
1.00
0900 1000 1100 1200 1300 1400 1500 1600 1700 1800 1900 2000 2100
Hour
Rel
ativ
e G
age
Hei
ght (
cm) Transect TY4
0.000.200.400.600.801.001.20
1100 1200 1300 1400 1500 1600 1700 1800 1900 2000 2100
Hour
Rel
ativ
e G
age
Hei
ght (
cm) Transect TY5
0.000.100.200.300.400.500.60
1200 1300 1400 1500 1600 1700 1800 1900 2000 2100 2200
Hour
Rel
ativ
e G
age
Hei
ght (
cm) Transect TY6
Figure B-1 Relative gage height (cm) of river stage at monitoring transects located in
Reach 1 of the Pee Dee River below the Tillery Hydroelectric Plant during the intensive temperature and dissolved oxygen study, August 2004.
Appendix B - 1

0.000.200.400.600.801.001.201.40
0700 0800 0900 1000 1100 1200 1300 1400 1500 1600 1700
Hour
Rel
ativ
e G
age
Hei
ght (
cm) Transect BF1
0.000.200.400.600.801.001.20
0800 0900 1000 1100 1200 1300 1400 1500 1600 1700
Hour
Rel
ativ
e G
age
Hei
ght (
cm) Transect BF2
0.00
0.20
0.40
0.60
0.80
1.00
0800 0900 1000 1100 1200 1300 1400 1500 1600 1700 1800
Hour
Rel
ativ
e G
age
Hei
ght (
cm) Transect BF3
0.000.200.400.600.801.001.20
1000 1100 1200 1300 1400 1500 1600 1700 1800 1900 2000
Hour
Rel
ativ
e G
age
Hei
ght (
cm) Transect BF4
0.00
0.20
0.40
0.60
0.80
1300 1400 1500 1600 1700 1800 1900 2000 2100 2000 2200
Hour
Rel
ativ
e G
age
Hei
ght (
cm) Transect BF5
0.00
0.20
0.40
0.60
0.80
1.00
1700 1800 1900 2000 2100 2200 2300 2400 0100 0200
Hour
Rel
ativ
e G
age
Hei
ght (
cm) Transect BF6
Figure B-2 Relative gage height (mm) of river stage at monitoring transects located in
Reach 2 of the Pee Dee River below the Blewett Falls Hydroelectric Plant during the intensive temperature and dissolved oxygen study, August 2004.
Appendix B - 2


![Dissolved Oxygen [DO]](https://static.fdocuments.net/doc/165x107/5a6721977f8b9ab12b8b464b/dissolved-oxygen-do.jpg)