Wenatchee River Basin Dissolved Oxygen, pH, and Phosphorus ... · Wenatchee River Basin Dissolved...
151
Wenatchee River Basin Dissolved Oxygen, pH, and Phosphorus Total Maximum Daily Load Study April 2006 Publication No. 06-03-018 printed on recycled paper
Transcript of Wenatchee River Basin Dissolved Oxygen, pH, and Phosphorus ... · Wenatchee River Basin Dissolved...
Wenatchee River Basin
Dissolved Oxygen, pH, and Phosphorus Total Maximum Daily Load Study
April 2006
Publication No. 06-03-018 printed on recycled paper

Publication Information
This data summary report is available on the Department of Ecology home page on the World Wide Web at www.ecy.wa.gov/biblio/0603018.html Data for this project are available at Ecology’s Environmental Information Management (EIM) website www.ecy.wa.gov/eim/index.htm. Search User Study ID, WENRTMDL. Ecology’s Project Code is 02-063-01-02. For more information contact: Publications Coordinator Environmental Assessment Program P.O. Box 47600 Olympia, WA 98504-7600 E-mail: [email protected]: (360) 407-6764
Any use of product or firm names in this publication is for descriptive purposes only and does not imply endorsement by the author or the Department of Ecology. If you need this publication in an alternate format, call Joan LeTourneau at (360) 407-6764. Persons with hearing loss can call 711 for Washington Relay Service. Persons with a speech disability can call 877-833-6341.
Wenatchee River Basin
Dissolved Oxygen, pH, and Phosphorus Total Maximum Daily Load Study
by Jim Carroll, Sarah O’Neal, and Steven Golding
Watershed Ecology Section Environmental Assessment Program
Washington State Department of Ecology Olympia, Washington 98504-7710
April 2006
Waterbody Numbers:
WA-45-1010, WA-45-1017, WA-45-1020

This page is purposely left blank
Table of Contents
Page List of Appendices .............................................................................................................. ii List of Figures .................................................................................................................... iii List of Tables .......................................................................................................................v Abstract ............................................................................................................................. vii Acknowledgements.......................................................................................................... viii Executive Summary ........................................................................................................... ix Introduction..........................................................................................................................1 Background..........................................................................................................................4
Study Area .....................................................................................................................4 Project Objectives ..........................................................................................................4
Methods................................................................................................................................6 Study Design..................................................................................................................6 Data Quality Objectives and Analytical Procedures......................................................8 Sample Collection and Field Measurements..................................................................9
Data Quality Results ..........................................................................................................17 Quality Assurance Objectives......................................................................................17 Sample Quality Assurance...........................................................................................17 Field Measurement Quality Assurance........................................................................23 Conclusion ...................................................................................................................25
Wenatchee River TMDL Data ...........................................................................................26 Dissolved Oxygen, pH, and Phosphorus TMDL ...............................................................27
Water Quality Concerns for Fisheries..........................................................................28 Applicable Criteria.......................................................................................................28 Seasonal Variation .......................................................................................................30 Wenatchee River and Icicle Creek 2002-03 Data Results ...........................................36 Sources of Phosphorus and Biochemical Oxygen Demand (BOD).............................46
Water Quality Modeling ....................................................................................................48 QUAL2K Model Structure and Approach...................................................................48 QUAL2K Model Calibration .......................................................................................49
Assimilative Load Capacity for Phosphorus......................................................................71 Wenatchee River..........................................................................................................71 Icicle Creek ..................................................................................................................76
Margin of Safety ................................................................................................................80 Conclusions........................................................................................................................81 Recommendations..............................................................................................................83 Adaptive Management Process..........................................................................................84 References..........................................................................................................................85
Page i

List of Appendices
A. Publicly-Owned Treatment Works, Permit Limits and Background
B. 2002-3 Sampling of Publicly-Owned Treatment Works, Summary of Field Notes and Influences of Sampling on BOD Results
C. Data Results for Publicly-Owned Treatment Works
D. Wenatchee River and Icicle Creek QUAL2K Model Calibration Coefficients and Reach Characteristics
E. Groundwater Statistics by Designated Subbasin
Page ii
List of Figures Page
ES-1. Study area map........................................................................................................ ix
ES-2. Dissolved oxygen levels in Class AA water on August 26, 2002 ............................x
ES-3. pH levels in Class A water on August 28-29, 2002..................................................x
ES-4. Orthophosphate concentrations in the lower Wenatchee River................................x
1. Study area for the Wenatchee River TMDL study. ........................................................3
2. Upper mainstem Wenatchee River sampling stations for the 2002-03 TMDL study...10
3. Lower mainstem Wenatchee River sampling stations for the 2002-03 TMDL study. .12
4. Icicle Creek sampling stations for the 2002-03 TMDL study. .....................................14
5. Box plot summary of monthly instantaneous pH measurements from Ecology ambient stations on the Wenatchee River at the mouth and above Tumwater Canyon from 1994 to 2004...........................................................................................31
6. Monthly average flows at USGS gaging stations in the Wenatchee River watershed. .....................................................................................................................32
7. Box plot summary of monthly instantaneous dissolved oxygen measurements from Ecology ambient stations on the Wenatchee River at the mouth and above Tumwater Canyon from 1994 to 2004. ........................................................................34
8. Box plot summary of monthly instantaneous dissolved oxygen deficit measurements, relative to saturation, from Ecology ambient stations on the Wenatchee River at the mouth and above Tumwater Canyon from 1994 to 2004. .....35
9. Continuous dissolved oxygen, pH, and temperature data from the Wenatchee River at the Tumwater Canyon Highway 2 bridge for August 25-26, 2002. ...............37
10. Continuous dissolved oxygen, pH, and temperature data from one mile upstream from the mouth of the Wenatchee River for August 28-30, 2002. .............................39
11. Map of mouth of the Wenatchee River showing the island at RM 0.5 with side channel on the left bank and main channel on the right bank.....................................41
12. Diel data collected with a data logger at the mouth of the Wenatchee River on August 27-28, 2002.....................................................................................................42
13. Diel data collected with a data logger in the main channel of the mouth of the Wenatchee River from October 2-16, 2004................................................................43
14. Nitrogen:phosphorus ratios for the Wenatchee River by river mile for each monthly survey............................................................................................................44
15. Orthophosphate concentrations for the monthly surveys by river mile, from Lake Wenatchee to just above the mouth. ..................................................................45
Page iii

List of Figures (cont) Page
16. Nitrate-nitrite concentrations for the monthly surveys by river mile, from Lake Wenatchee to just above the mouth. ..................................................................45
17. QUAL2K simulated flow and USGS flow for July to October flow balances; Wenatchee River, 2002...............................................................................................51
18. QUAL2K simulated flow and measured flow for August and September water balance; Icicle Creek, 2002.........................................................................................52
19. QUAL2K simulated travel time and measured travel time on the Wenatchee River for September 2002.....................................................................................................53
20. Comparison of QUAL2K simulated daily average water temperature and daily maximum and minimum water temperatures to observed water temperature data collected during synoptic surveys in 2002 and 2003 ..................................................57
21. Comparison of QUAL2K simulated chloride and conductivity concentrations to observed chloride and conductivity concentrations when diffuse (groundwater) fluxes of chloride and conductivity are not represented in the model ........................58
22. Comparison of QUAL2K simulated chloride concentrations to observed chloride concentrations in the Wenatchee River for July to October 2002 monthly surveys...59
23. Comparison of QUAL2K simulated conductivity to observed conductivity measurements in the Wenatchee River for July to October 2002 monthly surveys. ..60
24. Comparison of QUAL2K simulated periphyton biomass to observed end-of- season biomass maxima in the Wenatchee River .......................................................61
25. Comparison of QUAL2K simulated inorganic-P and nitrate-nitrite-N concentrations to observed inorganic-P and nitrate-nitrite-N concentrations in the Wenatchee River for the August and September 2002 synoptic surveys. ............64
26. Comparison of QUAL2K simulated daily maximum and daily minimum dissolved oxygen and pH to observed dissolved oxygen and pH in the Wenatchee River for the August and September 2002 synoptic surveys ...................65
27. Comparison of QUAL2K simulated water temperature and conductivity to observed water temperature and conductivity in Icicle Creek for the August and September 2002 synoptic surveys...............................................................................68
28. Comparison of QUAL2K simulated dissolved inorganic-P and nitrate-nitrite-N to observed dissolved inorganic-P and nitrate-nitrite-N in Icicle Creek for the August and September 2002 synoptic surveys. ..........................................................69
29. Comparison of QUAL2K simulated daily minimum and maximum dissolved oxygen and pH to observed daily minimum and maximum dissolved oxygen and pH in Icicle Creek for the August and September 2002 surveys. ........................70
Page iv

List of Tables Page
ES-1. Critical-condition dissolved phosphorus loads and assimilative capacity in the lower Wenatchee River..................................................................................... xi
ES-2. Critical-condition dissolved phosphorus loads and assimilative capacity load in lower Icicle Creek................................................................................................... xi
1. Stream reaches on the 1998 303(d) List for Impaired Waterbodies ...............................2
2. Samples dates for years 1 and 2......................................................................................6
3. Summary of field measurements and methods ...............................................................6
4. Summary of laboratory measurements and methods ......................................................7
5. Targets for accuracy, precision, bias, and reporting limits for the sample measurement...................................................................................................................8
6. Upper mainstem Wenatchee River sample site identification, description, and location .........................................................................................................................11
7. Lower mainstem Wenatchee River sample site, identification, description, and location .........................................................................................................................13
8. Icicle Creek sample site identification, description, and location ................................15
9. Lab precision results .....................................................................................................18
10. Total precision (field + lab) results.............................................................................19
11. Pooled analytical bias results by parameter. ...............................................................20
12. Field-blank results.......................................................................................................22
13. Accuracy results compared to target accuracy objectives. .........................................23
14. Ecology’s Freshwater Monitoring Unit stations used in the Wenatchee TMDL study and the project station equivalent. .....................................................................26
15. Streams on the 2004 303(d) list of impaired waterbodies for dissolved oxygen and pH water quality standard violations in the Wenatchee basin..............................27
16. Instantaneous dissolved oxygen excursions below the water quality criterion of 9.5 mg/L in the Class AA reaches of the Wenatchee River, Icicle Creek, and their tributaries. ...........................................................................................................38
17. Summary of Class A stations showing dissolved oxygen and/or pH water quality criteria excursions in data-logger, time-series profiles. ..............................................40
18. Instantaneous pH and dissolved oxygen water quality criteria excursions from 2002-03 sampling in the Class A waters of the Wenatchee River basin.....................40
19. Overall performance of Wenatchee River model calibrations using root mean square error and coefficient of variation in comparison to overall observed field replicate relative standard deviations ..........................................................................55
Page v
List of Tables (cont.) Page
20. Inorganic-P loads in the lower Wenatchee River in September 2002 ........................63
21. Overall performance of Icicle Creek model calibrations using root mean square error and coefficient of variation in comparison to overall observed field relative standard deviations......................................................................................................66
22. Critical-condition loads and assimilative capacity for inorganic-P in the lower Wenatchee River during critical low-flow conditions and current POTW effluent discharge.. ...................................................................................................................73
23. Critical-condition inorganic-P loads for the POTWs in the lower Wenatchee River at design flow and capacity POTW effluent discharge...............................................74
24. Critical-condition loads and assimilative capacity for inorganic-P in the lower Icicle Creek during critical low-flow conditions. .......................................................78
Page vi
Abstract As part of the Wenatchee River Total Maximum Daily Load (TMDL) study, the Washington State Department of Ecology conducted a water quality monitoring and modeling study during 2002-2004. This document summarizes the quality assurance of the data, and reports findings of the monitoring and modeling. Dissolved oxygen concentrations in the upper Wenatchee River and Icicle Creek (Class AA reaches) are likely to be lower than the 9.5 mg/L criterion during the summer due to the high land elevations and high water temperature. Implementation of the Wenatchee River temperature TMDL will improve dissolved oxygen in the tributaries. Reserve load capacities for biochemical oxygen demand (BOD) and nutrients to maintain water quality standards are recommended for the Class AA reaches of the Wenatchee River and Icicle Creek. Observed data and model simulations showed that dissolved oxygen and pH exceedances in the lower Wenatchee River and Icicle Creek (Class A reaches) were caused by periphyton (attached algae) growth. Phosphorus is the most limiting nutrient that controls periphyton growth and biomass. Loading sources and assimilative capacities for inorganic phosphorus were determined for the Wenatchee River and Icicle Creek by using the QUAL2K water quality model. Modeling of critical conditions in the lower Wenatchee River and Icicle Creek showed assimilative capacities of 7.7 kg/day and 0.65 kg/day of inorganic phosphorus, respectively, representing 80% and 55% reductions from current loading conditions, respectively. The model also showed that assimilative capacities for the lower Wenatchee River and Icicle Creek can be represented by instream maximum inorganic phosphorus concentrations of 3.1 ug/L and 4.4 ug/L, respectively.
Page vii
Acknowledgements
The Wenatchee River basin TMDL study included a partnership between the Department of Ecology and the Water Resource Inventory Area (WRIA) 45 Water Quality Technical Subcommittee (consisting of Ecology TMDL staff and the WRIA 45 Watershed Planning Unit’s Water Quality Subcommittee). Ecology authored this TMDL technical report for dissolved oxygen, pH, and phosphorus, and the Water Quality Technical Subcommittee reviewed, discussed, and commented on the report. The authors of this report would like to thank the following people for their contributions to this study:
• The WRIA 45 Water Quality Technical Subcommittee for review and comments.
• Staff with the Chelan County Conservation District for help with collecting and compiling data: Michael Rickel, Scott Wolf, Sarah Walker, and Kurt Hosman.
• Staff with the Washington State Department of Ecology
o Manchester Environmental Laboratory for transport of samples and data analysis: Will White, Pam Covey, Nancy Jensen, Lorisa McLean, Dean Momohara, Sara Sekerak, Connie Davies, and Debi Case.
o Melanie Kimsey and Kirk Sinclair for groundwater sampling, analysis, and statistics.
o Sarah Coffler, Aspen Madrone, Kim Gridley, Dustin Bilhimer, Carolyn Lee, and Rachael Erickson for help with collecting and compiling data.
o Greg Pelletier and Nicoleta Cristea for assistance with water quality modeling.
o Karol Erickson and Greg Pelletier for review of the draft report.
o Joan LeTourneau for formatting and editing the final report.
Page viii

Page ix
Executive Summary
Introduction The Wenatchee River and Icicle Creek are included on Washington State’s list of water-quality-impaired waters because of low dissolved oxygen (DO) and high pH. As part of the Wenatchee River basin Total Maximum Daily Load (TMDL) study for DO and pH, the Washington State Department of Ecology (Ecology) collected stream water quality data during 2002-2003 for the Wenatchee River and Icicle Creek. Wenatchee River Basin The Wenatchee River Basin is located in the central part of Washington State (Figure ES-1). The Wenatchee River originates at the outflow from Lake Wenatchee, drains an area of about 1371 square miles, and flows southeast until it meets the Columbia River at the city of Wenatchee. Annual average precipitation throughout the subbasin ranges from 150 inches at the crest of the Cascade Mountains to 8.5 inches in the city of Wenatchee. The Wenatchee River and Icicle Creek are Class AA waters just above the city of Leavenworth, and Class A below (for water quality standards classifications). The cities of Leavenworth, Peshastin, and Cashmere have public-owned treatment works that discharge treated wastewater to the lower Wenatchee River year-round. Stream water quality assessment • Three synoptic surveys were conducted on
the Wenatchee River and Icicle Creek during the dry months of 2002 (July, August, and September), and one synoptic survey was conducted in April 2003. During each
synoptic survey, data were collected from numerous sites within a short time period (1-2 days).
• In general, DO levels below (not in compliance with) the Class AA 9.5 mg/L criterion were observed throughout the Class AA (upper) reaches of the Wenatchee River and Icicle Creek. Also, pH levels above the Class A 8.5 criterion were observed throughout the Class A (lower) reaches of the Wenatchee River and Icicle Creek during the dry low-flow season of 2002 and near the mouth of the Wenatchee River in April 2003.
Figure ES-1. Study area map for the Wenatchee River basin DO, pH, and phosphorus TMDL
Page x
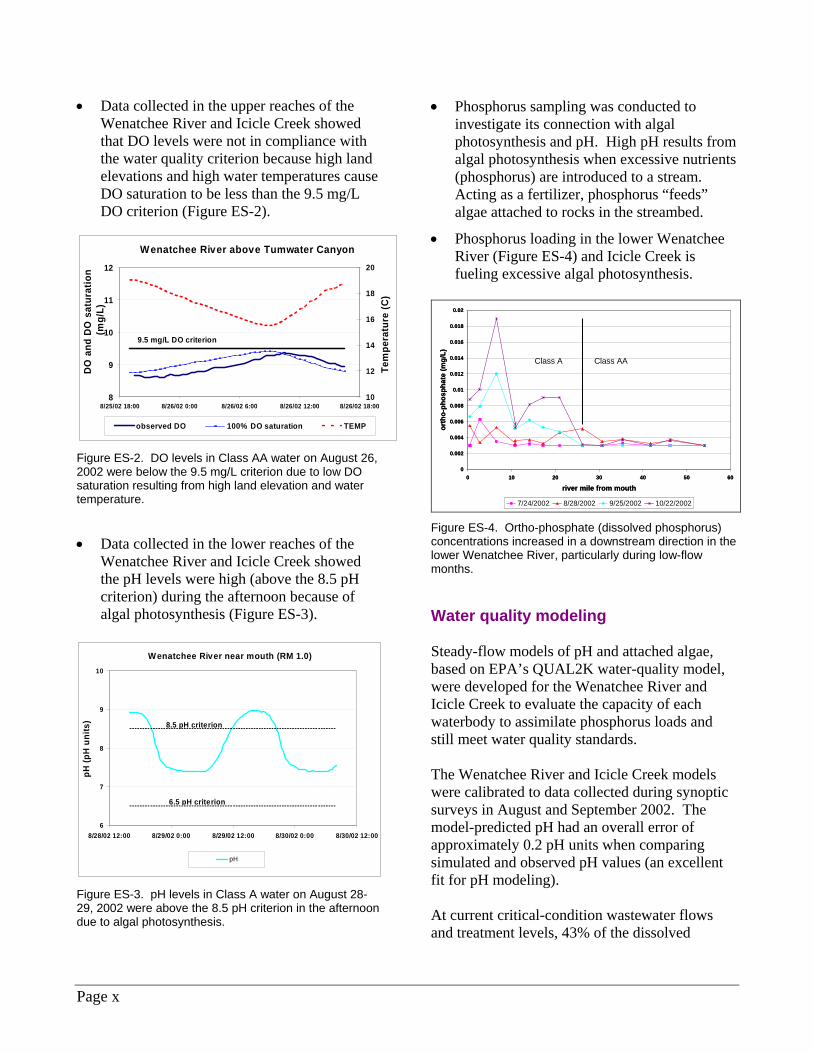
• Data collected in the upper reaches of the Wenatchee River and Icicle Creek showed that DO levels were not in compliance with the water quality criterion because high land elevations and high water temperatures cause DO saturation to be less than the 9.5 mg/L DO criterion (Figure ES-2).
Wenatchee River above Tumwater Canyon
8
9
10
11
12
8/25/02 18:00 8/26/02 0:00 8/26/02 6:00 8/26/02 12:00 8/26/02 18:00
DO
and
DO
sat
urat
ion
(mg/
L)
10
12
14
16
18
20
Tem
pera
ture
(C)
observed DO 100% DO saturation TEMP
9.5 mg/L DO criterion
Figure ES-2. DO levels in Class AA water on August 26, 2002 were below the 9.5 mg/L criterion due to low DO saturation resulting from high land elevation and water temperature.
• Data collected in the lower reaches of the
Wenatchee River and Icicle Creek showed the pH levels were high (above the 8.5 pH criterion) during the afternoon because of algal photosynthesis (Figure ES-3).
Wenatchee River near mouth (RM 1.0)
6
7
8
9
10
8/28/02 12:00 8/29/02 0:00 8/29/02 12:00 8/30/02 0:00 8/30/02 12:00
pH (p
H u
nits
)
pH
6.5 pH criterion
8.5 pH criterion
Figure ES-3. pH levels in Class A water on August 28-29, 2002 were above the 8.5 pH criterion in the afternoon due to algal photosynthesis.
• Phosphorus sampling was conducted to investigate its connection with algal photosynthesis and pH. High pH results from algal photosynthesis when excessive nutrients (phosphorus) are introduced to a stream. Acting as a fertilizer, phosphorus “feeds” algae attached to rocks in the streambed.
• Phosphorus loading in the lower Wenatchee River (Figure ES-4) and Icicle Creek is fueling excessive algal photosynthesis.
0
0.002
0.004
0.006
0.008
0.01
0.012
0.014
0.016
0.018
0.02
0 10 20 30 40 50 60
river mile from mouth
orth
o-ph
osph
ate
(mg/
L)
7/24/2002 8/28/2002 9/25/2002 10/22/2002
Class AAClass A
0
0.002
0.004
0.006
0.008
0.01
0.012
0.014
0.016
0.018
0.02
0 10 20 30 40 50 60
river mile from mouth
orth
o-ph
osph
ate
(mg/
L)
7/24/2002 8/28/2002 9/25/2002 10/22/2002
Class AAClass A
Figure ES-4. Ortho-phosphate (dissolved phosphorus) concentrations increased in a downstream direction in the lower Wenatchee River, particularly during low-flow months. Water quality modeling Steady-flow models of pH and attached algae, based on EPA’s QUAL2K water-quality model, were developed for the Wenatchee River and Icicle Creek to evaluate the capacity of each waterbody to assimilate phosphorus loads and still meet water quality standards. The Wenatchee River and Icicle Creek models were calibrated to data collected during synoptic surveys in August and September 2002. The model-predicted pH had an overall error of approximately 0.2 pH units when comparing simulated and observed pH values (an excellent fit for pH modeling). At current critical-condition wastewater flows and treatment levels, 43% of the dissolved
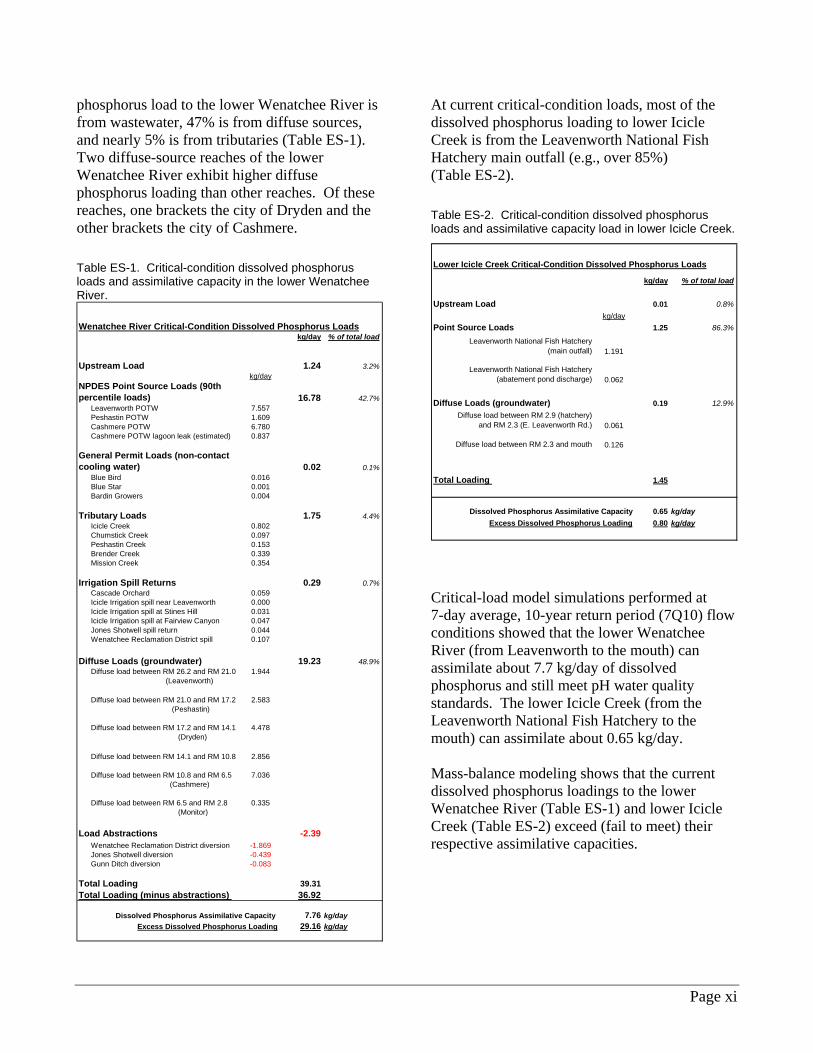
Page xi
phosphorus load to the lower Wenatchee River is from wastewater, 47% is from diffuse sources, and nearly 5% is from tributaries (Table ES-1). Two diffuse-source reaches of the lower Wenatchee River exhibit higher diffuse phosphorus loading than other reaches. Of these reaches, one brackets the city of Dryden and the other brackets the city of Cashmere. Table ES-1. Critical-condition dissolved phosphorus loads and assimilative capacity in the lower Wenatchee River.
Wenatchee River Critical-Condition Dissolved Phosphorus Loads% of total load
Upstream Load 1.24 3.2%kg/day
NPDES Point Source Loads (90th percentile loads) 16.78 42.7% Leavenworth POTW 7.557 Peshastin POTW 1.609 Cashmere POTW 6.780 Cashmere POTW lagoon leak (estimated) 0.837
General Permit Loads (non-contact cooling water) 0.02 0.1% Blue Bird 0.016 Blue Star 0.001 Bardin Growers 0.004
Tributary Loads 1.75 4.4% Icicle Creek 0.802 Chumstick Creek 0.097 Peshastin Creek 0.153 Brender Creek 0.339 Mission Creek 0.354
Irrigation Spill Returns 0.29 0.7% Cascade Orchard 0.059 Icicle Irrigation spill near Leavenworth 0.000 Icicle Irrigation spill at Stines Hill 0.031 Icicle Irrigation spill at Fairview Canyon 0.047 Jones Shotwell spill return 0.044 Wenatchee Reclamation District spill 0.107
Diffuse Loads (groundwater) 19.23 48.9% Diffuse load between RM 26.2 and RM 21.0 1.944 (Leavenworth)
Diffuse load between RM 21.0 and RM 17.2 2.583 (Peshastin)
Diffuse load between RM 17.2 and RM 14.1 4.478 (Dryden)
Diffuse load between RM 14.1 and RM 10.8 2.856
Diffuse load between RM 10.8 and RM 6.5 7.036 (Cashmere)
Diffuse load between RM 6.5 and RM 2.8 0.335 (Monitor)
Load Abstractions -2.39 Wenatchee Reclamation District diversion -1.869 Jones Shotwell diversion -0.439 Gunn Ditch diversion -0.083
Total Loading 39.31Total Loading (minus abstractions) 36.92
Dissolved Phosphorus Assimilative Capacity 7.76 kg/dayExcess Dissolved Phosphorus Loading 29.16 kg/day
kg/day
At current critical-condition loads, most of the dissolved phosphorus loading to lower Icicle Creek is from the Leavenworth National Fish Hatchery main outfall (e.g., over 85%) (Table ES-2). Table ES-2. Critical-condition dissolved phosphorus loads and assimilative capacity load in lower Icicle Creek.
% of total load
Upstream Load 0.01 0.8%kg/day
Point Source Loads 1.25 86.3%
Leavenworth National Fish Hatchery (main outfall) 1.191
Leavenworth National Fish Hatchery (abatement pond discharge) 0.062
Diffuse Loads (groundwater) 0.19 12.9% Diffuse load between RM 2.9 (hatchery)
and RM 2.3 (E. Leavenworth Rd.) 0.061
Diffuse load between RM 2.3 and mouth 0.126
Total Loading 1.45
Dissolved Phosphorus Assimilative Capacity 0.65 kg/dayExcess Dissolved Phosphorus Loading 0.80 kg/day
Lower Icicle Creek Critical-Condition Dissolved Phosphorus Loads
kg/day
Critical-load model simulations performed at 7-day average, 10-year return period (7Q10) flow conditions showed that the lower Wenatchee River (from Leavenworth to the mouth) can assimilate about 7.7 kg/day of dissolved phosphorus and still meet pH water quality standards. The lower Icicle Creek (from the Leavenworth National Fish Hatchery to the mouth) can assimilate about 0.65 kg/day. Mass-balance modeling shows that the current dissolved phosphorus loadings to the lower Wenatchee River (Table ES-1) and lower Icicle Creek (Table ES-2) exceed (fail to meet) their respective assimilative capacities.
Page xii
Conclusions • The Wenatchee River and Icicle Creek are
very sensitive to the addition of nutrients. Although inorganic phosphorus levels are relatively low (less than 20 ug/L) compared to other Washington State streams, they are currently too high in the lower reaches to comply with the pH water quality standards.
• Large reductions of phosphorus are needed from both point and nonpoint sources in the lower Wenatchee River and Icicle Creek.
• The Wenatchee River Basin Temperature TMDL recommendations to improve water temperatures will improve minimum DO in the Class AA tributaries and reaches of the Wenatchee River and Icicle Creek.
• To maintain water quality standards in the upper Wenatchee River and Icicle Creek, reserve load capacities for biological oxygen demand (BOD) and nutrients are recommended.

Introduction The Wenatchee River and Icicle Creek were included on Washington State’s 1998 list of impaired waters because of dissolved oxygen (DO) and pH water quality standard violations (Table 1). This list, called the 303(d) list because it is required by section 303(d) of the federal Clean Water Act, contains waterbodies that are not meeting water quality standards. The Clean Water Act mandates that Washington State establish Total Maximum Daily Loads (TMDLs) for surface waters that do not meet standards after application of technology-based pollution controls. The U.S. Environmental Protection Agency (EPA) and the Washington State Department of Ecology (Ecology) have promulgated regulations (40 CFR 130) and developed guidance (EPA, 1991, 1997, 1999; Ecology, 1991, 1996, 1999) for establishing TMDLs. Under the Clean Water Act, every state has its own water quality standards designed to protect, restore, and preserve water quality. Water quality standards consist of designated uses, such as fish spawning and drinking water supply, and criteria, usually numeric criteria, to achieve those uses. When a lake, river, or stream fails to meet water quality standards after application of required technology-based controls, the Clean Water Act requires the state to place the waterbody on a list of "impaired" waterbodies and to prepare an analysis called a TMDL. The goal of a TMDL is to ensure the impaired water will attain water quality standards. A TMDL includes a written, quantitative assessment of water quality problems and the pollutant sources that cause the problem. The TMDL determines the amount of a given pollutant that can be discharged to the waterbody and still meet standards (the loading capacity) and allocates that load among the various sources. If the pollutant comes from a discrete (point) source such as a municipal or industrial facility’s discharge pipe, that facility’s share of the loading capacity is called a wasteload allocation. If it comes from a set of diffuse (nonpoint) sources such as general urban, residential, or farm runoff, the cumulative share is called a load allocation. The TMDL must also consider seasonal variations and include a margin of safety that takes into account any lack of knowledge about the causes of the water quality problem or its loading capacity. A reserve capacity for future loads from growth pressures is sometimes included as well. The sum of the wasteload and load allocations, the margin of safety, and any reserve capacity must be equal to or less than the loading capacity. Consequently, in June 2002, Ecology began water quality monitoring as part of a TMDL technical study of DO and pH in the Wenatchee River watershed. The monitoring focused on the mainstem Wenatchee River and Icicle Creek. The study area is in the Wenatchee River watershed (Figure 1).
Page 1
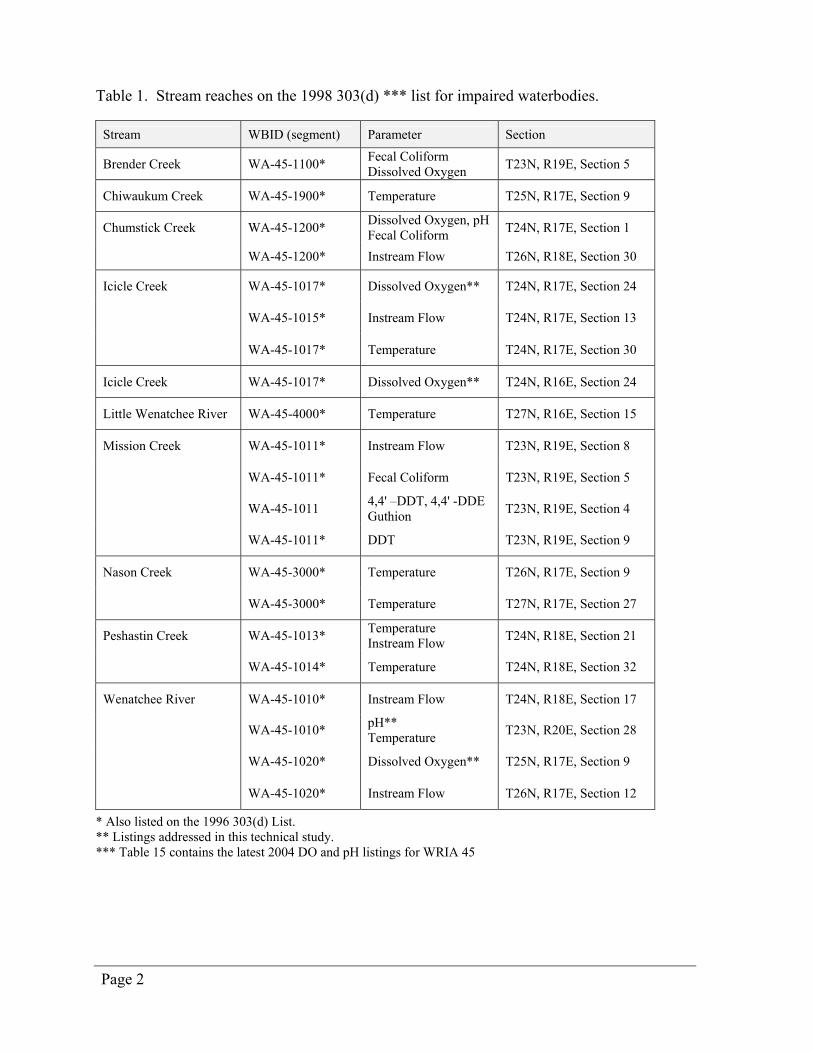
Table 1. Stream reaches on the 1998 303(d) *** list for impaired waterbodies.
Stream WBID (segment) Parameter Section
Brender Creek WA-45-1100* Fecal Coliform Dissolved Oxygen T23N, R19E, Section 5
Chiwaukum Creek WA-45-1900* Temperature T25N, R17E, Section 9
Chumstick Creek WA-45-1200* Dissolved Oxygen, pH Fecal Coliform T24N, R17E, Section 1
WA-45-1200* Instream Flow T26N, R18E, Section 30
Icicle Creek WA-45-1017* Dissolved Oxygen** T24N, R17E, Section 24
WA-45-1015* Instream Flow T24N, R17E, Section 13
WA-45-1017* Temperature T24N, R17E, Section 30
Icicle Creek WA-45-1017* Dissolved Oxygen** T24N, R16E, Section 24
Little Wenatchee River WA-45-4000* Temperature T27N, R16E, Section 15
Mission Creek WA-45-1011* Instream Flow T23N, R19E, Section 8
WA-45-1011* Fecal Coliform T23N, R19E, Section 5
WA-45-1011 4,4' –DDT, 4,4' -DDE Guthion T23N, R19E, Section 4
WA-45-1011* DDT T23N, R19E, Section 9
Nason Creek WA-45-3000* Temperature T26N, R17E, Section 9
WA-45-3000* Temperature T27N, R17E, Section 27
Peshastin Creek WA-45-1013* Temperature Instream Flow T24N, R18E, Section 21
WA-45-1014* Temperature T24N, R18E, Section 32
Wenatchee River WA-45-1010* Instream Flow T24N, R18E, Section 17
WA-45-1010* pH** Temperature T23N, R20E, Section 28
WA-45-1020* Dissolved Oxygen** T25N, R17E, Section 9
WA-45-1020* Instream Flow T26N, R17E, Section 12
* Also listed on the 1996 303(d) List. ** Listings addressed in this technical study. *** Table 15 contains the latest 2004 DO and pH listings for WRIA 45
Page 2

tu2
tu97
Wenatchee
Leavenworth
Cashmere
Wenatchee R.
Little Wenatchee R.
White R.
Icicle Cre ek
Chiwaukum Creek
Nason Creek
Chum
stick Creek
Mission C
reek
Peshastin Creek
!(
!(
!(
0 9 184.5 Miles
±
Figure 1. Study area for the Wenatchee River TMDL study.
Page 3

Background
Study Area The Wenatchee River subbasin (WRIA 45) encompasses 878,423 acres and is located in the central part of Washington State. The subbasin is bounded on the west by the Cascade Mountians, on the north and east by the Entiat Mountains, and on the south by the Wenatchee Mountains. The Wenatchee is a subbasin to the Columbia River basin and enters that system at the city of Wenatchee 15 miles upstream of the Rock Island Dam. The geology of the upper subbasin consists of high and low relief landtypes associated with glaciation (e.g. cirque headwalls, glaciated ridges, and glacial/fluvial outwash). The middle part of the subbasin is a mixture of igneous and basalt rock formations and glacial/fluvial outwash terraces. Alluvial fans and terraces are predominant landtypes in the lower Wenatchee. Annual average precipitation throughout the subbasin ranges from 150 inches at the crest of the Cascades to 8.5 inches in the city of Wenatchee. Streamflow varies during the year, but the mean monthly discharge peaks in the spring from the combined effects of snowmelt and rain-on-snow events. Most of the annual streamflow in the Wenatchee River originates from tributaries in the upper subbasin: the White River (25%), Icicle Creek (20%), Nason Creek (18%), Chiwawa River (15%), and the Little Wenatchee River (15%) (Andonaegui, 2001). Both the White and Little Wenatchee rivers enter Lake Wenatchee in the upper subbasin; the mouth of the lake is the head of the Wenatchee River, and Nason Creek enters the river just below the lake outlet. There is a mixture of federal, state, county, and private land ownership throughout the subbasin. Most of the upper subbasin is designated federal wilderness area and is under the jurisdiction of the U.S. Forest Service Lake Wenatchee and Leavenworth Ranger Districts. State Highways 2 and 97 parallel much of the Wenatchee mainstem and Nason Creek, and contain portions of their streambanks. The incorporated cities designated in the 2000 census are Wenatchee (population 27,856), Cashmere (population 2,965), and Leavenworth (population 2,074). There are smaller unincorporated towns and communities located along State Highways 2 and 97 (2000 census information).
Project Objectives The objectives of the study were to: 1. Conduct water quality monitoring surveys for physical, chemical, and biological parameters
to determine sources affecting dissolved oxygen and pH levels in the Wenatchee River, Icicle Creek, and their tributaries.
Page 4

2. Assess or model productivity in streams using data from all parameters collected during the surveys.
3. Set dissolved oxygen and pH TMDL targets, nonpoint load allocations, and point source wasteload allocations for parameters responsible for causing dissolved oxygen and pH exceedances1 in the Wenatchee River and Icicle Creek.
1 Levels not meeting Washington State standards
Page 5
Methods
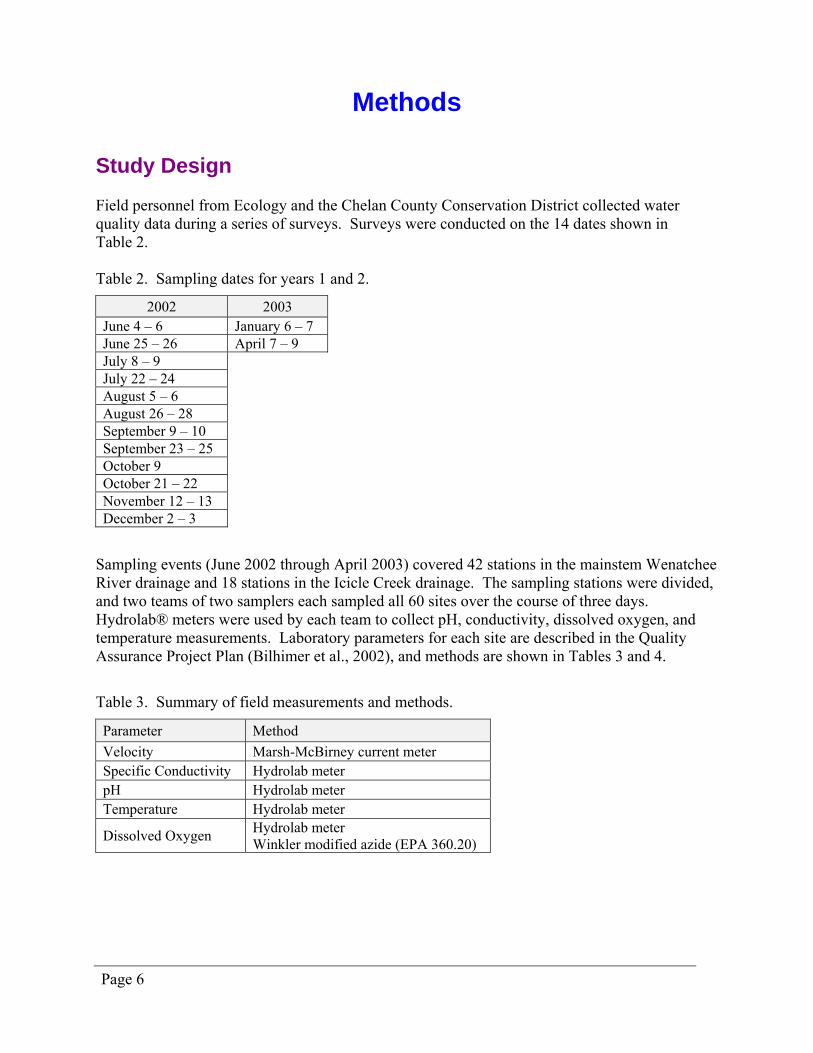
Study Design Field personnel from Ecology and the Chelan County Conservation District collected water quality data during a series of surveys. Surveys were conducted on the 14 dates shown in Table 2. Table 2. Sampling dates for years 1 and 2.
2002 2003 June 4 – 6 January 6 – 7 June 25 – 26 April 7 – 9 July 8 – 9 July 22 – 24 August 5 – 6 August 26 – 28 September 9 – 10 September 23 – 25 October 9 October 21 – 22 November 12 – 13 December 2 – 3
Sampling events (June 2002 through April 2003) covered 42 stations in the mainstem Wenatchee River drainage and 18 stations in the Icicle Creek drainage. The sampling stations were divided, and two teams of two samplers each sampled all 60 sites over the course of three days. Hydrolab® meters were used by each team to collect pH, conductivity, dissolved oxygen, and temperature measurements. Laboratory parameters for each site are described in the Quality Assurance Project Plan (Bilhimer et al., 2002), and methods are shown in Tables 3 and 4. Table 3. Summary of field measurements and methods.
Parameter Method Velocity Marsh-McBirney current meter Specific Conductivity Hydrolab meter pH Hydrolab meter Temperature Hydrolab meter
Dissolved Oxygen Hydrolab meter Winkler modified azide (EPA 360.20)
Page 6
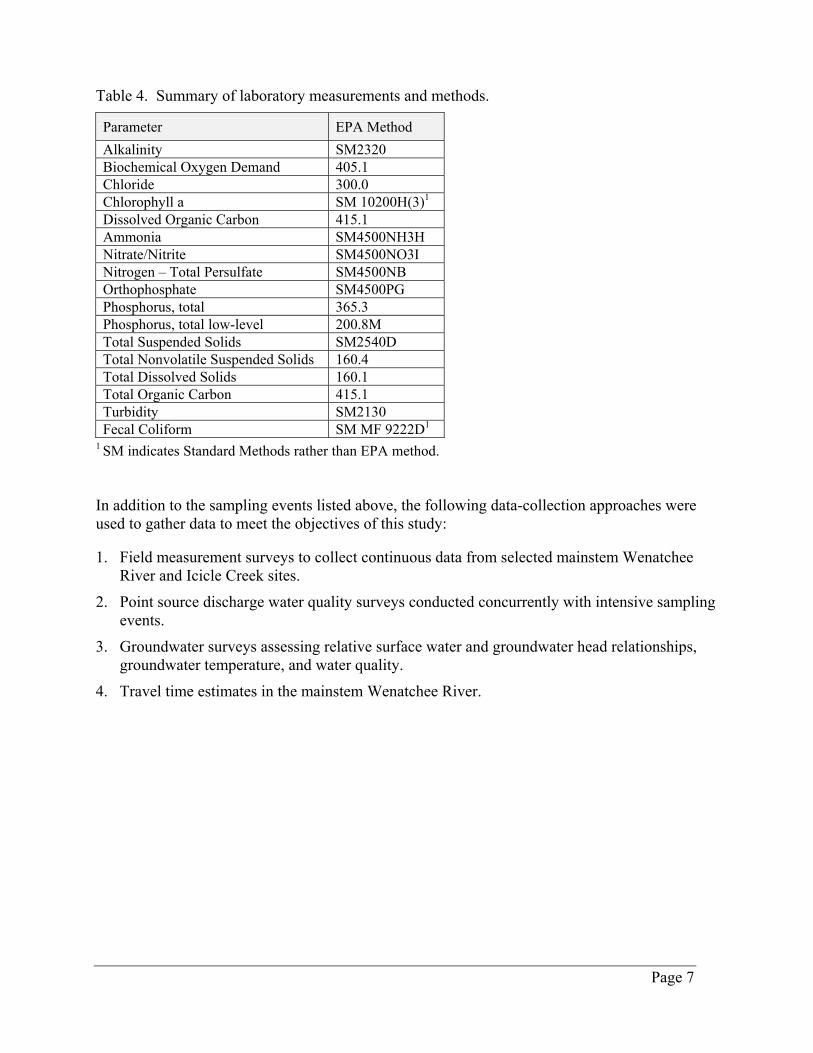
Table 4. Summary of laboratory measurements and methods.
Parameter EPA Method Alkalinity SM2320 Biochemical Oxygen Demand 405.1 Chloride 300.0 Chlorophyll a SM 10200H(3)1 Dissolved Organic Carbon 415.1 Ammonia SM4500NH3H Nitrate/Nitrite SM4500NO3I Nitrogen – Total Persulfate SM4500NB Orthophosphate SM4500PG Phosphorus, total 365.3 Phosphorus, total low-level 200.8M Total Suspended Solids SM2540D Total Nonvolatile Suspended Solids 160.4 Total Dissolved Solids 160.1 Total Organic Carbon 415.1 Turbidity SM2130 Fecal Coliform SM MF 9222D1
1 SM indicates Standard Methods rather than EPA method. In addition to the sampling events listed above, the following data-collection approaches were used to gather data to meet the objectives of this study: 1. Field measurement surveys to collect continuous data from selected mainstem Wenatchee
River and Icicle Creek sites.
2. Point source discharge water quality surveys conducted concurrently with intensive sampling events.
3. Groundwater surveys assessing relative surface water and groundwater head relationships, groundwater temperature, and water quality.
4. Travel time estimates in the mainstem Wenatchee River.
Page 7
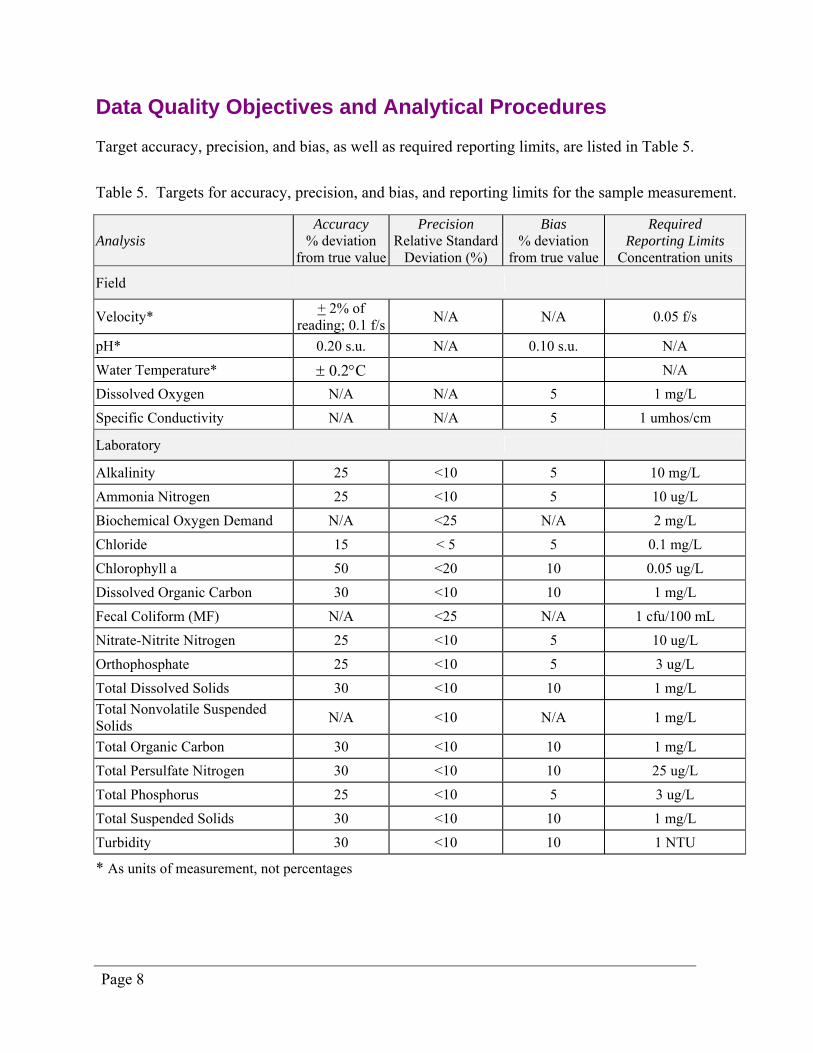
Data Quality Objectives and Analytical Procedures Target accuracy, precision, and bias, as well as required reporting limits, are listed in Table 5. Table 5. Targets for accuracy, precision, and bias, and reporting limits for the sample measurement.
Analysis
Accuracy % deviation
from true value
Precision Relative Standard
Deviation (%)
Bias % deviation
from true value
Required Reporting Limits
Concentration units
Field
Velocity* + 2% of reading; 0.1 f/s N/A N/A 0.05 f/s
pH* 0.20 s.u. N/A 0.10 s.u. N/A Water Temperature* ± 0.2°C N/A Dissolved Oxygen N/A N/A 5 1 mg/L Specific Conductivity N/A N/A 5 1 umhos/cm
Laboratory
Alkalinity 25 <10 5 10 mg/L Ammonia Nitrogen 25 <10 5 10 ug/L Biochemical Oxygen Demand N/A <25 N/A 2 mg/L Chloride 15 < 5 5 0.1 mg/L Chlorophyll a 50 <20 10 0.05 ug/L Dissolved Organic Carbon 30 <10 10 1 mg/L Fecal Coliform (MF) N/A <25 N/A 1 cfu/100 mL Nitrate-Nitrite Nitrogen 25 <10 5 10 ug/L Orthophosphate 25 <10 5 3 ug/L Total Dissolved Solids 30 <10 10 1 mg/L Total Nonvolatile Suspended Solids N/A <10 N/A 1 mg/L
Total Organic Carbon 30 <10 10 1 mg/L Total Persulfate Nitrogen 30 <10 10 25 ug/L Total Phosphorus 25 <10 5 3 ug/L Total Suspended Solids 30 <10 10 1 mg/L Turbidity 30 <10 10 1 NTU
* As units of measurement, not percentages
Page 8
Sample Collection and Field Measurements Ecology field personnel collected water quality data during surveys conducted in 2002 and 2003. The methods used in these surveys were initially described in the Quality Assurance (QA) Project Plan (Bilhimer et al., 2002). However, several stations changed according to logistical needs and information acquired from sampling. Figures 2 through 4 show all of the sampling site locations divided by sub-watershed. Tables 6 through 8 list the sampling station identification (which includes the river mile), description, and latitude and longitude of the sampling sites, as well as the general type of data collected at each site. All river water quality samples collected for laboratory analysis were grab samples taken just below the water surface from the main body of flow (unless there was not enough depth to submerse the sample container). Samples were collected either by using an extension rod extended from the streambank or by wading into the river. Generally, grab samples were collected once per day. Instantaneous river temperature, DO, pH and conductivity were measured using Hydrolab® Datasonde 3s and 4s. Hydrolab® DO measurements were compared to DO measurements using the azide modified Winkler method. In situ multi-parameter data loggers (Hydrolab® Datasonde 3s and 4s) were deployed at different locations in the mainstem Wenatchee River and Icicle Creek to collect continuous diel data for DO, temperature, pH, and conductivity. The locations where diel data was collected are listed in Tables 6 through 8. These data were used to assess diel changes in the parameters measured. Point sources listed in the QA Project Plans were sampled during the intensive synoptic surveys by Ecology’s Toxics Studies Unit. Appendix A lists the permit limits and background information of the Wenatchee TMDL point sources. Final effluents were sampled during periods when they discharge to receiving waters. Generally, two grab samples per day and 24-hour composite samples were collected. Appendix B contains a summary of the field notes from the point source sampling, describing the sample collection and field measurements.
Page 9

!
!
!
!
!
!
!
!
!
!
!
!
!
!
!
!
!
!
!
!
!
!
!!
!!
!!
!!
!!
!!
!!
!!
!!
!!
!!
!!
!!
!!
!!
!!
! !!! !!
!!
!
!
!!
!!
!!
!!
!!
!!
!!
!!
!! ! ! ! ! !
!!!
! !
! !
!!
!!
!!
!!
!!
!!
! !
!
!
!!
!!
!
!
!!
!!
!!
! !
!!
!!
!!
!!
!!
!!
!!
!!
tu2
Lake Wenatchee
Fish Lake
Leavenworth
Chu
msti
ck C
reek
45WDB45WDA
45WR54.0 45WR53.9
45WR46.2
45WR41.8
45WR21.0
45WH01.9
45NC01.245NC00.7
45LR01.2
45IC00.1
45FL00.3
45CW00.5
45CK01.0
45CK00.1
45CD00.1
45BC00.1
45WR35.4
45WR30.7
45WR26.2
Chiwawa River
r
Icicle Cr
Nason Creek
er
waukum Creek
Beaver Creek
Wenatchee River
0 1 2 3 40.5Miles
¥
Figure 2. Upper mainstem Wenatchee River sampling stations for the 2002-03 TMDL study.
Page 10
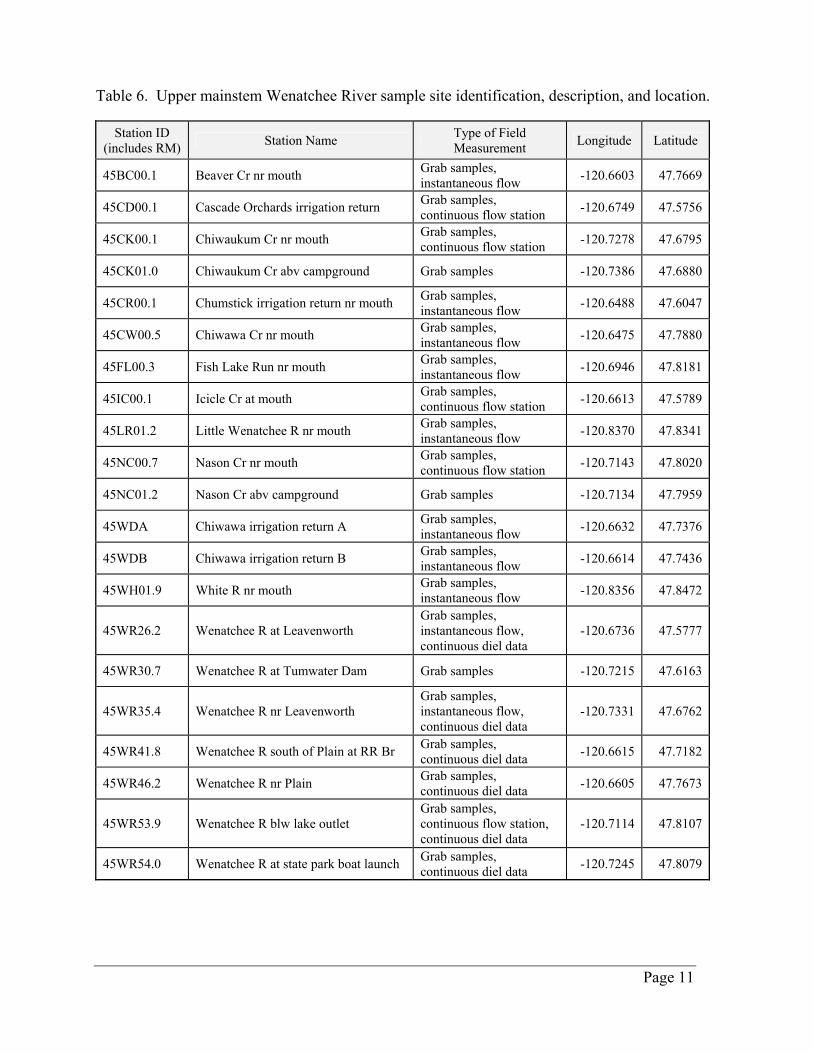
Table 6. Upper mainstem Wenatchee River sample site identification, description, and location.
Station ID (includes RM) Station Name Type of Field
Measurement Longitude Latitude
45BC00.1 Beaver Cr nr mouth Grab samples, instantaneous flow -120.6603 47.7669
45CD00.1 Cascade Orchards irrigation return Grab samples, continuous flow station -120.6749 47.5756
45CK00.1 Chiwaukum Cr nr mouth Grab samples, continuous flow station -120.7278 47.6795
45CK01.0 Chiwaukum Cr abv campground Grab samples -120.7386 47.6880
45CR00.1 Chumstick irrigation return nr mouth Grab samples, instantaneous flow -120.6488 47.6047
45CW00.5 Chiwawa Cr nr mouth Grab samples, instantaneous flow -120.6475 47.7880
45FL00.3 Fish Lake Run nr mouth Grab samples, instantaneous flow -120.6946 47.8181
45IC00.1 Icicle Cr at mouth Grab samples, continuous flow station -120.6613 47.5789
45LR01.2 Little Wenatchee R nr mouth Grab samples, instantaneous flow -120.8370 47.8341
45NC00.7 Nason Cr nr mouth Grab samples, continuous flow station -120.7143 47.8020
45NC01.2 Nason Cr abv campground Grab samples -120.7134 47.7959
45WDA Chiwawa irrigation return A Grab samples, instantaneous flow -120.6632 47.7376
45WDB Chiwawa irrigation return B Grab samples, instantaneous flow -120.6614 47.7436
45WH01.9 White R nr mouth Grab samples, instantaneous flow -120.8356 47.8472
45WR26.2 Wenatchee R at Leavenworth Grab samples, instantaneous flow, continuous diel data
-120.6736 47.5777
45WR30.7 Wenatchee R at Tumwater Dam Grab samples -120.7215 47.6163
45WR35.4 Wenatchee R nr Leavenworth Grab samples, instantaneous flow, continuous diel data
-120.7331 47.6762
45WR41.8 Wenatchee R south of Plain at RR Br Grab samples, continuous diel data -120.6615 47.7182
45WR46.2 Wenatchee R nr Plain Grab samples, continuous diel data -120.6605 47.7673
45WR53.9 Wenatchee R blw lake outlet Grab samples, continuous flow station, continuous diel data
-120.7114 47.8107
45WR54.0 Wenatchee R at state park boat launch Grab samples, continuous diel data -120.7245 47.8079
Page 11
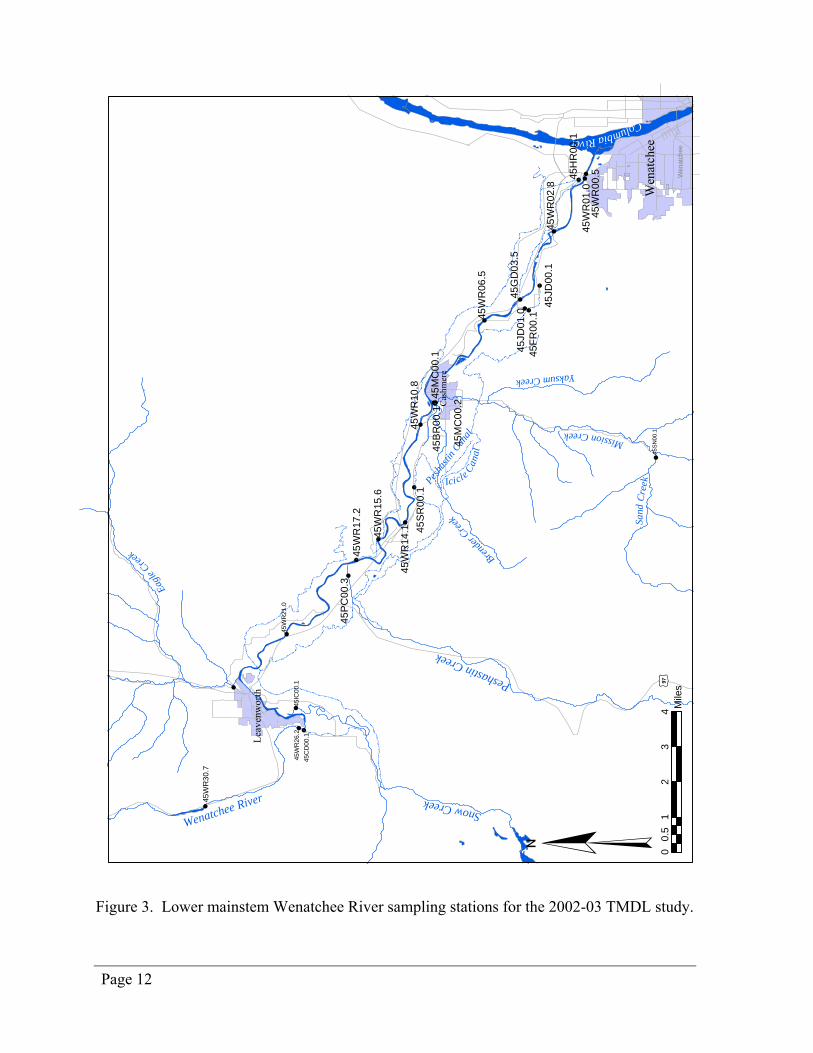
Figure 3. Lower mainstem Wenatchee River sampling stations for the 2002-03 TMDL study.
Page 12
!
! !
!
! !
!!
!
!
!
!
!
!
!
!
!
!
!
!
!
!
!
!
!!
!!
!
!
!!
!!
!!!!
!!
!!
!!!!
!!
!!
!!!!!!
!!
!!!!
!!
!!
!!
!!
!!
!!
!!
!!
!!
!!
!!
!!
!!
!!
!!
!!
!!
!!
!!
!!
!!
!!
!
!
!!
! !! !
!!
!!
!!
!!
!!
! !
!!
!!
!
!!!
!
! !!
!!
!!
!!
!!
!
!
!! !!
!
!
! !
!!!!
!!
!!
!! !
!
!
!!
!!
!!
!!
!!
!!
!!
!!
!!
!!
!!
!!
!!
!
!
!!
!!
!!
!!
!!
!!
!
!!
!!
!!
!
!!
!!
! !
!! !! ! !
!!
!!
!!
!!
! !
!!
!!
!!
! !
!!
! !
! !
!
!!
!
!!
!!
!!
!!
!!
!
!!
!!
!!
!!
!!
!!
!!
! !
!
!
! !
!!
!!
!!
!!
!!
!!
!!
!!
!!
!!
!
!
!
!
!!
!!
!!
!!
!!
!!
!
!
!!
!!
!!
!!
!!
!
!
!!
!
!
!!
!!
!!
!!
!!
!!
!!
!!
!!
!
!
!
!
! ! !! !!
!
!
!!
!
!
! !
!!
!! !!
!
!
! !
!!
! !
!!
!!
!!
!!
!!
!!
!!
!!
!!!!
!!
!!
!!
!
!
!!
! !
!!
!! !! !
!
!!
!!
!!!!
!
!
!
!
!!
!!
! ! !!
!!
!
!
!!
!
! !!
! !
!!!!
!!
!!
! !
!!
!
!
!
!
!!
!!
!!!
!
!!
!!!!
!!!!!
!!!
!!
!!
!!!!
!
!
!!
!!
!!
!!
!!
!!
!!
!!
!!
!!
! !
!!
! !
!!
!!
!!
!!
!!
!!
! !!!
!!!!
!!! !
!!
!!
!!
!!
!!
!
!
!!
!!
!
!
!!
!!
!!
!!
!!
!!
!!
!!
!!
!!
!!
!!
! !
!!
!!
!!
!!
!!
!!
!!
! !
!!
!!
!!
!!
!!
!!
!!
!!
!
!
!!
!!
!!
! !! !
!!
!!
!!
!!
!!
!!
!!
!
!
!!
!
!!!
!
!
!
!
!!
!!
!!
!!
!
!!!
!!
!
!
! !
!
!
!!
!
! !
!!
!!
!!
! !
!!!!
! !
!!
!
!
!!
!!
!
!
!!
!
!!
!!!
!!
!!
!!
!
!!
!!
!!
!!
!!
! !
!!
!!
!!
!!
!!
!!
!!
!!
!
!
!
! !!!
!!
!!
!!
!
!
!!
!
! !
!!
!
!
!!
!!
!
!
!!
!!!
!
!
!!
!!
! !!!!!
!!
!!
Wen
atch
ee
t u97
Cas
hmer
e
Leav
enw
orth
Columbia River
Mission Creek
Icicl e Ca
nal
Wen
atch
ee
Eagle
C
reek
!45
SN00
.1
Yaksum Creek
Brender
Creek Sand
Cre
ekPesha
stin C
anal
45W
R21
.0
45W
R17
.2
45W
R15
.6
45W
R14
.145
WR
10.8
45W
R06
.5
45W
R02
.8
45W
R01
.0
45S
R00
.1
45P
C00
.3
45JD
01.0
45JD
00.1
45IC
00.1
45H
R00
.1
45G
D03
.5
45C
D00
.1
45W
R30
.7
45M
C00
.1 45FR
00.1
45M
C00
.2
45B
R00
.1
45W
R26
.2
45W
R00
.5
Peshastin Creek
Snow Creek
Wenatchee River
01
23
40.
5M
iles
¥
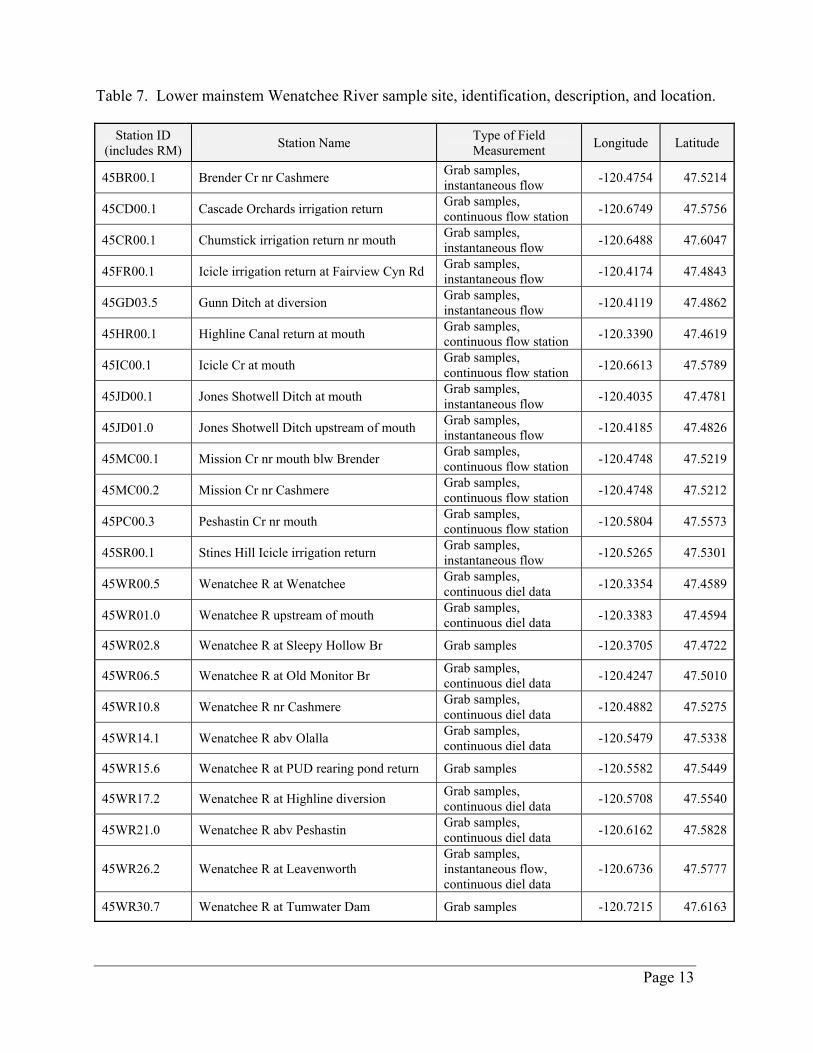
Table 7. Lower mainstem Wenatchee River sample site, identification, description, and location.
Station ID (includes RM) Station Name Type of Field
Measurement Longitude Latitude
45BR00.1 Brender Cr nr Cashmere Grab samples, instantaneous flow -120.4754 47.5214
45CD00.1 Cascade Orchards irrigation return Grab samples, continuous flow station -120.6749 47.5756
45CR00.1 Chumstick irrigation return nr mouth Grab samples, instantaneous flow -120.6488 47.6047
45FR00.1 Icicle irrigation return at Fairview Cyn Rd Grab samples, instantaneous flow -120.4174 47.4843
45GD03.5 Gunn Ditch at diversion Grab samples, instantaneous flow -120.4119 47.4862
45HR00.1 Highline Canal return at mouth Grab samples, continuous flow station -120.3390 47.4619
45IC00.1 Icicle Cr at mouth Grab samples, continuous flow station -120.6613 47.5789
45JD00.1 Jones Shotwell Ditch at mouth Grab samples, instantaneous flow -120.4035 47.4781
45JD01.0 Jones Shotwell Ditch upstream of mouth Grab samples, instantaneous flow -120.4185 47.4826
45MC00.1 Mission Cr nr mouth blw Brender Grab samples, continuous flow station -120.4748 47.5219
45MC00.2 Mission Cr nr Cashmere Grab samples, continuous flow station -120.4748 47.5212
45PC00.3 Peshastin Cr nr mouth Grab samples, continuous flow station -120.5804 47.5573
45SR00.1 Stines Hill Icicle irrigation return Grab samples, instantaneous flow -120.5265 47.5301
45WR00.5 Wenatchee R at Wenatchee Grab samples, continuous diel data -120.3354 47.4589
45WR01.0 Wenatchee R upstream of mouth Grab samples, continuous diel data -120.3383 47.4594
45WR02.8 Wenatchee R at Sleepy Hollow Br Grab samples -120.3705 47.4722
45WR06.5 Wenatchee R at Old Monitor Br Grab samples, continuous diel data -120.4247 47.5010
45WR10.8 Wenatchee R nr Cashmere Grab samples, continuous diel data -120.4882 47.5275
45WR14.1 Wenatchee R abv Olalla Grab samples, continuous diel data -120.5479 47.5338
45WR15.6 Wenatchee R at PUD rearing pond return Grab samples -120.5582 47.5449
45WR17.2 Wenatchee R at Highline diversion Grab samples, continuous diel data -120.5708 47.5540
45WR21.0 Wenatchee R abv Peshastin Grab samples, continuous diel data -120.6162 47.5828
45WR26.2 Wenatchee R at Leavenworth Grab samples, instantaneous flow, continuous diel data
-120.6736 47.5777
45WR30.7 Wenatchee R at Tumwater Dam Grab samples -120.7215 47.6163
Page 13
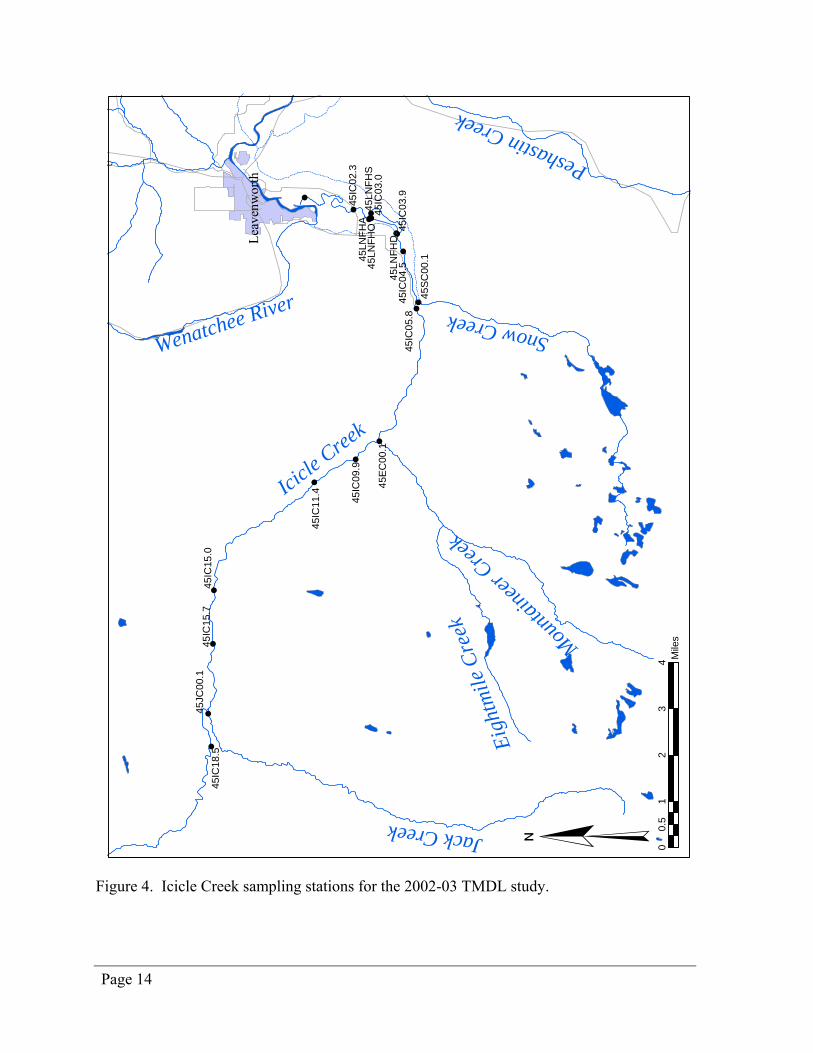
Figure 4. Icicle Creek sampling stations for the 2002-03 TMDL study.
!
!
!
!
!!
!
!
!
!!
!!
!
!
! !
!
!!
!!
!
!
!!
!!
!!!!
!!
!!
!!
!!!
!
!!
!!
!!!!
!!
!!
!!
!!
!!
!!
!!
!!
!!
!!
!!
!!
!!
!!
!!
!!
!!
!!
!!
!!
!!
!!
!!
!!
!!
!!
! !
! !!!
!!
!
!
!!
!!
!!
!!!
!
!!
!!!!
!!
!!!
!!!
!
!
!!
!!
!!
!!
!!
!!
! !
!!
!!
Leav
enw
orth
Icicle C
reek
Peshastin Creek
Jack Creek
Snow Creek
Eigh
tmile
Cre
ek
Mounta
ineer
Creek
Wenatchee River
45LN
FHS
45LN
FHO
45LN
FHD
45SC
00.1
45JC
00.1
45IC
18.5
45IC
15.7
45IC
15.0
45IC
05.8
45IC
04.5
45EC
00.1
45IC
02.3
45LN
FHA
45IC
11.4
45IC
09.9
45IC
03.9
45IC
03.0
01
23
40.
5M
iles
¥
Page 14
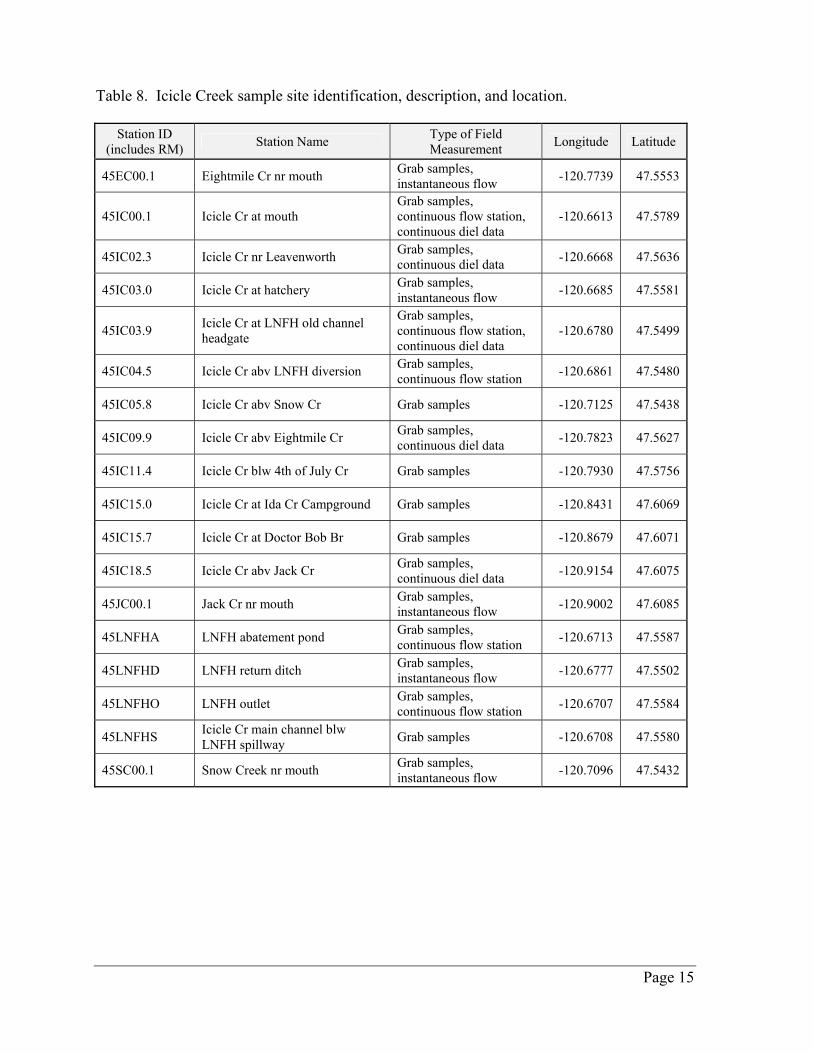
Table 8. Icicle Creek sample site identification, description, and location.
Station ID (includes RM) Station Name Type of Field
Measurement Longitude Latitude
45EC00.1 Eightmile Cr nr mouth Grab samples, instantaneous flow -120.7739 47.5553
45IC00.1 Icicle Cr at mouth Grab samples, continuous flow station, continuous diel data
-120.6613 47.5789
45IC02.3 Icicle Cr nr Leavenworth Grab samples, continuous diel data -120.6668 47.5636
45IC03.0 Icicle Cr at hatchery Grab samples, instantaneous flow -120.6685 47.5581
45IC03.9 Icicle Cr at LNFH old channel headgate
Grab samples, continuous flow station, continuous diel data
-120.6780 47.5499
45IC04.5 Icicle Cr abv LNFH diversion Grab samples, continuous flow station -120.6861 47.5480
45IC05.8 Icicle Cr abv Snow Cr Grab samples -120.7125 47.5438
45IC09.9 Icicle Cr abv Eightmile Cr Grab samples, continuous diel data -120.7823 47.5627
45IC11.4 Icicle Cr blw 4th of July Cr Grab samples -120.7930 47.5756
45IC15.0 Icicle Cr at Ida Cr Campground Grab samples -120.8431 47.6069
45IC15.7 Icicle Cr at Doctor Bob Br Grab samples -120.8679 47.6071
45IC18.5 Icicle Cr abv Jack Cr Grab samples, continuous diel data -120.9154 47.6075
45JC00.1 Jack Cr nr mouth Grab samples, instantaneous flow -120.9002 47.6085
45LNFHA LNFH abatement pond Grab samples, continuous flow station -120.6713 47.5587
45LNFHD LNFH return ditch Grab samples, instantaneous flow -120.6777 47.5502
45LNFHO LNFH outlet Grab samples, continuous flow station -120.6707 47.5584
45LNFHS Icicle Cr main channel blw LNFH spillway Grab samples -120.6708 47.5580
45SC00.1 Snow Creek nr mouth Grab samples, instantaneous flow -120.7096 47.5432
Page 15
Sampling and Quality Control Procedures All water samples for laboratory analysis were collected in pre-cleaned containers supplied by Ecology’s Manchester Environmental Laboratory (MEL), except dissolved organic carbon, dissolved total phosphorus, and orthophosphate which were collected in a syringe and filtered into a pre-cleaned container. The syringe was rinsed with ambient water at each sampling site three times before filtering. All samples for laboratory analysis were preserved as specified by MEL (2000) and delivered to MEL within 24 hours of collection. Laboratory analyses listed in Table 4 were performed in accordance with MEL (2000). Field sampling and measurement protocols followed those specified in WAS (1993) for in situ temperature, DO, pH, and specific conductance (Hydrolab® multi-parameter meters) and for DO Winkler titrations. All meters were calibrated and post-calibrated per manufacturer's instructions. Effluent samples from the point sources were collected in pre-cleaned ISCO 24-hour composite samplers. Effluent sampling was conducted according to standard operating procedures for Class II inspections by Ecology as documented in Glenn (1994). Appendix B contains a summary of the field notes from the point source sampling describing the sample collection and field measurements. Groundwater data collected by Ecology followed protocols defined in Garrigues (1999). Replicate samples were collected to assess total field and laboratory variation. Blanks were also used to assess possible sample contamination. Replicate and blank samples were introduced in the field and submitted “blind” with the routine batches of samples to the laboratory. Phytoplankton samples were preserved with 1% Lugol's solution immediately after collection and sent to Jim Sweet, Aquatic Analysts, Wilsonville, Oregon, for plankton analyses.
Page 16
Data Quality Results
Quality Assurance Objectives Data collected for this Wenatchee River TMDL Study were evaluated to determine whether data quality assurance/quality control (QA/QC) objectives for the project were met. Water quality data QA/QC objectives for precision, bias, and accuracy are described in Table 5.
Sample Quality Assurance QA/QC for Samples Field Sampling Field sampling protocols followed those specified in WAS (1993). Field QC requirements include the use of field replicates and field blanks to assess total precision and field bias, respectively. Laboratory MEL was used for all laboratory analyses. Laboratory data were generated according to QA/QC procedures described in MEL (2000). MEL prepared and submitted QA memos to Ecology’s Environmental Assessment Program for each sampling survey. Each memo summarized the QC procedures and results for sample transport and storage, sample holding times, and instrument calibration. The memo also included a QA summary of check standards, matrix spikes, method blanks (used to check for analytical bias), and lab-split samples (used to check for analytical precision). With few exceptions, all samples were received in good condition and were properly preserved, as necessary. The temperature of the shipping coolers was between proper ranges of 2°C - 6°C for all sample shipments except two coolers received at MEL on July 25, 2002. On that day, one cooler had an ambient temperature of 7°C, and another cooler had an ambient temperature of 8°C; however, the samples for that date were not qualified for being out of range. Holding times were violated at times throughout the project because of delayed transport problems or because the samples were held too long at MEL before analysis. MEL qualified as estimates all individual samples that were analyzed beyond holding times with a “J”. Instrument calibration and control checks were all within control limits for the project. Lower reporting limit objectives were met for all parameters except total phosphorus (TP) for the November 12 and 13, 2002 survey (TP on that survey had a reporting limit of 10 ug/L instead of 3 ug/L). Results not detected at or above the reporting limits listed in Table 5 were qualified by MEL with a “U”. Data below the reporting limit were excluded from consideration in determining analytical and total precision (see below).
Page 17
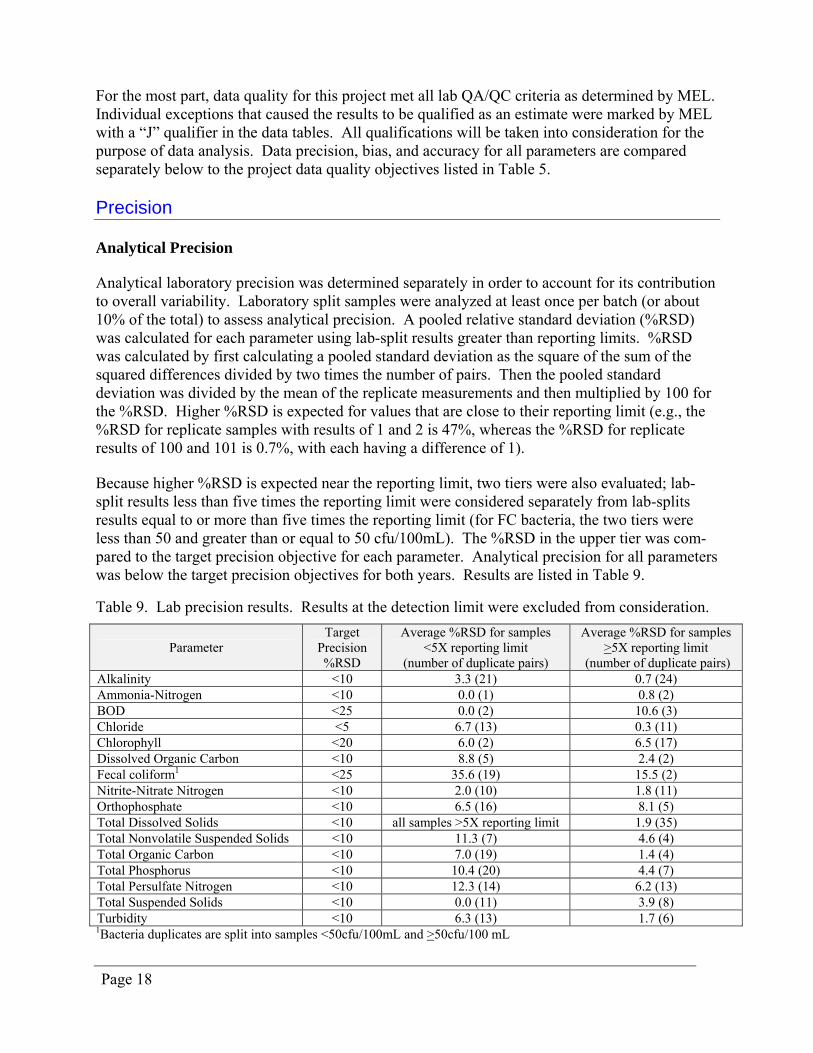
For the most part, data quality for this project met all lab QA/QC criteria as determined by MEL. Individual exceptions that caused the results to be qualified as an estimate were marked by MEL with a “J” qualifier in the data tables. All qualifications will be taken into consideration for the purpose of data analysis. Data precision, bias, and accuracy for all parameters are compared separately below to the project data quality objectives listed in Table 5. Precision Analytical Precision Analytical laboratory precision was determined separately in order to account for its contribution to overall variability. Laboratory split samples were analyzed at least once per batch (or about 10% of the total) to assess analytical precision. A pooled relative standard deviation (%RSD) was calculated for each parameter using lab-split results greater than reporting limits. %RSD was calculated by first calculating a pooled standard deviation as the square of the sum of the squared differences divided by two times the number of pairs. Then the pooled standard deviation was divided by the mean of the replicate measurements and then multiplied by 100 for the %RSD. Higher %RSD is expected for values that are close to their reporting limit (e.g., the %RSD for replicate samples with results of 1 and 2 is 47%, whereas the %RSD for replicate results of 100 and 101 is 0.7%, with each having a difference of 1). Because higher %RSD is expected near the reporting limit, two tiers were also evaluated; lab-split results less than five times the reporting limit were considered separately from lab-splits results equal to or more than five times the reporting limit (for FC bacteria, the two tiers were less than 50 and greater than or equal to 50 cfu/100mL). The %RSD in the upper tier was com-pared to the target precision objective for each parameter. Analytical precision for all parameters was below the target precision objectives for both years. Results are listed in Table 9. Table 9. Lab precision results. Results at the detection limit were excluded from consideration.
Parameter Target
Precision %RSD
Average %RSD for samples <5X reporting limit
(number of duplicate pairs)
Average %RSD for samples >5X reporting limit
(number of duplicate pairs) Alkalinity <10 3.3 (21) 0.7 (24) Ammonia-Nitrogen <10 0.0 (1) 0.8 (2) BOD <25 0.0 (2) 10.6 (3) Chloride <5 6.7 (13) 0.3 (11) Chlorophyll <20 6.0 (2) 6.5 (17) Dissolved Organic Carbon <10 8.8 (5) 2.4 (2) Fecal coliform1 <25 35.6 (19) 15.5 (2) Nitrite-Nitrate Nitrogen <10 2.0 (10) 1.8 (11) Orthophosphate <10 6.5 (16) 8.1 (5) Total Dissolved Solids <10 all samples >5X reporting limit 1.9 (35) Total Nonvolatile Suspended Solids <10 11.3 (7) 4.6 (4) Total Organic Carbon <10 7.0 (19) 1.4 (4) Total Phosphorus <10 10.4 (20) 4.4 (7) Total Persulfate Nitrogen <10 12.3 (14) 6.2 (13) Total Suspended Solids <10 0.0 (11) 3.9 (8) Turbidity <10 6.3 (13) 1.7 (6) 1Bacteria duplicates are split into samples <50cfu/100mL and >50cfu/100 mL
Page 18
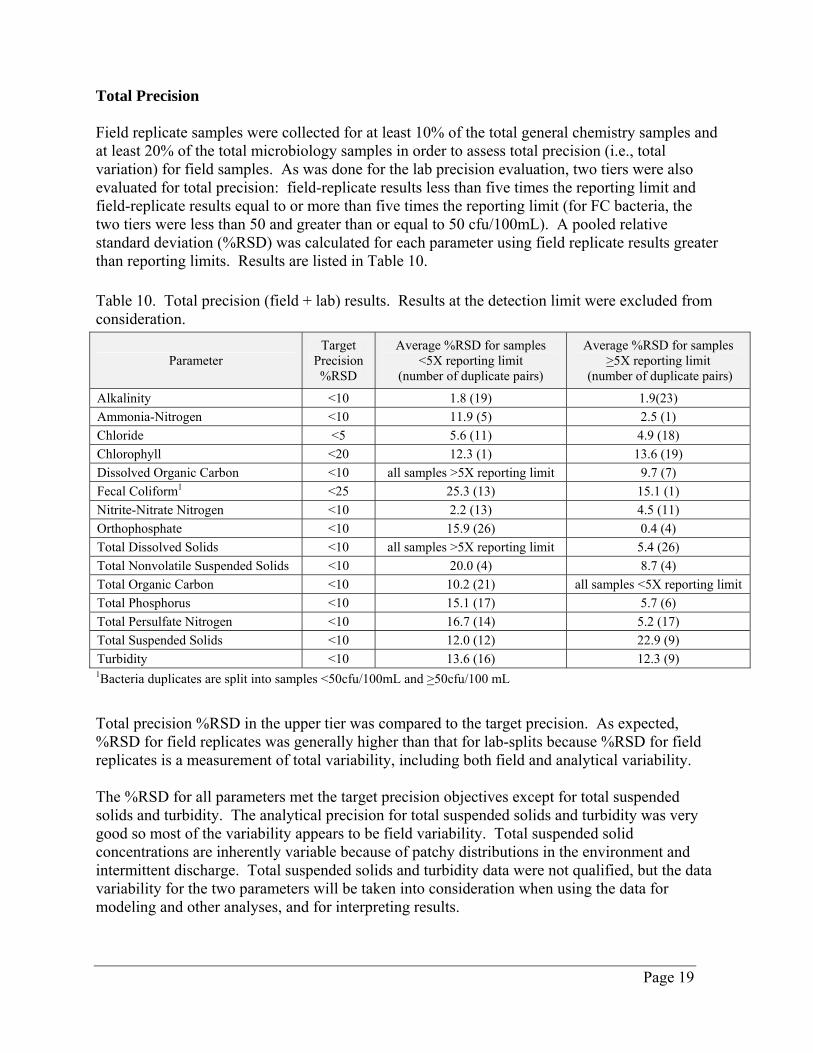
Total Precision Field replicate samples were collected for at least 10% of the total general chemistry samples and at least 20% of the total microbiology samples in order to assess total precision (i.e., total variation) for field samples. As was done for the lab precision evaluation, two tiers were also evaluated for total precision: field-replicate results less than five times the reporting limit and field-replicate results equal to or more than five times the reporting limit (for FC bacteria, the two tiers were less than 50 and greater than or equal to 50 cfu/100mL). A pooled relative standard deviation (%RSD) was calculated for each parameter using field replicate results greater than reporting limits. Results are listed in Table 10. Table 10. Total precision (field + lab) results. Results at the detection limit were excluded from consideration.
Parameter Target
Precision %RSD
Average %RSD for samples <5X reporting limit
(number of duplicate pairs)
Average %RSD for samples >5X reporting limit
(number of duplicate pairs)
Alkalinity <10 1.8 (19) 1.9(23) Ammonia-Nitrogen <10 11.9 (5) 2.5 (1) Chloride <5 5.6 (11) 4.9 (18) Chlorophyll <20 12.3 (1) 13.6 (19) Dissolved Organic Carbon <10 all samples >5X reporting limit 9.7 (7) Fecal Coliform1 <25 25.3 (13) 15.1 (1) Nitrite-Nitrate Nitrogen <10 2.2 (13) 4.5 (11) Orthophosphate <10 15.9 (26) 0.4 (4) Total Dissolved Solids <10 all samples >5X reporting limit 5.4 (26) Total Nonvolatile Suspended Solids <10 20.0 (4) 8.7 (4) Total Organic Carbon <10 10.2 (21) all samples <5X reporting limit Total Phosphorus <10 15.1 (17) 5.7 (6) Total Persulfate Nitrogen <10 16.7 (14) 5.2 (17) Total Suspended Solids <10 12.0 (12) 22.9 (9) Turbidity <10 13.6 (16) 12.3 (9) 1Bacteria duplicates are split into samples <50cfu/100mL and >50cfu/100 mL
Total precision %RSD in the upper tier was compared to the target precision. As expected, %RSD for field replicates was generally higher than that for lab-splits because %RSD for field replicates is a measurement of total variability, including both field and analytical variability. The %RSD for all parameters met the target precision objectives except for total suspended solids and turbidity. The analytical precision for total suspended solids and turbidity was very good so most of the variability appears to be field variability. Total suspended solid concentrations are inherently variable because of patchy distributions in the environment and intermittent discharge. Total suspended solids and turbidity data were not qualified, but the data variability for the two parameters will be taken into consideration when using the data for modeling and other analyses, and for interpreting results.
Page 19
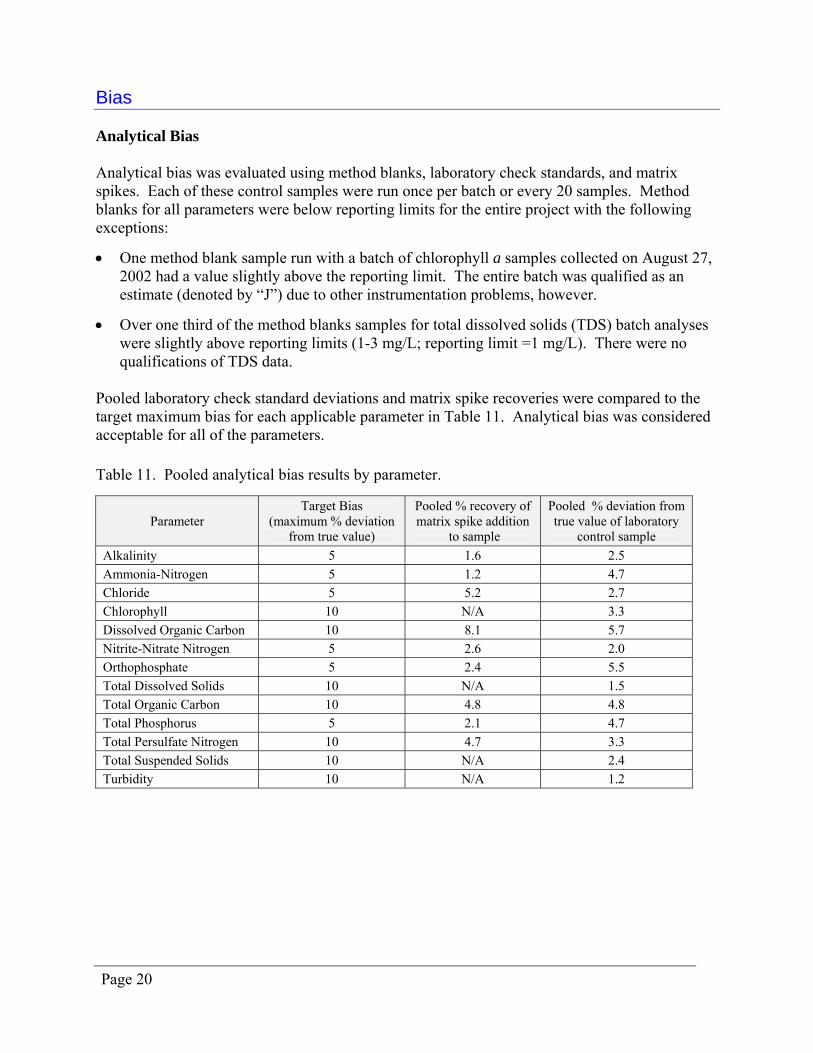
Bias Analytical Bias Analytical bias was evaluated using method blanks, laboratory check standards, and matrix spikes. Each of these control samples were run once per batch or every 20 samples. Method blanks for all parameters were below reporting limits for the entire project with the following exceptions:
• One method blank sample run with a batch of chlorophyll a samples collected on August 27, 2002 had a value slightly above the reporting limit. The entire batch was qualified as an estimate (denoted by “J”) due to other instrumentation problems, however.
• Over one third of the method blanks samples for total dissolved solids (TDS) batch analyses were slightly above reporting limits (1-3 mg/L; reporting limit =1 mg/L). There were no qualifications of TDS data.
Pooled laboratory check standard deviations and matrix spike recoveries were compared to the target maximum bias for each applicable parameter in Table 11. Analytical bias was considered acceptable for all of the parameters. Table 11. Pooled analytical bias results by parameter.
Parameter Target Bias
(maximum % deviation from true value)
Pooled % recovery of matrix spike addition
to sample
Pooled % deviation from true value of laboratory
control sample Alkalinity 5 1.6 2.5 Ammonia-Nitrogen 5 1.2 4.7 Chloride 5 5.2 2.7 Chlorophyll 10 N/A 3.3 Dissolved Organic Carbon 10 8.1 5.7 Nitrite-Nitrate Nitrogen 5 2.6 2.0 Orthophosphate 5 2.4 5.5 Total Dissolved Solids 10 N/A 1.5 Total Organic Carbon 10 4.8 4.8 Total Phosphorus 5 2.1 4.7 Total Persulfate Nitrogen 10 4.7 3.3 Total Suspended Solids 10 N/A 2.4 Turbidity 10 N/A 1.2
Page 20
Field Bias Field-blank samples were submitted to Manchester Laboratory blindly to determine bias from contamination in the field. Results are presented in Table 12. Field-blank contamination was suspected when measured values exceeded the corresponding reporting limits. With the exception of three samples (see below), all submitted field-blank measurement values were below reporting limits. NO2-NO3 was measured above the reporting limit in a field-blank sample from July 24, 2002. A review of laboratory QA/QC for NO2-NO3 on that date showed no laboratory bias or contamination. Since the measured value of the field blank was just slightly above the reporting limit, no correction or qualification was made to NO2-NO3 results for that date. Total organic carbon (TOC) and dissolved organic carbon (DOC) were measured above their reporting limits in field-blank samples submitted on September 25, 2002. A review of laboratory QA/QC for TOC and DOC on that date showed no laboratory bias or contamination. Other samples with measurable results above the reporting limits from that date did not have evidence of contamination (i.e., sample results were below the field-blank results). In reviewing all field and laboratory quality control data, it does not appear that there was any contamination or bias in either the sampling or analytical procedures; therefore, no qualifications or corrections were made for TOC or DOC results from that date.
Page 21
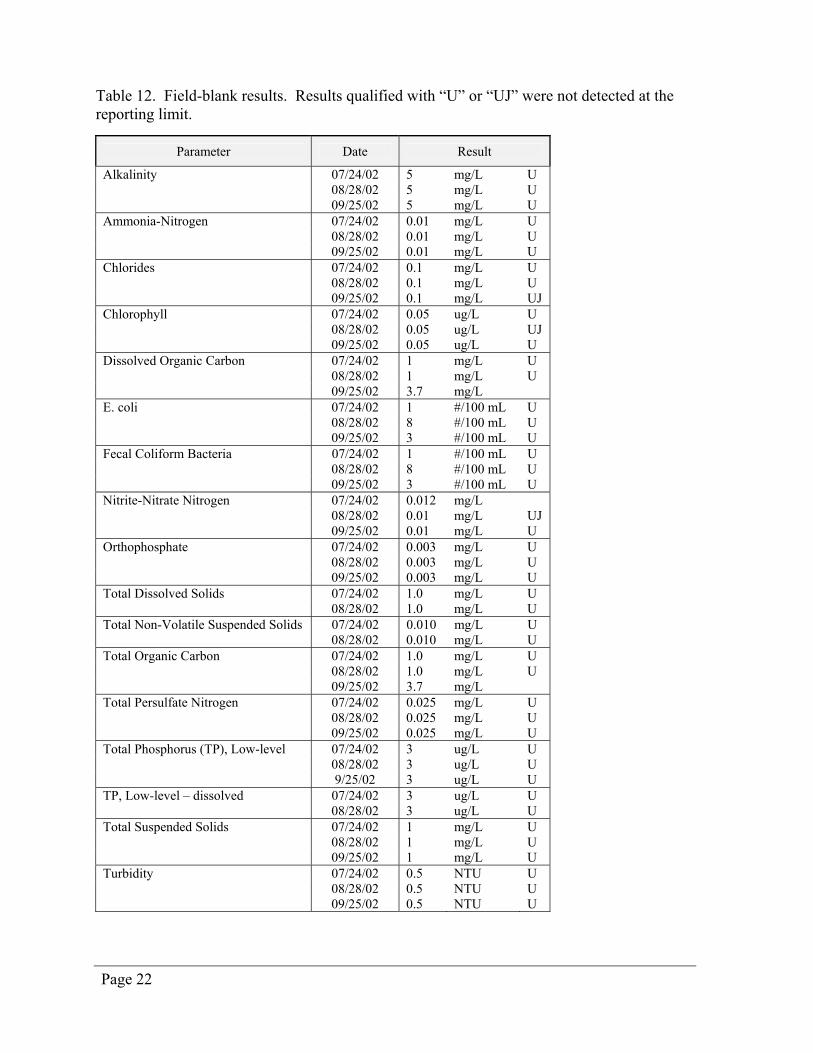
Table 12. Field-blank results. Results qualified with “U” or “UJ” were not detected at the reporting limit.
Parameter Date Result
Alkalinity 07/24/02 5 mg/L U 08/28/02 5 mg/L U 09/25/02 5 mg/L U Ammonia-Nitrogen 07/24/02 0.01 mg/L U 08/28/02 0.01 mg/L U 09/25/02 0.01 mg/L U Chlorides 07/24/02 0.1 mg/L U 08/28/02 0.1 mg/L U 09/25/02 0.1 mg/L UJ Chlorophyll 07/24/02 0.05 ug/L U 08/28/02 0.05 ug/L UJ 09/25/02 0.05 ug/L U Dissolved Organic Carbon 07/24/02 1 mg/L U 08/28/02 1 mg/L U 09/25/02 3.7 mg/L E. coli 07/24/02 1 #/100 mL U 08/28/02 8 #/100 mL U 09/25/02 3 #/100 mL U Fecal Coliform Bacteria 07/24/02 1 #/100 mL U 08/28/02 8 #/100 mL U 09/25/02 3 #/100 mL U Nitrite-Nitrate Nitrogen 07/24/02 0.012 mg/L 08/28/02 0.01 mg/L UJ 09/25/02 0.01 mg/L U Orthophosphate 07/24/02 0.003 mg/L U 08/28/02 0.003 mg/L U 09/25/02 0.003 mg/L U Total Dissolved Solids 07/24/02 1.0 mg/L U 08/28/02 1.0 mg/L U Total Non-Volatile Suspended Solids 07/24/02 0.010 mg/L U 08/28/02 0.010 mg/L U Total Organic Carbon 07/24/02 1.0 mg/L U 08/28/02 1.0 mg/L U 09/25/02 3.7 mg/L Total Persulfate Nitrogen 07/24/02 0.025 mg/L U 08/28/02 0.025 mg/L U 09/25/02 0.025 mg/L U Total Phosphorus (TP), Low-level 07/24/02 3 ug/L U 08/28/02 3 ug/L U 9/25/02 3 ug/L U TP, Low-level – dissolved 07/24/02 3 ug/L U 08/28/02 3 ug/L U Total Suspended Solids 07/24/02 1 mg/L U 08/28/02 1 mg/L U 09/25/02 1 mg/L U Turbidity 07/24/02 0.5 NTU U 08/28/02 0.5 NTU U 09/25/02 0.5 NTU U
Page 22
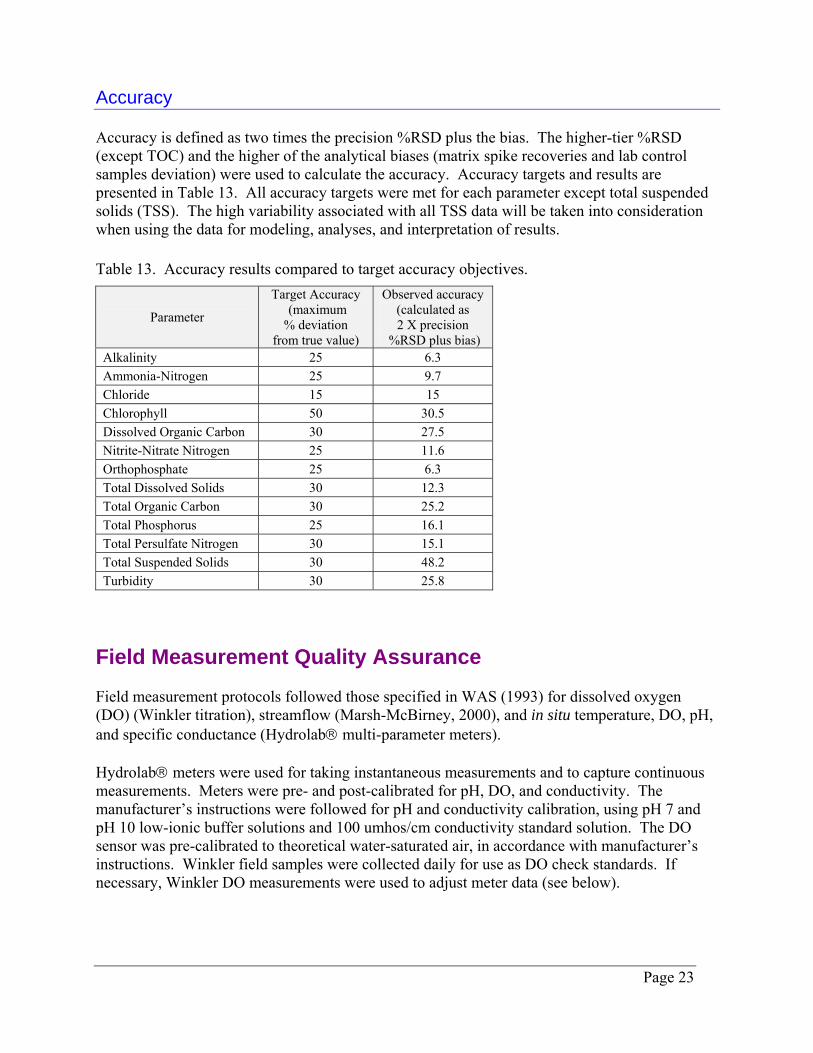
Accuracy Accuracy is defined as two times the precision %RSD plus the bias. The higher-tier %RSD (except TOC) and the higher of the analytical biases (matrix spike recoveries and lab control samples deviation) were used to calculate the accuracy. Accuracy targets and results are presented in Table 13. All accuracy targets were met for each parameter except total suspended solids (TSS). The high variability associated with all TSS data will be taken into consideration when using the data for modeling, analyses, and interpretation of results. Table 13. Accuracy results compared to target accuracy objectives.
Parameter
Target Accuracy (maximum % deviation
from true value)
Observed accuracy (calculated as 2 X precision
%RSD plus bias) Alkalinity 25 6.3 Ammonia-Nitrogen 25 9.7 Chloride 15 15 Chlorophyll 50 30.5 Dissolved Organic Carbon 30 27.5 Nitrite-Nitrate Nitrogen 25 11.6 Orthophosphate 25 6.3 Total Dissolved Solids 30 12.3 Total Organic Carbon 30 25.2 Total Phosphorus 25 16.1 Total Persulfate Nitrogen 30 15.1 Total Suspended Solids 30 48.2 Turbidity 30 25.8
Field Measurement Quality Assurance Field measurement protocols followed those specified in WAS (1993) for dissolved oxygen (DO) (Winkler titration), streamflow (Marsh-McBirney, 2000), and in situ temperature, DO, pH, and specific conductance (Hydrolab® multi-parameter meters). Hydrolab® meters were used for taking instantaneous measurements and to capture continuous measurements. Meters were pre- and post-calibrated for pH, DO, and conductivity. The manufacturer’s instructions were followed for pH and conductivity calibration, using pH 7 and pH 10 low-ionic buffer solutions and 100 umhos/cm conductivity standard solution. The DO sensor was pre-calibrated to theoretical water-saturated air, in accordance with manufacturer’s instructions. Winkler field samples were collected daily for use as DO check standards. If necessary, Winkler DO measurements were used to adjust meter data (see below).
Page 23
Precision Replicate or duplicate measurements were not taken for instantaneous or continuous field measurements so there was not an assessment of precision for these measurements. All measurements made with meters were taken in situ, and the meter was allowed to equilibrate to a stable reading as in the case for an instantaneous reading, or was given a two-minute equilibration period before a reading was recorded as in the case for a continuous reading. Continuous readings were generally 30 minutes apart and were conducted for 12 to 24 hours or longer. Bias Instantaneous Measurement Bias The average difference of post-calibration pH readings was 0.07 standard pH units (s.u.) with a standard deviation of 0.1 s.u. The pooled bias for all of the post-calibration instantaneous pH readings was 0.09 s.u. (the target bias was less than 0.1 s.u.). All instantaneous pH readings were considered acceptable except five pH readings from July 21, 2003 which were qualified as estimates due to a problem with the meter that morning. Post-calibration checks for instantaneous conductivity measurements had a pooled %RSD bias of 3.4%, well under the target maximum bias of 5%. All instantaneous conductivity measurements were considered acceptable for use without qualification. Hydrolab® instantaneous DO data was compared to Winkler check standards to assess bias. In most cases, there was a slight adjustment (correction factor) applied to the meter DO data, and there was no qualification designated. The pooled standard deviation for instantaneous DO data was 0.16 mg/L with a pooled %RSD of 1.45%, well below the target maximum bias of 5%. For several sampling dates, instantaneous DO results were rejected or qualified due to poor correlation between Hydrolab and Winkler values, or malfunctioning equipment. Some of the Hydrolab instantaneous DO data were rejected for the following dates:
• June 25, 2002 (1 value) • July 23, 2002 (2 values) • September 23, 2002 (3 values) • January 7, 2003 (1 value) In addition, for the following sampling dates, some or all of the instantaneous DO results were corrected but qualified as estimates (denoted with “J”) due to poor correlation between Hydrolab and Winkler values:
• June 25, 2002 (7 values) • July 22-23, 2002 (11 values) • August 5, 2002 (2 values)
Page 24
• August 27-28, 2002 (3 values) • September 10, 2002 (2 values) • September 23-25, 2002 (22 values) • October 9, 2002 (17 values) • October 21-22, 2002 (20 values) • December 3, 2002 (1 value) Other than the noted exceptions, all other DO data were considered acceptable for use. Continuous Measurement Bias The average difference of post-calibration pH readings for continuous Hydrolab® meters was 0.08 s.u. (standard deviation of 0.10 s.u.). The pooled bias for all of the post-calibration continuous pH readings was 0.09 s.u. (the target maximum bias was 0.1 s.u.). All continuous pH readings were considered acceptable except pH readings from Hydrolab® meter #21 used on April 7-10, 2003 which were qualified because of poor post-calibration. Post-calibration checks for continuous conductivity measurements had a pooled %RSD bias of 5%, meeting the target maximum bias of 5%. All conductivity measurements were considered acceptable for use without qualification. Quality assurance (QA) of the continuous DO data was conducted for nearly 60 continuous data profiles recorded with Hydrolab® meters for the project. The QA/QC was verified a variety of ways including the following QA checks:
1. Pre-calibration of DO prior to deployment.
2. Field measurements of DO at the beginning, during, and end time of deployment with either Winkler’s or another calibrated DO meter.
3. Post calibration of the DO meter.
4. Plotting measured DO values against calculated saturated values as a bias check, particularly useful for measured DO data from unproductive areas, but a rough bias check for productive areas as well.
Accuracy For field measurements, target objectives for accuracy were set for velocity and temperature. Both accuracy targets are from manufacturers specifications for the respective instruments (velocity meter and thermometer). Instruments are factory calibrated and were considered to be performing within the specified published accuracies during the field season.
Conclusion Overall, the data collected by Ecology for this project met the data quality objectives. The QA and QC review suggests that the Ecology data are of good quality and are properly qualified.
Page 25
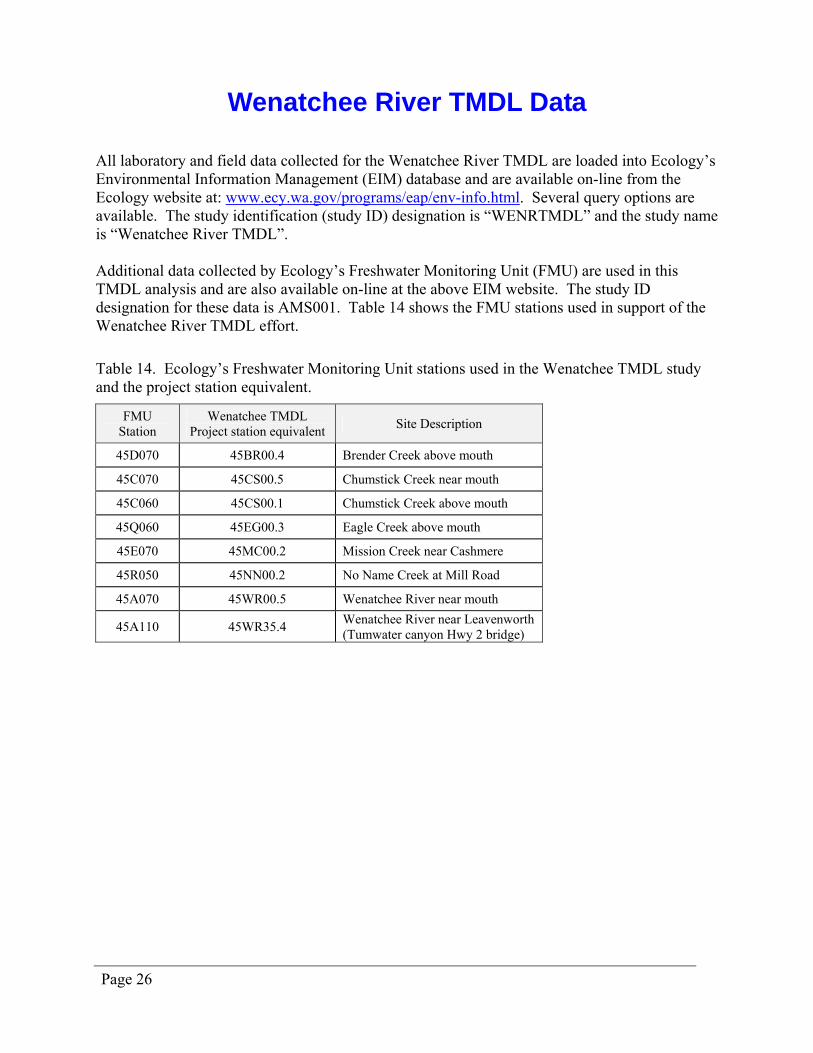
Wenatchee River TMDL Data All laboratory and field data collected for the Wenatchee River TMDL are loaded into Ecology’s Environmental Information Management (EIM) database and are available on-line from the Ecology website at: www.ecy.wa.gov/programs/eap/env-info.html. Several query options are available. The study identification (study ID) designation is “WENRTMDL” and the study name is “Wenatchee River TMDL”. Additional data collected by Ecology’s Freshwater Monitoring Unit (FMU) are used in this TMDL analysis and are also available on-line at the above EIM website. The study ID designation for these data is AMS001. Table 14 shows the FMU stations used in support of the Wenatchee River TMDL effort. Table 14. Ecology’s Freshwater Monitoring Unit stations used in the Wenatchee TMDL study and the project station equivalent.
FMU Station
Wenatchee TMDL Project station equivalent Site Description
45D070 45BR00.4 Brender Creek above mouth
45C070 45CS00.5 Chumstick Creek near mouth
45C060 45CS00.1 Chumstick Creek above mouth
45Q060 45EG00.3 Eagle Creek above mouth
45E070 45MC00.2 Mission Creek near Cashmere
45R050 45NN00.2 No Name Creek at Mill Road
45A070 45WR00.5 Wenatchee River near mouth
45A110 45WR35.4 Wenatchee River near Leavenworth (Tumwater canyon Hwy 2 bridge)
Page 26
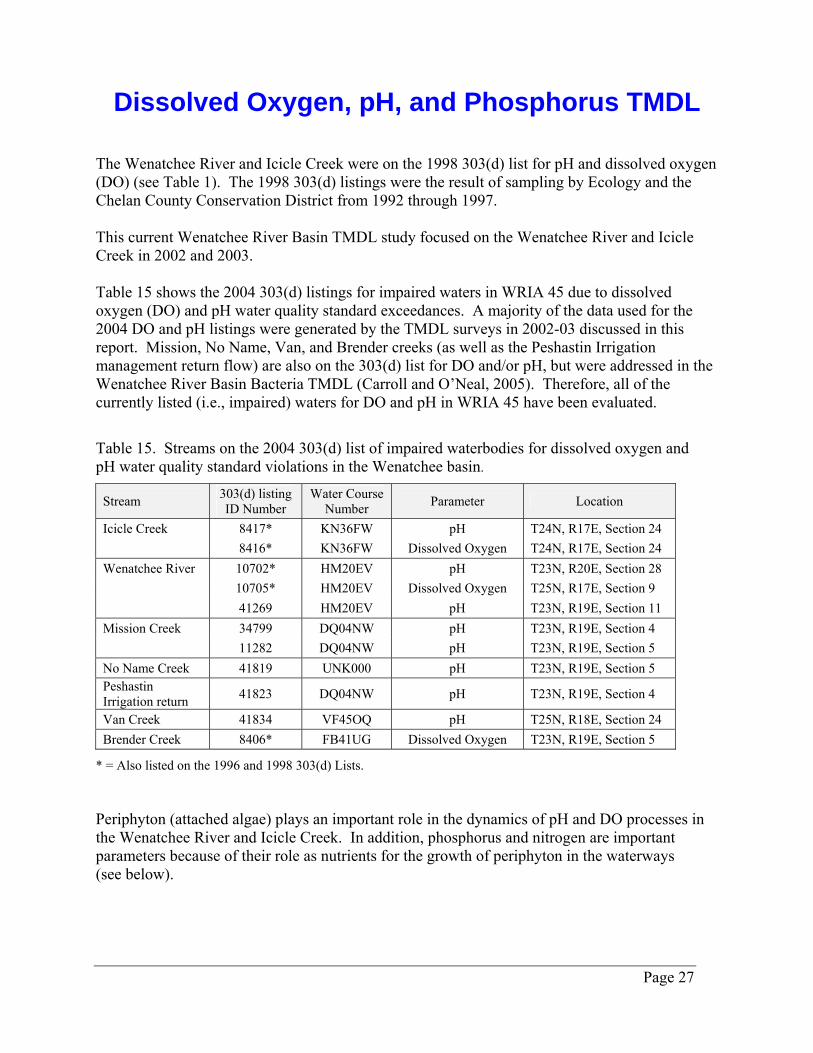
Dissolved Oxygen, pH, and Phosphorus TMDL The Wenatchee River and Icicle Creek were on the 1998 303(d) list for pH and dissolved oxygen (DO) (see Table 1). The 1998 303(d) listings were the result of sampling by Ecology and the Chelan County Conservation District from 1992 through 1997. This current Wenatchee River Basin TMDL study focused on the Wenatchee River and Icicle Creek in 2002 and 2003. Table 15 shows the 2004 303(d) listings for impaired waters in WRIA 45 due to dissolved oxygen (DO) and pH water quality standard exceedances. A majority of the data used for the 2004 DO and pH listings were generated by the TMDL surveys in 2002-03 discussed in this report. Mission, No Name, Van, and Brender creeks (as well as the Peshastin Irrigation management return flow) are also on the 303(d) list for DO and/or pH, but were addressed in the Wenatchee River Basin Bacteria TMDL (Carroll and O’Neal, 2005). Therefore, all of the currently listed (i.e., impaired) waters for DO and pH in WRIA 45 have been evaluated. Table 15. Streams on the 2004 303(d) list of impaired waterbodies for dissolved oxygen and pH water quality standard violations in the Wenatchee basin.
Stream 303(d) listing ID Number
Water Course Number Parameter Location
Icicle Creek 8417* KN36FW pH T24N, R17E, Section 24 8416* KN36FW Dissolved Oxygen T24N, R17E, Section 24 Wenatchee River 10702* HM20EV pH T23N, R20E, Section 28 10705* HM20EV Dissolved Oxygen T25N, R17E, Section 9 41269 HM20EV pH T23N, R19E, Section 11 Mission Creek 34799 DQ04NW pH T23N, R19E, Section 4 11282 DQ04NW pH T23N, R19E, Section 5 No Name Creek 41819 UNK000 pH T23N, R19E, Section 5 Peshastin Irrigation return 41823 DQ04NW pH T23N, R19E, Section 4
Van Creek 41834 VF45OQ pH T25N, R18E, Section 24 Brender Creek 8406* FB41UG Dissolved Oxygen T23N, R19E, Section 5
* = Also listed on the 1996 and 1998 303(d) Lists. Periphyton (attached algae) plays an important role in the dynamics of pH and DO processes in the Wenatchee River and Icicle Creek. In addition, phosphorus and nitrogen are important parameters because of their role as nutrients for the growth of periphyton in the waterways (see below).
Page 27
Water Quality Concerns for Fisheries A Wenatchee River basin limiting factors analysis for salmon, steelhead, and bull trout (Andonaegui, 2001) identified factors affecting natural salmonid production in the Wenatchee River basin. The report summarizes in detail fisheries use of streams in the Wenatchee River basin. Currently, spring chinook, summer chinook, steelhead (rainbow), sockeye, and bull trout use the Wenatchee River and Icicle Creek for spawning, rearing, and/or migration. Summer chinook and steelhead use the lower Wenatchee River (below river mile (RM) 25.6) for spawning. Temperature and fine sediment were identified as water quality limiting factors in the Wenatchee basin; however, pH and DO were noted to affect salmonid habitat quality and currently to be out of compliance with state water quality standards. The state water quality standards were established to protect fisheries and wildlife, as well as public health and enjoyment. Compliance with these standards will enhance the propagation and protection of fisheries in the basin.
Applicable Criteria The Washington State Water Quality Standards, set forth in Chapter 173-201A of the Washington Administrative Code, include designated beneficial uses, waterbody classifications, and numeric and narrative water quality criteria for surface waters of the state. Beneficial Uses and Classifications The Wenatchee River is a tributary to the Class A portion of the Columbia River (WAC 173-201A-030). Consequently, the Wenatchee River from its mouth to the Forest Service boundary is considered a Class A, “excellent,” waterbody. Icicle Creek is considered a Class A waterbody from its confluence with the mainstem Wenatchee River to the Wenatchee National Forest boundary. From the Wenatchee National Forest boundary to their headwaters, the Wenatchee River and Icicle Creek are considered Class AA, “extraordinary,” waterbodies. Characteristic uses for Class A waterbodies include water supply (domestic, industrial, agricultural), stock watering, fish and shellfish (salmonid and other fish migration, rearing, spawning, harvesting), wildlife habitat, recreation (primary contact recreation, sport fishing, boating, aesthetic enjoyment), and commerce and navigation. Characteristic uses for Class AA are considered identical to Class A characteristic uses. Numeric criteria for specific water quality parameters are intended to protect designated uses. However, criteria are more stringent in Class AA waters such that the class shall markedly and uniformly exceed the requirements for all, or substantially all, uses. The criteria for dissolved oxygen, pH, and nutrients (nitrogen and phosphorus) are presented below.
Page 28

Dissolved Oxygen
• For Class A Waters: dissolved oxygen shall exceed 8.0 mg/L. • For Class AA waters: dissolved oxygen shall exceed 9.5 mg/L. pH
• For Class A Waters: pH shall be within the range of 6.5 to 8.5 with a human-caused
variation within the above range of less than 0.5 units. • For Class AA Waters: pH shall be within the range of 6.5 to 8.5 with a human-caused
variation within the above range of less than 0.2 units. Nutrients (Nitrogen and Phosphorus) Nitrogen and phosphorus are essential nutrients for plant growth and aquatic community health. However, when there is an overabundance of nutrients, aquatic plant growth can become over-stimulated, a process called eutrophication. If natural reaeration processes cannot compensate for plant respiration and production in areas affected by eutrophication, dissolved oxygen becomes under-saturated at night and over-saturated during the day, and hydrogen ion (pH) concentrations become over-saturated at night and under-saturated during the day. These diel (i.e., day to night) swings can be harmful to macroinvertebrates and fish. Washington State water quality standards do not have numeric nutrient (nitrogen and phosphorus) criteria for streams. However, Chapter 173-201A contains a narrative criterion that states:
"Toxic, radioactive, or deleterious material concentrations shall be below those which have the potential either singularly or cumulatively to adversely affect characteristic water uses, cause acute or chronic conditions to the most sensitive biota dependent upon those waters, or adversely affect public health, as determined by the department."
This narrative criterion applies to nitrogen and phosphorus. Natural Causes and Anti-degradation Other sections of the water quality standards (in Chapter 173-201A WAC) are pertinent to the Wenatchee TMDL. Chapter 173-201A-070, a section on anti-degradation, states that existing beneficial uses shall be maintained and protected, and no further degradation allowed. The section goes on to state that: “Whenever the natural conditions of said waters are of lower quality than the criteria assigned, the natural conditions shall constitute the water quality criteria.”
Page 29
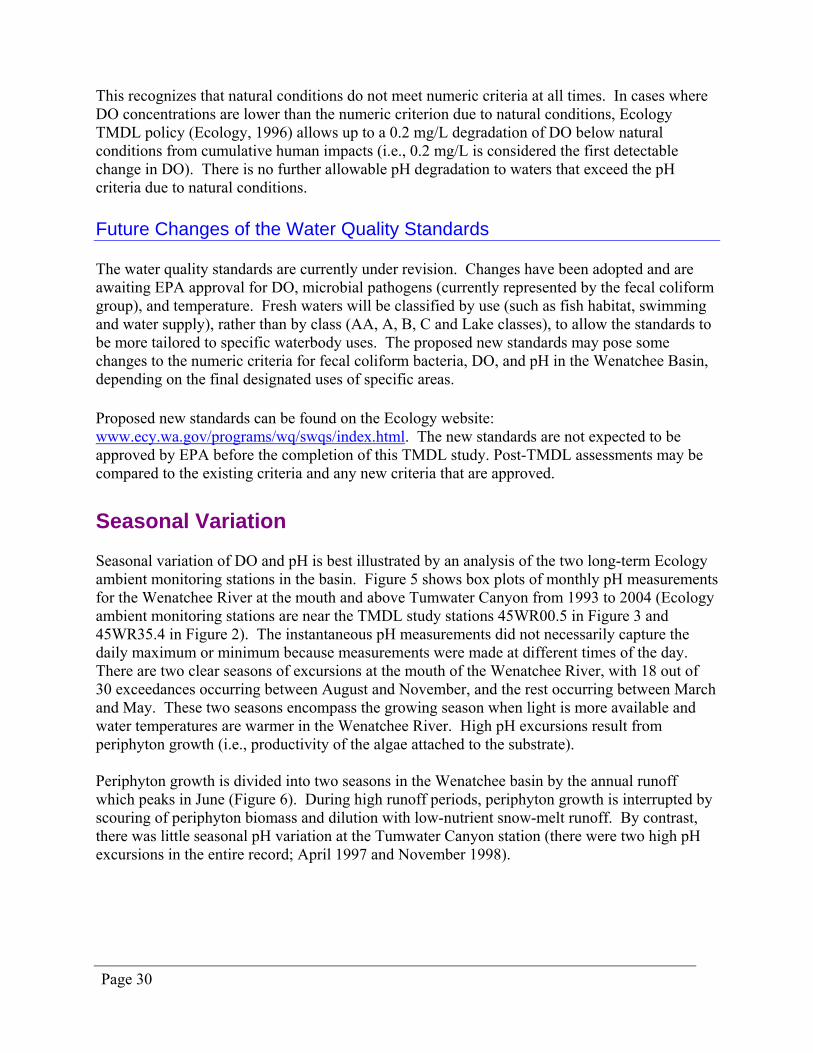
This recognizes that natural conditions do not meet numeric criteria at all times. In cases where DO concentrations are lower than the numeric criterion due to natural conditions, Ecology TMDL policy (Ecology, 1996) allows up to a 0.2 mg/L degradation of DO below natural conditions from cumulative human impacts (i.e., 0.2 mg/L is considered the first detectable change in DO). There is no further allowable pH degradation to waters that exceed the pH criteria due to natural conditions. Future Changes of the Water Quality Standards The water quality standards are currently under revision. Changes have been adopted and are awaiting EPA approval for DO, microbial pathogens (currently represented by the fecal coliform group), and temperature. Fresh waters will be classified by use (such as fish habitat, swimming and water supply), rather than by class (AA, A, B, C and Lake classes), to allow the standards to be more tailored to specific waterbody uses. The proposed new standards may pose some changes to the numeric criteria for fecal coliform bacteria, DO, and pH in the Wenatchee Basin, depending on the final designated uses of specific areas. Proposed new standards can be found on the Ecology website: www.ecy.wa.gov/programs/wq/swqs/index.html. The new standards are not expected to be approved by EPA before the completion of this TMDL study. Post-TMDL assessments may be compared to the existing criteria and any new criteria that are approved.
Seasonal Variation Seasonal variation of DO and pH is best illustrated by an analysis of the two long-term Ecology ambient monitoring stations in the basin. Figure 5 shows box plots of monthly pH measurements for the Wenatchee River at the mouth and above Tumwater Canyon from 1993 to 2004 (Ecology ambient monitoring stations are near the TMDL study stations 45WR00.5 in Figure 3 and 45WR35.4 in Figure 2). The instantaneous pH measurements did not necessarily capture the daily maximum or minimum because measurements were made at different times of the day. There are two clear seasons of excursions at the mouth of the Wenatchee River, with 18 out of 30 exceedances occurring between August and November, and the rest occurring between March and May. These two seasons encompass the growing season when light is more available and water temperatures are warmer in the Wenatchee River. High pH excursions result from periphyton growth (i.e., productivity of the algae attached to the substrate). Periphyton growth is divided into two seasons in the Wenatchee basin by the annual runoff which peaks in June (Figure 6). During high runoff periods, periphyton growth is interrupted by scouring of periphyton biomass and dilution with low-nutrient snow-melt runoff. By contrast, there was little seasonal pH variation at the Tumwater Canyon station (there were two high pH excursions in the entire record; April 1997 and November 1998).
Page 30
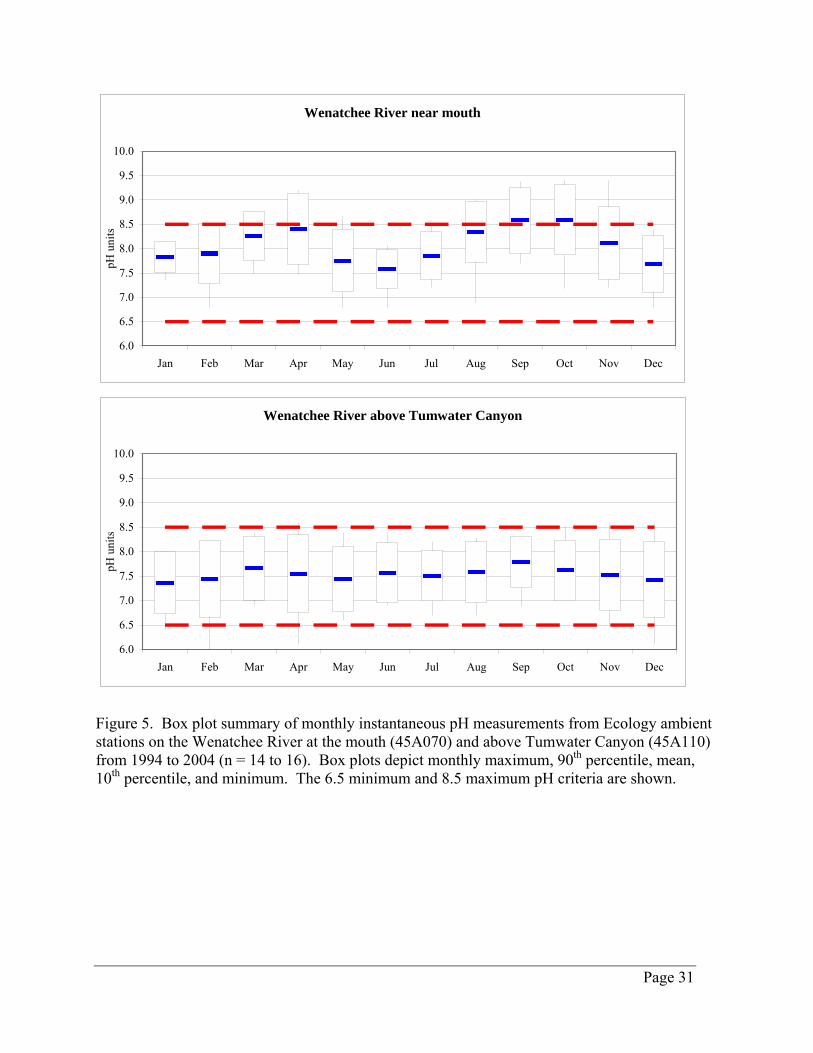
Wenatchee River near mouth
6.0
6.5
7.0
7.5
8.0
8.5
9.0
9.5
10.0
Jan Feb Mar Apr May Jun Jul Aug Sep Oct Nov Dec
pH u
nits
Wenatchee River above Tumwater Canyon
6.0
6.5
7.0
7.5
8.0
8.5
9.0
9.5
10.0
Jan Feb Mar Apr May Jun Jul Aug Sep Oct Nov Dec
pH u
nits
Figure 5. Box plot summary of monthly instantaneous pH measurements from Ecology ambient stations on the Wenatchee River at the mouth (45A070) and above Tumwater Canyon (45A110) from 1994 to 2004 (n = 14 to 16). Box plots depict monthly maximum, 90th percentile, mean, 10th percentile, and minimum. The 6.5 minimum and 8.5 maximum pH criteria are shown.
Page 31
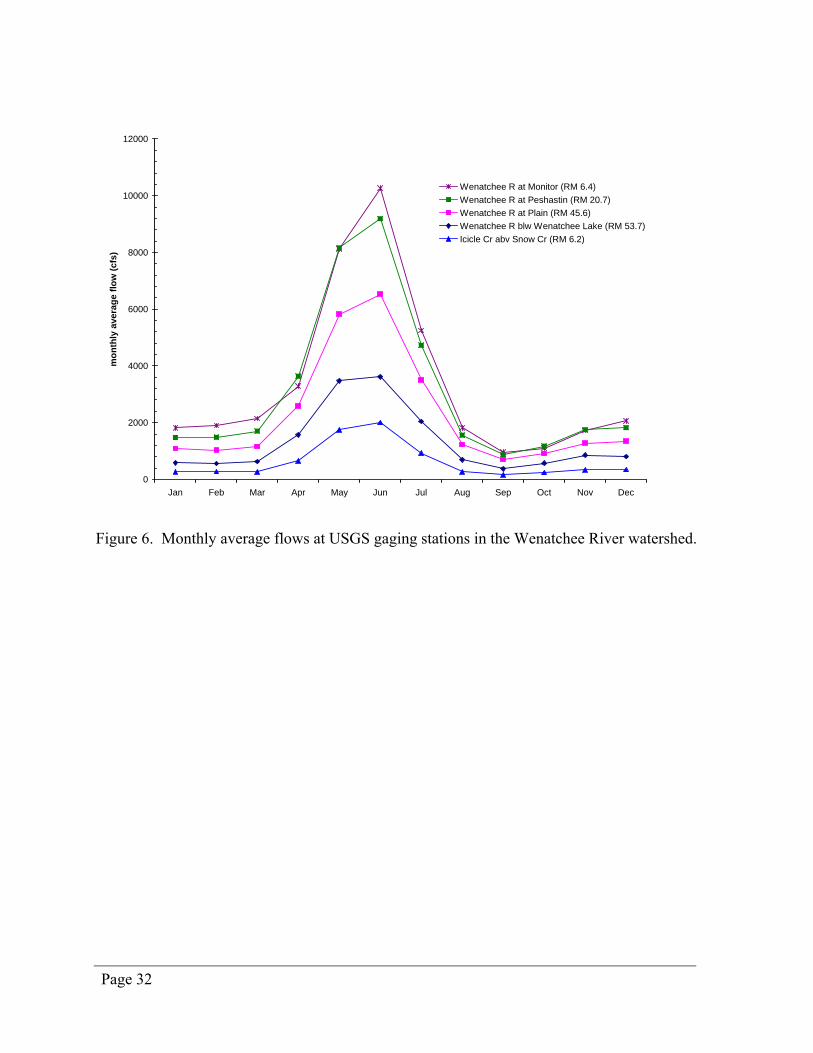
0
2000
4000
6000
8000
10000
12000
Jan Feb Mar Apr May Jun Jul Aug Sep Oct Nov Dec
mon
thly
ave
rage
flow
(cfs
)
Wenatchee R at Monitor (RM 6.4)Wenatchee R at Peshastin (RM 20.7)Wenatchee R at Plain (RM 45.6)Wenatchee R blw Wenatchee Lake (RM 53.7)Icicle Cr abv Snow Cr (RM 6.2)
Figure 6. Monthly average flows at USGS gaging stations in the Wenatchee River watershed.
Page 32

Figure 7 shows box plots of monthly instantaneous DO samples for the Wenatchee River at the mouth and above Tumwater Canyon taken by Ecology from 1993 to 2004. The instantaneous DO measurements did not necessarily capture the daily minimum because they were made during daylight hours when photosynthesis is increasing water column DO. Above Tumwater Canyon, low DO (including many readings below the Class AA criterion of 9.5 mg/L) occurred from mid-July to mid-September. July through September is the season of highest water temperatures and lowest flow in the Wenatchee River. By contrast, at the mouth, DO readings did not drop below the Class A water quality criterion of 8.0 mg/L; but again, measurements were made during daylight hours when daily DO was not at its minimum. The lowest DO measurements at the mouth also occurred from July through September. Figure 8 shows box plots of monthly instantaneous DO deficits (departure from DO saturation concentrations) for the Wenatchee River at the mouth and above Tumwater Canyon from 1993 to 2004. Again, the measurements were made during daylight hours when photosynthesis contributed to over-saturated conditions. The DO deficits do not necessarily reflect the maximum DO departure, either, because the measurements were made at different times of the day. At the mouth, the greatest DO concentrations above saturation (mean DO deficit > 1.0 mg/L) occurred in March/April and August to October, concurrent with the highest periphyton growth periods in the lower Wenatchee River. By contrast, the Tumwater Canyon station monthly mean DO deficits were minimal, although there was more variability from October to December. Ecology does not have long-term ambient monitoring stations on Icicle Creek; however, the Chelan County Conservation District monitored two sites in 1992-93. At the East Leavenworth Road bridge station, low DO and pH excursions from water quality criteria generally occurred in late summer (September-October). At the Bridge Creek station, DO values below the Class AA 9.5 mg/L criterion generally occurred between July and November. All historical data indicate that the season of concern for pH and DO is during the periphyton growing season from March through October, when biomass and growth are greatest. This season is interrupted from May through July due to spring runoff. There were a few pH excursions extending into the winter months of November and December. These are most likely due to periphyton biomass accumulation through the summer and fall growing season; biomass control during the growing season will likely mitigate winter-time excursions.
Page 33
Wenatchee River near mouth
6
8
10
12
14
16
18
Jan Feb Mar Apr May Jun Jul Aug Sep Oct Nov Dec
Dis
solv
ed O
xyge
n (m
g/L)
Wenatchee River above Tumwater Canyon
6
8
10
12
14
16
18
Jan Feb Mar Apr May Jun Jul Aug Sep Oct Nov Dec
Dis
solv
ed O
xyge
n (m
g/L)
Figure 7. Box plot summary of monthly instantaneous dissolved oxygen measurements from Ecology ambient stations on the Wenatchee River at the mouth (45A070) and above Tumwater Canyon (45A110) from 1994 to 2004 (n = 14 to 16). The mouth is Class A water, and above Tumwater Canyon is Class AA water. Box plots depict monthly maximum, 90th percentile, mean, 10th percentile, and minimum. The Class A (8.0 mg/L) and Class AA (9.5 mg/L) dissolved oxygen criteria are shown for each respective station.
Page 34

Wenatchee River near mouth
-3
-2
-1
0
1
2
3
4
Jan Feb Mar Apr May Jun Jul Aug Sep Oct Nov Dec
Dis
solv
ed O
xyge
n de
ficit
(mg/
L)
Wenatchee River above Tumwater Canyon
-3
-2
-1
0
1
2
3
4
Jan Feb Mar Apr May Jun Jul Aug Sep Oct Nov Dec
Dis
solv
ed O
xyge
n de
ficit
(mg/
L)
Figure 8. Box plot summary of monthly instantaneous dissolved oxygen deficit measurements, relative to saturation, from Ecology ambient stations on the Wenatchee River at the mouth (45A070) and above Tumwater Canyon (45A110) from 1994 to 2004 (n = 14 to 16). Box plots depict monthly maximum, 90th percentile, mean, 10th percentile, and minimum.
Page 35
Wenatchee River and Icicle Creek 2002-03 Data Results In accordance with the seasons of concern, Ecology conducted monthly synoptic surveys from July to October 2002 and one synoptic survey in April 2003 in the Wenatchee River and Icicle Creek. A synoptic survey is defined as data collection from many sampling sites over a short time interval. In addition to the synoptic surveys, core stations were sampled once a month from June 2002 to January 2003, concurrent with synoptic surveys when applicable, to develop time series data. Flow conditions are an important consideration when conducting TMDL studies. Ecology defines the critical low-flow river condition for TMDL studies to be the 7-day-average low-flow with a reoccurrence interval of once every 10 years on the average (7Q10) (i.e., a 10th percentile flow). The seasonal (July through October) 7Q10 for the Wenatchee River at Monitor is 344 cfs (based on the 1962 to 2003 USGS record at Monitor). The 2002 seasonal 7-day low-flow was 406 cfs (or approximately a 20th percentile flow). This means that water quality standard exceedances observed in 2002 might be worse in a critical year with 7Q10 conditions. The following is a brief review of the data results for these parameters, including a summary of observed water quality standard exceedances during 2002-03. Dissolved Oxygen and pH Class AA reaches Continuous and instantaneous (grab sample) data show that DO concentrations in the Wenatchee River and Icicle Creek were sometimes below the DO criterion of 9.5 mg/L in their respective Class AA water segments. The Class AA waters begin and continue upstream from the first junction with the Wenatchee National Forest boundary. The Wenatchee National Forest boundaries occur just upstream of Leavenworth within Tumwater Canyon on the Wenatchee River and just upstream of the Leavenworth National Fish Hatchery on Icicle Creek. Private land ownership is interspersed with public ownership above these Class AA boundaries. At least nine out of 25 continuous data-logger, time-series data sets from eight Class AA reaches of the Wenatchee River, Icicle Creek, or their tributaries showed DO concentrations less than the 9.5 mg/L criterion during at least part of the day. Most DO time-series showing excursions were from the late August survey when water temperatures were warm (>18.0 C) and diel water temperature change was approximately 3-4 °C. DO excursions below 9.5 mg/L also occurred during the July and September surveys. Figure 9 is an example of the data-logger continuous data from one Class AA site. The diel change in DO concentration in this Class AA reach was mostly due to the diel change in water temperature which, in combination with the higher land elevations, affected the DO solubility in water (i.e., temperature is the main factor causing the DO excursions). When water temperatures dropped, the DO solubility increased and DO diffused into the water through reaeration. When the water temperature rose, the DO solubility decreased and DO diffused to the atmosphere. The lag (i.e., phase shift) in the observed DO data curve peak from the DO saturation curve peak is
Page 36

due to a delay in reaeration and is an indirect measurement of the reaeration rate for the conditions at that particular site and time. Cristea and Pelletier (2005) used effective shade as a surrogate for thermal load in developing a temperature TMDL for the Wenatchee River watershed. They found that during critical conditions the site-potential effective shade in some places was not sufficient to meet the numeric water temperature criteria, implying that, at times, natural conditions may exceed the numeric temperature criteria (in which case the natural condition becomes the criterion). It should be noted that even when the water temperatures met the Class AA criterion of 16º C, DO concentrations of less than 9.5 mg/L were observed (Figure 9), because the DO saturation was below 9.5 mg/L. In these Class AA reaches, natural DO concentrations will be less than 9.5 mg/L during the summer months due to the high land elevations and high water temperatures.
6
7
8
9
10
11
12
8/25/2002 18:00 8/26/2002 0:00 8/26/2002 6:00 8/26/2002 12:00 8/26/2002 18:00
pH (s
tand
ard
units
), D
O (m
g/L)
, DO
sa
tura
tion
(mg/
L)
6
8
10
12
14
16
18
20
Tem
pera
ture
(C)
DO and DO standard pH and pH standards DO saturation TEMP
Figure 9. Continuous dissolved oxygen, pH, and temperature data from the Wenatchee River at the Tumwater Canyon Highway 2 bridge (station 45WR35.4) for August 25-26, 2002.
Page 37
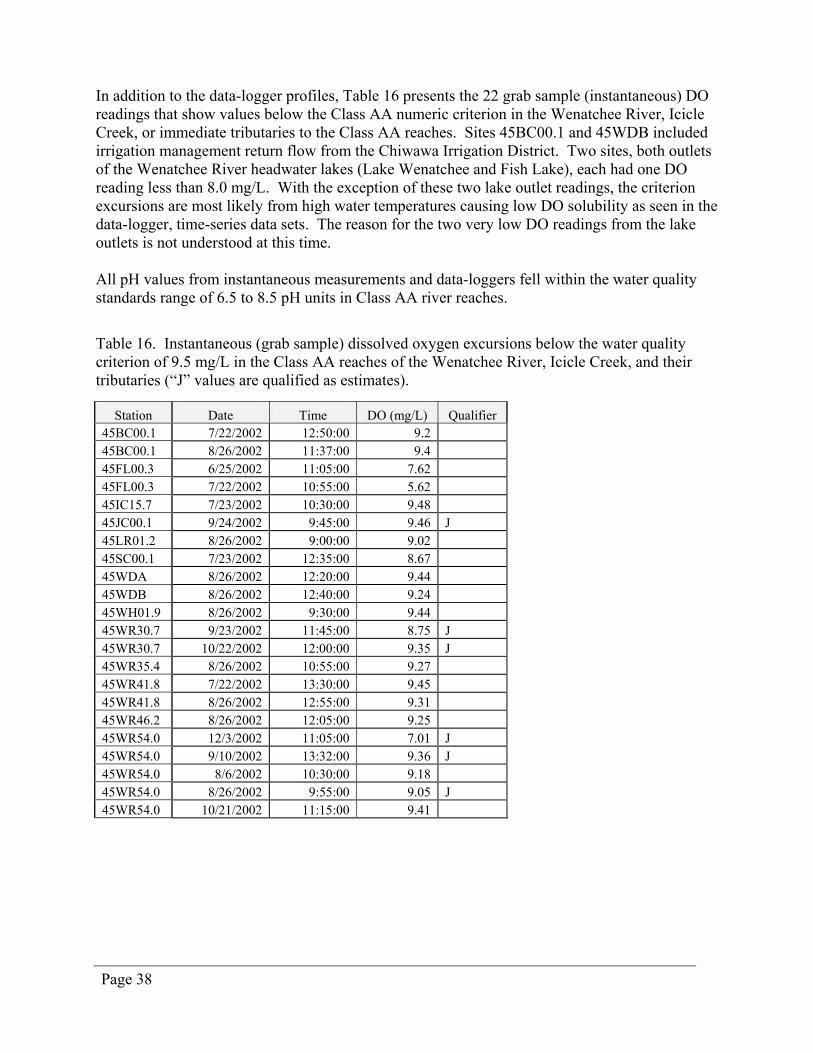
In addition to the data-logger profiles, Table 16 presents the 22 grab sample (instantaneous) DO readings that show values below the Class AA numeric criterion in the Wenatchee River, Icicle Creek, or immediate tributaries to the Class AA reaches. Sites 45BC00.1 and 45WDB included irrigation management return flow from the Chiwawa Irrigation District. Two sites, both outlets of the Wenatchee River headwater lakes (Lake Wenatchee and Fish Lake), each had one DO reading less than 8.0 mg/L. With the exception of these two lake outlet readings, the criterion excursions are most likely from high water temperatures causing low DO solubility as seen in the data-logger, time-series data sets. The reason for the two very low DO readings from the lake outlets is not understood at this time. All pH values from instantaneous measurements and data-loggers fell within the water quality standards range of 6.5 to 8.5 pH units in Class AA river reaches. Table 16. Instantaneous (grab sample) dissolved oxygen excursions below the water quality criterion of 9.5 mg/L in the Class AA reaches of the Wenatchee River, Icicle Creek, and their tributaries (“J” values are qualified as estimates).
Station Date Time DO (mg/L) Qualifier 45BC00.1 7/22/2002 12:50:00 9.2 45BC00.1 8/26/2002 11:37:00 9.4 45FL00.3 6/25/2002 11:05:00 7.62 45FL00.3 7/22/2002 10:55:00 5.62 45IC15.7 7/23/2002 10:30:00 9.48 45JC00.1 9/24/2002 9:45:00 9.46 J 45LR01.2 8/26/2002 9:00:00 9.02 45SC00.1 7/23/2002 12:35:00 8.67 45WDA 8/26/2002 12:20:00 9.44 45WDB 8/26/2002 12:40:00 9.24 45WH01.9 8/26/2002 9:30:00 9.44 45WR30.7 9/23/2002 11:45:00 8.75 J 45WR30.7 10/22/2002 12:00:00 9.35 J 45WR35.4 8/26/2002 10:55:00 9.27 45WR41.8 7/22/2002 13:30:00 9.45 45WR41.8 8/26/2002 12:55:00 9.31 45WR46.2 8/26/2002 12:05:00 9.25 45WR54.0 12/3/2002 11:05:00 7.01 J 45WR54.0 9/10/2002 13:32:00 9.36 J 45WR54.0 8/6/2002 10:30:00 9.18 45WR54.0 8/26/2002 9:55:00 9.05 J 45WR54.0 10/21/2002 11:15:00 9.41
Page 38
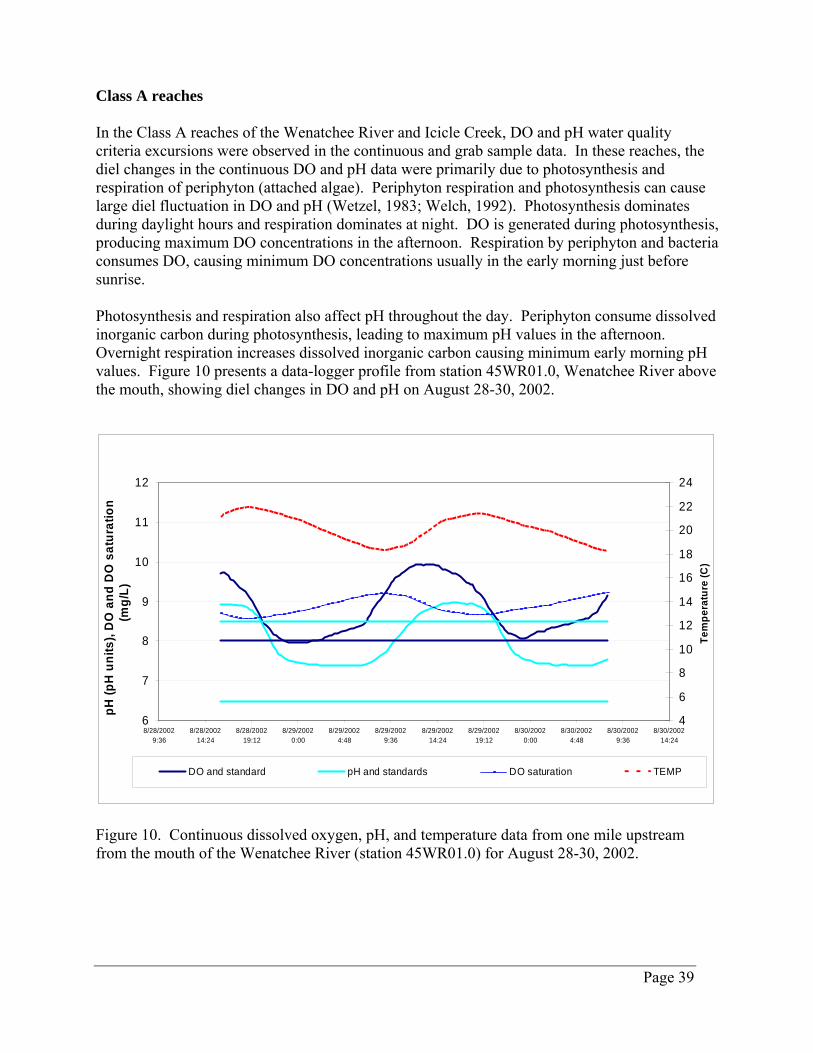
Class A reaches In the Class A reaches of the Wenatchee River and Icicle Creek, DO and pH water quality criteria excursions were observed in the continuous and grab sample data. In these reaches, the diel changes in the continuous DO and pH data were primarily due to photosynthesis and respiration of periphyton (attached algae). Periphyton respiration and photosynthesis can cause large diel fluctuation in DO and pH (Wetzel, 1983; Welch, 1992). Photosynthesis dominates during daylight hours and respiration dominates at night. DO is generated during photosynthesis, producing maximum DO concentrations in the afternoon. Respiration by periphyton and bacteria consumes DO, causing minimum DO concentrations usually in the early morning just before sunrise. Photosynthesis and respiration also affect pH throughout the day. Periphyton consume dissolved inorganic carbon during photosynthesis, leading to maximum pH values in the afternoon. Overnight respiration increases dissolved inorganic carbon causing minimum early morning pH values. Figure 10 presents a data-logger profile from station 45WR01.0, Wenatchee River above the mouth, showing diel changes in DO and pH on August 28-30, 2002.
6
7
8
9
10
11
12
8/28/20029:36
8/28/200214:24
8/28/200219:12
8/29/20020:00
8/29/20024:48
8/29/20029:36
8/29/200214:24
8/29/200219:12
8/30/20020:00
8/30/20024:48
8/30/20029:36
8/30/200214:24
pH (p
H u
nits
), D
O a
nd D
O s
atur
atio
n (m
g/L)
4
6
8
10
12
14
16
18
20
22
24
Tem
pera
ture
(C)
DO and standard pH and standards DO saturation TEMP
Figure 10. Continuous dissolved oxygen, pH, and temperature data from one mile upstream from the mouth of the Wenatchee River (station 45WR01.0) for August 28-30, 2002.
Page 39
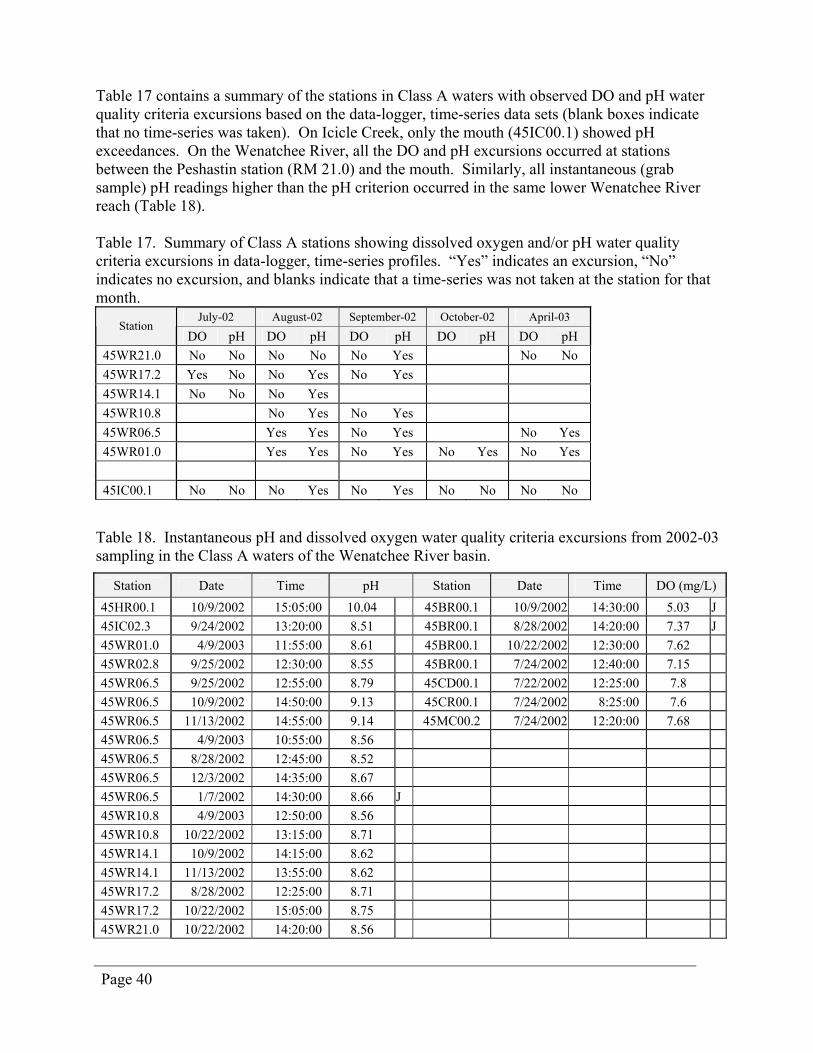
Table 17 contains a summary of the stations in Class A waters with observed DO and pH water quality criteria excursions based on the data-logger, time-series data sets (blank boxes indicate that no time-series was taken). On Icicle Creek, only the mouth (45IC00.1) showed pH exceedances. On the Wenatchee River, all the DO and pH excursions occurred at stations between the Peshastin station (RM 21.0) and the mouth. Similarly, all instantaneous (grab sample) pH readings higher than the pH criterion occurred in the same lower Wenatchee River reach (Table 18). Table 17. Summary of Class A stations showing dissolved oxygen and/or pH water quality criteria excursions in data-logger, time-series profiles. “Yes” indicates an excursion, “No” indicates no excursion, and blanks indicate that a time-series was not taken at the station for that month.
July-02 August-02 September-02 October-02 April-03 Station
DO pH DO pH DO pH DO pH DO pH 45WR21.0 No No No No No Yes No No 45WR17.2 Yes No No Yes No Yes 45WR14.1 No No No Yes 45WR10.8 No Yes No Yes 45WR06.5 Yes Yes No Yes No Yes 45WR01.0 Yes Yes No Yes No Yes No Yes 45IC00.1 No No No Yes No Yes No No No No
Table 18. Instantaneous pH and dissolved oxygen water quality criteria excursions from 2002-03 sampling in the Class A waters of the Wenatchee River basin.
Station Date Time pH Station Date Time DO (mg/L) 45HR00.1 10/9/2002 15:05:00 10.04 45BR00.1 10/9/2002 14:30:00 5.03 J 45IC02.3 9/24/2002 13:20:00 8.51 45BR00.1 8/28/2002 14:20:00 7.37 J 45WR01.0 4/9/2003 11:55:00 8.61 45BR00.1 10/22/2002 12:30:00 7.62 45WR02.8 9/25/2002 12:30:00 8.55 45BR00.1 7/24/2002 12:40:00 7.15 45WR06.5 9/25/2002 12:55:00 8.79 45CD00.1 7/22/2002 12:25:00 7.8 45WR06.5 10/9/2002 14:50:00 9.13 45CR00.1 7/24/2002 8:25:00 7.6 45WR06.5 11/13/2002 14:55:00 9.14 45MC00.2 7/24/2002 12:20:00 7.68 45WR06.5 4/9/2003 10:55:00 8.56 45WR06.5 8/28/2002 12:45:00 8.52 45WR06.5 12/3/2002 14:35:00 8.67 45WR06.5 1/7/2002 14:30:00 8.66 J 45WR10.8 4/9/2003 12:50:00 8.56 45WR10.8 10/22/2002 13:15:00 8.71 45WR14.1 10/9/2002 14:15:00 8.62 45WR14.1 11/13/2002 13:55:00 8.62 45WR17.2 8/28/2002 12:25:00 8.71 45WR17.2 10/22/2002 15:05:00 8.75 45WR21.0 10/22/2002 14:20:00 8.56
Page 40
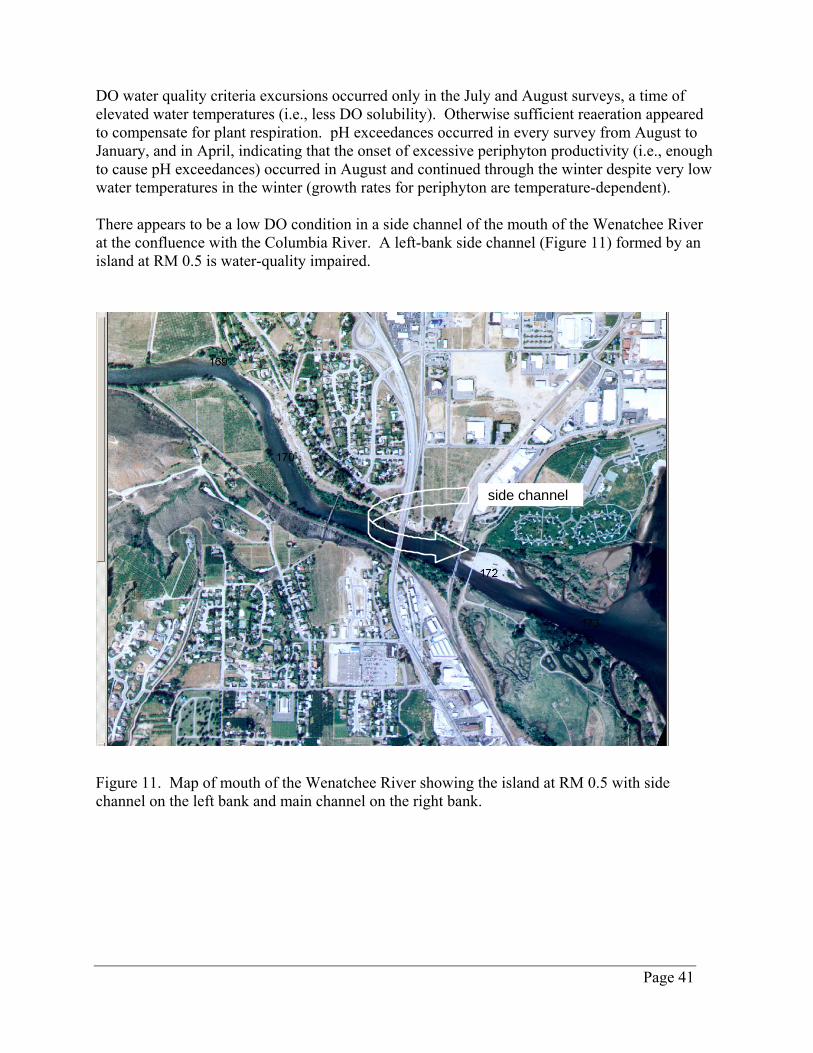
DO water quality criteria excursions occurred only in the July and August surveys, a time of elevated water temperatures (i.e., less DO solubility). Otherwise sufficient reaeration appeared to compensate for plant respiration. pH exceedances occurred in every survey from August to January, and in April, indicating that the onset of excessive periphyton productivity (i.e., enough to cause pH exceedances) occurred in August and continued through the winter despite very low water temperatures in the winter (growth rates for periphyton are temperature-dependent). There appears to be a low DO condition in a side channel of the mouth of the Wenatchee River at the confluence with the Columbia River. A left-bank side channel (Figure 11) formed by an island at RM 0.5 is water-quality impaired.
side channelside channel
Figure 11. Map of mouth of the Wenatchee River showing the island at RM 0.5 with side channel on the left bank and main channel on the right bank.
Page 41

A data-logger deployment on August 28, 2002 in the side channel showed DO levels dropping to below 6 mg/L (Figure 12). Oscillations (upstream and downstream movement of water) were visible on this date and are indicated in the DO profile as up and down spikes. Complex hydro-dynamics within this side channel create a back flow of water depending on changes in the level of the Columbia River (perhaps from daily adjustment at Rock Island Dam for power generation or from upstream surges). The data show a dominating diel effect due to algal photosynthesis and respiration, but the low DO may be exacerbated by oxidation of organic matter interned in this side channel, and/or reduced reaeration due to the rising water of the Columbia River. The deleterious DO effects seen in 2002 could be worse during 7Q10 critical flow conditions.
4
5
6
7
8
9
10
8/27/200216:48
8/27/200219:12
8/27/200221:36
8/28/20020:00
8/28/20022:24
8/28/20024:48
8/28/20027:12
8/28/20029:36
8/28/200212:00
8/28/200214:24
8/28/200216:48
pH (s
tand
ard
units
), D
O (m
g/L)
15
17
19
21
23
25
Tem
pera
ture
(C)
DO and DO standard pH and pH standards control TEMP
Figure 12. Diel data collected with a data logger at the mouth of the Wenatchee River (station 45WR00.5) on August 27-28, 2002.
Page 42
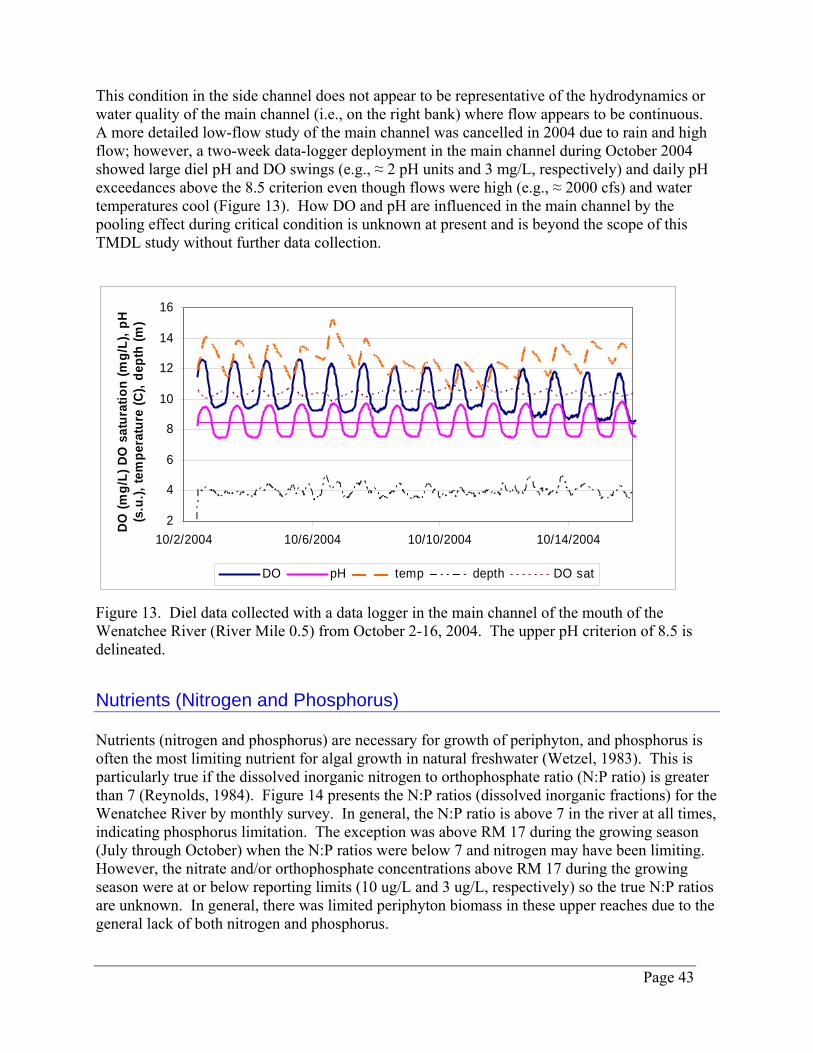
This condition in the side channel does not appear to be representative of the hydrodynamics or water quality of the main channel (i.e., on the right bank) where flow appears to be continuous. A more detailed low-flow study of the main channel was cancelled in 2004 due to rain and high flow; however, a two-week data-logger deployment in the main channel during October 2004 showed large diel pH and DO swings (e.g., ≈ 2 pH units and 3 mg/L, respectively) and daily pH exceedances above the 8.5 criterion even though flows were high (e.g., ≈ 2000 cfs) and water temperatures cool (Figure 13). How DO and pH are influenced in the main channel by the pooling effect during critical condition is unknown at present and is beyond the scope of this TMDL study without further data collection.
2
4
6
8
10
12
14
16
10/2/2004 10/6/2004 10/10/2004 10/14/2004
DO
(mg/
L) D
O s
atur
atio
n (m
g/L)
, pH
(s.u
.), te
mpe
ratu
re (C
), de
pth
(m)
DO pH temp depth DO sat
Figure 13. Diel data collected with a data logger in the main channel of the mouth of the Wenatchee River (River Mile 0.5) from October 2-16, 2004. The upper pH criterion of 8.5 is delineated. Nutrients (Nitrogen and Phosphorus) Nutrients (nitrogen and phosphorus) are necessary for growth of periphyton, and phosphorus is often the most limiting nutrient for algal growth in natural freshwater (Wetzel, 1983). This is particularly true if the dissolved inorganic nitrogen to orthophosphate ratio (N:P ratio) is greater than 7 (Reynolds, 1984). Figure 14 presents the N:P ratios (dissolved inorganic fractions) for the Wenatchee River by monthly survey. In general, the N:P ratio is above 7 in the river at all times, indicating phosphorus limitation. The exception was above RM 17 during the growing season (July through October) when the N:P ratios were below 7 and nitrogen may have been limiting. However, the nitrate and/or orthophosphate concentrations above RM 17 during the growing season were at or below reporting limits (10 ug/L and 3 ug/L, respectively) so the true N:P ratios are unknown. In general, there was limited periphyton biomass in these upper reaches due to the general lack of both nitrogen and phosphorus.
Page 43
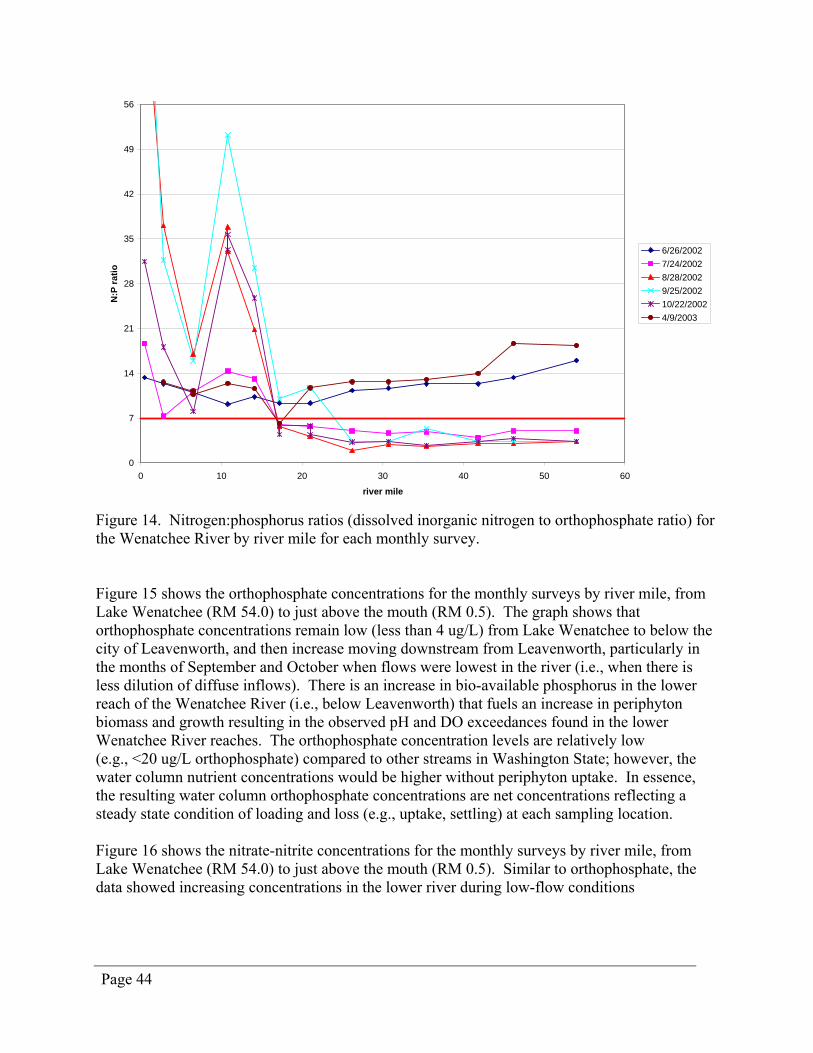
0
7
14
21
28
35
42
49
56
0 10 20 30 40 50 60
river mile
N:P
ratio
6/26/20027/24/20028/28/20029/25/200210/22/20024/9/2003
Figure 14. Nitrogen:phosphorus ratios (dissolved inorganic nitrogen to orthophosphate ratio) for the Wenatchee River by river mile for each monthly survey. Figure 15 shows the orthophosphate concentrations for the monthly surveys by river mile, from Lake Wenatchee (RM 54.0) to just above the mouth (RM 0.5). The graph shows that orthophosphate concentrations remain low (less than 4 ug/L) from Lake Wenatchee to below the city of Leavenworth, and then increase moving downstream from Leavenworth, particularly in the months of September and October when flows were lowest in the river (i.e., when there is less dilution of diffuse inflows). There is an increase in bio-available phosphorus in the lower reach of the Wenatchee River (i.e., below Leavenworth) that fuels an increase in periphyton biomass and growth resulting in the observed pH and DO exceedances found in the lower Wenatchee River reaches. The orthophosphate concentration levels are relatively low (e.g., <20 ug/L orthophosphate) compared to other streams in Washington State; however, the water column nutrient concentrations would be higher without periphyton uptake. In essence, the resulting water column orthophosphate concentrations are net concentrations reflecting a steady state condition of loading and loss (e.g., uptake, settling) at each sampling location. Figure 16 shows the nitrate-nitrite concentrations for the monthly surveys by river mile, from Lake Wenatchee (RM 54.0) to just above the mouth (RM 0.5). Similar to orthophosphate, the data showed increasing concentrations in the lower river during low-flow conditions
Page 44
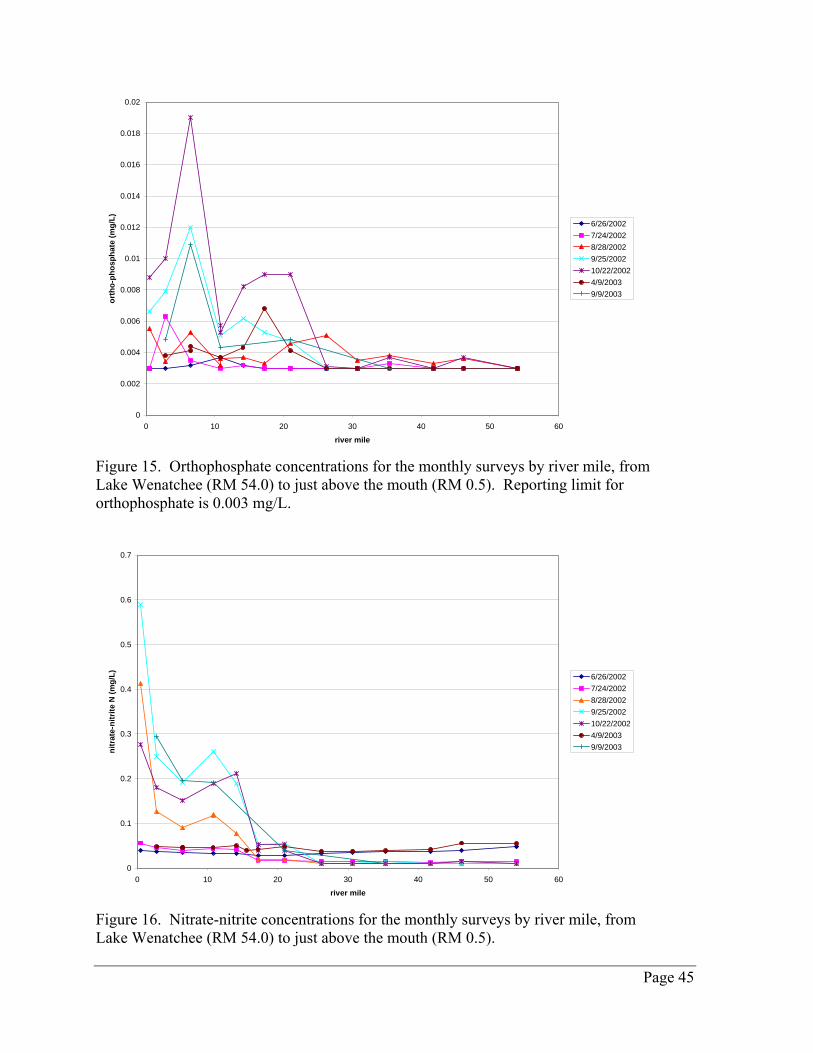
0
0.002
0.004
0.006
0.008
0.01
0.012
0.014
0.016
0.018
0.02
0 10 20 30 40 50 60
river mile
orth
o-ph
osph
ate
(mg/
L) 6/26/20027/24/20028/28/20029/25/200210/22/20024/9/20039/9/2003
Figure 15. Orthophosphate concentrations for the monthly surveys by river mile, from Lake Wenatchee (RM 54.0) to just above the mouth (RM 0.5). Reporting limit for orthophosphate is 0.003 mg/L.
0
0.1
0.2
0.3
0.4
0.5
0.6
0.7
0 10 20 30 40 50 60
river mile
nitr
ate-
nitr
ite N
(mg/
L) 6/26/20027/24/20028/28/20029/25/200210/22/20024/9/20039/9/2003
Figure 16. Nitrate-nitrite concentrations for the monthly surveys by river mile, from Lake Wenatchee (RM 54.0) to just above the mouth (RM 0.5).
Page 45
Sources of Phosphorus and Biochemical Oxygen Demand (BOD) Five facilities have individual National Pollutant Discharge Elimination System (NPDES) permits for discharging to either Icicle Creek or the Wenatchee River. Effluent from the following facilities was sampled for this TMDL study: Icicle Creek
• City of Leavenworth Water Treatment Plant (WTP) Wenatchee River
• Lake Wenatchee Publicly-Owned Treatment Works (POTW) (influent station name: LAKEWNI; effluent station name: LAKEWNE)
• City of Leavenworth POTW (station name: LEAVWWTP) • City of Peshastin POTW (station name: PESHTN) • City of Cashmere POTW (station name: CASHMR) Appendix A and B contain a summary of the permit limits for these facilities and a synopsis of field notes taken during the sampling surveys. The following fruit processors have a general permit to discharge non-contact cooling water to the Wenatchee River. These fruit processors were also sampled for this TMDL study:
• Bardin Farms Corporation in Monitor • Blue Star Growers, Inc. in Cashmere • Blue Bird, Inc. in Peshastin The following fish hatcheries have an NPDES General Upland Fin-Fish Hatching and Rearing Discharge Permit for Icicle Creek, Wenatchee River, and/or the Chiwawa River:
• Leavenworth National Fish Hatchery [station names: 45LNFHA (abatement pond); 45LNFHD (return Ditch); 45LNFHO (main outlet); and 45LNFHS (below spillway)]
• Chiwawa Ponds Hatchery (station name: 45CW00.5) • Dryden Ponds Hatchery (station name: 45WR15.6) Irrigation water purveyors have recently been required by law to obtain an NPDES permit for discharge back to natural waterways if applying aquatic herbicides in their water canals or ditches. Aquatic weeds and periphyton within the irrigation canals as well as nonpoint sources to irrigation canals may contribute BOD and phosphorus loads to the Wenatchee system. The following irrigation water districts or purveyors divert and discharge to waters within the Wenatchee River basin:
• Icicle and Peshastin Creek Irrigation District • Cascade Orchards Irrigation District • Chiwawa Irrigation District
Page 46
• Wenatchee Reclamation District • Jones Shotwell Irrigation District • Gunn Ditch Irrigation District The following tributaries discharge to the Wenatchee River during the summer low-flow period: • Nason Creek. The Stevens Pass Sewer District has a small Class IV Advanced Wastewater
Treatment plant (tertiary treatment using a membrane bioreactor ultra-filtration process) that services the ski resort area and has an NPDES permit to discharge to Nason Creek.
• Chiwawa River. This river drains primarily Forest Service lands, although a community of private residences with on-site septic systems is established near the mouth of the river.
• Chiwaukum Creek. This creek drains primarily Forest Service lands, although a wastewater lagoon drains to groundwater near the mouth.
• Icicle Creek. This creek drains primarily Forest Service land but has multiple potential point and nonpoint source impacts from fish aquaculture, agriculture, and rural/urban sources.
• Chumstick Creek. This creek drains primarily Forest Service lands but has multiple potential nonpoint source impacts from both agricultural and rural/urban sources.
• Peshastin Creek. This creek drains primarily Forest Service lands, although Hwy 97 runs through the watershed.
• Mission Creek. This creek drains primarily Forest Service lands but has multiple potential nonpoint source impacts from both agricultural and urban sources.
Groundwater discharging to the Wenatchee River, Icicle Creek, and their tributaries also affects DO levels and nutrient concentrations. Groundwater discharges to the river or creeks in some reaches, and is recharged in other reaches. In the Wenatchee basin, background groundwater flow and BOD/nutrient concentrations may be elevated due to upland practices such as orchard irrigation and wastewater discharge to groundwater from on-site septic systems. In addition, nonpoint sources along the length of the river may be contributing BOD and nutrients. There may be high-concentration, nonpoint source areas associated with large community on-site septic systems, a high density of individual on-site septic systems, or failing public wastewater collection or treatment systems. Most notable examples of such possible sources are the City of Dryden POTW that discharges wastewater to a large community drainfield alongside the Wenatchee River (fruit processors also land apply process water here), and the City of Cashmere POTW sewage lagoons which have been confirmed to be leaking alongside the Wenatchee River. Other than the tributary, groundwater, and nonpoint loads described above, other nonpoint runoff sources along the mainstem of the river are probably relatively insignificant for this project because stormwater and combined sewer overflow discharges to the river do not occur during the period of concern. The contributions of BOD and nutrients from small discharges to the tributaries of the Wenatchee River and Icicle Creek were included as part of the tributary loading to the river, and not assessed as “discrete” loads for this study.
Page 47

Water Quality Modeling Water quality (periphyton production, pH, dissolved oxygen, and nutrients) was simulated in the Wenatchee River and Icicle Creek using the QUAL2K numerical model. Ultimately, since phosphorus is the limiting nutrient for the production of periphyton, the model was used to develop assimilative load capacities for phosphorus. Phosphorus controls periphyton growth which in turn controls excessive pH and dissolved oxygen diel swings. Eventually, the model will be used as a tool for developing a phosphorus allocation strategy to bring pH and dissolved oxygen into compliance with water quality standards in the Wenatchee basin. There are several important concepts in modeling periphyton productivity in running waters. First, only one nutrient can limit algal growth at a time. The limiting nutrient will be the nutrient that is in least supply relative to its demand. The QUAL2K model uses carbon-to-nitrogen-to-phosphorus stoichiometric ratios of 40:7:1 (expressed as percentages of biomass dry weight). These ratios define the relative demand of each nutrient for algal growth. Secondly, in rivers, it is important to limit the growth rate in order to control the algal biomass yield. The growth rate is only limited by the concentration of the most limiting nutrient (i.e., the supply rate of the limiting nutrient) because rivers transport a continual downstream supply of nutrients at steady-state conditions. Finally, it is appropriate to use the dissolved-fraction concentration of the limiting nutrient (i.e., dissolved inorganic-phosphorus) as the basis for modeling periphyton growth because the nutrient has to be in a readily available form for biological uptake and growth to occur during steady-state solute transport (Welch and Jacoby, 2004).
QUAL2K Model Structure and Approach QUAL2K is a one-dimensional, steady-state numerical model capable of simulating a variety of conservative and non-conservative water quality parameters (Chapra and Pelletier, 2003). QUAL2K is supported by EPA, and the model and documentation is available at the following EPA website: www.epa.gov/ATHENS/wwqtsc/html/qual2k.html. The State of Washington also supports a version of QUAL2K which has enhanced features and can be downloaded at www.ecy.wa.gov/programs/eap/models/index.html. QUAL2K assumes steady-state flow and hydraulics; however, the heat budget and temperature are simulated on a daily time scale. Diel variations in all water quality variables are simulated as well. QUAL2K was calibrated to model the Wenatchee River between RM 52.4 (Lake Wenatchee outlet) and RM 1.0. The model concluded at RM 1.0 because of inadequate field data at the mouth to calibrate the model to potential backwater conditions. QUAL2K was also calibrated to model Icicle Creek from above Jack Creek to the mouth. The following state variables were used to simulate steady-state water quality conditions: water temperature, conductivity, chloride, total dissolved solids, dissolved oxygen, carbonaceous biochemical oxygen demand (CBOD), alkalinity, total inorganic carbon, pH, periphyton biomass, nitrogen (N) in the forms of organic-N, ammonia-N, and nitrate-N, and phosphorus (P) in the forms of organic-P and dissolved inorganic-P (orthophosphate). The study portion of the Wenatchee River was divided into 84 one-kilometer reaches for QUAL2K modeling, and the study portion of Icicle Creek was
Page 48

divided into 60 one-half kilometer reaches. Tables of reaches are presented in Appendix D. Each reach was assumed to have uniform steady-state flow conditions. Temperature was simulated for the four synoptic surveys (July, August, and September 2002, and April 2003). To better understand seasonal hydrology and diffuse source inputs in the Wenatchee River, QUAL2K simulations were set up for the months of July to October and calibrated for flow and conservative tracers. For water quality calibration, two Wenatchee River and two Icicle Creek simulations were calibrated using data collected during the August and September 2002 field synoptic surveys. The August and September synoptic survey data provided unique critical-condition data sets (i.e., low-flow season). Only fixed model inputs (i.e., observed or measured flow, meteorology, and water quality data inputs) were changed between the two model runs. After an optimum calibration was achieved, the model was used to simulate critical-condition loading and 7Q10 flow conditions.
QUAL2K Model Calibration Fixed Model Inputs Hydrology QUAL2K uses flow-exponent power equations to functionally represent the hydraulic routing of the river. The flow-exponent equations relating velocity (V in m/sec), depth (D in m), and width (W in m) with flow (Q in cms) are written as follows (McCutcheon, 1989): V = a Qb D = c Qd W = eQf (equation 1) Flow and channel width relationships were developed by digitizing segment channel widths from aerial photos representing 2-3 different flows. Channel cross-section velocity data at USGS gage stations were used to develop flow and velocity relationships. The flow-exponent equations for lower Icicle Creek from RM 4.1 to the mouth were developed from an existing Icicle Creek HEC-RAS model (ENSR Consulting and Engineering, 2000). Flow balances were developed for each of the synoptic surveys using measured or gaged headwater, tributary, and point source inflows. Residual inflows and outflows were calculated from differences in the flow mass balance between USGS gaging stations. Residual flows were entered into the QUAL2K model as distributed diffuse inflows or outflows. Figure 17 presents the QUAL2K flow balances for the four synoptic surveys on the Wenatchee River, and Figure 18 presents the QUAL2K flow balances for the August and September synoptic surveys on Icicle Creek. Withdrawals in Icicle Creek nearly completely dewatered a portion of the channel in September 2002; the flow in Icicle Creek was restored downstream of the Leavenworth National Fish Hatchery by the hatchery’s discharge back to the creek.
Page 49
Page 50
Water velocity and hydraulic routing on the Wenatchee River was confirmed with a time-of-travel dye study conducted September 9-12, 2002 from Lake Wenatchee (RM 54.0) to the Sleepy Hollow bridge at RM 2.8. Comparison of the QUAL2K model fit to travel time data is shown in Figure 19. Appendix D includes the flow exponents and coefficients used in all the reaches for both the Wenatchee River and Icicle Creek QUAL2K models. Meteorology QUAL2K simulates diel variations in stream temperature and water quality for a steady flow condition. QUAL2K assumes that flow remains constant but allows meteorological variables to vary with time over the course of a day. Solar radiation (and shade), air temperature, relative humidity, headwater temperature, and tributary water temperatures were specified or simulated as diurnally varying functions. Meteorological data were estimated from data recorded at stations in the Wenatchee basin. QUAL2K uses kinetic formulations for the components of the surface water heat budget described in Chapra and Pelletier (2003). Water Quality Inputs Headwater, tributary, and point source water quality input conditions for the QUAL2K simulations were taken from data collected during synoptic surveys, including diel temperature, DO, and pH data collected from data-loggers. Appendix C contains tables of POTW and Leavenworth National Fish Hatchery point source data collected during synoptic surveys. The water quality characteristics of diffuse inflows (i.e., groundwater) affect the instream water quality of the Wenatchee River and Icicle Creek, particularly in the lower reaches. Calibration of the QUAL2K model involved selecting the temperature of diffuse inflows, ranging from the measured groundwater temperatures to observed surface water tributary temperatures. The groundwater DO concentration was assumed to be within the range of 6 to 12 mg/L, concentrations typically found in recently recharged groundwater (Matthess, 1982). Nutrient and chloride concentrations were selected from ranges found in Wenatchee River basin well waters. The groundwater databases of the USGS, Department of Health, and Ecology were used to develop water quality statistics for alkalinity, chloride, conductivity, nitrate, and inorganic-P (Appendix E). Groundwater water-quality statistics were developed for sub-areas which roughly corresponded to diffuse-source reach breaks in the model.
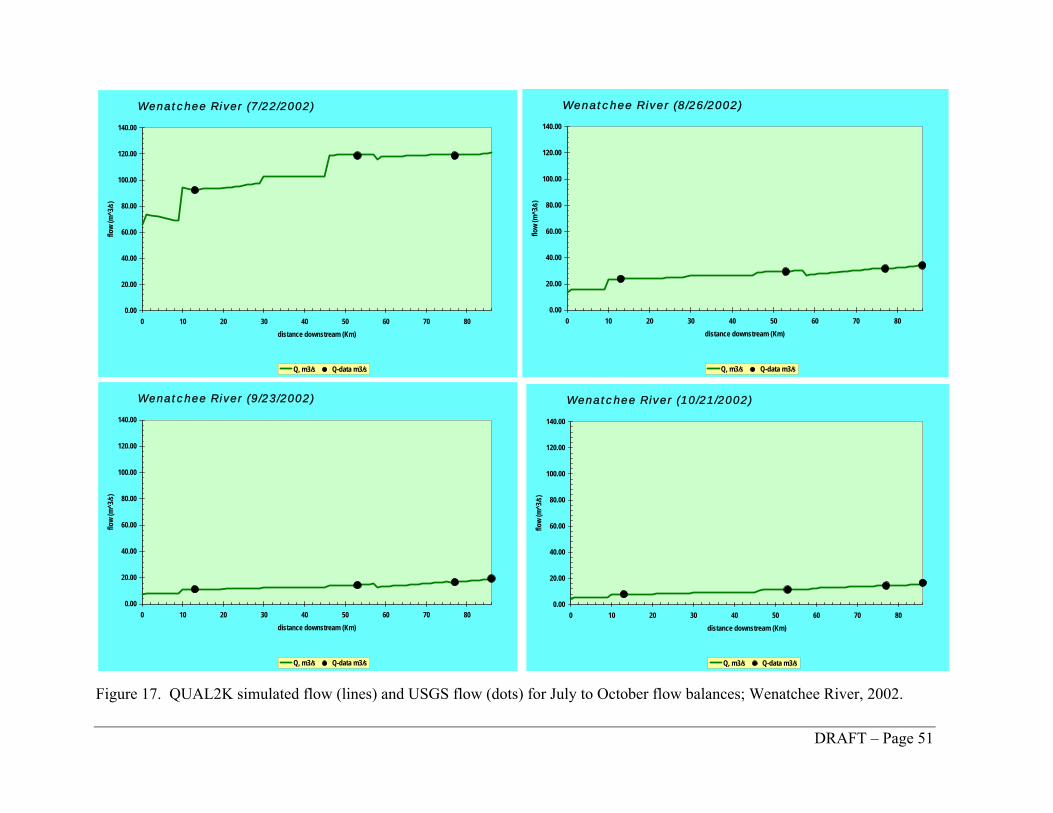
Wenatchee River (7/22/2002)
0.00
20.00
40.00
60.00
80.00
100.00
120.00
140.00
0 10 20 30 40 50 60 70 80distance downstream (Km)
flow
(m^3
/s)
Q, m3/s Q-data m3/s
Wenatchee River (8/26/2002)
0.00
20.00
40.00
60.00
80.00
100.00
120.00
140.00
0 10 20 30 40 50 60 70 80distance downstream (Km)
flow
(m^3
/s)
Q, m3/s Q-data m3/s Wenatchee River (9/23/2002)
0.00
20.00
40.00
60.00
80.00
100.00
120.00
140.00
0 10 20 30 40 50 60 70 80distance downstream (Km)
flow
(m^3
/s)
Q, m3/s Q-data m3/s
Wenatchee River (10/21/2002)
0.00
20.00
40.00
60.00
80.00
100.00
120.00
140.00
0 10 20 30 40 50 60 70 80distance downstream (Km)
flow
(m^3
/s)
Q, m3/s Q-data m3/s
DRAFT – Page 51
Figure 17. QUAL2K simulated flow (lines) and USGS flow (dots) for July to October flow balances; Wenatchee River, 2002.
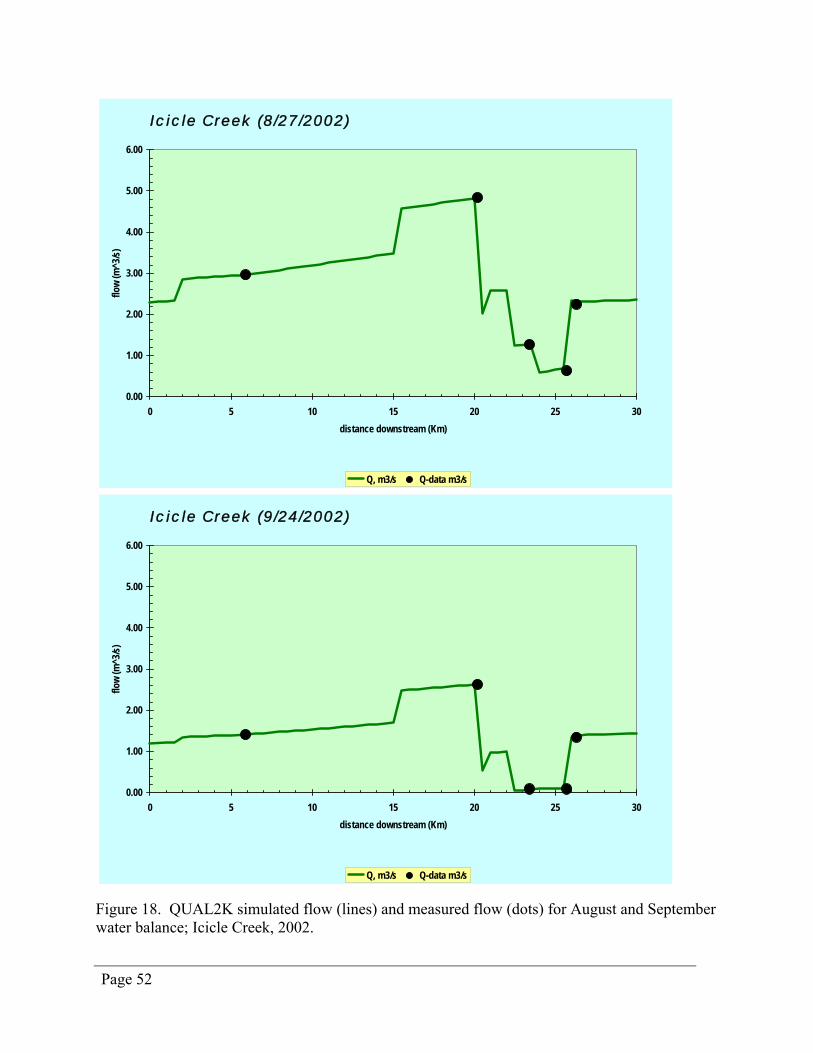
Icicle Creek (8/27/2002)
0.00
1.00
2.00
3.00
4.00
5.00
6.00
0 5 10 15 20 25 30distance downstream (Km)
flow
(m^3
/s)
Q, m3/s Q-data m3/s
Icicle Creek (9/24/2002)
0.00
1.00
2.00
3.00
4.00
5.00
6.00
0 5 10 15 20 25 30distance downstream (Km)
flow
(m^3
/s)
Q, m3/s Q-data m3/s Figure 18. QUAL2K simulated flow (lines) and measured flow (dots) for August and September water balance; Icicle Creek, 2002.
Page 52
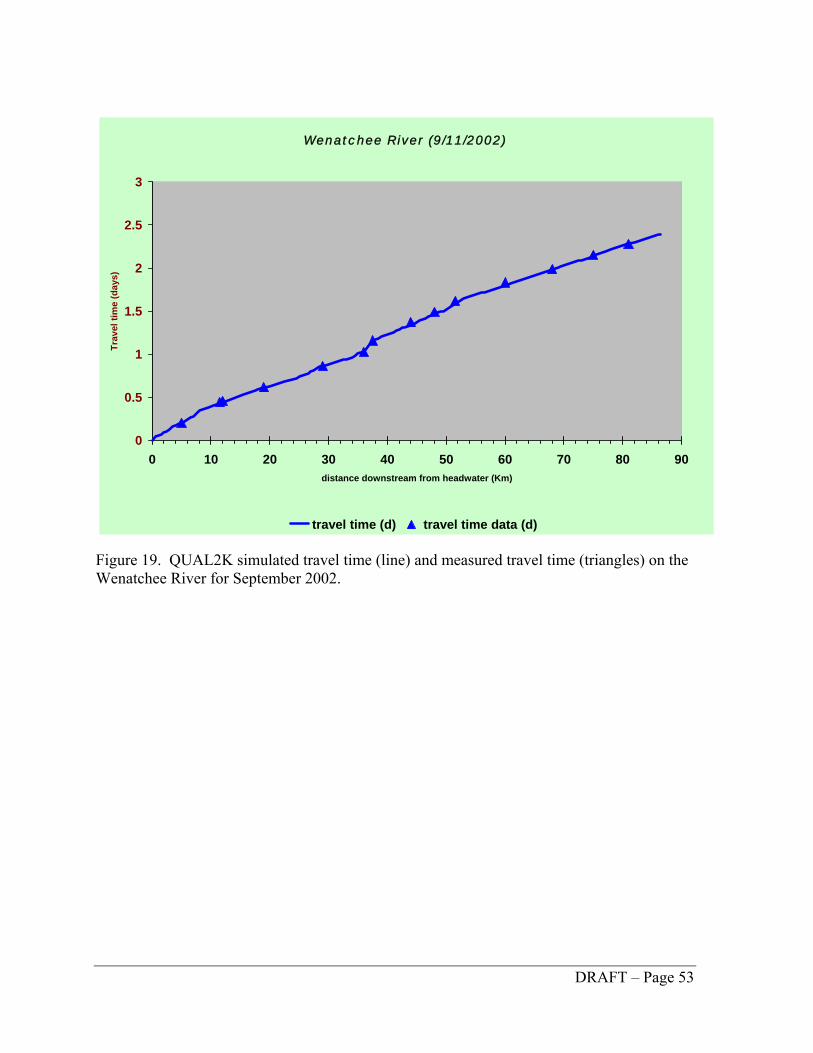
Wenatchee River (9/11/2002)
0
0.5
1
1.5
2
2.5
3
Trav
el ti
me
(day
s)
0 10 20 30 40 50 60 70 80 90distance downstream from headwater (Km)
travel time (d) travel time data (d) Figure 19. QUAL2K simulated travel time (line) and measured travel time (triangles) on the Wenatchee River for September 2002.
DRAFT – Page 53
Calibrated Model Inputs Appendix D contains the calibration coefficients and rate parameters selected to fit observed conditions during the August and September 2002 synoptic surveys in the Wenatchee River and Icicle Creek. The same coefficients were applied to both synoptic surveys to test the robustness of the QUAL2K calibration (i.e., to confirm its ability to accurately simulate water quality under two different sets of low-flow conditions). Calibration was accomplished by adjusting model coefficients and rates iteratively until optimum goodness-of-fit between predicted model results and observed field values was achieved. Goodness-of-fit was measured using the root-mean-square-error (RMSE), a commonly used measure of model variability (Reckhow, 1986). The RMSE is defined as the square root of the mean of the squared difference between the observed and simulated values. It is similar to a standard deviation of the error. All model coefficients were adjusted within acceptable ranges as described by Pelletier and Chapra (2004), Chapra (1997), and EPA (1985, 1987). Coefficients for Temperature Calibration The QUAL2K model was calibrated for temperature as described in Cristea and Pelletier (2005). Temperature correction factors are used in QUAL2K for most chemical and biological kinetic rates since those processes are temperature-dependent. Temperature correction factors were from commonly accepted range of values from the scientific literature or model default values. Coefficients for Dissolved Oxygen Calibration Various options for the calculation of atmospheric reaeration rates are available for use in the QUAL2K model. Using the guidance of EPA (1985), the Tsivoglou-Neal reaeration equation was considered to be the most representative of conditions in the Wenatchee River during the August and September synoptic surveys based on velocity and slope during low-flow conditions. For the Icicle Creek scenarios, the USGS (channel-control) equation was used. Other DO coefficients and rate parameters, including the stoichiometric amounts of DO required per unit of ammonia nitrified or carbon oxidized, were model default values. Coefficients for Periphyton and Nutrient Calibration Periphyton growth was modeled using a zero-order growth rate and allowed to run until a steady-state maximum areal biomass was achieved. The simulated maximum areal biomass was calibrated to measured end-of-season biomass maxima. A variable-stoichiometry and luxury-uptake algorithm for nutrients is used in QUAL2K that separates periphyton growth from nutrient uptake. Maximum nutrient uptake rates, subsistence cell quotas, and internal half-saturation constants for algal cells, plus external nutrient half-saturation constants, were iteratively selected from published ranges summarized in Pelletier and Chapra (2004) until an optimized goodness-of-fit to the observed data was achieved.
Page 54
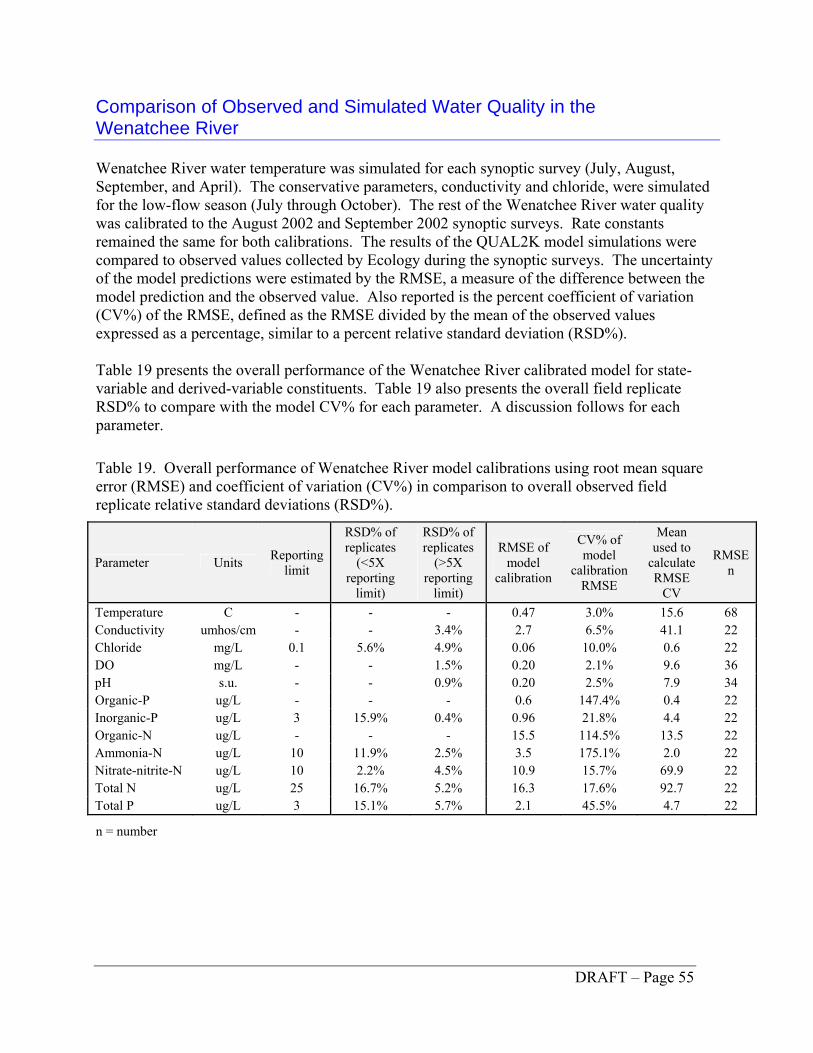
Comparison of Observed and Simulated Water Quality in the Wenatchee River Wenatchee River water temperature was simulated for each synoptic survey (July, August, September, and April). The conservative parameters, conductivity and chloride, were simulated for the low-flow season (July through October). The rest of the Wenatchee River water quality was calibrated to the August 2002 and September 2002 synoptic surveys. Rate constants remained the same for both calibrations. The results of the QUAL2K model simulations were compared to observed values collected by Ecology during the synoptic surveys. The uncertainty of the model predictions were estimated by the RMSE, a measure of the difference between the model prediction and the observed value. Also reported is the percent coefficient of variation (CV%) of the RMSE, defined as the RMSE divided by the mean of the observed values expressed as a percentage, similar to a percent relative standard deviation (RSD%). Table 19 presents the overall performance of the Wenatchee River calibrated model for state-variable and derived-variable constituents. Table 19 also presents the overall field replicate RSD% to compare with the model CV% for each parameter. A discussion follows for each parameter. Table 19. Overall performance of Wenatchee River model calibrations using root mean square error (RMSE) and coefficient of variation (CV%) in comparison to overall observed field replicate relative standard deviations (RSD%).
Parameter Units Reporting limit
RSD% of replicates
(<5X reporting
limit)
RSD% of replicates
(>5X reporting
limit)
RMSE of model
calibration
CV% of model
calibration RMSE
Mean used to
calculate RMSE
CV
RMSE n
Temperature C - - - 0.47 3.0% 15.6 68 Conductivity umhos/cm - - 3.4% 2.7 6.5% 41.1 22 Chloride mg/L 0.1 5.6% 4.9% 0.06 10.0% 0.6 22 DO mg/L - - 1.5% 0.20 2.1% 9.6 36 pH s.u. - - 0.9% 0.20 2.5% 7.9 34 Organic-P ug/L - - - 0.6 147.4% 0.4 22 Inorganic-P ug/L 3 15.9% 0.4% 0.96 21.8% 4.4 22 Organic-N ug/L - - - 15.5 114.5% 13.5 22 Ammonia-N ug/L 10 11.9% 2.5% 3.5 175.1% 2.0 22 Nitrate-nitrite-N ug/L 10 2.2% 4.5% 10.9 15.7% 69.9 22 Total N ug/L 25 16.7% 5.2% 16.3 17.6% 92.7 22 Total P ug/L 3 15.1% 5.7% 2.1 45.5% 4.7 22
n = number
DRAFT – Page 55
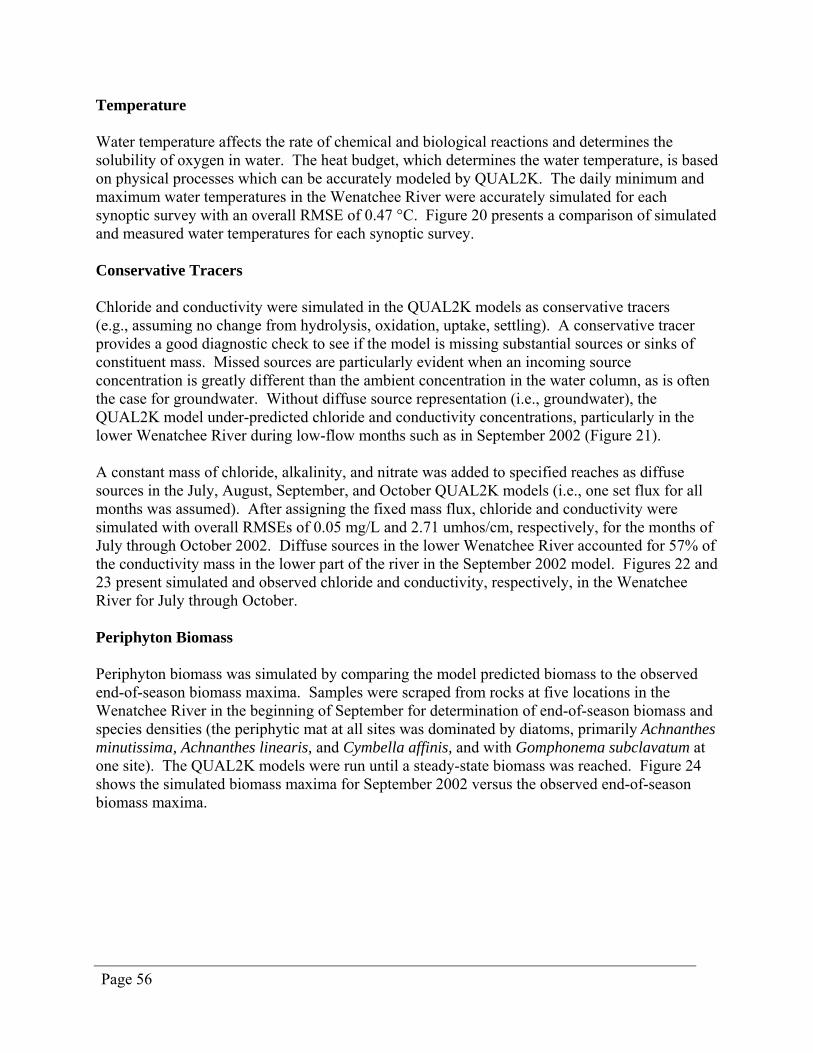
Page 56
Temperature Water temperature affects the rate of chemical and biological reactions and determines the solubility of oxygen in water. The heat budget, which determines the water temperature, is based on physical processes which can be accurately modeled by QUAL2K. The daily minimum and maximum water temperatures in the Wenatchee River were accurately simulated for each synoptic survey with an overall RMSE of 0.47 °C. Figure 20 presents a comparison of simulated and measured water temperatures for each synoptic survey. Conservative Tracers Chloride and conductivity were simulated in the QUAL2K models as conservative tracers (e.g., assuming no change from hydrolysis, oxidation, uptake, settling). A conservative tracer provides a good diagnostic check to see if the model is missing substantial sources or sinks of constituent mass. Missed sources are particularly evident when an incoming source concentration is greatly different than the ambient concentration in the water column, as is often the case for groundwater. Without diffuse source representation (i.e., groundwater), the QUAL2K model under-predicted chloride and conductivity concentrations, particularly in the lower Wenatchee River during low-flow months such as in September 2002 (Figure 21). A constant mass of chloride, alkalinity, and nitrate was added to specified reaches as diffuse sources in the July, August, September, and October QUAL2K models (i.e., one set flux for all months was assumed). After assigning the fixed mass flux, chloride and conductivity were simulated with overall RMSEs of 0.05 mg/L and 2.71 umhos/cm, respectively, for the months of July through October 2002. Diffuse sources in the lower Wenatchee River accounted for 57% of the conductivity mass in the lower part of the river in the September 2002 model. Figures 22 and 23 present simulated and observed chloride and conductivity, respectively, in the Wenatchee River for July through October. Periphyton Biomass Periphyton biomass was simulated by comparing the model predicted biomass to the observed end-of-season biomass maxima. Samples were scraped from rocks at five locations in the Wenatchee River in the beginning of September for determination of end-of-season biomass and species densities (the periphytic mat at all sites was dominated by diatoms, primarily Achnanthes minutissima, Achnanthes linearis, and Cymbella affinis, and with Gomphonema subclavatum at one site). The QUAL2K models were run until a steady-state biomass was reached. Figure 24 shows the simulated biomass maxima for September 2002 versus the observed end-of-season biomass maxima.
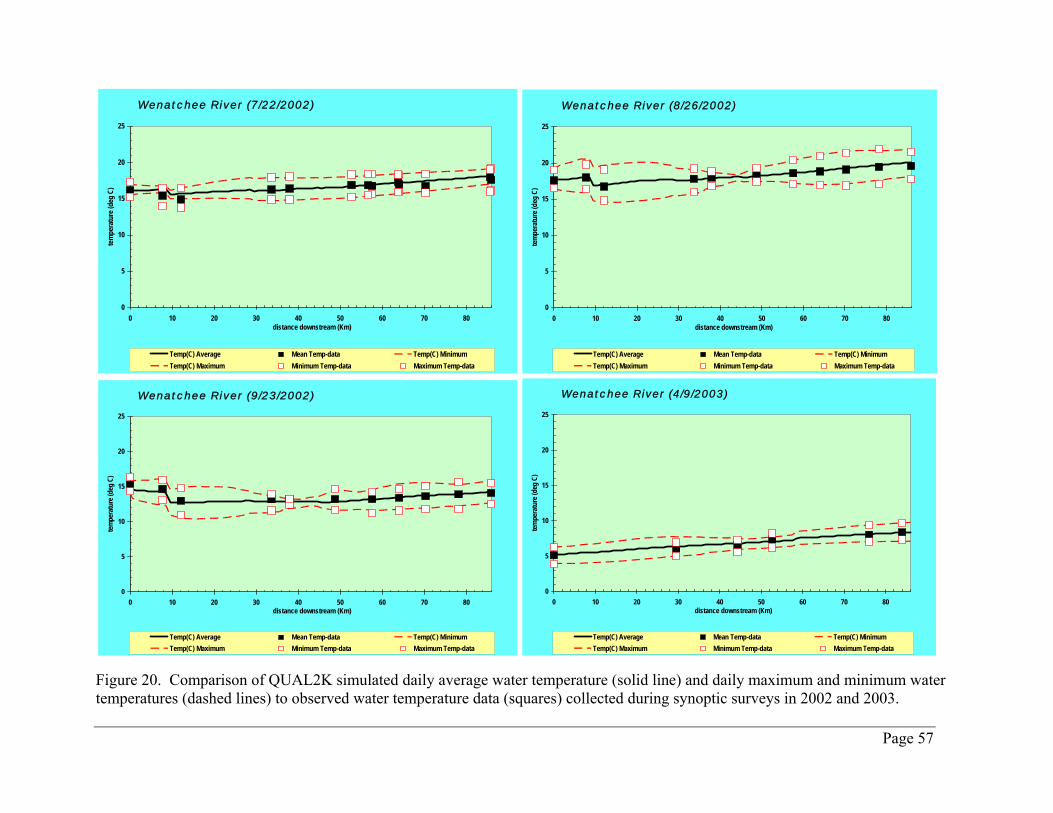
Page 57
Wenatchee River (7/22/2002)
0
5
10
15
20
25
0 10 20 30 40 50 60 70 80distance downstream (Km)
tem
pera
ture
(deg
C)
Temp(C) Average Mean Temp-data Temp(C) MinimumTemp(C) Maximum Minimum Temp-data Maximum Temp-data
Wenatchee River (8/26/2002)
0
5
10
15
20
25
0 10 20 30 40 50 60 70 80distance downstream (Km)
tem
pera
ture
(deg
C)
Temp(C) Average Mean Temp-data Temp(C) MinimumTemp(C) Maximum Minimum Temp-data Maximum Temp-data
Wenatchee River (9/23/2002)
0
5
10
15
20
25
0 10 20 30 40 50 60 70 80distance downstream (Km)
tem
pera
ture
(deg
C)
Temp(C) Average Mean Temp-data Temp(C) MinimumTemp(C) Maximum Minimum Temp-data Maximum Temp-data
Wenatchee River (4/9/2003)
0
5
10
15
20
25
0 10 20 30 40 50 60 70 80distance downstream (Km)
tem
pera
ture
(deg
C)
Temp(C) Average Mean Temp-data Temp(C) MinimumTemp(C) Maximum Minimum Temp-data Maximum Temp-data
Figure 20. Comparison of QUAL2K simulated daily average water temperature (solid line) and daily maximum and minimum water temperatures (dashed lines) to observed water temperature data (squares) collected during synoptic surveys in 2002 and 2003.
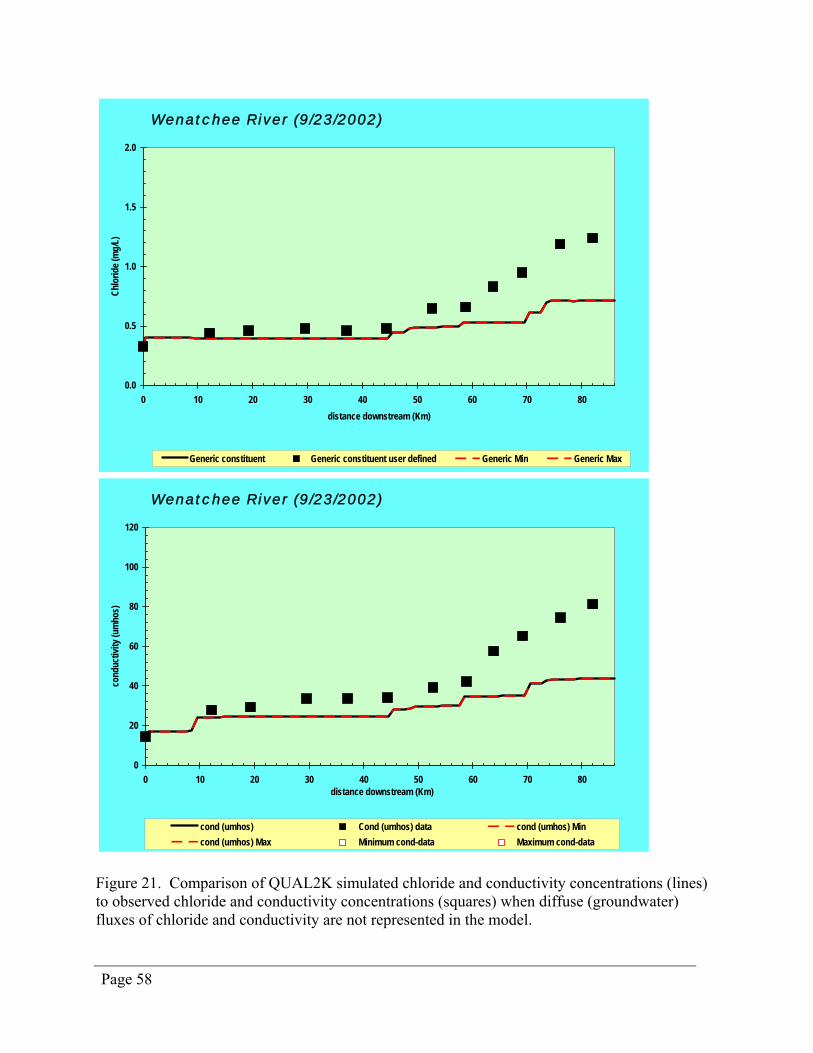
Page 58
Figure 21. Comparison of QUAL2K simulated chloride and conductivity concentrations (lines) to observed chloride and conductivity concentrations (squares) when diffuse (groundwater) fluxes of chloride and conductivity are not represented in the model.
Wenatchee River (9/23/2002)
0
20
40
60
80
100
120
0 10 20 30 40 50 60 70 80distance downstream (Km)
cond
uctiv
ity (u
mho
s)
cond (umhos) Cond (umhos) data cond (umhos) Mincond (umhos) Max Minimum cond-data Maximum cond-data
Wenatchee River (9/23/2002)
0.0
0.5
1.0
1.5
2.0
0 10 20 30 40 50 60 70 80
Chlo
ride (
mg/
L)
distance downstream (Km)
Generic constituent Generic constituent user defined Generic Min Generic Max
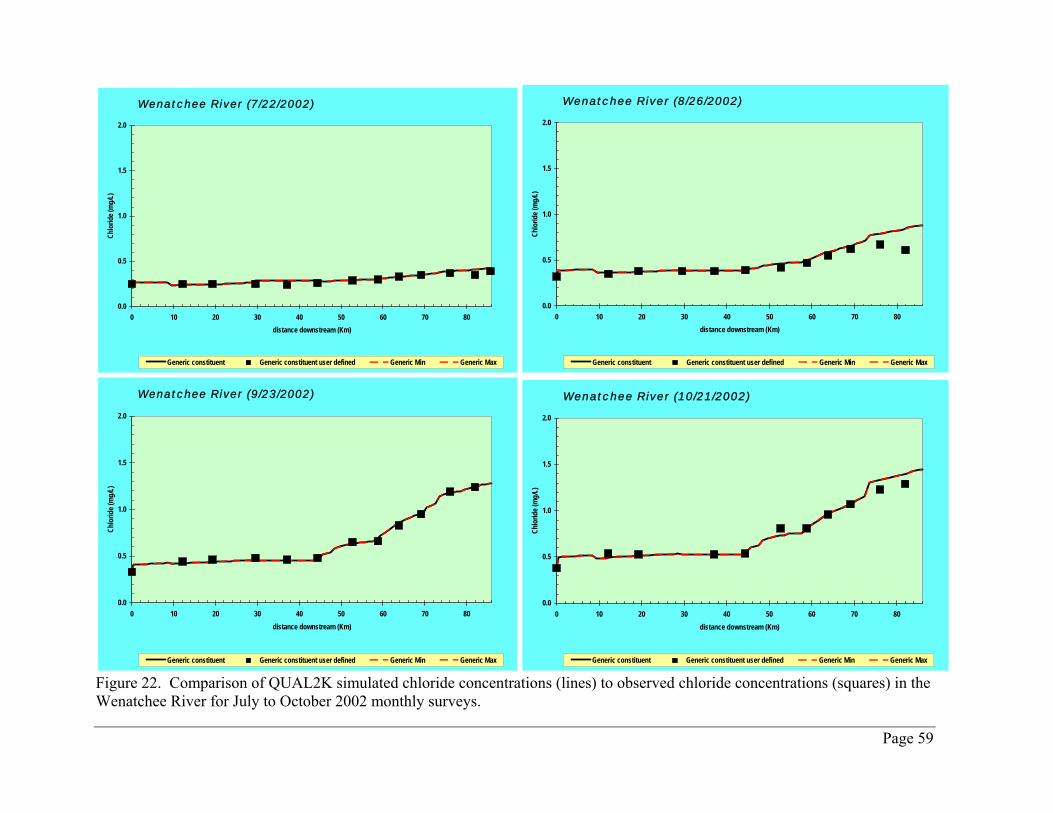
Wenatchee River (7/22/2002)
0.0
0.5
1.0
1.5
2.0
0 10 20 30 40 50 60 70 80distance downstream (Km)
Chlo
ride (
mg/
L)
Generic constituent Generic constituent user defined Generic Min Generic Max
Wenatchee River (8/26/2002)
0.0
0.5
1.0
1.5
2.0
0 10 20 30 40 50 60 70 80distance downstream (Km)
Chlo
ride (
mg/
L)
Generic constituent Generic constituent user defined Generic Min Generic Max Wenatchee River (9/23/2002)
0.0
0.5
1.0
1.5
2.0
0 10 20 30 40 50 60 70 80distance downstream (Km)
Chlo
ride (
mg/
L)
Generic constituent Generic constituent user defined Generic Min Generic Max
Wenatchee River (10/21/2002)
0.0
0.5
1.0
1.5
2.0
0 10 20 30 40 50 60 70 80distance downstream (Km)
Chlo
ride (
mg/
L)
Generic constituent Generic constituent user defined Generic Min Generic Max
Figure 22. Comparison of QUAL2K simulated chloride concentrations (lines) to observed chloride concentrations (squares) in the Wenatchee River for July to October 2002 monthly surveys.
Page 59

Wenatchee River (7/22/2002)
0
20
40
60
80
100
120
0 10 20 30 40 50 60 70 80distance downstream (Km)
cond
uctiv
ity (u
mho
s)
cond (umhos) Cond (umhos) data cond (umhos) Mincond (umhos) Max Minimum cond-data Maximum cond-data
Wenatchee River (8/26/2002)
0
20
40
60
80
100
120
0 10 20 30 40 50 60 70 80distance downstream (Km)
cond
uctiv
ity (u
mho
s)
cond (umhos) Cond (umhos) data cond (umhos) Mincond (umhos) Max Minimum cond-data Maximum cond-data
Wenatchee River (9/23/2002)
0
20
40
60
80
100
120
0 10 20 30 40 50 60 70 80distance downstream (Km)
cond
uctiv
ity (u
mho
s)
cond (umhos) Cond (umhos) data cond (umhos) Mincond (umhos) Max Minimum cond-data Maximum cond-data
Wenatchee River (10/21/2002)
0
20
40
60
80
100
120
0 10 20 30 40 50 60 70 80distance downstream (Km)
cond
uctiv
ity (u
mho
s)
cond (umhos) Cond (umhos) data cond (umhos) Mincond (umhos) Max Minimum cond-data Maximum cond-data
Figure 23. Comparison of QUAL2K simulated conductivity (lines) to observed conductivity measurements (squares) in the Wenatchee River for July to October 2002 monthly surveys.
Page 60
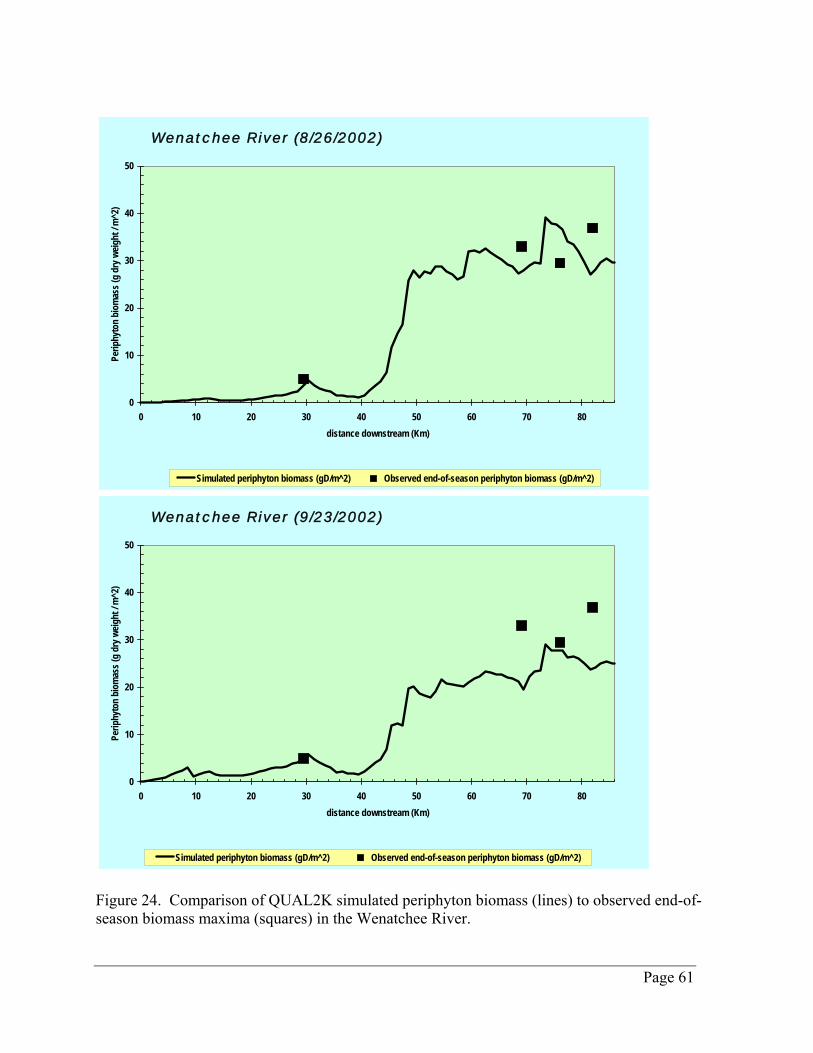
Wenatchee River (8/26/2002)
0
10
20
30
40
50
0 10 20 30 40 50 60 70 80distance downstream (Km)
Perip
hyto
n bi
omas
s (g
dry w
eight
/ m^2
)
Simulated periphyton biomass (gD/m^2) Observed end-of-season periphyton biomass (gD/m^2)
Wenatchee River (9/23/2002)
0
10
20
30
40
50
0 10 20 30 40 50 60 70 80distance downstream (Km)
Perip
hyto
n bi
omas
s (g
dry w
eight
/ m^2
)
Simulated periphyton biomass (gD/m^2) Observed end-of-season periphyton biomass (gD/m^2)
Figure 24. Comparison of QUAL2K simulated periphyton biomass (lines) to observed end-of-season biomass maxima (squares) in the Wenatchee River.
Page 61
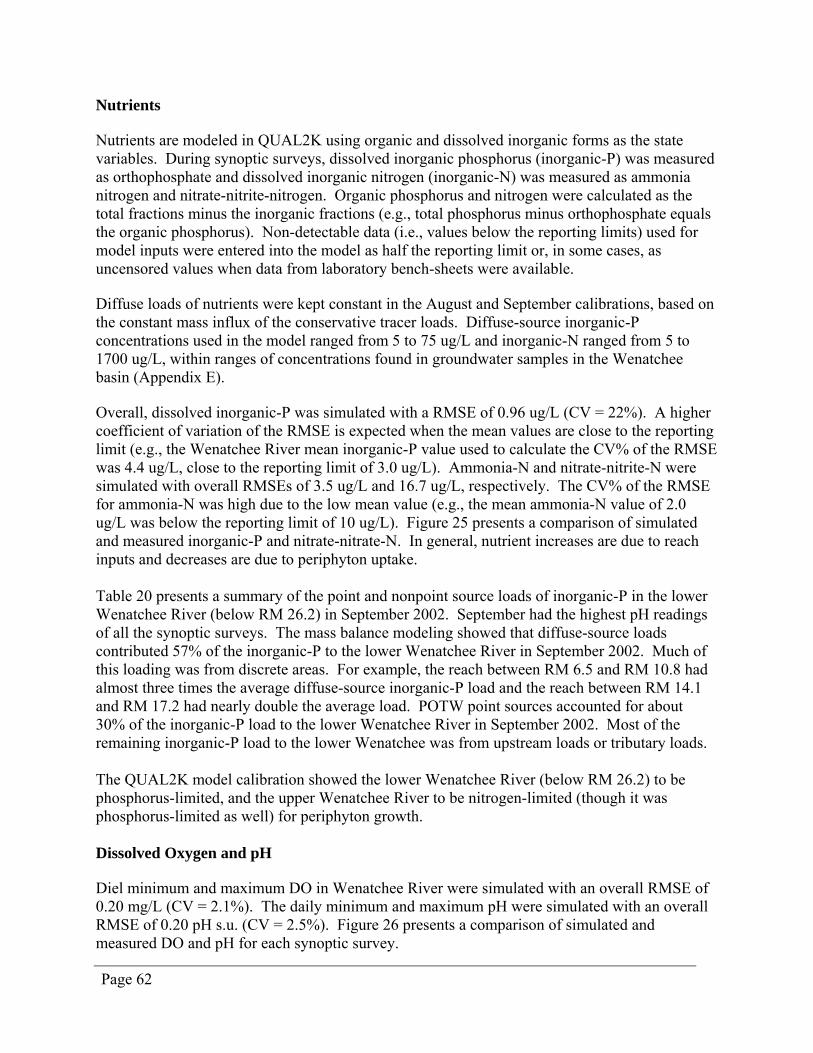
Nutrients Nutrients are modeled in QUAL2K using organic and dissolved inorganic forms as the state variables. During synoptic surveys, dissolved inorganic phosphorus (inorganic-P) was measured as orthophosphate and dissolved inorganic nitrogen (inorganic-N) was measured as ammonia nitrogen and nitrate-nitrite-nitrogen. Organic phosphorus and nitrogen were calculated as the total fractions minus the inorganic fractions (e.g., total phosphorus minus orthophosphate equals the organic phosphorus). Non-detectable data (i.e., values below the reporting limits) used for model inputs were entered into the model as half the reporting limit or, in some cases, as uncensored values when data from laboratory bench-sheets were available. Diffuse loads of nutrients were kept constant in the August and September calibrations, based on the constant mass influx of the conservative tracer loads. Diffuse-source inorganic-P concentrations used in the model ranged from 5 to 75 ug/L and inorganic-N ranged from 5 to 1700 ug/L, within ranges of concentrations found in groundwater samples in the Wenatchee basin (Appendix E). Overall, dissolved inorganic-P was simulated with a RMSE of 0.96 ug/L (CV = 22%). A higher coefficient of variation of the RMSE is expected when the mean values are close to the reporting limit (e.g., the Wenatchee River mean inorganic-P value used to calculate the CV% of the RMSE was 4.4 ug/L, close to the reporting limit of 3.0 ug/L). Ammonia-N and nitrate-nitrite-N were simulated with overall RMSEs of 3.5 ug/L and 16.7 ug/L, respectively. The CV% of the RMSE for ammonia-N was high due to the low mean value (e.g., the mean ammonia-N value of 2.0 ug/L was below the reporting limit of 10 ug/L). Figure 25 presents a comparison of simulated and measured inorganic-P and nitrate-nitrate-N. In general, nutrient increases are due to reach inputs and decreases are due to periphyton uptake. Table 20 presents a summary of the point and nonpoint source loads of inorganic-P in the lower Wenatchee River (below RM 26.2) in September 2002. September had the highest pH readings of all the synoptic surveys. The mass balance modeling showed that diffuse-source loads contributed 57% of the inorganic-P to the lower Wenatchee River in September 2002. Much of this loading was from discrete areas. For example, the reach between RM 6.5 and RM 10.8 had almost three times the average diffuse-source inorganic-P load and the reach between RM 14.1 and RM 17.2 had nearly double the average load. POTW point sources accounted for about 30% of the inorganic-P load to the lower Wenatchee River in September 2002. Most of the remaining inorganic-P load to the lower Wenatchee was from upstream loads or tributary loads. The QUAL2K model calibration showed the lower Wenatchee River (below RM 26.2) to be phosphorus-limited, and the upper Wenatchee River to be nitrogen-limited (though it was phosphorus-limited as well) for periphyton growth. Dissolved Oxygen and pH Diel minimum and maximum DO in Wenatchee River were simulated with an overall RMSE of 0.20 mg/L (CV = 2.1%). The daily minimum and maximum pH were simulated with an overall RMSE of 0.20 pH s.u. (CV = 2.5%). Figure 26 presents a comparison of simulated and measured DO and pH for each synoptic survey.
Page 62

Page 63
Table 20. Inorganic-phosphorus loads in the lower Wenatchee River (below RM 26.2) in September 2002.
September 2002 Dissolved Inorganic-P Loadskg/day % of total load
Upstream Load 1.68 4.96%kg/day
NPDES Point Source Loads (90th percentile loads) 10.65 31.35% Leavenworth POTW 2.200 Peshastin POTW 1.380 Cashmere POTW 6.236 Cashmere POTW lagoon leak (estimated) 0.837
General P Blue B Blue S Ba
Tributary Icicle Chum Pesh Brender Mission Cr
Irrigatio Casc Icicle Ir Icicle Ir Icicle Ir Jones Wenatc
Diffus Diffus Diffus Diffus Diffus Diffus Load A Wenatchee Reclamation District diversion Jones Shotwell diversion Gunn Ditch diversion
Total Loading 33.98Total Loading (minus abstractions)
ermit Loads (non-contact cooling water) 0.02 0.06%ird 0.016tar 0.001
rdin Growers 0.004
Loads 1.94 5.72% Creek 0.919stick Creek 0.097
astin Creek 0.234 Creek 0.339
eek 0.354
n Spill Returns 0.29 0.85%ade Orchard 0.059
rigation spill near Leavenworth 0.000rigation spill at Stines Hill 0.031rigation spill at Fairview Canyon 0.047
Shotwell spill return 0.044hee Reclamation District spill 0.107
Diffuse Loads (groundwater) 19.39 57.06%e load between RM 26.2 and RM 21.0 (Leavenworth) 1.944e load between RM 21.0 and RM 17.2 (Peshastin) 2.684e load between RM 17.2 and RM 14.1 (Dryden) 4.510e load between RM 14.1 and RM 10.8 2.863e load between RM 10.8 and RM 6.5 (Cashmere) 7.049e load between RM 6.5 and RM 2.8 (Monitor) 0.338
bstractions -1.76
-1.269-0.415-0.079
32.22

Wenatchee River (8/26/2002)
0
2
4
6
8
10
12
14
16
0 10 20 30 40 50 60 70 80distance downstream (Km)
inor
gani
c-P
(ug/
L)
Inorg P (ugP/L) data Inorg P (ugP/L) Inorg P (ugP/L) Min Inorg P (ugP/L) Max
Wenatchee River (9/23/2002)
0
2
4
6
8
10
12
14
16
0 10 20 30 40 50 60 70 80distance downstream (Km)
inor
gani
c-P
(ug/
L)
Inorg P (ugP/L) data Inorg P (ugP/L) Inorg P (ugP/L) Min Inorg P (ugP/L) Max
Wenatchee River (8/26/2002)
1
10
100
1000
0 10 20 30 40 50 60 70 80distance downstream (Km)
nitra
te +
nitri
te (u
gN/L
)
NO3 (ugN/L) data NO3(ugN/L) NO3(ugN/L) Min NO3(ugN/L) Max
Wenatchee River (9/23/2002)
1
10
100
1000
0 10 20 30 40 50 60 70 80distance downstream (Km)
nitra
te +
nitr
ite (u
gN/L
)
NO3 (ugN/L) data NO3(ugN/L) NO3(ugN/L) Min NO3(ugN/L) Max
Figure 25. Comparison of QUAL2K simulated inorganic-P and nitrate-nitrite-N concentrations (lines) to observed inorganic-P and nitrate-nitrite-N concentrations (squares) in the Wenatchee River for the August 2002 and September 2002 synoptic surveys.
Page 64
Page 65
Figure 26. Comparison of QUAL2K simulated daily maximum and daily minimum dissolved oxygen and pH (dashed lines) to observed dissolved oxygen and pH (squares) in the Wenatchee River for the August 2002 and September 2002 synoptic surveys.
Wenatchee River (8/26/2002)
6
7
8
9
10
11
12
13
0 10 20 30 40 50 60 70 80distance downstream (Km)
diss
olve
d ox
ygen
(mg/
L)
DO(mgO2/L) DO(mgO2/L) Min DO(mgO2/L) Max Minimum DO-data Maximum DO-data
Wenatchee River (9/23/2002)
6
7
8
9
10
11
12
13
0 10 20 30 40 50 60 70 80distance downstream (Km)
diss
olve
d ox
ygen
(mg/
L)
DO(mgO2/L) DO(mgO2/L) Min DO(mgO2/L) Max Minimum DO-data Maximum DO-data
Wenatchee River (8/26/2002)
5.0
5.5
6.0
6.5
7.0
7.5
8.0
8.5
9.0
9.5
10.0
0 10 20 30 40 50 60 70 80distance downstream (Km)
pH
pH pH Min pH Max Minimum pH-data Maximum pH-data high pH criterion
Wenatchee River (9/23/2002)
5.0
5.5
6.0
6.5
7.0
7.5
8.0
8.5
9.0
9.5
10.0
0 10 20 30 40 50 60 70 80distance downstream (Km)
pH
pH pH Min pH Max Minimum pH-data Maximum pH-data high pH criterion

Comparison of Observed and Simulated Water Quality in Icicle Creek Icicle Creek was calibrated to the August and September 2002 synoptic surveys. Rate constants remained the same for both calibrations. The results of the QUAL2K model simulations were compared to observed values collected by Ecology during the synoptic surveys. The uncertainty of the model predictions were estimated by the RMSE, a measure of the difference between the model prediction and the observed value. Table 21 presents the overall performance of the Icicle Creek calibrated model for state-variable and derived-variable constituents. Also reported is the percent coefficient of variation (CV%) of the RMSE, defined as the RMSE divided by the mean of the observed values expressed as a percentage, similar to a percent relative standard deviation (RSD%). Table 21 also presents the overall field replicate RSD% to compare with the model CV% for each parameter. A discussion follows for each constituent category. Table 21. Overall performance of Icicle Creek model calibrations using root mean square error (RMSE) and coefficient of variation (CV%) in comparison to overall observed field relative standard deviations (RSD%)
Parameter Units Reporting limit
RSD% of replicates
(<5X reporting
limit)
RSD% of replicates
(>5X reporting
limit)
RMSE of model
calibration
CV% of model
calibration RMSE
Mean used to
calculate RMSE
CV
RMSE n
Temperature C - - - 0.37 2.8% 13.2 18 Conductivity umhos/cm - - 3.4% 2.4 5.0% 47.4 16 DO mg/L - - 1.5% 0.16 1.6% 10.2 18 pH s.u. - - 0.9% 0.12 1.5% 7.9 18 Inorganic-P ug/L 3 15.9% 0.4% 2.3 49.8% 3.9 16 Ammonia-N ug/L 10 11.9% 2.5% 5.4 77.5% 6.4 16 Nitrate-nitrite-N ug/L 10 2.2% 4.5% 9.3 36.0% 11.1 16 n - number
Temperature The daily minimum and maximum water temperatures in Icicle Creek were simulated for the two synoptic surveys with an overall RMSE of 0.37 °C. Figure 27 presents a comparison of simulated and measured water temperatures for each synoptic survey. Conservative Tracer Conductivity was simulated for Icicle Creek as a conservative tracer. Without diffuse source representation, the QUAL2K model under-predicted conductivity concentrations in Icicle Creek. Conductivity was simulated with an overall RMSE of 2.4 umhos/cm for the months of August and September 2002. Figure 27 presents a comparison of simulated and measured conductivity for each synoptic survey.
Page 66
Page 67
Periphyton Biomass Periphyton biomass was not sampled for Icicle Creek. The Icicle Creek model was run until a steady-state biomass was reached. August and September 2002 simulated biomass maxima were between 8 to 10 g dry weight/ m2 at the mouth. Nutrients Nutrients were modeled as their organic and dissolved inorganic forms. Both August and September models showed phosphorus to be the most limiting nutrient for periphyton growth. Overall, inorganic-P was simulated with a RMSE of 2.3 ug/L (CV = 49.8%). Higher CV of the RMSE is expected for RMSE and mean values that are low or close to their reporting limit (e.g., the Icicle Creek mean inorganic-P value used to calculate the CV of the RMSE was 4.5 ug/L, close to the reporting limit of 3.0 ug/L). Ammonia-N and nitrate-nitrite-N were simulated with overall RMSEs of 5.4 ug/L and 9.3 ug/L, respectively. Figure 28 presents a comparison of simulated and measured dissolved inorganic-P and nitrate-nitrate as nitrogen. Dissolved Oxygen and pH Diel minimum and maximum DO in Icicle Creek were simulated with an overall RMSE of 0.16 mg/L (CV = 1.6%). The daily minimum and maximum pH were simulated with an overall RMSE of 0.12 pH s.u. (CV = 1.5%). Figure 29 presents a comparison of simulated and measured conductivity for each synoptic survey.
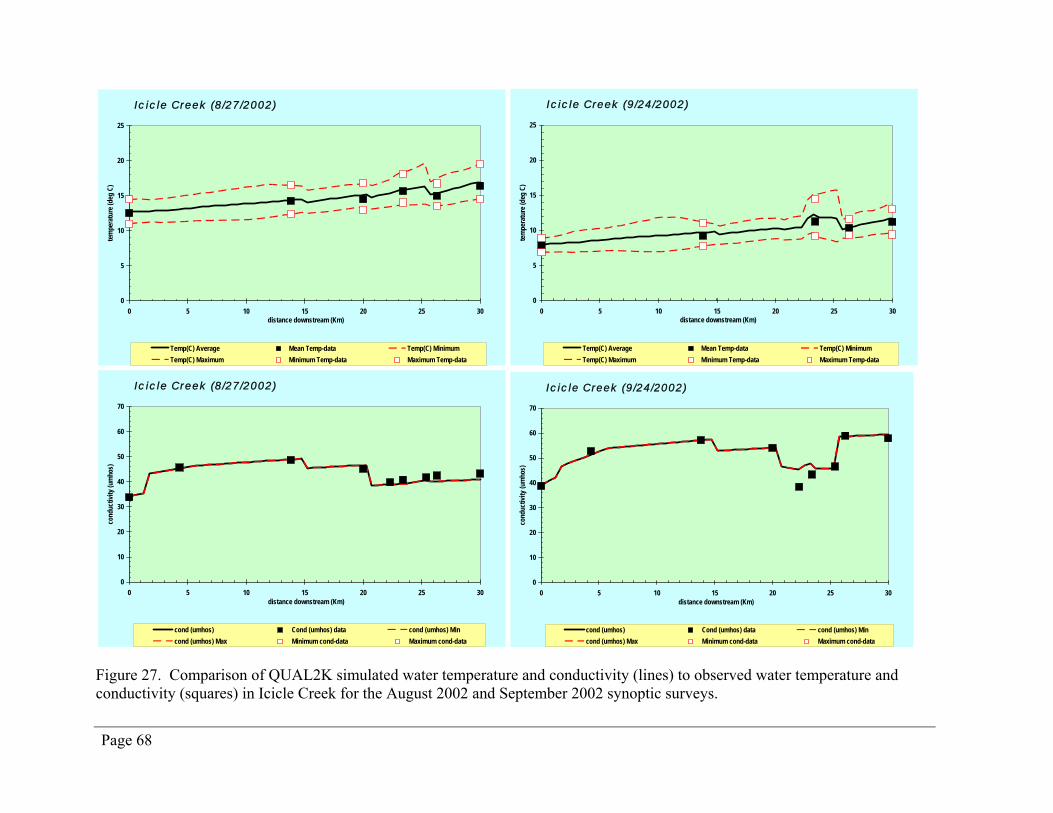
Icicle Creek (8/27/2002)
0
5
10
15
20
25
0 5 10 15 20 25 30distance downstream (Km)
tem
pera
ture
(deg
C)
Temp(C) Average Mean Temp-data Temp(C) MinimumTemp(C) Maximum Minimum Temp-data Maximum Temp-data
Icicle Creek (9/24/2002)
0
5
10
15
20
25
0 5 10 15 20 25 30distance downstream (Km)
tem
pera
ture
(deg
C)
Temp(C) Average Mean Temp-data Temp(C) MinimumTemp(C) Maximum Minimum Temp-data Maximum Temp-data
Icicle Creek (8/27/2002)
0
10
20
30
40
50
60
70
0 5 10 15 20 25 30distance downstream (Km)
cond
uctiv
ity (u
mho
s)
cond (umhos) Cond (umhos) data cond (umhos) Mincond (umhos) Max Minimum cond-data Maximum cond-data
Icicle Creek (9/24/2002)
0
10
20
30
40
50
60
70
0 5 10 15 20 25 30distance downstream (Km)
cond
uctiv
ity (u
mho
s)
cond (umhos) Cond (umhos) data cond (umhos) Mincond (umhos) Max Minimum cond-data Maximum cond-data
Figure 27. Comparison of QUAL2K simulated water temperature and conductivity (lines) to observed water temperature and conductivity (squares) in Icicle Creek for the August 2002 and September 2002 synoptic surveys.
Page 68
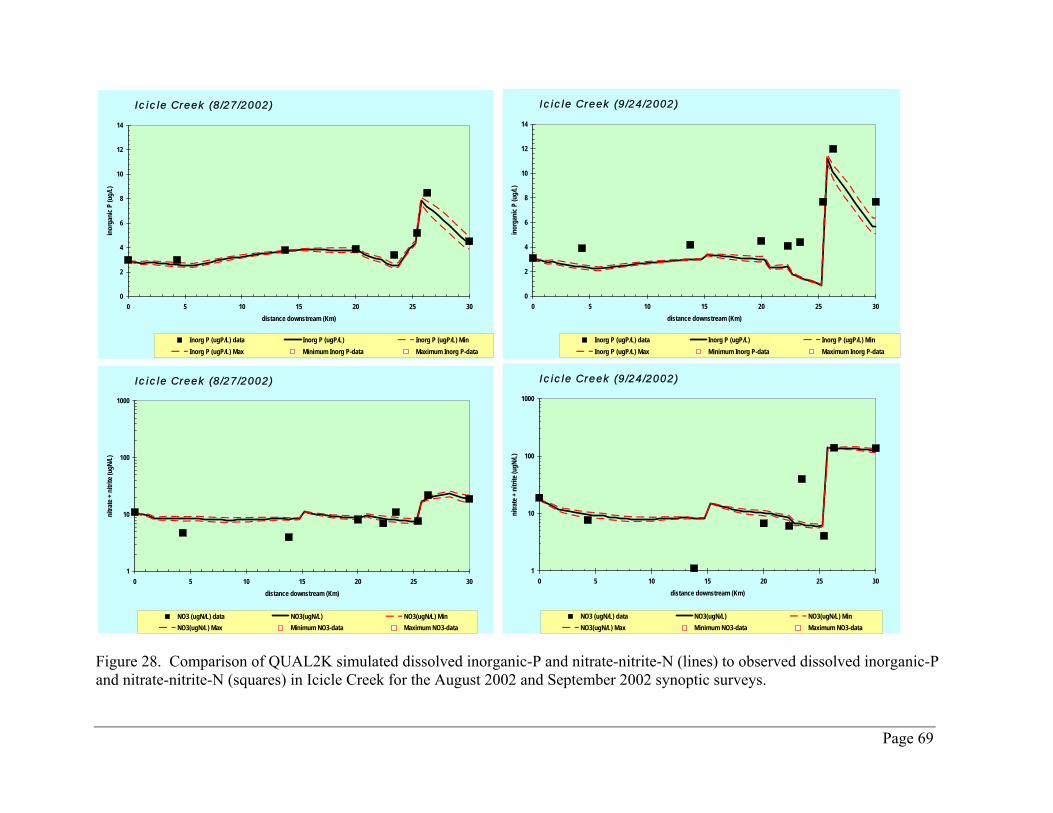
Icicle Creek (8/27/2002)
0
2
4
6
8
10
12
14
0 5 10 15 20 25 30distance downstream (Km)
inor
gani
c P (u
g/L)
Inorg P (ugP/L) data Inorg P (ugP/L) Inorg P (ugP/L) MinInorg P (ugP/L) Max Minimum Inorg P-data Maximum Inorg P-data
Icicle Creek (9/24/2002)
0
2
4
6
8
10
12
14
0 5 10 15 20 25 30distance downstream (Km)
inor
gani
c P (u
g/L)
Inorg P (ugP/L) data Inorg P (ugP/L) Inorg P (ugP/L) MinInorg P (ugP/L) Max Minimum Inorg P-data Maximum Inorg P-data
Icicle Creek (8/27/2002)
1
10
100
1000
0 5 10 15 20 25 30distance downstream (Km)
nitra
te +
nitri
te (u
gN/L
)
NO3 (ugN/L) data NO3(ugN/L) NO3(ugN/L) MinNO3(ugN/L) Max Minimum NO3-data Maximum NO3-data
Icicle Creek (9/24/2002)
1
10
100
1000
0 5 10 15 20 25 30distance downstream (Km)
nitra
te +
nitr
ite (u
gN/L
)
NO3 (ugN/L) data NO3(ugN/L) NO3(ugN/L) MinNO3(ugN/L) Max Minimum NO3-data Maximum NO3-data
Figure 28. Comparison of QUAL2K simulated dissolved inorganic-P and nitrate-nitrite-N (lines) to observed dissolved inorganic-P and nitrate-nitrite-N (squares) in Icicle Creek for the August 2002 and September 2002 synoptic surveys.
Page 69
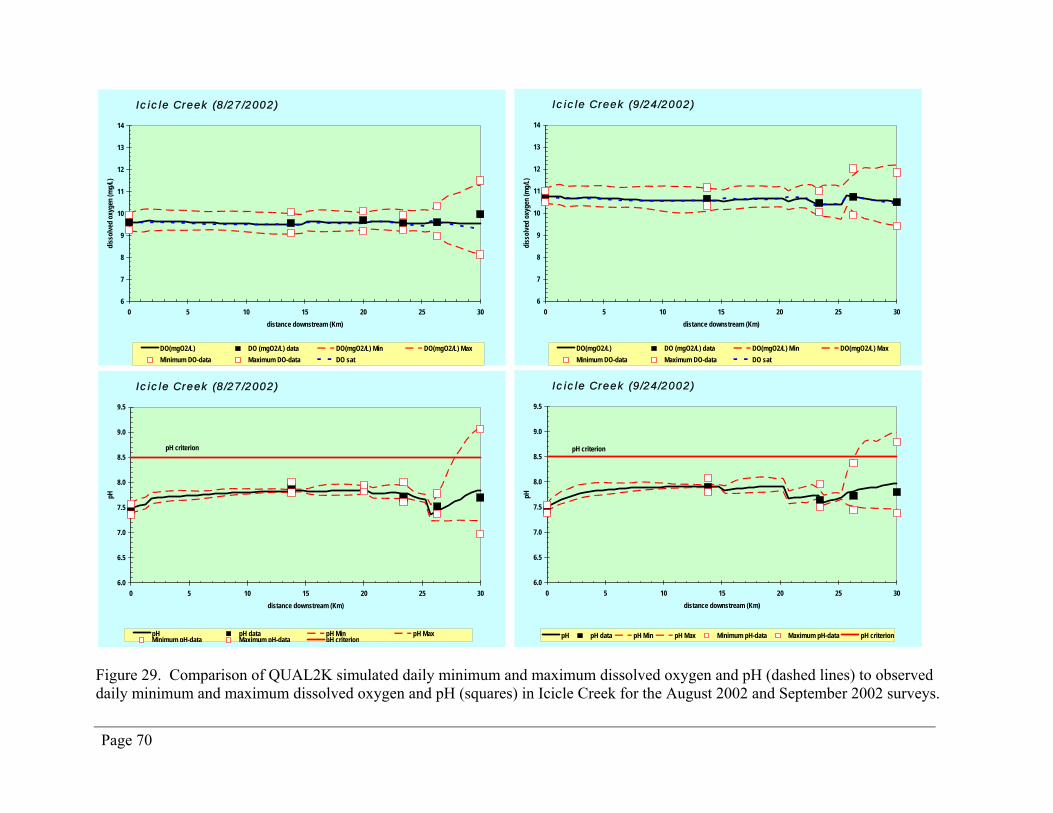
Figure 29. Comparison of QUAL2K simulated daily minimum and maximum dissolved oxygen and pH (dashed lines) to observed daily minimum and maximum dissolved oxygen and pH (squares) in Icicle Creek for the August 2002 and September 2002 surveys.
Page 70
Icicle Creek (8/27/2002)
6
7
8
9
10
11
12
13
14
0 5 10 15 20 25 30distance downstream (Km)
diss
olve
d ox
ygen
(mg/
L)
DO(mgO2/L) DO (mgO2/L) data DO(mgO2/L) Min DO(mgO2/L) MaxMinimum DO-data Maximum DO-data DO sat
Icicle Creek (9/24/2002)
6
7
8
9
10
11
12
13
14
0 5 10 15 20 25 30distance downstream (Km)
diss
olve
d ox
ygen
(mg/
L)
DO(mgO2/L) DO (mgO2/L) data DO(mgO2/L) Min DO(mgO2/L) MaxMinimum DO-data Maximum DO-data DO sat
Icicle Creek (8/27/2002)
6.0
6.5
7.0
7.5
8.0
8.5
9.0
9.5
0 5 10 15 20 25 30distance downstream (Km)
pH
pH pH data pH Min pH MaxMinimum pH-data Maximum pH-data pH criterion
pH criterion
Icicle Creek (9/24/2002)
6.0
6.5
7.0
7.5
8.0
8.5
9.0
9.5
0 5 10 15 20 25 30distance downstream (Km)
pH
pH pH data pH Min pH Max Minimum pH-data Maximum pH-data pH criterion
pH criterion

Assimilative Load Capacity for Phosphorus
Wenatchee River The Wenatchee River QUAL2K model (calibrated to the August and September 2002 data) was used to simulate critical-load conditions for calculating the inorganic-phosphorus assimilative load capacity. Critical Load Conditions
• The season of concern is March through October (i.e., the growing season) when enough light is available for photosynthetic productivity. The highest diel pH values measured during the 2002-03 synoptic surveys were in late September during low-flow.
• The seasonal 7Q10 flow (July – October) was used as the critical flow condition and was based on the long-term flow records of USGS gaging stations. The probability of 7Q10 conditions occurring is approximately one in ten years on the average, which Ecology considers an acceptable exceedance probability for defining the loading capacity.
• Meteorological conditions from September 2002 were used in the model. Meteorology for 2002 was close to representing a median year.
• Critical effluent flow conditions for the Publicly-Operated Treatment Works (POTWs) were defined as highest-reported flow (defined as “current flow”) and design-capacity flow (defined as “design flow”). In the recently reported flow data, the Leavenworth POTW did not show any apparent seasonality; however, both Cashmere and Peshastin POTWs showed seasonal high flows in the fall (September to November), apparently from the additional discharge from the apple and pear packing industry during that season. Appendices B and C contain POTW data.
1. For Cashmere POTW, a design flow of 0.94 million gallons per day (MGD) and a current flow of 0.66 MGD (from October and November 2002 data).
2. For the Peshastin POTW, a design flow of 0.11 MGD and a current flow of 0.061 MGD (September through November 2003-04 data).
3. For Leavenworth POTW, a design flow of 0.84 MGD and a current flow of 0.43 MGD (from 2003-04 flow data).
• Critical-condition POTW concentrations were defined as the 90th percentile effluent ortho-phosphate concentrations as calculated from the 2002-03 synoptic survey data. Appendix C contains POTW data tables with the concentration values. The 90th percentile current orthophosphate load is defined as the 90th percentile concentration times the current flow.
• The September 2002 concentrations for tributaries, nonpoint (diffuse; e.g., groundwater), and other point (discrete; e.g., POTWs) source inflows were used in the model. They represent the best available data for these sources.
• September 2002 water withdrawals were used for critical-condition water withdrawals.
Page 71
Load Capacity for the Lower Wenatchee River A simplified first-approximation of the assimilative capacity for inorganic-P was developed by reducing the inorganic-P load from all sources (point and nonpoint) by an equal percentage, until the predicted maximum diel pH did not exceed the 8.5 pH criterion in any part of the lower river. All of the remaining inorganic-P loads to the lower Wenatchee River were then added together to give a single assimilative capacity. A single assimilative capacity for the whole lower Wenatchee is a simplification because it treats the whole lower reach as if it were a single compliance point. However, it provides a first approximation of the scale of reduction needed to comply with water quality standards. In reality, there are many discrete compliance points throughout the lower Wenatchee River, and there are many possible combinations of loadings that would meet water quality standards at each compliance point. The QUAL2K model has a resolution of one kilometer segments. The model will be used to evaluate alternative load-reduction scenarios, which is outside the scope of this report. Using the simplified approach to establish a single assimilative capacity for the whole lower Wenatchee River, the model showed a maximum assimilative capacity of 7.8 kg/day of inorganic-P loading to comply with the water quality standards during critical conditions. At this point, the maximum instream inorganic-P concentration in the river was 3.1 ug/L, representing the target inorganic-P total maximum daily load (TMDL) concentration. An 80% reduction in inorganic-P loading from all sources would be necessary to comply with water quality criteria. Ecology does not consider this simplified method (e.g., 80% from all sources) as a viable allocation strategy, because the required reductions from some sources would result in inorganic-P levels below natural background levels or below levels of what might be expected with any kind of reasonable assurance. In addition, because there is more inorganic-P loading in the lower end of the lower Wenatchee River, a larger percent reduction is necessary in that part of the river than in the upper end of the lower Wenatchee River. Table 22 compares the critical inorganic-P loads with current POTW flows to the assimilative capacities for inorganic-P in the lower Wenatchee River (below RM 26.2). Mass balance modeling showed that under critical conditions and with current POTW flows and treatment levels, 49% of the inorganic-P load to the lower Wenatchee is from diffuse sources, 43% of the inorganic-P load is from the three POTWs (including the Cashmere lagoon leak), and nearly 5% is from the tributaries, for a total inorganic-P load of almost 40 kg/day entering the lower Wenatchee. Only 1.3 kg/day of inorganic-P is expected from upstream sources. At design flow conditions and current treatment levels, the POTW’s inorganic-P load to the lower Wenatchee is expected to increase to 44 kg/day (Table 23).
Page 72

Table 22. Critical-condition loads and assimilative capacity for inorganic-P in the lower Wenatchee River during critical low-flow conditions and current POTW effluent discharge.
Critical-Condition Dissolved Inorganic-P Loads% of total load
Upstream Load 1.24 3.2%kg/day
NPDES Point Source Loads (90th percentile loads) 16.78 42.7% Leavenworth POTW 7.557 Peshastin POTW 1.609 Cashmere POTW 6.780 Cashmere POTW lagoon leak (estimated) 0.837
General Permit Loads (non-contact cooling water) 0.02 0.1% Blue Bird 0.016 Blue Star 0.001 Bardin Growers 0.004
Tributary Loads 1.75 4.4% Icicle Creek 0.802 Chumstick Creek 0.097 Peshastin Creek 0.153 Brender Creek 0.339 Mission Creek 0.354
Irrigation Spill Returns 0.29 0.7% Cascade Orchard 0.059 Icicle Irrigation spill near Leavenworth 0.000 Icicle Irrigation spill at Stines Hill 0.031 Icicle Irrigation spill at Fairview Canyon 0.047 Jones Shotwell spill return 0.044 Wenatchee Reclamation District spill 0.107
Diffuse Loads (groundwater) 19.23 48.9% Diffuse load between RM 26.2 and RM 21.0 (Leavenworth) 1.944 Diffuse load between RM 21.0 and RM 17.2 (Peshastin) 2.583 Diffuse load between RM 17.2 and RM 14.1 (Dryden) 4.478 Diffuse load between RM 14.1 and RM 10.8 2.856 Diffuse load between RM 10.8 and RM 6.5 (Cashmere) 7.036 Diffuse load between RM 6.5 and RM 2.8 (Monitor) 0.335
Load Abstractions -2.39-1.869-0.439-0.083
Wenatchee Reclamation District diversion Jones Shotwell diversion Gunn Ditch diversion
Total Loading 39.31Total Loading (minus abstractions) 36.92
Dissolved Inorganic-P Assimilative Capacity 7.76 kg/dayExcess Dissolved Inorganic-P Loading 29.16 kg/day
kg/day
Page 73

Table 23. Critical-condition inorganic-phosphorus loads for the POTWs in the lower Wenatchee River at design flow and capacity POTW effluent discharge.
NPDES Municipal Point Source (design flow) in the lower Wenatchee River
Inorganic-P Load (kg/day)
Leavenworth POTW (0.84 MGD) 18.7 Peshastin POTW (0.11 MGD) 3.7 Cashmere POTW (0.94 MGD) 21.3 Total for Lower Wenatchee POTWs (1.89 MGD) 43.7
Table 22 clearly shows that large reductions of inorganic-P loads are necessary from point and nonpoint sources. Currently, POTWs account for nearly 43% of the inorganic-P load in the lower Wenatchee River during critical conditions. With future growth or expansion of services up to their design capacities, the POTWs are expected to account for up to 67% of the inorganic-P load. Based on mass-balance modeling, diffuse nonpoint sources account for nearly half of the inorganic-P load to the lower Wenatchee River during critical conditions. Inorganic-P loads conveyed by groundwater to the river appear to be the main source of diffuse inorganic-P. The groundwater water-quality characteristics may be influenced by infiltration from the surrounding irrigated agricultural regions, rural and urban development (on-site septic and wastewater collection systems), land application of waste and process water, and other unidentified sources. There may be naturally occurring phosphorus sources as well. One possible diffuse phosphorus source is leaching from on-site septic drainfields. A study of Lake Chelan in Chelan County (Patmont et al., 1989) found that septic system discharges of phosphorus to the lake were greatest in areas where saturated soils predominated beneath on-site drainfields. In the soils around Lake Chelan, an unsaturated zone extending more than 3 meters below the saturated drainfield was recommended for optimum phosphorus-removal efficiency. A similar study is recommended for the different soil types in the Wenatchee Basin to determine the minimal depth of unsaturated soils beneath drainfields for effective removal of phosphorus. Development and implementation of regulations that restrict placement of drainfields from areas with inadequate unsaturated soils would likely result in reduction of nonpoint phosphorus to the river. Mass-balance modeling showed that two reaches of the lower Wenatchee River had two to three times the diffuse P-loading of other reaches (Table 22). Of these reaches, one brackets the city of Dryden, and the other brackets the city of Cashmere. High levels of inorganic-P and nitrate (e.g., ranges of 79-250 ug/L of orthophosphate and 2-3.5 mg/L of nitrate) were found in groundwater samples taken from piezometers located below Dryden’s community drainfield. This drainfield is located on a point of the riverbank and is a likely source of high nutrients in the groundwater, although other upland land use practices, such as the land application of process water by the local fruit processors, may contribute as well. In the Cashmere reach, estimates of the leaching from the Cashmere wastewater lagoon may be low due to limited data; there may be increased diffuse loading of inorganic-P from the lagoon. Other potential contributors of inorganic-P to groundwater in and around the city of Cashmere include on-site septic, leaking
Page 74
wastewater collection systems, and other unidentified sources. There may be naturally occurring phosphorus sources as well. Both reaches may provide an opportunity for significant nonpoint reduction of inorganic-P. Groundwater phosphorus source studies and best management practices (BMP) implementation are recommended in both of these reaches. Tributaries account for nearly 5% of the inorganic-P load to the lower Wenatchee River during critical conditions. Even though Icicle Creek had lower inorganic-P concentrations, the largest load was from Icicle Creek because it had the highest flow of all the lower tributaries. In 2002, Peshastin Creek and Icicle Creek had inorganic-P concentrations less than 10 ug/L at their mouths. The mouth of Mission Creek had some inorganic-P concentrations above 10 ug/L, and Brender Creek and Chumstick Creek generally had inorganic-P concentrations above 20 ug/L. With the exception of Icicle Creek, nutrient sampling was conducted only at the mouths of the tributaries in 2002. Brender, Mission, and Chumstick creeks also had fecal coliform bacteria, dissolved oxygen, and pH water quality violations. Implementing control measures to mitigate fecal coliform exceedances in these tributary basins will likely mitigate dissolved oxygen and pH exceedances by lowering nutrient concentrations. Further nutrient sampling is recommended for Brender, Mission, and Chumstick creeks to identify nutrient sources in those watersheds. Storm runoff is infrequent during the low-flow months of August through October (the main critical season). While the water quality of a large storm runoff event has not been characterized, summer thunderstorms that produce large, localized runoff events may temporarily affect water quality in streams and the river. Infrequent storm runoff cannot be modeled in a steady-state fashion and was not included in the QUAL2K modeling of the Wenatchee River; however, it is recommended to control and manage any stormwater runoff from agricultural lands, urban areas, and/or transportation corridors by using BMPs to reduce stormwater impacts to surface waters. Storm runoff and snowmelt runoff is most important in the early growing season from March through May. Reserve Load Capacity for the Upper Wenatchee River In Class AA reaches of the Wenatchee River, dissolved oxygen (DO) concentrations were shown to be less than the 9.5 mg/L criterion during the summer months due to high land elevations and high water temperatures. Implementation of the Wenatchee River temperature TMDL will improve DO; however, to stay in compliance with water quality standards, future biochemical oxygen demand (BOD) and nutrient loading from point and nonpoint sources needs to be restricted to keep from reducing minimum diel DO more than the allowable 0.2 mg/L from natural conditions. Additionally, future nutrient loading needs to be restricted in Class AA waters to keep from increasing the diel pH range more than 0.2 pH units from natural conditions. The calibrated Wenatchee River model was used to determine reserve load capacities for BOD and nutrients during critical conditions. To determine the nutrient load capacity, nutrient loading was increased at the Lake Wenatchee POTW discharge location (RM 53.3) in the Wenatchee River model (set to critical conditions) until the simulated DO and pH were out of compliance with water quality standards. Modeling
Page 75
showed that the upper Wenatchee River is currently co-limited by nitrogen and phosphorus (nitrogen is the most limiting) but is poised to respond readily to additional nutrient loading. To maintain water quality standards, a reserve load capacity of 1.35 kg/day of additional (above current conditions) inorganic-N or 0.17 kg/day of inorganic-P load is recommended at the reach where the Lake Wenatchee POTW discharges. This reserve capacity represents a total capacity for all sources in the reach, both point and nonpoint. Currently, the Lake Wenatchee POTW has a permit for only seasonal winter-time discharge to the Wenatchee River and land-applies during the summer critical season. Controlling diffuse (nonpoint) sources will be critical to protecting the water quality of the upper Wenatchee River. The QUAL2K model can be used to ensure that impacts from various additional loads in other parts of the river do not combine in a way such that compliance is exceeded at any point in the river. The current instream concentrations of inorganic-phosphorus and inorganic-nitrogen in the upper Wenatchee River during the low-flow months of August to October were used as natural reference conditions. They are at or below reporting limits (3.0 ug/L and 10.0 ug/L, respectively), representing conditions that currently comply with water quality standards and probably nearly reflect natural conditions (as far as can be determined). In order to preserve the pristine water quality of the upper Wenatchee River, the Lake Wenatchee POTW or any other point source should not discharge to the Wenatchee River at any time during March through October. The summer-time land application site for the POTW should be checked for adequate unsaturated soils (i.e., static water levels greater than 3 meters below ground surface) for high-level phosphorus removal, and monthly phosphorus sampling (with a reporting limit down to 3 ug/L) should be included in the POTW groundwater monitoring plan. The Wenatchee National Forest wastewater infiltration pond for the Tumwater Campground off Highway 2 should be checked for proper functioning. Since nitrates are difficult to trap in soil, a conversion to an evaporation pond or some other treatment option other than infiltration should be explored for the campground facility. As mentioned for the lower Wenatchee River, development and implementation of regulations that restrict placement of on-site septic drainfields from areas with inadequate unsaturated soils would preserve the upper Wenatchee River pristine water quality. Estimates could be made of the maximum number and density of on-site drainfields that the upper basin could accommodate and still meet the water quality standards, as was done in the Lake Chelan study (Patmont et al., 1989).
Icicle Creek The calibrated Icicle Creek QUAL2K model was used to predict diel pH response to variable phosphorus loads during conditions similar to the September and August 2002 synoptic surveys. Critical Load Conditions
• The season of concern in Icicle Creek is July through October when enough light is available for photosynthetic productivity, flows are low, and water temperatures are warm enough for productivity. The highest diel pH values (and only exceedances) measured in Icicle Creek
Page 76
during 2002-03 were at the mouth of the creek during the August and September synoptic surveys.
• The seasonal 7Q10 flow (July –October) at the mouth had to be estimated because there is no long-term flow record at the mouth and significant water diversions occur below the upstream USGS gaging station. Based on limited data, the seasonal 7Q10 flow at the mouth was estimated to be close to the September 2002 measured flow (i.e., within 7 cfs or 0.2 cms of each other). During this time of year, most of the flow originates from the Leavenworth National Fish Hatchery (LNFH) outflow. Most of the hatchery outflow is water from their upstream Icicle Creek diversion; however, the hatchery augments the Icicle Creek water diversion with water from a well-field to provide adequate flow for the facility. The ability to augment flow presumably creates consistent year-to-year flow conditions at the mouth. The September 2002 flow was assumed to represent 7Q10 conditions.
• Meteorological conditions from September 2002 were used in the model. The meteorology for 2002 was close to a median year representation.
• The September 2002 loads from the hatchery main outflow and abatement pond discharge, as well as the calculated diffuse loads in lower Icicle Creek, were used in the model. They represent the best available data for these sources.
Page 77

Load Capacity for Icicle Creek Assimilative capacity for inorganic-phosphorus was determined by reducing loading from the hatchery main outfall and abatement pond effluent until water quality standards were met. For September 2002, most of the flow and the inorganic-P load in lower Icicle Creek came from the hatchery main outfall. Table 24 compares the current inorganic-P loads with the assimilative capacities for inorganic-P in lower Icicle Creek (below RM 4.1) for the September simulation. The simulation showed phosphorus to be the most limiting nutrient for periphyton growth. The September 2002 simulation, which is assumed to represent critical conditions, predicted an assimilative capacity of 0.65 kg/day of inorganic-P in the lower part of Icicle Creek, requiring a 55% load reduction of current loads. Table 24. Critical-condition (September 2002) loads and assimilative capacity for inorganic-P in the lower Icicle Creek during critical low-flow conditions (September 2002 flows).
% of total load
kg/dayUpstream Load 0.01 0.8%
Point Source Loads 1.25 86.3% Leavenworth National Fish Hatchery
(main outfall) 1.191
Leavenworth National Fish Hatchery (abatement pond discharge) 0.062
Diffuse Loads 0.19 12.9%
Diffuse load between RM 2.9 (hatchery) and RM 2.3 (E. Leavenworth Rd.) 0.061
Diffuse load between RM 2.3 and mouth 0.126
Total Loading 1.45
Dissolved Inorganic-P Assimilative Capacity 0.65 kg/dayExcess Dissolved Inorganic-P Loading 0.80 kg/day
kg/day
Critical-Condition Dissolved Inorganic-P Loads
Page 78
To attain water quality standards in lower Icicle Creek, the hatchery main outfall would need to reduce its inorganic-P effluent concentration to less than 5.0 ug/L. The inorganic-P concentration in the hatchery main outfall was approximately 13 ug/L in both August and September 2002, a three-fold increase over the inorganic-P concentration of the intake water from its upper Icicle Creek diversion. (The maximum 2002-03 inorganic-P concentration in Icicle Creek above the old channel (RM 3.9) was less than 5.0 ug/L and averaged 3.4 ug/L). Organic-P concentrations in the main outfall were below reporting limits. There were significant observed increases (200% to 1500% increases) in ammonia and nitrate concentrations in the main outfall discharge compared to the below-reporting-limit levels of the Icicle Creek water at the hatchery diversion. An increase in inorganic-P and ammonia within the hatchery facility is most likely due to the products of fish metabolism and phosphorus addition from fish feed, although groundwater augmentation may contribute additional phosphorus and nitrogen (the hatchery well water was not sampled). Kendra (1989) summarized the work of numerous investigators who documented water quality degradation downstream of fish hatcheries, including increased downstream algal and periphyton growth and productivity. The assimilative capacities predicted for September (critical conditions) resulted in a maximum instream inorganic-P (orthophosphate) concentration of 4.4 ug/L which represents the target inorganic-P total maximum daily load (TMDL) concentration.
Page 79
Margin of Safety The Clean Water Act requires a margin of safety (MOS) to be incorporated into the loading capacity. The MOS requirement is intended to account for uncertainty in data and modeling. The MOS may be implicit (built into the analysis) or explicit (an added, separate load allocation). The MOS for this study was implicitly provided by using a combination of conservative modeling assumptions that tend to err on the side of a smaller loading capacity (e.g., combining 7Q10 flow conditions with 90th percentile pollutant loads and hot, meteorological conditions favorable for stream productivity). The Wenatchee River point-source dischargers experience greater loading during critical low-flow conditions due to increased loads from the fruit packing industry in the fall. Therefore, in the course of establishing wasteload and load allocations, an additional explicit MOS (10%) is recommended to be applied for the TMDL.
Page 80
Conclusions The Wenatchee River and Icicle Creek are on the 1998 303(d) list of impaired waters for pH and dissolved oxygen. Ecology conducted monthly synoptic surveys in the Wenatchee River and Icicle Creek during the season of concern, July through September 2002, and during April 2003. In Class AA reaches, dissolved oxygen concentrations were shown to be lower than the 9.5 mg/L criterion during the summer due to high land elevations and high water temperatures. pH data showed that the upper pH criterion of 8.5 was exceeded near the mouth of Icicle Creek and in the lower Wenatchee River from RM 21.0 (above Peshastin) to the mouth. The cause of the pH exceedances was from periphyton (attached algae) growth. Nitrogen-to-phosphorus ratios of instream bioavailable nutrients suggest that dissolved inorganic phosphorus (inorganic-P) is the most limiting nutrient that controls periphyton growth. Steady-state modeling of dissolved oxygen, pH, and periphyton productivity, based on EPA’s QUAL2K model, was conducted to evaluate the capacity of the Wenatchee River and Icicle Creek to assimilate dissolved inorganic-P loading from point and nonpoint sources and still meet water quality criteria. The Wenatchee River QUAL2K model showed that inorganic-P was limiting periphyton growth in the lower Wenatchee River. Modeling of critical conditions in the lower Wenatchee River showed an assimilative capacity of 7.7 kg/day of inorganic-P, which represents an 80% reduction from current loading conditions. The model also showed that the assimilative capacity for the lower Wenatchee River can also be represented by an instream maximum inorganic-P concentration of 3.1 ug/L. Under critical conditions and with current publicly-owned treatment works (POTW) flows and treatment levels, nearly 50% of the inorganic-P load to the lower Wenatchee is from diffuse sources, 43% is from the three POTWs (including the Cashmere lagoon leak), and nearly 5% is from tributaries, for a total load of nearly 40 kg/day. Large reductions of inorganic-P are needed from both point and nonpoint sources to meet the assimilative capacity of the lower Wenatchee River. Mass-balance modeling showed that two reaches of the lower Wenatchee River exhibit higher diffuse phosphorus loading than other reaches. Of these reaches, one brackets the city of Dryden and the other brackets the city of Cashmere. Groundwater studies should be done in these two reaches, specifically focusing on which land uses in these reaches are causing phosphorus inputs to the river. Tributaries account for nearly 5% of the inorganic-P load to the lower Wenatchee River during critical conditions. The largest load was from Icicle Creek because it had the highest flow of the lower tributaries. With the exception of Icicle Creek, nutrient sampling was conducted only at the mouths of the tributaries during 2002. Mission, Brender, and Chumstick creeks generally had higher inorganic-P concentrations, in addition to fecal coliform bacteria, dissolved oxygen,
Page 81
and pH water quality violations. Implementing control measures to mitigate fecal coliform exceedances in these tributary basins will likely mitigate dissolved oxygen and pH exceedances by lowering nutrient concentrations. Further nutrient sampling is recommended for Brender, Mission, and Chumstick creeks to identify nutrient sources in those watersheds. To maintain water quality standards in the upper Wenatchee River, reserve load capacities for biochemical oxygen demand (BOD) and nutrients are recommended. The Lake Wenatchee POTW should not discharge to the Wenatchee River during March through October, and the land application site for the POTW and any future on-site drainfields should be checked for adequate unsaturated soils for high-level phosphorus removal. The Icicle Creek QUAL2K model showed that inorganic-P was limiting periphyton growth in the lower Icicle Creek (below RM 4.1). Mass-balance modeling showed that under critical conditions, most of the inorganic-P loading (over 85%) to lower Icicle Creek was from the Leavenworth National Fish Hatchery main outfall. The model also showed that the assimilative capacity for inorganic-P in lower Icicle Creek was 0.65 kg/day which represents a 55% reduction from current levels. The assimilative capacity for lower Icicle Creek can also be represented by an instream maximum inorganic-P concentration of 4.4 ug/L. Under critical conditions, inorganic-P concentrations in the Leavenworth National Fish Hatchery main outfall effluent must be below 5 ug/L to meet the assimilative capacity of the creek. The Wenatchee River and Icicle Creek are very sensitive to the addition of nutrients. Although phosphorus levels are relatively low (less than 20 ug/L) compared to other Washington State streams, they are currently too high in the lower reaches to comply with the pH water quality standards.
Page 82
Recommendations In Class AA reaches, dissolved oxygen concentrations were shown to be less than the 9.5 mg/L criterion during the summer months due to high land elevations and high water temperatures. Implementation of the Wenatchee River Temperature Total Maximum Daily Load (TMDL) will improve dissolved oxygen in the river and tributaries; however, to be in compliance with water quality standards, future biochemical oxygen demand (BOD) and nutrient loading needs to be restricted to keep from further reducing minimum diel dissolved oxygen more than 0.2 mg/L from natural conditions. Additionally, future nutrient loading needs to be restricted to prevent the diel pH range from increasing more than 0.2 pH units from natural conditions. To maintain water quality standards in the upper Wenatchee River, reserve load capacities for BOD and nutrients are recommended. The Lake Wenatchee Publicly-Owned Treatment Works (POTW) should not discharge to the Wenatchee River during March through October, and the land application site for the POTW and any future on-site drainfields should be checked for adequate unsaturated soils for high-level phosphorus removal. In Class A reaches of the Wenatchee River, large reductions of phosphorus are currently needed from both point (discrete) and nonpoint (diffuse) sources to meet the assimilative capacity of the lower Wenatchee River. An allocation plan for phosphorus wasteload and load allocations needs to be developed. Mass-balance modeling showed that two reaches of the lower Wenatchee River exhibit higher diffuse phosphorus loading than other reaches. Of these reaches, one brackets the city of Dryden and the other brackets the city of Cashmere. Groundwater studies should be done in these two reaches, specifically focusing on which land uses are causing phosphorus inputs to the river. The Icicle Creek QUAL2K model showed that most of the inorganic-phosphorus loading (over 85%) to lower Icicle Creek is from the Leavenworth National Fish Hatchery main outfall. Under current critical conditions, inorganic-phosphorus concentrations in the Leavenworth National Fish Hatchery main outfall effluent must be below 5 ug/L to meet the assimilative capacity of the creek.
Page 83
Adaptive Management Process The Wenatchee River Basin TMDL study included a partnership between the Department of Ecology and the Water Resource Inventory Area (WRIA) 45 Water Quality Technical Subcommittee (WQTS). The WQTS consists of Ecology TMDL staff and the WRIA 45 Watershed Planning Unit’s Water Quality Subcommittee. Ecology authored this TMDL technical report for dissolved oxygen, pH, and phosphorus, and the WQTS reviewed, discussed, and commented on the report. The data collection and literature review conducted for and presented in this technical report for the Wenatchee River basin represent the current state of knowledge for dissolved oxygen and pH in the watershed. It is the understanding of the WQTS that additional studies will be performed to fill data gaps and address unanswered questions, as determined by the WQTS. Conclusions and recommendations currently presented in this technical report may be revised based on new data as they become available. It is also the understanding of the WQTS that any new data gathered from further study can be incorporated in the TMDL process in the Summary Implementation Strategy (SIS) or Detailed Implementation Plan (DIP) wherein recommendations and management strategies may be refined. This adaptive management approach is acceptable to both Ecology staff and the WQTS. Ecology will partner with stakeholders (interested parties) in the watershed to conduct studies addressing information gaps (e.g., monitoring). Further monitoring for purposes of TMDL assessment will be addressed in the TMDL SIS and DIP. Any new science available as a result of these studies will be integrated into the SIS and DIP as new conclusions and management recommendations. Management strategies addressing both point (discrete) and nonpoint (diffuse) pollution sources are subject to this adaptive management approach.
Page 84

References Andonaegui, C., 2001. Salmon, Steelhead, and Bull Trout Habitat Limiting Factors; For the Wenatchee Subbasin (Water Resource Inventory Area 45) and Portions of WRIA 40 Within Chelan County. Washington State Conservation Commission, Olympia, WA. Bilhimer, D., J. Carroll, S. O’Neal, and G. Pelletier, 2002. Quality Assurance Project Plan: Wenatchee River Temperature, Dissolved Oxygen, pH, and Fecal Coliform Total Maximum Daily Load Year 1 Technical Study. Washington State Department of Ecology, Olympia, WA. Publication No. 02-03-069. www.ecy.wa.gov/biblio/0203069.html Carroll, J. and S. O’Neal, 2005. Wenatchee River Basin Fecal Coliform Bacteria Total Maximum Daily Load Study. Washington State Department of Ecology, Olympia, WA. Publication No. 05-03-012. www.ecy.wa.gov/biblio/0503012.html Chapra, S.C., 1997. Surface Water-Quality Modeling. McGraw-Hill Companies, Inc. Chapra, S.C. and G.J. Pelletier, G.J. 2003. QUAL2K: A Modeling Framework for Simulating River and Stream Water Quality: Documentation and Users Manual. Civil and Environmental Engineering Dept., Tufts University, Medford, MA. [email protected] Cristea, N. and G. Pelletier, 2005. Wenatchee River Temperature Total Maximum Daily Load Study. Washington State Department of Ecology, Olympia, WA. Publication No. 05-03-011. 83 pgs. www.ecy.wa.gov/biblio/0503011.html Ecology, 1991. Guidance for Determination and Allocation of Total Maximum Daily Loads (TMDLs) in Washington State. Washington State Department of Ecology, Olympia, WA. Publication No. 91-e31. www.ecy.wa.gov/biblio/91e31.html Ecology, 1996. Total Maximum Daily Load Development Guidelines. Washington State Department of Ecology, Olympia, WA. Publication No. 97-315. www.ecy.wa.gov/biblio/97315.html Ecology, 1999. Guidance Document for Developing Total Maximum Daily Loads (TMDLs); Water Cleanup Plans. Washington State Department of Ecology, Olympia, WA. Publication No. 99-23-WQ. http://aww.ecology/programs/wq/tmdls/guidance-rev/index.html. ENSR Consulting and Engineering, 2000. Supporting HEC-RAS Model. Leavenworth National Fish Hatchery: Hydraulic and Hydrologic Analysis of Icicle Creek Fish Passage Restoration Alternatives, Final Report. Document No. 6455-022-400. April 2000. Sverdrup Civil, Inc., Bellevue, WA. EPA, 1985. Rates, Constants, and Kinetic Formulations in Surface Water Quality Modeling (Second Edition). EPA/600/3-85/040. U.S. Environmental Protection Agency, Athens, GA.
Page 85

EPA, 1987. The Enhanced Water Quality Models QUAL2E and QUAL2E-UNCAS: Documentation and users manual. EPA/600/3-87/007. U.S. Environmental Protection Agency. EPA, 1991. Guidance for Water Quality-based Decisions: The TMDL Process. EPA 440/4-91-001. U.S. Environmental Protection Agency. EPA, 1997. New Policies for Establishing and Implementing Total Maximum Daily Loads (TMDLs). www.epa.gov/OWOW/tmdl/ratepace1997guid.pdf EPA, 1999. Protocol for Developing Nutrient TMDLs. Document number 841-B-99-007. U.S. Environmental Protection Agency. EPA, 2000. Ambient Water Quality Criteria Recommendations. Information Supporting the Development of State and Tribal Nutrient Criteria: Rivers and Streams in Nutrient Ecoregion II. EPA 822-B-00-015. U.S. Environmental Protection Agency, Office of Water, Washington, D.C. Garrigues, R.S., 1999. Spokane River/Aquifer Interaction Project. Final Quality Assurance Project Plan. Washington State Department of Ecology, Environmental Assessment Program, Olympia, WA. Glenn, N., 1994. Quality Assurance Project Plan for Basin Class II Inspections. Washington State Department of Ecology, Olympia, WA. Kendra, W., 1989. Quality and Fate of Fish Hatchery Effluents During Summer Low Flow Season. Washington State Department of Ecology, Olympia, WA. Publication No. 89-17. www.ecy.wa.gov/biblio/8917.html Mathess, G., 1982. The Properties of Groundwater. Publishers John Wiley & Sons, Inc. New York, NY. McCutcheon, S.C., 1989. Water Quality Modeling, Volume I: Transport and Surface Exchange in Rivers. CRC Press, Inc., Boca Raton, FL. MEL, 2000. Manchester Environmental Laboratory Lab Users Manual. Fifth Edition. Washington State Department of Ecology, Manchester Environmental Laboratory, Manchester, WA. Patmont, C.R., G. Pelletier, E.B. Welch, D. Banton, and C.C. Ebbesmeyer, 1989. Lake Chelan Water Quality Assessment. Washington State Department of Ecology, Olympia, WA. Publication No. 89-e36. www.ecy.wa.gov/biblio/89e36.html Pelletier G. and S.C. Chapra, 2004. Draft QUAL2Kw. Documentation and User Manual for a Modeling Framework to Simulate River and Stream Water Quality. Washington State Department of Ecology, Olympia, WA. Reckhow, K.H., 1986. Statistical goodness-of-fit measures for waste load allocation models. Work Assignment No. 33. EPA Contract No. 68-01-6904.
Page 86
Reynolds, C.S., 1984. The ecology of freshwater phytoplankton: Cambridge University Press, 384 p. Sinclair, K., 2003. Unpublished data for the hydrogeology of the Wenatchee River basin. Washington State Department of Ecology, Olympia, WA. WAS, 1993. Field Sampling and Measurement Protocols for the Watershed Assessments Section. Ecology Manual. Washington State Department of Ecology, Olympia, WA. Publication No. 93-e04. www.ecy.wa.gov/biblio/93e04.html Welch, E.B., 1992. Ecological effects of wastewater-applied limnology and pollutant effects, 2nd ed.: London, Chapman and Hall, 425 p. Welch, E.B., and J.M. Jacoby, 2004. Pollutant Effects in Freshwater, Applied Limnology, Third Edition, Spon Press, New York, NY. Wetzel, R.G., 1983. Limnology, Second Edition: Philadelphia, Saunders College Publishing, 858 p. Whiley, A.J. and Cleland, B., 2003. Wenatchee National Forest Water Temperature TMDL: Technical Report. Washington State Department of Ecology. Publication No. 03-10-063. www.ecy.wa.gov/biblio/0310063.html. November 2003.
Page 87

This page is purposely left blank
Page 88

Appendices
Page 89

This page is purposely left blank
Page 90

Appendix A
Publicly-Owned Treatment Works, Permit Limits and Background
by Steven Golding
Leavenworth POTW The NPDES Permit No. WA-002097-4 for the City of Leavenworth Publicly-Owned Treatment Works (POTW) became effective May 1, 2005, and expires April 30, 2010. Discharge is to the Wenatchee River.
Effluent Limitationsa: Outfall # 001 Parameter Average Monthly Average Weekly
BOD5 30 mg/L; 210 lbs/day 85% minimum removal 45 mg/L; 315 lbs/day
Total Suspended Solids 30 mg/L; 210 lbs/day 85% minimum removal 45 mg/L; 315 lbs/day
Fecal Coliform Bacteria 200/100 mL 400/100 mL pH Shall not be outside the range of 6.0 – 9.0
a The average monthly and weekly effluent limitations are based on the arithmetic mean of the samples taken, with the exception of fecal coliform which is based on the geometric mean. Schedule of TMDL Compliance: The Permittee shall be in compliance with assigned wasteload allocations by July 14, 2014. The City of Leavenworth operates wastewater collection and treatment facilities serving residential and commercial customers within the city limits of Leavenworth. In recent years the treatment plant reached, and on occasion exceeded, its design capacity. In addition, the city determined that the treatment plant did not have the capability to meet receiving water standards for toxic constituents. In addition, the collection system was found to have several major deficiencies, with portions over 50 years old and reaching the end of their service life. Finally, a significant population growth for the city was projected over the next 20 years, suggesting a further demand on wastewater services. In response, the city prepared a Wastewater Facilities Plan in 1996. The plan recommended a comprehensive program of collection system rehabilitation and maintenance, including separation of storm sewers from the sanitary sewer system, and expansion and upgrade of the treatment plant, including an improved sludge management program, ultraviolet (UV) disinfection, and enhanced treatment capacities. Improvements in the Facilities Plan were based on a 20-year planning horizon (1995 to 2015), when the service population is predicted to increase from 2020 to 4483. Between 1971 and 1973, a major project was undertaken to separate stormwater flows from the sanitary wastewater flow by constructing a separate storm sewer system. The Facility Plan has
Page 91

addressed deficiencies in the collection system, and the city signed a contract to implement a TV inspection of the system to identify areas of needed repair or replacement. The Leavenworth POTW has been upgraded. Before the upgrade, the plant consisted of headworks, two oxidation ditch aeration basins, two secondary clarifiers, chlorination facilities, and discharge to the Wenatchee River. With the new POTW, wastewater processing begins with an anoxic conditioning tank, or selector, to improve sludge settling characteristics. The wastewater is then processed by a new oxidation ditch aeration basin, followed by secondary clarification and UV disinfection, before being discharged to the Wenatchee River. The process for the current permit included a preliminary evaluation of the discharge’s potential for exceedance of the water quality standards for ammonia. Based on this preliminary evaluation, the discharger does not have a reasonable potential for exceedance of the water quality standards for ammonia. Nitrification (oxidation of ammonia) is expected to occur in the normal course of biological treatment in the plant, especially in warmer seasons. The permit recommends that the plant operator implement necessary actions to maintain optimum plant nitrification during the critical period. Peshastin POTW Permit No. WA-005217-5 for Chelan County PUD No. 1, Community of Peshastin POTW became effective January 1, 2005, and expires on December 31, 2009. Discharge is to the Wenatchee River.
Effluent Limitations: Outfall # 001
Parameter Average Monthlya Average Weeklyb BOD5 30 mg/L; 27.5 lbs/day 45 mg/L; 41.25 lbs/dayTotal Suspended Solids 30 mg/L; 27.5 lbs/day 45 mg/L; 41.25 lbs/dayFecal Coliform Bacteria 200/100 mL 400/100 mL pH Shall not be outside the range of 6.0 – 9.0
a The average monthly effluent limitation is defined as the highest allowable average of daily discharges over a calendar month, calculated as the sum of all daily discharges measured during a calendar month divided by the number of daily discharges measured during that month. b The average weekly effluent limitation is defined as the highest allowable average of daily discharges over a calendar week, calculated as the sum of all daily discharges measured during a calendar week divided by the number of daily discharges measured during that week. Schedule of TMDL Compliance: The Permittee shall be in compliance with assigned wasteload allocations no later than ten years after the permit is issued. The Peshastin Wastewater Treatment Plant (or POTW) serves the unincorporated community of Peshastin and two fruit packing facilities near the plant. There have been plans to provide service to an additional industrial site being developed adjacent to the POTW. In the past, chemical additives used by the fruit packers have interfered with the treatment plant’s ultraviolet disinfection process, causing exceedances of its fecal coliform effluent limits. The fruit packers decided to conduct an engineering study to correct their pretreatment problems.
Page 92
Wastewater from residences receives preliminary treatment in a septic tank effluent pumped (STEP) system. Preliminary treatment occurs on-site at each residence, since the septic tank acts as a primary clarifier. Most of the solids remain in the septic tank; therefore, smaller diameter sewer lines are used, and the main treatment plant does not require grit chambers, bar screens, or other unit processes typically associated with headworks. Flows entering the main treatment plant are first pretreated by caustic soda or pre-chlorination injection systems, if necessary. The caustic soda system is used to maintain effluent pH above 6.0. The treatment plant is designed to nitrify wastewater (oxidize ammonia). During the nitrification process, wastewater alkalinity is consumed. Once all or most of the alkalinity is consumed, nitrification is diminished and the wastewater is subject to rapid changes in pH. During operation of the caustic injection system, the operator must closely monitor ammonia levels and effluent pH. The purpose of the pre-chlorination system is to minimize toxicity and odors caused by hydrogen sulfide in the influent, a common occurrence with pressurized collection systems. The treatment plant uses a sequential batch reactor (SBR) system to provide secondary treatment. Two SBR systems react independently, with only one operated during seasons of lower influent flow. Each SBR follows a four-phase process that combines aeration and clarification in the same basin, thereby eliminating the need for separate clarifiers and return activated sludge pumps. Each SBR can also be converted for ammonia, phosphorus, or nitrogen removal by altering the aeration and settling sequences. After leaving the SBRs, the effluent passes in front of ultraviolet lamps for final disinfection. The plant has two sludge digesters. During normal operation, the SBR system is completely automated, although the operator must monitor process control parameters to ensure the system processes are working effectively. Cashmere POTW Permit No. WA-002318-3 for the City of Cashmere POTW was issued January 22, 2001, became effective March 1, 2001, and expired February 28, 2006. The final limitations, shown in the table below, began on July 1, 2003, lasting through February 28, 2006. Discharge is to the Wenatchee River.
Effluent Limitations: Outfall # 001 Parameter Average Monthly Average Weekly
BOD5 45 mg/L, 354 lbs/day and 65% minimum removal 65mg/L, 511 lbs/day
Total Suspended Solids 75 mg/L, 590 lbs/day 112 mg/L, 880 lbs/day Fecal Coliform Bacteria 200/100 mL 400/100 mL pH Shall not be outside the range of 6.0 – 9.0
Additional Effluent Limitations: Outfall # 001 Parameter Average Monthly Daily Maximum Total Residual Chlorine Minimized 0.05 mg/L, 0.4 lbs/day Total Ammonia To be determined To be determined
Page 93
The Cashmere POTW provides wastewater collection and treatment for a combination of residential, commercial, and industrial contributors. Industrial users are Tree Top, Inc, a fruit processing facility, two fruit packing facilities, and Liberty Orchards, makers of applets and cotlets candies. The facility provides secondary treatment with a three-cell lagoon system, chlorine disinfection, and dechlorination. The city also operates a Bulk Volume Fermenter (BVF) for pretreatment of fruit processing wastes. The city had intermittent compliance problems during the permit period beginning 1995 as a result of algal blooms in the lagoons. In the late autumn of 1999, the city installed baffles and a cover over the final lagoon, which, according to the current fact sheet, appears to have eliminated compliance problems related to algal blooms. The fact sheet states that the city has been adding hydrochloric acid to control pH, and notes that suspended solids cannot be easily controlled, exceeding permit limits three to four months of the summer and early fall. During the current 2002-2003 Wenatchee TMDL sampling events, some samples were noticeably green and the lagoons continue to produce a high pH effluent at times. City personnel continue to add acid to the effluent seasonally to bring pH to within permit limits. The permit issued in 2001 requires compliance with the established effluent limits and self-monitoring to verify compliance: two Infiltration and Inflow Evaluations, two Wasteload Assessments, and a new Operation and Maintenance Manual. In 1999, the city requested an amendment to its urban growth boundary. The annexation added approximately 96 acres to the west of the city, including the Chelan County Fairgrounds. The annexation resulted in a 30% increase in the population projections contained in the 1995 Comprehensive Sewer Plan. In November 1999, the Department of Ecology received an amendment to the plan which describes measures the city took to accommodate the expanded wastewater service area. These measures include construction of the West Cashmere Lift Station and the addition of 4.5 miles of sewer pipe. The amendment to the plan was approved by Ecology in November 1999. Expansion of the collection system was completed in September 2000. A Facility Plan was written in response to an Administrative Order issued by Ecology in 1995. The order noted that the city’s treatment facilities had neared or exceeded NPDES permitted influent and discharge capacities on a number of occasions, and required the city to submit a plan to maintain adequate capacity. The city’s facility planning is being undertaken in two phases, Phases I and II, to cover a 20-year planning horizon. Planned improvements include replacement of the lift station, removal of stormwater discharges, installation of a cover over lagoon #3, installation of a dechlorination system, and implementation of a groundwater monitoring program. These had been accomplished at the time of permit issuance, with the groundwater monitoring program in development.
Page 94
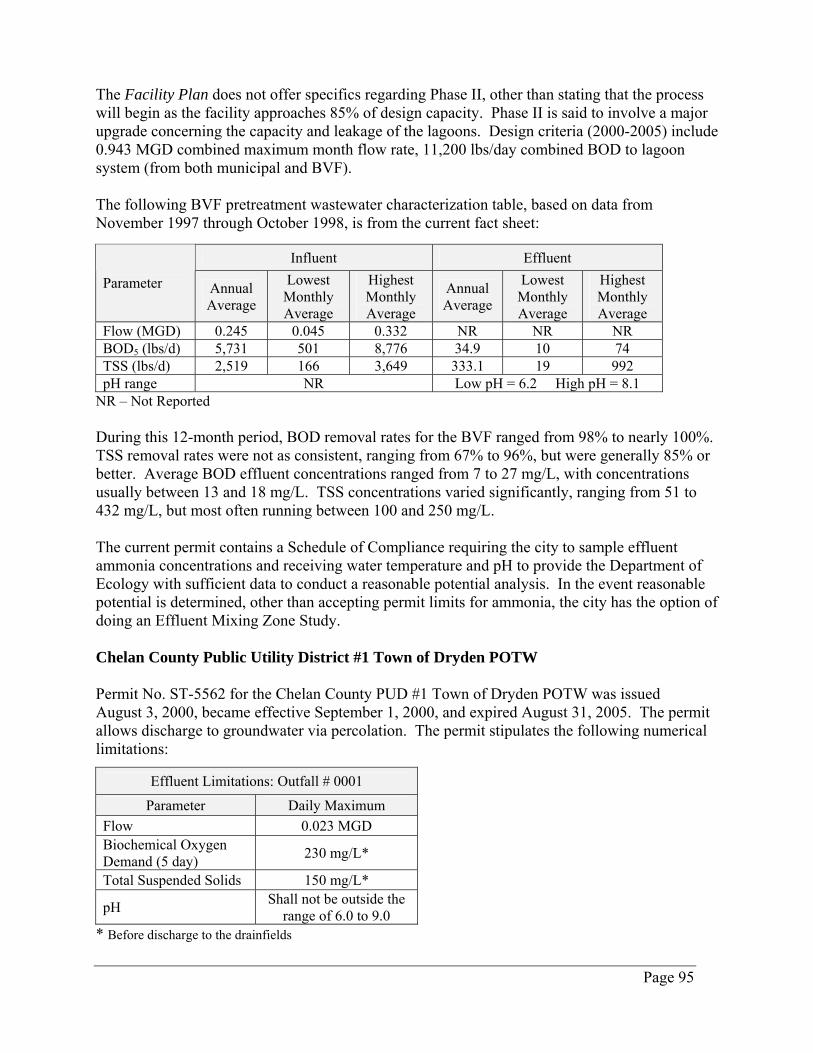
The Facility Plan does not offer specifics regarding Phase II, other than stating that the process will begin as the facility approaches 85% of design capacity. Phase II is said to involve a major upgrade concerning the capacity and leakage of the lagoons. Design criteria (2000-2005) include 0.943 MGD combined maximum month flow rate, 11,200 lbs/day combined BOD to lagoon system (from both municipal and BVF). The following BVF pretreatment wastewater characterization table, based on data from November 1997 through October 1998, is from the current fact sheet:
Influent Effluent
Parameter Annual Average
Lowest Monthly Average
Highest Monthly Average
Annual Average
Lowest Monthly Average
Highest Monthly Average
Flow (MGD) 0.245 0.045 0.332 NR NR NR BOD5 (lbs/d) 5,731 501 8,776 34.9 10 74 TSS (lbs/d) 2,519 166 3,649 333.1 19 992 pH range NR Low pH = 6.2 High pH = 8.1
NR – Not Reported During this 12-month period, BOD removal rates for the BVF ranged from 98% to nearly 100%. TSS removal rates were not as consistent, ranging from 67% to 96%, but were generally 85% or better. Average BOD effluent concentrations ranged from 7 to 27 mg/L, with concentrations usually between 13 and 18 mg/L. TSS concentrations varied significantly, ranging from 51 to 432 mg/L, but most often running between 100 and 250 mg/L. The current permit contains a Schedule of Compliance requiring the city to sample effluent ammonia concentrations and receiving water temperature and pH to provide the Department of Ecology with sufficient data to conduct a reasonable potential analysis. In the event reasonable potential is determined, other than accepting permit limits for ammonia, the city has the option of doing an Effluent Mixing Zone Study. Chelan County Public Utility District #1 Town of Dryden POTW Permit No. ST-5562 for the Chelan County PUD #1 Town of Dryden POTW was issued August 3, 2000, became effective September 1, 2000, and expired August 31, 2005. The permit allows discharge to groundwater via percolation. The permit stipulates the following numerical limitations:
Effluent Limitations: Outfall # 0001
Parameter Daily Maximum Flow 0.023 MGD Biochemical Oxygen Demand (5 day) 230 mg/L*
Total Suspended Solids 150 mg/L*
pH Shall not be outside the range of 6.0 to 9.0
* Before discharge to the drainfields
Page 95
The Chelan County Public Utility District (PUD) #1 constructed the Town of Dryden POTW in the summer of 1981 as a septic tank/drainfield treatment system. The system was designed to serve 60 connections. No expansion or rehabilitation of major facilities is currently scheduled. However, capacity of the plant will be required to be monitored as the connected population increases over the years. The treatment facilities consist of two 23,000 gallon concrete septic tanks, a splitter box, three drainfield trenches comprising 1.37 acres, and two 841-gallon dosing tanks. The drainfield pipe is 4-inch diameter perforated, designed to distribute 1.1 gallons per square foot per day. The permit fact sheet states that the wastewater receives anaerobic and then aerobic treatment, “which is considered an excellent way to disinfect wastewater prior to discharge back to groundwater near the Wenatchee River. Once the drainfield oxidants and reductants have been consumed by the river flora and fauna, only the non-nutrient salts will remain in the waters of the Wenatchee River.” Typically, only two drainfields are loaded at any time with the third left to rest, giving the plan a hydraulic design capacity of 23,000 gallons per day. The fact sheet states that “while resting, a drainfield breathes and fully oxidizes any ammonia that has been deposited in the soil.” The remaining two drainfields operate continuously during the resting period of one year. The fact sheet does not assess the potential for unoxidized ammonia to percolate into the river from the two active drainfields. Discharge flow from the plant is determined by noting the count of tank drainages. Dave Johnston of the PUD indicated that flow distribution between the two active tanks has been erratic at times, and the PUD has not been able to improve plant operation in this respect. He also pointed out a fruit packer about 200 feet uphill from the POTW. The fruit packer was spray irrigating what may have been process water at the time of Ecology’s September 2002 visit. The fact sheet states that the gravel and cobble-filled soils of the drainfield will be difficult to assess. Monitoring from two wells was required until Ecology determined the data were not of value in assessing the plant discharge (Dave Holland/ WQ/ CRO, personal communication, 2002). The permit required a Plan for Maintaining Adequate Capacity and an Infiltration and Inflow Evaluation, both to be submitted by March 1, 2003.
Page 96
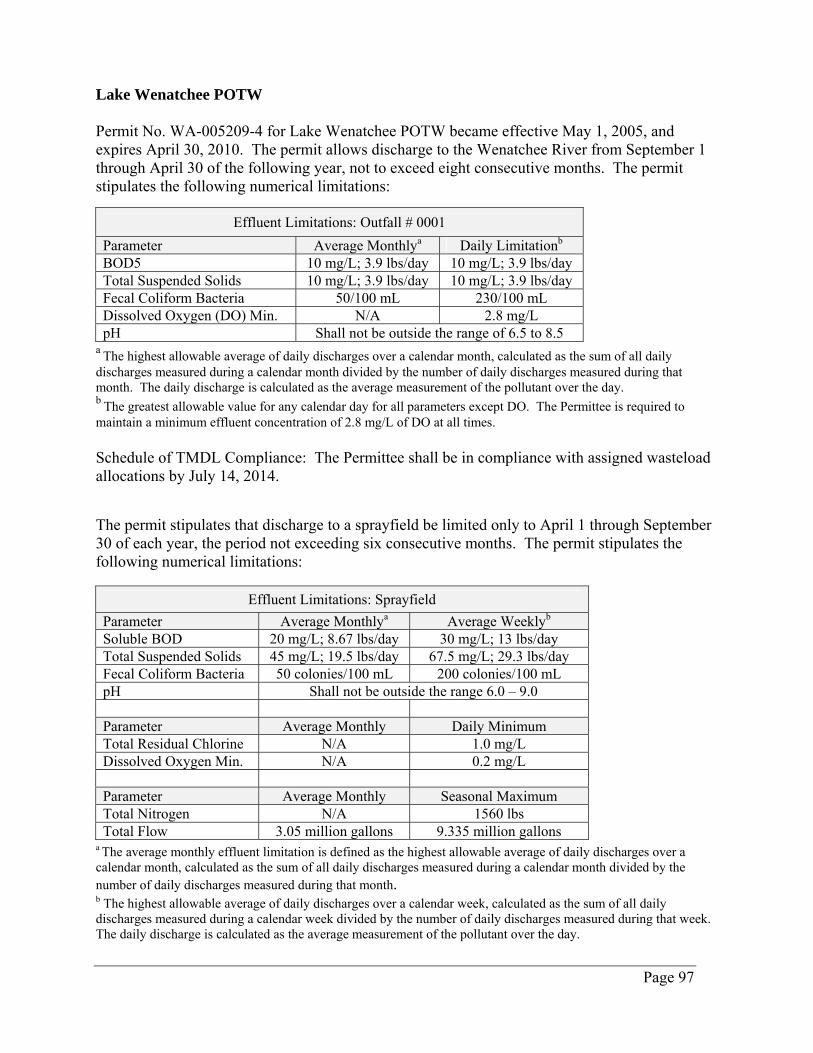
Lake Wenatchee POTW Permit No. WA-005209-4 for Lake Wenatchee POTW became effective May 1, 2005, and expires April 30, 2010. The permit allows discharge to the Wenatchee River from September 1 through April 30 of the following year, not to exceed eight consecutive months. The permit stipulates the following numerical limitations:
Effluent Limitations: Outfall # 0001 Parameter Average Monthlya Daily Limitationb BOD5 10 mg/L; 3.9 lbs/day 10 mg/L; 3.9 lbs/day Total Suspended Solids 10 mg/L; 3.9 lbs/day 10 mg/L; 3.9 lbs/day Fecal Coliform Bacteria 50/100 mL 230/100 mL Dissolved Oxygen (DO) Min. N/A 2.8 mg/L pH Shall not be outside the range of 6.5 to 8.5
a The highest allowable average of daily discharges over a calendar month, calculated as the sum of all daily discharges measured during a calendar month divided by the number of daily discharges measured during that month. The daily discharge is calculated as the average measurement of the pollutant over the day. b The greatest allowable value for any calendar day for all parameters except DO. The Permittee is required to maintain a minimum effluent concentration of 2.8 mg/L of DO at all times. Schedule of TMDL Compliance: The Permittee shall be in compliance with assigned wasteload allocations by July 14, 2014.
The permit stipulates that discharge to a sprayfield be limited only to April 1 through September 30 of each year, the period not exceeding six consecutive months. The permit stipulates the following numerical limitations:
Effluent Limitations: Sprayfield Parameter Average Monthlya Average Weeklyb Soluble BOD 20 mg/L; 8.67 lbs/day 30 mg/L; 13 lbs/day Total Suspended Solids 45 mg/L; 19.5 lbs/day 67.5 mg/L; 29.3 lbs/day Fecal Coliform Bacteria 50 colonies/100 mL 200 colonies/100 mL pH Shall not be outside the range 6.0 – 9.0 Parameter Average Monthly Daily Minimum Total Residual Chlorine N/A 1.0 mg/L Dissolved Oxygen Min. N/A 0.2 mg/L Parameter Average Monthly Seasonal Maximum Total Nitrogen N/A 1560 lbs Total Flow 3.05 million gallons 9.335 million gallons
a The average monthly effluent limitation is defined as the highest allowable average of daily discharges over a calendar month, calculated as the sum of all daily discharges measured during a calendar month divided by the number of daily discharges measured during that month. b The highest allowable average of daily discharges over a calendar week, calculated as the sum of all daily discharges measured during a calendar week divided by the number of daily discharges measured during that week. The daily discharge is calculated as the average measurement of the pollutant over the day.
Page 97
Treated effluent is discharged to Class AA waters of the Wenatchee River during cold weather months. The facility collects and treats wastewater from private residences, a few commercial businesses, public and private campgrounds, and a U.S. Forest Service ranger station located around the eastern end of Lake Wenatchee. The collection system is a STEP system; primary-level treatment of wastewater occurs in on-site septic tanks and is then conveyed to the main treatment plant through pressurized sewers. During warm weather months, secondary level treatment occurs in a facultative lagoon and an adjacent 11.2 acre sprayfield. Wastewater receives tertiary-level treatment during cold weather months through use of a recirculating sand filter and polishing tank. Tertiary treated effluent is discharged to the Wenatchee River. The Permittee’s record of compliance was excellent for the permit cycle ending 2000. Influent design criteria of the treatment plant were exceeded in 1999 as the collection system was expanded to the state park. The inclusion of the state park took place without the addition of treatment capacity, as specified in 1997 engineering plans. Therefore the current permit requires submittal of a Plan to Maintain Adequate Capacity to the Department of Ecology.
Page 98
Appendix B
2002-03 Sampling of Publicly-Owned Treatment Works, Summary of Field Notes and Influences of
Sampling on BOD Results
by Steven Golding The following is a summary of three sampling events of wastewater plants for the Wenatchee TMDL. The sampling events were conducted July 22-25, August 26-29, and September 23-25, 2002. Dave Holland of Ecology’s Central Regional Office assisted in July, Nigel Blakely assisted in August, and Kim Gridley assisted in August. The Leavenworth POTW, Leavenworth Federal Fish Hatchery (Icicle Creek), Peshastin POTW, and Cashmere POTW were sampled on all three events. In addition, the Lake Wenatchee POTW influent and effluent were grab-sampled in August, as were the Dryden influent and effluent in September. Leavenworth POTW The Leavenworth POTW discharges to the river throughout the year. The plant employs UV disinfection. The plant discharges to the river through a single port diffuser at the center of the river. July 22-25 ’02 sampling event A compositor was set up to take equal volumes of effluent every 30 minutes for 48 hours. A strainer was placed 3 feet upstream of the partial flume, after UV disinfection. No seed was added to the BOD sample and, in concept, the result may have been an artificially low BOD result since the microorganisms needed for a valid BOD test may have been killed by the UV. Lisa Reed of the Leavenworth POTW lab says that they also sample after UV and do not seed the BOD samples because they are concerned that with the plant’s low BOD; seed would raise the BOD result artificially.
The Winkler sample for dissolved oxygen was taken just downstream of a one-foot fall, just upstream of the Parshall flume, in non-turbulent effluent.
August 26-29 ’02 sampling event The compositor intake was moved to just before UV so that the sample would contain microorganisms for the BOD test. In this way, no seed was needed, and none was added to the sample. The August result can be considered a valid BOD result for comparison with July’s sample, collected and tested in the same way that the Leavenworth POTW plant does. Consider total organic carbon (TOC) and total suspended solids (TSS) during sampling events as an indicator of true plant performance; they should correlate with BOD.
Page 99
All Winkler and bacteria samples were taken after UV for all three sampling events.
As a result of a communications mix-up, we (Ecology) used TOC filters for orthophosphate samples for all POTWs, August sampling event only. A preliminary result of a later blank we submitted of blank water filtered with a TOC filter and analyzed for orthophosphate showed no contamination, so orthophosphate results for August may be acceptable.
Bill Russ, the plant operator, reported to the Ecology Central Regional Office a spill to the river that took place August 18, 2002. Upon arriving to work at 7:30 AM on August 18, the operator found that a check valve had failed and that a discharge of largely raw influent to the river had been taking place for about three hours. The estimated spill volume was 46,400 gallons, with an estimated 1,250 pounds of solids.
September 23-25 ’02 sampling event The composite sample was collected upstream of UV, and the BOD test was conducted without seed, as in August. A portion of the sample was of UV disinfected wastewater. When Bill Russ told us he had changed his UV flow scheme since August, we moved the compositor to collect most of its sample upstream of UV. Because UV has no residual, as does chlorine disinfection, and because most of sample was before UV, it can safely be assumed there were plenty of microorganisms for a valid BOD test with no need of seed.
April 7-9 ‘03 sampling event A compositor was set up in the screening building to collect influent just upstream of screening. The strainer was in only about 4 inches of water so we let the strainer lie on the channel bottom; Flow was turbulent so the sample should be fairly representative. When the scum pump is operating, there is a recirculated stream added upstream of this sampling spot, but the operator reported that the scum pump would not be in operation while Ecology was sampling. BOD testing of the influent sample was requested to be done without seed.
The effluent compositor was set up to sample before (upstream) of UV treatment. The intake was attached to a bamboo pole and placed about 2 feet below the surface. Coliform samples and dissolved oxygen samples were grabbed after UV treatment at the upstream end of the Parshall flume. Because the composite sample was taken before disinfection, effluent BOD testing was requested without seed.
Plant Flows:
8AM July 22 – 8AM July 23 2002: 321,566 gallons per day 8AM Aug 27 – 8AM Aug 28 2002: 356,104 gallons per day 8AM Sept 24 – 8AM Sept 25 2002: 339,864 gallons per day 8AM April 7 – 8 AM April 8 2003: 281,570 gallons per day
Page 100
Peshastin POTW
The Peshastin POTW, rather than treating wastewater continuously as do most wastewater treatment plants, treats wastewater in batches alternately in two tanks known as sequential batch reactors (SBRs). Peshastin is a small town, and much of the influent comes seasonal from two fruit processors during the packing season that begins in late summer. The SBRs are set to discharge at fixed time intervals (approximately every two hours) when flow does not exceed normal conditions. The SBR tanks are 24 feet in depth, and the top 2 feet is decanted with each cycle. We set our compositors with this fixed time interval so that we would sample only during plant discharge periods. The plant was operating its sampler at shorter fixed intervals so that the sample was being collected when there was no discharge and the effluent was stagnant and warm. I discussed with Dave Johnston, the plant operator, how this leads to invalid samples. We do not know whether this situation was remedied. The plant uses UV disinfection. July ‘02 sampling event The composite sample was collected downstream of UV and, although the microorganisms necessary for a valid BOD may have been killed by the UV, the BOD test was run without seed. As in the Leavenworth POTW sample, the BOD result should be compared with the August and September sampling events (they were sampled in a valid way).
The plant was operating at half capacity, with only one of the SBR tanks, and flow was relatively low since the fruit packers were not yet in the packing season (Dave Johnston said only Bluebird was contributing a small flow of about 2000-3000gpd. He reads their influent flow with a flow meter). The plant operated as expected with fixed timing cycles, and our compositor collected samples during discharge periods as expected. Because the municipal wastewater contribution to this plant is small and fruit packer wastewater is a major contributor and variable, the plant flow from day-to-day varies more for this plant than most.
August ’02 sampling event The compositor intake was placed before the UV so that the BOD sample would have plenty of microorganisms and not need to be seeded. All dissolved oxygen and bacteria samples were taken after UV for all three 2002 sampling events. Because plant flow was higher than expected, the plant was not running on a fixed time cycle and the composite sample could not be used. Dave Johnston said that both Blue Bird and Hi Up (fruit packers) had just started seasonal contributions of wastewater that day. He had not expected Hi Up to be discharging yet. Plant flow records for August show plant flow lower than 40,000 gallons per day from Aug 2-26. August 27, the time we (Ecology) were there, shows a jump in flow to 57,274 gallons. Dave was preparing to begin using the plant’s second SBR tank, but it would not be running during our inspection.
Page 101
The plant was in normal low-flow season operation during our July sampling. In September, it was in normal high-flow season operation. During this August sampling event it was in transition and operating at a higher load than normal. We took a grab sample of effluent during a discharge cycle at 1600 on August 26 to represent effluent during this relatively brief transition period of plant operation. The reason they do not run both SBR tanks year-round is that the microorganisms (“bugs”) wouldn’t have enough food (organics) to maintain a healthy population.
September ’02 sampling event The plant was operating with both SBR tanks in operation, and the fruit processing plants were discharging to the city’s sewer system to the Peshastin POTW. The 49,000 gpd flow during the sampling period was typical of the packing season, but lower than the 57,274 gpd flow of the August sampling period. The composite sample was collected beginning on a Monday. Operator Dave Johnston told us effluent is weaker early in week after fruit packers are closed on weekends. For this reason, we collected an extra sample at 1330 on September 24 (Tuesday) as well.
April ’03 sampling event The plant was still running with both SBRs as it does throughout the fruit processing season. Blue Bird was still doing some fruit packing and contributing some process water to the POTW. The SBR cycle was 2 hr 25 min, with a cycle to begin 1:30 PM on April 8. The influent was through a pressure line, so I used the facilities compositor for influent, placing our iced base in their open refrigerated sample enclosure. I set up an ISCO sampler to sample every 145 minutes during plant discharge periods, with the intake placed upstream of (before) UV.
Plant flows:
8AM July 23 – 8AM July 24 2002: 37,950 gallons per day 8AM Aug 26 – 8AM Aug 27 2002: 57,274 gallons per day 8AM Sept 23 – 8AM Sept 24 2002: 49,000 gallons per day 8AM April 8 – 8 AM April 9 2002: 32,590 gallons per day Self reporting by the Peshastin POTW shows the following flows for July-Oct ’02:
Avg. (MGD) Max. (MGD)
July 0.035 0.057 August 0.036 0.059 September 0.045 0.058 October 0.051 0.064
Page 102
Cashmere POTW
The Cashmere POTW is a 3-lagoon system. The plant chlorinates and dechlorinates with SO2. The city samples before chlorination. This may inflate BOD results. We (Ecology) set up the compositor at the outlet of the last lagoon, also before chlorination, for all three sampling events. It should be noted that the SO2 added downstream of our sampling location exerts an additional oxygen demand not included in the sample. This also provides a sample with microorganisms that does not require seed. Dissolved oxygen and bacteria samples were collected after chlorination and dechlorination for all three 2002 sampling events. The city dredged cell #1 the day before the July sampling. This would create a tendency toward lower quality effluent with more solids and associated organics, but Tom Hastings, operator, said he didn’t think it would have any effect. The plant has a seasonal algae problem and high pH, so plant personnel add HCl to the effluent as needed. During the September sampling event, Tom Hastings said they hadn’t added any acid since the end of July (they only do so when pH >9). We measured a pH of 8.09 during the September 2002 sampling event, and Tom said they measured about 8.1.
April ’03 sampling event As in previous sampling events, the downstream half of the final pond was covered with black plastic to reduce algal growth and corresponding rises in pH. The pH was running about 8.5 according to operator Tom Hastings. He said they were not adding acid yet for the season, as they will be later in the summer to bring down effluent pH as a result of algal pH increases. The water in the first pond looked green as it was sprayed by the aerator. The TOC effluent sample looks green as compared with the DOC clear sample. The city samples influent as two separate flows, separately from the city and the Treetop Bulk Volume Fermenter (BVF). Since this was impractical to do, I collected grab samples from the influent box where the two influents come in from separate pipes and mix. The effluent compositor intake was submerged in the effluent box from the final pond, as in all previous sampling events. As before, dissolved oxygen and coliform samples were taken after disinfection, at the outfall of the chlorination basin, just upstream of a one-foot drop into a vertical outflow pipe. The plant operator, Tom Hastings, reports effluent BODs in the range of 20 to 30 mg/L.
Flows:
7:30 AM July 24 – 7:30 AM July 25 2002: 0.3424 MGD 7:30 AM Aug 26 – 7:30 AM Aug 27 2002: 0.3955 MGD 7:30 AM Sept 23 – 7:30 AM Sept 24 2002: 0.300 MGD 7:30 AM April 7 – 7:30 AM April 8 2003: 0.4420 MGD
Page 103
Leavenworth Federal Fish Hatchery (Icicle Creek)
Main discharge at Parshall flume to river
Two discharges were sampled at the fish hatchery. The main discharge to the river was sampled in the Parshall flume after the flows from the hatchery were commingled and well-mixed, just before the discharge reached the river. The second discharge was of the settling pond discharge, sometimes referred to by the sampler as “clean” discharge as the pond settled the cleaning water from tank cleaning. During all three 2002 sampling events, the Parshall flume was flowing freely so it could be used for valid measurements. We measured the vertical distance from the water surface at the location in the flume where an ultrasonic detector had been located (a PVC pipe is still there) as this is the location where flow is determined from Parshall flumes. This vertical distance was 205 cm at 1405 on July 23; and 200 cm at 1110 and 208 cm at 1445 on August 27. This lowest flow in August of the three sampling events corresponded with the concrete apron across the river just upstream of the discharge point being dry for the only time during the three sampling events. These vertical measured distances can be used to calculate flows if the Parshall flume width and vertical distance from the top of grate to bottom of flume are known. The sampling point for the grab samples at the Parshall flume was at the upstream end of the flume in July, and it is possible that the two nearby process water streams were not yet well mixed. This was remedied in the August and September sampling when the sampling point was moved to the downstream end of the flume, with considerable turbulence upstream of the sampling point for thorough mixing. Settling pond (abatement pond) discharge Dan Davies of the hatchery provided the following schedule for August cleaning of the 8-ft x 80-ft tanks and the 10-ft x 100-ft tanks. He indicates that no chlorine or any other disinfectant is used in the tank cleaning process.
August 2002
19, Monday upper 8x80s and lower 10x100s 20, Tuesday mid 8x80s 21, Wednesday mid 8x80s and upper 10x100s 22, Thursday lower 8x80s 23, Friday upper 8x80s and lower 10x100s 24, Saturday mid 8x80s 25, Sunday upper 10x100s 26, Monday lower 8x80s and lower 10x100s 27, Tuesday upper 8x80s 28, Wednesday mid 8x80s and upper 10x100s 29, Thursday lower 8x80s
Page 104
During cleaning, the 10-ft x 100-ft tanks are drawn down from a depth of four feet to one foot. The 8-ft x 80-ft tanks are drawn down from 2 ½ feet to one foot. In July a grab sample from the settling pond was collected when we came upon it discharging at 1100 on July 22. Tank cleaning takes place in the morning, and the Ecology flow meter showed that most of the pond discharge takes place at that time of day. We met Ecology co-worker, Dustin Bilhimer, at the cleaning pond on August 28 to read the data-logger for stage. From the data log, we were able to see that there is a high discharge in morning when the tanks are cleaned, with flow tapering off rapidly thereafter. Based on this, we planned to sample the next day, making a flow-weighted grab composite by hand. On August 29, 2002, we grabbed samples every 15 minutes between 0615 and 0930, keeping each sample separate in the bottles of a sequential compositor. Then we flow weighted the samples based on the ISCO flow book charts for approximate flow rate for a 3.75 foot wide weir with end contractions. The maximum flow rate during that period was found to be approximately 6.9 cfs. The total flow volume during the sampling period was calculated to be approximately 17,700 cu ft. If the average baseflow was about 0.3 cfs, an estimate, the unsampled 20.75 hr portion of that day’s flow was approximately 22,400 cu ft, the estimated total flow per 24-hour period being 30,100 cu ft. Because the August 29 sampling represented a lower than maximum volume of cleaning water, we sampled during a day when a maximum amount of cleaning water was discharged. I sampled on the morning of Wednesday, September 25, 2002. The depth of flow over the weir was high, noticeably higher than during the August sampling. The maximum flow was estimated to be 7.8 cfs, and the total discharge during the 8:00 AM – 10:00 AM sampling period was approximately 42,700 cu ft, more than double the volume sampled during the August sampling. If baseflow is assumed again to be 0.3 cfs, the flow was 225,200 gallons per day.
Summary estimated flows for Hatchery abatement pond
August 29, 2002: 30,100 cu ft (24-hour period) September 25, 2002: 66,460 cu ft (24-hour period)
More precise measurements of flows in the hatchery abatement pond may be determined from the continuous flow recording devices Ecology placed in operation during the 2002-03 survey period.
Dryden Treatment System The small community of Dryden treats its wastewater in a community septic system. The system is operated by Dave Johnson, who also operates the Peshastin plant. Dave says that the groundwater problems in the area may be, at least in part, a result of the irrigation a few hundred feet uphill from a fruit packing house. Dave Holland of Ecology’s Central Regional Office says that there have been two sampling wells to monitor the effects of the system but that Ecology asked the PUD not to sample any longer since the results were not helpful.
Page 105
The Dryden septic system consists of three drainfields, two being used during any single year. The two chambers being used have an automatic switch to cause their use to be alternated. Dave told us he has had problems with uneven flow and irregular filling between the two tanks. Influent and effluent samples were collected from manholes on September 23, 2002 Lake Wenatchee POTW The Lake Wenatchee POTW was sampled on August 26, 2002. Discharge to land is permitted from April 1 through September 30. During the winter, a filter is used to improve effluent quality to tertiary standards for discharge to Class AA waters of the Wenatchee River. The plant was applying effluent to a sprayfield during the August 2002 sampling, and less restrictive limitations applied than during the April 2003 sampling when discharge was to the river. We sampled from the influent and effluent vaults during the August 2002 sampling. The POTW was sampled again in April 2003 when a recirculating sand filter was being operated for tertiary treatment. I grab-sampled from a pressurized influent line and collected a 24-hour composite sample from the effluent box, just before effluent is released through a culvert to the river. (I did not sample before chlorination because there is a settling basin after the accessible non-chlorinated point). The operator said the effluent was chlorinated to 0.03 mg/L, but not dechlorinated.
Page 106
Appendix C
Data Results for Publicly-Owned Treatment Works
by Steven Golding
The following is a summary of results from data for the wastewater treatment systems sampled. Data include results from effluent sampled in July, August, and September 2002, as well as influent and effluent sampled in April 2003. Quality Assurance/Quality Control The following tables (C1 – C11) show lab duplicate and field replicate results. Pairs of results and lab duplicates for all parameters have a relative percent difference (RPD) of less than 7%, except for chloride at 11% and fecal coliform at 58%. Field replicate results for all parameters had RPDs of less than 15%, except for total suspended solids (TSS) and dissolved organic carbon (DOC). TSS had values of 2 and 3 mg/L, showing good agreement despite the high RPD at these low values. DOC had a RPD of 28%, indicating possible contamination of the field-filtered sample during filtering. Leavenworth POTW The plant performed very well throughout the survey. Effluent BOD5 was nondetectable except for one value of 1.1 mg/L in April 2003. The composite effluent sample had been collected before UV disinfection. This compares with a permit limit of 30 mg/L BOD5. The maximum effluent TSS during the survey was 4 mg/L compared to the permit limit of 30 mg/L. BOD5 removal was found to be 99.5% during the April 2003 sampling event, compared with a permit requirement of 85% removal. TSS removal was 98.9%, compared to a required 85%. Effluent TOC values were close in value throughout the survey, another indication of uniform plant operation for the dates sampled. Effluent ammonia (NH3)–N was less than 0.2 mg/L throughout the survey, compared to a permit limit of 15.5 mg/L. This indicates that near-complete nitrification was taking place, with a removal efficiency of 100.0%. Nitrite-nitrate (NO2-NO3) values were correspondingly elevated to above 7 mg/L throughout the survey, as ammonia was converted to nitrites and then nitrates. Alkalinity was substantially used in the nitrification process in the August 2002 sampling event and, although it was not a factor during the survey, there is the potential for alkalinity to become limiting to nitrification, and the meeting of ammonia permit limits. Fecal coliform counts were well within permit limits for the dates sampled. Field measurements of pH showed all values within the permit limit of 6.0 – 9.0.
Page 107

In July we sampled after UV disinfection and did not add seed for the BOD test. This is the protocol the POTW uses for its monitoring. It is possible that this can cause an artificially low BOD result since UV can kill the microorganisms that are necessary for biochemical oxidation in the BOD test. In July and August we sampled upstream of UV and added no seed. The POTW continued to sample downstream of UV and add no seed. The following analysis is to test the hypothesis that sampling downstream of UV without adding seed suppresses the biochemical reactions in the BOD test, causing an under-reporting of BOD during the first (July) sampling event. BOD5 TSS TOC (all mg/L, all composite samples) July 2U 3 4.7 Aug 2U 4 5.8 Sept 2U 2 4.9 With the effluent of similar quality with respect to TSS and TOC (an indicator of organic content), the BOD5 tests showed the same nondetect result. The effect of sampling downstream of UV and not adding seed when BOD is within the detectable range is not known. The possibility should be considered that during periods of less effective plant operation than were observed during this survey, the plant under-reports effluent BOD. Peshastin POTW The plant performed well during the survey. Because of the variable nature of the fruit processing influent and the small size of the plant, the operator had to make adjustments, but effluent quality remained good. Effluent BOD5 was 4 mg/L and 6 mg/L (est.) compared to a permit limit of 30 mg/L. BOD5 removal was determined in April 2003 and found to be 98.8%, compared to a permit limit of 90%. Effluent TSS ranged from not detectable at a detection limit of 1 mg/L to 4 mg/L. TSS removal was calculated at 84.2% in April 2003, slightly under the permit requirement of 85%. This was a result of the unusually low influent TSS concentration of 19 mg/L, presumably due to the nature of fruit industry process water. Nitrification was near complete during the survey, with effluent NH3 concentrations consistently below 0.2 mg/L, meeting permit limits of 10 mg/L. NO2-NO3 concentrations were correspondingly high, above 12 mg/L except for values below 3 mg/L in July 2002. Ammonia removal was 100.0% in April. Alkalinity was not close to limiting nitrification. Fecal coliform permit limits were met, with most values below detection limits. All effluent pH values determined in the field were within permit limits. Cashmere POTW The plant performed well during the survey. Effluent BOD5 ranged from 16 – 22 mg/L during the survey, compared to a permit limit of 45 mg/L. BOD5 removal efficiency calculated from
Page 108
April 2003 data was 82.2%, meeting the permit limit of 65%. Effluent TSS values ranged from 6 – 20 mg/L, meeting the permit limit of 75 mg/L. TSS removal efficiency was calculated at 84.4% in April 2003. Nitrification (oxidation of ammonia) was largely incomplete. Effluent NH3 concentrations ranged from 1.42 – 8.38 mg/L. NO2-NO3 effluent concentrations were all below 0.8 mg/L except for one anomalous value of 4.95 mg/L. The finding in April 2003 of effluent ammonia concentrations of approximately 8 mg/L compared to an influent concentration of 12.4 mg/L, as well as the relatively high NH3 concentrations throughout the survey, suggest that low NO2-NO3 effluent concentrations cannot be explained to be a result of denitrification in anoxic conditions, as might be suspected. Substantial alkalinity was present to provide for potential denitrification. This is further supported by alkalinity declining only slightly between influent and effluent in April. As the plant was functioning, with little nitrification occurring, effluent NH3 concentrations provided an oxygen demand for the receiving water. Effluent fecal coliform counts ranged from 14 – 170 (est.)/100 mL, meeting the permit limit of 200/100 mL monthly and 400/100 mL weekly. Field measurements of effluent pH were within limits during the survey. Lake Wenatchee POTW The plant performed well during the survey. Effluent BOD5 was found to be 5 and 1.3 mg/L during the survey, compared to seasonal permit limits of 10 mg/L total BOD5 and 20 mg/L soluble BOD5, respectively. BOD5 removal efficiency calculated from April 2003 data was 98.8%. BOD5 removal was also efficient during the sprayfield discharge season in August 2002. Effluent TSS values were 50 mg/L in August, compared to a permit limit of 67.5 mg/L average weekly for the sprayfield season. The effluent TSS value in April was 1 mg/L, compared to a permit limit of 10 mg/L daily. TSS removal efficiency was calculated at 90.0% in April 2003. Effluent TSS was higher in August than was influent TSS. Nitrification was essentially complete both in August and April, with NO2-NO3 concentrations of 27.5 (est.) and 22.2 mg/L and NH3 concentrations of 0.128 and 0.122 mg/L for those two months, respectively. These ammonia concentrations are well below the permit limit for discharge to the river of 7 mg/L average monthly. Ammonia removal efficiency in April was 99.5 %. Sufficient alkalinity remained in the effluent so as not to constrain nitrification, with effluent alkalinity dipping to 31 mg/L (est.) only in August, a level that suggests alkalinity be watched by the plant operator. The fecal coliform count met permit limits, as did the pH measured in the field. Plant flow in August, during the sprayfield season, was reported to be 0.0388 MGD. This is within the average monthly permitted flow of 0.05 MGD for that season.
Page 109
Dryden POTW The Dryden plant is a septic tank system. Influent and effluent can be sampled only from large concrete tanks with quiescent, sluggish flow, placing doubt on the representativeness of the samples. The effluent actually leaving the drainfields near the river could not be measured. BOD5 discharged to the drainfields was found to be 118 mg/L for a single measurement in September 2002, meeting the permit limit of 230 mg/L daily maximum. TSS was 23 mg/L, meeting the permit limit of 150 mg/L. pH was within permit limits. Self-reported flow data for the period of the survey indicate that the permitted daily maximum flow limit of 0.023 MGD was not exceeded. (Flow is recorded only weekly but represent flows less than the limit). Ammonia discharged to the drainfield had a concentration of 25.8 mg/L. Federal Fish Hatchery at Icicle Creek – Main Outfall As shown in the data table, BOD5 and TSS concentrations in the fish hatchery main outfall discharge were below detection limits of 2 mg/L and 1 mg/L respectively. An exception was a TSS concentration of 2 mg/L from a grab sample collected on June 25, 2002. Effluent NH3 concentrations ranged from 0.026 to 0.095 mg/L. While both NH3 and NO2-NO3 were found in low concentrations relative to those of the municipal POTWs in the survey, the finding of NH3 and NO2-NO3 in approximately equal concentrations indicates only partial or no nitrification of ammonia to nitrate was taking place in the facility. Because inflow to the hatchery was not sampled, data indicating changes in nutrients and alkalinity across the hatchery are not available to provide confirmation of this. Effluent alkalinity was more than adequate to allow for complete nitrification of the ammonia concentrations found in the effluent. The finding of only partial nitrification is not surprising since treatment is not provided for flow-through water. Federal Fish Hatchery at Icicle Creek – Abatement Pond Effluent The abatement pond settles solids from daily cleaning of fish-holding tanks. The flow from the abatement pond spikes during the few hours after cleaning during weekday mornings. BOD5 concentrations were not detectable throughout the survey at a detection limit of 2 mg/L. An indication of organic concentration is TOC and DOC, ranging from 1.1 – 1.6 mg/L throughout the survey. DOC tended to be approximately 0.1 mg/L lower than TOC, indicating that the organics in the effluent were substantially in dissolved form. TSS ranged from 2 – 6 mg/L during the survey. NO2-NO3 as nitrogen ranged from nondetect at 0.01 mg/L to 0.139 mg/L. NH3 as nitrogen ranged from 0.05 – 0.071 mg/L. For most sampling dates, NH3 concentrations were higher than NO2-NO3 , indicating little or no nitrification of the pond effluent was taking place. Alkalinity was not limiting to nitrification. Phosphorus results were erratic in June and July, 2002, with two points higher than 49 mg/L. Other phosphorus results for the abatement pond discharge during the survey were 0.103 mg/L or lower.
Page 110
Page 111
Peshastin POTW The Peshastin POTW, like the Leavenworth POTW, was sampled downstream of UV in July and upstream in September. Both tests were run without seed: BOD5 TSS TOC (all mg/L, composite samples) July 4 1U 7.0 Sept 6J 4 12.7 The results show that when the effluent was disinfected with UV and the BOD test was conducted without seed in July, a biochemical reaction took place yielding a BOD (4 mg/L). The September test results were in line with the July results. The somewhat higher BOD5 result in September is consistent with the somewhat stronger effluent as indicated by TSS and TOC. Although there are insufficient data for definite conclusions, it appears that sampling downstream of UV (as in August) provides enough live microorganisms in the sample for valid results without seeding. Any future sampling for the TMDL should continue to be upstream of UV disinfection, to ensure the validity of results, however.
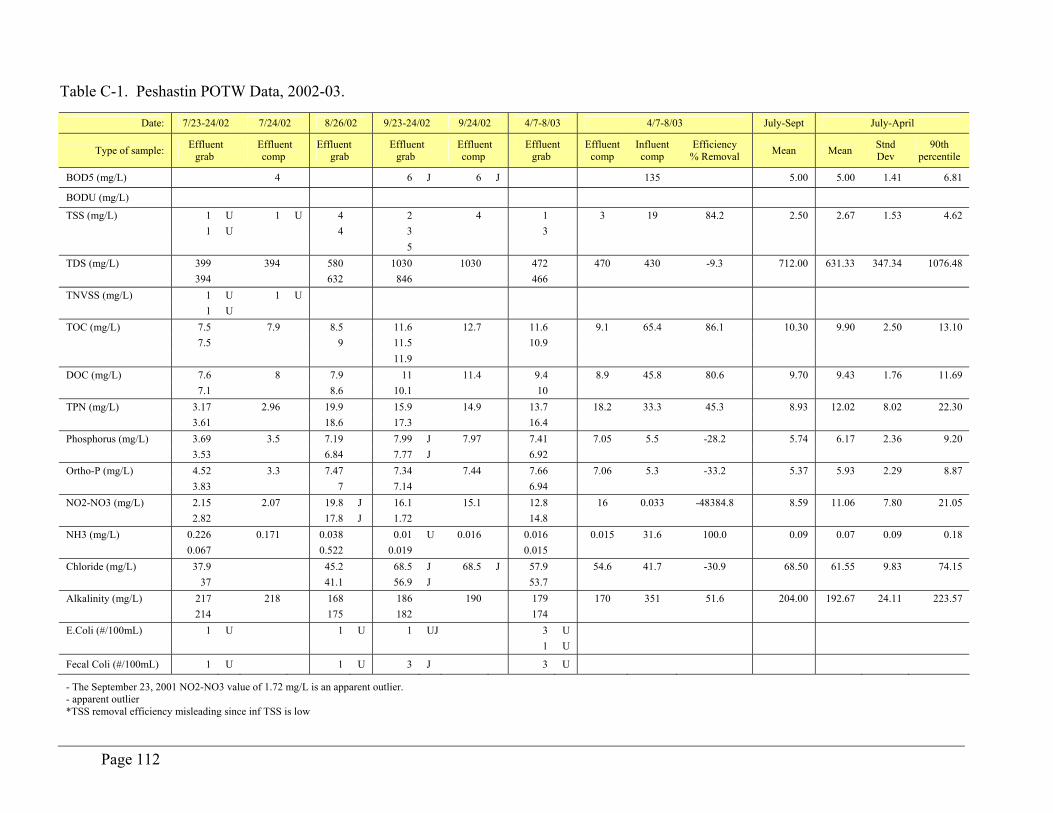
Table C-1. Peshastin POTW Data, 2002-03.
Date: 7/23-24/02 7/24/02 8/26/02 9/23-24/02 9/24/02 4/7-8/03 4/7-8/03 July-Sept July-April
Type of sample: Effluent grab
Effluent comp
Effluent grab
Effluent grab
Effluent comp
Effluent grab
Effluent comp
Influent comp
Efficiency % Removal Mean Mean Stnd
Dev 90th
percentile
BOD5 (mg/L) 4 6 J 6 J 135 5.00 5.00 1.41 6.81
BODU (mg/L) TSS (mg/L) 1 U 1 U 4 2 4 1 3 19 84.2 2.50 2.67 1.53 4.62 1 U 4 3 3 5 TDS (mg/L) 399 394 580 1030 1030 472 470 430 -9.3 712.00 631.33 347.34 1076.48 394 632 846 466 TNVSS (mg/L) 1 U 1 U 1 U TOC (mg/L) 7.5 7.9 8.5 11.6 12.7 11.6 9.1 65.4 86.1 10.30 9.90 2.50 13.10 7.5 9 11.5 10.9 11.9 DOC (mg/L) 7.6 8 7.9 11 11.4 9.4 8.9 45.8 80.6 9.70 9.43 1.76 11.69 7.1 8.6 10.1 10 TPN (mg/L) 3.17 2.96 19.9 15.9 14.9 13.7 18.2 33.3 45.3 8.93 12.02 8.02 22.30 3.61 18.6 17.3 16.4 Phosphorus (mg/L) 3.69 3.5 7.19 7.99 J 7.97 7.41 7.05 5.5 -28.2 5.74 6.17 2.36 9.20 3.53 6.84 7.77 J 6.92 Ortho-P (mg/L) 4.52 3.3 7.47 7.34 7.44 7.66 7.06 5.3 -33.2 5.37 5.93 2.29 8.87 3.83 7 7.14 6.94 NO2-NO3 (mg/L) 2.15 2.07 19.8 J 16.1 15.1 12.8 16 0.033 -48384.8 8.59 11.06 7.80 21.05 2.82 17.8 J 1.72 14.8 NH3 (mg/L) 0.226 0.171 0.038 0.01 U 0.016 0.016 0.015 31.6 100.0 0.09 0.07 0.09 0.18 0.067 0.522 0.019 0.015 Chloride (mg/L) 37.9 45.2 68.5 J 68.5 J 57.9 54.6 41.7 -30.9 68.50 61.55 9.83 74.15 37 41.1 56.9 J 53.7 Alkalinity (mg/L) 217 218 168 186 190 179 170 351 51.6 204.00 192.67 24.11 223.57 214 175 182 174 E.Coli (#/100mL) 1 U 1 U 1 UJ 3 U 1 U Fecal Coli (#/100mL) 1 U 1 U 3 J 3 U
- The September 23, 2001 NO2-NO3 value of 1.72 mg/L is an apparent outlier. - apparent outlier *TSS removal efficiency misleading since inf TSS is low
Page 112
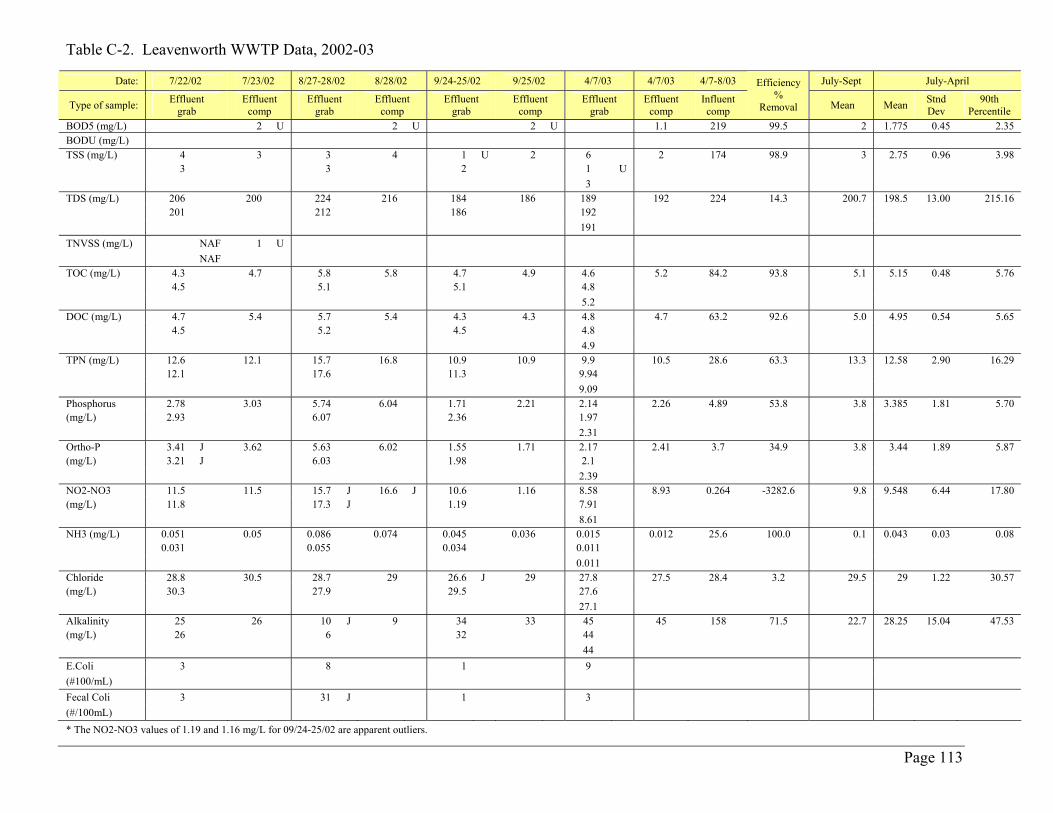
Page 113
Table C-2. Leavenworth WWTP Data, 2002-03
Date: 7/22/02 7/23/02 8/27-28/02 8/28/02 9/24-25/02 9/25/02 4/7/03 4/7/03 4/7-8/03 July-Sept July-April
Type of sample: Effluent grab
Effluent comp
Effluent grab
Effluent comp
Effluent grab
Effluent comp
Effluent grab
Effluent comp
Influent comp
Efficiency %
Removal Mean Mean Stnd Dev
90th Percentile
BOD5 (mg/L) 2 U 2 U 2 U 1.1 219 99.5 2 1.775 0.45 2.35BODU (mg/L) TSS (mg/L) 4 3 3 4 1 U 2 6 2 174 98.9 3 2.75 0.96 3.98 3 3 2 1 U 3 TDS (mg/L) 206 200 224 216 184 186 189 192 224 14.3 200.7 198.5 13.00 215.16 201 212 186 192 191 TNVSS (mg/L) NAF 1 U NAF TOC (mg/L) 4.3 4.7 5.8 5.8 4.7 4.9 4.6 5.2 84.2 93.8 5.1 5.15 0.48 5.76 4.5 5.1 5.1 4.8 5.2 DOC (mg/L) 4.7 5.4 5.7 5.4 4.3 4.3 4.8 4.7 63.2 92.6 5.0 4.95 0.54 5.65 4.5 5.2 4.5 4.8 4.9 TPN (mg/L) 12.6 12.1 15.7 16.8 10.9 10.9 9.9 10.5 28.6 63.3 13.3 12.58 2.90 16.29 12.1 17.6 11.3 9.94 9.09 Phosphorus 2.78 3.03 5.74 6.04 1.71 2.21 2.14 2.26 4.89 53.8 3.8 3.385 1.81 5.70(mg/L) 2.93 6.07 2.36 1.97 2.31 Ortho-P 3.41 J 3.62 5.63 6.02 1.55 1.71 2.17 2.41 3.7 34.9 3.8 3.44 1.89 5.87(mg/L) 3.21 J 6.03 1.98 2.1 2.39 NO2-NO3 11.5 11.5 15.7 J 16.6 J 10.6 1.16 8.58 8.93 0.264 -3282.6 9.8 9.548 6.44 17.80(mg/L) 11.8 17.3 J 1.19 7.91 8.61 NH3 (mg/L) 0.051 0.05 0.086 0.074 0.045 0.036 0.015 0.012 25.6 100.0 0.1 0.043 0.03 0.08 0.031 0.055 0.034 0.011 0.011 Chloride 28.8 30.5 28.7 29 26.6 J 29 27.8 27.5 28.4 3.2 29.5 29 1.22 30.57(mg/L) 30.3 27.9 29.5 27.6 27.1 Alkalinity 25 26 10 J 9 34 33 45 45 158 71.5 22.7 28.25 15.04 47.53(mg/L) 26 6 32 44 44 E.Coli 3 8 1 9 (#100/mL) Fecal Coli 3 31 J 1 3 (#/100mL) * The NO2-NO3 values of 1.19 and 1.16 mg/L for 09/24-25/02 are apparent outliers.
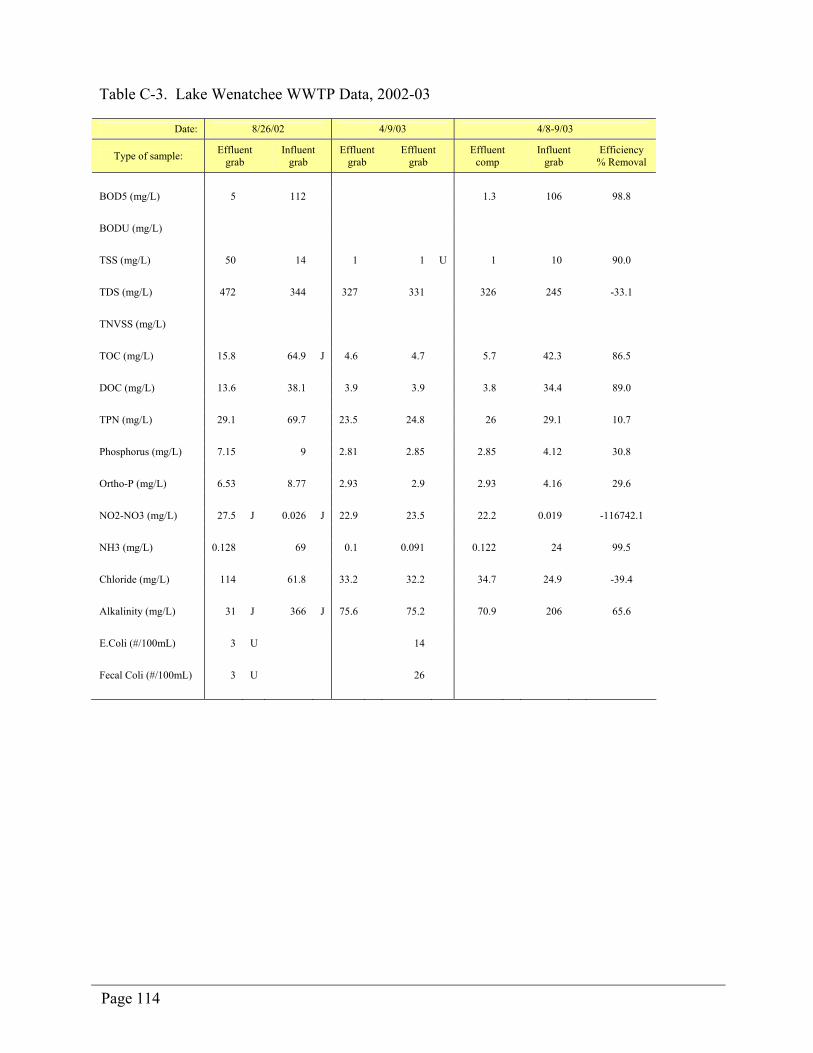
Page 114
Table C-3. Lake Wenatchee WWTP Data, 2002-03
Date: 8/26/02 4/9/03 4/8-9/03
Type of sample: Effluent grab
Influent grab
Effluent grab
Effluent grab
Effluent comp
Influent grab
Efficiency % Removal
BOD5 (mg/L) 5 112 1.3 106 98.8 BODU (mg/L) TSS (mg/L) 50 14 1 1 U 1 10 90.0 TDS (mg/L) 472 344 327 331 326 245 -33.1 TNVSS (mg/L) TOC (mg/L) 15.8 64.9 J 4.6 4.7 5.7 42.3 86.5 DOC (mg/L) 13.6 38.1 3.9 3.9 3.8 34.4 89.0 TPN (mg/L) 29.1 69.7 23.5 24.8 26 29.1 10.7 Phosphorus (mg/L) 7.15 9 2.81 2.85 2.85 4.12 30.8 Ortho-P (mg/L) 6.53 8.77 2.93 2.9 2.93 4.16 29.6 NO2-NO3 (mg/L) 27.5 J 0.026 J 22.9 23.5 22.2 0.019 -116742.1 NH3 (mg/L) 0.128 69 0.1 0.091 0.122 24 99.5 Chloride (mg/L) 114 61.8 33.2 32.2 34.7 24.9 -39.4 Alkalinity (mg/L) 31 J 366 J 75.6 75.2 70.9 206 65.6 E.Coli (#/100mL) 3 U 14 Fecal Coli (#/100mL) 3 U 26

Page 115
Table C-4. Dryden WWTP Data, 2002-03
Date: 9/23/02
Type of sample: Effluent grab
Influent grab
Efficiency % Removal
BOD5 (mg/L) 118 709 83.4 BODU (mg/L) TSS (mg/L) 23 131 82.4 TDS (mg/L) 328 403 18.6 TNVSS (mg/L) TOC (mg/L) 57.8 106 45.5 DOC (mg/L) 33.6 65.5 48.7 TPN (mg/L) 31.1 38.6 19.4 Phosphorus (mg/L) 4.17 J 4.08 J -2.2 Ortho-P (mg/L) 3.26 1.44 -126.4 NO2-NO3 (mg/L) 0.01 U 0.564 98.2 NH3 (mg/L) 25.8 11.1 -132.4 Chloride (mg/L) 24.1J 16.9 J -47.9 Alkalinity (mg/L) 297 228 -30.3 E.Coli (#/100mL) NC Fecal Coli (#/100mL) NC
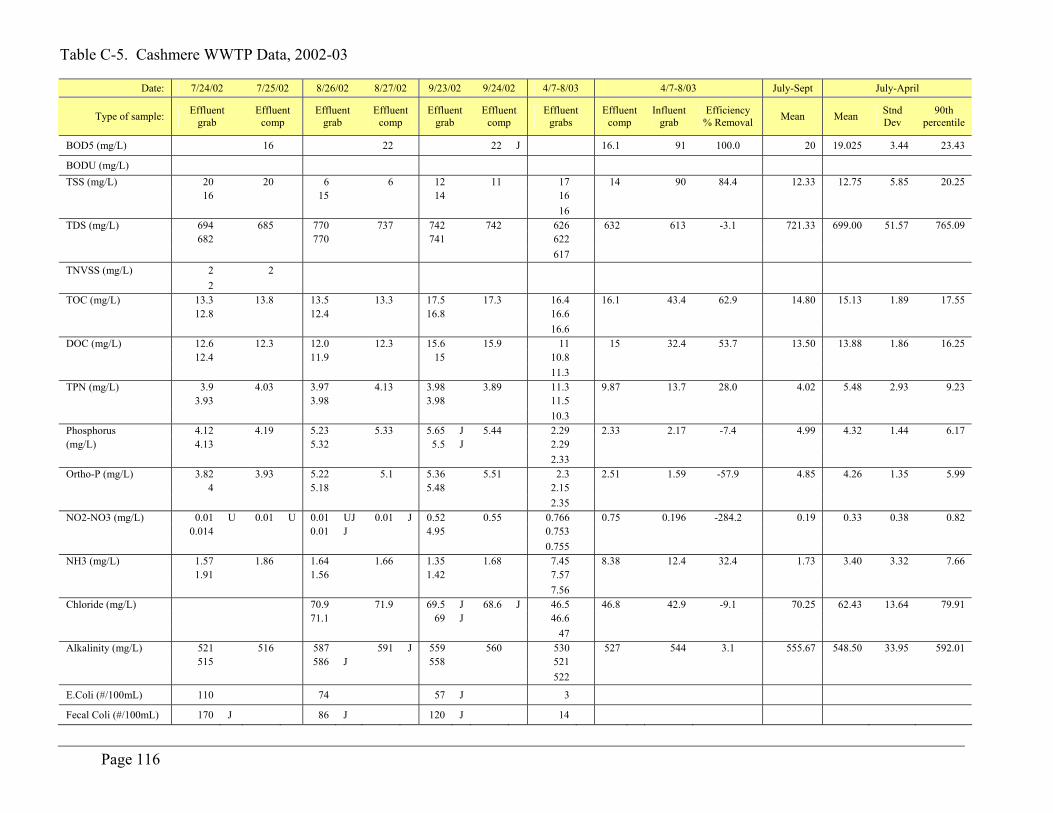
Table C-5. Cashmere WWTP Data, 2002-03
Date: 7/24/02 7/25/02 8/26/02 8/27/02 9/23/02 9/24/02 4/7-8/03 4/7-8/03 July-Sept July-April
Type of sample: Effluent grab
Effluent comp
Effluent grab
Effluent comp
Effluent grab
Effluent comp
Effluent grabs
Effluent comp
Influent grab
Efficiency % Removal Mean Mean Stnd
Dev 90th
percentile
BOD5 (mg/L) 16 22 22 J 16.1 91 100.0 20 19.025 3.44 23.43
BODU (mg/L) TSS (mg/L) 20 20 6 6 12 11 17 14 90 84.4 12.33 12.75 5.85 20.25 16 15 14 16 16 TDS (mg/L) 694 685 770 737 742 742 626 632 613 -3.1 721.33 699.00 51.57 765.09 682 770 741 622 617 TNVSS (mg/L) 2 2 2 TOC (mg/L) 13.3 13.8 13.5 13.3 17.5 17.3 16.4 16.1 43.4 62.9 14.80 15.13 1.89 17.55 12.8 12.4 16.8 16.6 16.6 DOC (mg/L) 12.6 12.3 12.0 12.3 15.6 15.9 11 15 32.4 53.7 13.50 13.88 1.86 16.25 12.4 11.9 15 10.8 11.3 TPN (mg/L) 3.9 4.03 3.97 4.13 3.98 3.89 11.3 9.87 13.7 28.0 4.02 5.48 2.93 9.23 3.93 3.98 3.98 11.5 10.3 Phosphorus 4.12 4.19 5.23 5.33 5.65 J 5.44 2.29 2.33 2.17 -7.4 4.99 4.32 1.44 6.17 (mg/L) 4.13 5.32 5.5 J 2.29 2.33 Ortho-P (mg/L) 3.82 3.93 5.22 5.1 5.36 5.51 2.3 2.51 1.59 -57.9 4.85 4.26 1.35 5.99 4 5.18 5.48 2.15 2.35 NO2-NO3 (mg/L) 0.01 U 0.01 U 0.01 UJ 0.01 J 0.52 0.55 0.766 0.75 0.196 -284.2 0.19 0.33 0.38 0.82 0.014 0.01 J 4.95 0.753 0.755 NH3 (mg/L) 1.57 1.86 1.64 1.66 1.35 1.68 7.45 8.38 12.4 32.4 1.73 3.40 3.32 7.66 1.91 1.56 1.42 7.57 7.56 Chloride (mg/L) 70.9 71.9 69.5 J 68.6 J 46.5 46.8 42.9 -9.1 70.25 62.43 13.64 79.91 71.1 69 J 46.6 47 Alkalinity (mg/L) 521 516 587 591 J 559 560 530 527 544 3.1 555.67 548.50 33.95 592.01 515 586 J 558 521 522 E.Coli (#/100mL) 110 74 57 J 3 Fecal Coli (#/100mL) 170 J 86 J 120 J 14
Page 116

Page 117
Table C-6. Leavenworth Fish Hatchery Abatement Pond Outfall Data, 2002-03
Date: 6/25/02 7/22/02 7/23/02 8/29/02 9/25/02 10/22/02 4/8/03
Type of sample: grab grab grab grab-comp grab-comp grab grab
BOD5 (mg/L) 2 U 2 U 2 U
BODU (mg/L)
TSS (mg/L) 2 4 2 2 2 3 6 3 Turbidity (NTU) 1.7 0.9 1 2.7 0.9
TDS (mg/L) 27 30 32 38 39
TNVSS (mg/L) 2 NAF 1
TOC (mg/L) 1.6 1.1 1.1 1.3 1.2 1.2 1.4
DOC (mg/L) 1.1 1.1 1 U 1.3 1.3
TPN (mg/L) 0.126 0.088 0.126 0.194 0.206 0.045 0.304 0.063 Phosphorus (mg/L) 0.0497 0.042 53.7 0.103 0.073 0.029 0.029 Ortho-P (mg/L) 0.028 0.017 J 0.027 0.0665 0.042 0.013 0.0396 0.012 NO2-NO3 (mg/L) 0.01 U 0.01 U 0.01 U 0.029 J 0.082 0.016 0.139 0.016 NH3 (mg/L) 0.05 0.037 0.058 0.056 0.071 0.013 0.056 0.015 Chloride (mg/L) 0.22 0.21 0.46 0.67 J 0.62 1.99 0.62
Chlorophyll (ug/L) 5.8
Alkalinity (mg/L) 13 16 16 25 29 34 40 33 E.Coli (#/100mL) 1 UJ 1 U 1 UJ Fecal Coli (#/100mL) 1 UJ 1 U 2 J
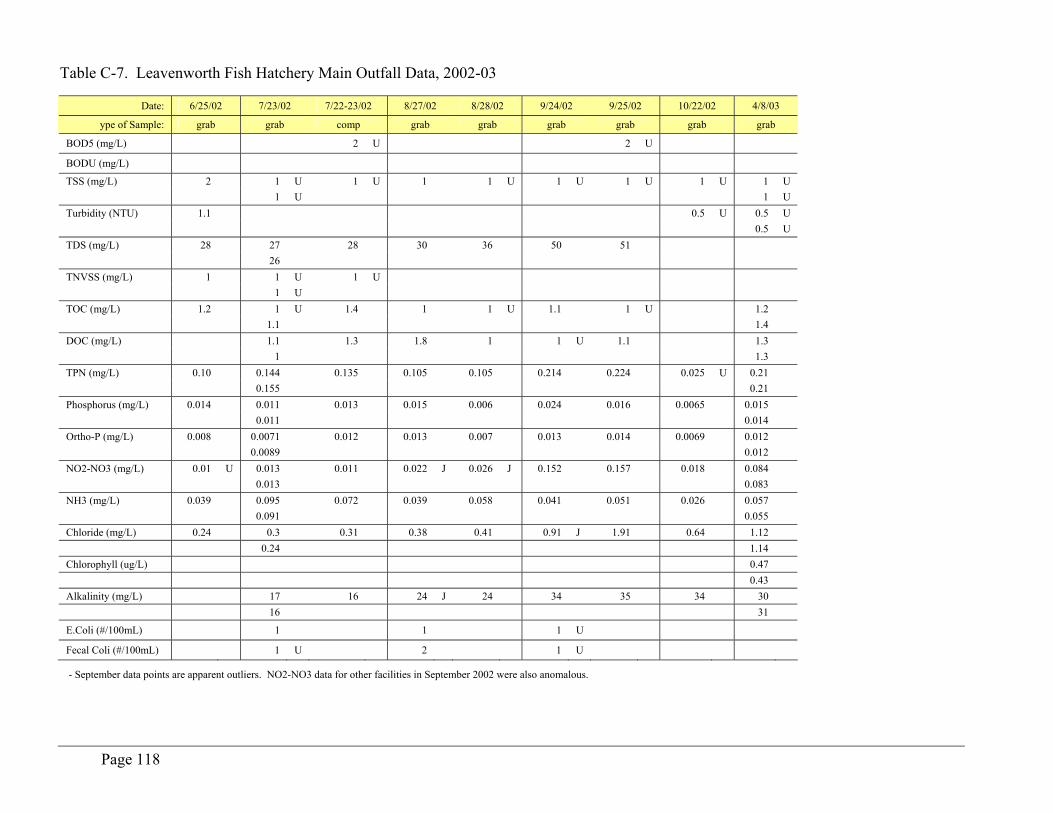
Table C-7. Leavenworth Fish Hatc
T
BOD5 (
BODU
TSS (m Turbidity TDS (m TNVSS TOC (m DOC (m TPN (m Phosph Ortho-P NO2-NO3 NH3 (m Chloride Chlorophy Alkalinity
E.Coli (
Fecal Coli (#/100m
- Septe
Page 118
hery Main Outfall Data, 2002-03
Date: 6/25/02 7/23/02 7/22-23/02 8/27/02 8/28/02 9/24/02 9/25/02 10/22/02 4/8/03
ype of Sample: grab grab comp grab grab grab grab grab grab
mg/L) 2 U 2 U
(mg/L)
g/L) 2 1 U 1 U 1 1 U 1 U 1 U 1 U 1 U 1 U 1 U
(NTU) 1.1 0.5 U 0.5 U 0.5 U
g/L) 28 27 28 30 36 50 51 26
(mg/L) 1 1 U 1 U 1 U
g/L) 1.2 1 U 1.4 1 1 U 1.1 1 U 1.2 1.1 1.4
g/L) 1.1 1.3 1.8 1 1 U 1.1 1.3 1 1.3
g/L) 0.10 0.144 0.135 0.105 0.105 0.214 0.224 0.025 U 0.21 0.155 0.21
orus (mg/L) 0.014 0.011 0.013 0.015 0.006 0.024 0.016 0.0065 0.015 0.011 0.014
(mg/L) 0.008 0.0071 0.012 0.013 0.007 0.013 0.014 0.0069 0.012 0.0089 0.012
(mg/L) 0.01 U 0.013 0.011 0.022 J 0.026 J 0.152 0.157 0.018 0.084 0.013 0.083
g/L) 0.039 0.095 0.072 0.039 0.058 0.041 0.051 0.026 0.057 0.091 0.055
(mg/L) 0.24 0.3 0.31 0.38 0.41 0.91 J 1.91 0.64 1.12 0.24 1.14
ll (ug/L) 0.47 0.43
(mg/L) 17 16 24 J 24 34 35 34 30 16 31
#/100mL) 1 1 1 U
L) 1 U 2 1 U
mber data points are apparent outliers. NO2-NO3 data for other facilities in September 2002 were also anomalous.
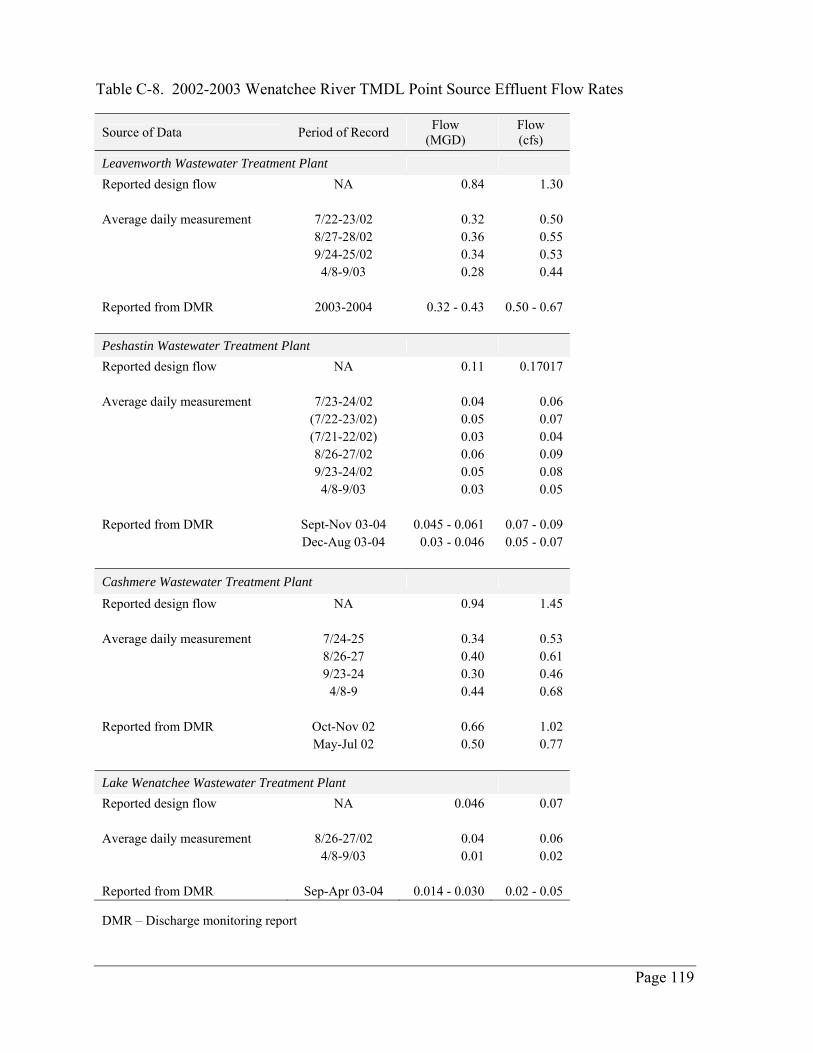
Table C-8. 2002-2003 Wenatchee River TMDL Point Source Effluent Flow Rates
Source of Data Period of Record Flow (MGD)
Flow (cfs)
Leavenworth Wastewater Treatment Plant Reported design flow NA 0.84 1.30 Average daily measurement 7/22-23/02 0.32 0.50 8/27-28/02 0.36 0.55 9/24-25/02 0.34 0.53 4/8-9/03 0.28 0.44 Reported from DMR 2003-2004 0.32 - 0.43 0.50 - 0.67 Peshastin Wastewater Treatment Plant Reported design flow NA 0.11 0.17017 Average daily measurement 7/23-24/02 0.04 0.06 (7/22-23/02) 0.05 0.07 (7/21-22/02) 0.03 0.04 8/26-27/02 0.06 0.09 9/23-24/02 0.05 0.08 4/8-9/03 0.03 0.05 Reported from DMR Sept-Nov 03-04 0.045 - 0.061 0.07 - 0.09 Dec-Aug 03-04 0.03 - 0.046 0.05 - 0.07
Cashmere Wastewater Treatment Plant Reported design flow NA 0.94 1.45 Average daily measurement 7/24-25 0.34 0.53 8/26-27 0.40 0.61 9/23-24 0.30 0.46 4/8-9 0.44 0.68 Reported from DMR Oct-Nov 02 0.66 1.02 May-Jul 02 0.50 0.77 Lake Wenatchee Wastewater Treatment Plant Reported design flow NA 0.046 0.07 Average daily measurement 8/26-27/02 0.04 0.06 4/8-9/03 0.01 0.02 Reported from DMR Sep-Apr 03-04 0.014 - 0.030 0.02 - 0.05 DMR – Discharge monitoring report
Page 119
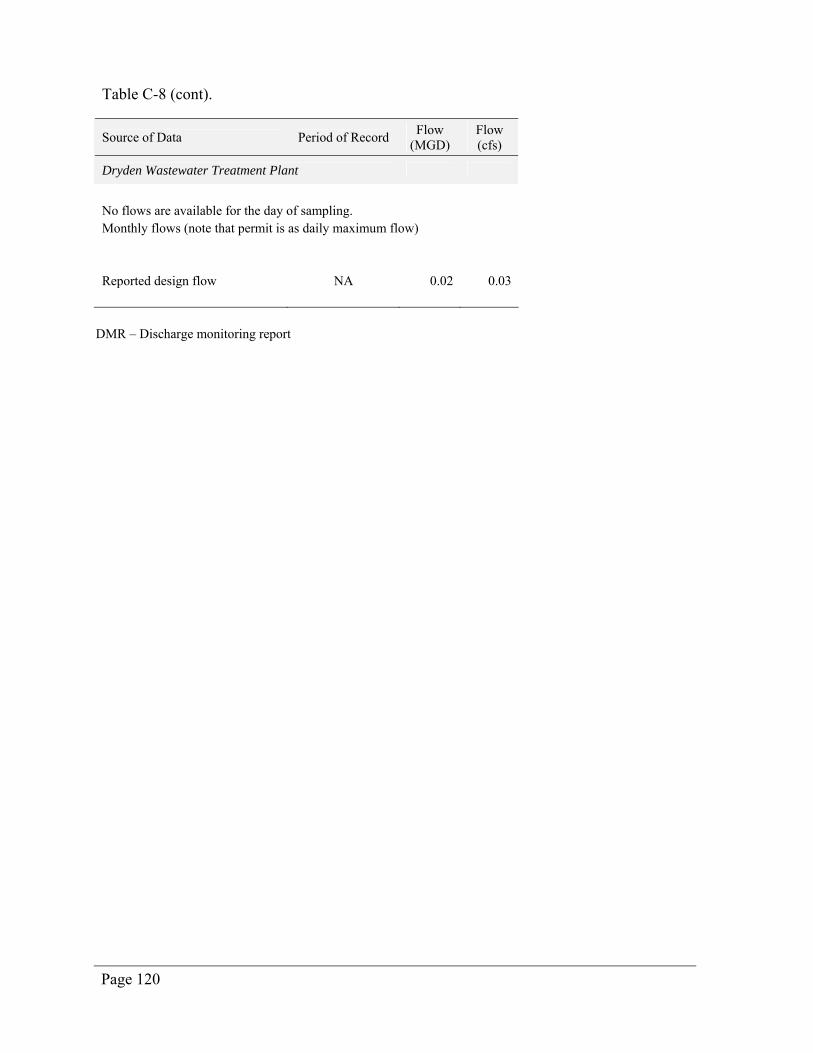
Page 120
Table C-8 (cont).
Source of Data Period of Record Flow (MGD)
Flow (cfs)
Dryden Wastewater Treatment Plant
No flows are available for the day of sampling. Monthly flows (note that permit is as daily maximum flow) Reported design flow NA 0.02 0.03
DMR – Discharge monitoring report
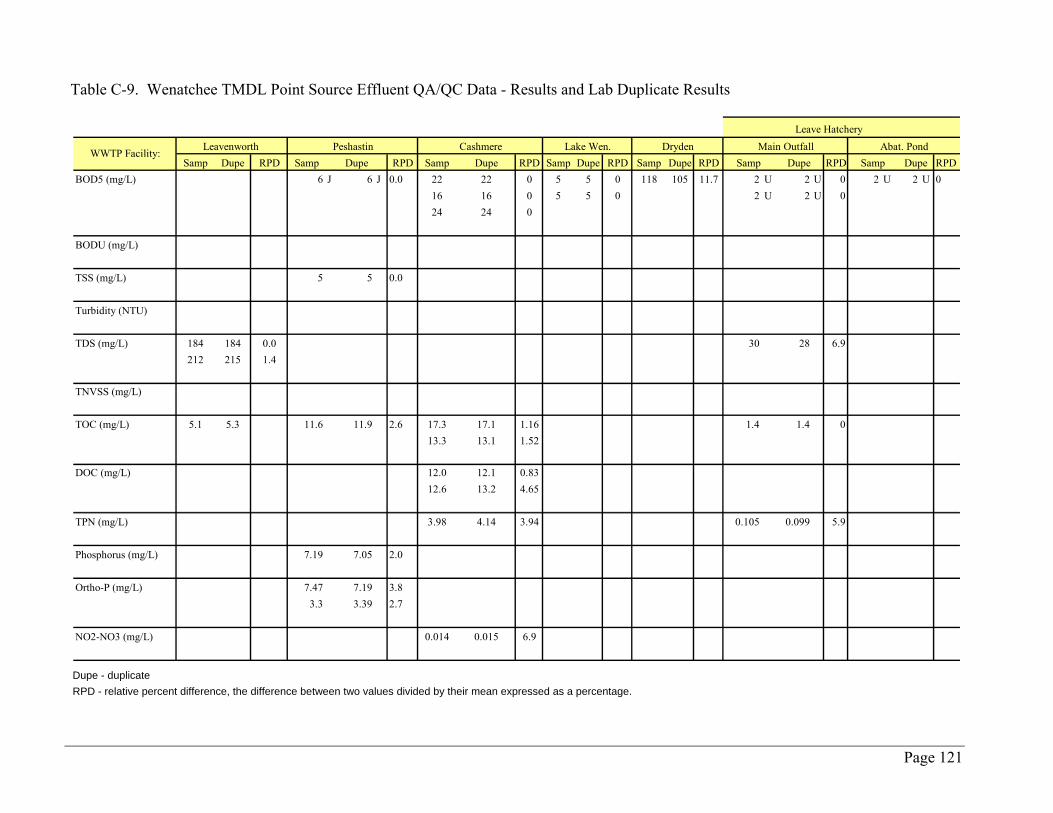
Table C-9. Wenatchee TMDL Point Source Effluent QA/QC Data - Results and Lab Duplicate Results
Samp Dupe RPD Samp Dupe RPD Samp Dupe RPD Samp Dupe RPD Samp Dupe RPD RPD RPDBOD5 (mg/L) 6 J 6 J 0.0 22 22 0 5 5 0 118 105 11.7 2 U 2 U 0 2 U 2 U 0
16 16 0 5 5 0 2 U 2 U 024 24 0
BODU (mg/L)
TSS (mg/L) 5 5 0.0
Turbidity (NTU)
TDS (mg/L) 184 184 0.0 30 28 6.9212 215 1.4
TNVSS (mg/L)
TOC (mg/L) 5.1 5.3 11.6 11.9 2.6 17.3 17.1 1.16 1.4 1.4 013.3 13.1 1.52
DOC (mg/L) 12.0 12.1 0.8312.6 13.2 4.65
TPN (mg/L) 3.98 4.14 3.94 0.105 0.099 5.9
Phosphorus (mg/L) 7.19 7.05 2.0
Ortho-P (mg/L) 7.47 7.19 3.83.3 3.39 2.7
NO2-NO3 (mg/L) 0.014 0.015 6.9
Dupe
Leave HatcheryLeavenworth Peshastin Cashmere Lake Wen. Abat. PondDryden Main Outfall
Samp Dupe SampWWTP Facility:
Dupe - duplicate RPD - relative percent difference, the difference between two values divided by their mean expressed as a percentage.
Page 121
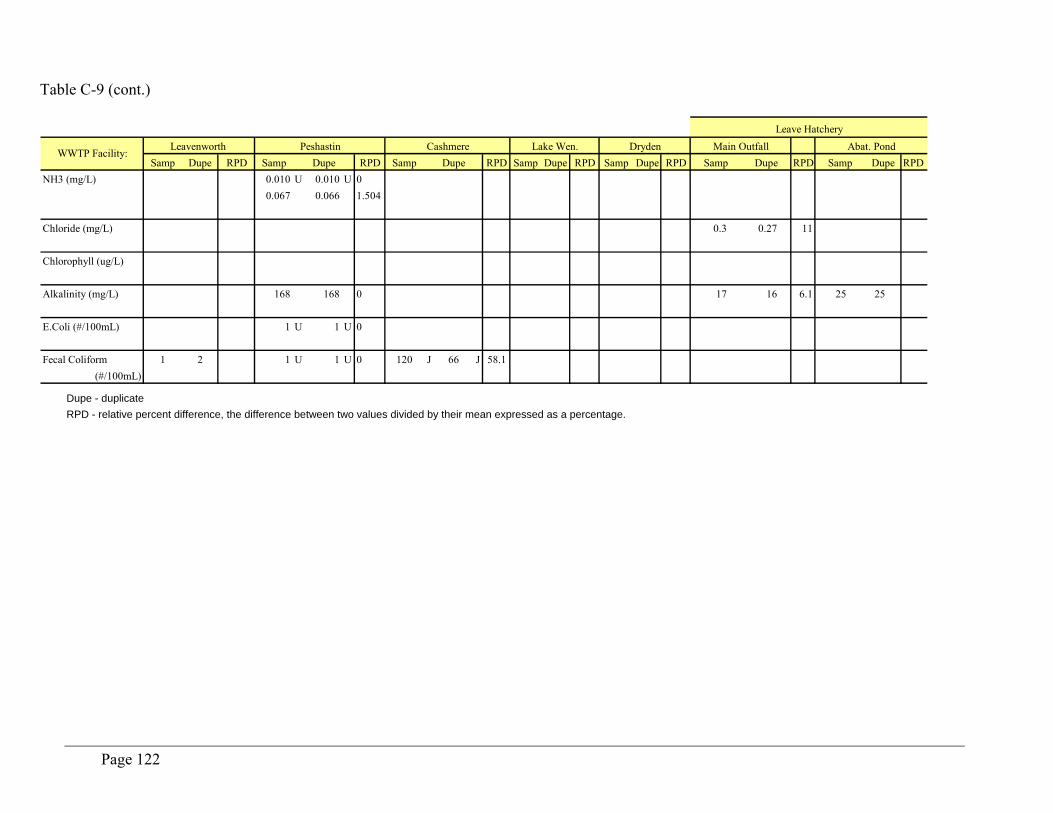
Page 122
Table C-9 (cont.)
Samp Dupe RPD Samp Dupe RPD Samp Dupe RPD Samp Dupe RPD Samp Dupe RPD RPD RPDNH3 (mg/L) 0.010 U 0.010 U 0
0.067 0.066 1.504
Chloride (mg/L) 0.3 0.27 11
Chlorophyll (ug/L)
Alkalinity (mg/L) 168 168 0 17 16 6.1 25 25
E.Coli (#/100mL) 1 U 1 U 0
Fecal Coliform 1 2 1 U 1 U 0 120 J 66 J 58.1(#/100mL)
WWTP Facility: Lake Wen.CashmerePeshastinLeavenworth Dryden Main Outfall Abat. PondLeave Hatchery
Samp Dupe Samp Dupe
Dupe - duplicate RPD - relative percent difference, the difference between two values divided by their mean expressed as a percentage.
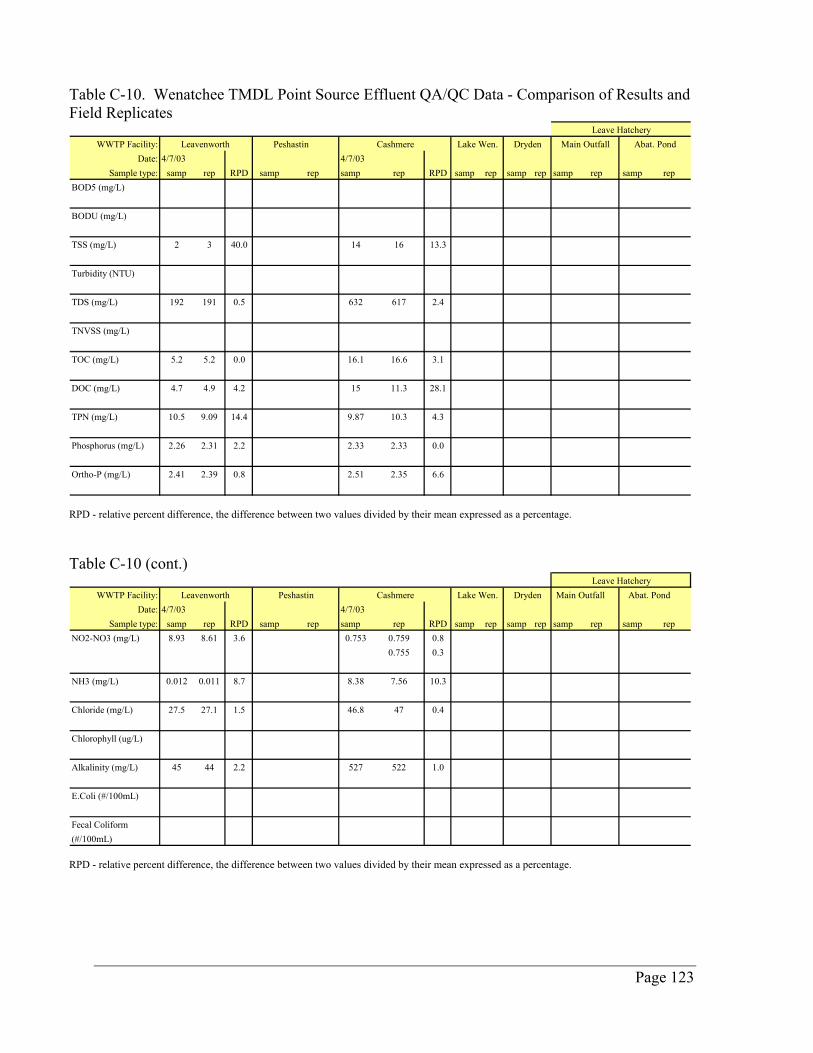
Page 123
Table C-10. Wenatchee TMDL Point Source Effluent QA/QC Data - Comparison of Results and Field Replicates
WWTP Facility:Date: 4/7/03 4/7/03
Sample type: samp rep RPD samp rep samp rep RPD samp rep samp rep samp rep samp repBOD5 (mg/L)
BODU (mg/L)
TSS (mg/L) 2 3 40.0 14 16 13.3
Turbidity (NTU)
TDS (mg/L) 192 191 0.5 632 617 2.4
TNVSS (mg/L)
TOC (mg/L) 5.2 5.2 0.0 16.1 16.6 3.1
DOC (mg/L
TPN (mg/L)
Phosphor
Ortho-P (mg/
Leavenworth PeshastinLeave Hatchery
Cashmere Main Outfall Abat. PondLake Wen. Dryden
) 4.7 4.9 4.2 15 11.3 28.1
10.5 9.09 14.4 9.87 10.3 4.3
us (mg/L) 2.26 2.31 2.2 2.33 2.33 0.0
L) 2.41 2.39 0.8 2.51 2.35 6.6
RPD - centage.
relative percent difference, the difference between two values divided by their mean expressed as a per
Table C-10 (cont.)
WW
Sa samp rep samp rep samp repNO2-NO3 (
NH3 (mg/L
Chloride (m
Chlorophyl
Alkalinity
E.Coli (#/10
Fecal Colifo(#/100mL)
DrydenLeave Hatchery
Main Outfall Abat. PondTP Facility:Date: 4/7/03 4/7/03
mple type: samp rep RPD samp rep samp rep RPD samp repmg/L) 8.93 8.61 3.6 0.753 0.759 0.8
0.755 0.3
) 0.012 0.011 8.7 8.38 7.56 10.3
g/L) 27.5 27.1 1.5 46.8 47 0.4
l (ug/L)
(mg/L) 45 44 2.2 527 522 1.0
0mL)
rm
Lake Wen.PeshastinLeavenworth Cashmere
RPD - centage.
relative percent difference, the difference between two values divided by their mean expressed as a per
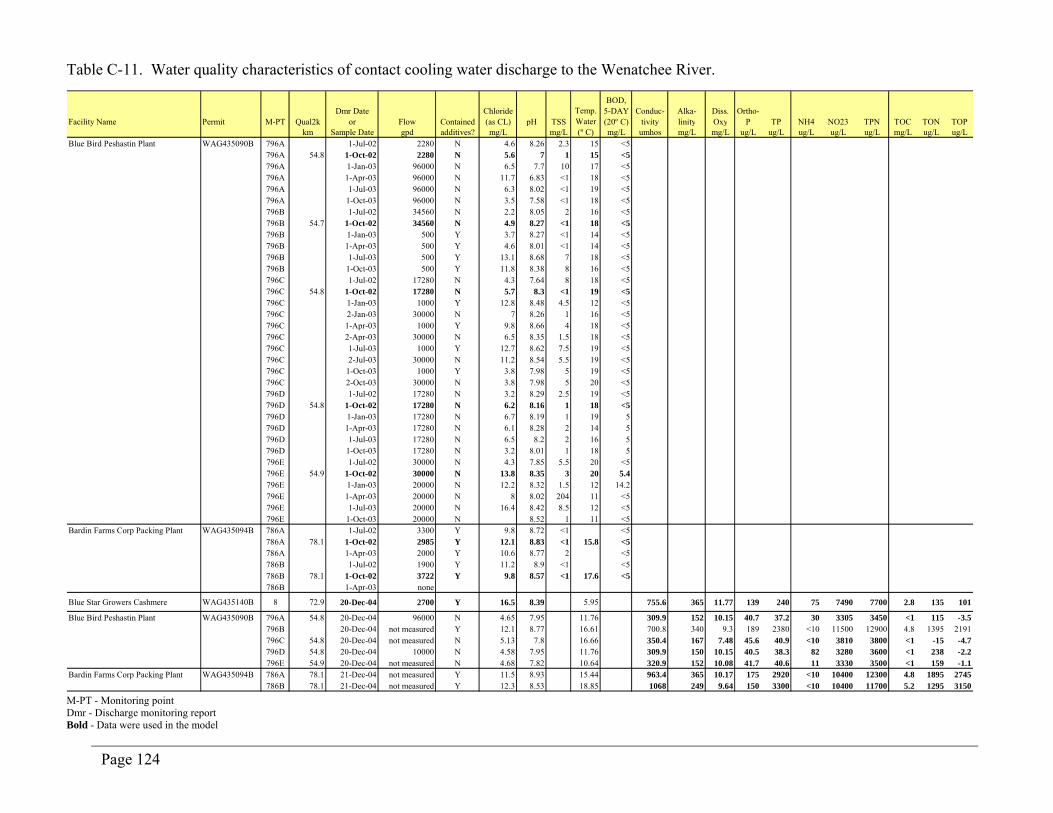
Table C-11. W
Page 124
ater quality characteristics of contact cooling water discharge to the Wenatchee River.
Facility Name Permit M-PT Qual2kDmr Date
or Flow ContainedChloride (as CL) pH TSS
BOD, 5-DAY (20º C)
Conduc-tivity
Alka-linity
Diss. Oxy
Ortho-P TP NH4 NO23 TPN TOC TON TOP
km Sample Date gpd additives? mg/L mg/L mg/L umhos mg/L mg/L ug/L ug/L ug/L ug/L ug/L mg/L ug/L ug/LBlue Bird Peshastin Plant WAG435090B 796A 1-Jul-02 2280 N 4.6 8.26 2.3 15 <5
796A 54.8 1-Oct-02 2280 N 5.6 7 1 15 <5796A 1-Jan-03 96000 N 6.5 7.7 10 17 <5796A 1-Apr-03 96000 N 11.7 6.83 <1 18 <5796A 1-Jul-03 96000 N 6.3 8.02 <1 19 <5796A 1-Oct-03 96000 N 3.5 7.58 <1 18 <5796B 1-Jul-02 34560 N 2.2 8.05 2 16 <5796B 54.7 1-Oct-02 34560 N 4.9 8.27 <1 18 <5796B 1-Jan-03 500 Y 3.7 8.27 <1 14 <5796B 1-Apr-03 500 Y 4.6 8.01 <1 14 <5796B 1-Jul-03 500 Y 13.1 8.68 7 18 <5796B 1-Oct-03 500 Y 11.8 8.38 8 16 <5796C 1-Jul-02 17280 N 4.3 7.64 8 18 <5796C 54.8 1-Oct-02 17280 N 5.7 8.3 <1 19 <5796C 1-Jan-03 1000 Y 12.8 8.48 4.5 12 <5796C 2-Jan-03 30000 N 7 8.26 1 16 <5796C 1-Apr-03 1000 Y 9.8 8.66 4 18 <5796C 2-Apr-03 30000 N 6.5 8.35 1.5 18 <5796C 1-Jul-03 1000 Y 12.7 8.62 7.5 19 <5796C 2-Jul-03 30000 N 11.2 8.54 5.5 19 <5796C 1-Oct-03 1000 Y 3.8 7.98 5 19 <5796C 2-Oct-03 30000 N 3.8 7.98 5 20 <5796D 1-Jul-02 17280 N 3.2 8.29 2.5 19 <5796D 54.8 1-Oct-02 17280 N 6.2 8.16 1 18 <5796D 1-Jan-03 17280 N 6.7 8.19 1 19 5796D 1-Apr-03 17280 N 6.1 8.28 2 14 5796D 1-Jul-03 17280 N 6.5 8.2 2 16 5796D 1-Oct-03 17280 N 3.2 8.01 1 18 5796E 1-Jul-02 30000 N 4.3 7.85 5.5 20 <5796E 54.9 1-Oct-02 30000 N 13.8 8.35 3 20 5.4796E 1-Jan-03 20000 N 12.2 8.32 1.5 12 14.2796E 1-Apr-03 20000 N 8 8.02 204 11 <5796E 1-Jul-03 20000 N 16.4 8.42 8.5 12 <5796E 1-Oct-03 20000 N 8.52 1 11 <5
Bardin Farms Corp Packing Plant WAG435094B 786A 1-Jul-02 3300 Y 9.8 8.72 <1 <5786A 78.1 1-Oct-02 2985 Y 12.1 8.83 <1 15.8 <5786A 1-Apr-03 2000 Y 10.6 8.77 2 <5786B 1-Jul-02 1900 Y 11.2 8.9 <1 <5786B 78.1 1-Oct-02 3722 Y 9.8 8.57 <1 17.6 <5786B 1-Apr-03 none
Blue Star Growers Cashmere WAG435140B 8 72.9 20-Dec-04 2700 Y 16.5 8.39 5.95 755.6 365 11.77 139 240 75 7490 7700 2.8 135 101
Blue Bird Peshastin Plant WAG435090B 796A 54.8 20-Dec-04 96000 N 4.65 7.95 11.76 309.9 152 10.15 40.7 37.2 30 3305 3450 <1 115 -3.5796B 20-Dec-04 not measured Y 12.1 8.77 16.61 700.8 340 9.3 189 2380 <10 11500 12900 4.8 1395 2191796C 54.8 20-Dec-04 not measured N 5.13 7.8 16.66 350.4 167 7.48 45.6 40.9 <10 3810 3800 <1 -15 -4.7796D 54.8 20-Dec-04 10000 N 4.58 7.95 11.76 309.9 150 10.15 40.5 38.3 82 3280 3600 <1 238 -2.2796E 54.9 20-Dec-04 not measured N 4.68 7.82 10.64 320.9 152 10.08 41.7 40.6 11 3330 3500 <1 159 -1.1
Bardin Farms Corp Packing Plant WAG435094B 786A 78.1 21-Dec-04 not measured Y 11.5 8.93 15.44 963.4 365 10.17 175 2920 <10 10400 12300 4.8 1895 2745786B 78.1 21-Dec-04 not measured Y 12.3 8.53 18.85 1068 249 9.64 150 3300 <10 10400 11700 5.2 1295 3150
Temp. Water (º C)
M-PT - Monitoring point Dmr - Discharge monitoring report Bold - Data were used in the model
Appendix D
Wenatchee River and Icicle Creek QUAL2K Model Calibration Coefficients and Reach Characteristics
Page 125
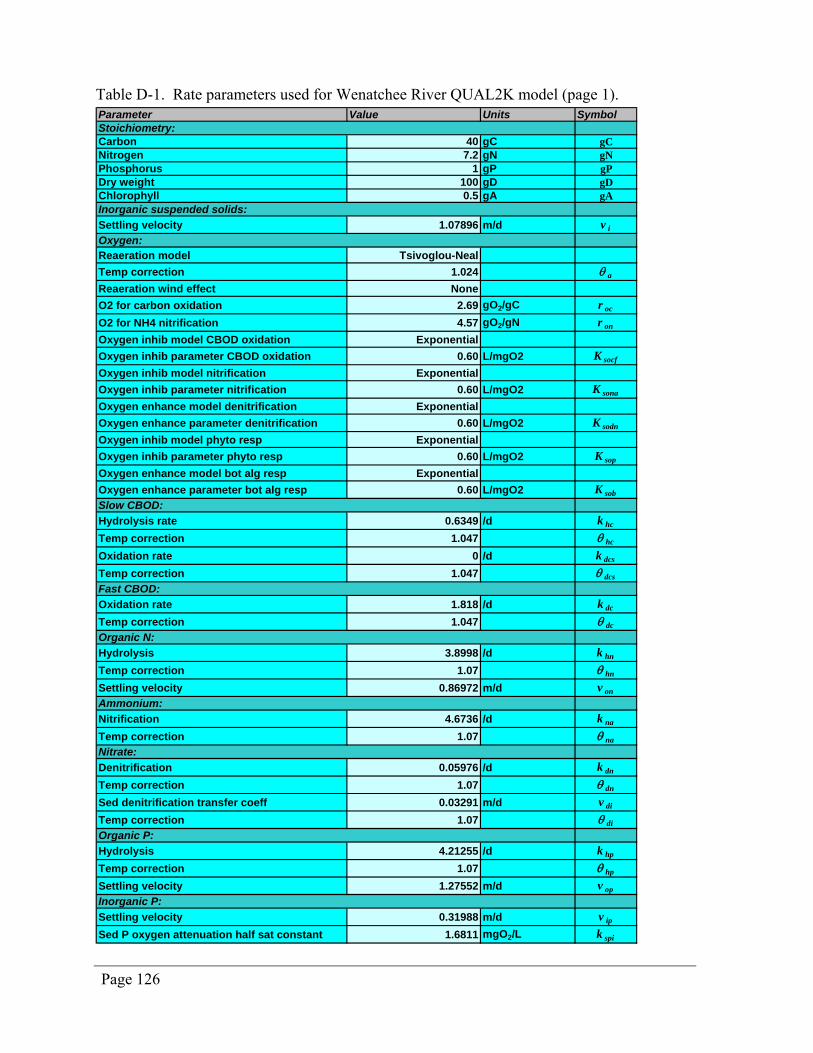
Table D-1. Rate parameters used for Wenatchee River QUAL2K model (page 1). Parameter Value Units SymbolStoichiometry:Carbon 40 gC gCNitrogen 7.2 gN gNPhosphorus 1 gP gPDry weight 100 gD gDChlorophyll 0.5 gA gAInorganic suspended solids:Settling velocity 1.07896 m/d v iOxygen:Reaeration model Tsivoglou-NealTemp correction 1.024 θ a
Reaeration wind effect NoneO2 for carbon oxidation 2.69 gO2/gC r oc
O2 for NH4 nitrification 4.57 gO2/gN r on
Oxygen inhib model CBOD oxidation ExponentialOxygen inhib parameter CBOD oxidation 0.60 L/mgO2 K socf
Oxygen inhib model nitrification ExponentialOxygen inhib parameter nitrification 0.60 L/mgO2 K sona
Oxygen enhance model denitrification ExponentialOxygen enhance parameter denitrification 0.60 L/mgO2 K sodn
Oxygen inhib model phyto resp ExponentialOxygen inhib parameter phyto resp 0.60 L/mgO2 K sop
Oxygen enhance model bot alg resp ExponentialOxygen enhance parameter bot alg resp 0.60 L/mgO2 K sobSlow CBOD:Hydrolysis rate 0.6349 /d k hc
Temp correction 1.047 θ hc
Oxidation rate 0 /d k dcs
Temp correction 1.047 θ dcsFast CBOD:Oxidation rate 1.818 /d k dc
Temp correction 1.047 θ dcOrganic N:Hydrolysis 3.8998 /d k hn
Temp correction 1.07 θ hn
Settling velocity 0.86972 m/d v onAmmonium:Nitrification 4.6736 /d k na
Temp correction 1.07 θ naNitrate:Denitrification 0.05976 /d k dn
Temp correction 1.07 θ dn
Sed denitrification transfer coeff 0.03291 m/d v di
Temp correction 1.07 θ diOrganic P:Hydrolysis 4.21255 /d k hp
Temp correction 1.07 θ hp
Settling velocity 1.27552 m/d v opInorganic P:Settling velocity 0.31988 m/d v ip
Sed P oxygen attenuation half sat constant 1.6811 mgO2/L k spi
Page 126
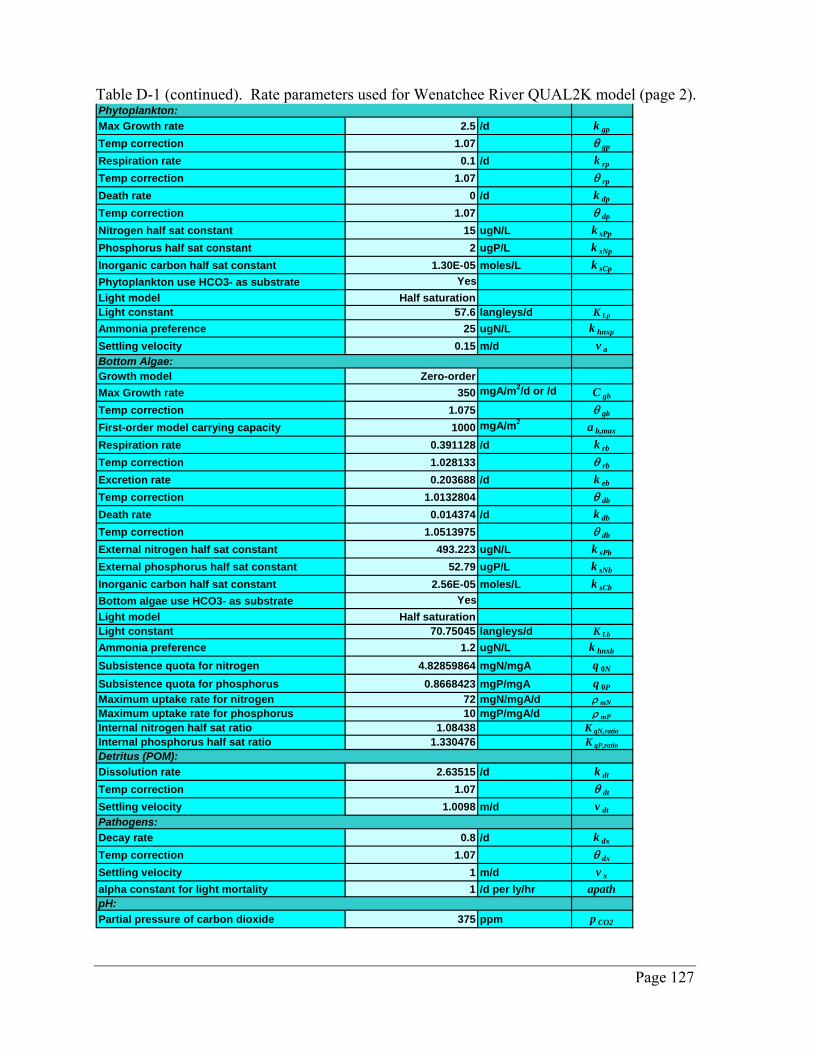
Table D-1 (continued). Rate parameters used for Wenatchee River QUAL2K model (page 2). Phytoplankton:Max Growth rate 2.5 /d k gp
Temp correction 1.07 θ gp
Respiration rate 0.1 /d k rp
Temp correction 1.07 θ rp
Death rate 0 /d k dp
Temp correction 1.07 θ dp
Nitrogen half sat constant 15 ugN/L k sPp
Phosphorus half sat constant 2 ugP/L k sNp
Inorganic carbon half sat constant 1.30E-05 moles/L k sCp
Phytoplankton use HCO3- as substrate YesLight model Half saturationLight constant 57.6 langleys/d K Lp
Ammonia preference 25 ugN/L k hnxp
Settling velocity 0.15 m/d v aBottom Algae:Growth model Zero-orderMax Growth rate 350 mgA/m2/d or /d C gb
Temp correction 1.075 θ gb
First-order model carrying capacity 1000 mgA/m2 a b,max
Respiration rate 0.391128 /d k rb
Temp correction 1.028133 θ rb
Excretion rate 0.203688 /d k eb
Temp correction 1.0132804 θ db
Death rate 0.014374 /d k db
Temp correction 1.0513975 θ db
External nitrogen half sat constant 493.223 ugN/L k sPb
External phosphorus half sat constant 52.79 ugP/L k sNb
Inorganic carbon half sat constant 2.56E-05 moles/L k sCb
Bottom algae use HCO3- as substrate YesLight model Half saturationLight constant 70.75045 langleys/d K Lb
Ammonia preference 1.2 ugN/L k hnxb
Subsistence quota for nitrogen 4.82859864 mgN/mgA q 0N
Subsistence quota for phosphorus 0.8668423 mgP/mgA q 0PMaximum uptake rate for nitrogen 72 mgN/mgA/d ρ mN
Maximum uptake rate for phosphorus 10 mgP/mgA/d ρ mP
Internal nitrogen half sat ratio 1.08438 K qN,ratio
Internal phosphorus half sat ratio 1.330476 K qP,ratio
Detritus (POM):Dissolution rate 2.63515 /d k dt
Temp correction 1.07 θ dt
Settling velocity 1.0098 m/d v dtPathogens:Decay rate 0.8 /d k dx
Temp correction 1.07 θ dx
Settling velocity 1 m/d v x
alpha constant for light mortality 1 /d per ly/hr apathpH:Partial pressure of carbon dioxide 375 ppm p CO2
Page 127

Table D-2. Rate parameters used for Icicle Creek QUAL2K model (page 1). Parameter Value Units SymbolStoichiometry:Carbon 40 gC gCNitrogen 7.2 gN gNPhosphorus 1 gP gPDry weight 100 gD gDChlorophyll 0.5 gA gAInorganic suspended solids:Settling velocity 0.60832 m/d v iOxygen:Reaeration model USGS(channel-control)Temp correction 1.024 θ a
Reaeration wind effect NoneO2 for carbon oxidation 2.69 gO2/gC r oc
O2 for NH4 nitrification 4.57 gO2/gN r on
Oxygen inhib model CBOD oxidation ExponentialOxygen inhib parameter CBOD oxidation 0.60 L/mgO2 K socf
Oxygen inhib model nitrification ExponentialOxygen inhib parameter nitrification 0.60 L/mgO2 K sona
Oxygen enhance model denitrification ExponentialOxygen enhance parameter denitrification 0.60 L/mgO2 K sodn
Oxygen inhib model phyto resp ExponentialOxygen inhib parameter phyto resp 0.60 L/mgO2 K sop
Oxygen enhance model bot alg resp ExponentialOxygen enhance parameter bot alg resp 0.60 L/mgO2 K sobSlow CBOD:Hydrolysis rate 1.6233 /d k hc
Temp correction 1.047 θ hc
Oxidation rate 0 /d k dcs
Temp correction 1.047 θ dcsFast CBOD:Oxidation rate 0.5712 /d k dc
Temp correction 1.047 θ dcOrganic N:Hydrolysis 0.1 /d k hn
Temp correction 1.07 θ hn
Settling velocity 0.5 m/d v onAmmonium:Nitrification 10 /d k na
Temp correction 1.07 θ naNitrate:Denitrification 0.66408 /d k dn
Temp correction 1.07 θ dn
Sed denitrification transfer coeff 0.31461 m/d v di
Temp correction 1.07 θ diOrganic P:Hydrolysis 0.1 /d k hp
Temp correction 1.07 θ hp
Settling velocity 0.5 m/d v opInorganic P:Settling velocity 0.921 m/d v ip
Sed P oxygen attenuation half sat constant 1.40408 mgO2/L k spi
Page 128
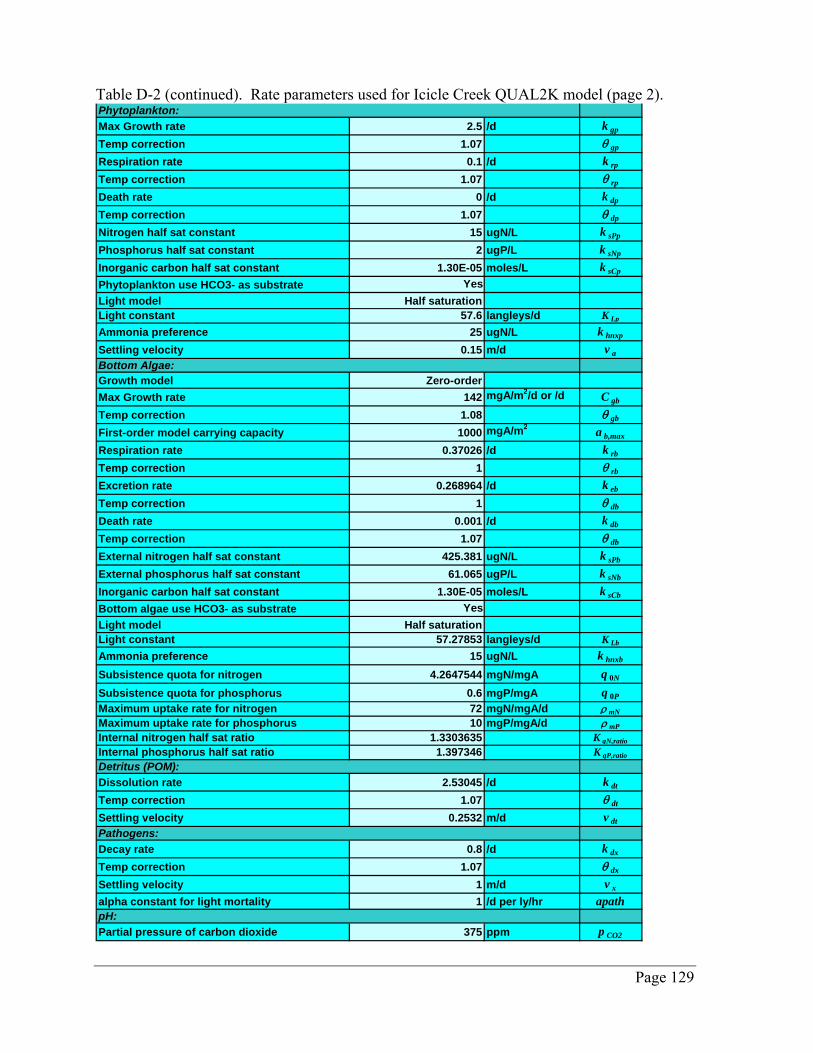
Table D-2 (continued). Rate parameters used for Icicle Creek QUAL2K model (page 2). Phytoplankton:Max Growth rate 2.5 /d k gp
Temp correction 1.07 θ gp
Respiration rate 0.1 /d k rp
Temp correction 1.07 θ rp
Death rate 0 /d k dp
Temp correction 1.07 θ dp
Nitrogen half sat constant 15 ugN/L k sPp
Phosphorus half sat constant 2 ugP/L k sNp
Inorganic carbon half sat constant 1.30E-05 moles/L k sCp
Phytoplankton use HCO3- as substrate YesLight model Half saturationLight constant 57.6 langleys/d K Lp
Ammonia preference 25 ugN/L k hnxp
Settling velocity 0.15 m/d v aBottom Algae:Growth model Zero-orderMax Growth rate 142 mgA/m2/d or /d C gb
Temp correction 1.08 θ gb
First-order model carrying capacity 1000 mgA/m2 a b,max
Respiration rate 0.37026 /d k rb
Temp correction 1 θ rb
Excretion rate 0.268964 /d k eb
Temp correction 1 θ db
Death rate 0.001 /d k db
Temp correction 1.07 θ db
External nitrogen half sat constant 425.381 ugN/L k sPb
External phosphorus half sat constant 61.065 ugP/L k sNb
Inorganic carbon half sat constant 1.30E-05 moles/L k sCb
Bottom algae use HCO3- as substrate YesLight model Half saturationLight constant 57.27853 langleys/d K Lb
Ammonia preference 15 ugN/L k hnxb
Subsistence quota for nitrogen 4.2647544 mgN/mgA q 0N
Subsistence quota for phosphorus 0.6 mgP/mgA q 0PMaximum uptake rate for nitrogen 72 mgN/mgA/d ρ mN
Maximum uptake rate for phosphorus 10 mgP/mgA/d ρ mP
Internal nitrogen half sat ratio 1.3303635 K qN,ratio
Internal phosphorus half sat ratio 1.397346 K qP,ratio
Detritus (POM):Dissolution rate 2.53045 /d k dt
Temp correction 1.07 θ dt
Settling velocity 0.2532 m/d v dtPathogens:Decay rate 0.8 /d k dx
Temp correction 1.07 θ dx
Settling velocity 1 m/d v x
alpha constant for light mortality 1 /d per ly/hr apathpH:Partial pressure of carbon dioxide 375 ppm p CO2
Page 129
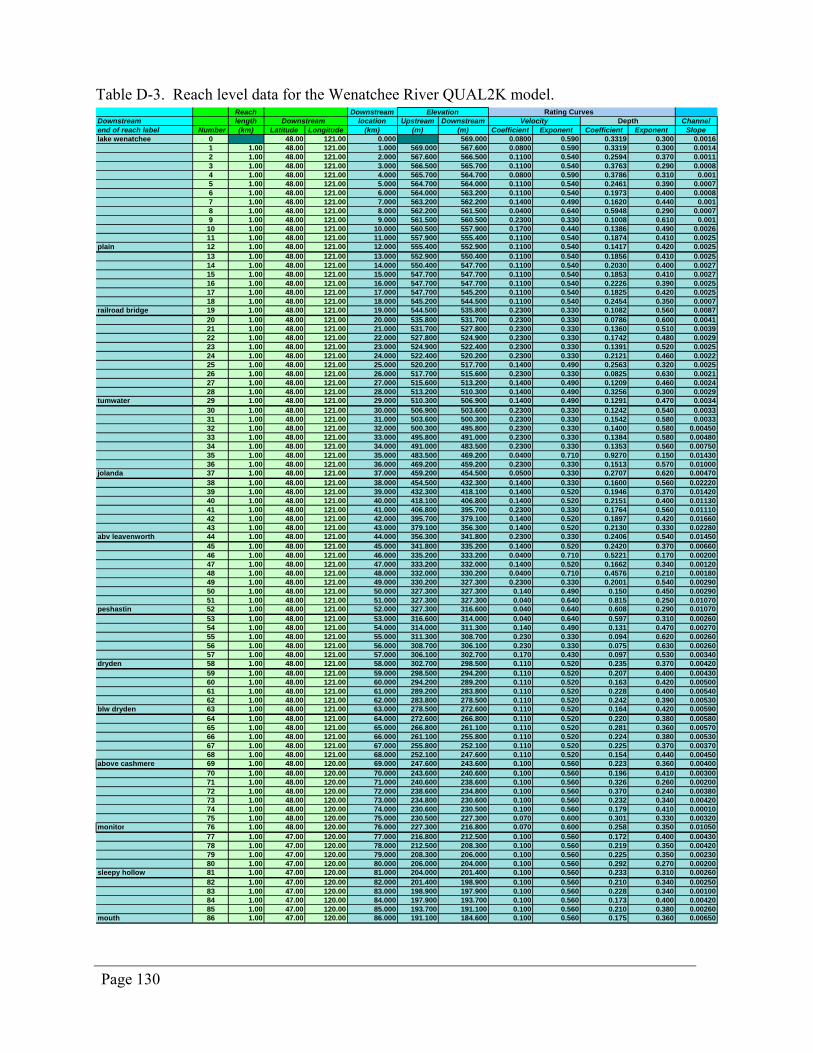
Table D-3. Reach level data for the Wenatchee River QUAL2K model. Reach Downstream Rating Curves
Downstream length Downstream location Upstream Downstream Channelend of reach label Number (km) Latitude Longitude (km) (m) (m) Coefficient Exponent Coefficient Exponent Slopelake wenatchee 0 48.00 121.00 0.000 569.000 0.0800 0.590 0.3319 0.300 0.0016
1 1.00 48.00 121.00 1.000 569.000 567.600 0.0800 0.590 0.3319 0.300 0.00142 1.00 48.00 121.00 2.000 567.600 566.500 0.1100 0.540 0.2594 0.370 0.00113 1.00 48.00 121.00 3.000 566.500 565.700 0.1100 0.540 0.3763 0.290 0.00084 1.00 48.00 121.00 4.000 565.700 564.700 0.0800 0.590 0.3786 0.310 0.0015 1.00 48.00 121.00 5.000 564.700 564.000 0.1100 0.540 0.2461 0.390 0.00076 1.00 48.00 121.00 6.000 564.000 563.200 0.1100 0.540 0.1973 0.400 0.00087 1.00 48.00 121.00 7.000 563.200 562.200 0.1400 0.490 0.1620 0.440 0.0018 1.00 48.00 121.00 8.000 562.200 561.500 0.0400 0.640 0.5948 0.290 0.00079 1.00 48.00 121.00 9.000 561.500 560.500 0.2300 0.330 0.1008 0.610 0.00110 1.00 48.00 121.00 10.000 560.500 557.900 0.1700 0.440 0.1386 0.490 0.002611 1.00 48.00 121.00 11.000 557.900 555.400 0.1100 0.540 0.1874 0.410 0.0025
plain 12 1.00 48.00 121.00 12.000 555.400 552.900 0.1100 0.540 0.1417 0.420 0.002513 1.00 48.00 121.00 13.000 552.900 550.400 0.1100 0.540 0.1856 0.410 0.002514 1.00 48.00 121.00 14.000 550.400 547.700 0.1100 0.540 0.2030 0.400 0.002715 1.00 48.00 121.00 15.000 547.700 547.700 0.1100 0.540 0.1853 0.410 0.002716 1.00 48.00 121.00 16.000 547.700 547.700 0.1100 0.540 0.2226 0.390 0.002517 1.00 48.00 121.00 17.000 547.700 545.200 0.1100 0.540 0.1825 0.420 0.002518 1.00 48.00 121.00 18.000 545.200 544.500 0.1100 0.540 0.2454 0.350 0.0007
railroad bridge 19 1.00 48.00 121.00 19.000 544.500 535.800 0.2300 0.330 0.1082 0.560 0.008720 1.00 48.00 121.00 20.000 535.800 531.700 0.2300 0.330 0.0786 0.600 0.004121 1.00 48.00 121.00 21.000 531.700 527.800 0.2300 0.330 0.1360 0.510 0.003922 1.00 48.00 121.00 22.000 527.800 524.900 0.2300 0.330 0.1742 0.480 0.002923 1.00 48.00 121.00 23.000 524.900 522.400 0.2300 0.330 0.1391 0.520 0.002524 1.00 48.00 121.00 24.000 522.400 520.200 0.2300 0.330 0.2121 0.460 0.002225 1.00 48.00 121.00 25.000 520.200 517.700 0.1400 0.490 0.2563 0.320 0.002526 1.00 48.00 121.00 26.000 517.700 515.600 0.2300 0.330 0.0825 0.630 0.002127 1.00 48.00 121.00 27.000 515.600 513.200 0.1400 0.490 0.1209 0.460 0.002428 1.00 48.00 121.00 28.000 513.200 510.300 0.1400 0.490 0.3256 0.300 0.0029
tumwater 29 1.00 48.00 121.00 29.000 510.300 506.900 0.1400 0.490 0.1291 0.470 0.003430 1.00 48.00 121.00 30.000 506.900 503.600 0.2300 0.330 0.1242 0.540 0.003331 1.00 48.00 121.00 31.000 503.600 500.300 0.2300 0.330 0.1542 0.580 0.003332 1.00 48.00 121.00 32.000 500.300 495.800 0.2300 0.330 0.1400 0.580 0.0045033 1.00 48.00 121.00 33.000 495.800 491.000 0.2300 0.330 0.1384 0.580 0.0048034 1.00 48.00 121.00 34.000 491.000 483.500 0.2300 0.330 0.1353 0.560 0.0075035 1.00 48.00 121.00 35.000 483.500 469.200 0.0400 0.710 0.9270 0.150 0.0143036 1.00 48.00 121.00 36.000 469.200 459.200 0.2300 0.330 0.1513 0.570 0.01000
jolanda 37 1.00 48.00 121.00 37.000 459.200 454.500 0.0500 0.330 0.2707 0.620 0.0047038 1.00 48.00 121.00 38.000 454.500 432.300 0.1400 0.330 0.1600 0.560 0.0222039 1.00 48.00 121.00 39.000 432.300 418.100 0.1400 0.520 0.1946 0.370 0.0142040 1.00 48.00 121.00 40.000 418.100 406.800 0.1400 0.520 0.2151 0.400 0.0113041 1.00 48.00 121.00 41.000 406.800 395.700 0.2300 0.330 0.1764 0.560 0.0111042 1.00 48.00 121.00 42.000 395.700 379.100 0.1400 0.520 0.1897 0.420 0.0166043 1.00 48.00 121.00 43.000 379.100 356.300 0.1400 0.520 0.2130 0.330 0.02280
abv leavenworth 44 1.00 48.00 121.00 44.000 356.300 341.800 0.2300 0.330 0.2406 0.540 0.0145045 1.00 48.00 121.00 45.000 341.800 335.200 0.1400 0.520 0.2420 0.370 0.0066046 1.00 48.00 121.00 46.000 335.200 333.200 0.0400 0.710 0.5221 0.170 0.0020047 1.00 48.00 121.00 47.000 333.200 332.000 0.1400 0.520 0.1662 0.340 0.0012048 1.00 48.00 121.00 48.000 332.000 330.200 0.0400 0.710 0.4576 0.210 0.0018049 1.00 48.00 121.00 49.000 330.200 327.300 0.2300 0.330 0.2001 0.540 0.0029050 1.00 48.00 121.00 50.000 327.300 327.300 0.140 0.490 0.150 0.450 0.0029051 1.00 48.00 121.00 51.000 327.300 327.300 0.040 0.640 0.815 0.250 0.01070
peshastin 52 1.00 48.00 121.00 52.000 327.300 316.600 0.040 0.640 0.608 0.290 0.0107053 1.00 48.00 121.00 53.000 316.600 314.000 0.040 0.640 0.597 0.310 0.0026054 1.00 48.00 121.00 54.000 314.000 311.300 0.140 0.490 0.131 0.470 0.0027055 1.00 48.00 121.00 55.000 311.300 308.700 0.230 0.330 0.094 0.620 0.0026056 1.00 48.00 121.00 56.000 308.700 306.100 0.230 0.330 0.075 0.630 0.0026057 1.00 48.00 121.00 57.000 306.100 302.700 0.170 0.430 0.097 0.530 0.00340
dryden 58 1.00 48.00 121.00 58.000 302.700 298.500 0.110 0.520 0.235 0.370 0.0042059 1.00 48.00 121.00 59.000 298.500 294.200 0.110 0.520 0.207 0.400 0.0043060 1.00 48.00 121.00 60.000 294.200 289.200 0.110 0.520 0.163 0.420 0.0050061 1.00 48.00 121.00 61.000 289.200 283.800 0.110 0.520 0.228 0.400 0.0054062 1.00 48.00 121.00 62.000 283.800 278.500 0.110 0.520 0.242 0.390 0.00530
blw dryden 63 1.00 48.00 121.00 63.000 278.500 272.600 0.110 0.520 0.164 0.420 0.0059064 1.00 48.00 121.00 64.000 272.600 266.800 0.110 0.520 0.220 0.380 0.0058065 1.00 48.00 121.00 65.000 266.800 261.100 0.110 0.520 0.281 0.360 0.0057066 1.00 48.00 121.00 66.000 261.100 255.800 0.110 0.520 0.224 0.380 0.0053067 1.00 48.00 121.00 67.000 255.800 252.100 0.110 0.520 0.225 0.370 0.0037068 1.00 48.00 121.00 68.000 252.100 247.600 0.110 0.520 0.154 0.440 0.00450
above cashmere 69 1.00 48.00 120.00 69.000 247.600 243.600 0.100 0.560 0.223 0.360 0.0040070 1.00 48.00 120.00 70.000 243.600 240.600 0.100 0.560 0.196 0.410 0.0030071 1.00 48.00 120.00 71.000 240.600 238.600 0.100 0.560 0.326 0.260 0.0020072 1.00 48.00 120.00 72.000 238.600 234.800 0.100 0.560 0.370 0.240 0.0038073 1.00 48.00 120.00 73.000 234.800 230.600 0.100 0.560 0.232 0.340 0.0042074 1.00 48.00 120.00 74.000 230.600 230.500 0.100 0.560 0.179 0.410 0.0001075 1.00 48.00 120.00 75.000 230.500 227.300 0.070 0.600 0.301 0.330 0.00320
monitor 76 1.00 48.00 120.00 76.000 227.300 216.800 0.070 0.600 0.258 0.350 0.0105077 1.00 47.00 120.00 77.000 216.800 212.500 0.100 0.560 0.172 0.400 0.0043078 1.00 47.00 120.00 78.000 212.500 208.300 0.100 0.560 0.219 0.350 0.0042079 1.00 47.00 120.00 79.000 208.300 206.000 0.100 0.560 0.225 0.350 0.0023080 1.00 47.00 120.00 80.000 206.000 204.000 0.100 0.560 0.292 0.270 0.00200
sleepy hollow 81 1.00 47.00 120.00 81.000 204.000 201.400 0.100 0.560 0.233 0.310 0.0026082 1.00 47.00 120.00 82.000 201.400 198.900 0.100 0.560 0.210 0.340 0.0025083 1.00 47.00 120.00 83.000 198.900 197.900 0.100 0.560 0.228 0.340 0.0010084 1.00 47.00 120.00 84.000 197.900 193.700 0.100 0.560 0.173 0.400 0.0042085 1.00 47.00 120.00 85.000 193.700 191.100 0.100 0.560 0.210 0.380 0.00260
mouth 86 1.00 47.00 120.00 86.000 191.100 184.600 0.100 0.560 0.175 0.360 0.00650
Velocity DepthElevation
Page 130
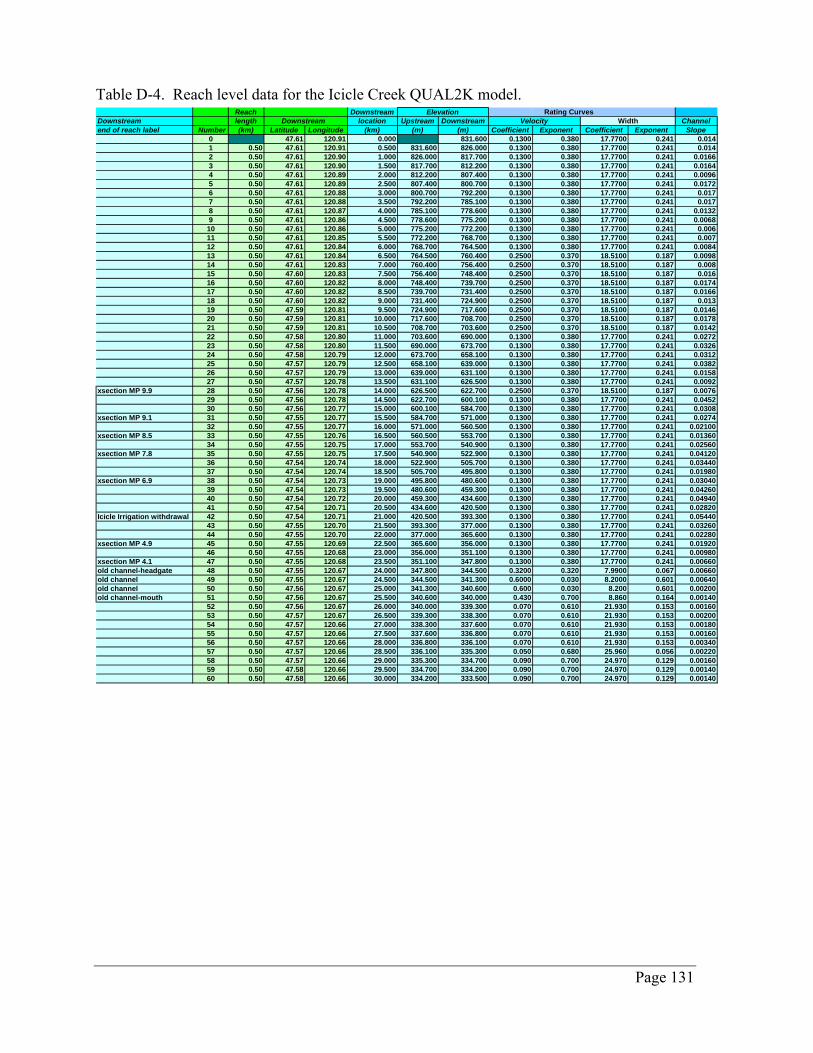
Table D-4. Reach level data for the Icicle Creek QUAL2K model. Reach Downstream Rating Curves
Downstream length Downstream location Upstream Downstream Channelend of reach label Number (km) Latitude Longitude (km) (m) (m) Coefficient Exponent Coefficient Exponent Slope
0 47.61 120.91 0.000 831.600 0.1300 0.380 17.7700 0.241 0.0141 0.50 47.61 120.91 0.500 831.600 826.000 0.1300 0.380 17.7700 0.241 0.0142 0.50 47.61 120.90 1.000 826.000 817.700 0.1300 0.380 17.7700 0.241 0.01663 0.50 47.61 120.90 1.500 817.700 812.200 0.1300 0.380 17.7700 0.241 0.01644 0.50 47.61 120.89 2.000 812.200 807.400 0.1300 0.380 17.7700 0.241 0.00965 0.50 47.61 120.89 2.500 807.400 800.700 0.1300 0.380 17.7700 0.241 0.01726 0.50 47.61 120.88 3.000 800.700 792.200 0.1300 0.380 17.7700 0.241 0.0177 0.50 47.61 120.88 3.500 792.200 785.100 0.1300 0.380 17.7700 0.241 0.0178 0.50 47.61 120.87 4.000 785.100 778.600 0.1300 0.380 17.7700 0.241 0.01329 0.50 47.61 120.86 4.500 778.600 775.200 0.1300 0.380 17.7700 0.241 0.006810 0.50 47.61 120.86 5.000 775.200 772.200 0.1300 0.380 17.7700 0.241 0.00611 0.50 47.61 120.85 5.500 772.200 768.700 0.1300 0.380 17.7700 0.241 0.00712 0.50 47.61 120.84 6.000 768.700 764.500 0.1300 0.380 17.7700 0.241 0.008413 0.50 47.61 120.84 6.500 764.500 760.400 0.2500 0.370 18.5100 0.187 0.009814 0.50 47.61 120.83 7.000 760.400 756.400 0.2500 0.370 18.5100 0.187 0.00815 0.50 47.60 120.83 7.500 756.400 748.400 0.2500 0.370 18.5100 0.187 0.01616 0.50 47.60 120.82 8.000 748.400 739.700 0.2500 0.370 18.5100 0.187 0.017417 0.50 47.60 120.82 8.500 739.700 731.400 0.2500 0.370 18.5100 0.187 0.016618 0.50 47.60 120.82 9.000 731.400 724.900 0.2500 0.370 18.5100 0.187 0.01319 0.50 47.59 120.81 9.500 724.900 717.600 0.2500 0.370 18.5100 0.187 0.014620 0.50 47.59 120.81 10.000 717.600 708.700 0.2500 0.370 18.5100 0.187 0.017821 0.50 47.59 120.81 10.500 708.700 703.600 0.2500 0.370 18.5100 0.187 0.014222 0.50 47.58 120.80 11.000 703.600 690.000 0.1300 0.380 17.7700 0.241 0.027223 0.50 47.58 120.80 11.500 690.000 673.700 0.1300 0.380 17.7700 0.241 0.032624 0.50 47.58 120.79 12.000 673.700 658.100 0.1300 0.380 17.7700 0.241 0.031225 0.50 47.57 120.79 12.500 658.100 639.000 0.1300 0.380 17.7700 0.241 0.038226 0.50 47.57 120.79 13.000 639.000 631.100 0.1300 0.380 17.7700 0.241 0.015827 0.50 47.57 120.78 13.500 631.100 626.500 0.1300 0.380 17.7700 0.241 0.0092
xsection MP 9.9 28 0.50 47.56 120.78 14.000 626.500 622.700 0.2500 0.370 18.5100 0.187 0.007629 0.50 47.56 120.78 14.500 622.700 600.100 0.1300 0.380 17.7700 0.241 0.045230 0.50 47.56 120.77 15.000 600.100 584.700 0.1300 0.380 17.7700 0.241 0.0308
xsection MP 9.1 31 0.50 47.55 120.77 15.500 584.700 571.000 0.1300 0.380 17.7700 0.241 0.027432 0.50 47.55 120.77 16.000 571.000 560.500 0.1300 0.380 17.7700 0.241 0.02100
xsection MP 8.5 33 0.50 47.55 120.76 16.500 560.500 553.700 0.1300 0.380 17.7700 0.241 0.0136034 0.50 47.55 120.75 17.000 553.700 540.900 0.1300 0.380 17.7700 0.241 0.02560
xsection MP 7.8 35 0.50 47.55 120.75 17.500 540.900 522.900 0.1300 0.380 17.7700 0.241 0.0412036 0.50 47.54 120.74 18.000 522.900 505.700 0.1300 0.380 17.7700 0.241 0.0344037 0.50 47.54 120.74 18.500 505.700 495.800 0.1300 0.380 17.7700 0.241 0.01980
xsection MP 6.9 38 0.50 47.54 120.73 19.000 495.800 480.600 0.1300 0.380 17.7700 0.241 0.0304039 0.50 47.54 120.73 19.500 480.600 459.300 0.1300 0.380 17.7700 0.241 0.0426040 0.50 47.54 120.72 20.000 459.300 434.600 0.1300 0.380 17.7700 0.241 0.0494041 0.50 47.54 120.71 20.500 434.600 420.500 0.1300 0.380 17.7700 0.241 0.02820
Icicle Irrigation withdrawal 42 0.50 47.54 120.71 21.000 420.500 393.300 0.1300 0.380 17.7700 0.241 0.0544043 0.50 47.55 120.70 21.500 393.300 377.000 0.1300 0.380 17.7700 0.241 0.0326044 0.50 47.55 120.70 22.000 377.000 365.600 0.1300 0.380 17.7700 0.241 0.02280
xsection MP 4.9 45 0.50 47.55 120.69 22.500 365.600 356.000 0.1300 0.380 17.7700 0.241 0.0192046 0.50 47.55 120.68 23.000 356.000 351.100 0.1300 0.380 17.7700 0.241 0.00980
xsection MP 4.1 47 0.50 47.55 120.68 23.500 351.100 347.800 0.1300 0.380 17.7700 0.241 0.00660old channel-headgate 48 0.50 47.55 120.67 24.000 347.800 344.500 0.3200 0.320 7.9900 0.067 0.00660old channel 49 0.50 47.55 120.67 24.500 344.500 341.300 0.6000 0.030 8.2000 0.601 0.00640old channel 50 0.50 47.56 120.67 25.000 341.300 340.600 0.600 0.030 8.200 0.601 0.00200old channel-mouth 51 0.50 47.56 120.67 25.500 340.600 340.000 0.430 0.700 8.860 0.164 0.00140
52 0.50 47.56 120.67 26.000 340.000 339.300 0.070 0.610 21.930 0.153 0.0016053 0.50 47.57 120.67 26.500 339.300 338.300 0.070 0.610 21.930 0.153 0.0020054 0.50 47.57 120.66 27.000 338.300 337.600 0.070 0.610 21.930 0.153 0.0018055 0.50 47.57 120.66 27.500 337.600 336.800 0.070 0.610 21.930 0.153 0.0016056 0.50 47.57 120.66 28.000 336.800 336.100 0.070 0.610 21.930 0.153 0.0034057 0.50 47.57 120.66 28.500 336.100 335.300 0.050 0.680 25.960 0.056 0.0022058 0.50 47.57 120.66 29.000 335.300 334.700 0.090 0.700 24.970 0.129 0.0016059 0.50 47.58 120.66 29.500 334.700 334.200 0.090 0.700 24.970 0.129 0.0014060 0.50 47.58 120.66 30.000 334.200 333.500 0.090 0.700 24.970 0.129 0.00140
Velocity WidthElevation
Page 131

This page is purposely left blank
Page 132
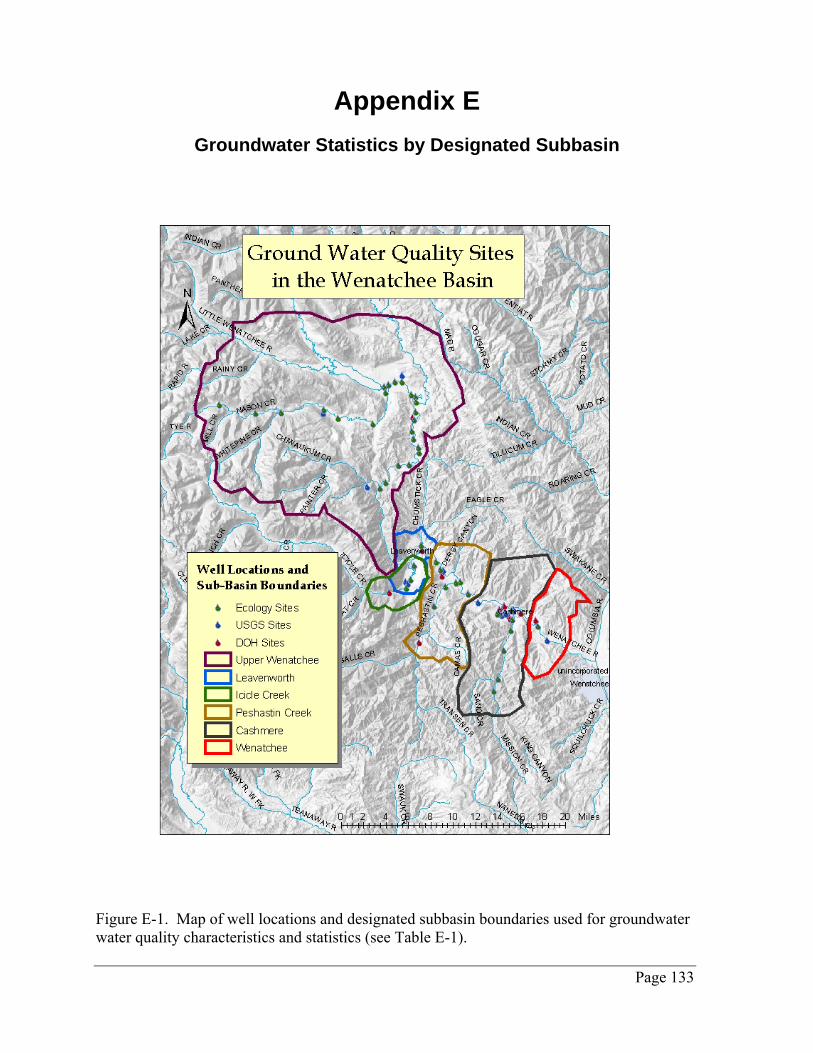
Appendix E
Groundwater Statistics by Designated Subbasin
Figure E-1. Map of well locations and designated subbasin boundaries used for groundwater water quality characteristics and statistics (see Table E-1).
Page 133
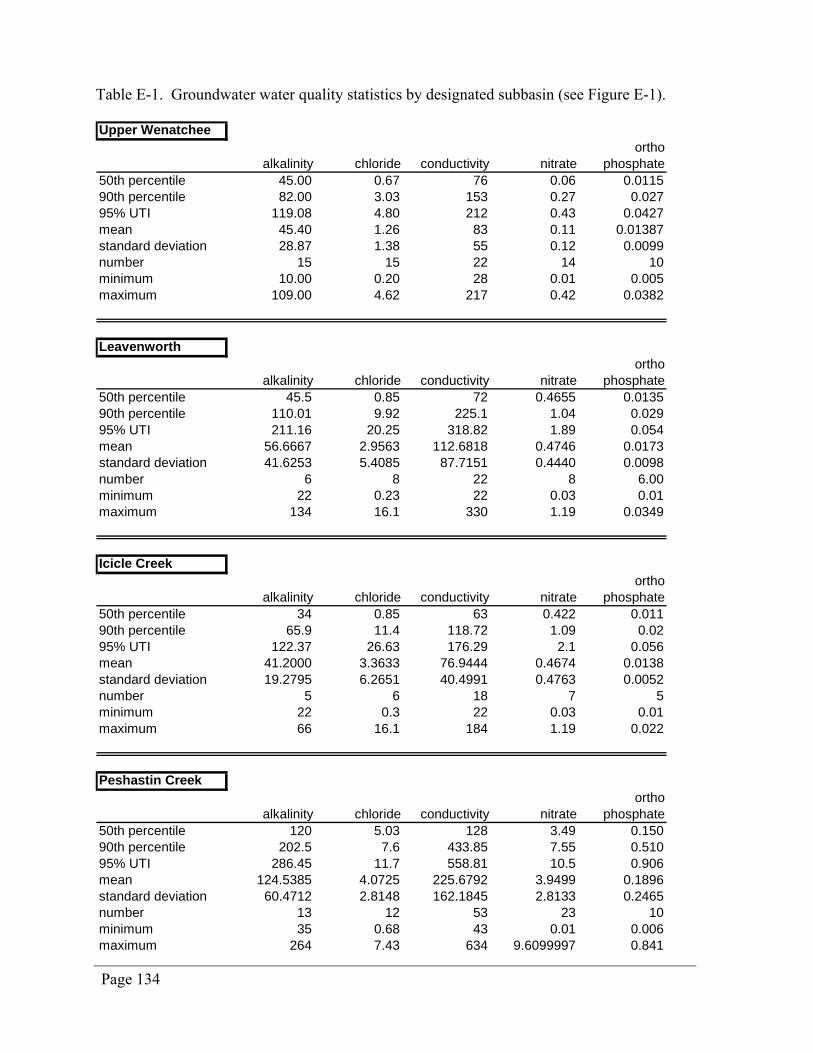
Table E-1. Groundwater water quality statistics by designated subbasin (see Figure E-1).
0
.01
0
Upper Wenatchee
alkalinity chloride conductivity nitrateortho
phosphate50th percentile 45.00 0.67 76 0.06 0.011590th percentile 82.00 3.03 153 0.27 0.02795% UTI 119.08 4.80 212 0.43 0.0427mean 45.40 1.26 83 0.11 0.01387standard deviation 28.87 1.38 55 0.12 0.0099number 15 15 22 14 1minimum 10.00 0.20 28 0.01 0.005maximum 109.00 4.62 217 0.42 0.0382
Leavenworth
alkalinity chloride conductivity nitrateortho
phosphate50th percentile 45.5 0.85 72 0.4655 0.013590th percentile 110.01 9.92 225.1 1.04 0.02995% UTI 211.16 20.25 318.82 1.89 0.054mean 56.6667 2.9563 112.6818 0.4746 0.0173standard deviation 41.6253 5.4085 87.7151 0.4440 0.0098number 6 8 22 8 6.00minimum 22 0.23 22 0.03 0maximum 134 16.1 330 1.19 0.0349
Icicle Creek
alkalinity chloride conductivity nitrateortho
phosphate50th percentile 34 0.85 63 0.422 0.01190th percentile 65.9 11.4 118.72 1.09 0.0295% UTI 122.37 26.63 176.29 2.1 0.056mean 41.2000 3.3633 76.9444 0.4674 0.0138standard deviation 19.2795 6.2651 40.4991 0.4763 0.0052number 5 6 18 7 5minimum 22 0.3 22 0.03 0.01maximum 66 16.1 184 1.19 0.022
Peshastin Creek
alkalinity chloride conductivity nitrateortho
phosphate50th percentile 120 5.03 128 3.49 0.15090th percentile 202.5 7.6 433.85 7.55 0.51095% UTI 286.45 11.7 558.81 10.5 0.906mean 124.5385 4.0725 225.6792 3.9499 0.1896standard deviation 60.4712 2.8148 162.1845 2.8133 0.2465number 13 12 53 23 1minimum 35 0.68 43 0.01 0.006maximum 264 7.43 634 9.6099997 0.841
Page 134
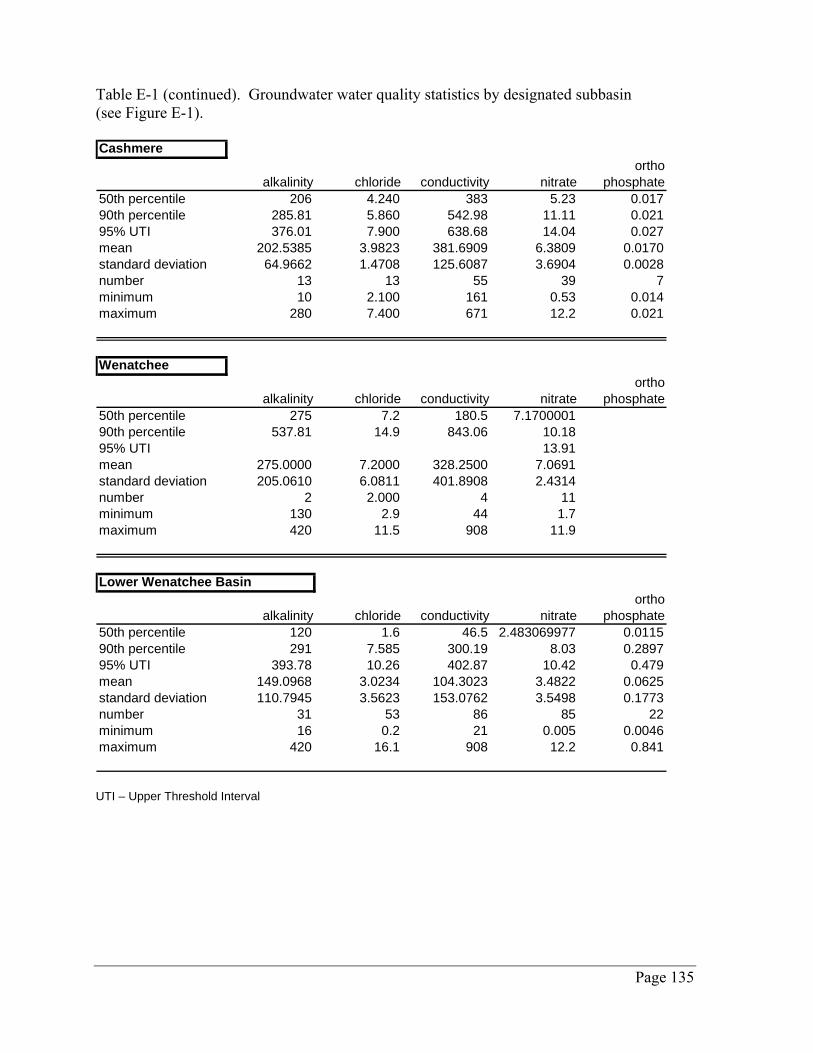
Table E-1 (continued). Groundwater water quality statistics by designated subbasin (see Figure E-1).
7
2
Cashmere
alkalinity chloride conductivity nitrateortho
phosphate50th percentile 206 4.240 383 5.23 0.01790th percentile 285.81 5.860 542.98 11.11 0.02195% UTI 376.01 7.900 638.68 14.04 0.027mean 202.5385 3.9823 381.6909 6.3809 0.0170standard deviation 64.9662 1.4708 125.6087 3.6904 0.0028number 13 13 55 39minimum 10 2.100 161 0.53 0.014maximum 280 7.400 671 12.2 0.021
Wenatchee
alkalinity chloride conductivity nitrateortho
phosphate50th percentile 275 7.2 180.5 7.170000190th percentile 537.81 14.9 843.06 10.1895% UTI 13.91mean 275.0000 7.2000 328.2500 7.0691standard deviation 205.0610 6.0811 401.8908 2.4314number 2 2.000 4 11minimum 130 2.9 44 1.7maximum 420 11.5 908 11.9
Lower Wenatchee Basin
alkalinity chloride conductivity nitrateortho
phosphate50th percentile 120 1.6 46.5 2.483069977 0.011590th percentile 291 7.585 300.19 8.03 0.289795% UTI 393.78 10.26 402.87 10.42 0.479mean 149.0968 3.0234 104.3023 3.4822 0.0625standard deviation 110.7945 3.5623 153.0762 3.5498 0.1773number 31 53 86 85 2minimum 16 0.2 21 0.005 0.0046maximum 420 16.1 908 12.2 0.841
UTI – Upper Threshold Interval
Page 135
![Dissolved Oxygen [DO]](https://static.fdocuments.net/doc/165x107/5a6721977f8b9ab12b8b464b/dissolved-oxygen-do.jpg)