Intelligent Adversary Risk Analysis: A Bioterrorism Risk ... · PDF fileIntelligent Adversary...
30
Submitted to Risk Analysis, Journal of the Society for Risk Analysis, February 20, 2009 Intelligent Adversary Risk Analysis: A Bioterrorism Risk Management Model Dr. Gregory S. Parnell Professor of Systems Engineering Department of Systems Engineering United States Military Academy at West Point [email protected] MAJ Christopher M. Smith Instructor Department of Mathematical Sciences United States Military Academy at West Point [email protected] Dr. Frederick I. Moxley Director of Research for Network Science Department of Electrical Engineering and Computer Science United States Military Academy at West Point [email protected] Abstract: The tragic events of 911 and the concerns about the potential for a terrorist or hostile state attack with weapons of mass destruction have led to an increased emphasis on risk analysis for homeland security. Uncertain hazards (natural and engineering) have been analyzed using Probabilistic Risk Analysis. Unlike uncertain hazards, terrorists and hostile states are intelligent adversaries who adapt their plans and actions to achieve their strategic objectives. This paper compares uncertain hazard risk analysis with intelligent adversary risk analysis, describes the intelligent adversary risk analysis challenges, and uses a defender-attacker-defender decision analysis model to evaluate defender investments. The model includes defender decisions prior to an attack; attacker decisions during the attack; defender actions after an attack; and the uncertainties of attack implementation, detection, and consequences. The risk management model is demonstrated with an illustrative bioterrorism problem with notional data. Key words: intelligent adversary risk analysis, bioterrorism, defender-attacker-defender, risk management, terrorism risk analysis February 20, 2009 1
Transcript of Intelligent Adversary Risk Analysis: A Bioterrorism Risk ... · PDF fileIntelligent Adversary...

Submitted to Risk Analysis, Journal of the Society for Risk Analysis, February 20, 2009
Intelligent Adversary Risk Analysis:
A Bioterrorism Risk Management Model
Dr. Gregory S. Parnell
Professor of Systems Engineering Department of Systems Engineering
United States Military Academy at West Point [email protected]
MAJ Christopher M. Smith
Instructor Department of Mathematical Sciences
United States Military Academy at West Point [email protected]
Dr. Frederick I. Moxley Director of Research for Network Science
Department of Electrical Engineering and Computer Science United States Military Academy at West Point
Abstract:
The tragic events of 911 and the concerns about the potential for a terrorist or hostile state attack with weapons of mass destruction have led to an increased emphasis on risk analysis for homeland security. Uncertain hazards (natural and engineering) have been analyzed using Probabilistic Risk Analysis. Unlike uncertain hazards, terrorists and hostile states are intelligent adversaries who adapt their plans and actions to achieve their strategic objectives. This paper compares uncertain hazard risk analysis with intelligent adversary risk analysis, describes the intelligent adversary risk analysis challenges, and uses a defender-attacker-defender decision analysis model to evaluate defender investments. The model includes defender decisions prior to an attack; attacker decisions during the attack; defender actions after an attack; and the uncertainties of attack implementation, detection, and consequences. The risk management model is demonstrated with an illustrative bioterrorism problem with notional data.
Key words: intelligent adversary risk analysis, bioterrorism, defender-attacker-defender, risk management, terrorism risk analysis
February 20, 2009
1

Report Documentation Page Form ApprovedOMB No. 0704-0188
Public reporting burden for the collection of information is estimated to average 1 hour per response, including the time for reviewing instructions, searching existing data sources, gathering andmaintaining the data needed, and completing and reviewing the collection of information. Send comments regarding this burden estimate or any other aspect of this collection of information,including suggestions for reducing this burden, to Washington Headquarters Services, Directorate for Information Operations and Reports, 1215 Jefferson Davis Highway, Suite 1204, ArlingtonVA 22202-4302. Respondents should be aware that notwithstanding any other provision of law, no person shall be subject to a penalty for failing to comply with a collection of information if itdoes not display a currently valid OMB control number.
1. REPORT DATE 20 FEB 2009 2. REPORT TYPE
3. DATES COVERED 00-00-2009 to 00-00-2009
4. TITLE AND SUBTITLE Intelligent Adversary Risk Analysis: A Bioterrorism Risk Management Model
5a. CONTRACT NUMBER
5b. GRANT NUMBER
5c. PROGRAM ELEMENT NUMBER
6. AUTHOR(S) 5d. PROJECT NUMBER
5e. TASK NUMBER
5f. WORK UNIT NUMBER
7. PERFORMING ORGANIZATION NAME(S) AND ADDRESS(ES) United States Military Academy at West Point,Department of SystemsEngineering,West Point,NY,10996
8. PERFORMING ORGANIZATIONREPORT NUMBER
9. SPONSORING/MONITORING AGENCY NAME(S) AND ADDRESS(ES) 10. SPONSOR/MONITOR’S ACRONYM(S)
11. SPONSOR/MONITOR’S REPORT NUMBER(S)
12. DISTRIBUTION/AVAILABILITY STATEMENT Approved for public release; distribution unlimited
13. SUPPLEMENTARY NOTES
14. ABSTRACT The tragic events of 911 and the concerns about the potential for a terrorist or hostile state attack withweapons of mass destruction have led to an increased emphasis on risk analysis for homeland security.Uncertain hazards (natural and engineering) have been analyzed using Probabilistic Risk Analysis. Unlikeuncertain hazards, terrorists and hostile states are intelligent adversaries who adapt their plans andactions to achieve their strategic objectives. This paper compares uncertain hazard risk analysis withintelligent adversary risk analysis, describes the intelligent adversary risk analysis challenges, and uses adefender-attacker-defender decision analysis model to evaluate defender investments. The model includesdefender decisions prior to an attack; attacker decisions during the attack; defender actions after anattack; and the uncertainties of attack implementation, detection, and consequences. The risk managementmodel is demonstrated with an illustrative bioterrorism problem with notional data.
15. SUBJECT TERMS
16. SECURITY CLASSIFICATION OF: 17. LIMITATION OF ABSTRACT Same as
Report (SAR)
18. NUMBEROF PAGES
29
19a. NAME OFRESPONSIBLE PERSON
a. REPORT unclassified
b. ABSTRACT unclassified
c. THIS PAGE unclassified
Standard Form 298 (Rev. 8-98) Prescribed by ANSI Std Z39-18

Submitted to Risk Analysis, Journal of the Society for Risk Analysis, February 20, 2009
1. INTELLIGENT ADVERSARY RISK ANALISIS IS DIFFERENT THAN HAZARD RISK ANALYSIS
Risk analysis has helped public and private organizations assess, communicate, and manage the risk
posed by uncertain hazards (i.e. natural hazards and engineered systems) (Henley, E. and Kumamoto, H.,
1996, Ayyub, B., 2003, and Haimes, 2004). The U.S. government has been informed on preparation for
natural events and potential engineered system failures by credible and timely risk analysis. In
probabilistic risk analysis (PRA), the uncertain hazards have been modeled using probability distributions
for threats, vulnerabilities, and consequences. The data has been obtained from statistical analysis of past
events, tests, models, simulations, and assessments from subject matter experts. Risk analysts have used
PRA techniques including event trees, fault trees, attack trees, systems dynamics, and Markov models to
assess, communicate, and manage the risk of uncertain hazards.
The nuclear power industry, perhaps more than any other risk application area, has integrated the
use of PRA for risk assessment, risk communication, and risk management. The original PRA process
was developed in the commercial nuclear power industry in the 1970s (USNRC, 1975). The U.S. Nuclear
Regulatory Commission and the nuclear power industry jointly developed procedures and handbooks for
PRA models (USNRC, 1983, and Vesely, 1981). Today, the nuclear power industry is moving toward
risk-based regulations, specifically using PRA to analyze and demonstrate lower cost regulations without
compromising safety (Davison and Vantine, 1998, Frank, 1988). Research in the nuclear industry has also
supported advances in human reliability analysis, external events analysis, and common cause failure
analysis (USNRC, 1991, Mosleh, 1993, and USNRC, 1996).
More recently, leaders of public and private organizations have requested risk analyses for
problems that involve the threats posed by intelligent adversaries. For example, in 2004, the President
directed the Department of Homeland Security (DHS) to assess the risk of bioterrorism (HSPD-10, 2004).
Homeland Security Presidential Directive 10 (HSPD-10): Biodefense for the 21st Century, states that
2

Submitted to Risk Analysis, Journal of the Society for Risk Analysis, February 20, 2009
“[b]iological weapons in the possession of hostile states or terrorists pose unique and grave threats to the
safety and security of the United States and our allies” and charged the DHS with issuing biennial
assessments of biological threats, to “guide prioritization of our on-going investments in biodefense-
related research, development, planning, and preparedness.” A subsequent Homeland Security
Presidential Directive 18 (HSPD-18): Medical Countermeasures against Weapons of Mass Destruction
directed an integrated risk assessment of all chemical, biological, radiological, and nuclear (CBRN)
threats. The critical risk analysis question addressed in this paper is: are the standard PRA techniques for
uncertain hazard techniques adequate and appropriate for intelligent adversaries? Our answer is an
emphatic no. We will show that treating adversary decisions as uncertain hazards is inappropriate
because it provides the wrong assessment of risks.
In the rest of this section, we describe the difference between natural hazards and intelligent
adversaries and demonstrate, with a simple example, that standard PRA does not properly assess the risk
of an intelligent adversary attack. In the second section, we describe a canonical model for resource
allocation decision making for an intelligent adversary problem using an illustrative bioterrorism example
with notional data. In the third section, we describe the illustrative analysis results obtained for model
and discuss the insights they provide for risk management. In the fourth section, we describe the benefits
and limitations of the model. Finally, we discuss future work and our conclusions.
1.1. Intelligent adversary risk analysis requires new approaches
We believe that risk analysis of uncertain hazards is fundamentally different than risk analysis
of intelligent adversaries. Others have found that there are differences between risks from intelligent
adversaries and other risk management decisions (Willis, 2006). Some of the key differences are
summarized in the Table 1 below (NRC, 2008). A key difference is historical data. For many
uncertain events, both natural and engineered, we have not only historical data of extreme failures or
crises, but many times we can replicate events in a laboratory environment for further study
3

Submitted to Risk Analysis, Journal of the Society for Risk Analysis, February 20, 2009
(engineered systems) or analyze using complex simulations. Intelligent adversary attacks have a long
historical background, but the aims, events, and effects have incomplete documentation.
Both risk of occurrence and geographical risk can be narrowed down and identified concretely.
Intelligent adversary targets vary by the goals of the adversary and can be vastly dissimilar between
adversary attacks.
Table 1: Uncertain Hazards vs. Intelligent Adversaries
Information sharing between the two events differs dramatically. After hurricanes or
earthquakes, engineers typically review the incident, publish results, and improve their simulations.
Sometimes after intelligent adversary attacks, or near misses, the situation and conduct of the attack
may involve critical state vulnerabilities and protected intelligence means. In these cases, intelligence
agencies may be reluctant to share complete information even with other government agencies.
Uncertain Hazards Intelligent Adversaries Historical Data Some historical data:
me events Very limited historical data:
, were the first foreign A record exists of extrethat have already occurred.
Events of September 11, 2001terrorist attacks worldwide with such a huge concentration of victims and insured damages.
Risk of Occurrence Risk reasonably well defined: Well-developed models exist for
ical Adversaries can purposefully adapt their strategy
on their
Considerable ambiguity of risk:
estimating risks based on histordata and experts’ estimates.
(target, weapons, time) dependinginformation on vulnerabilities. Attribution may bedifficult (e.g. anthrax attacks).
Geographic Risk Some geographical areas are well known for being at risk (e.g.,
es or
riskier than others (e.g., New York City, Washington), but terrorists may
y time.
Specific areas at risk: All areas at risk: Some cities may be considered
California for earthquakFlorida for hurricanes).
attack anywhere, an
Information
ared with all the stakeholders.
p secret new information on terrorism for national security reasons.
Information sharing: New scientific knowledge on natural hazards can be sh
Asymmetry of information: Governments sometimes kee
Natural event: To date no one can influence the occurrence of an extreme natural event (e.g., an earthqu
Event Type
ake). ational and
homeland security measures).
Intelligent adversary events: Governments may be able to influence terrorism (e.g., foreign policy; international cooperation; n
Government andin well-known mitigation measures.
insureds can invest encies may Weapons types are numerous. Federal agbe in a better position to develop more efficient global mitigation programs.
Preparedness and Prevention
Modified form Kunreuthe , “ Perspectives”, in OECD n OECD lumns). Parnell, G. S., D H d Hand land
r, H. and Michel-Kerjan, E (2005), Terrorism Risk Insurance i
Insuring (Mega)-Terrorism: Challenges and Countries, July (modified first two co
illon-Merromeland Security an
book of Home
ill, R. L., and Bresnick, T. A., 2005, Integrating Risk MAntiterrorism Resource Allocation D Security, David Kamien, Editor, pp.
anagement with ecision-Making, The McGraw-Hill 431-461.
4

Submitted to Risk Analysis, Journal of the Society for Risk Analysis, February 20, 2009
The ability to influence the event is also different. Though we can prepare, we typically have
no way of influencing the natural event to occur or not occur. On the other hand, governments may
be able to affect terrorism attacks by a variety of offensive and defensive measures. Additionally,
adversary attacks can take on so many forms that one cannot realistically defend against all types of
attacks.
We believe that PRA still has an important role in intelligent adversary risk analysis for
assessment of vulnerabilities and consequences, but we do not believe we should assess probabilities
of adversary decisions. With uncertain hazards, the systems (e.g. hurricanes, nuclear reactors, or
space systems) do not make decisions so the uncertainties can be assigned a probability distribution
based on historical data, tests, models, simulations, or expert assessment. However, when we
consider intelligent adversary risk analysis, the adversary will make future decisions based on their
objectives, our actions, and future information about their ability to achieve their objectives that is
revealed during a scenario. Instead, we believe the probabilities of adversary decisions should be an
output of not an input to risk analysis models (NRC 2008).
1.2. An Illustrative Bioterrorism Example
In order to make our argument and our proposed alternative more explicit, we use a
bioterrorism illustrative example. In response to the 2004 HSPD, in October 2006, the DHS released
a report called the Bioterrorism Risk Assessment (BTRA) (BTRA, 2006). The risk assessment model
contained 17 step event tree (18 steps with consequences) that could lead to the deliberate exposure of
civilian populations for each of the 27 most dangerous pathogens that the Center for Disease Control
tracks (emergency.cdc.gov/bioterrorism) plus one engineered pathogen. The model was extremely
detailed and contained a number of separate models that fed into the main BTRA model. The BTRA
resulted in a normalized risk for each of the 28 pathogens.
5

Submitted to Risk Analysis, Journal of the Society for Risk Analysis, February 20, 2009
The National Research Council conducted a review of the BTRA model (NRC, 2008) and
provided 11 specific recommendations for improvement to the model. In our example, we will use
four of the recommendations: model the decisions of intelligent adversaries, include risk
management, and simplify the model by not assigning probabilities to the branches of uncertain
events, and do not normalize the risk. The intelligent adversary technique we illustrate is defender-
attacker-defender model (NRC 2008, Appendix E) solved with decision trees (NRC 2008, Appendix
D. Since the model has been simplified to reflect the available data, the model can be developed in a
Commercial off the Shelf (COTS) software package, such as the one we used to for modeling, DPL
(www.syncopation.org). Other decision analysis software would work as well1.
1.3. Event Trees Do Not Properly Model Intelligent Adversary Risk
Event trees have been useful for modeling uncertain hazards (Pate-Cornell, 2002). However,
there is a difference in the modeling of intelligent adversary decisions that event trees do not capture.
The attacker makes decisions to achieve his objectives. The defender makes resource allocation
decisions before and after an attack to try to mitigate vulnerabilities and consequences of the
attacker’s actions. This dynamic sequence of decisions made by first defender, then an attacker, then
again by the defender should not be modeled by assessing probabilities of the attacker’s decisions.
For example, when the attacker looks at the defender’s preparations for their possible bioterror attack,
they do not assign probabilities to their decisions; they choose the agent and the target based on their
perceived ability to acquire the agent and successfully attack the target that will give them the effects
they desire to achieve their objectives. In the 911 attack, the terrorists decided to attack the World
Trade Center and targets in Washington DC using airplanes loaded with fuel to achieve their
1 A useful reference for decision analysis software is located on the ORMS website (http://www.lionhrtpub.com/orms/surveys/das/das.html).
6
Submitted to Risk Analysis, Journal of the Society for Risk Analysis, February 20, 2009
objectives. Furthermore, they choose flights and timing to maximize their probability of success.
They did not assign probabilities to these decisions.
Representing an attacker decision as a probability can result in a fundamentally different and
flawed risk assessment. Consider the simple bioterrorism event tree given in Figure 1 with notional
data. For each agent (A and B) there is a probability that an adversary will attack, a probability of
attack success, and an expected consequence for each outcome (at the terminal node of the tree). The
probability of success involves many factors including the probability of obtaining the agent and the
probability of detection during attack preparations and execution. The consequences depend on many
factors including agent propagation, agent lethality, time to detection, and risk mitigation. Calculating
expected values in Figure 1, we would assess expected consequences of 32. We would be primarily
concerned about agent B because it contributes 84% of the expected consequences (30*0.9=27 for B
of the total of 32).
Figure 1: Event Tree Example
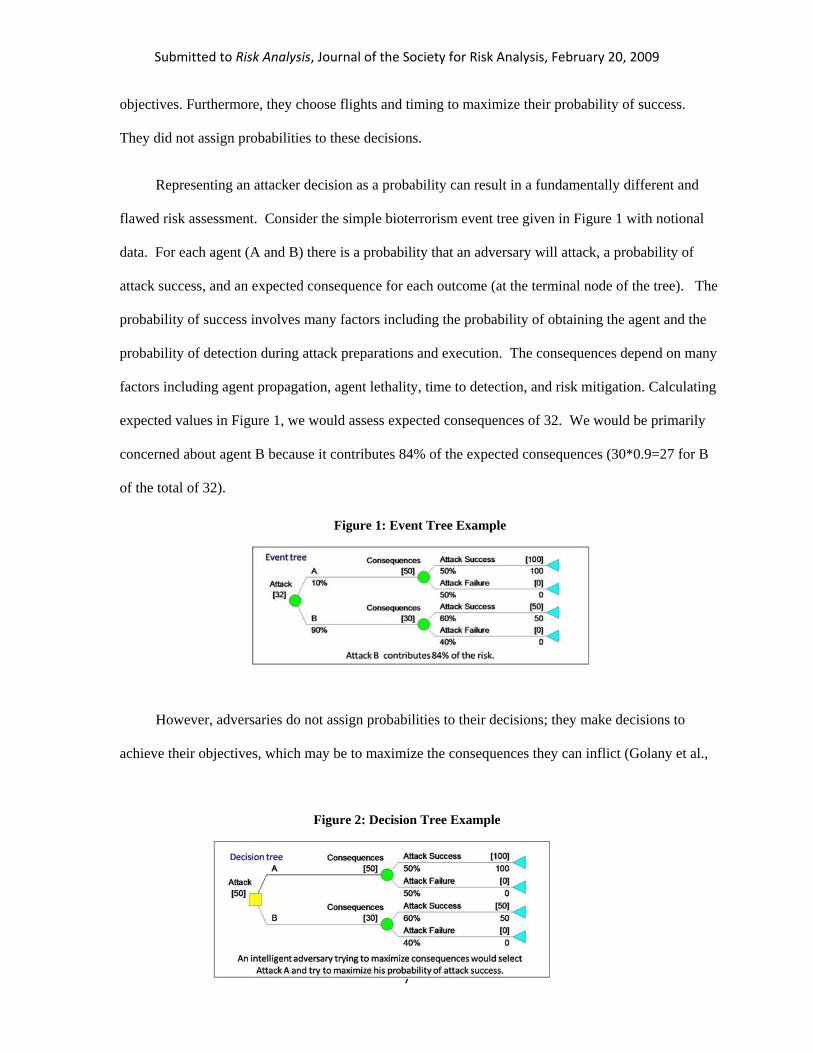
However, adversaries do not assign probabilities to their decisions; they make decisions to
achieve their objectives, which may be to maximize the consequences they can inflict (Golany et al.,
Figure 2: Decision Tree Example
7

Submitted to Risk Analysis, Journal of the Society for Risk Analysis, February 20, 2009
2009). If we use a decision tree as in Figure 2, we replace the initial probability node with a decision
node since this is an adversary decision. We find that the intelligent adversary would select agent A,
and the expected consequences are 50, which is a different result than with the event tree. The
expected consequences are greater and the primary agent of concern is now A. Clearly, event trees
underestimate the risk and provide the wrong risk ranking. However, while providing an important
insight into the fundamental flaw of using event trees for intelligent adversary risk analysis, this
simple decision tree model does not sufficiently model the fundamental structure of intelligent
adversary risk.
2. CANONICAL INTELLIGENT ADVERSARY RISK MANAGEMENT
MODEL FOR BIOTERRISM
We believe the canonical risk management model for bioterrorism homeland security must have at
six components: the initial actions of the defender to acquire defensive capabilities, the attacker’s
uncertain acquisition of the agents (e.g., A, B, and C), the attacker’s target selection and method of
attack(s) given agent acquisition, the defender’s risk mitigation actions given attack detection, the
uncertain consequences, and the cost of the defender actions. In general the defender decisions can
provide offensive, defensive, or informational capabilities. We are not considering offensive decisions
such as preemption before an attack; however, we are considering decisions that will increase our
Figure 3: Canonical Bioterrorism Decision Tree
8

Submitted to Risk Analysis, Journal of the Society for Risk Analysis, February 20, 2009
defensive capability (e.g. buy vaccine reserves) (BioShield, 2004) or provide earlier or more complete
information for warning of an attack (add a Bio Watch city) (BioWatch, 2003). In our defender-attacker-
defender decision analysis model, we have the two defender decisions (buy vaccine, add a Bio Watch
city), the agent acquisition is uncertain, the target and method of attack are attacker decisions, the
consequences (fatalities and economic) are uncertain, and the costs are known. The U.S. risk is defined
as the probability of adverse consequences and is modeled using a multiobjective additive model similar
to multiobjective value models (Kirkwood, 1997). The defender minimizes the risk and the attacker
maximizes the risk. We implemented a decision tree (Figure 3) and an influence diagram (Figure 4) using
DPL. The mathematical formulation of our model and the notional data are provided in the appendix.
Figure 4: Canonical Bioterrorism Influence Diagram
2.1. Defender.
The illustrative decision tree model (Figure 3) begins with decisions that the defender (U.S.)
makes to deter the adversary by reducing the vulnerabilities or be better prepared to mitigate a
bioterrorism attack of agents A, B, or C. We modeled the agents to represent notional bioterror
agents using the CDCs agent categories in Table 2 below. For example, agent A represents a notional
agent from category A. Table 3 provides a current listing of the agents by category. There are many
decisions that we could model, however for our simple illustrative example, we chose to model
9

Submitted to Risk Analysis, Journal of the Society for Risk Analysis, February 20, 2009
notional decisions about the Bio Watch program for agents A and B and the BioShield vaccine
reserve for Agent A.
Table 2: CDC BioTerror Agent Categories
Bio Watch is a program that installs and monitors a series of passive sensors within a major
metropolitan city (BioWatch, 2003). The BioShield program is a plan to purchase and store vaccines
for some of the more dangerous pathogens (BioShield, 2004). The defender first decides whether or
not to add another city to the Bio Watch program. If that city is attacked, this decision could affect
the warning time, which influences the response and ultimately the potential consequences of an
attack. Of course the BioWatch system does not detect every agent, so we modeled agent C to be the
most effective agent that the BioWatch system does not sense and therefore will give no additional
warning. Adding a city will also incur a cost in dollars for the U.S.
Category Definition
A
The U.S. public health system and primary healthcare providers must be e
e
prepared to address various biological agents, including pathogens that arrarely seen in the United States. High-priority agents include organisms thatpose a risk to national security because they: can be easily disseminated or transmitted from person to person; result in high mortality rates and have thpotential for major public health impact; might cause public panic and social disruption; and require special action for public health preparedness.
B
to
Second highest priority agents include those that: are moderately easydisseminate; result in moderate morbidity rates and low mortality rates; andrequire specific enhancements of CDC's diagnostic capacity and enhanced disease surveillance
C issemination in the future because of: availability; ease of ality
Third highest priority agents include emerging pathogens that could be engineered for mass dproduction and dissemination; and potential for high morbidity and mortrates and major health impact.
Cent r D vaihttp://www
er fo isease Control website. Bioterrorism Agents/Diseases Definitions by category. A.bt.cdc.gov/agent/agentlist-category.asp, Accessed February 10, 2009.
10

Submitted to Risk Analysis, Journal of the Society for Risk Analysis, February 20, 2009
The second notional defender decision is the amount of vaccine to store for agent A. Agent A
is the notional agent that we have modeled that exceeds the other agents in probability to acquire and
potential consequences. The defender can store a percentage of what experts think is 100% of what
we would need in a full scale biological agent attack on the maximum number of people. The more
of agent A vaccine the U.S. stores, the fewer consequences we will have if the adversaries use agent
Table 3: Pathogens
National Institutes of Health National Institute of Allergy and Infectious Diseases (NIAID)
Category A, B and C Priority Pathogens
Category A Category B Category C • Bacillus anthracis (anthrax)
• Burkholderia pseudomallei
Emerging infectious disease threats such as Nipah virus and additional hantaviruses. • Coxiella burnetii (Q fever) • Clostridium botulinum toxin
(botulism) • Brucella species (brucellosis) NIAID priority areas:
• Burkholderia mallei (glanders) • Yersinia pestis (plague) • Chlamydia psittaci (Psittacosis) • Variola major (smallpox) and
other related pox viruses • Tickborne hemorrhagic fever viruses
• Ricin toxin (from Ricinus communis) • Francisella tularensis
(tularemia) • Crimean-Congo Hemorrhagic fever virus
• Epsilon toxin of Clostridium perfringens • Viral hemorrhagic fevers
• Tickborne encephalitis viruses • Staphylococcus enterotoxin B • Arenaviruses • Yellow fever • Typhus fever (Rickettsia
prowazekii) • LCM, Junin virus, Machupo
• Multi-drug resistant TB virus, Guanarito virus • Influenza • Food and Waterborne Pathogens • Lassa Fever • Other Rickettsias • Bacteria • Bunyaviruses • Rabies • Diarrheagenic E.coli • Hantaviruses • Prions* • Pathogenic Vibrios • Rift Valley Fever • Chikungunya virus* • Shigella species • Flaviruses • Severe acute respiratory syndromeassociated
• Salmonella • Dengue • Listeria monocytogenes • Filoviruses
coronavirus (SARS-CoV)
• Campylobacter jejuni • Ebola • Yersinia enterocolitica) • Marburg
• Viruses (Caliciviruses, Hepatitis A)
• Protozoa • Cryptosporidium parvum • Cyclospora cayatanensis • Giardia lamblia • Entamoeba histolytica • Toxoplasma • Microsporidia • Additional viral encephalitides • West Nile Virus • LaCrosse • California encephalitis • VEE • EEE • WEE • Japanese Encephalitis Virus • Kyasanur Forest Virus
The list of potential bioterrorism agents was compiled from both CDC and NIH/NIAID websites available at http://www.bt.cdc.gov/agent/agentlist-category.asp and http://www3.niaid.nih.gov/topics/emerging/list.htm [accessed Feb. 10, 2009].
11

Submitted to Risk Analysis, Journal of the Society for Risk Analysis, February 20, 2009
A and we have warning time to deploy the vaccine reserve. However, as we store more vaccine, the
costs for purchasing and storage increase.
2.2. Attacker.
After the defender has made their investment decisions, the attacker makes two decisions: the
type of agent and the target. We will assume that the attacker has already made the decision to attack
the United States with a bioterror attack. In our model, there are three agents they can choose,
though this can be increased to represent the other pathogens listed in Table 3. As stated earlier, if we
only looked at the attacker decision, agent A would be the best choice. Agent B and C are the next
two most attractive agents to the attacker. Again, agent B can be detected by BioWatch while agent
C cannot be detected by BioWatch. The attacker has a probability of acquiring each agent. If the
agent is not acquired, he cannot attack with that agent. Additionally, each agent has a lethality
associated with it, represented by the agent casualty factor. Finally, each agent has a different
probability of being detected over time. Generally, the longer it takes for the agent to be detected, the
more consequences the U.S will suffer.
The adversary also decides what population they would target. Generally, the more
population they target, the more potential consequences that could result. The attacker’s decisions
impact the maximum possible casualties from the scenario. There is a probability of actually
attaining a low, medium or high amount of those potential casualties. This sets the stage for the next
decisions by the defender.
2.3. Defender.
After warning of the attack of agent A, the defender decides whether or not to deploy the agent
A vaccine reserve. The decision depends upon how much of the vaccine reserve the U.S. chose to
store, whether the attacker used agent A, and the potential effectiveness given the attack warning.
Additionally, there is a cost associated with deploying the vaccine reserve.
12

Submitted to Risk Analysis, Journal of the Society for Risk Analysis, February 20, 2009
2.4. Consequences.
In our model (Figure 4) we have two consequences: causalities and economic impact. Given
the defender-attacker-defender decisions, the potential casualties given an attack and the economic
impact are assessed. Casualties are based on the maximum potential casualties, the warning time
given to the defender, and the effectiveness of vaccine for agent A. Economic effects are modeled
with a linear model with a fixed economic effect no matter the number of casualties and a variable
cost of the number of casualties times the dollars per casualty. Of course, the defender would like
potential consequences (risk) given an attack to be low, while the attacker would like the potential
consequences (risk) given an attack to be high.
Our economic consequences come from Wulf, Haimes and Longstaff’s paper (2003) on
economic impact of terrorism. For example, experts estimate that there was a negative $6 billion
effect on the economy due to the Anthrax letters of 2001 (World at Risk, 2008, p. 8). This attack only
infected 17 and killed 5. Therefore, we modeled the impact as a linear function with the $10 billion
as the constant and a cost per casualty also based on their work. They give an upper bound of the
casualties and economic impacts of a full scale biological attack.
2.5. Budget.
Each U.S. defender decision incurs a dollar cost. The amount of money available to homeland
security programs is limited by a budget determined by the President and Congress. The model will
track the costs incurred and only allows spending within the budget (see appendix). We considered
notional budget levels of 10M, 20M and 30M.
2.6. Risk.
Normally, a decision tree is solved by maximizing or minimizing the expected attribute at the
terminal branches of the tree. In our model, the attribute is defender risk which depends on the
casualty and economic consequences given an attack. We use multiple objective decision analysis
13

Submitted to Risk Analysis, Journal of the Society for Risk Analysis, February 20, 2009
2with an additive value (risk) model to assign risk to the defender consequences . The defender is
minimizing risk and the attacker is maximizing risk. Therefore, we assign a risk of 0.0 to no
consequences and a value of 1.0 to the worst case consequences in our model. We model each
consequence with a linear value function (constant returns to scale) and a weight (See Appendix).
The risk functions measure returns to scale on the consequences. Of course, additional consequences
could be included and different shape risk curves could be used.
Table 4: Modeling Assumptions
Categories Our Assumptions Possible Alternative Assumptions Uncertain Variables
Probability of acquiring the agent, Other indications and warning
Detection time varies by agent
Add Bio Watch city for agent A and B Additional detection and warning systems
Increase vaccine reserve Increase stocks of multiple agents Decisions stocks for agent A
Deploy vaccine A Other risk mitigation decisions
Different casualty models for Consequence Models
One casualty model for all three agents different agents
Casualties and economic consequences Additional risk measures
Defender minimizes risk and attacker maximizes risk
Other optimization assumptions Risks
Solve decision tree at various Other solution approaches
budget levels
2.7. Assumptions.
Some of the key assumptions in our model are listed in Table 4 (the details are in the
Appendix) and some possible alternative assumptions. Given different assumptions, the model may
produce different results.
2 We define risk to be a weighted expected value using an additive value model instead of a probability of a bad outcome.
14

Submitted to Risk Analysis, Journal of the Society for Risk Analysis, February 20, 2009
We model uncertainty in probability that an adversary acquires an agent and we vary detection
time by agent. Clearly, other indications and warning exist to detect possible attacks. These
programs could be included in the model.
We model three decisions: add Bio Watch for agent A and B, increase vaccine researve for
agent A, and deploy agent A. Additionally, we assume limited decisions (i.e., 100% storage of
vaccine A, 50% storage, 0% storage), but there decisions that could be modeled (e.g., other levels of
storage, storing vaccines for other agents, etc).
We used one casualty model for all agents. There are other casualty and economic models that
could be used.
Finally some risk assumptions that our model makes are listed. First, we assume that the risks
important to the defender are the number of casualties and the economic impact but additional
measures could be used. Second, we assume defenders and attackers have a diametrically opposed
view of all of the objectives. Finally, we made some budget assumptions, which could be improved
or modified. We assumed a number for a budget, but this budget could be modeled with more
detailed cost models (e.g., Instead of adding a set amount to adding a city to the Bio Watch program,
the budget could reflect different amounts depending upon the city and the robustness of the sensors
installed).
2.8. Number of Strategies.
The canonical model has 108 different strategies to evaluate (Table 5). This is important because one
Table 5: Total number of strategies
Owner Decision # Strategies U.S. BioWatch 2U.S. BioShield 3Attacker Agent Selection 3Attacker Target 3U.S. Deploy Reserve 2Total # of Strategies 108
15

Submitted to Risk Analysis, Journal of the Society for Risk Analysis, February 20, 2009
can see that with more complexity, the number of strategies the model would need to evaluate can
grow significantly.
3. ILLUSTRATIVE DECISION ANALYSIS RESULTS
3.1. Modeling Insights.
After modeling the canonical problem, we obtained several insights. First, in our model
economic impact and casualties are highly correlated. Higher casualties will result in higher
economic impact. In addition, other consequences, e.g. psychological consequences, could also be
correlated with casualties. Second, there could be a large economic impact (and psychological
impact), even if casualties are low.
3.2. Analysis Results of Risk versus Budget
The major risk analysis results are shown in Figure 5. Risk shifting is occurs in our decision
analysis model. In the baseline, (no defender spending) Agent A is the most effective agent for the
attacker to select and the defender to consider spending resources to reduce vulnerability and/or
consequences. As we improve our defense against agent A, at some point the attacker will select
another agent, B. The high risk agent has shifted from agent A to B. Finally, as the budget level
increases, the defender adds a city to the BioWatch program and the attackers choose to attack with
agent C which Bio Watch cannot detect. We use notional data in our model, but if more realistic data
were used, the defender could determine the cost benefit of additional risk reduction decisions. This
decision model, using COTS software allows DHS to conduct risk management. They can
quantitatively evaluate the potential risk reduction of options and make cost benefit decisions.
16

Submitted to Risk Analysis, Journal of the Society for Risk Analysis, February 20, 2009
Figure 5: Budget vs. U.S. Risk
Figure 5 provides a useful summary of the expected risk. However, it is also very useful to
look a the complementary cummumative distribution (Figure 6) to better understand the risks of
Figure 6: Complimentary cumulative distribution
17

Submitted to Risk Analysis, Journal of the Society for Risk Analysis, February 20, 2009
extreme outcomes. The best risk management result would be that option 4 deterministically or
stochastically dominates (SD) option 3, 3 SD 2, and 2 SD 1. The first observation we note from
Figure 6 is that options 2, 3, and 4 stochasically dominate 1 since there is a lower probability for each
risk outcome. A second observation is that while 4 SD 3, 4 does not SD 2 since 4 has a 0.15
proability of a risk of 0.4. This illustrates a possibly important relationship necessary for
understanding how the budget might affect the defender’s risk.
3.3. Value of Information/Control.
Risk managers can run a value of control or value of correlation diagram to see which nodes
most directly affect the outcomes and which are correlated (Figure 7). Since we only have two
uncertainty nodes in our canonical model, the results are not surprising. The graphs show that the
ability to acquire the agent is positively correlated with the defender risk, and that it is the most
important variable that defender risk managers would want to control. Admittedly, this is a basic
example, but with a more complex model, analysts could determine which nodes are positively or
Figure 7: Value of Information/Control
18

Submitted to Risk Analysis, Journal of the Society for Risk Analysis, February 20, 2009
negatively correlated with risk and quantitatively which nodes we would most want to exercise
control over or gather information about the outcomes.
3.4. Sensitivity Analysis.
Using COTS software also allows us to easily perform sensitivity analysis on key model
assumptions. From the value of correlation and control above, the probability the attacker acquires
the agent they choose is an important variable. COTS software allows us to perform sensitivity
analysis like a rainbow and strategy region diagrams. The strategy region diagram (Figure 8) allows
us to see changes in strategy as our assumptions about the probability of acquiring agent A and agent
B change. The different colored/shaded regions represent a change in decisions, both the attacker
and the defender. If our assumption about the ability to acquire agent A is wrong, we see the effects.
Currently we notionally assigned the value of probability of acquiring agent A and B are .9 and .5
respectively. The diagram was run with the model at maximum budget and it shows that if the
probability of acquiring agent B rises to .6, the attackers would choose to use agent B instead of agent
C. One can also see the level of defender risk rising as the probability of acquiring agent B
increasing. In addition, we see that as the probability of acquiring agent A increases, there is no
overall change in risk unless the probability of acquiring agent B also increases.
19

Submitted to Risk Analysis, Journal of the Society for Risk Analysis, February 20, 2009
Figure 8: Rainbow Diagram Probability of Acquiring Agent A vs. Agent B
4. BENEFITS AND LIMITATIONS OF DEFENDER-ATTACKER
DECISION ANALYSIS MODEL
4.1. Benefits.
The defender-attacker-defender decision analysis model provides four important benefits. First,
it provides a more accurate risk assessment. Second, it provides information for risk-informed
decision making. Third, using COTS software that takes advantage of the existing sensitivity
analysis tools. Fourth, the risk analysis can be conducted by one risk analyst with an understanding
of decision trees and optimization and training on the features of the COTS software.
Risk analysis of intelligent adversaries is fundamentally different than risk analysis of uncertain
hazards. As we demonstrated in Section 1.3, assigning probabilities to the decisions of intelligent
adversaries underestimates the potential risk and provide an incorrect ranking of the threats. Decision
tree models of intelligent adversaries provide more accurate risk assessment.
20

Submitted to Risk Analysis, Journal of the Society for Risk Analysis, February 20, 2009
The defender-attacker-defender decision analysis provides essential information for risk
management decision making. These models provide insights about resource allocation decisions to
reduce risk and risk shifting. Additionally, with budget set to 0 you can assess the baseline risk. As
you increase the budget, the analyst can clearly show the best risk management decisions and the risk
reduction.
This model significantly simplifies the DHS BTRA model and enables the use of COTS risk
analysis software. In addition, the use of COTS software enables the use of standard sensitivity
analysis tools to provide insights into areas that the model should be improved or expanded.
Currently, the DHS BTRA event tree requires extensive contractor support to run, compile, and
analyze results (NRC 2008). The defender-attacker-defender decision analysis model is usable by a
single risk analyst who can provide real-time analysis results to stakeholders and decision makers.
This risk analyst must understand decision trees, optimization, and have training in the COTS tool.
4.2. Limitations
Some of the limitations are actually the same as using event trees. There are limitations on the
number of agents used in the models. We easily modeled 28 bio agents with reasonable run times,
but there are always more agents that could be modeled. Additionally, there are challenges in
assessing the probability of the uncertain events, e.g., the probability that the attacker acquires Agent
A. Next, there is a limitation in modeling of the multiple consequences. Another limitation may be
that in order to get more realistic results, we may have to develop “response surface” models of more
complex consequence models. These are the limitations that event trees and decision trees share.
There are some decision tree limitations that are different from event trees. First, there are a
limited number of risk management decisions that can realistically be modeled. Care must be used to
choose the most appropriate set of potential decisions. Additionally, there may be an upper bound in
the number of decisions or events the COTS software can model. In this case, an alternative would
21

Submitted to Risk Analysis, Journal of the Society for Risk Analysis, February 20, 2009
be large scale optimization software (Brown, 2005). Finally, successful model operation and
interpretation requires trained analysts who understand decision analysis and defender-attacker-
defender optimization.
5. FUTURE WORK
This paper has demonstrated the feasibility of modeling intelligent adversary risk analysis using
defender-attacker-defender decision analysis. Table 4 and the discussion in section 2.7 identified several
alternative modeling assumptions that could be considered. We can modify and expand our assumptions
to increase the complexity and fidelity of our canonical model. The next step is to use the model with the
best data available on the agents of concern and the potential risk management options.
6. CONCLUSION
These defender-attacker-defender recommendations do not require a major intelligent adversary
research program; they require the willingness to change (NRC, 2008). Much of the data used for event
tree models can be used in the decision analysis model. Assessing probabilities of attacker decisions will
not increase our security but defender-attacker-defender decision analysis models can provide a sound
assessment of risk and the essential information our nation needs to make risk-informed decisions.
ACKNOWLEDGEMENTS
The first author would like to acknowledge the many helpful discussions on intelligent adversary risk
analysis with his colleagues on the NRC committee (NRC 2008) and the defender-attacker-defender
research of Jerry Brown and his colleagues at the Naval Postgraduate School. We would also like to
acknowledge the DPL modeling advice provided by Chris Dalton of Syncopation. Finally, we would like
to thank Roger Burk at the United States Military Academy for his useful reviews and suggestions.
22

Submitted to Risk Analysis, Journal of the Society for Risk Analysis, February 20, 2009
APPENDIX: MODEL FORMULATION
This model is a multi objective decision analysis / game theory model that allows for risk
management at the U.S. governmental level in terms of budgeting and certain bio terror risk mitigation
decisions. The values for probabilities as well as factors are notional and could easily be changed based
on more accurate data. It uses the starting U.S. (defender) decisions of adding a city to the Bio Watch
program (or not) and the percent of storing an agent in the nation’s vaccine reserve program to set the
conditions for an attacker decision. The attacker can choose which agent to use as well as what size of
population to target. There is some unpredictability in the ability to acquire the agent as well as the
effects of the agent given the defender and attacker decisions. Finally, the defender gets to choose
whether to deploy the vaccine reserve to mitigate casualties. The model tracks the cost for each U.S.
decision and evaluates them over a specified budget. The decisions cannot violate the budget without
incurring a dire penalty. The objectives that the model tracks are U.S. casualties and impact to the U.S.
economy. They are joined together using a value function with weights for each objective.
We outline our model using a method suggested by Brown and Rosenthal (2008).
Table 5: Notional data for variable nodes
0% 50% 100% Agent A reserve factor (arv) 0 0.3 0.6
0 0.5 1 Vaccine Reserve cost factor (vrcfv) Agent A Agent B Agent C
0.8 07 0.7 .8 Warning time factor (wfa) Agent casualty factor (afa) 0.9 0.5 0.4 Small Medium Large Target population factor (popt) 0.001 0.1 1 Low Nominal High Potential casualties factor (pcfc) 0.6 0.8 0.99
Weight of Casualties (w1) 0.5 Agent A Agent B Agent C Probability of acquiring agent a (P(aca)) 0.9 0.5 0.49
23

Submitted to Risk Analysis, Journal of the Society for Risk Analysis, February 20, 2009
Table 6: Notional Data for probability of potential casualties c with agent a
Indicies
w = add Bio Watch city {0, 1} v = store vaccine A at percent {0%, 50%, 100%} a = agent {A, B, C} t = target population {Small - .0001 Million, Medium - .1 Million, Large - 1 Million} c = potential casualties given an attack {Low, Nominal, High} d = deploy reserve vaccine {0, 1} i = risk measure {1, 2} Data
aca = agent acquired {0, 1}
wi = weight of i value measure {w1, 1-w1}
Probability Data
P(aca) = probability acquire agent a
P(pcac)=probability of potential casualties c with agent a
Casualty Data
bwf = bio watch factor {.9}
arv= Agent A reserve factor
wfa= warning time factor
afa= agent casualty factor
popt= target population factor
mpop = max population targeted {1 Million people}
pcfc=potential casualties factor
Economic Impact Data
eif = economic impact of attack (fixed) {$10 Billion}
Probability of potential casualties c with agent a (P(pcac)) Agent A Agent B Agent C Low 0.3 0.3 0.3
0.4 0.4 0.4 Nominal High 0.3 0.3 0.3
24

Submitted to Risk Analysis, Journal of the Society for Risk Analysis, February 20, 2009
dtc = dollars to casualty effect ratio {1 Million $/person}
Cost Data
mbw=maximum bio watch cost {$10 Million}
mcvr = maximum cost for vaccine reserve {$10 Million}
vrcfv = vaccine reserve cost factor
mcd = maximum cost to deploy 100% of vaccine A {$10 Million}
mb = maximum budget (U.S.) {$30 Million or variable}
cbp = cost greater than budget penalty = 1
Equations
Casualty Equations
wtaw = warning time factor (U.S.)
if 0 then 1, otherwise 1
, ,
,
Economic Impact Equations
mcat = maximum casualties given an attack
pcatc = potential casualties given attack
drfvd = deploy reserve factor
x1 = U.S. casualties due to bioterrorism attack given response
25

Submitted to Risk Analysis, Journal of the Society for Risk Analysis, February 20, 2009
mei = maximum economic impact
x2 = U.S. economic effects due to a bioterrorism attack
Cost Equations
bwcw = bio watch cost (U.S.)
if 0, then 0, otherwise
if agent1 hen if .1 then 1, otherwise otherwise
1
avd = deploy vaccine cost (U.S.)
, otherwise 0
ostawvd = U.S. cost to prepare and mitigate a potential bioterrorism attack
ecision Variables
vrcv = vaccine reserve cost (U.S.)
drcfav = deploy reserve cost factor
cd
if 1 then
c
D
ion (U.S.)
.S.)
rrorist)
bw = bio watch decis
rv = vaccine reserve decision (U
agenta = agent selection decision (Te
popdt = target population decision (Terrorist)
drd = deploy reserve decision (U.S.)
26

Submitted to Risk Analysis, Journal of the Society for Risk Analysis, February 20, 2009
Objectives
function for U.S. casualties due to bioterrorism attack r1(x1) = risk
r
r2(x2) = risk function for U.S. economic effects due to a bioterrorism attack r
) = Risk to he United States
x) = if costawvd≤ mb then ∑ , else cbp
mi max · max min
7. REFERENCES
sis in Engineering and Economics. Chapman and Hall/CRC.
2.
Research, 2005; 102-123. nd how to
4. eration and
5. re and nagement Workshop, ESTEC, March 30-
6. ogical Improvements to the Department of Homeland Security’s
r(x t r( n min
1. Ayyub, B., 2003. Risk Analy
Brown, G. and Rosenthal, R. Optimization Tradecraft: Hard-Won Insights from Real-World Decision Support, Interfaces September-October 2008; 38(5):356-366.
3. Brown G., Carlyle W., Salmeron J., Wood K. Analyzing the Vulnerability of Critical Infrastructure to Attack and Planning Defenses. Tutorials in Operations (introduces and write about the attacker defender model and defender attacker model asolve them. Gives some examples of uses of each and how to set them up.) Commission on the Prevention of Weapons of Mass Destruction Proliferation and Terrorism.
orld at Risk: Report of the Commission on the Prevention of WMD ProlifWTerrorism. New York, NY: Vintage Books, 2008.
Davison M, and Vantine, W. Understanding Risk Management: A Review of the LiteratuIndustry Practice. European Space Agency Risk MaApril 2 1998; 253-256.
Department of Homeland Security's Bioterrorism Risk Assessment: A Call for Change, Committee on MethodolBiological Agent Risk Analysis, National Research Council of the National Academies. Washington, DC: The National Academy Press, 2008.
27

Submitted to Risk Analysis, Journal of the Society for Risk Analysis, February 20, 2009
Frank, M. A Survey of Risk Assessment Methods from7. the Nuclear, Chemical, and Aerospace
dustries for Applicability to the Privatized Vitrification of Hanford Tank Wastes. Report to the
8. plays with dice - terrorists do not: Allocating resources to counter strategic versus probabilistic
9. Sons, Inc.
10. and Kumamoto, H., 1996. 2nd Ed, Probabilistic Risk Assessment: Reliability Engineering, Design, and Analysis, New York: IEEE Press.
11. cision Analysis with Spreadsheets. elmont, CA: Duxbury Press, 1997.
12. (2005), “Insuring (Mega)-Terrorism: Challenges and erspectives”, in OECD, Terrorism Risk Insurance in OECD Countries, July (modified first two
13. . Project BioShield: Protecting Americans from Terrorism. FDA Consumer agazine, November-December 2004. Available at:
9.
14. lysis, ashington D.C.: Division of Safety Issue Resolution. Office of Nuclear Regulatory Research,
15. Bresnick, T. A. Integrating Risk Management with , Chapter 10 in
aw-
16. l E., Guikema S. Probabilistic Modeling of Terrorist Threats: A Systems Analysis pproach to Setting Priorities Among Countermeasures. Military Operations Research, 2002;
17. le at: http://www.sra.org/
InNuclear Regulatory Commission, August, 1998.
Golany, Boaz & Kaplan, Edward H. & Marmur, Abraham & Rothblum, Uriel G., 2009. "Nature
risks," European Journal of Operational Research, Elsevier, vol. 192(1), pages 198-208, January.
Haimes, Y., 2004. Risk Modeling, Assessment, and Management. Hoboken, NJ: John Wiley and
Henley, E.
Kirkwood, C. Strategic Decision Making: Multiobjective DeB Kunreuther, H. and Michel-Kerjan, EPcolumns). Meadows MMhttp://www.fda.gov/fdac/features/2004/604_terror.html, Accessed on January 30, 200 Mosleh, A. Procedure For Analysis Of Common-Cause Failures In Probabilistic Safety AnaWNuclear Regulatory Commission, 1993.
Parnell, G. S., Dillon-Merrill, R. L., and Homeland Security and Antiterrorism Resource Allocation Decision-MakingKamien D. (ed). The McGraw- Hill Handbook of Homeland Security. New York, NY: McGrHill, 2005. Pate-CornelA7(4): 5-23. (creates model for setting priorities among threats and countermeasures, suggests framework for reasoning it provides; shows influence diagrams in terrorist behavior and U.S. decisions, probabilistic and game theory) Society for Risk Analysis website. Availab . Accessed on February 3,
009.
18. ., Lister S. The Bio Watch Program: Detection of Bioterrorism. Congressional Research Service Report No. RL 32152, November 19, 2003.
19. copationsoftware.com/
2
Shea D
Syncopation Software. Available at: http://www.syn , Accessed on January 30, 2009.
28

Submitted to Risk Analysis, Journal of the Society for Risk Analysis, February 20, 2009
29
20. The White House. Homeland Security Presidential Directive 10 [HSPD-10]: Biodefense for the
21. he White House. Homeland Security Presidential Directive 18 [HSPD-18]: Medical
.
22. U.S. Center for Disease Control (CDC). Listing of Biological Agents A-Z. Available at:
23. .S. Center for Disease Control (CDC). Bioterroris Agents/Diseases Definitions by category.
24. U.S. Department of Homeland Security. Bioterrorism Risk Assessment (BTRA). Biological
nter.
25. .S. Nuclear Regulatory Commission (USNRC). Reactor Safety Study: Assessment of Accident
26. U.S. Nuclear Regulatory Commission (USNRC). PRA Procedures Guide, NUREG/CR-2300.
27. U.S. Nuclear Regulatory Commission (USNRC). Procedural and Submittal Guidance for the .
28. U.S. Nuclear Regulatory Commission (USNRC). A Technique For Human Error Analysis ry
29. Vesely, W.E.. Fault Tree Handbook. Washington D.C.: Office of Nuclear Regulatory Research,
30. Willis H. Guiding Resource Allocations Based on Terrorism Risk. Working paper for RAND.
31. ative Responses to Risks of Terrorism. Risk
21st Century, 2004. Available at http://www.fas.org/irp/offdocs/nspd/hspd-10.html, Accessed onJanuary 30, 2009. TCountermeasures Against Weapons of Mass Destruction. 2007. Available at http://www.fas.org/irp/offdocs/nspd/hspd-18.html, Accessed January 30, 2009
http://www.bt.cdc.gov/agent/agentlist.asp, Accessed on January 30, 2009. UAvailable at: http://www.bt.cdc.gov/agent/agentlist‐category.asp, Accessed on February 10, 2009.
Threat Characterization Center of the National Biodefense Analysis and Countermeasures CeFort Detrick, Md, 2006. URisk in U.S. Commercial Nuclear Plants. WASH-1400 (NUREG-75/014). Washington, D.C.: U.S. Nuclear Regulatory Commission, 1975.
Washington D.C.: U.S. Nuclear Regulatory Commission, 1983.
Individual Plant Examination of External Events (IPEEE) for Severe Accident VulnerabilitiesFinal Report, Washington, D.C, 1991.
(Atheana). Washington, D.C.: Division of Systems Technology. Office of Nuclear RegulatoResearch, 1996.
1981.
WR-371-ISE. March 2006.
Wulf, W., Haimes Y., Longstaff T. Strategic AlternAnalysis, 2003; 23:429-444.