Intellectual capital efficiency and economic value added ...
12
www.idosr.org Akpan and Otung 58 IDOSR JOURNAL OF HUMANITIES AND SOCIAL SCIENCES 5(1): 58-69, 2020. ©IDOSR PUBLICATIONS International Digital Organization for Scientific Research ISSN: 2550-7966 IDOSR JOURNAL OF HUMANITIES AND SOCIAL SCIENCES 5(1): 58-69, 2020. Intellectual capital efficiency and economic value added: The Nigerian banking industry perspective Akpan Dorathy Christopher and Otung Affiong Ukana Department of Accounting AkwaIbom State University, Obio Akpa Campus Nigeria Email: [email protected] , [email protected] ABSTRACT This study investigates the effect of intellectual capital on economic value added of listed banks in Nigeria. The data for the data were secondary derived from the annual reports of these banks and Nigeria Stock Exchange fact books. The research design adopted is e xpo facto research and the study covered a period of four years from 2015 to 2018. The sample size of 12 banks is selected using Cochran model. Intellectual capital is measured using Value Added Intellectual Coeffiecient (VAIC) developed by Pulic. Data areanalyzed using descriptive statistics and ordinary least square regression technique. The results obtained show that human capital efficiency, structural capital efficiency and capital employed efficiency significantly influence economic value added of listed banks in Nigeria. The study therefore concludes that IC efficiency is positively associated with economic value added of banks in Nigeria. Thus, this study recommends that the apex bank and other regulatory agencies should strengthen the enforcement of policies and measures that will promote intellectual capital development, as this will in turn enhance economic value added of these banks. keywords: Intellectual capital, economic value added, human capital efficiency, structural capital efficiency, capital employed efficiency INTRODUCTION The importance of intellectual capital (IC) as a vital instrument for determining corporate values cannot be under- estimated. Currently, economies of the world are shifting towards knowledge- oriented economy in which companies‟ competitiveness and sustainability are increasingly dependent on intellectual capital. The advent of the knowledge economy combinedwith globalization, market liberalization and increased competition has pushed many firms to invest in innovation and in value creation activities, such as research and development, manpower training, new technology acquisition or advertisement, in order to sustain their leadership in the market. However, these major value creating resources are most at times not given preeminence in the financial statement because of stringent recognition criteria imposed by the international financial reporting standards on intangible assets. Given the role of value creation by intellectual capital and the relative lack of accounting recognition, the financial statement lost some of their values for shareholders and other stakeholders alike. Intellectual resources are important strategic asset of the company and as such should be communicated to the stakeholders. Intellectual capital has been seen as an indispensable resource particularly in environments where the source of competitive advantage is strongly based on knowledge and intangible resource. Knowledge and information are considered most influential element in value creation of the company. In this wise, corporate performance does not only depend on tangible asset but also
Transcript of Intellectual capital efficiency and economic value added ...
www.idosr.org Akpan and Otung
58
IDOSR JOURNAL OF HUMANITIES AND SOCIAL SCIENCES 5(1): 58-69, 2020.
©IDOSR PUBLICATIONS
International Digital Organization for Scientific Research ISSN: 2550-7966
IDOSR JOURNAL OF HUMANITIES AND SOCIAL SCIENCES 5(1): 58-69, 2020.
Intellectual capital efficiency and economic value added: The Nigerian
banking industry perspective
Akpan Dorathy Christopher and Otung Affiong Ukana
Department of Accounting AkwaIbom State University, Obio Akpa Campus Nigeria
Email: [email protected], [email protected]
ABSTRACT
This study investigates the effect of intellectual capital on economic value added of listed
banks in Nigeria. The data for the data were secondary derived from the annual reports of
these banks and Nigeria Stock Exchange fact books. The research design adopted is expo
facto research and the study covered a period of four years from 2015 to 2018. The
sample size of 12 banks is selected using Cochran model. Intellectual capital is measured
using Value Added Intellectual Coeffiecient (VAIC) developed by Pulic. Data areanalyzed
using descriptive statistics and ordinary least square regression technique. The results
obtained show that human capital efficiency, structural capital efficiency and capital
employed efficiency significantly influence economic value added of listed banks in
Nigeria. The study therefore concludes that IC efficiency is positively associated with
economic value added of banks in Nigeria. Thus, this study recommends that the apex bank
and other regulatory agencies should strengthen the enforcement of policies and measures
that will promote intellectual capital development, as this will in turn enhance economic
value added of these banks.
keywords: Intellectual capital, economic value added, human capital efficiency, structural
capital efficiency, capital employed efficiency
INTRODUCTION
The importance of intellectual capital (IC)
as a vital instrument for determining
corporate values cannot be under-
estimated. Currently, economies of the
world are shifting towards knowledge-
oriented economy in which companies‟
competitiveness and sustainability are
increasingly dependent on intellectual
capital. The advent of the knowledge
economy combinedwith globalization,
market liberalization and increased
competition has pushed many firms to
invest in innovation and in value creation
activities, such as research and
development, manpower training, new
technology acquisition or advertisement,
in order to sustain their leadership in the
market. However, these major value
creating resources are most at times not
given preeminence in the financial
statement because of stringent
recognition criteria imposed by the
international financial reporting
standards on intangible assets. Given the
role of value creation by intellectual
capital and the relative lack of accounting
recognition, the financial statement lost
some of their values for shareholders and
other stakeholders alike. Intellectual
resources are important strategic asset of
the company and as such should be
communicated to the stakeholders.
Intellectual capital has been seen as an
indispensable resource particularly in
environments where the source of
competitive advantage is strongly based
on knowledge and intangible resource.
Knowledge and information are
considered most influential element in
value creation of the company. In this
wise, corporate performance does not
only depend on tangible asset but also

www.idosr.org Akpan and Otung
59
IDOSR JOURNAL OF HUMANITIES AND SOCIAL SCIENCES 5(1): 58-69, 2020.
intangible asset which intellectual capital
is a major component. A study made by
[1] shows that companies‟ tangible assets
can represent 20% of market value and
the remaining 80% is intangible asset.
Hence the market and economic value of a
firm is highly influenced by the
information relating to intellectual
capital. In addition company's
competitive position to a greater extent is
dependent on the strategic management
of intellectual capital. Negligence in this
context can cause irreparable damages on
the procedure of capital market indices,
because intellectual capital is shaping
economic environment in the countries.
The goal of all companies is to create
value for the shareholders. In addition, [2]
states that, when long-term EVA is
maximized, the company will be
maximizing its own value. EVA can be
used to set goals, evaluate performance,
determine bonuses, communicate with
investors and budget for capital
expenditure. In today‟ knowledge oriented
economy, it is quite necessary for
companies to seek, generate, manage,
develop and exploit IC optimally to
create economic value added and improve
corporate performance and as such
enhance shareholders‟ value. There are
numerous prior studies related to
intellectual capital and even have similar
variables, but the empirical results are
varying. More so, none of these
researches studied the effect of IC on
economic value added of companies,
though other related performance
measures are used. Also most of the
researches on intellectual capital are done
in more developed economies with
sophisticated capital structure and
different legal frameworks, hence, the
need for such research in Nigeria. Thus
this research studies the effect of IC on
EVA using Value added Intellectual
Coefficient (VAIC) as a measure of
intellectual capital.
LITERATURE REVIEW
Intellectual capital
[3] define IC as intellectual material that
has been formalized, captured and
leveraged to produce a higher order asset.
IC has also been defined in financial
terms to mean the difference between
market value and the shareholders capital
[4]. This can be supported by the fact that
firms in the past have been acquired for
amounts far in excess of market
capitalization. [5] defines IC as
comprising all immaterial resources that
could be considered as assets with some
kind of assignable capitalized value. All
the above definitions have a convergence
in the sense that they refer to assets that
are important to the company but are not
captured by the traditional accounting
methods or techniques. They are
therefore the total sum of “hidden assets”
of an entity and these assets are not
physical.). One of the most workable
definitions however is that offered by the
Organization for Economic Co-operation
and Development (OECD) (1999) which
describes IC as “the economic value of
two categories of intangible assets of a
company: organizational capital; and
human capital.
In this study intellectual capital is
measured using Pulic model. Intellectual
capital according to him is measured
using value added which is created by
human capital, structural capital and
physical capital (capital employed). The
combination of these three values is
symbolized by the name Value Added
Intellectual Coefficient (VAIC) developed
by [6]. The efficiency levels to be
calculated in this model are human
capital efficiency (HCE), structural capital
efficiency (SCE) and capital employed
efficiency (CEE). VAIC is considered as a
“universal indicator showing abilities of a
company in value creation and
representing a measure for business
Efficiency in a knowledge-based
economy” [7]. According to [8] the purest
measure to produce economic value in a
knowledge-based company is the value
added per individual‟s contribution. As
suggested by [9], this monetary
measuring system could be useful in
providing objective information to
stakeholders about company‟s real value
www.idosr.org Akpan and Otung
60
IDOSR JOURNAL OF HUMANITIES AND SOCIAL SCIENCES 5(1): 58-69, 2020.
and performance. In addition, it allows
comparison and future predictability in
respect of the companies‟ Intellectual
Capital performance [10].
Components of intellectual capital
efficiency
Human capital refers to knowledge, skills
and experiences that employees take
them with themselves when they leave
the organization. The contributions of the
Human Capital of an organization is very
important because it‟s the skills,
competency and knowledge possessed by
the Human Capital, and the efficient
management of such, that will determine
how other resources of the organization
will be utilized to achieve organizational
goals and objectives. Therefore, the
human element is very crucial in
determining corporate performance. [11]
defined Human Capital “as employee‟s
competence in creating both tangible and
intangible assets by contributing in the
continuous generation of knowledge and
ideas”. Human capital efficiency (HCE) is
one of the three components of value
added intellectual coefficients as
postulated by [12]. Human capital
efficiency measures the value added by
the human resources of an organization.
Human capital efficiency iscomputed as
the ratio of value added (specifically by
the human assets) to human costs (which
indicates personnel expenses salaries and
benefits for company).
Structural capital efficiency
Structural capital includes all non-human
resources of knowledge in the
organization which consists of databases,
organizational charts, procedures and
administrative processes, strategies and
generally consist of everything that create
higher value for the organization rather
than its physical aspect. Structural capital
is computed as the difference between
value added and human capital while
human capital efficiency is calculated as
the ratio between structural capital and
value added
Capital Employed Efficiency (CEE)
This is the third component of value
added intellectual coefficient. Capital
employed is the tangible assets parts of
capital and contain both physical and
financial assets. The physical parts
represent fixed and raw materials, while
the financial part includes other existing
assets after employees leave. According
to [13], CE refers to physical and financial
capital like book value of net assets. in
this study capital employed is the
difference between total assets and
intangible assets while CEE is calculated
as the ratio of value added to capital
employed.
Economic value added (EVA)
The concept of EVA was propounded by
Stewart & Co at the beginning of the
1990s. It is an estimate of a firm's
economic profit – being the value created
in excess of the required return of the
company's investors (being shareholders
and debt holders). It is the performance
measure most straightforwardly
connected to the creation of shareholders
wealth over time [14]. The methodology
is “the one measure that properly
accounts for all the complex trade-offs
involved in creating value” and therefore,
“the right measure to use for setting
goals, evaluating performance,
determining bonuses, communicating
with investors, and for capital budgeting
and valuations of all sorts” [15].
Nonetheless, EVA is different from other
traditional performance measuring tools
because most measures mostly depend on
accounting information. The problem
with these kinds of tools is that
accounting earnings fail to measure
changes in the economic value of the
firm, and some of the reasons which
according to [16] is that the link between
economic profit and shareholder value is
transparent unlike accounting profit. With
time value of money taken into account,
the net present value of the firm is equal
to the discounted stream of expected
economic value added generated by its
current and future assets. Resource based
theory of the firm support intellectual
capital framework and it directly
corresponds to the logic behind the
economic value added as a performance
measure.

www.idosr.org Akpan and Otung
61
IDOSR JOURNAL OF HUMANITIES AND SOCIAL SCIENCES 5(1): 58-69, 2020.
THEORETICAL FRAMEWORK
Human capital theory and resourced
based view theory are the two major
theories supporting this work. The human
capital theory is attributed to [17]. The
significance of the human capital theory
is that it regards people as assets and
stresses that investment by organizations
in people will generate worthwhile
returns. It proposes that sustainable
competitive advantage is attained when
the firm has a human resource pool that
cannot be imitated or substituted by its
rivals [18]. The concept views workers as
key resource managers used to achieve
competitive advantage for their
companies. The resource based view
theory is traced to [19]. Resource - based
view gained attention of strategic thinkers
only after the contribution by prominent
authors such as [20]. This theory links a
firm‟s internal capability (what it does
best) to its external industry environment
(what market demands and what
competitors offer).Capabilities have
proven more difficult to delineate and are
often termed as intangible assets [21] or
intermediate goods.
Empirical framework
[22] studied the impact of IC on
organizational performance in British
firms. They employed multiple linear
regression, a quantitative method, to
analyze the data collected from 300 UK
companies publicly listed on London
Stock Exchange (LSE) and available in the
“Value Added Scoreboard” database. The
sample was selected mostly from the
following industries: high-tech, services,
and traditional manufacturing. The
researchers measured Intellectual Capital
using the VAIC model. It was also found
that RCE had a significant positive effect
on the market value (β = 0.550; p < 0.05),
but the aggregated HCE-SCE did not.
Based on the findings, the study
concluded that IC has a significant
positive impact on firm performance
[23] investigated the rapport amid
intellectual capital and performance
pointers of firms. The statistical methods
used were correlation analysis and
regression pooled least squares by SPSS
23 software. The outcomes presented that
there is an expressive association amid
intellectual capital and Return Stock,
Tobin's Q and market to booking value
(MTB). [24] examined the relationship
between IC and organizational
performance in two Indian industries: the
pharmaceutical and the textile. The
authors employed the VAIC model to
measure IC and its efficiency indicators:
HCE, SCE, and RCE, ATO for productivity
and market value for stock performance
as the indicators of business
performance. The results showed that IC
did not significantly affect either ATO or
market value of either industry. Based on
the findings of the insignificant effect of
IC on both the productivity and stock
performance in both the industries, the
authors provided an explanation that
Indian firms, like those in other emerging
economies, still mainly focused on
making short-term profits.
[25] empirically assess the impact of IC
and its components on corporate
performance in Romanian firms. The
author collected data by accessing the
yearly reports of 72 corporations publicly
listed on Bucharest Stock Exchange.
Morariu employed the VAIC model to
measure IC and its efficiency indicators:
HCE, SCE, and CEE. The researcher also
chose ROE, ATO, and market value as the
indicators of business performance. The
results revealed that IC,does not have
effect on any of the performance
indicators. Similarly, there was no
significant positive relationship between
any IC efficiency element (HCE, SCE, CEE)
and any business performance indicator.
[26] examined the relationship between IC
and business performance in the Indian
textile sector. To collect data for the
research, the authors accessed the annual
reports of 100 textile firms publicly listed
in both the Indian stock exchanges: NSE
(National Stock Exchange) and BSE
(Bombay Stock Exchange). [27] employed
the VAIC method to amount IC and its
efficiency indicators: HCE, SCE, and RCE.
The results indicated that IC, represented
by VAIC, had a significant positive impact

www.idosr.org Akpan and Otung
62
IDOSR JOURNAL OF HUMANITIES AND SOCIAL SCIENCES 5(1): 58-69, 2020.
on ROA (FEM: β = 0.013; p < 0.01; REM: β =
0.012; p < 0.01). As per the findings, IC
had a significant positive influence on
profitability (represent by ROA), but it did
not have any significant role in impacting
either productivity (represented by ATO)
or market performance (represented by
the market value) in Indian textile
companies. [28] analyzed the relationship
between IC and business performance in
the oil and gas industry of Pakistan. The
authors accessed the annual reports of
the firms publicly listed on Karachi Stock
Exchange and collected data for a total of
78 observations. The study used the VAIC
model to measure IC and its efficiency
elements (HCE, SCE, and RCE). The results
showed that IC had a significant positive
impact on market value (β = 0.248; p <
0.05). The significant positive impact of
IC on the market value could suggest that
knowledge resources potentially create
great long-term value for these
companies.
[28] examined the relationship between
intellectual capital accounting and
business performance. The study focused
on pharmaceutical firms in Kenya.
Primary data were therefore collected
from 31 pharmaceutical companies. The
results showed that intellectual capital
accounting had positive relationship with
business performance.
From these reviews, it could be observed
that most of this studies are done in
developed countries as well as emerging
economies such as India. Studies
conducted in Africa in general and Nigeria
in particular are scanty and this paucity
of local studies form a contextual
knowledge gap, thus this study was
instigated as a result of this gap.
METHODOLOGY
The research design used in this study
was ex post facto research design. This
research design was adopted because the
data used was historical data generated
from annual reports and accounts of
these banks as well as Nigerian Stock
Exchange fact book. The secondary data
covered a study period of four (4) years
i.e. 2015 to 2018. The population of this
study comprised all listed commercial
banks on the Nigerian Stock Exchange as
at 2018 financial year and currently, there
are 13 listed commercial banks. The
sample size of this study was ascertained
using Cochran model;
n=12
A simple random sampling technique was
adopted to select the 12 banks and this
technique
was chosen because all the banks have
equal chance of being selected.
Descriptive statistics, correlation analysis
and ordinary least square regression
technique were the analytical techniques
used and SPSS version 23 was the
statistical software used.
3.1 Model specification
The model used in this work is specified
below:
EVA = f (intellectual capital efficiency)
EVA = ao
+ d1
HCEit
+d2
SCEit
+d3
CEEit
+eo
where;
ao
= constant
EVA = Economic value added
HCE = Human capital efficiency
SCE = Structural capital efficiency
CEE = Capitalemployed efficiency
d1
-d3
= unknown coefficient of variables.
it is expected that d1
-d3
<0
eo
= stochastic error.
EVA is derived mathematically thus;
EVA = PAT – (capital employed x WACC).
Capital employed is the sum of equity and
and non-current liabilities and WACC is
weighted average cost of capital. This is
given as
WACC = MVe x Ke + MVd x Kd
MVtotalMVtotal
where,
MVe = market value of equity
Ke = cost of equity = d/Mve
Kd = cost of debt = i(1-t)/Mvd
Mvd = market value of debt
Mv total = total market value of both
debt and equity
i = interest rate
t = tax rate
1 = one (constant)

www.idosr.org Akpan and Otung
63
IDOSR JOURNAL OF HUMANITIES AND SOCIAL SCIENCES 5(1): 58-69, 2020.
Component of Intellectual capital is
derived using value added intellectual
coefficient (VAIC). VAIC is the sum of
human capital efficiency, structural
capital efficiency and capital employed
efficiency.
VAIC = HCE+SCE+CEE
HCE = VA/HC
SCE = SC/VA
CEE = VA/CE
Where,
VA = Value Added = OP+EC+D+A
HC = total payroll cost
OP = operating profit
EC = payroll cost
D = depreciation
A = amortization
CE = capital employed (total
assets –intangible assets)
SC = VA-HC
DATA PRESENTATION
Table 1: Economic value added and intellectual capital components of listed Nigerian
banks for 2015 financial year
Bank Eva (N/m) HCE SCE CEE
Access 237367 23.73 13.05 20.11
Ecobank 380596 83.18 49.87 40.61
Firstbank 334815 36.32 9.64 22.31
FCMB 77140 8.94 18.42 43.86
Fidelity 2419543 12.61 17.22 32.16
GTB 9570223 12.39 12.51 30.12
Stanbic IBTC 712578 24.16 20.13 21.32
Sterling 187352 13.65 21.99 49.42
Union 1153295 20.16 11.81 28.12
UBA 271629 42.75 10.27 16.12
Zenith 194649 11.12 21.31 18.22
Wema 243982 22.35 12.37 13.22
Source: Annual report and account of the selected banks (2016)
Table 2: Economic value added and intellectual capital components of listed Nigerian
banks for 2016 financial year
Bank Eva (N/m) HCE SCE CEE
Access 792496 12.10 11.65 28.28
Ecobank 283967 70.30 51.99 42.02
Firstbank 288149 26.49 9.43 30.26
FCMB 530389 5.19 36.18 42.21
Fidelity 1042578 12.45 12.83 30.21
GTB 2015886 12.24 22.71 28.61
Stanbic IBTC 334746 24.46 20.48 32.61
Sterling 16223 12.84 98.14 51.81
Union 296403 24.11 14.92 30.51
UBA 168987 17.85 24.22 31.11
Zenith 265274 13.21 24.22 21.11
Wema 305345 27.35 21.22 21.21
Source: Annual report and account of the selected banks (2016)
www.idosr.org Akpan and Otung
64
IDOSR JOURNAL OF HUMANITIES AND SOCIAL SCIENCES 5(1): 58-69, 2020.
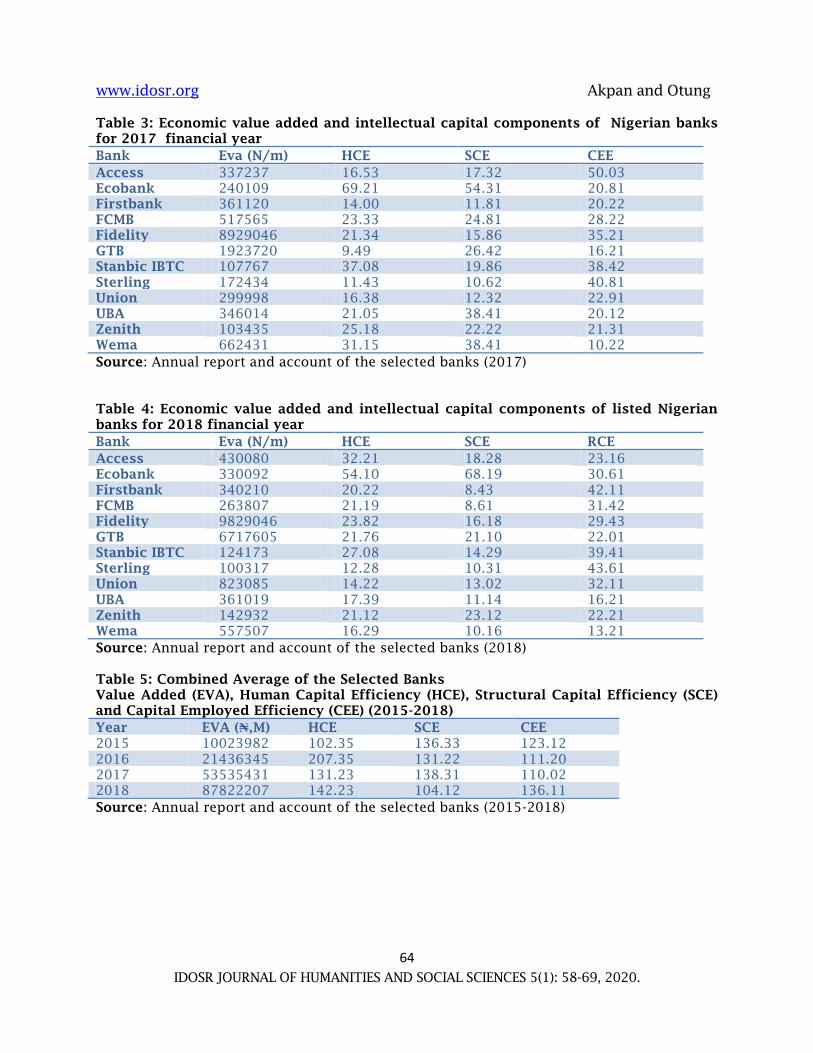
Table 3: Economic value added and intellectual capital components of Nigerian banks
for 2017 financial year
Bank Eva (N/m) HCE SCE CEE
Access 337237 16.53 17.32 50.03
Ecobank 240109 69.21 54.31 20.81
Firstbank 361120 14.00 11.81 20.22
FCMB 517565 23.33 24.81 28.22
Fidelity 8929046 21.34 15.86 35.21
GTB 1923720 9.49 26.42 16.21
Stanbic IBTC 107767 37.08 19.86 38.42
Sterling 172434 11.43 10.62 40.81
Union 299998 16.38 12.32 22.91
UBA 346014 21.05 38.41 20.12
Zenith 103435 25.18 22.22 21.31
Wema 662431 31.15 38.41 10.22
Source: Annual report and account of the selected banks (2017)
Table 4: Economic value added and intellectual capital components of listed Nigerian
banks for 2018 financial year
Bank Eva (N/m) HCE SCE RCE
Access 430080 32.21 18.28 23.16
Ecobank 330092 54.10 68.19 30.61
Firstbank 340210 20.22 8.43 42.11
FCMB 263807 21.19 8.61 31.42
Fidelity 9829046 23.82 16.18 29.43
GTB 6717605 21.76 21.10 22.01
Stanbic IBTC 124173 27.08 14.29 39.41
Sterling 100317 12.28 10.31 43.61
Union 823085 14.22 13.02 32.11
UBA 361019 17.39 11.14 16.21
Zenith 142932 21.12 23.12 22.21
Wema 557507 16.29 10.16 13.21
Source: Annual report and account of the selected banks (2018)
Table 5: Combined Average of the Selected Banks
Value Added (EVA), Human Capital Efficiency (HCE), Structural Capital Efficiency (SCE)
and Capital Employed Efficiency (CEE) (2015-2018)
Year EVA (₦,M) HCE SCE CEE
2015 10023982 102.35 136.33 123.12
2016 21436345 207.35 131.22 111.20
2017 53535431 131.23 138.31 110.02
2018 87822207 142.23 104.12 136.11
Source: Annual report and account of the selected banks (2015-2018)
www.idosr.org Akpan and Otung
65
IDOSR JOURNAL OF HUMANITIES AND SOCIAL SCIENCES 5(1): 58-69, 2020.
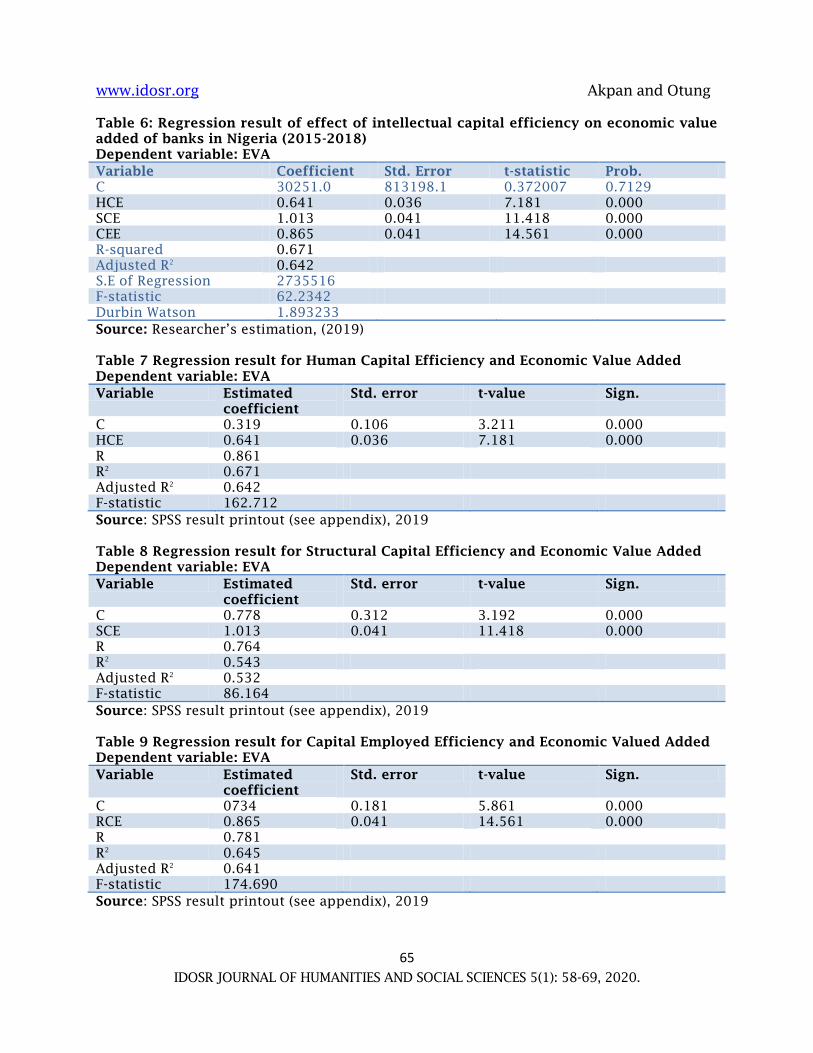
Table 6: Regression result of effect of intellectual capital efficiency on economic value
added of banks in Nigeria (2015-2018)
Dependent variable: EVA
Variable Coefficient Std. Error t-statistic Prob.
C 30251.0 813198.1 0.372007 0.7129
HCE 0.641 0.036 7.181 0.000
SCE 1.013 0.041 11.418 0.000
CEE 0.865 0.041 14.561 0.000
R-squared 0.671
Adjusted R2
0.642
S.E of Regression 2735516
F-statistic 62.2342
Durbin Watson 1.893233
Source: Researcher‟s estimation, (2019)
Table 7 Regression result for Human Capital Efficiency and Economic Value Added
Dependent variable: EVA
Variable Estimated
coefficient
Std. error t-value Sign.
C 0.319 0.106 3.211 0.000
HCE 0.641 0.036 7.181 0.000
R 0.861
R2
0.671
Adjusted R2
0.642
F-statistic 162.712
Source: SPSS result printout (see appendix), 2019
Table 8 Regression result for Structural Capital Efficiency and Economic Value Added
Dependent variable: EVA
Variable Estimated
coefficient
Std. error t-value Sign.
C 0.778 0.312 3.192 0.000
SCE 1.013 0.041 11.418 0.000
R 0.764
R2
0.543
Adjusted R2
0.532
F-statistic 86.164
Source: SPSS result printout (see appendix), 2019
Table 9 Regression result for Capital Employed Efficiency and Economic Valued Added
Dependent variable: EVA
Variable Estimated
coefficient
Std. error t-value Sign.
C 0734 0.181 5.861 0.000
RCE 0.865 0.041 14.561 0.000
R 0.781
R2
0.645
Adjusted R2
0.641
F-statistic 174.690
Source: SPSS result printout (see appendix), 2019

www.idosr.org Akpan and Otung
66
IDOSR JOURNAL OF HUMANITIES AND SOCIAL SCIENCES 5(1): 58-69, 2020.
ANALYSIS OF DATA
Tables 1-4 show the economic value
added, human capital efficiency,
structural capital efficiency, and capital
employed efficiency of the studied banks.
These tables show the priorities these
banks give to their intellectual capital
efficiency components and the calculated
EVA of these banks. Table 5 shows the
combined average of the selected banks
from 2015 to 2018 and this reveals that
banks in Nigeria have a positive human
resource policy and ensure that workers
are treated fairly, and it has led to
increase economic value added of the
selected banks.
The results obtained show that all
explanatory variables have their correct
expected sign, which comply with the
aprior expectation. The positive sign of
the co-efficient of human capital
efficiency shows that there is a positive
relationship between human capital
efficiency and economic value added of
the selected banks [29] [30]. This is
consistent with the theoretical
expectation showing that a 1billion naira
increase in HCE will lead to an increase in
EVA by 0.641billion naira, other things
being equal.Similarly, the positive
coefficient of structural capital efficiency
shows that there is a positive relationship
between SCE and economic value added of
the selected banks. The result is in line
with theoretical expectation, showing that
an increase in structural capital efficiency
will lead to an increase in EVA by
1.013billion naira. The examination of the
result showed that there is a positive
relationship between capitalemployed
efficiency (CEE) and EVA..
From the result obtained, three variables
(human capital efficiency, structural
capital efficiency,capital employed
efficiency) are statistically significant.
This is seen in their t-statistic values
calculated of 7.181, 11.418 and 14.516
respectively for human capital efficiency,
structural capital efficiency, and capital
employed efficiency and they are all l
greater than the critical value of 4.303 at
5 percent level of significance. This
results means that these three variables
are significant in causing short-run
changes in economic value added (EVA) of
the selected banks in Nigeria. Adjusted R-
squared of 0.642 shows that about 64.2%
of the total variations in the dependent
variable are explained by variations in the
independent variables. The remaining
35.8% left unexplained is attributed to
variation in other factors not captured in
the model but represented by the
disturbance term. The high value of the R-
squared shows that the estimated model
has a better goodness of fit.
The f-statistic value of 62.234 shows that
the overall model is statistically
significant at 5 percent level of
significance. This means that the
independent variables collectively have
significant effect on EVA of the selected
banks in Nigeria. The result confirms the
existence of linear relationship between
the dependent variable and the
independent variables in the model.
Table 7 present data for test of
hypothesis one. The result reveals that
calculated t-value of 7.181 is greater than
t-table value of 4.303 when tested at 0.05
level of significance. Thus the null
hypothesis was rejected meaning that
human capital efficiency significantly
affects economic valued added (EVA) of
listed banks in Nigeria. Also, from this
table, it is observed that the estimated
coefficient for EVA is also positive which
is consistent with economic theory. That
is, there is a positive relationship between
human capital efficiency and economic
value added.
Table 8 reveals the relationship between
structural capital efficiency and economic
value added of listed banks in Nigeria.
From the analysis of hypothesis two, the
result reveals that the calculated t-value
of (11.418) is greater than the critical t-
table value of (4.303) when tested at 0.05
level of significance. The adjusted R2
value
of 53.2% means that 53.2 percent of the
variation‟ in EVA is explained by the
explanatory variable, while the remaining
46.8% is accounted by factors which are
not captured in the model. Therefore, the
null hypothesis was rejected, while the

www.idosr.org Akpan and Otung
67
IDOSR JOURNAL OF HUMANITIES AND SOCIAL SCIENCES 5(1): 58-69, 2020.
alternative hypothesis was accepted. This
means that structural capital efficiency
significantly affects economic valued
added (EVA) of listed banks in Nigeria.
Table 9 shows the relationship between
capital employed efficiency and Economic
value added of banks in Nigeria. The
analysis of hypothesis three reveals that
the calculated t-value of 14.561 is greater
than the table value of 1.980 when tested
at 0.05 level of significance. The Adjusted
R2
of 0.645 indicates that64.5% of
variation in EVA is caused by capital
employed efficiency while the remaining
35.5% is caused by factors not captured in
the model.Thus, the null hypothesis was
rejected, while the alternative hypothesis
was accepted. This means that capital
employed efficiency significantly affects
economic valued added (EVA) of listed
banks in Nigeria.
SUMMARY AND CONCLUSION
The study examines the effect of
intellectual capital efficiency on economic
value added as a measure of
organizational performance of listed
banks in Nigeria. The findings from the
study reveals that human capital
efficiency, structural capital efficiency
and capital employed efficiency have
significant effect on economic value
added of the selected banks in Nigeria.
They study therefore concludes that
intellectual capital efficiency has
significant positive effect on the
economic value added of listed banks in
Nigeria. Based on this, the study
recommends that management of banks
in Nigeria should invest in human capital
in order to enjoy increase in their
economic value added. In addition to this,
the study also recommends that the apex
bankand other regulatory agencies should
strengthen the enforcement of policies
and measures that will promote
intellectual capital development, as this
will in turn enhance economic value
added of these banks.
REFERENCES
1. Abdomohamadi,T. F. Greenlay&
Poole, (2001). Impact of accounting
standards on financial reporting in
Nigeria‖, Unpublished Ph.D Thesis,
University of Lagos.
2. Al-Dujaili, G.H. (2012). The
relationship between intellectual
capitals and financial performance:
An empirical investigation in an
Iranian company. African Journal
ofBusiness Management 5(1), 88-
95.
3. Ali, O. A. (2018). The effect of
disclosure of intellectual capital
components on market price of
shares listed in Jordanian
industrial companies. An empirical
study.International Journal of
Economics and Financial Issues,
8(5), 156-167.
4. Asare, N., Onumah, J. M., &
Simpson, S. N. (2013).Exploring The
disclosure of intellectual capital in
Ghana: Evidence from listed
companies. Journal of Accounting
and Marketing 2 (3)
5. Beattie & Thomson
(2010).Investment in human
capital. A Theoretical Analysis.
Journal of Political Economy, 5(6),
9-49
6. Bontis, N, Chua, W., & Richardson,
S. (2000). Intellectual capital and
the nature of business
International Journal of Advanced
Academic Research | Financial
Management | ISSN: 2488-9849
8(4).
7. Chen, M. C., Cheng, S. J., & Hwang,
Y. (2005). An empirical
investigation of the relationship
between intellectual capital and
firm„s market value and financial
performance. Journal of
Intellectual Capital, 6(2), 159-176.
8. Chu, T. (2011).The strategic
management of intellectual capital
and organizational knowledge.
New York, NY: Oxford University
Press.
9. Deep & Narwal, S. (2014).
Relationship between intellectual
capital and business performance

www.idosr.org Akpan and Otung
68
IDOSR JOURNAL OF HUMANITIES AND SOCIAL SCIENCES 5(1): 58-69, 2020.
in India. Retrieved from;
www.researchersgate.com.ng
10. Edvinsson & Malone
(1997).Developing intellectual
capital in Scandia. Long range
planning. Journal of Intellectual
Capital 30(3), 320 -331
11. Eka, C. Mirna, I. &Mulia, S. (2018).
Effect of intellectual capital to
financial performance and market
value of companies listed in
Indonesia Stock Exchange for year
2010-2015. Account and financial
management Journal, 3(2), 1323-
1330.
12. Fahim, M. &Yousefnezhad
(2012).Intellectual capital and
performance pointers in Tehran.
Retrieved from;
www.academiaedu.com.ng.
13. Hermati, H. Mohammadi, A.,
&Rezaeyen, N. (2013). Economic
value added of intellectual capital
on the market value of listed
companies in Tehran Stock
Exchange. European on line Journal
of Natural and Social Sciences, 2
(3), 1303-1307.
14. Kamal,Mat,Rahim Husain & Ismail.
(2012). The intellectual capital
performance of banking sector in
Pakistan‖. Pakistan Journal
Communication & Social Sciences,
4(1):84-99.
15. Khanhossini, F.(2013). Relationship
between intellectual capital and
financial performance of
companies in Nairobi. Journal of
intellectual capital 5(7),12-15.
16. Ofurum, C. O., & Shanley, J. U.
(1990).Firms„ financial
performance and human resources
accounting disclosure in Nigeria.
International Journal of Business
and Management, 7(14): 67-75.
17. Morariu, F. (2014).Impact of
intellectual capital on corporate
performance. Journal of
intellectual capital 6(3),7-10.
18. Ngari, M. (2013). The relationship
between intellectual capital
accounting and business
performance: A study of
pharmaceutical firms in Kenya.
Journal of intellectual capital
8(5),30-35.
19. Ngugi, C. (2012). Intellectual
capital on growth of SMEs in
Kenya. Journal of intellectual
capital, 6(4),11-15.
20. Onyekwelu, U. L. ^ Ubesie, M. C.
(2016). Effect of intellectual capital
on corporate valuation of quoted
pharmaceutical firms in Nigeria.
International Journal of Business
and Management Review, 4(7), 50-
59.
21. Pal,&Soriya, D. (2012).Relationship
between intellectual capital and
organizational performance in
India. Retrieved from;
www.academiaedu.com.ng.
22. Pulic, A., (1998).Measuring the
performance of intellectual
potential in knowledge economy.
International Journal of Technology
Management, 20(2), 245-354.
23. Pulic, A., (2004).VAIC – an
accounting tool for IC
management. International Journal
of Technology Management, 20 (5),
702-714.
24. Suhendra, E. S. (2015). The
influence of intellectual capital on
firms value towards
manufacturing performance in
Indonesia. International
Conference on Eurasian Economics
54-61.
25. Sveiby, K. E. (2001). The intangible
assets monitor. Journal of Human
Resource Costing & Accounting
2(1), 34-40.
26. Stewart, T.A. (1991). Intellectual
capital: The new wealth of
organizations London: Journal of
Intellectual Capital, 6(5), 20-25.
27. Taliyang, S. M. &Mansor, M
(2014).Intellectual capital
disclosure and market
capitalization. International
Journal of Business and Social
Sciences, 5 (10), 96-102.
28. Yang, C. C., & Lin, C.Y.Y. (2009).
Does intellectual capital mediate
the relationship between HRM and
www.idosr.org Akpan and Otung
69
IDOSR JOURNAL OF HUMANITIES AND SOCIAL SCIENCES 5(1): 58-69, 2020.
organizational performance?
Perspective of healthcare industry
in Taiwan. International Journal of
Human Resource Management,
20(9), 1965-1984.
29. Yusuf, H. K., & Kavida, V.
(2018).Nexus between intellectual
capital disclosure and corporate
governance quality. Evidence from
IT companies in India. SUMEDHA
Journal of Management, 7(2), 200-
211.
30. Zeghal&Maaloul, C. (2010). Impact
of intellectual capital on
organizational performance in
British firms. Retrieved from;
www.researchersgate.com.ng.