Integration of Demand Side Management, Distributed ... · Task XVII:Integration of Demand Side...
77
Integration of Demand Side Management, Distributed Generation, Renewable Energy Sources and Energy Storages State of the art report Vol 1: Main report International Energy Agency Demand- Side Management Programme Task XVII: Integration of Demand Side Management, Distributed Generation, Renewable Energy Sources and Energy Storages Operating Agent: Seppo Kärkkäinen VTT, Finland Tel: +358 20 7226406 [email protected]
Transcript of Integration of Demand Side Management, Distributed ... · Task XVII:Integration of Demand Side...
Integration of Demand Side Management,Distributed Generation, Renewable Energy
Sources and Energy Storages
State of the art report
Vol 1: Main report
International Energy Agency Demand-Side Management Programme
Task XVII: Integration of DemandSide Management, DistributedGeneration, Renewable EnergySources and Energy Storages
Operating Agent:
Seppo KärkkäinenVTT, FinlandTel: +358 20 [email protected]
Participants
Matthias Stifter Austria arsenal research
Hubert Fechner Austria arsenal research
Helfried Brunner Austria arsenal research
Anna-Kaisa Karppinen Finland Technology Centre Merinova
Corentin Evens Finland Technical Research Centre of Finland (VTT)
Jussi Ikäheimo Finland Technical Research Centre of Finland (VTT)
Seppo Kärkkäinen Finland Technical Research Centre of Finland (VTT)
Giancarlo Scorsoni Italy Gestore dei Servizi Elettrici (GSE)
René Kamphuis Netherlands Energy Research Centre of Netherlands (ECN)
Seungchan Chang Korea Korea Energy Management Corporation
Won-Goo Lee Korea Korea Energy Management Corporation
Ki-Tae Nam Korea Korea Energy Management Corporation
Hyeon-Hee Kwak Korea Korea Energy Management Corporation
Hyung-Joong Kim Korea Korea Energy Management Corporation
Susaña Bañares Spain Red Eléctrica España
Carmen RodríguezVillagarcía
Spain Red Eléctrica España
Miguel Ordiales Spain Red Eléctrica España
Carlos Madina Spain Labein
Gil Bindewald USA U.S. Department of Energy
Stan Calvert USA U.S. Department of Energy
Richard DeBlasio USA National Renewable Energy Laboratory (NREL)
Alison Silverstein USA Alison Silverstein Consulting
DSM REPORT - EXECUTIVE SUMMARY
TASK XVII: INTEGRATION OF DEMAND SIDE MANAGEMENT,DISTRIBUTED GENERATION, RENEWABLE ENERGY SOURCES ANDENERGY STORAGES
Background Energy policies are promoting distributed energy resources such asenergy efficiency, distributed generation (DG), energy storage devices,and renewable energy resources (RES), increasing the number of DGinstallations and especially variable output (only partly controllable)sources like wind power, solar, small hydro and combined heat andpower.
Intermittent generation like wind can cause problems in grids, in physicalbalances and in adequacy of power.
Thus, there are two goals for integrating distributed energy resourceslocally and globally: network management point of view and energymarket objectives.
Solutions to decrease the problems caused by the variable output ofintermittent resources are to add energy storages into the system, createmore flexibility on the supply side to mitigate supply intermittency andload variation, and to increase flexibility in electricity consumption.Combining the different characteristics of these resources is essential inincreasing the value of distributed energy resources in the bulk powersystem and in the energy market.
IEA has several Implementing Agreements dealing with distributedgeneration (DG) (such as wind, photovoltaic, CHP), energy storage anddemand side management (DSM). However, the question of how tohandle the integration of various distributed energy resources is notactually studied.
This Task is focusing on the aspects of this integration.
Objectives The main objective of this Task is to study how to achieve a betterintegration of flexible demand (Demand Response, Demand SideManagement) with Distributed Generation, energy storages and SmartGrids. This would lead to an increase of the value of Demand Response,Demand Side Management and Distributed Generation and a decreaseof problems caused by intermittent distributed generation (mainly basedon renewable energy sources) in the physical electricity systems and atthe electricity market.
Approach The first step in the Task was to carry out a scope study collectinginformation from the existing IEA Agreements, participating countries withthe help of country experts and from organized workshops and othersources (research programs, field experience etc), analyzing theinformation on the basis of the above mentioned objectives andsynthesizing the information to define the more detailed needs for thefurther work. The main output of the first step is this state-of-the art reportand the proposal for the future work to be carried out as a second step ofthe Task.
Results Overview of the situation: The main topics discussed are DER andelectricity supply, flexibility in electricity demand, communications and IT,integration analytics, regulation, policy and business opportunities as wellas market in participating countries.
Pilot case studies: more than 50 case studies, experiments andresearch projects in the participating and some other countries have beencollected and categorized.
Although a general conclusion of the case studies is difficult, someelements can be pinpointed:Most of the case studies are still in research, pilot or field test level andonly very few were actual business cases. Integration technologies withdifferent characteristics exist; metering and communication technologyare still expensive to install and maintain, optimization algorithms foraggregated portfolio exist but are not public available yet, market ruleswhich allow the integration of different generation units - especiallyaggregation of production and consumption – differ between countries.Vision and Conclusion: As a conclusion of this analysis it can be saidthat the increased penetration of DG and the technology and marketdevelopment results in:
new roles of the different stakeholders meaning new businessenvironment and possibilities; on the other hand new tools are alsoneeded in this new business area
metering and ICT technologies are developing rapidly
the above development will result in new products, services and
pricing policies which can activate the more deep participation of finalconsumers in the market
Successful integration means that different technologies in supply anddemand side as well as in ICT are developed to the level where theirintegration is feasible both technically and economically and thatregulation, policy and market give the successful framework for theintegration
The summary on the situation of integration was developed on the basisof analysis and expert group opinions. The status of each item wasassessed among the following:
Early: R&D
Young: Pilots / Field tests
Existing: Available, at least one vendor; early adopters involved
Mature: Widespread commercial
Implications On the basis of the analysis, it was noted that there are some needs forthe future work inside this Task XVII to be defined. Especially topicswhich are at the level of young/existing give possibilities to mutualdevelopment and sharing experiences.
The list of the interesting topics was produced by the expert groupincluding about 15 items.
It was decided that as the first priority topic – which is related to theassessment of the effect of DER penetration to the costs and benefits ofdifferent stakeholders and the whole system – will be further elaborated.
International Energy Agency Demand-Side Management Programme
Task XVII: Integration of DemandSide Management, DistributedGeneration, Renewable EnergySources and Energy Storages
Operating Agent:
Seppo KärkkäinenVTT, FinlandTel: +358 20 [email protected]
ContentsGlossary
List of abbreviations
1 Introduction...................................................................................................................1
2 IEA DSM Task XVII ......................................................................................................7
2.1 IEA and DER .........................................................................................................7
2.2 Objectives..............................................................................................................7
2.3 Approach ...............................................................................................................7
3 DER and electricity supply............................................................................................9
3.1 Background: effects of variable output generation on electricity supply ................9
3.1.1 Variability and uncertainty ..............................................................................9
3.1.2 Two kinds of utility systems ............................................................................9
3.1.3 Greater flexibility...........................................................................................10
3.2 Distributed generation and renewable energy sources........................................10
3.3 Energy storages ..................................................................................................11
3.4 Economic dispatch ..............................................................................................14
3.5 Real-time grid operation ......................................................................................15
3.5.1 Power quality management ..........................................................................15
3.5.2 Protection .....................................................................................................17
3.5.3 Distribution automation.................................................................................17
4 Flexibility in the electricity demand .............................................................................19
4.1 Demand-side resources ......................................................................................19
4.2 Automated demand response devices ................................................................19
4.3 Pricing granularity or smart rates.........................................................................19
4.4 Customer response and production.....................................................................20
5 Communications and IT..............................................................................................22
5.1 Communication networks ....................................................................................22
5.2 High-speed digital monitoring ..............................................................................22
5.3 Smart meters deployment....................................................................................22
5.4 Interoperability .....................................................................................................24
5.5 Functional Automation/Monitoring .......................................................................25
5.6 Intelligence/Smart behavior .................................................................................25
5.6.1 Load modeling..............................................................................................25
5.6.2 Automation of distributed energy resources (DER) ......................................26
5.7 User/primary process feedback...........................................................................26
5.8 Intelligent agents and distributed controllers........................................................27
5.8.1 Local interface or local DER Controller.........................................................28
5.8.2 DER/EMS management system...................................................................28
5.8.3 ICT infrastructure..........................................................................................29
6 Integration analytics....................................................................................................31
6.1 Analytical tools and analysis methods for the assessing the effects of integration31
6.1.1 General description of the tools....................................................................31
6.1.2 Classification of tools....................................................................................31
6.1.3 Readiness level and weaknesses of the tools..............................................34
6.2 Good, real data....................................................................................................34
7 Regulation, policy and business opportunities............................................................35
7.1 Understanding relative costs and benefits...........................................................35
7.1.1 Costs and benefits of different actors related to the integration of DER.......35
7.2 Incentives and subsidies .....................................................................................36
7.3 DER business opportunities ................................................................................38
7.3.1 Market based DER.......................................................................................38
7.3.2 Examples of business models ......................................................................39
8 Market in participating countries .................................................................................43
8.1 Electric Industry: market structure and market actors..........................................43
8.1.1 Market structure ...........................................................................................43
8.1.2 Market actors................................................................................................43
8.2 Electricity market transactions. ............................................................................44
8.3 Bilateral and self-supply for DER.........................................................................44
9 Experiences from the pilot case studies .....................................................................45
9.1 Autonomous grids, microgrids. ............................................................................45
9.2 Balancing DG units..............................................................................................45
9.3 Aggregation of units and virtual power plant........................................................46
9.4 Traditional DR/DSM.............................................................................................47
9.5 Delay network investments..................................................................................48
9.6 Conclusions from the case studies ......................................................................48
10 Vision of successful integration and conclusions ....................................................49
11 References..............................................................................................................52
Annex 1: Standards on integration DSM, DG, RES, ES ...................................................54
Annex 2: Busmod methodology .........................................................................................58
Annex 3: Overview of IEA..................................................................................................60
GlossarySome of the terms used in the report are described. The terminology used is notnecessary standardized, and it is produced to explain how the terms are used in thisdocument.
Active and passive grids
A passive grid is the most commonly used way to manage low and medium voltagenetworks where a feeder is connected to a transformer and that transformer is the onlysource of control on the feeder (e.g. voltage control). In an active grid, the loads,generators and grid nodes can be controlled in real time by means of ICT technology.
Aggregation
Aggregation of flexible energy resources means that a third party, named DER aggregator,collects and implements a portfolio of flexible energy resources and operates themcombined as a flexible resource on the energy market such as the whole sale electricitymarket. The aggregator may also offer the aggregated flexible resources to the market forsystem reserves or as ancillary services for the operators of energy distribution networks.The term Virtual Power Plant has roughly the same meaning as DER aggregation.
Bridging power
Application area for energy storages, where stored energy is used for seconds to minutesto assure continuity of service when switching from one source of energy generation toanother.
Centralized power generation
Way of operating a power system where almost all electrical energy is generated or almostall capacity lies in large central power plants, which are not considered distributedgeneration units.
Common information model
Common Information Model (CIM) is a standard developed by the electric power industrythat has been officially adopted by the International Electrotechnical Commission (IEC). Itaims to allow application software to exchange information about the configuration andstatus of an electrical network from utility and system operation point of view. A relatedlanguage is Substation Configuration Description Language (SCL) which specifies theinformation model in the substation automation system (SAS).
Congestion
A condition that occurs in the network when insufficient transfer capacity is available tobring electricity from generators to consumers.
Cyber security
Information security within the internet, telecommunications networks, computer systems,integrated sensors, system control networks and embedded processors and controllers.
As the grid becomes increasingly dependent upon distributed intelligence, communicationsand controls with multiple points of generation and consumption, cyber-security becomes agreater vulnerability for the bulk power system.
Demand response (DR)
or Demand Side Response (DSR). Programs and activities designed to encourageconsumers to change their electricity usage patterns, including timing and level ofelectricity demand, covering all load shape and customer objectives. DR includes time-of-use and dynamic rates or pricing, reliability programs such as direct load control of devicesand instantaneous interruptible load, and other market options for demand cahnges (likedemand side bidding).
Direct Load Control (DLC)
Loads are externally controlled for the set of DR/DSM actions when the end-users areprovided with the required hardware and communication infrastructure to allow direct loadcontrol. In DLC programs customers’ load is interrupted by remotely shutting down orcycling consumers’ electrical appliances such as air conditioners and water heaters.
Distributed energy resources (DER)
Common term for distributed generation (including small combined heat and power, smallrenewables), energy storages and flexible loads (recently called also active demand)connected to the distribution or transmission network. Flexible loads are usually utilisedthrough demand response activities.
Distributed generation (DG)
Low capacity power generation connected to the distribution or transmission networkincluding renewable resources and combined heat and power units. The definition of lowcapacity varies usually between 1 and 50 MW. In this report 20 MW limit is used in sometables..
Distribution System Operator (DSO)
A distribution system operator delivers electricity to the final consumer through adistribution system. The European directive 2003/54/EC defines DSO as follows:“DSOmeans a natural or legal person responsible for operating, ensuring the maintenance ofand, if necessary, developing the distribution system in a given area and, where applicable,its interconnections with other systems and for ensuring the long term ability of the systemto meet reasonable demands for the distribution of electricity” [It has to be noted thedistinction between Retailer (in the US the Retail Electric Provider) who is the entity thatsells electricity to the end user and DSO who delivers the electricity]
Dynamic Pricing (DP)
Pricing model where the energy price charged to customers can vary significantlyaccording to the time and location of the electricity consumed; this can include real-timepricing.
Energy Management
The operations related to reducing cost of energy consumption and/or increasing incomefrom electricity and heat generation.
Energy management is also an application area for energy storages. In these applicationsthe electric storage is used to decouple the timing of generation and consumption ofelectric energy. A typical application is load levelling, which involves the charging ofstorage when energy cost is low and utilization as needed. This would also enableconsumers to be grid-independent for many hours. Heat storages can be used to decoupleelectricity generation from a CHP unit and its associated heat consumption.
Energy Service Company (ESCO)
"Energy service company" (ESCO) is a natural or legal person that delivers energyservices and/or other energy efficiency improvement measures in a user's facility orpremises, and accepts some degree of financial risk in so doing. The payment for theservices delivered is based (either wholly or in part) on the achievement of energyefficiency improvements and on the meeting of the other agreed performance criteria. [1]
Flexibility
Customer flexibility means the ability to quickly and inexpensively adapt his own powergeneration and demand in response to varying electricity prices, electricity marketconditions, transmission and distribution system conditions, and of regulation.
Network flexibility is defined by either having enough capacity for transmission ordistribution or increase the available energy storage in the network, or by being able to usetools such as real-time monitoring and analytics to manage grid assets in ways thatincrease its throughput and operational flexibility without compromising its reliability.
High-speed digital monitoring
Used for monitoring the status of a grid or of some elements on it in real time and allowinga quick response (automated or not) when needed. It is common in European countries tomonitor the status of the high-voltage grids in such a way.
Independent system operator
An independent organization that is responsible for coordinating, controlling andmonitoring the operation of the electrical power system in a particular geographic area
Indirect Load Control
Indirect Load Control is classified as the set of initiatives that require end-use customers tomodify their load consumption with actions executed by the customers themselves. Theseinclude all the cases in which the system operator does not have the capability of directlycontrol the load.
Intelligent agent
An entity (computer program or physical device) which can observe and act upon anenvironment and directs its activity towards achieving certain goals.
Interoperability
The ability of two or more systems or components to exchange information and to use theinformation that has been exchanged effectively without intervention on the part of the useror operator.
Liberalization
In the electricity sector, liberalization means the removal of the monopolies for electricutility sales to retail customers and the opening of competition in electricity generation andsupply and sales to retail customers while keeping the monopoly in transmission anddistribution. In order to guarantee a fair competition, the rules for accessing transmissionand distribution grids must be transparent and non-discriminatory.
Micro-CHP
A cogeneration unit generating less than 16A per phase.
Power exchange
also known as spot or pool market, conducts auctions for generators seeking to sellenergy and for loads which are otherwise served by bilateral contracts. The powerexchange determines the market clearing prices and those generator units which havebid at or below the clearing price are scheduled for generation (known as 'merit order').The power exchange is often also responsible for the settlement and billing (not in theUK). Depending on the closing time of the power exchange, it is either called a day-ahead market (like Nord Pool) or real-time market if it closes just before delivery. Inaddition, the term is also often used for other related markets, e.g. financial market orancillary service market, because the entity operating the power exchange alsooperates those markets. Hence, the entity functions as a market operator (See marketoperator). Finally, in some cases, e.g. Pennsylvania-New Jersey-MarylandInterconnection, the entity operating the power exchange also functions as the systemoperator. [2]
Power quality
The conformity of voltage to certain standards. Deviation from these standards is regardedas degradation of power quality. Requirements can be set for variations in the peak orRMS voltage, voltage spikes, waveform shape, symmetricity of the waveform betweendifferent phases, etc.
When energy storages are used to assure continuity of quality power, stored energy isonly applied for seconds or less, as needed.
Power system protection
Power system protection is that part of electrical power engineering that deals withprotecting the electrical power system from perturbations by isolating the faulted part fromthe rest of the network. The main objective of a protection scheme is to keep the powersystem stable by isolating only the components that are under fault, whilst leaving as muchof the network as possible still in operation.
Smart metering
Smart metering has the following features:
Measures energy use in regular intervals as short as five to 15 minutes in length
Stores energy use data to communicate to the utility meter data managementsystem
automatic processing, transfer, management and use of metering data;
automatic management of meters;
two-way data communication with the utility meter data management system
Advanced meters may provide meaningful and timely information about electricity ratesand individual electricity consumption information to the relevant actors and their systems,including the energy consumer; they also support services that improve the energyefficiency of the energy consumption and the energy system (generation, transmission,distribution and especially end use).; they may also deliver information and signals thattrigger customers’ on-premise equipment operation. Advanced or smart meters do notinclude meters that have only automated meter reading.
Smart grid
The management of transmission and distribution networks which uses robust two-waycommunications, advanced sensors, and distributed computers to improve the efficiency,reliability and safety of power generation, delivery and use. Additionally it can supportservices, such as demand response, to consumers. The concept encompasses a widerange of technologies, such as advanced meter reading, substation automation andenergy management systems. Smart grid development for the most part can use existingtechnologies, applying them in new ways to grid operations.
Time-of-Use (ToU) tariff
A method of pricing electricity using different prices at different times of the day andseasons of the year. Opposed to dynamic pricing, the prices have been agreedbeforehand and the number of tariffs is fewer.
Variable-output power generation
Power generation whose output power is determined externally and varies with time. In [3]it refers to renewable electricity technologies, such as wind, wave, tidal, solar, and run-of-river hydro sharing a characteristic that distinguishes them from conventional powerplants: their output varies according to the availability of the resource. The samecharacteristics can be related also to CHP. Often also the term “intermittent type
generation” is used in quite a similar way: however, intermittent generation may be morestochastic and less predictable than variable generation
Virtual power plant
A portfolio of smaller generators and demands. The concept is closely related to DERaggregation. Commercial virtual power plant, CVPP, is one type of VPP operation. CVPPis related to the market (seeking to obtain a maximum benefit from the generation anddemand portfolio without further considerations). Services provided by a CVPP includetrading in the wholesale energy market, balancing or trading portfolios and provision ofservices to the system operator. Technical virtual power plant, TVPP, is another type ofVPP operation. The TVPP takes into consideration also the operation of the grid and triesto solve possible contingencies (it probably will receive an income but it will come mainlynot from the market but from the system operator)The TVPP consists of DER from thesame geographic location. In this case the impact of operation on the distribution networkis considered. Services from a TVPP include local system management for DSO, as wellas providing TSO balancing and ancillary services. The operator of a TVPP requiresdetailed information on the local network, typically this will be the DSO.
References
1. Directive 2006/32/EC of the European Parliament and of the Council of 5 April 2006on energy end-use efficiency and energy services and repealing Council Directive93/76/EEC
2. Distributed Resources in a Re-Regulated Market environment Thomas AckermannDoctoral Thesis Stockholm, Sweden 2004-12-09
3. Empowering Variable Renewables. Options for Flexible Electricity Systems. IEA2008, 36 p.
(http://www.iea.org/textbase/publications/free_new_Desc.asp?PUBS_ID=2040)
List of abbreviations
AMM Advanced metering managementAMR Automatic Meter ReadingCAES Compressed Air Energy StorageCENELEC European Committee for Electrotechnical StandardizationCHP Combined Heat and PowerDER Distributed Energy ResourcesDG Distributed GenerationDR Demand ResponseDS Distributed energy StorageDSM Demand-Side ManagementDSO Distribution System OperatorEN European Standard (developed by European Committee for Standardization)GHG Green-House GasesHV High-voltageIA Implementing AgreementICT Information and Communication TechnologiesIEA International Energy AgencyIEC International Electrotechnical CommissionIT Information TechnologyLV Low-voltagePCC Point of Common CouplingPV Photovoltaic (power generation)RES Renewable Energy SourceSMES Superconducting Magnetic Energy StorageToU Time of UseTSO Transmission System OperatorUPS Uninterruptible Power SupplyVPP Virtual Power PlantVTT Technical Research Centre of FinlandUCA Utility Communications ArchitectureµCHP Micro Combined Heat and Power
Integration of DSM, DG, RES and storages: Introduction
1
1 IntroductionAll around the world, there is increasing use of renewable energy sources and moreefficient use of energy. These are motivated by a will to reduce green-house gases(GHG) emissions and the increase of fuel prices that drives up the prices of energy.Behind the will to reduce GHG large number of countries have ratified the Kyoto protocolwhich has, in turn, been transposed into national laws and energy policies. At the sametime the role of electricity as an energy carrier is increasing and the construction of newtransmission lines and large central power plants is becoming more and more difficult.
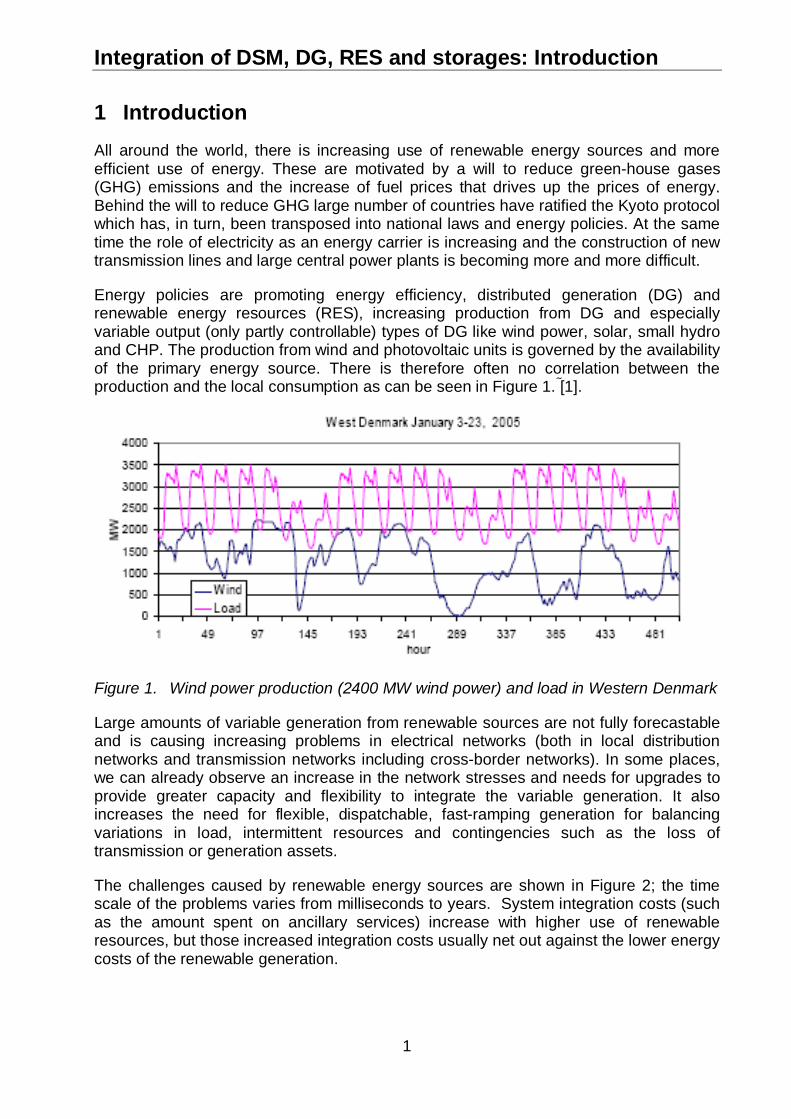
Energy policies are promoting energy efficiency, distributed generation (DG) andrenewable energy resources (RES), increasing production from DG and especiallyvariable output (only partly controllable) types of DG like wind power, solar, small hydroand CHP. The production from wind and photovoltaic units is governed by the availabilityof the primary energy source. There is therefore often no correlation between theproduction and the local consumption as can be seen in Figure 1. [1].
Figure 1. Wind power production (2400 MW wind power) and load in Western Denmark
Large amounts of variable generation from renewable sources are not fully forecastableand is causing increasing problems in electrical networks (both in local distributionnetworks and transmission networks including cross-border networks). In some places,we can already observe an increase in the network stresses and needs for upgrades toprovide greater capacity and flexibility to integrate the variable generation. It alsoincreases the need for flexible, dispatchable, fast-ramping generation for balancingvariations in load, intermittent resources and contingencies such as the loss oftransmission or generation assets.
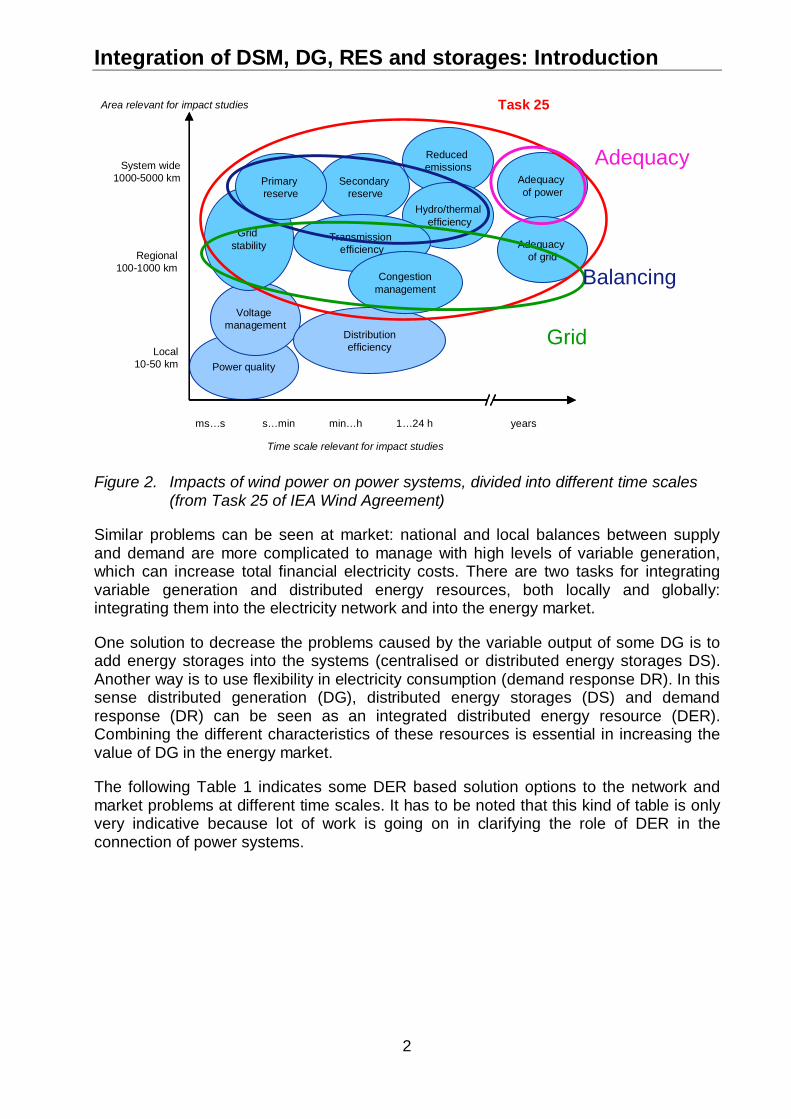
The challenges caused by renewable energy sources are shown in Figure 2; the timescale of the problems varies from milliseconds to years. System integration costs (suchas the amount spent on ancillary services) increase with higher use of renewableresources, but those increased integration costs usually net out against the lower energycosts of the renewable generation.
Integration of DSM, DG, RES and storages: Introduction
2
Figure 2. Impacts of wind power on power systems, divided into different time scales(from Task 25 of IEA Wind Agreement)
Similar problems can be seen at market: national and local balances between supplyand demand are more complicated to manage with high levels of variable generation,which can increase total financial electricity costs. There are two tasks for integratingvariable generation and distributed energy resources, both locally and globally:integrating them into the electricity network and into the energy market.
One solution to decrease the problems caused by the variable output of some DG is toadd energy storages into the systems (centralised or distributed energy storages DS).Another way is to use flexibility in electricity consumption (demand response DR). In thissense distributed generation (DG), distributed energy storages (DS) and demandresponse (DR) can be seen as an integrated distributed energy resource (DER).Combining the different characteristics of these resources is essential in increasing thevalue of DG in the energy market.
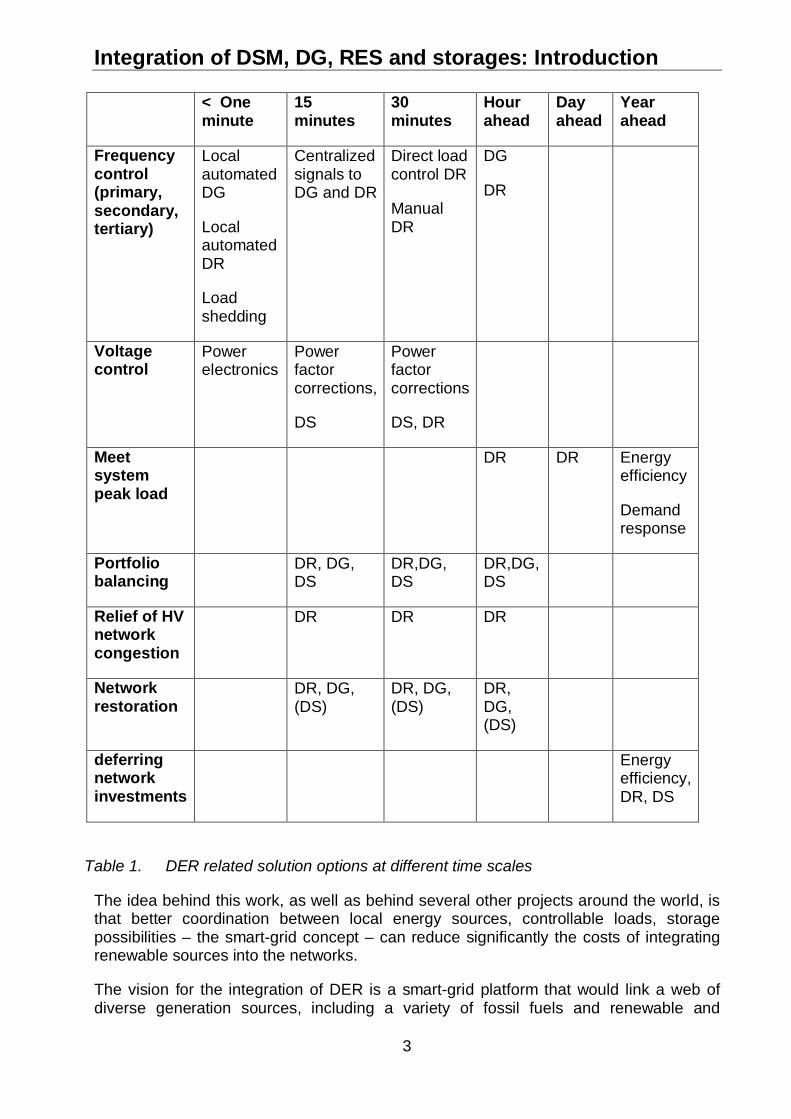
The following Table 1 indicates some DER based solution options to the network andmarket problems at different time scales. It has to be noted that this kind of table is onlyvery indicative because lot of work is going on in clarifying the role of DER in theconnection of power systems.
Power quality
Reducedemissions
Area relevant for impact studies
Time scale relevant for impact studies
ms…s s…min min…h years
Voltagemanagement
Local10-50 km
Regional100-1000 km
System wide1000-5000 km Secondary
reserve
Distributionefficiency
Adequacyof power
1…24 h
Hydro/thermalefficiency
Adequacyof grid
Gridstability
Primaryreserve
Task 25
Transmissionefficiency
Congestionmanagement
Grid
Balancing
Adequacy
Integration of DSM, DG, RES and storages: Introduction
3
< Oneminute
15minutes
30minutes
Hourahead
Dayahead
Yearahead
Frequencycontrol(primary,secondary,tertiary)
LocalautomatedDG
LocalautomatedDR
Loadshedding
Centralizedsignals toDG and DR
Direct loadcontrol DR
ManualDR
DG
DR
Voltagecontrol
Powerelectronics
Powerfactorcorrections,
DS
Powerfactorcorrections
DS, DR
Meetsystempeak load
DR DR Energyefficiency
Demandresponse
Portfoliobalancing
DR, DG,DS
DR,DG,DS
DR,DG,DS
Relief of HVnetworkcongestion
DR DR DR
Networkrestoration
DR, DG,(DS)
DR, DG,(DS)
DR,DG,(DS)
deferringnetworkinvestments
Energyefficiency,DR, DS
Table 1. DER related solution options at different time scales
The idea behind this work, as well as behind several other projects around the world, isthat better coordination between local energy sources, controllable loads, storagepossibilities – the smart-grid concept – can reduce significantly the costs of integratingrenewable sources into the networks.
The vision for the integration of DER is a smart-grid platform that would link a web ofdiverse generation sources, including a variety of fossil fuels and renewable and
Integration of DSM, DG, RES and storages: Introduction
4
distributed sources, across the grid to a large set of consumers with possibilities forimproved energy efficiency, local generation, controllable loads or storage devices. Thegrid, along with analytics, communication technologies and distributed intelligence, isused to coordinate and balance sources, storage and loads to produce a reliable powersystem for more moderate costs than a traditional and centralized approach. It isexpected that the costs of a system with a better DER integration would be reducedcompared to the present situation, because of the inclusion of more energy efficiencyand renewables, but also of a lesser use of expensive peaking power and a better use ofthe transmission and distribution assets. This vision for the future grid can lead to alower adverse environmental impact.
In the future system a proportion of the electricity generated by large conventional plantswill be displaced by distributed generation, renewable energy sources, demandresponse, demand side management and energy storage. Additional stand-by capacitymight be required, which could be called upon whenever the variable output type of RESceases to generate power and there is not enough demand response or energy fromstorages. Efficient integration of distributed generation is unlikely to occur withoutchanges to the transmission and distribution network structure, planning and operatingprocedures. Indeed, it is envisaged that there will be less of a distinction between thesenetwork types, as distribution networks become more active and share many of theresponsibilities of transmission.
Several models for the future electricity system recognise the fundamental fact that withincreased levels of distributed generation and active demand-side penetration, thedistribution network can no longer act as a passive appendage to the transmissionnetwork. The entire system has to be designed and operated as an integrated unit. Inaddition, this more complex operation must be undertaken by a system where ownership,decision-making and operation are also dispersed.
Three conceptual models can be mentioned: microgrids (or minigrids), active networkssupported by ICT and an ‘Internet’ model - all of which could find applications,depending on geographical constraints and market evolution.
Microgrids are generally defined as low-voltage networks with distributed generationsources, together with local storage devices and controllable loads (e.g. water heatersand air conditioning). They can have a total installed capacity in the range of a fewhundred kilowatts to a couple of megawatts. Although microgrids operate mostlyconnected to the distribution network, they can be automatically transferred to isolatedmode in case of faults in the upstream network and then resynchronised after restorationof the upstream network voltage. Within the main grid, a microgrid can be regarded as acontrolled entity capable of operating as a single aggregated load or generator and,given attractive remuneration, as a small source of power or as an ancillary servicesupporting the network.
Active networks are a possible evolution of the current passive distribution networksand may be technically and economically the best way to initially facilitate distributedgeneration in a deregulated market. Active networks have been specifically conjecturedas facilitators for increased penetration of DG and demand-side resources, building onnew ICT technology and strategies to actively manage the network.
Integration of DSM, DG, RES and storages: Introduction
5
The internet model effectively takes the active network to the global scale butdistributes control around the system. The flow of information around the internet usesthe concept of distributed control where each node, web host computer, email server orrouter, acts autonomously under a global protocol. In the analogous electricity systemevery supply point, consumer and switching facility corresponds to a node.
The internet-type systems also enable new types of concepts in the electricity market,such as virtual power plants or virtual utilities. A conventional power plant generateselectricity in one location, using (usually) one type of generating technology and isowned by one legal entity. A virtual power plant is a multi-fuel, multi-location and multi-owned power station.
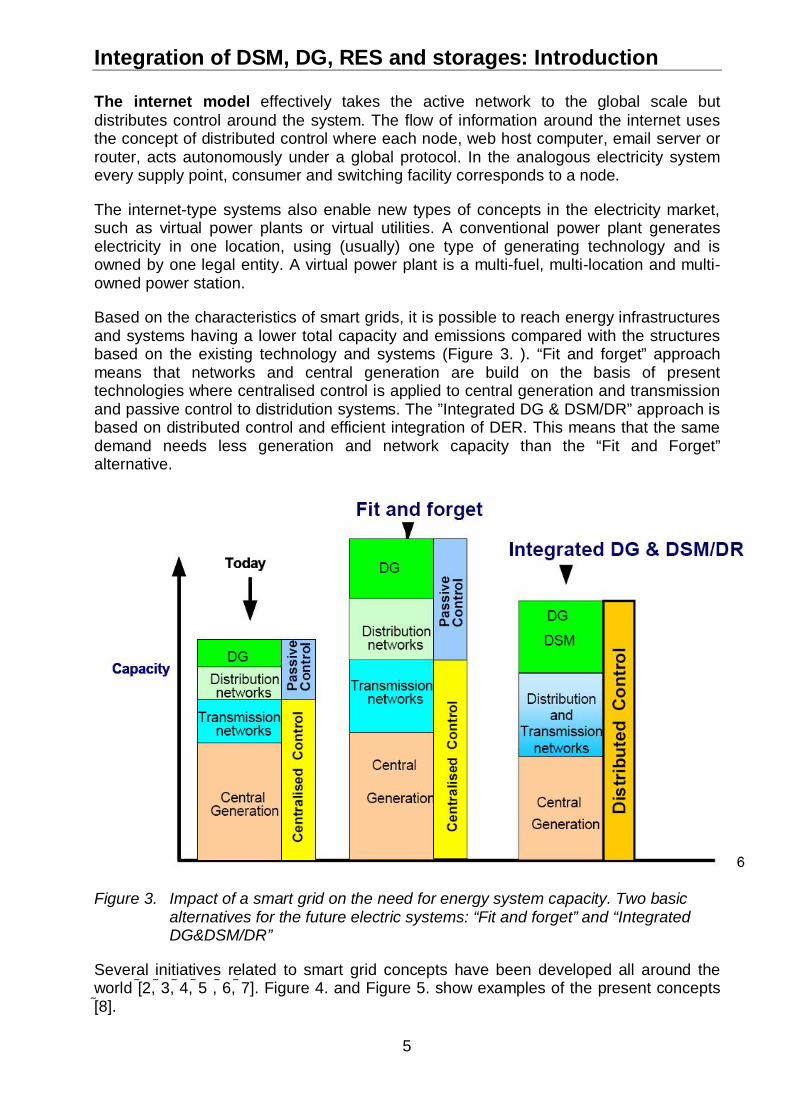
Based on the characteristics of smart grids, it is possible to reach energy infrastructuresand systems having a lower total capacity and emissions compared with the structuresbased on the existing technology and systems (Figure 3. ). “Fit and forget” approachmeans that networks and central generation are build on the basis of presenttechnologies where centralised control is applied to central generation and transmissionand passive control to distridution systems. The ”Integrated DG & DSM/DR” approach isbased on distributed control and efficient integration of DER. This means that the samedemand needs less generation and network capacity than the “Fit and Forget”alternative.
Figure 3. Impact of a smart grid on the need for energy system capacity. Two basicalternatives for the future electric systems: “Fit and forget” and “IntegratedDG&DSM/DR”
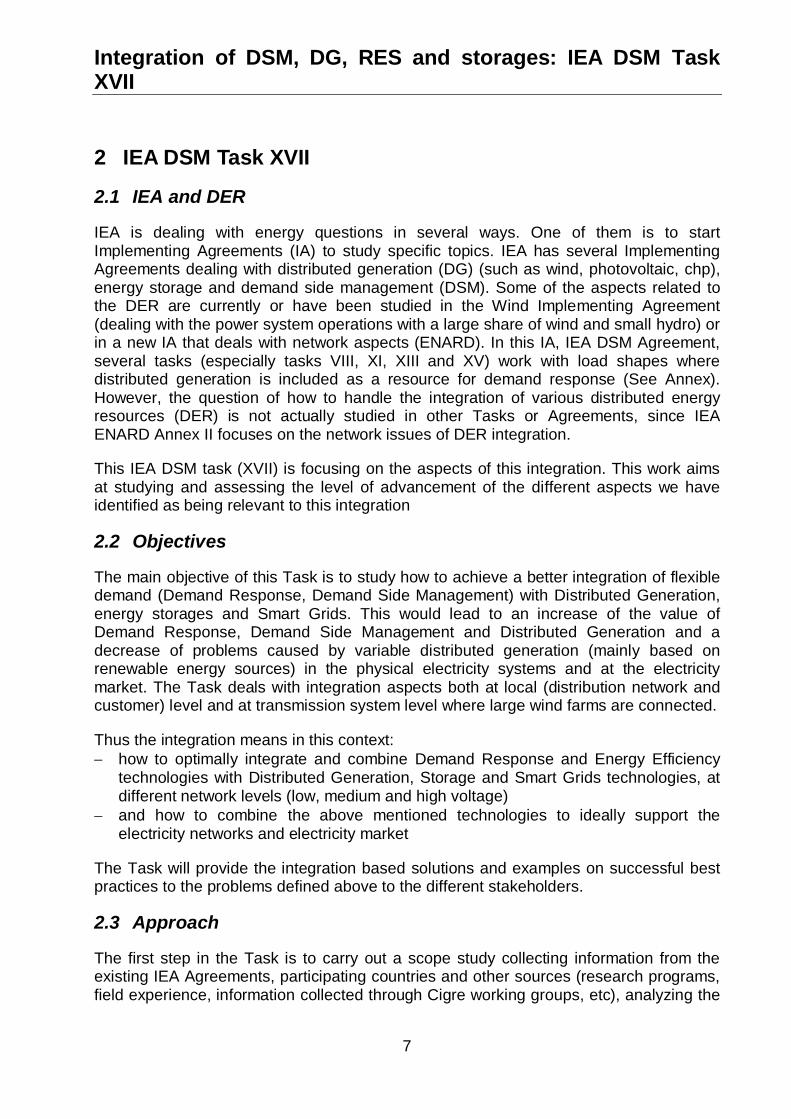
Several initiatives related to smart grid concepts have been developed all around theworld [2, 3, 4, 5 , 6, 7]. Figure 4. and Figure 5. show examples of the present concepts8].
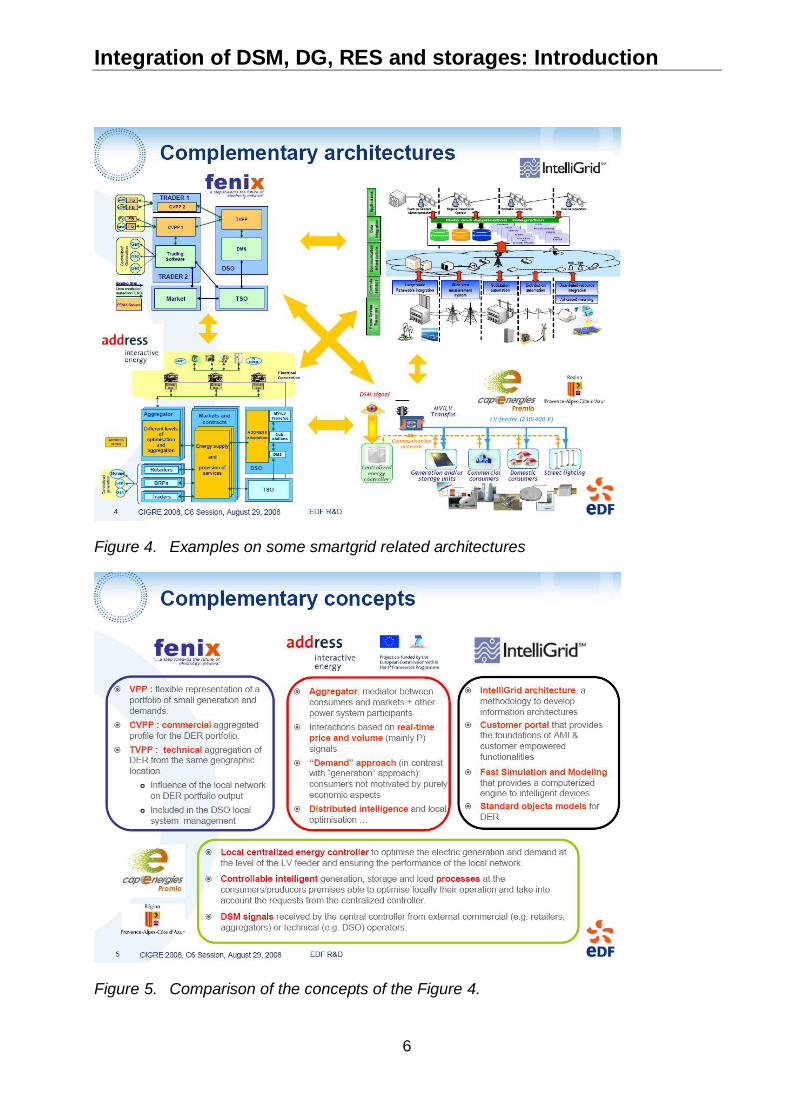
Integration of DSM, DG, RES and storages: Introduction
6
Figure 4. Examples on some smartgrid related architectures
Figure 5. Comparison of the concepts of the Figure 4.
Integration of DSM, DG, RES and storages: IEA DSM TaskXVII
7
2 IEA DSM Task XVII
2.1 IEA and DER
IEA is dealing with energy questions in several ways. One of them is to startImplementing Agreements (IA) to study specific topics. IEA has several ImplementingAgreements dealing with distributed generation (DG) (such as wind, photovoltaic, chp),energy storage and demand side management (DSM). Some of the aspects related tothe DER are currently or have been studied in the Wind Implementing Agreement(dealing with the power system operations with a large share of wind and small hydro) orin a new IA that deals with network aspects (ENARD). In this IA, IEA DSM Agreement,several tasks (especially tasks VIII, XI, XIII and XV) work with load shapes wheredistributed generation is included as a resource for demand response (See Annex).However, the question of how to handle the integration of various distributed energyresources (DER) is not actually studied in other Tasks or Agreements, since IEAENARD Annex II focuses on the network issues of DER integration.
This IEA DSM task (XVII) is focusing on the aspects of this integration. This work aimsat studying and assessing the level of advancement of the different aspects we haveidentified as being relevant to this integration
2.2 Objectives
The main objective of this Task is to study how to achieve a better integration of flexibledemand (Demand Response, Demand Side Management) with Distributed Generation,energy storages and Smart Grids. This would lead to an increase of the value ofDemand Response, Demand Side Management and Distributed Generation and adecrease of problems caused by variable distributed generation (mainly based onrenewable energy sources) in the physical electricity systems and at the electricitymarket. The Task deals with integration aspects both at local (distribution network andcustomer) level and at transmission system level where large wind farms are connected.
Thus the integration means in this context: how to optimally integrate and combine Demand Response and Energy Efficiency
technologies with Distributed Generation, Storage and Smart Grids technologies, atdifferent network levels (low, medium and high voltage)
and how to combine the above mentioned technologies to ideally support theelectricity networks and electricity market
The Task will provide the integration based solutions and examples on successful bestpractices to the problems defined above to the different stakeholders.
2.3 Approach
The first step in the Task is to carry out a scope study collecting information from theexisting IEA Agreements, participating countries and other sources (research programs,field experience, information collected through Cigre working groups, etc), analyzing the
Integration of DSM, DG, RES and storages: IEA DSM TaskXVII
8
information on the basis of the above mentioned objectives and synthesizing theinformation to define the more detailed needs for the further work.
On the basis of the collected information a systematic analysis is carried out to producethe state of the art to the integrated approach of the utilization of Demand Response andEnergy Efficiency in combination with other DER aspects and barriers related to it and todefine the detailed further work.
This kind of approach presumes the co-operation between different ImplementingAgreements related to DG, storages, DSM and networks. Experts are needed from eacharea. Especially information exchange and coordination with Wind and ENARD isorganized.
In July 2008, a workshop with the stakeholders was arranged to get feedback and inputsfrom outside to the conclusion and the definition for the future work. The workshopmaterial can be found from http://ieadsm.org/ViewTask.aspx?ID=16&Task=17&Sort=0
This work has been divided into chapters related to the aspects we considered asrelevant for the integration of more various distributed energy resources. Main topics are
DER and electricity supply
Flexibility in electricity demand
Communications and IT
Integration analytics and
Regulation, policy and business models
Inside each main topic the most relevant items have been discussed. We also collectedinformation on the tools and methods to be used in the assessment of integration andpilots, field tests and case studies. These are shortly summarized in the report and moredetailed information is given in the separate Annex report (Vol. 2).
We have also come to an agreement during our work that we would not focusextensively on regulations and policies. They determine the structure of the market aswell as the business models which can be implemented in each country. It is assumedthat as technologies evolve and ways to capture benefits will appear, be proven orbecome more available, business models will appear or evolve likewise in the availablemarkets. Some examples on business models, however, are given.
Moreover, the market structures are very different in the participating countries. Ourwork aims at identifying integration performance and development in very differentmarket structures and we wish our recommendations not to depend too much on them.
Country experts also produced the description of the DER integration situation in theirrespective countries. These country reports are included in the Vol. 2 report (Annexes).
Integration of DSM, DG, RES and storages: DER andelectricity supply
9
3 DER and electricity supplyThis chapter discusses the electricity systems which include distributed energyresources like demand-side management, generation and storages. Flexible loads anddemand response are, however, discussed more in the chapter 4. DG and storagetechnologies are described shortly in this chapter and the operational questions of thesystems are discussed.
3.1 Background: effects of variable output generation on electricitysupply
3.1.1 Variability and uncertainty
A central station-dominated utility system has two principal sources of variability –changes in load, and supply contingencies (such as the loss of a transmission line orgeneration unit). If you add a high amount of renewable generation such as wind orsolar to such a system, the system operator faces a third source of variability andunpredictability, but can operate the system by dispatching to net load – load net ofrenewable generation – and forecast net load. When that system takes on additionalcomplexity with growing levels of distributed energy resources, there are moreuncertainties and variability to consider.
Distributed generation is usually operated at the owner’s discretion, not the utility’s will;energy efficiency is often initiated by the end user, not only the utility’s programs andencouragement; customers’ demand response decisions are affected by a variety ofmotivations beyond what the grid operator wants and needs; and as customers decideto install more distributed renewable generation, it changes the topology of thedistribution grid as well as the load patterns perceived on the utility side of the meter.The resulting grid is significantly more complex and uncertain and requires a morecomplex, interactive means of operation and coordination.
3.1.2 Two kinds of utility systems
This study posits an electric power system that incorporates a variety of central stationrenewable and traditional generation technologies (including fossil and nuclear), as wellas a breadth of distributed energy resources (including combined heat and power, smallrenewables, energy storage, energy efficiency, and demand response).
Traditional utility systems have central station generation with power flows and controlsflowing one-way down from the generation and transmission system to the user. Incontrast, a system that contains a high penetration of distributed energy resources willneed a different model of communications and controls – an extensive, wide-spread setof monitoring, two-way communications, distributed controls, and analytics.
While the centralized power system is organized so that supply resources are operatedto follow demands under all circumstances, in a distributed system customer demandsinteract with and respond to supply conditions and capabilities.
Integration of DSM, DG, RES and storages: DER andelectricity supply
10
While the centralized power system is operated by a single dispatch entity thatcommands and operates all assets in an optimized fashion according to a consistent setof values, in a system with high levels of distributed energy resources, there will be avariety of assets operated by many different owners and operators acting to serve theirown interests rather than to optimize the electric system.
Therefore, such systems will have to be operated with high-speed monitoring,sophisticated analytics, and information and incentives (particularly price) disseminatedon two-way communications systems, will be needed to enable assets to respond in acoordinated rather than command fashion.
3.1.3 Greater flexibility
The key to the integration of these higher levels of variability and uncertainty are toincrease the system operational flexibility and diversity, fuel and technology diversity,with more sophisticated analytics, faster response times and reaction capabilities.Improving grid flexibility requires more dispatchable power plants with wide operatingranges and fast ramp rates, but also much greater use of power electronics, energystorage, automation, and managing customer loads and demand-side resources tobalance supply side resources.
3.2 Distributed generation and renewable energy sources
Distributed generation (DG) involves a large number of generation technologies: smallturbines with a steam cycle, small turbines with an organic Rankine cycle (ORC), gasturbines, micro turbines, diesel- or gas-fuelled reciprocating engines, Stirling engines,fuel cells (high and low temperature), photovoltaic systems, wind turbines and smallhydro turbines. There are also different ways to characterize distributed generation..Depending on the context, it may be fuel-based or non-fuel-based, renewable-based(fuel or non-fuel) or non-renewable, controllable or uncontrollable (variable output). Alsosize or network connection (isolated, low-voltage, medium-voltage, high-voltage) may beused as defining aspects. All the above aspects are important in assessing the usabilityof distributed generation in distributed energy systems. Investment and operational costs,reliability, service life, level of technology development etc. are also important factors.
For example, different types of turbines, reciprocating engines and fuel cells all requirefuel, which means that the operator of such units needs to purchase and transport thefuel. Therefore, the fuel purchase has to be taken into account in the production cost ofthe energy. Photovoltaic, wind power, hydro and a part of the CHP production aredependent on the meteorological situation and industrial CHP depends on theproduction processes. Therefore the risks due to the lack of predictability of thegeneration will have to be taken into account for investment decision-making.
Some of the technologies are still emerging and have high investment costs, e.g. fuelcells, while others are already widely deployed. It should be noticed that although manyDG technologies use fossil fuels, most of them can also be run using renewables suchas biofuels. However, nowadays small-scale DG is mainly used as a local means for oneconsumer to reduce his consumption or as an emergency generator. Very little, andoften nothing at all, is done to use DG in order to achieve other goals such asparticipating to renewable balancing or to network management.
Integration of DSM, DG, RES and storages: DER andelectricity supply
11
Some technologies like wind, solar and hydro power use renewable rather than fossilfuels, and so are unaffected by fluctuations in the oil and gas market. The down side isthat in most cases they need to be located at particular places, which may be far awayfrom the network or on a weak network, thus increasing connection costs. Non-controllability also brings in additional costs to cover the risks due to the fluctuation ingeneration.
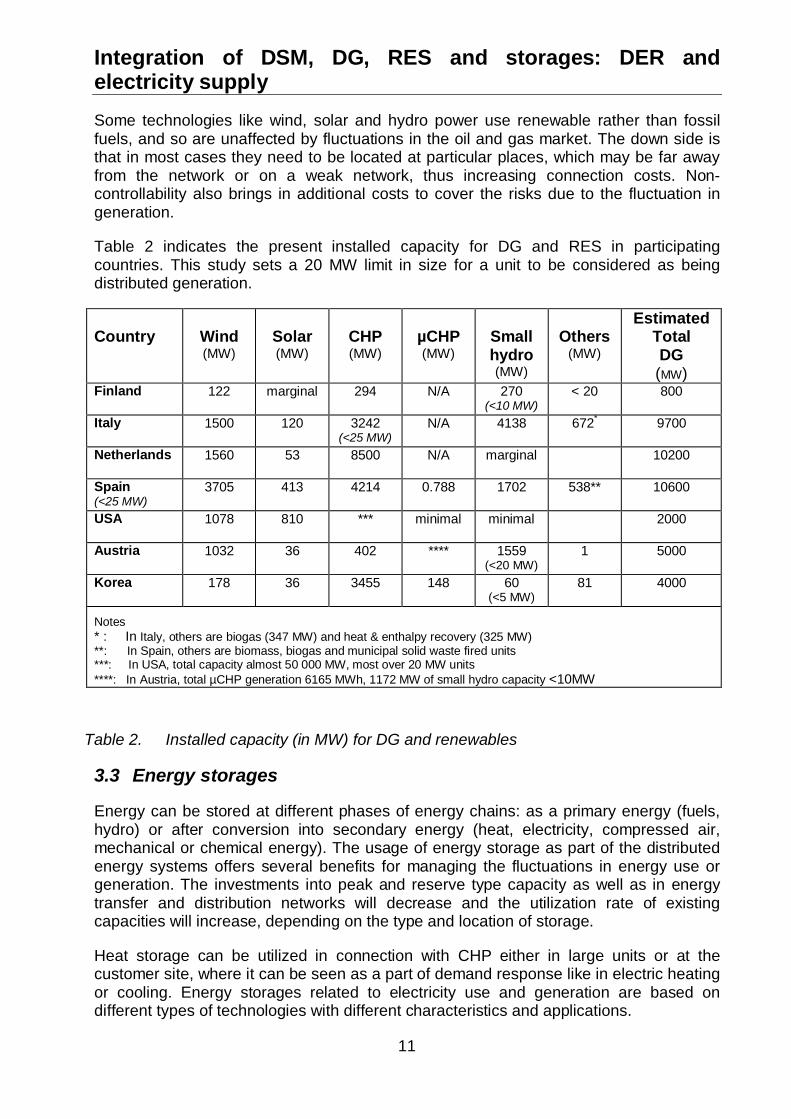
Table 2 indicates the present installed capacity for DG and RES in participatingcountries. This study sets a 20 MW limit in size for a unit to be considered as beingdistributed generation.
Country Wind(MW)
Solar(MW)
CHP(MW)
µCHP(MW)
Smallhydro(MW)
Others(MW)
EstimatedTotalDG(MW)
Finland 122 marginal 294 N/A 270(<10 MW)
< 20 800
Italy 1500 120 3242(<25 MW)
N/A 4138 672* 9700
Netherlands 1560 53 8500 N/A marginal 10200
Spain(<25 MW)
3705 413 4214 0.788 1702 538** 10600
USA 1078 810 *** minimal minimal 2000
Austria 1032 36 402 **** 1559(<20 MW)
1 5000
Korea 178 36 3455 148 60(<5 MW)
81 4000
Notes* : In Italy, others are biogas (347 MW) and heat & enthalpy recovery (325 MW)**: In Spain, others are biomass, biogas and municipal solid waste fired units***: In USA, total capacity almost 50 000 MW, most over 20 MW units****: In Austria, total µCHP generation 6165 MWh, 1172 MW of small hydro capacity <10MW
Table 2. Installed capacity (in MW) for DG and renewables
3.3 Energy storages
Energy can be stored at different phases of energy chains: as a primary energy (fuels,hydro) or after conversion into secondary energy (heat, electricity, compressed air,mechanical or chemical energy). The usage of energy storage as part of the distributedenergy systems offers several benefits for managing the fluctuations in energy use orgeneration. The investments into peak and reserve type capacity as well as in energytransfer and distribution networks will decrease and the utilization rate of existingcapacities will increase, depending on the type and location of storage.
Heat storage can be utilized in connection with CHP either in large units or at thecustomer site, where it can be seen as a part of demand response like in electric heatingor cooling. Energy storages related to electricity use and generation are based ondifferent types of technologies with different characteristics and applications.
Integration of DSM, DG, RES and storages: DER andelectricity supply
12
The applications of electricity storages can be defined on the basis of differentparameters like storing or discharging time and capacity of storages. Very short-termapplications (less than one second) are related to power quality, reliability and securityof power systems and can be defined as high-power applications. The applications fromminutes to hours can relate to the support of distributed energy generation or loadvariations but also to needs for uninterruptible power supply or energy managementneeds of consumers or power suppliers. Depending on applications in power systems,the capacities of storages can vary from less than 1 kW to 1 GW. This kind of applicationis related to high-energy needs.
High-power electricity storage technologies, such as capacitors, flywheels,superconducting magnetic energy storage (SMES) etc. are applicable for fast-responsevoltage and power quality management, whereas high-energy electricity storagetechnologies such as pumped hydro, compressed air energy storage (CAES), flowbatteries, etc. are used in daily cycles for economic gain. High-power applications arestorage technologies that can supply a large power, but only for a time up to a fewseconds or minutes, typically to maintain the voltage level during the start of theemergency generators (bridging power).
High-energy applications can not supply such a large amount of power, but can sustainit for a much longer period of time. These are used more to shift some electricityproduction. On the basis of the power ratings of storages, pumped hydro, CAES andSMES are large with capacities from tens of MWs up to hundreds MWs compared tocapacitors, different types of batteries and fly wheels, which range from 10 MW down toseveral kWs.
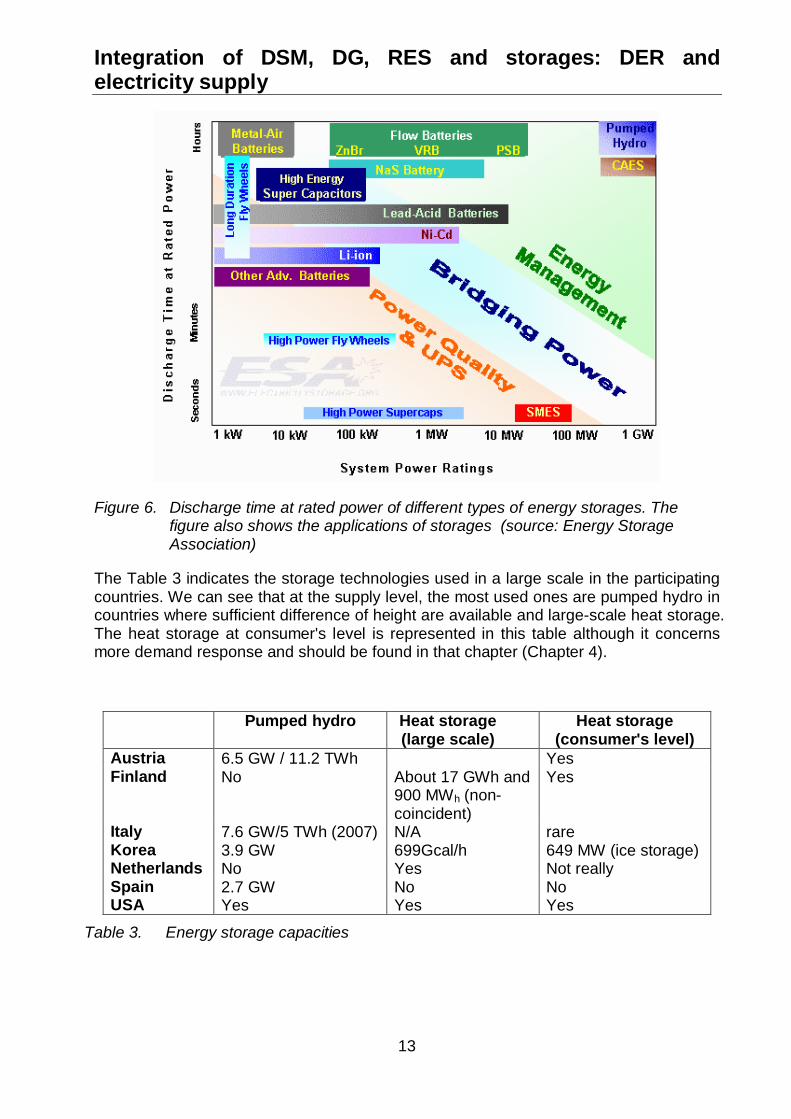
Figure 6. describes the discharge time of different storages. The applicability of differenttypes of storage also depends on the efficiency, lifetime (in operating cycles) andinvestment costs. Especially in the applications of DR these characteristics are important.
If the capital costs are taken into account, pumped hydropower and CAES are thecheapest ones per charge/discharge cycle. But they need to be installed at a specificsite. For the batteries, it can be noticed that the biggest units are built from the best-known technologies (i.e. lead-acid and Ni-Cd). Flywheels seem to be suitable for powerquality systems or for short maintenance of the power. Flow batteries, because the tanksare isolated one from the other, have a slow discharge rate and can be used in energymanagement. They also offer the advantage of lower replacement cost, since only thetanks have to be refilled. In the other batteries, the whole system has to be replaced.Electrochemical capacitors show good qualities and can be designed for different typesof operation, but they are limited in their possible power output.
Concerning our interests for this work, storage technologies are especially useful. Theefficiency and maneuverability of local energy management can be greatly improved byusing storage devices or by exploiting the storage capacities that consumers have on-site. Integrating storage units to a local management system can take the costs down aswell as making new possibilities available.
Integration of DSM, DG, RES and storages: DER andelectricity supply
13
Figure 6. Discharge time at rated power of different types of energy storages. Thefigure also shows the applications of storages (source: Energy StorageAssociation)
The Table 3 indicates the storage technologies used in a large scale in the participatingcountries. We can see that at the supply level, the most used ones are pumped hydro incountries where sufficient difference of height are available and large-scale heat storage.The heat storage at consumer's level is represented in this table although it concernsmore demand response and should be found in that chapter (Chapter 4).
Pumped hydro Heat storage(large scale)
Heat storage(consumer's level)
Austria 6.5 GW / 11.2 TWh YesFinland No About 17 GWh and
900 MWh (non-coincident)
Yes
Italy 7.6 GW/5 TWh (2007) N/A rareKorea 3.9 GW 699Gcal/h 649 MW (ice storage)Netherlands No Yes Not reallySpain 2.7 GW No NoUSA Yes Yes Yes
Table 3. Energy storage capacities
Integration of DSM, DG, RES and storages: DER andelectricity supply
14
3.4 Economic dispatch
One of the goals when integrating various Distributed Energy Resources (DER), and acondition without the concept can not work, is that every actor receives enough paymentor compensation to make it profitable. In the traditional and centralized approach, thefocus is on the optimizing the operation of the system as a whole with centralizedgeneration and transmission, often neglecting the potential of distributed resources.
When more distributed resources are to be integrated, the revenues must also becomedistributed and we can somehow talk of distributed optimization. We should howeverkeep in mind that due to the large number of actors with sometimes contradictoryinterests, even if we could determine a global economical optimized operation, theactual operation is more likely done to suit some other goals.
Distributed market based optimization does not work well if there is not enough variety inthe units to be optimized. Thus a centralized approach is probably often better for theinternal optimization of a local system consisting only of a few DER-units.
Optimization of the operation of CHP units needs to include storage and use of heat, inaddition to electricity and heat production, electricity market and own electricity use. Alsothe constraints imposed by the power distribution and heat distribution networks need tobe taken into account.
The actual control and operation of DER units depends on the optimization strategy,business models applied, physical and ICT infrastructure etc. Later some examples aregiven.
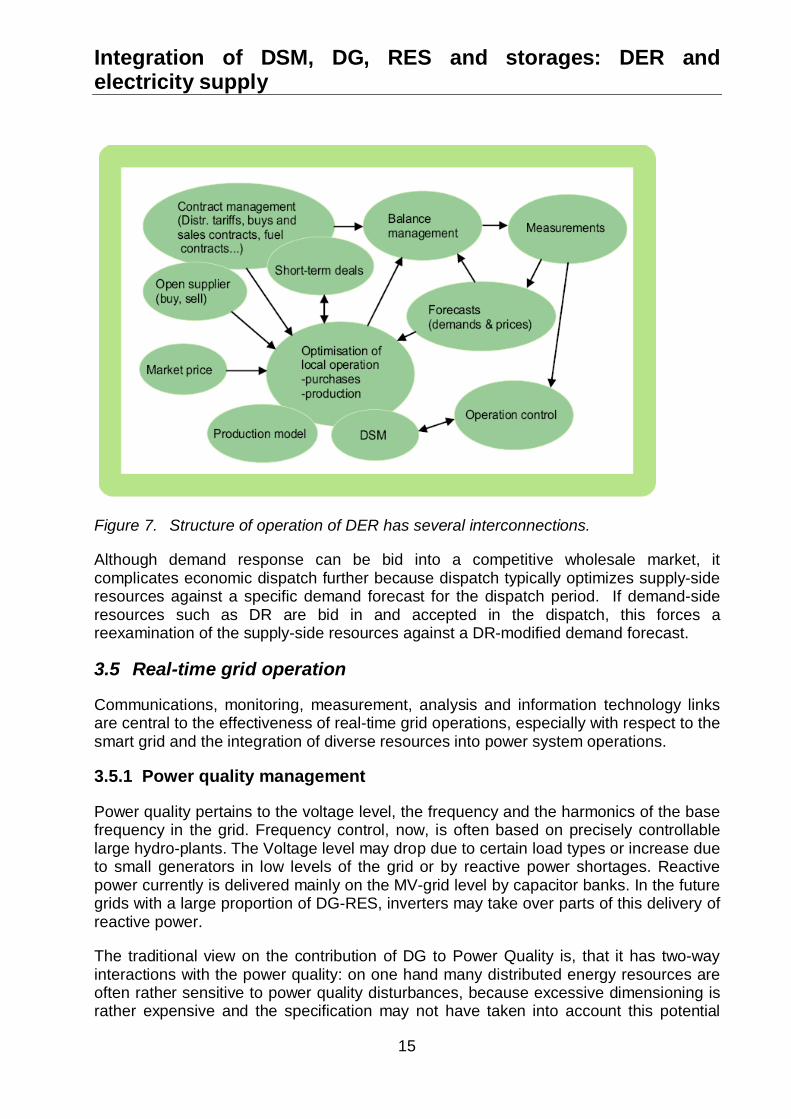
The actual trading and optimized operation of a DER portfolio or virtual power plant incompetitive and unbundled market conditions is complicated, as can be seen from thenext figure. A large number of factors have to be taken into account: different types ofcontracts and short-term deals, variations in market prices of electricity and fuels,balancing conditions and suppliers of imbalances (open suppliers), uncertainties relatedto the consumption and production of electricity and heat, measurements etc.
All these factors affect the optimization of the operation of DER units and on trading ofenergy, and their interconnections are presented as an example in Figure 7. [9].
Integration of DSM, DG, RES and storages: DER andelectricity supply
15
Figure 7. Structure of operation of DER has several interconnections.
Although demand response can be bid into a competitive wholesale market, itcomplicates economic dispatch further because dispatch typically optimizes supply-sideresources against a specific demand forecast for the dispatch period. If demand-sideresources such as DR are bid in and accepted in the dispatch, this forces areexamination of the supply-side resources against a DR-modified demand forecast.
3.5 Real-time grid operation
Communications, monitoring, measurement, analysis and information technology linksare central to the effectiveness of real-time grid operations, especially with respect to thesmart grid and the integration of diverse resources into power system operations.
3.5.1 Power quality management
Power quality pertains to the voltage level, the frequency and the harmonics of the basefrequency in the grid. Frequency control, now, is often based on precisely controllablelarge hydro-plants. The Voltage level may drop due to certain load types or increase dueto small generators in low levels of the grid or by reactive power shortages. Reactivepower currently is delivered mainly on the MV-grid level by capacitor banks. In the futuregrids with a large proportion of DG-RES, inverters may take over parts of this delivery ofreactive power.
The traditional view on the contribution of DG to Power Quality is, that it has two-wayinteractions with the power quality: on one hand many distributed energy resources areoften rather sensitive to power quality disturbances, because excessive dimensioning israther expensive and the specification may not have taken into account this potential
Integration of DSM, DG, RES and storages: DER andelectricity supply
16
problem. On the other hand different forms of distributed power production may disturbthe power quality of the public power supply network. In addition to normal healthystates, also possible faults both in network and in customer installations create needs todetect and manage the power quality.
Thus, the effect of introducing DG-RES in the grid may be positive or negative,depending on whether ICT compensates intelligently for PQ-loss or even aids inincreasing Power Quality. Also automated DR can be used to manage and maintainvoltage on feeders; can be used to manage frequency by feathering on and off loads,and for responsive reserve to replace lost generation.
Power quality measurements are often needed at or near distributed power production,especially if the level of power produced is high compared to the source impedance ofthe network. In general, power quality and its measurements are usually more importantinside the premises of the customer of the power distribution company than in the publicpower distribution network. Thus the customer, either local generator or user ofelectricity needs power quality measurement results.
Measurements of voltage level, voltage interruptions, and voltage dips are most oftenneeded preferably permanently. Keeping the voltage levels within standards may requirelimiting temporarily the operation of distributed power production. It may also setconstraints on the operation of the power distribution network. Tuning the response ofprotection systems of DG to voltage dips and short interruptions becomes more criticalin networks where voltage dips are frequent for example due to network protectionbased on auto-reclosure sequences. Some types of distributed power production,especially fixed speed wind power plants, have such fluctuations in their output powerthat cause visually disturbing flicker of incandescent lighting. Measurements of flickerseverity indices may be needed in such sites. Variable speed technology is much lesslikely to produce flicker but produces harmonics and possibly also some interharmonics.Distributed power production has often also reactive power compensation that maycreate a resonance that amplifies harmonics and interharmonics. Faults, blown fuses,erroneous grounding or unbalanced loads in customer installations or networkcomponents may cause power quality problems, such as severe asymmetry or DC-component that need to be detected rather quickly in order to avoid further damage ortripping protection of DG. If DER is used as a separate island, also the fundamentalfrequency needs to be measured for monitoring and control purposes.
The short-circuiting behavior of high DG-RES grids deserves extra attention, becausecurrents flow differently as compared to a completely hierarchical grid. This also holdsfor black-starting strategies.
As seen above, DERs increase the needs for voltage quality monitoring. However, anadequate overall view of the voltage quality can be obtained by permanentmeasurements at some critical points in the power distribution network. There is no needto install specific power quality monitoring instruments to a large number of small DERunits. On the other hand communication infrastructure is necessary for aggregating orcoordinated scheduling – e.g. Virtual Power Plants. Monitoring of the generation is oftendesired even at small DERs.
Integration of DSM, DG, RES and storages: DER andelectricity supply
17
3.5.2 Protection
There may be measurement needs related to monitoring the operation of powerdistribution protection and DER protection. These are mainly measurements of powerquality quantities that the protection uses for tripping such as the fundamental frequency,voltage levels, voltage asymmetry and voltage dips. Measurements directly used tocritical protection typically require fast response (roughly speaking 10 milliseconds fromdetection to tripping), high reliability and independence from other systems. Due to theserequirements long distance data communication is avoided. Thus a general-purposemeasurement system does not provide measurements for protection equipment andsystems. However, DER increases the need for coordinating, tuning and monitoring theoperation of protection equipment dispersed over the power distribution network. Somemeasurement data for this purpose may come from or via other systems. It is alsobecoming more and more common, that protection equipment and systems provide theirmeasurements to other systems thus reducing the need to install parallel measurements.
With an increased share of DER in the network, and especially of DG units, somenetwork operators require that the protection equipments are not too sensitive. Forexample in Spain (and Germany for all DGs connected to MV networks from 2009 on),wind turbines must be able to ride through a defined voltage dip before access to thenetwork will be granted (so-called fault ride-through capability). The reason behind thisrequirement is that if at time of a voltage dip, all the wind turbines disconnect from thenetwork due to their protection equipment, the situation on the network may worsen.
3.5.3 Distribution automation
Power distribution automation needs measurements for load forecast and for real-timemonitoring of the network state and power flows. These include measurements of activeand reactive power, currents and voltage levels. With this information the network statecan be estimated, predicted and controlled more accurately. Power distributionautomation typically does not have enough measurements from the customerconnection points, because the costs of extending the distribution automation systemthat far are relatively high. The same measurements are often available in or can withminor costs be added to other automation and measurement systems and transferredfrom there to the distribution automation system. In recent years, utilities are undertakingextensive advanced meter installations with the intention that the communicationssystem installed to support the advanced meters will be used as the communicationsplatform for distribution and transmission system automation.
Modern network state estimation tools are able to use these measurements to improvethe accuracy of the state estimation and the estimation models. In this kind of use ratherlong measurement delays and some missing measurements can be tolerated. However,situations needing rather fast reaction may occur, which requires the possibility to sendalarms. It is also useful to give some power quality information to power distributionautomation so that it can be taken into account when operating the network. Powerdistribution automation may sometimes need temperature measurements of distributiontransformers, for example, in order to know how much they can be loaded. Automationof the distribution of other energy forms, such as natural gas and district heat, may alsoneed information from the DER connection point. Possible solutions in high-DG RES
Integration of DSM, DG, RES and storages: DER andelectricity supply
18
grids for quick fault location are fault passage indicators. In high G-RES grids a moregranular approach is necessary to find and resolve faults.
The communication needs between DER and power distribution automation systemsdepend on the size and penetration of DER. Standard IEEE 1547-2003 states that eachDR (distributed resource) unit or aggregate of 250 kVA or more at a single PCC shallhave provisions for monitoring its connection status, real power output, reactive poweroutput, and voltage at the point of DER connection. The standard EN 50438, whichdeals with microcogeneration units (less than 16A per phase with some nationalexceptions, 16A per phase is a little over 10 kVA in three phase connection), does notrequire any communication between microcogeneration and power distributionautomation. The new German interconnection guideline for DGs (e.g. inverters of PV-systems) connected to MV networks requires, beside fault-ride-through (behavior underfault conditions) the capability of the active and reactive power control, and generationmanagement. It could be expected, that these guidelines will extend to the distributionnetwork connected DGs in the near future.
The IEC 61850 standard deals with Communication structures in Substation Automation.Part 7-420 (currently in state “for voting”) deals with Communications systems fordistributed energy resources (DER) – the information model, information exchange andservices for control of DER. (See Annex 1)
Integration of DSM, DG, RES and storages: Flexibility in theelectricity demand
19
4 Flexibility in the electricity demandThis chapter discusses on the utilization of flexibility as a distributed resource. Itdescribes shortly the demand-side resources and automatic and price-based demandresponse.
4.1 Demand-side resources
The availability of the demand response resources (and to a lesser degree, energyefficiency) means that consumers may have some flexibility in how and when they useelectricity. This means that given both the ability to easily manage their electricity useand information about its value, they can be willing to change that usage. Some part oftheir consumption can be shifted in time or simply suppressed. Typical flexible loadsinclude different types of industrial processes, e.g. groundwood plants and mechanicalpulping plants, electrolysis, arc furnaces, rolling mill, grinding plants, extruders, gascompressors, etc. In the commercial and residential sectors flexible loads can includespace heating, water heating, cooling, ventilation, lighting, etc.
Theoretically almost all electricity consumption is flexible if the electricity price is highenough. In that sense the potential for demand response is huge. In practice thepotential depends on several factors, like information or warning in advance of actualdemand response, duration and timing of demand response, technical processes andICT, metering and automation solutions at end-users, and economic benefits andpricing/contracts. The availability of enabling technologies such as in-premiseautomation facilitates customers’ responsiveness to price signals and other demandresponse triggers.
In practice, different types of potentials can be defined. Technical potential is theamount of load reduction that would be realized if all eligible customers adopt DRmeasure(s) without regard to economic or market barriers. Economic potential is theamount of technical potential that would be realized from DR measures that meetspecified economic criteria like pay-back time of investments or anticipated revenuefrom DR. Market or achievable potential is the amount of load reduction that couldrealistically be achieved by an actual DR program over a certain period of time.
4.2 Automated demand response devices
Often, it is easier and thus preferable for the consumer to be able to make its demandresponse automated. Devices exists that can control some loads automatically [10,].Most often, that type of devices receives a signal such as an alarm or a price signal andcontrol loads accordingly. In most cases, consumers accept that type of device only ifthere is a possibility to override the automated control and to adapt or change the controlstrategies. More will be said about these signals and the way loads can be remotelyoperated in the communications and IT chapter.
4.3 Pricing granularity or smart rates
We have chosen the term of price granularity to express at what frequency consumerssee the price of their electricity vary in time. The first element regarding the granularity is
Integration of DSM, DG, RES and storages: Flexibility in theelectricity demand
20
that it is closely related to the metering capability at the consumer's premises. If theconsumers are submitted to for example night and day tariff (ToU-tariffs), their metermust be able to distinguish between the energy consumed in each different rate periods.Otherwise, the consumption is calculated based on a scenario and doesn't take intoaccount any effort taken to respond to the prices. Shorter, more detailed pricing periods– e.g., real-time pricing or various peak pricing rates (e.g., critical peak periods) requireadvanced interval meters to record customers’ period-specific energy use and chargethem accordingly. Therefore more flexibility is needed in pricing, or for example powerline communication (PLC) is used to switch the loads on and off.
In most of the participating countries, large consumers have hourly (or half-hourly)meters and tariffs. But when it comes to smaller consumers, the spread of hourly metersis a lot smaller, or even non-existing. It is quite common, however, that small consumershave night and day tariff or tariffs that vary from day to day.
The main obstacle to introduce more price granularity at consumer's level is the costs ofinstalling and monitoring the meters. Our opinion is that it can become profitable in nearfuture as the prices of fuel go up, the price volatility increases due to a larger share ofrenewables and as low voltage systems become more integrated and new sources ofrevenues are developed.
4.4 Customer response and production
In all the participating countries, demand response is present to some extent. The mostcommon DR scheme is the time of use tariff (ToU) or the real-time pricing. These areschemes where consumers see different electricity price according to the time of the day.In ToU tariffs, the price vary only between a few values (typically day or night forexample) while in real-time pricing, the price is linked to the spot market trade. Moreover,interruptibility contracts for industrial customers, considered within indirect load controlinitiatives, have been widely deployed for power balancing in most countries, at least inEurope and USA.
The best known type of DR that is commonly used in the participating countries is theload shedding, in order to help the transmission system operator in case of criticalsituations, such as avoiding a blackout (congestion management) or restarting thesystem after one. This type of DR is not included in the table in order to be able to makethe difference with the direct load control programs where some consumer's appliances(often air-conditioning or water heating devices) are controlled directly by the energyretailer.
In addition to these programs, in some countries consumers that are large enough or anaggregation of consumers can act directly on power exchanges or on other servicemarkets such as ancillary or regulating power services. There is however a reluctance ofthe balance responsible party, often the TSO, to accept the participation of smallconsumers.
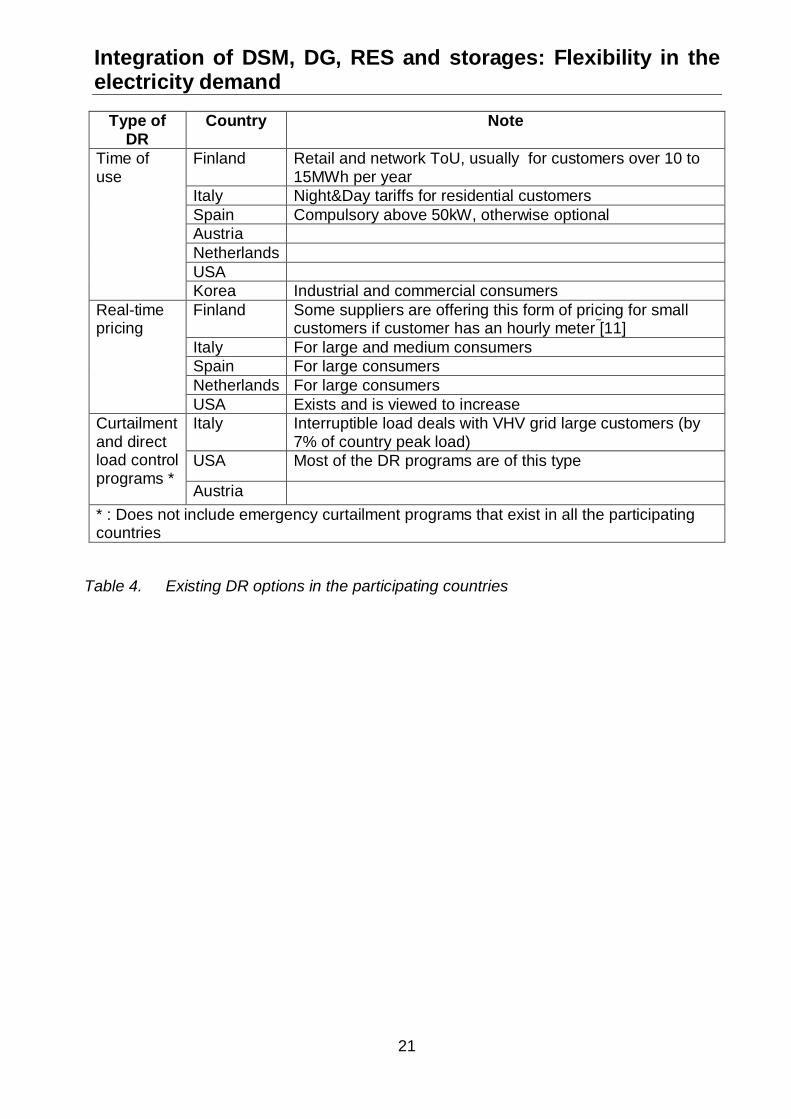
Integration of DSM, DG, RES and storages: Flexibility in theelectricity demand
21
Type ofDR
Country Note
Finland Retail and network ToU, usually for customers over 10 to15MWh per year
Italy Night&Day tariffs for residential customersSpain Compulsory above 50kW, otherwise optionalAustriaNetherlandsUSA
Time ofuse
Korea Industrial and commercial consumersFinland Some suppliers are offering this form of pricing for small
customers if customer has an hourly meter [11]Italy For large and medium consumersSpain For large consumersNetherlands For large consumers
Real-timepricing
USA Exists and is viewed to increaseItaly Interruptible load deals with VHV grid large customers (by
7% of country peak load)USA Most of the DR programs are of this type
Curtailmentand directload controlprograms *
Austria* : Does not include emergency curtailment programs that exist in all the participatingcountries
Table 4. Existing DR options in the participating countries
Integration of DSM, DG, RES and storages: Communicationsand IT
22
5 Communications and ITThis chapter describes the communication, monitoring, metering, automation andintelligence questions related to the DER integration.
5.1 Communication networks
Total costs for installation of specific communication network and infrastructure willincrease non-linearly and converge when a certain density and penetration of ICT isreached. Initially, the costs per network node at a certain voltage level are highest.Replication in ICT generally leads to fast decrease of component cost.. The efficiencysavings for the customers will be linearly increasing with the numbers of participants.Most communications networks enabling smart grid and DER integration are installedwith advanced metering infrastructure. Once that communications network is installed,transmission automation and distribution automation can use that system. Also,advanced meters enable distributed intelligence and time of use rates and activedemand response.
Public communication networks exist and are operational. Most of the pilots conductednowadays utilize public TCP/IP networks, such as the public or private Internet in orderto transmit information. Some other technologies, such as radio or cell phonecommunications are also possible in areas where the Internet access is not possible ortoo expensive to install, although a convergence of Internet technology currently istaking place in which the communication medium is transparent.
5.2 High-speed digital monitoring
In order to have a flexible and adaptable system, it is necessary to have a great deal ofhigh-speed digital monitoring. The technologies and techniques for generationmonitoring already exist and are used for large-scale generation and also for some DGunits.
The transmission networks are also monitored in real-time with, among others,information about the energy flows and about the power quality at the system's nodes.
At the distribution level, the monitoring is limited by the deployment of smart meters orexists only partly in new or refurbished substations.
5.3 Smart meters deployment
There is no single definition of smart metering, however all smart-meter systemscomprise an electronic box and a communications link. At its most basic, a smart metermeasures electronically how much energy is used in a certain time-interval, and cancommunicate this information to the utility. This information can be shared with end-usedevices to let the customer see how much energy they are using and how much it iscosting them [12]
Definitions of smart metering are discussed in more details for ex. in [13]. Smartmetering may have the following features:
Integration of DSM, DG, RES and storages: Communicationsand IT
23
Automatic processing, transfer, management and utilization of metering data
Automatic management of meters
2-way data communication with meters allowing control functions by a serviceprovider
Provides meaningful and timely consumption information to the relevant actors andtheir systems, including the energy consumer
Supports services that improve the energy efficiency of the energy consumption andthe energy system (generation, transmission, distribution and especially end-use)
The deployment of smart meters is still in an early phase in many countries. But manyinitiatives and plans have been launched recently to accelerate the deployment, andsome countries like Italy already have almost 100 % penetration of smart meters. Drivenby directives on energy efficiency in the EU, it seems that during next few years thedeployment of smart meters will be forced in several European countries.
In most countries there are no adequate requirements for functionality of smart meters.The lack of common requirements increases costs of smart metering systems andmakes it expensive to develop, maintain and implement market applications andservices that are based on smart meter data. Some examples of common minimumrequirements for smart meter functionality can be found [14, 15].
The frequency or duration of meter intervals depends upon the electricity provider’s tariffand rate designs. The requirements for billing metering stem from the tariffs applied. Inprinciple, it is not necessary for the metering system to know the tariff applied. It isenough that the meter meters both the consumption and production of active andpossibly reactive power separately (so called four quadrant metering) with the timeresolution required for the tariff. In the Nordic countries this time resolution is 1 hour, insome other countries it is 15 or 30 minutes. Consumption and customer-initiatedgeneration usually have different tariffs. Meter data can be stored in the meter for daysor weeks before it is transferred to the utility’s meter data management system. The datamust be reliable and accurate. Lost or erroneous data may cause significant costs, buttransactional communication mechanism can avoid this.
Apart from solid ‘back-office’ applications receiving the metering data, detection of meterfaults, erroneous installation and tampering is useful. Compensations for long voltageinterruptions are also quite often included in the billing. Compensations for some powerquality defects are also tentatively considered. Thus registering of voltage interruptionsand perhaps even some basic power quality characteristics may be required for thebilling meters of the future.
Data communication with the meter shall be such that the accuracy of the measurementdata produced by the meter is not reduced due to data communication. The accuracyrequirements of static billing meters are defined in IEC 61036 standards. It is reasonableto require that the hourly or 15 minute values required by the tariff maintain the originalaccuracy. In other words the data communication may not be the biggest source ofmeasurement error. Typical source of such unacceptable inaccuracy is too large pulse
Integration of DSM, DG, RES and storages: Communicationsand IT
24
size of pulse metering, because in some countries such recommendations for billingmetering pulse size are commonly applied that do not meet this criterion.
5.4 Interoperability
Technical regulations, together with market regulations, can have a major impact on thedevelopment of distributed generation systems. Those technical protocols reflectemerging interoperability across elements of the electricity system, which affects howeasily devices can connect and information can flow across the system. For DERresources to succeed and contribute most effectively to the grid, they will need bothstandardized physical interconnections to the networks and standardized informationexchange. Interoperability can hasten DER integration; the lack of interoperability canslow or obstruct installation of DG and effective interactions between devices, device-go-grid, and back-office integration by the grid operator.
A large number of international standards have been developed or are underdevelopment for the connections of different types of DG. These are, however, voluntaryunless a specific organization or legislation requires adopting these standards. Hence,worldwide there are a large number of additional national or regional standards,requirements, guidelines, recommendation or instructions for the interconnection of DG.
Regarding the connection of DG to an electrical network, different working groupselaborate on the development or maintenance of standardized documents. Europeancountries significantly participate in the International Electrotechnical Commission (IEC)and in European Committee for Electrotechnical Standardization (CENELEC). Parallel tothese and partly in co-operation the standardization work in the Institute of Electrical andElectronics Engineers (IEEE) is going on.
These working groups were concentrating initially on one type of DG, taking into accountalso the connection aspects to the electricity network. However the basic principles forinterconnection are common and do not always depend on the type of DG. Therefore, amore recent approach comes up, where connection of a DG is treated irrespective of thetype of ‘primary’ energy.
Annex 1 gives the summary on the most relevant standardization work.
Data communications architecture and application object models for DER are describedin draft standard proposals such as UCA-DER and IEC 61400-25. These are based onIEC 61850 standards and their scope and point of view are around power distributionautomation. In the UCA-DER and IEC 61400-25 draft standard proposals, electricitymarket interface, DER and load management issues are not included and the possibleseparation of distribution and trade businesses is not taken into account. While theseand other IEC 61850 based standards deal with automation issues the CommonInformation Model (CIM) for power system energy management is defined in thestandards IEC 61970-301:2003 (Energy Management System Application ProgrammingInterfaces EMS-API) and IEC 61970-302:2004. The objective of CIM is to support theintegration of between EMS systems, or between an EMS and generation anddistribution management systems.
Integration of DSM, DG, RES and storages: Communicationsand IT
25
Very little work has been done to promote interoperability for demand response devicesrelative to the electric system; to date, most interoperability for DR has focused on in-premise automation, communications and information technology.
5.5 Functional Automation/Monitoring
Building automation and other electricity end-use automation often include energymanagement that controls and monitors end user's loads. Time resolution of about 1minute is typically needed and long delays are unacceptable, when the measurementsare used in control loops or observed online. Often the systems are monitored from aremote control centre. Alarms from abnormal load behavior are useful.
About the monitoring, for individual loads and appliances, it is needed for
- development and updating of load models and forecasts- verification of control response- some load control strategies.
Time resolution of 1 to 10 minutes is usually adequate for modeling and verificationpurposes. Modeling and verification tolerate delays of several days, but faster responsemakes these tasks more efficient.
When using some type of load control strategies, particular end user’s loads orappliances may require individual monitoring capabilities. Such load control strategiesare usually developed for residential customers and imply that the proper infrastructureis deployed within end user’s facilities in order to transmit the information from individualappliances to the control centre. If we want to have a significant amount of controlledload, many residential customers have to be monitored and the cost of real timemonitoring of many individual residential appliances is high. Even if one-minute timeresolution is very desirable, delays of 5 or 10 minutes could be acceptable, if very fastresponse is not compulsory.
Due to the high communication costs of minute level data at large number of residentialcustomers other methods are usually applied to define demand response of smallcustomers like feeder based measurements and statistical analysis.
5.6 Intelligence/Smart behavior
5.6.1 Load modeling
Often the purpose of load modeling is to create and update models for hourly loadcurves. Even then it is essential to understand the behavior of loads and better timeresolution is needed for that. Also verification of load control responses requires timeresolution of one or some minutes. Otherwise the responses cannot be accuratelydistinguished from other load variations. Often both active and reactive powers need tobe registered.
Load models are also developed for the prediction of the response to controllable loads.Then time resolution of some minutes is typically needed. Loads to be modeled mayalso include DG.
Integration of DSM, DG, RES and storages: Communicationsand IT
26
5.6.2 Automation of distributed energy resources (DER)
The requirements of DER-automation depend very much on the type of DER in questionand on the way DER is operated: mainly customer-operated or utility/aggregatoroperated. Control, management, and state and condition monitoring are typical DER-automation functions. There are needs to send alarms on exceptional situations tocontrol centers. Maintenance checks of far-located DER-processes and equipment needto be as automatic as possible. The same applies also for the possible fuel supply chainof DG. Significant costs are saved, if problems can be solved based on remote expertadvice instead of requiring the expert to travel long distances. Also energy trading needsadvance information on DG failures and maintenance stops. Remotely readablemeasurements are needed for such purposes. At some DER installations there may notbe any such DER-automation system that could transfer measurements to a remotecontrol centre. Thus the electricity measurement system may need to transfer also someother measurements. Some examples on the DER automation exist like [16].
Metering systems may transfer DER-management commands, time variable tariffs andweather forecast data for use in optimization of DER operation. Local trading systemmay also interact with energy markets by exchanging offers and contracts, but probablythese functions are outside the scope of metering systems.
5.7 User/primary process feedback
In several studies it has been shown that customer behavior can be affected by thefeedback and information. In IEA DSM Task XI three main mechanisms were identifiedby which smaller customers can be motivated to change behavior, save energy and berewarded for making the changes [17]:
End Use Monitoring and Feedback (EUMF): customers are presented with abreakdown of their individual end uses of electricity, its costs and environmentalimpacts and are motivated to make general energy savings
Time of Use (TOU): electricity customers are presented with different prices forelectricity at different times and respond by shifting demand from high to low costprice periods. A variation of this motivating mechanism is Dynamic TOU pricingwhere customers can change their use of electricity with reasonably short noticetimes (typically 24 hours notice) in response to notified price changes.
Demand Side Bidding (DSB): customers participate in energy trading, bycontracting specific demand changes in response to requests by System Operatorsor Suppliers (for ex. an offer to deliver a specific change in energy use when the spotmarket price hits a specific level). Dynamic TOU pricing is a valuable motivator fordelivering DSB, which can deliver energy saving as a result of reduced systemlosses and reserve generation capacity and overall increases in operationalefficiency.
Customers also respond strongly to reliability events, enrolling to deliver acontracted response when called to do so by the grid operator. These measurescan include direct load control, instantaneous interruptible load, and similar programs.
Integration of DSM, DG, RES and storages: Communicationsand IT
27
More detailed discussion on the effect of the feedback and the related technologies isgiven in the report [18]. Recently new technologies are coming into market where thefeedback from the meters can be obtained at customer displays either directly from themeters or indirectly from the service providers.
5.8 Intelligent agents and distributed controllers
The integration of a DER portfolio can be done following the concept of the VirtualPower Plant (VPP). Although the size can vary, the concepts found are very similar. Wecan however make the distinction between two types of integrated DER portfolio. Thefirst one is purely commercial and aims at aggregating units in order to mitigate risks andto be able to act on the different power or capacity markets. The other one is the smartgrid concept and includes technical aspects such as local network management.
From the technologies point of view, both VPP systems have elements in common. Theyare often organized with a central unit gathering information from smaller dispatchedunits and sending them orders according to the market or network situation. As it hasbeen discussed already, the collection of metered data as well as the orders can havedifferent forms and be realized with different time scales.
The information sent from the dispatched units can include:- consumption / production of one or several resources- amount of available flexible power and its price bidding- confirmation that an order has been realized as required- situation on the network
And the information from the central unit to the dispatched ones can be:- direct orders or requests (such as time schedules)- remote control signals- prognosis data- price signals
Sending price signals seems to be the most convenient way to control dispatched units.The local units can then transform these price signals into direct control or into an alertto the consumer.
The Figure 8. represents the architecture most commonly found in current VPP projects.Not all projects have all these interactions with the different actors. Also, a single localunit can operate several different local resources or some smaller local units withoutthose units located in the same physical area.
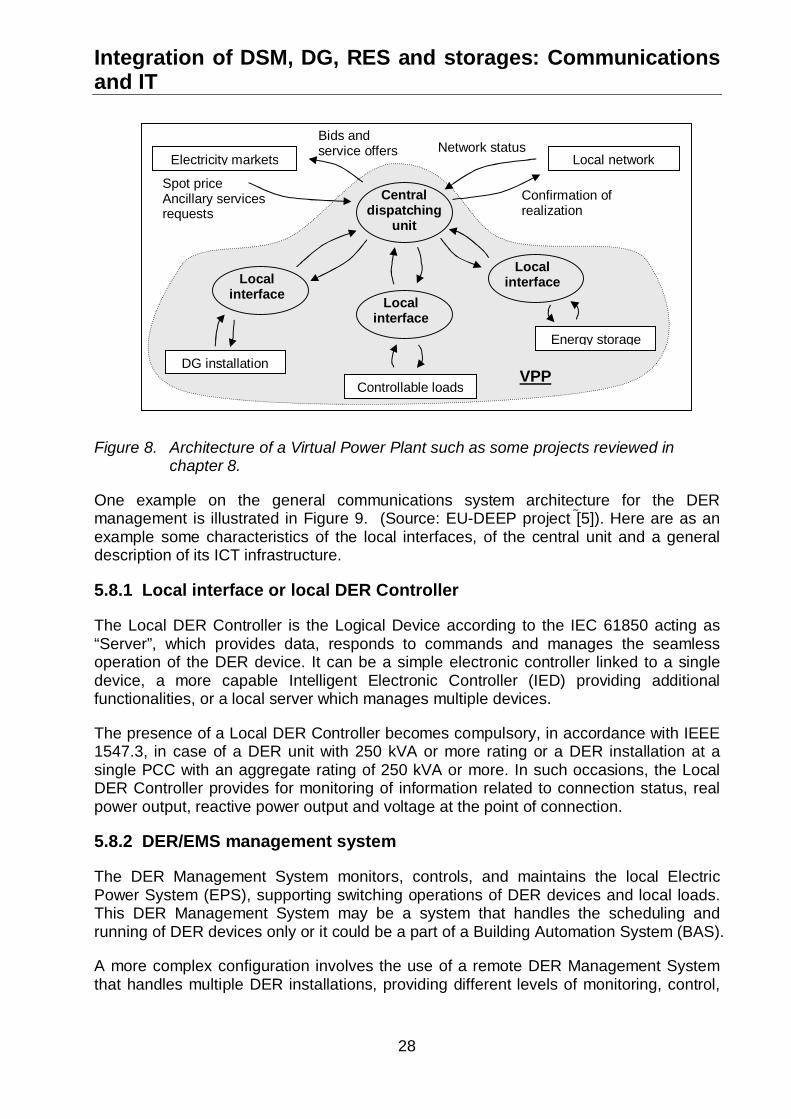
Integration of DSM, DG, RES and storages: Communicationsand IT
28
Figure 8. Architecture of a Virtual Power Plant such as some projects reviewed inchapter 8.
One example on the general communications system architecture for the DERmanagement is illustrated in Figure 9. (Source: EU-DEEP project [5]). Here are as anexample some characteristics of the local interfaces, of the central unit and a generaldescription of its ICT infrastructure.
5.8.1 Local interface or local DER Controller
The Local DER Controller is the Logical Device according to the IEC 61850 acting as“Server”, which provides data, responds to commands and manages the seamlessoperation of the DER device. It can be a simple electronic controller linked to a singledevice, a more capable Intelligent Electronic Controller (IED) providing additionalfunctionalities, or a local server which manages multiple devices.
The presence of a Local DER Controller becomes compulsory, in accordance with IEEE1547.3, in case of a DER unit with 250 kVA or more rating or a DER installation at asingle PCC with an aggregate rating of 250 kVA or more. In such occasions, the LocalDER Controller provides for monitoring of information related to connection status, realpower output, reactive power output and voltage at the point of connection.
5.8.2 DER/EMS management system
The DER Management System monitors, controls, and maintains the local ElectricPower System (EPS), supporting switching operations of DER devices and local loads.This DER Management System may be a system that handles the scheduling andrunning of DER devices only or it could be a part of a Building Automation System (BAS).
A more complex configuration involves the use of a remote DER Management Systemthat handles multiple DER installations, providing different levels of monitoring, control,
Bids andservice offers
Spot priceAncillary servicesrequests
Confirmation ofrealization
Network status
Centraldispatching
unit
Electricity markets Local network
Energy storage
DG installation
Controllable loads
Localinterface
VPP
Localinterface
Localinterface
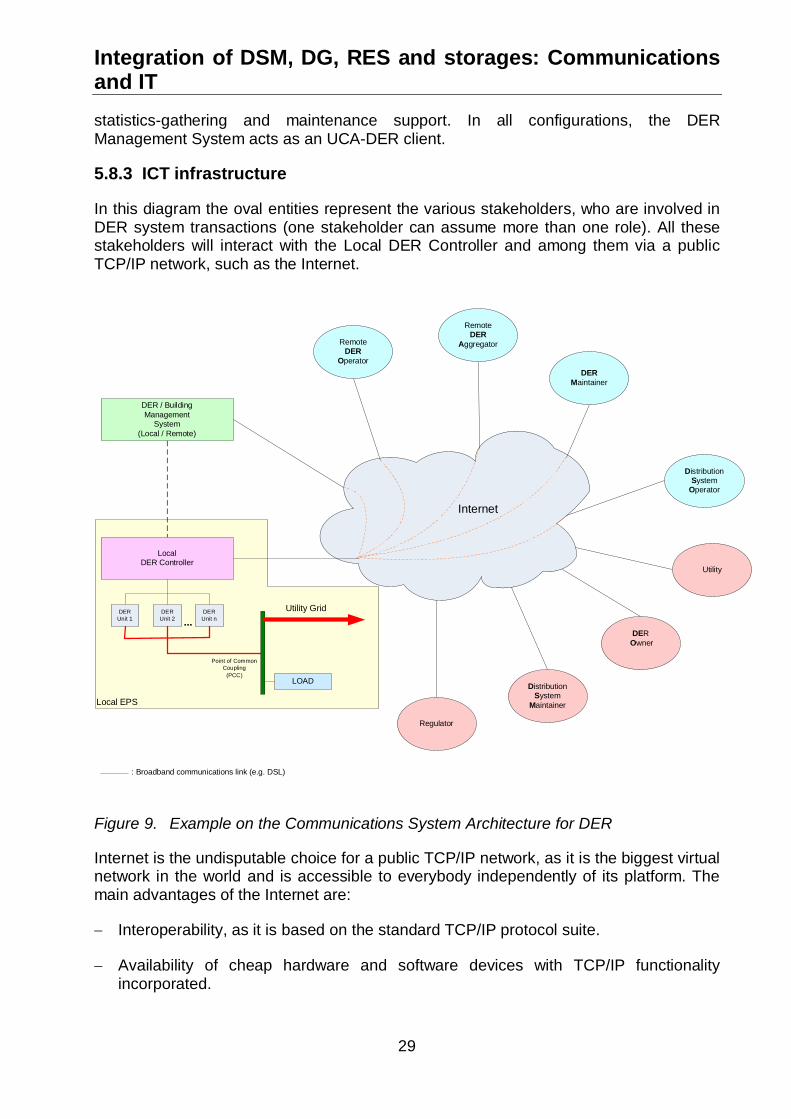
Integration of DSM, DG, RES and storages: Communicationsand IT
29
statistics-gathering and maintenance support. In all configurations, the DERManagement System acts as an UCA-DER client.
5.8.3 ICT infrastructure
In this diagram the oval entities represent the various stakeholders, who are involved inDER system transactions (one stakeholder can assume more than one role). All thesestakeholders will interact with the Local DER Controller and among them via a publicTCP/IP network, such as the Internet.
Local EPS
LocalDER Controller
DERUnit 1
DERUnit 2
DERUnit n
Point of CommonCoupling
(PCC)
Internet
LOAD
DER / BuildingManagement
System(Local / Remote)
Utility Grid
RemoteDER
Operator
RemoteDER
Aggregator
DERMaintainer
DistributionSystem
Operator
DEROwner
DistributionSystem
Maintainer
Regulator
Utility
: Broadband communications link (e.g. DSL)
Figure 9. Example on the Communications System Architecture for DER
Internet is the undisputable choice for a public TCP/IP network, as it is the biggest virtualnetwork in the world and is accessible to everybody independently of its platform. Themain advantages of the Internet are:
Interoperability, as it is based on the standard TCP/IP protocol suite.
Availability of cheap hardware and software devices with TCP/IP functionalityincorporated.
Integration of DSM, DG, RES and storages: Communicationsand IT
30
However, using the internet can expand network vulnerability to cyber security, creatingsecurity and redundancy challenges that become important for maintaining reliable gridoperations.
TCP/IP uses several protocols, which provide very scalable routing properties and canselect reliable or unreliable communication, depending on the needs of the applications.If timely transmission is required, UDP (User Datagram Protocol) is often selected foruse, but also other transport layer protocols can be developed for special purposes.Power system communication protocol standards use special communication protocols(IEC 61850 GOOSE and GSSE protocols) for time and safety critical communication.
In order to satisfy the requirement for wideband communications, the high speedInternet access Digital Subscriber Line technology (DSL) is proposed with speeds, whichdepending on the application needs, can vary from 128 kbps up to several Mbps. . DSLtechnologies use sophisticated modulation schemes to pack data onto copper wires andoffer high speed communication. The local site may have several DER units andautomation systems in the same site and they are connected via a switch to a DSLrouter. The site has also functionalities for the DSL modem, VPN and firewall. The mostimportant VPN technologies are probably IPsec/IKE and MPLS. This way, securedtunnels can be provided between parties (Local site, DER Aggregation, DER unit andelectricity market), the basis for security in Internet is achieved by VPN technology, butother technologies and methods of defense are necessary in addition.
Within the Local DER Controller, the UCA-DER architecture is adopted, as it ensuresinteroperability and compatibility with the TCP/IP standard. The Local DER Controlleracts as an UCA-DER server and every user, who wants to communicate with it, acts asan UCA-DER client.
For communication exchanges between any two stakeholders, the proposedarchitecture is Web Services, as it constitutes the standard technology today forBusiness-to-Business applications and guarantees interoperability.
For DER System control functions, in particular, there are some instances such asprotection mechanisms, whereby there is a demand for fast response times (e.g. 10msfrom detection of the problem to tripping, the transfer of trip and breaker status is veryfast, maximum end-to-end transfer time is typically specified between 3-10 msec,according to IEC 61850). This type of action requires high reliability and predictabilitythat the Internet cannot guarantee. As a result such functions should be decided andexecuted locally by the Local DER Controller. However, for many remote automationapplications the requirements are significantly less strict and the performance of theInternet is satisfactory.
Integration of DSM, DG, RES and storages: Integrationanalytics
31
6 Integration analyticsThis chapter is mainly describing the tools and methods available for the analyzing theeffects of integration to the energy systems. It is mainly based on the survey done byVTT and is not in any sense comprehensive, but more or less illustrative. Acomprehensive survey would require a larger group of experts, who have first-handexperience of using many tools.
6.1 Analytical tools and analysis methods for the assessing theeffects of integration
6.1.1 General description of the tools
With DR, DG, storage and smart grid technologies we may be able to solve problemssuch as network congestion, high transmission losses and supply variation from variablegeneration, including wind power, run-of-river hydro power and CHP. It is difficult toknow by manual inspection how to implement them in a way so that we achieve a goodcost/benefit ratio. Analysis tools can help in making the right kind of investments at theright time. After the investment has been made, different tools can help in operating theresources in a way that the owner's and (hopefully) the system's benefits are maximized.They can also show the physical effects of DER penetration on the network. Certaintools can also be used for finding the right kind of incentives to promote investments,taking into account their externalities and system security. Without these tools, we donot yet understand the technical ramifications and consequences of such integration, norcan we estimate the benefits from enacting policies to push integration faster.
The tools that we have considered are mainly high-level software tools, which, while notabsolutely necessary, can support decisions concerning energy policy and investmentsand operation of DER. Some of the tools can also be connected into a larger automatedsystem including also hardware components such as meters. There are few tools whichhave been built specifically for the analysis of integration of demand response withdistributed generation, storage, or smart grid technologies. However, many tools allowthe addition of a demand response and a distributed generation and/or a storagecomponent. When network effects such as congestion and losses are not considered,demand response can be considered as one form of DG. Certain forms of DR and DGalso inherently contain energy storage.
6.1.2 Classification of tools
We divided the tools according to their purpose into following classes:
resource planning and policy analysis tools, energy flow and market integration tools, power system analysis tools, customer level simulation tools, operation optimization tools forecasting tools
Integration of DSM, DG, RES and storages: Integrationanalytics
32
Resource planning and policy analysis tools perform macro-scale analysis, whichdoes not only include technical but also economic variables. They can calculate theeconomic effects of introduction of DR, DG, and (some tools) storage, into the powersystem. These tools work with time scales up to several decades, and normally do notgo beyond one hour time resolution. They can calculate things such as
Power demand (and duration curve) development trends, costs of maintaining the current power generation system and expanding the system
with different alternatives, analysis of alternative future scenarios in terms of cost, emissions and security, effects of taxes, subsidies and emission limits.
The drawback of these tools is that they can easily lull an inexperienced user into a falsesense of security. Often the tools require projections of fuel prices, industry trends,consumption patterns, etc. into distant future. These are inherently difficult to predict.One should perform quite an extensive sensitivity analysis to get an understanding ofthe performance of different policies or investment plans under future uncertainty. Inaddition, one should remember that even with perfect forecasts of relevant parametersthe models can make errors because of their imperfect description of reality.
Energy flow and market integration tools can calculate the coincident load in certainarea, or its probability distribution. They may be able to simulate supply, too, for exampleby performing system-level economic dispatch optimization. This way they may be ableto produce price forecasts and transmission bottleneck forecasts.
Power system analysis tools do the detailed physical simulation of power (or fluid)network. They can be used for planning, design, control and optimization of powersystems and their performance. This becomes more and more important whenpenetration rate of distributed generation increases. There are new potential gridproblems that might arise. Low-loaded lines and cables tend to become capacitive,which might lead to over-voltages and instability of power plants. These problems canbe identified with network simulation. Components such as power lines, relays,appliances, transformers and generators can be included in the simulation. The toolscan be for example used when deciding the location of a DG unit, although other factors,such as fuel supply, which are out of the scope of these tools, also have to be taken intoaccount. Different simulation tools are available for gas networks. They are relevantbecause CHP units often use natural gas as fuel.
Customer-level simulation tools are simulation tools for single building or a group ofbuildings, or an industrial facility. They calculate heat and power consumption atcustomer sites and possibilities for consumption control. Heat consumption is relevantbecause the customer may have electric heating or consume heat produced by a CHPunit. Some of them can forecast demand response and the subsequent payback peak,when consumption is larger than normal.
Operation optimization tools suggest the optimal way to operate DR, DG and storageson the electricity market. The reason for needing these tools is that usage constraints.For example, we may not ask DR from a customer more than two hours per day,therefore we must consider the opportunity cost of not being able to use it at some othertime during the same day. There are also uncertainties in the price that is received from
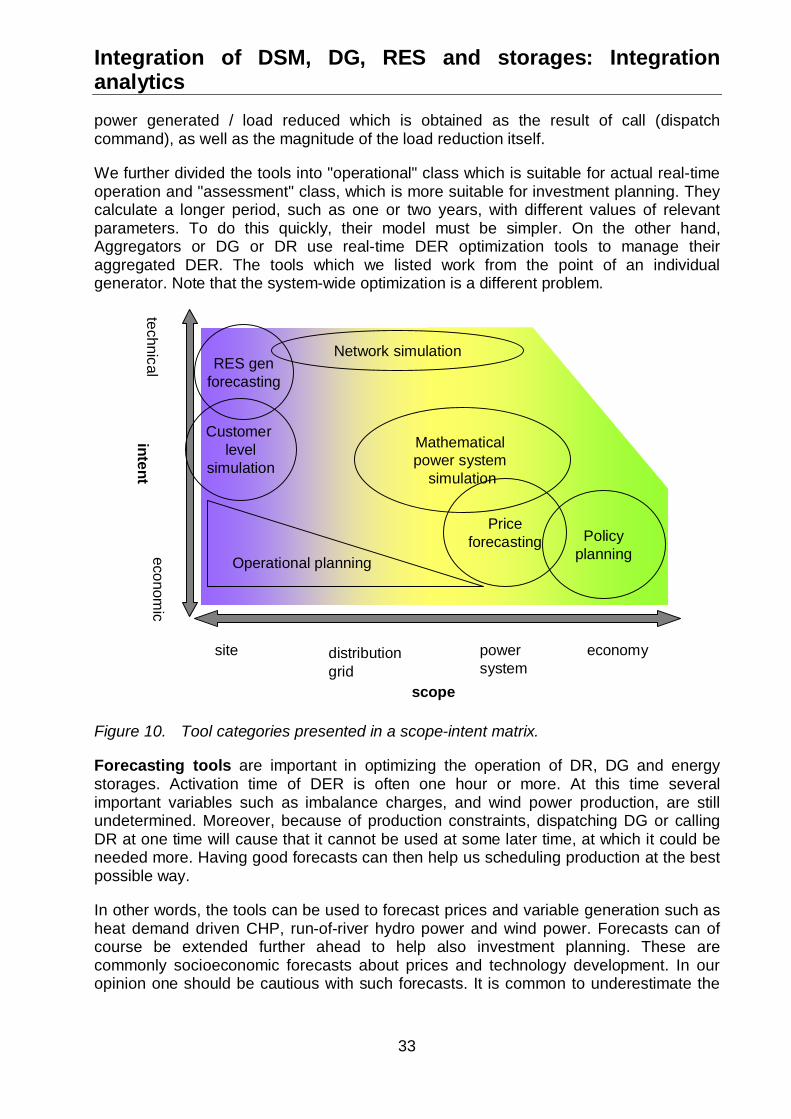
Integration of DSM, DG, RES and storages: Integrationanalytics
33
power generated / load reduced which is obtained as the result of call (dispatchcommand), as well as the magnitude of the load reduction itself.
We further divided the tools into "operational" class which is suitable for actual real-timeoperation and "assessment" class, which is more suitable for investment planning. Theycalculate a longer period, such as one or two years, with different values of relevantparameters. To do this quickly, their model must be simpler. On the other hand,Aggregators or DG or DR use real-time DER optimization tools to manage theiraggregated DER. The tools which we listed work from the point of an individualgenerator. Note that the system-wide optimization is a different problem.
powersystem
economydistributiongrid
site
scope
intenttechnical
economic
Network simulation
Customerlevel
simulation
Policyplanning
RES genforecasting
Priceforecasting
Operational planning
Mathematicalpower system
simulation
Figure 10. Tool categories presented in a scope-intent matrix.
Forecasting tools are important in optimizing the operation of DR, DG and energystorages. Activation time of DER is often one hour or more. At this time severalimportant variables such as imbalance charges, and wind power production, are stillundetermined. Moreover, because of production constraints, dispatching DG or callingDR at one time will cause that it cannot be used at some later time, at which it could beneeded more. Having good forecasts can then help us scheduling production at the bestpossible way.
In other words, the tools can be used to forecast prices and variable generation such asheat demand driven CHP, run-of-river hydro power and wind power. Forecasts can ofcourse be extended further ahead to help also investment planning. These arecommonly socioeconomic forecasts about prices and technology development. In ouropinion one should be cautious with such forecasts. It is common to underestimate the
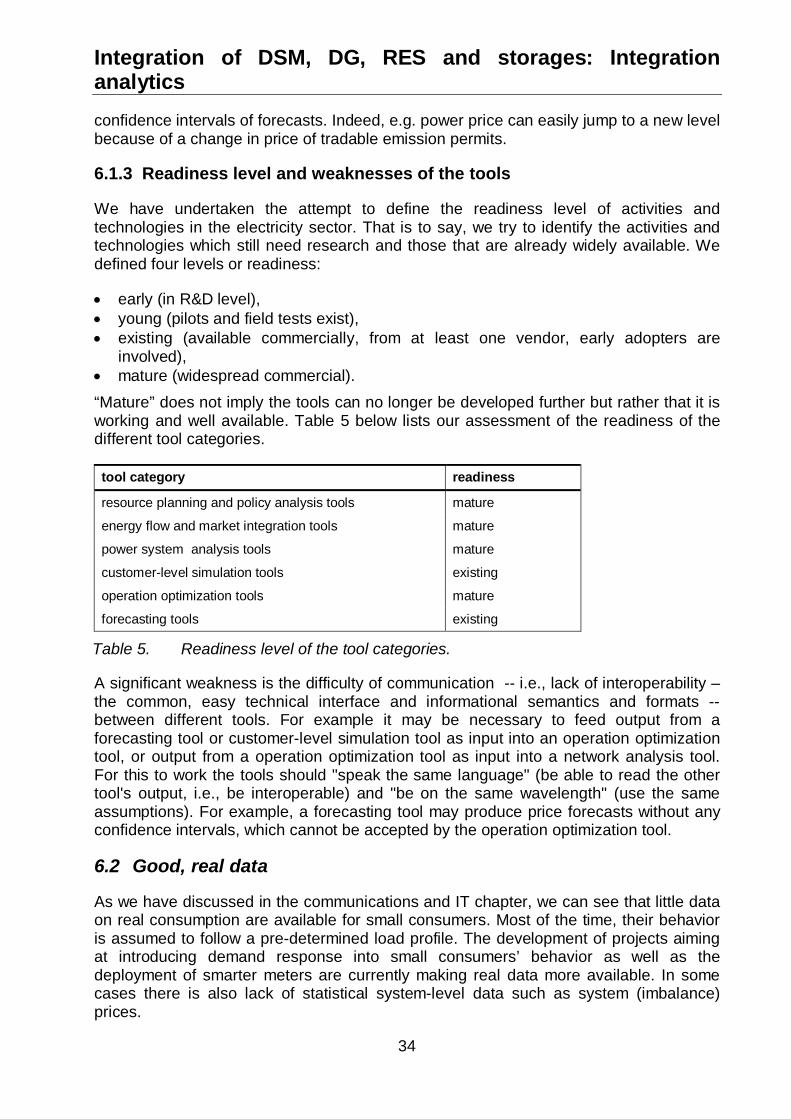
Integration of DSM, DG, RES and storages: Integrationanalytics
34
confidence intervals of forecasts. Indeed, e.g. power price can easily jump to a new levelbecause of a change in price of tradable emission permits.
6.1.3 Readiness level and weaknesses of the tools
We have undertaken the attempt to define the readiness level of activities andtechnologies in the electricity sector. That is to say, we try to identify the activities andtechnologies which still need research and those that are already widely available. Wedefined four levels or readiness:
early (in R&D level), young (pilots and field tests exist), existing (available commercially, from at least one vendor, early adopters are
involved), mature (widespread commercial).
“Mature” does not imply the tools can no longer be developed further but rather that it isworking and well available. Table 5 below lists our assessment of the readiness of thedifferent tool categories.
tool category readiness
resource planning and policy analysis tools mature
energy flow and market integration tools mature
power system analysis tools mature
customer-level simulation tools existing
operation optimization tools mature
forecasting tools existing
Table 5. Readiness level of the tool categories.
A significant weakness is the difficulty of communication -- i.e., lack of interoperability –the common, easy technical interface and informational semantics and formats --between different tools. For example it may be necessary to feed output from aforecasting tool or customer-level simulation tool as input into an operation optimizationtool, or output from a operation optimization tool as input into a network analysis tool.For this to work the tools should "speak the same language" (be able to read the othertool's output, i.e., be interoperable) and "be on the same wavelength" (use the sameassumptions). For example, a forecasting tool may produce price forecasts without anyconfidence intervals, which cannot be accepted by the operation optimization tool.
6.2 Good, real data
As we have discussed in the communications and IT chapter, we can see that little dataon real consumption are available for small consumers. Most of the time, their behavioris assumed to follow a pre-determined load profile. The development of projects aimingat introducing demand response into small consumers’ behavior as well as thedeployment of smarter meters are currently making real data more available. In somecases there is also lack of statistical system-level data such as system (imbalance)prices.
Integration of DSM, DG, RES and storages: Regulation, policyand business opportunities
35
7 Regulation, policy and business opportunitiesThis chapter discusses on the costs and benefits of DER integration, policy instrumentsapplied in different countries and business opportunities in the framework of differentregulation and policy.
7.1 Understanding relative costs and benefits
Distributed energy business has the character that there are many actors which all havetheir own goals [19]. These actors can include customers, on whose premises DG or DRequipment are installed, the energy supplier, the company who installs and controls theoperation of DG and DR (if this is different from energy supplier), distribution networkoperator, transmission system operator, gas network operator, government and thewhole society. Moreover, the interactions between different parties are not simple valuechains but value constellations in which enterprises are collaborating in networks. Theintroduction of changes into this system can have a negative or positive effect on thewell-being of different actors. Negative effects to some actor can jeopardize or delay thefollow-through of the changes.
Example of such negative effect can be found in smart metering. They may not beprofitable to the DSO (who installs them) only. However, they can include extendedservices such as load control and can thus be exploited by demand responseaggregators. A suitable price for the metering and control services should then be foundso that DSO as monopoly can make normal profit. In principle, if the business can bringnet benefits to the whole society, it is possible to find income transfers which wouldmake all parties better off. These can take the form of payments between companies orbetween taxpayers and companies, such as subsidies.
There are tools for understanding the transactions between different actors in networkedeconomy especially in the case of DG and DR. One such tool is the "Busmod" (businessmodeling) or "e3-value" methodology [20, 21]. It graphically shows the financialconnections between different actors and can also calculate profits for all relevant actorsin simple cases. It does not, however, calculate the complicated decisions needed in e.g.operating DG units; prices and quantities for transactions can only be calculated in asimple way. By explicitly modeling a DER business case using a shared and well-defined terminology, it is also a good tool for helping to increase understanding betweendifferent parties. This tool has been better introduced in Annex 2: Busmod methodology.
7.1.1 Costs and benefits of different actors related to the integration of DER
Large number of actors in the electricity market can derive benefits from the use of DRin the connection of DG, RES and energy storages. Policy-makers or regulators canincrease system security, improve economic efficiency through reduced market pricesand protect the environment. Market operators’ benefits are related to the decrease inthe market power of big players and thus increased credibility of the market, and to thedevelopment new products for the market.
A system operator or transmission system operator (TSO) can use DR for systembalancing (regulating power market in many cases), for handling disturbances in
Integration of DSM, DG, RES and storages: Regulation, policyand business opportunities
36
generation and in the transmission system (auxiliary services), for preventing blackoutsand restoration from blackouts, for handling bottlenecks in transmission and for betteruse of existing generation and transmission capacity. A distribution network operator(DSO) is able to handle network bottlenecks during the peak load period and to betterutilise network capacity. In addition, demand response helps to prevent blackouts andrestore from blackouts, to decrease the problems caused by distributed generation(especially variable generation: wind, solar, CHP), to increase the quality of supply(voltage etc) and finally, to meet the requirements of regulators and energy policy.
Traders, suppliers and retailers can use DR for risk management and hedging in theelectricity market, in developing new products and services for customers, and indeveloping new businesses (like acting as aggregators between customers andelectricity market).
Customers get their own economic benefits. They enjoy the lowering of electricity price.They can also better react to tariffs, prices or other incentives and they get economicbenefits from trading loads. All in all, demand response improves system reliability andthe environment.
For manufacturers the benefits are related to development of new ICT, metering andautomation products for the needs of demand response.
The demand response market can also stimulate the development of new businessopportunities for new actors such as aggregators and metering service provides.This field is still under development. As can be seen, the benefits of demand responseare divided among a large number of actors, but this is also a barrier in an unbundledand competitive market: it is difficult to develop business cases where enough of thebenefits accrue to one or more actors in a way that allows a win-win-win situation, eventhough the benefits for society as a whole are obvious. Costs and benefits of demandresponse are described for ex. in [22].
As a general rule, the costs and benefits of an increased DER penetration are starting tobe known for DG units and large consumers, but there is a lack of knowledge when itcomes to information about smaller consumers. Some pilots and projects are beingconducted, but their results are not yet available.
7.2 Incentives and subsidies
DG/RES is not yet usually economic to consumers or investors compared to the largescale electricity production although their benefits are seen on long term and for thewhole society. Therefore different types of support schemes are developed to improvethe market access of DG/RES.
Typical incentives are:
different types of feed-in tariffs (fixed, variable, price premium),
priority access,
quota systems,
investment support,
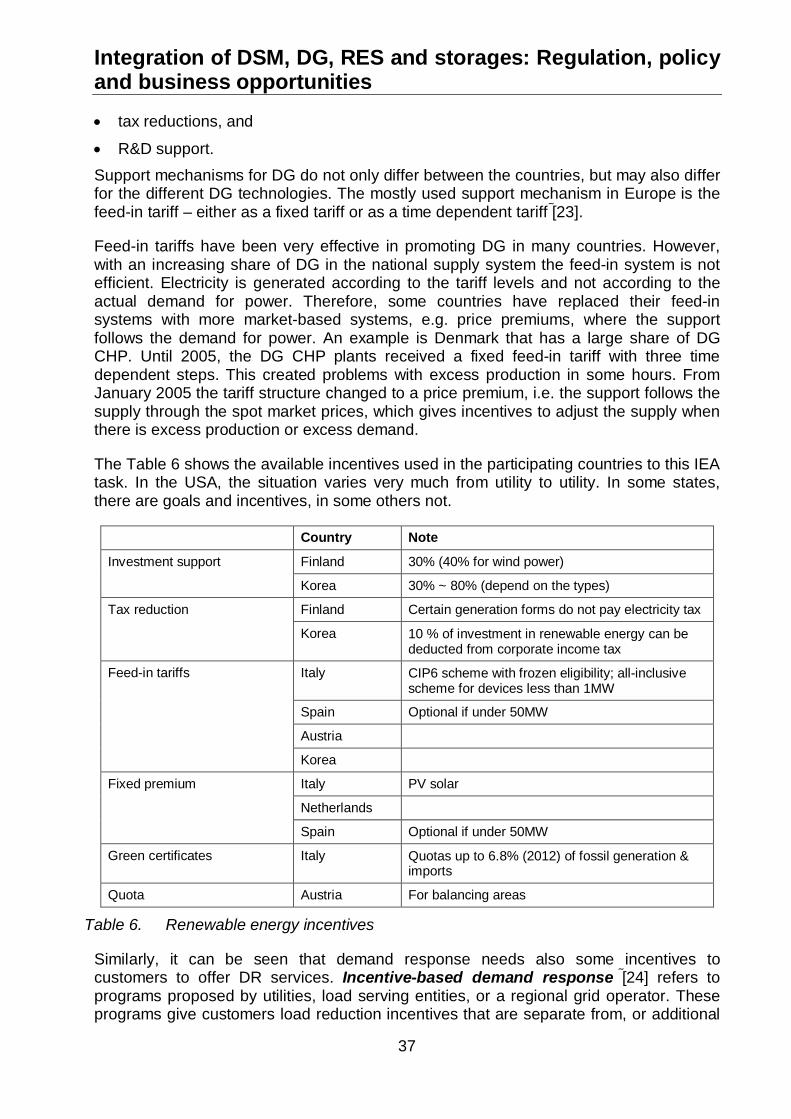
Integration of DSM, DG, RES and storages: Regulation, policyand business opportunities
37
tax reductions, and
R&D support.Support mechanisms for DG do not only differ between the countries, but may also differfor the different DG technologies. The mostly used support mechanism in Europe is thefeed-in tariff – either as a fixed tariff or as a time dependent tariff [23].
Feed-in tariffs have been very effective in promoting DG in many countries. However,with an increasing share of DG in the national supply system the feed-in system is notefficient. Electricity is generated according to the tariff levels and not according to theactual demand for power. Therefore, some countries have replaced their feed-insystems with more market-based systems, e.g. price premiums, where the supportfollows the demand for power. An example is Denmark that has a large share of DGCHP. Until 2005, the DG CHP plants received a fixed feed-in tariff with three timedependent steps. This created problems with excess production in some hours. FromJanuary 2005 the tariff structure changed to a price premium, i.e. the support follows thesupply through the spot market prices, which gives incentives to adjust the supply whenthere is excess production or excess demand.
The Table 6 shows the available incentives used in the participating countries to this IEAtask. In the USA, the situation varies very much from utility to utility. In some states,there are goals and incentives, in some others not.
Country Note
Finland 30% (40% for wind power)Investment support
Korea 30% ~ 80% (depend on the types)
Finland Certain generation forms do not pay electricity taxTax reduction
Korea 10 % of investment in renewable energy can bededucted from corporate income tax
Italy CIP6 scheme with frozen eligibility; all-inclusivescheme for devices less than 1MW
Spain Optional if under 50MW
Austria
Feed-in tariffs
Korea
Italy PV solar
Netherlands
Fixed premium
Spain Optional if under 50MW
Green certificates Italy Quotas up to 6.8% (2012) of fossil generation &imports
Quota Austria For balancing areas
Table 6. Renewable energy incentives
Similarly, it can be seen that demand response needs also some incentives tocustomers to offer DR services. Incentive-based demand response [24] refers toprograms proposed by utilities, load serving entities, or a regional grid operator. Theseprograms give customers load reduction incentives that are separate from, or additional
Integration of DSM, DG, RES and storages: Regulation, policyand business opportunities
38
to, their retail electricity rate, which may be fixed (based on average costs) or time-varying. The load reductions are needed and requested either when the grid operatorthinks reliability conditions are compromised or when prices are too high (reliability oreconomy based DR). Most demand response programs specify a method forestablishing customers’ baseline energy consumption level. Hence, observers canmeasure and verify the magnitude of their load response. Some demand responseprograms penalize customers that enroll but fail to respond or fulfill their contractualcommitments when events are declared. Typical incentive-based demand responsesare:
Direct load control: a program by which the program operator remotely shuts downor cycles a customer’s electrical equipment (e.g. air conditioner, water heater, spaceheating) on short notice. Direct load control programs are primarily offered toresidential or small commercial customers.
Interruptible/curtailable (I/C) service: curtailment options integrated into retailtariffs that provide a rate discount or bill credit for agreeing to reduce load duringsystem contingencies. Penalties may be assessed for failure to curtail. Interruptibleprograms have traditionally been offered only to the largest industrial (or commercial)customers.
Demand Bidding/Buyback Programs: customers offer bids to curtail based onwholesale electricity market prices or an equivalent. Mainly offered to largecustomers (e.g., one megawatt [MW] and over).
Emergency Demand Response Programs: programs that provide incentivepayments to customers for load reductions during periods when reserve shortfallsarise.
Capacity Market Programs: customers offer load curtailments as system capacityto replace conventional generation or delivery resources. Customers typically receiveday-of notice of events. Incentives usually consist of up-front reservation payments,and face penalties for failure to curtail when called upon to do so.
Ancillary Services Market Programs: customers bid load curtailments in ISO/RTOmarkets as operating reserves. If their bids are accepted, they are paid the marketprice for committing to be on standby. If their load curtailments are needed, they arecalled by the ISO/RTO, and may be paid the spot market energy price.
7.3 DER business opportunities
7.3.1 Market based DER
In the market based solution getting DER into market the market design givesframework to stakeholders to develop solutions or react to market conditions. Typicalexamples for DG/RES are market price based feed-in tariffs and green certificates andfor energy efficiency white certificates.
Correspondingly price-based demand response refers to changes in usage bycustomers in response to changes in the prices they pay:
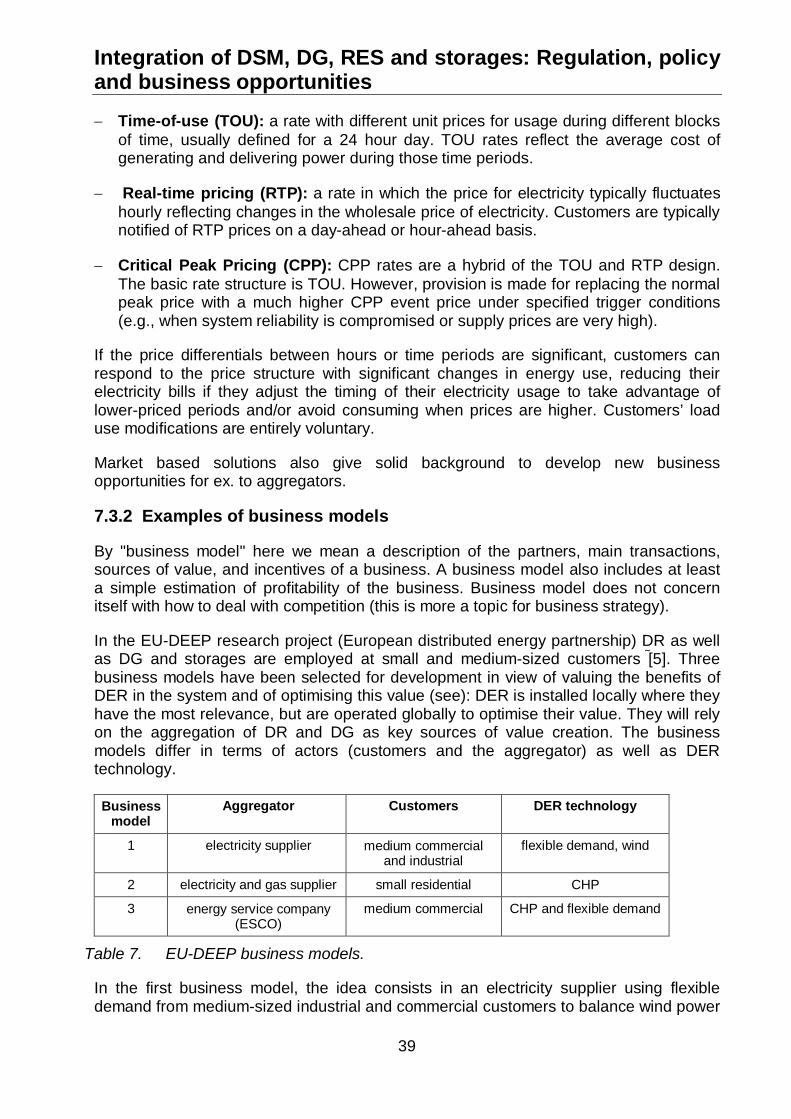
Integration of DSM, DG, RES and storages: Regulation, policyand business opportunities
39
Time-of-use (TOU): a rate with different unit prices for usage during different blocksof time, usually defined for a 24 hour day. TOU rates reflect the average cost ofgenerating and delivering power during those time periods.
Real-time pricing (RTP): a rate in which the price for electricity typically fluctuateshourly reflecting changes in the wholesale price of electricity. Customers are typicallynotified of RTP prices on a day-ahead or hour-ahead basis.
Critical Peak Pricing (CPP): CPP rates are a hybrid of the TOU and RTP design.The basic rate structure is TOU. However, provision is made for replacing the normalpeak price with a much higher CPP event price under specified trigger conditions(e.g., when system reliability is compromised or supply prices are very high).
If the price differentials between hours or time periods are significant, customers canrespond to the price structure with significant changes in energy use, reducing theirelectricity bills if they adjust the timing of their electricity usage to take advantage oflower-priced periods and/or avoid consuming when prices are higher. Customers’ loaduse modifications are entirely voluntary.
Market based solutions also give solid background to develop new businessopportunities for ex. to aggregators.
7.3.2 Examples of business models
By "business model" here we mean a description of the partners, main transactions,sources of value, and incentives of a business. A business model also includes at leasta simple estimation of profitability of the business. Business model does not concernitself with how to deal with competition (this is more a topic for business strategy).
In the EU-DEEP research project (European distributed energy partnership) DR as wellas DG and storages are employed at small and medium-sized customers [5]. Threebusiness models have been selected for development in view of valuing the benefits ofDER in the system and of optimising this value (see): DER is installed locally where theyhave the most relevance, but are operated globally to optimise their value. They will relyon the aggregation of DR and DG as key sources of value creation. The businessmodels differ in terms of actors (customers and the aggregator) as well as DERtechnology.
Businessmodel
Aggregator Customers DER technology
1 electricity supplier medium commercialand industrial
flexible demand, wind
2 electricity and gas supplier small residential CHP
3 energy service company(ESCO)
medium commercial CHP and flexible demand
Table 7. EU-DEEP business models.
In the first business model, the idea consists in an electricity supplier using flexibledemand from medium-sized industrial and commercial customers to balance wind power
Integration of DSM, DG, RES and storages: Regulation, policyand business opportunities
40
generation and integrate both in electricity markets. The business model containsseveral sources of value. They involve aggregating small load reductions, and sellingthem to the spot market when spot price of electricity is high, to reduce imbalance(originating for example from wind power generation) when they can be seen to providepower at a cheaper price than would be the imbalance price for power deficit, or (forcertain types of flexible loads) to increase load when better price can be obtained byselling power surplus to flexible customer than would be the imbalance price for powersurplus, and selling them to the balancing mechanism to help TSO keep system balance,and providing ancillary services such as short-term operating reserve.
The aggregator in this case is the supplier itself. The regulatory requirement for thebusiness model to be feasible is that the load reductions are summed into the supplier'simbalance account (in UK there are two balance accounts, consumption and generation,and load reductions as well as wind power generation are summed in the former).
In the second business model an electricity and gas supplier aggregates flexible micro-CHP units owned by residential customers. The flexibility (ability to quickly react to theneed of power) is realized through a decoupling of heat and electricity generation usingheat storage capacities inherent in the buildings. A single micro-CHP unit cannotparticipate in electricity markets on its own, because its size is normally much lower thanthe required capacity to participate in the market. Moreover, the schedule of micro-CHP's should be optimized to get better price for the electricity. To reduce suchoverhead costs, aggregation is necessary. This business model has been mostthoroughly analyzed in Germany but also in four other European countries. The problemin Germany at the moment is the feed-in tariff for micro-CHP which does not giveincentive to run it when it is most needed for system balance.
The customer can benefit by reducing his energy supply costs. The source of the savingis that the aggregator shares his benefits, which he gets from customer flexibility, withthe customer. Another source of saving is the higher energy efficiency of CHP comparedto separate production of heat and electricity, as well as possible government subsidies.
The third business model involves an Energy Service Company (ESCO), which installsCHP units at commercial customers such as hospitals and universities. The customerscan exploit the heat (or cold if absorption chiller is included) and ESCO can exploit theelectricity in the same way as in business model 1, although this of course depends onthe regulations of the country in question. It is also possible to use the DG units torelieve distribution network congestion. In order to increase CHP flexibility, the ESCOcan install a boiler and a heat storage tank for each customer (in addition to the CHPunit). In this model ESCO, which acts as aggregator, owns the CHP unit.
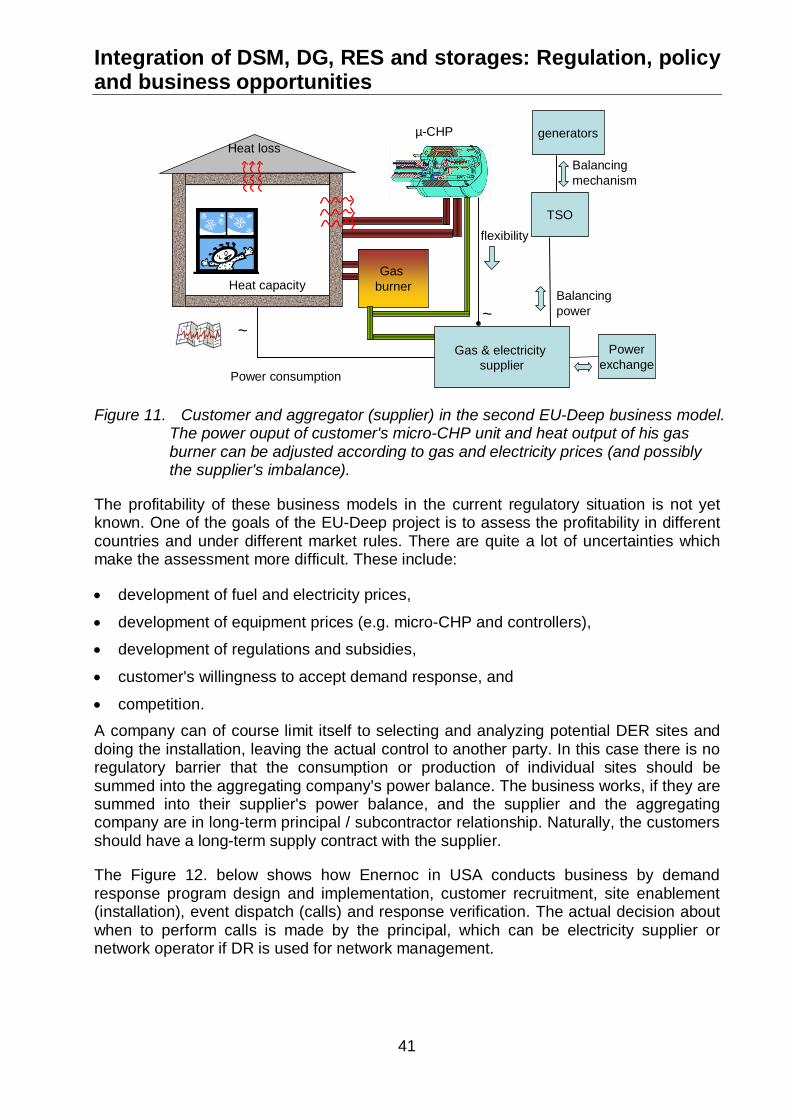
Integration of DSM, DG, RES and storages: Regulation, policyand business opportunities
41
~
Gasburner
Gas & electricitysupplier
flexibility
~
Power consumption
µ-CHP
TSO
generators
Balancingpower
Balancingmechanism
Heat capacity
Heat loss
Powerexchange
Figure 11. Customer and aggregator (supplier) in the second EU-Deep business model.The power ouput of customer's micro-CHP unit and heat output of his gasburner can be adjusted according to gas and electricity prices (and possiblythe supplier's imbalance).
The profitability of these business models in the current regulatory situation is not yetknown. One of the goals of the EU-Deep project is to assess the profitability in differentcountries and under different market rules. There are quite a lot of uncertainties whichmake the assessment more difficult. These include:
development of fuel and electricity prices,
development of equipment prices (e.g. micro-CHP and controllers),
development of regulations and subsidies,
customer's willingness to accept demand response, and
competition.A company can of course limit itself to selecting and analyzing potential DER sites anddoing the installation, leaving the actual control to another party. In this case there is noregulatory barrier that the consumption or production of individual sites should besummed into the aggregating company's power balance. The business works, if they aresummed into their supplier's power balance, and the supplier and the aggregatingcompany are in long-term principal / subcontractor relationship. Naturally, the customersshould have a long-term supply contract with the supplier.
The Figure 12. below shows how Enernoc in USA conducts business by demandresponse program design and implementation, customer recruitment, site enablement(installation), event dispatch (calls) and response verification. The actual decision aboutwhen to perform calls is made by the principal, which can be electricity supplier ornetwork operator if DR is used for network management.
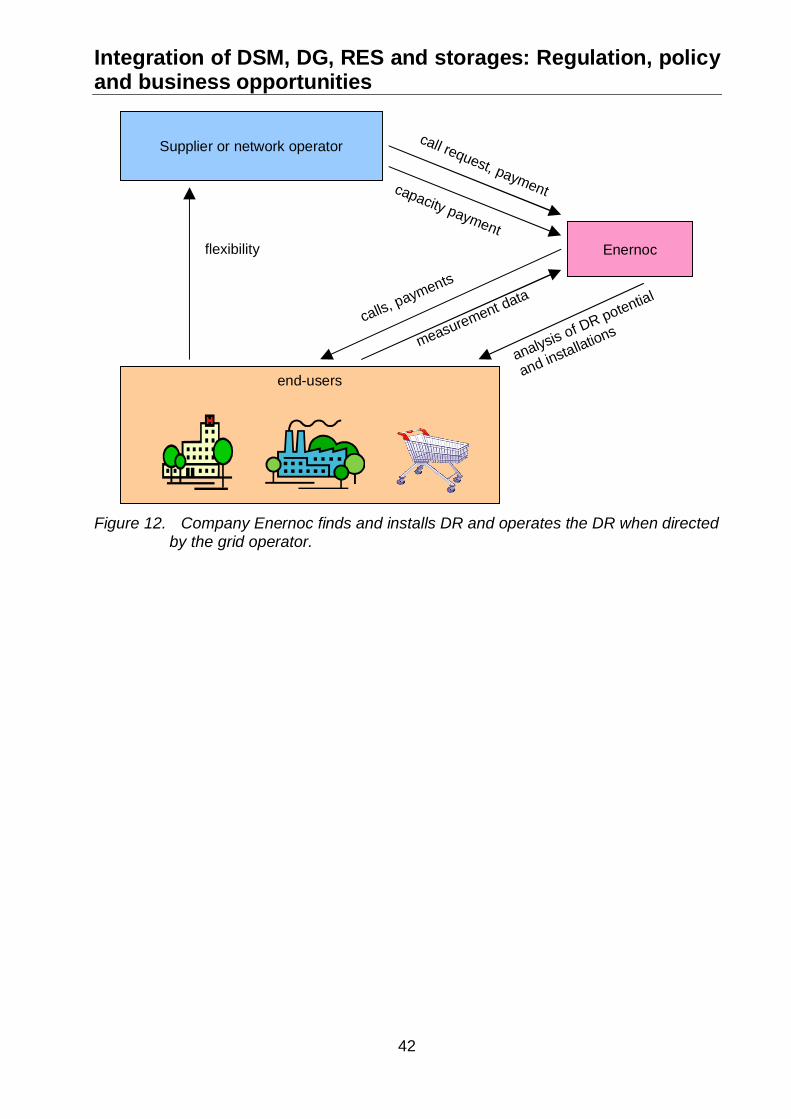
Integration of DSM, DG, RES and storages: Regulation, policyand business opportunities
42
end-users
Supplier or network operator
Enernoc
calls, payments
measurement data
flexibility
call request, paymentcapacity payment
analysis of DR potential
and installations
Figure 12. Company Enernoc finds and installs DR and operates the DR when directedby the grid operator.
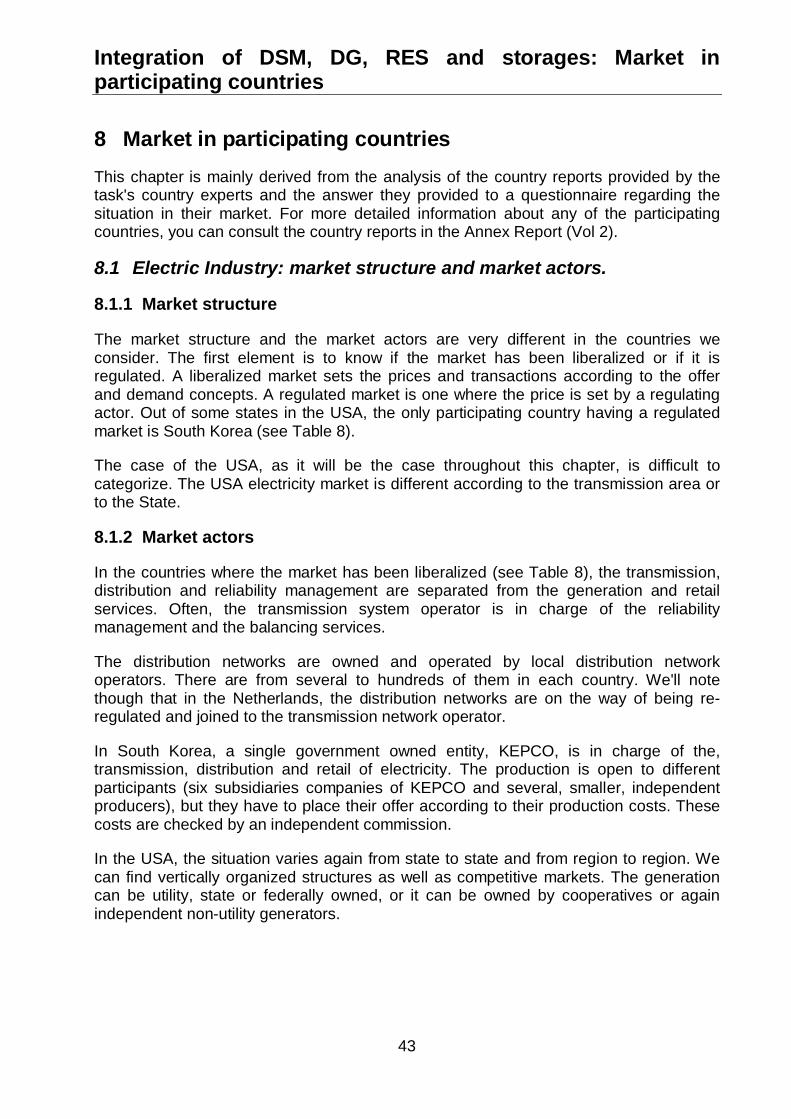
Integration of DSM, DG, RES and storages: Market inparticipating countries
43
8 Market in participating countriesThis chapter is mainly derived from the analysis of the country reports provided by thetask's country experts and the answer they provided to a questionnaire regarding thesituation in their market. For more detailed information about any of the participatingcountries, you can consult the country reports in the Annex Report (Vol 2).
8.1 Electric Industry: market structure and market actors.
8.1.1 Market structure
The market structure and the market actors are very different in the countries weconsider. The first element is to know if the market has been liberalized or if it isregulated. A liberalized market sets the prices and transactions according to the offerand demand concepts. A regulated market is one where the price is set by a regulatingactor. Out of some states in the USA, the only participating country having a regulatedmarket is South Korea (see Table 8).
The case of the USA, as it will be the case throughout this chapter, is difficult tocategorize. The USA electricity market is different according to the transmission area orto the State.
8.1.2 Market actors
In the countries where the market has been liberalized (see Table 8), the transmission,distribution and reliability management are separated from the generation and retailservices. Often, the transmission system operator is in charge of the reliabilitymanagement and the balancing services.
The distribution networks are owned and operated by local distribution networkoperators. There are from several to hundreds of them in each country. We'll notethough that in the Netherlands, the distribution networks are on the way of being re-regulated and joined to the transmission network operator.
In South Korea, a single government owned entity, KEPCO, is in charge of the,transmission, distribution and retail of electricity. The production is open to differentparticipants (six subsidiaries companies of KEPCO and several, smaller, independentproducers), but they have to place their offer according to their production costs. Thesecosts are checked by an independent commission.
In the USA, the situation varies again from state to state and from region to region. Wecan find vertically organized structures as well as competitive markets. The generationcan be utility, state or federally owned, or it can be owned by cooperatives or againindependent non-utility generators.
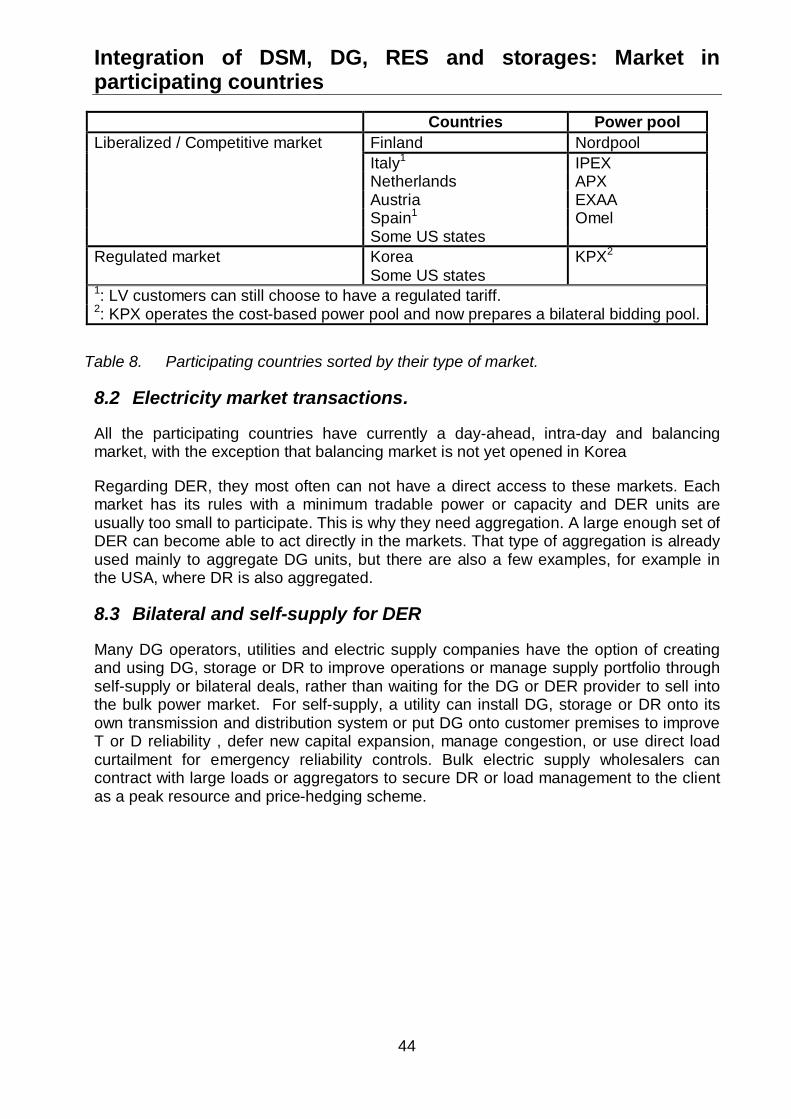
Integration of DSM, DG, RES and storages: Market inparticipating countries
44
Countries Power poolFinland NordpoolItaly1 IPEXNetherlands APXAustria EXAASpain1 Omel
Liberalized / Competitive market
Some US statesKorea KPX2Regulated marketSome US states
1: LV customers can still choose to have a regulated tariff.2: KPX operates the cost-based power pool and now prepares a bilateral bidding pool.
Table 8. Participating countries sorted by their type of market.
8.2 Electricity market transactions.
All the participating countries have currently a day-ahead, intra-day and balancingmarket, with the exception that balancing market is not yet opened in Korea
Regarding DER, they most often can not have a direct access to these markets. Eachmarket has its rules with a minimum tradable power or capacity and DER units areusually too small to participate. This is why they need aggregation. A large enough set ofDER can become able to act directly in the markets. That type of aggregation is alreadyused mainly to aggregate DG units, but there are also a few examples, for example inthe USA, where DR is also aggregated.
8.3 Bilateral and self-supply for DER
Many DG operators, utilities and electric supply companies have the option of creatingand using DG, storage or DR to improve operations or manage supply portfolio throughself-supply or bilateral deals, rather than waiting for the DG or DER provider to sell intothe bulk power market. For self-supply, a utility can install DG, storage or DR onto itsown transmission and distribution system or put DG onto customer premises to improveT or D reliability , defer new capital expansion, manage congestion, or use direct loadcurtailment for emergency reliability controls. Bulk electric supply wholesalers cancontract with large loads or aggregators to secure DR or load management to the clientas a peak resource and price-hedging scheme.
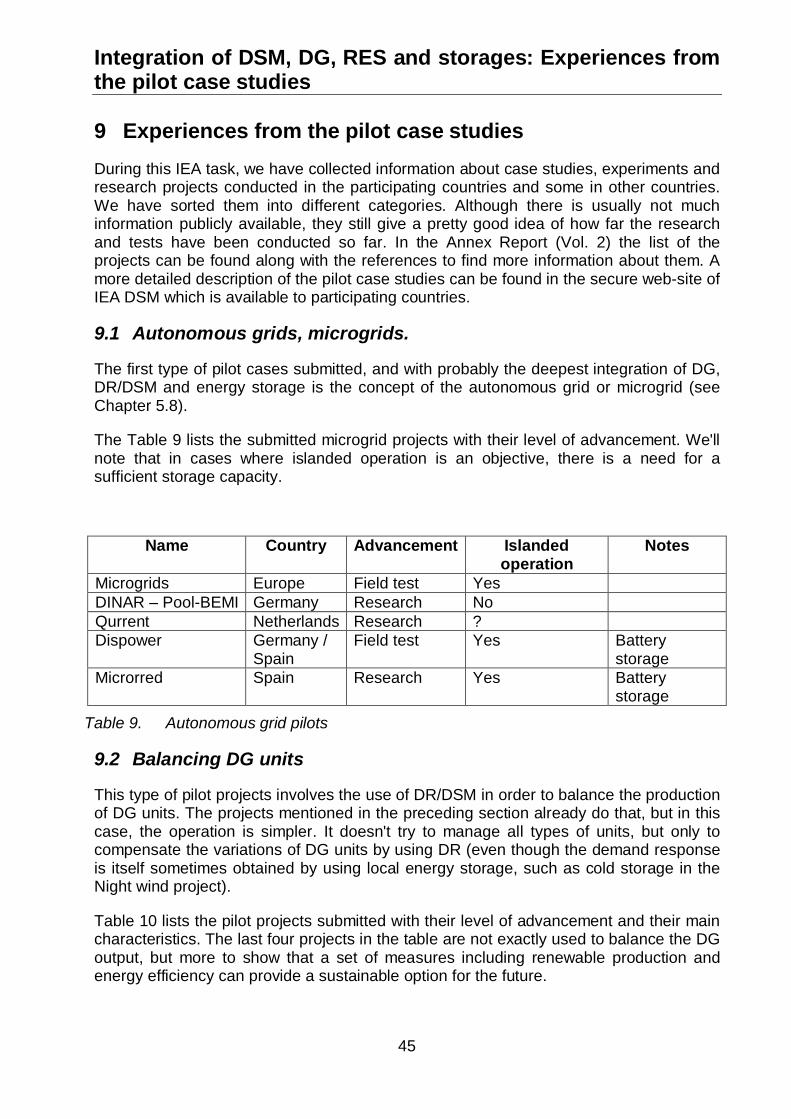
Integration of DSM, DG, RES and storages: Experiences fromthe pilot case studies
45
9 Experiences from the pilot case studiesDuring this IEA task, we have collected information about case studies, experiments andresearch projects conducted in the participating countries and some in other countries.We have sorted them into different categories. Although there is usually not muchinformation publicly available, they still give a pretty good idea of how far the researchand tests have been conducted so far. In the Annex Report (Vol. 2) the list of theprojects can be found along with the references to find more information about them. Amore detailed description of the pilot case studies can be found in the secure web-site ofIEA DSM which is available to participating countries.
9.1 Autonomous grids, microgrids.
The first type of pilot cases submitted, and with probably the deepest integration of DG,DR/DSM and energy storage is the concept of the autonomous grid or microgrid (seeChapter 5.8).
The Table 9 lists the submitted microgrid projects with their level of advancement. We'llnote that in cases where islanded operation is an objective, there is a need for asufficient storage capacity.
Name Country Advancement Islandedoperation
Notes
Microgrids Europe Field test YesDINAR – Pool-BEMI Germany Research NoQurrent Netherlands Research ?Dispower Germany /
SpainField test Yes Battery
storageMicrorred Spain Research Yes Battery
storage
Table 9. Autonomous grid pilots
9.2 Balancing DG units
This type of pilot projects involves the use of DR/DSM in order to balance the productionof DG units. The projects mentioned in the preceding section already do that, but in thiscase, the operation is simpler. It doesn't try to manage all types of units, but only tocompensate the variations of DG units by using DR (even though the demand responseis itself sometimes obtained by using local energy storage, such as cold storage in theNight wind project).
Table 10 lists the pilot projects submitted with their level of advancement and their maincharacteristics. The last four projects in the table are not exactly used to balance the DGoutput, but more to show that a set of measures including renewable production andenergy efficiency can provide a sustainable option for the future.
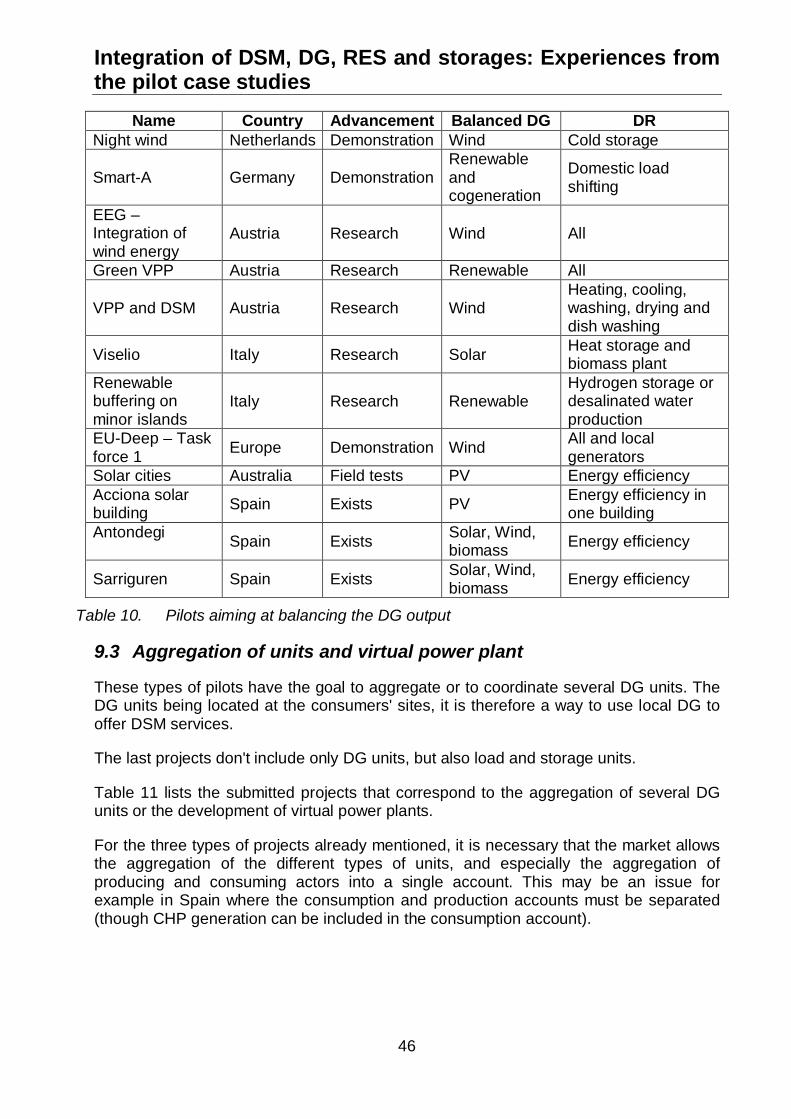
Integration of DSM, DG, RES and storages: Experiences fromthe pilot case studies
46
Name Country Advancement Balanced DG DRNight wind Netherlands Demonstration Wind Cold storage
Smart-A Germany DemonstrationRenewableandcogeneration
Domestic loadshifting
EEG –Integration ofwind energy
Austria Research Wind All
Green VPP Austria Research Renewable All
VPP and DSM Austria Research WindHeating, cooling,washing, drying anddish washing
Viselio Italy Research Solar Heat storage andbiomass plant
Renewablebuffering onminor islands
Italy Research RenewableHydrogen storage ordesalinated waterproduction
EU-Deep – Taskforce 1 Europe Demonstration Wind All and local
generatorsSolar cities Australia Field tests PV Energy efficiencyAcciona solarbuilding Spain Exists PV Energy efficiency in
one buildingAntondegi Spain Exists Solar, Wind,
biomass Energy efficiency
Sarriguren Spain Exists Solar, Wind,biomass Energy efficiency
Table 10. Pilots aiming at balancing the DG output
9.3 Aggregation of units and virtual power plant
These types of pilots have the goal to aggregate or to coordinate several DG units. TheDG units being located at the consumers' sites, it is therefore a way to use local DG tooffer DSM services.
The last projects don't include only DG units, but also load and storage units.
Table 11 lists the submitted projects that correspond to the aggregation of several DGunits or the development of virtual power plants.
For the three types of projects already mentioned, it is necessary that the market allowsthe aggregation of the different types of units, and especially the aggregation ofproducing and consuming actors into a single account. This may be an issue forexample in Spain where the consumption and production accounts must be separated(though CHP generation can be included in the consumption account).
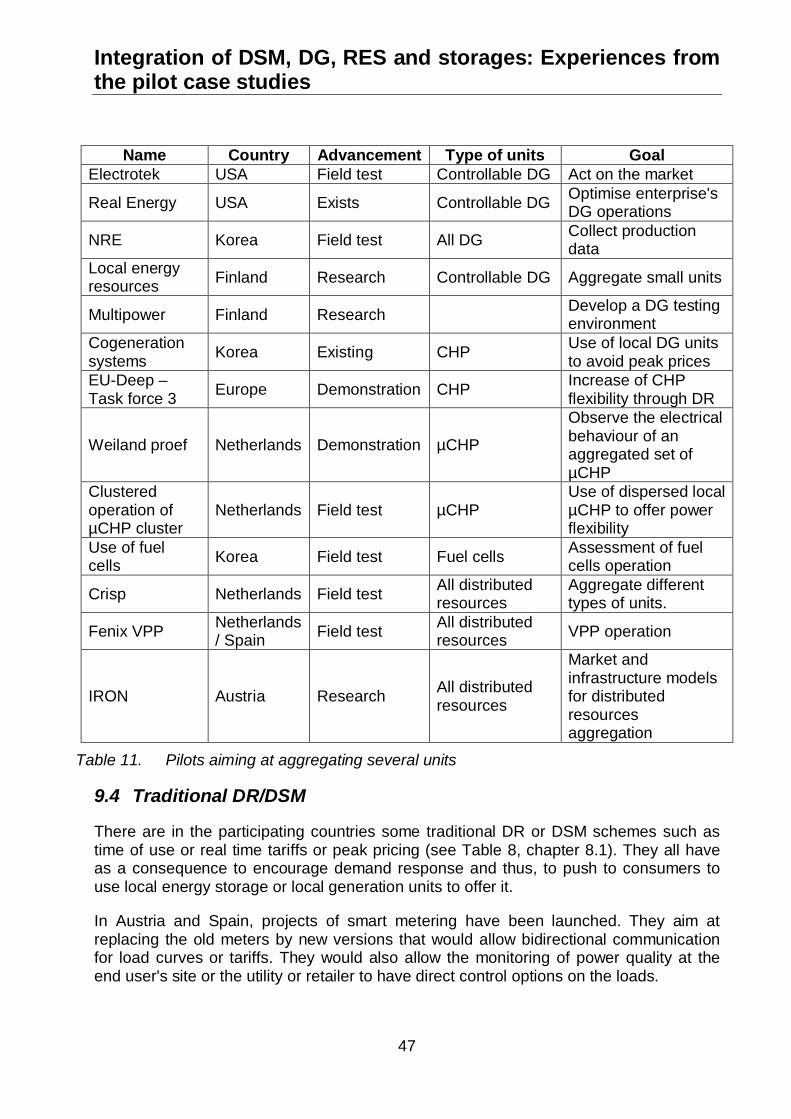
Integration of DSM, DG, RES and storages: Experiences fromthe pilot case studies
47
Name Country Advancement Type of units GoalElectrotek USA Field test Controllable DG Act on the market
Real Energy USA Exists Controllable DG Optimise enterprise'sDG operations
NRE Korea Field test All DG Collect productiondata
Local energyresources Finland Research Controllable DG Aggregate small units
Multipower Finland Research Develop a DG testingenvironment
Cogenerationsystems Korea Existing CHP Use of local DG units
to avoid peak pricesEU-Deep –Task force 3 Europe Demonstration CHP Increase of CHP
flexibility through DR
Weiland proef Netherlands Demonstration µCHP
Observe the electricalbehaviour of anaggregated set ofµCHP
Clusteredoperation ofµCHP cluster
Netherlands Field test µCHPUse of dispersed localµCHP to offer powerflexibility
Use of fuelcells Korea Field test Fuel cells Assessment of fuel
cells operation
Crisp Netherlands Field test All distributedresources
Aggregate differenttypes of units.
Fenix VPP Netherlands/ Spain Field test All distributed
resources VPP operation
IRON Austria Research All distributedresources
Market andinfrastructure modelsfor distributedresourcesaggregation
Table 11. Pilots aiming at aggregating several units
9.4 Traditional DR/DSM
There are in the participating countries some traditional DR or DSM schemes such astime of use or real time tariffs or peak pricing (see Table 8, chapter 8.1). They all haveas a consequence to encourage demand response and thus, to push to consumers touse local energy storage or local generation units to offer it.
In Austria and Spain, projects of smart metering have been launched. They aim atreplacing the old meters by new versions that would allow bidirectional communicationfor load curves or tariffs. They would also allow the monitoring of power quality at theend user's site or the utility or retailer to have direct control options on the loads.
Integration of DSM, DG, RES and storages: Experiences fromthe pilot case studies
48
9.5 Delay network investments
Some projects have been started by some distribution companies in order to delaynetwork investments. The distribution company chooses between the investment in anew substation or a new line and the investment in promulgating energy efficiency orinstalling direct load control systems. A number of US utilities have used DG , EE andLM to defer new T&D capital investment, including PG&E, Commonwealth Edison andConsolidated Edison.
A project in Finland delays network investment by direct control of electric heating whilethe Castle Hill project in Australia intended to increase energy efficiency to reduce thepeak load and hence the need for other, more expensive, investments.
The winter peak project in Ireland is a bit different. It aims to reduce the peak demand ata national level so that investments in security of supply can be reduced.
9.6 Conclusions from the case studies
It is difficult to make general conclusions from the case studies since they all involve adifferent level of resource integration. We can however pinpoint some elements.Most of the case studies are still in research, pilot or field test level and only very fewwere actual business cases.The technologies to integrate different resources with different characteristics exist.However, in the cases where hundreds or thousands of small units are taken intoconsideration, metering and communication technologies are too expensive to installand maintain.Some algorithms involving the optimization of an aggregated portfolio exist also forsome of the projects, but they are not directly available to the public.As we already mentioned, it is necessary that the market rules allow the integration ofunits of different natures, especially the aggregation of production with consumption.
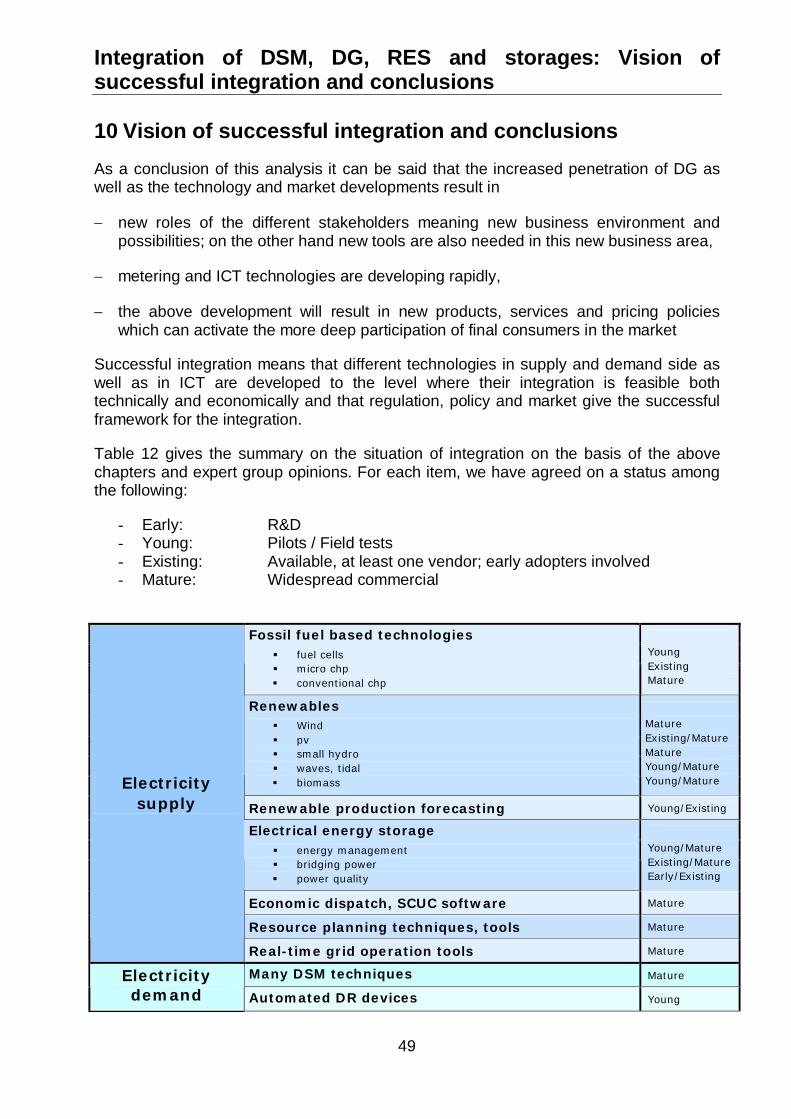
Integration of DSM, DG, RES and storages: Vision ofsuccessful integration and conclusions
49
10 Vision of successful integration and conclusionsAs a conclusion of this analysis it can be said that the increased penetration of DG aswell as the technology and market developments result in
new roles of the different stakeholders meaning new business environment andpossibilities; on the other hand new tools are also needed in this new business area,
metering and ICT technologies are developing rapidly,
the above development will result in new products, services and pricing policieswhich can activate the more deep participation of final consumers in the market
Successful integration means that different technologies in supply and demand side aswell as in ICT are developed to the level where their integration is feasible bothtechnically and economically and that regulation, policy and market give the successfulframework for the integration.
Table 12 gives the summary on the situation of integration on the basis of the abovechapters and expert group opinions. For each item, we have agreed on a status amongthe following:
- Early: R&D- Young: Pilots / Field tests- Existing: Available, at least one vendor; early adopters involved- Mature: Widespread commercial
Fossil fuel based technologiesfuel cellsmicro chpconventional chp
YoungExistingMature
RenewablesWindpvsmall hydrowaves, tidalbiomass
MatureExisting/MatureMatureYoung/MatureYoung/Mature
Renewable production forecasting Young/Existing
Electrical energy storageenergy managementbridging powerpower quality
Young/MatureExisting/MatureEarly/Existing
Economic dispatch, SCUC software Mature
Resource planning techniques, tools Mature
Electricitysupply
Real-time grid operation tools Mature
Many DSM techniques MatureElectricitydemand Automated DR devices Young
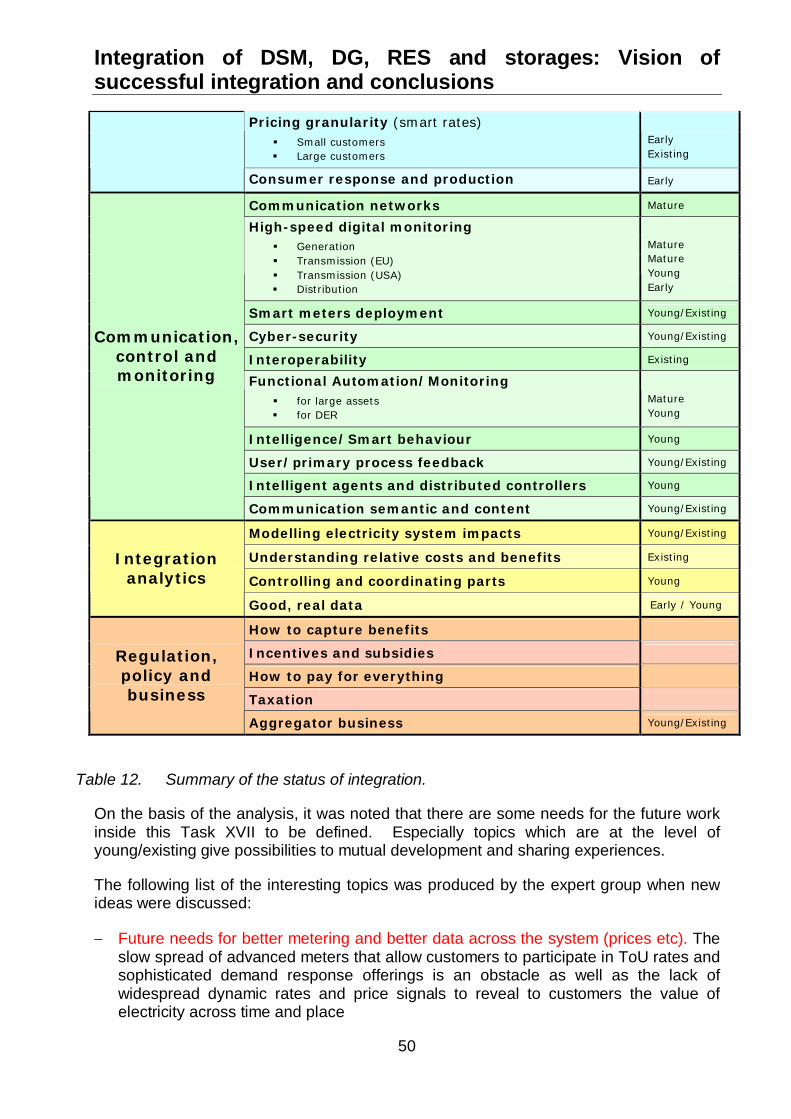
Integration of DSM, DG, RES and storages: Vision ofsuccessful integration and conclusions
50
Pricing granularity (smart rates)Small customersLarge customers
EarlyExisting
Consumer response and production Early
Communication networks Mature
High-speed digital monitoringGenerationTransmission (EU)Transmission (USA)Distribution
MatureMatureYoungEarly
Smart meters deployment Young/Existing
Cyber-security Young/Existing
Interoperability Existing
Functional Automation/Monitoringfor large assetsfor DER
MatureYoung
Intelligence/Smart behaviour Young
User/primary process feedback Young/Existing
Intelligent agents and distributed controllers Young
Communication,control andmonitoring
Communication semantic and content Young/Existing
Modelling electricity system impacts Young/Existing
Understanding relative costs and benefits Existing
Controlling and coordinating parts Young
Integrationanalytics
Good, real data Early / Young
How to capture benefits
Incentives and subsidies
How to pay for everything
Taxation
Regulation,policy andbusiness
Aggregator business Young/Existing
Table 12. Summary of the status of integration.
On the basis of the analysis, it was noted that there are some needs for the future workinside this Task XVII to be defined. Especially topics which are at the level ofyoung/existing give possibilities to mutual development and sharing experiences.
The following list of the interesting topics was produced by the expert group when newideas were discussed:
Future needs for better metering and better data across the system (prices etc). Theslow spread of advanced meters that allow customers to participate in ToU rates andsophisticated demand response offerings is an obstacle as well as the lack ofwidespread dynamic rates and price signals to reveal to customers the value ofelectricity across time and place
Integration of DSM, DG, RES and storages: Vision ofsuccessful integration and conclusions
51
How much does the early status of high-speed monitoring especially at distributionlevel hold back the system's evolution? Where are the best benefits?
More detailed analysis of the Integration analytics and ICT to see how much theydelay the integration of DER?
Power quality questions related to DER, positive and negative effects of DER to thepower quality, improvement of power quality management
Isolated systems: islanded systems in rural areas and on islands, islanded operationof network connected systems (microgrids and larger islanded subsystems)
Quantitative effects of DER penetration into existing power systems, for.ex electricvehicles, heat pumps; understanding costs and benefits of different stakeholders
Increasing of predictability of generation and demand (forecasting also consumerresponse)
Market design aspects: analysis of the effects in different countries, interoperabilitybetween countries and regions
Potential surveys of DER
Legal frameworks to DER
Comparison of best practices and recommendations on national level
Guidelines for the interoperability
Rate design and applications of incentive schemes for installing DER
Aggregator business analysis, comparison and development
Customer behavior and response to price-responsive demand response options.
The topics with the red color were the most supported within expert group meeting inSeoul. It was decided that the topic related to the assessment of the effect of DERpenetration to the costs and benefits of different stakeholders and the whole system willbe further elaborated by the Operating Agent.
Integration of DSM, DG, RES and storages: References
52
11 References1. IEA Wind, Task 25. Design and operation of power systems with large amounts of
wind power. State-of-the-art report. VTT working papers 82, 2007
2. European Technology Platform SmartGrids. Vision and Strategy for Europe’sElectricity Networks of the Future. EUROPEAN COMMISSION , Directorate-General for Research. Sustainable Energy Systems. EUR 22040, 2006
3. European Technology Platform SmartGrids. Strategic research agenda forEurope’s electricity networks of the future. EUROPEAN COMMISSION.Directorate-General for Research, Directorate Energy. EUR 22580, 2007
4. (http://www.gridwiseac.org/ and http://www.gridwiseac.org/about/mission.aspx
5. http://www.eudeep.com/
6. http://www.addressfp7.org/
7. http://intelligrid.epri.com/
8. Sebastian Maria, Belhomme Régine, Normand Olivier, Huet Olivier, Mamo Xavier,Virtual Power Plants, Active Demand, Energy Manager, Intelligent Grids and Co.Discussion slides in CIGRE 2008, 2 C6 Session, August 29, 2008
9. Göran Koreneff, Eero Vartiainen, Pekka Koponen, Seppo Kärkkäinen.The conceptfor the energy management of the distributed energy generation (in Finnish)..Project report PRO1/P7005/04 (31.1.2004). Public. 39 p. + app. 15 p.)
10. DRAS (Demand Response Automation Server); Berkeley Laboratory, PIER –Demand Response Research Center, http://www.lbl.gov/Science-Articles/Archive/sabl/2008/Feb/ADR.html
11. Koponen, P., Kärkkäinen, S., Farin, J. and Pihala, H. Control of small customerelectricity demand with spot-market price signals (In Finnish). VTT Research Notes2362. 2006
12. http://www.esma-home.eu/
13. Pekka Koponen (ed.), Definition of Smart Metering and Applications andIdentification of Benefits, Deliverable D3 of the European Smart Metering AllianceESMA (available at www.esma-home.eu, members area)
14. Adrian Kemp, Ann Whitfield, Brendan Quach, Yuliya Hedynach, Tara D'Souza,Cost Benefit Analysis of Smart Metering and Direct Load Control: Overview Reportfor Consultation, Report for the Ministerial Council on Energy Smart Meter WorkingGroup, NERA Economic Consulting, Sydney NSW Australia, 29 February 2008.212 p. Available from www.mce.gov.au
15. Netherlands Technical Agreement NTA 8130:2007, Minimum set of functions formetering of electricity, gas and thermal energy for domestic customers.Netherlands Standardization Institute (NEN), August 2007, 25 p.
Integration of DSM, DG, RES and storages: References
53
16. http://www.iset.uni-kassel.de/pls/w3isetdad/www_iset_new.main_page?p_lang=eng&p_owa_call=www_veroeff.show_veroeffdaten%3Fp_veroeff_nr=1970%26p_lang=eng
17. Task XI: Time of Use Pricing and Energy Use for Demand Management Delivery.Final Report, October 2007
18. Task XI: Subtask 1, Smaller Customer Energy Saving by End Use Monitoring andFeedback. May 2005.
19. Jaap Gordijn and Hans Akkermans: "Business Models for Distributed EnergyResources In a Liberalized Market Environment". In The Electric Power SystemsResearch Journal, Vol. 77(9): pp. 1178-1188, Elsevier, 2007.
20. Deliverable 1.1 of BUSMOD project, "Analysis of Business ModellingMethodologies for Distributed Generation Businesses ",http://www.e3value.com/projects/ourprojects/busmod/
21. Busmod project deliverable 5.1 "Distributed generation business modelling"http://e3value.few.vu.nl/docs/misc/VUA_DGB_WP05_01_01.pdf
22. Benefits of Demand Response in Electricity Markets and Recommendations forachieving them. A report to the United States Congress. February 2006, 122 p.
23. Klaus Skytte and Stephanie Ropenus. Regulatory Review and InternationalComparison of EU-15 Member States. DG-GRID project, Report D1, October 2005
24. Assessement of Demand Response and Advanced Metering, Federal EnergyRegulatory Commission, Staff Report, August 2006, 228 p.
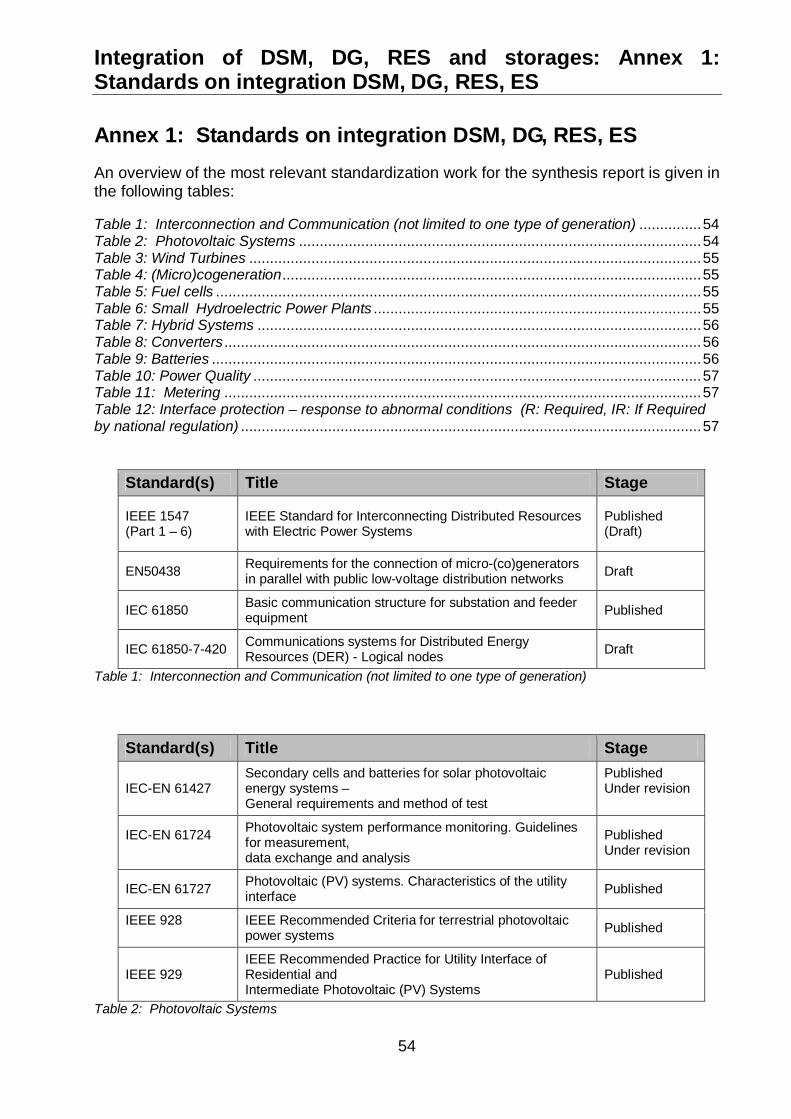
Integration of DSM, DG, RES and storages: Annex 1:Standards on integration DSM, DG, RES, ES
54
Annex 1: Standards on integration DSM, DG, RES, ESAn overview of the most relevant standardization work for the synthesis report is given inthe following tables:
Table 1: Interconnection and Communication (not limited to one type of generation) ...............54Table 2: Photovoltaic Systems .................................................................................................54Table 3: Wind Turbines .............................................................................................................55Table 4: (Micro)cogeneration.....................................................................................................55Table 5: Fuel cells .....................................................................................................................55Table 6: Small Hydroelectric Power Plants ...............................................................................55Table 7: Hybrid Systems ...........................................................................................................56Table 8: Converters ...................................................................................................................56Table 9: Batteries ......................................................................................................................56Table 10: Power Quality ............................................................................................................57Table 11: Metering ...................................................................................................................57Table 12: Interface protection – response to abnormal conditions (R: Required, IR: If Requiredby national regulation) ...............................................................................................................57
Standard(s) Title Stage
IEEE 1547(Part 1 – 6)
IEEE Standard for Interconnecting Distributed Resourceswith Electric Power Systems
Published(Draft)
EN50438 Requirements for the connection of micro-(co)generatorsin parallel with public low-voltage distribution networks Draft
IEC 61850 Basic communication structure for substation and feederequipment Published
IEC 61850-7-420 Communications systems for Distributed EnergyResources (DER) - Logical nodes Draft
Table 1: Interconnection and Communication (not limited to one type of generation)
Standard(s) Title Stage
IEC-EN 61427Secondary cells and batteries for solar photovoltaicenergy systems –General requirements and method of test
PublishedUnder revision
IEC-EN 61724 Photovoltaic system performance monitoring. Guidelinesfor measurement,data exchange and analysis
PublishedUnder revision
IEC-EN 61727 Photovoltaic (PV) systems. Characteristics of the utilityinterface Published
IEEE 928 IEEE Recommended Criteria for terrestrial photovoltaicpower systems Published
IEEE 929IEEE Recommended Practice for Utility Interface ofResidential andIntermediate Photovoltaic (PV) Systems
Published
Table 2: Photovoltaic Systems
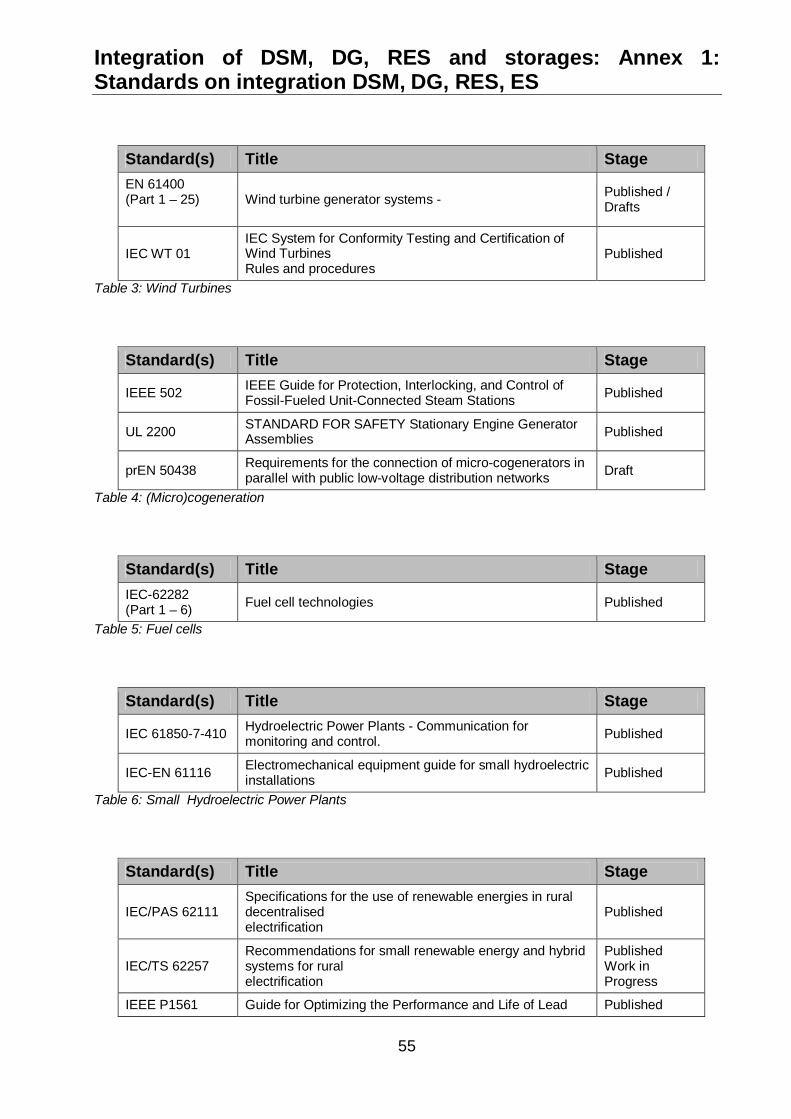
Integration of DSM, DG, RES and storages: Annex 1:Standards on integration DSM, DG, RES, ES
55
Standard(s) Title StageEN 61400(Part 1 – 25) Wind turbine generator systems - Published /
Drafts
IEC WT 01IEC System for Conformity Testing and Certification ofWind TurbinesRules and procedures
Published
Table 3: Wind Turbines
Standard(s) Title Stage
IEEE 502 IEEE Guide for Protection, Interlocking, and Control ofFossil-Fueled Unit-Connected Steam Stations Published
UL 2200 STANDARD FOR SAFETY Stationary Engine GeneratorAssemblies Published
prEN 50438 Requirements for the connection of micro-cogenerators inparallel with public low-voltage distribution networks Draft
Table 4: (Micro)cogeneration
Standard(s) Title StageIEC-62282(Part 1 – 6) Fuel cell technologies Published
Table 5: Fuel cells
Standard(s) Title Stage
IEC 61850-7-410 Hydroelectric Power Plants - Communication formonitoring and control. Published
IEC-EN 61116 Electromechanical equipment guide for small hydroelectricinstallations Published
Table 6: Small Hydroelectric Power Plants
Standard(s) Title Stage
IEC/PAS 62111Specifications for the use of renewable energies in ruraldecentralisedelectrification
Published
IEC/TS 62257Recommendations for small renewable energy and hybridsystems for ruralelectrification
PublishedWork inProgress
IEEE P1561 Guide for Optimizing the Performance and Life of Lead Published
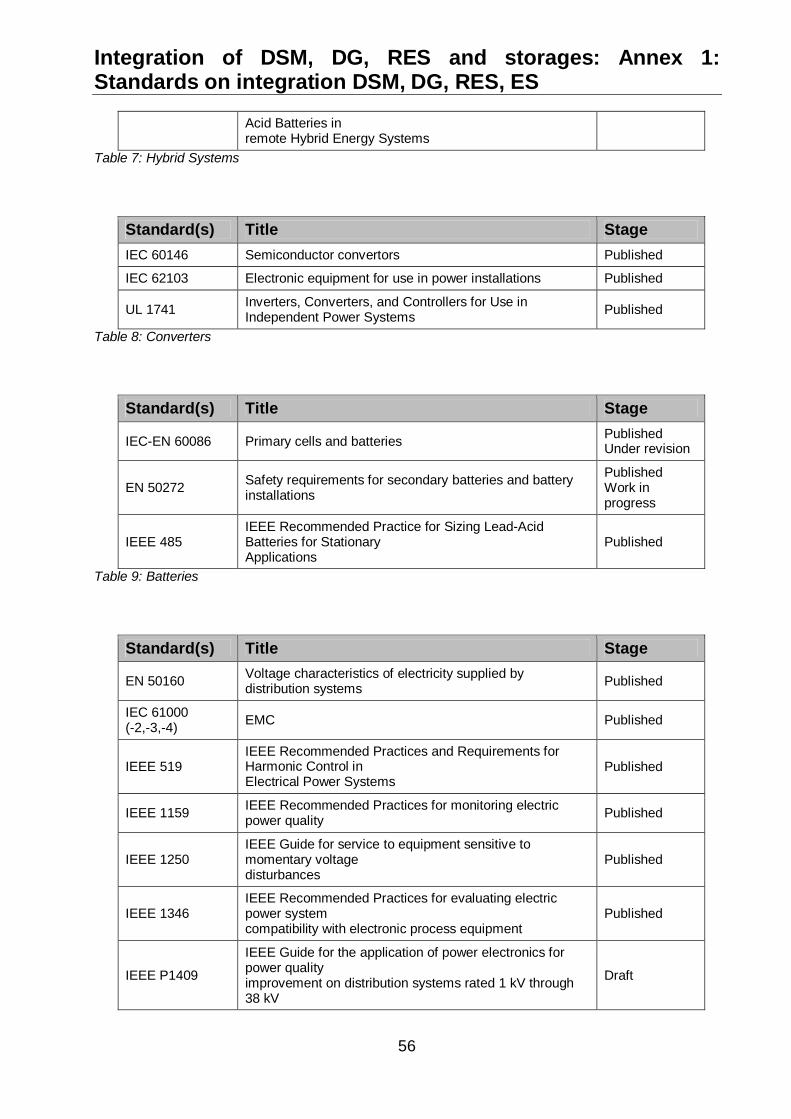
Integration of DSM, DG, RES and storages: Annex 1:Standards on integration DSM, DG, RES, ES
56
Acid Batteries inremote Hybrid Energy Systems
Table 7: Hybrid Systems
Standard(s) Title StageIEC 60146 Semiconductor convertors Published
IEC 62103 Electronic equipment for use in power installations Published
UL 1741 Inverters, Converters, and Controllers for Use inIndependent Power Systems Published
Table 8: Converters
Standard(s) Title Stage
IEC-EN 60086 Primary cells and batteries PublishedUnder revision
EN 50272 Safety requirements for secondary batteries and batteryinstallations
PublishedWork inprogress
IEEE 485IEEE Recommended Practice for Sizing Lead-AcidBatteries for StationaryApplications
Published
Table 9: Batteries
Standard(s) Title Stage
EN 50160 Voltage characteristics of electricity supplied bydistribution systems Published
IEC 61000(-2,-3,-4) EMC Published
IEEE 519IEEE Recommended Practices and Requirements forHarmonic Control inElectrical Power Systems
Published
IEEE 1159 IEEE Recommended Practices for monitoring electricpower quality Published
IEEE 1250IEEE Guide for service to equipment sensitive tomomentary voltagedisturbances
Published
IEEE 1346IEEE Recommended Practices for evaluating electricpower systemcompatibility with electronic process equipment
Published
IEEE P1409
IEEE Guide for the application of power electronics forpower qualityimprovement on distribution systems rated 1 kV through38 kV
Draft
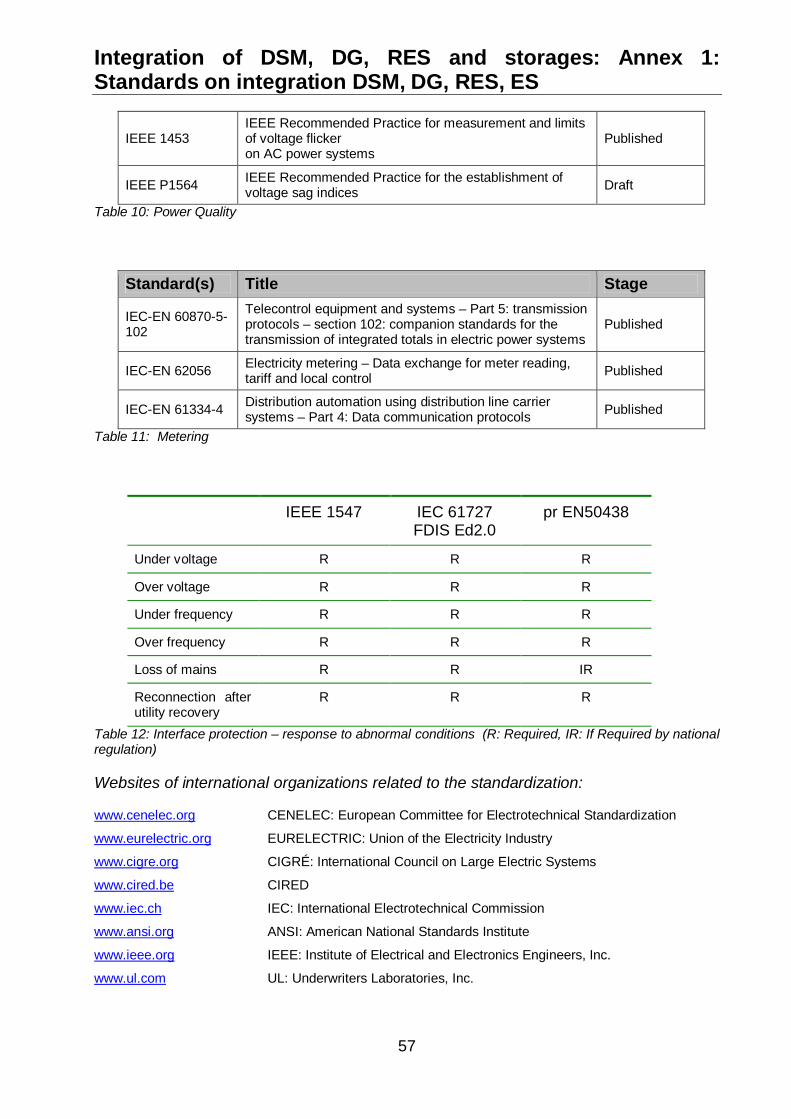
Integration of DSM, DG, RES and storages: Annex 1:Standards on integration DSM, DG, RES, ES
57
IEEE 1453IEEE Recommended Practice for measurement and limitsof voltage flickeron AC power systems
Published
IEEE P1564 IEEE Recommended Practice for the establishment ofvoltage sag indices Draft
Table 10: Power Quality
Standard(s) Title Stage
IEC-EN 60870-5-102
Telecontrol equipment and systems – Part 5: transmissionprotocols – section 102: companion standards for thetransmission of integrated totals in electric power systems
Published
IEC-EN 62056 Electricity metering – Data exchange for meter reading,tariff and local control Published
IEC-EN 61334-4 Distribution automation using distribution line carriersystems – Part 4: Data communication protocols Published
Table 11: Metering
IEEE 1547 IEC 61727FDIS Ed2.0
pr EN50438
Under voltage R R R
Over voltage R R R
Under frequency R R R
Over frequency R R R
Loss of mains R R IR
Reconnection afterutility recovery
R R R
Table 12: Interface protection – response to abnormal conditions (R: Required, IR: If Required by nationalregulation)
Websites of international organizations related to the standardization:
www.cenelec.org CENELEC: European Committee for Electrotechnical Standardization
www.eurelectric.org EURELECTRIC: Union of the Electricity Industry
www.cigre.org CIGRÉ: International Council on Large Electric Systems
www.cired.be CIRED
www.iec.ch IEC: International Electrotechnical Commission
www.ansi.org ANSI: American National Standards Institute
www.ieee.org IEEE: Institute of Electrical and Electronics Engineers, Inc.
www.ul.com UL: Underwriters Laboratories, Inc.
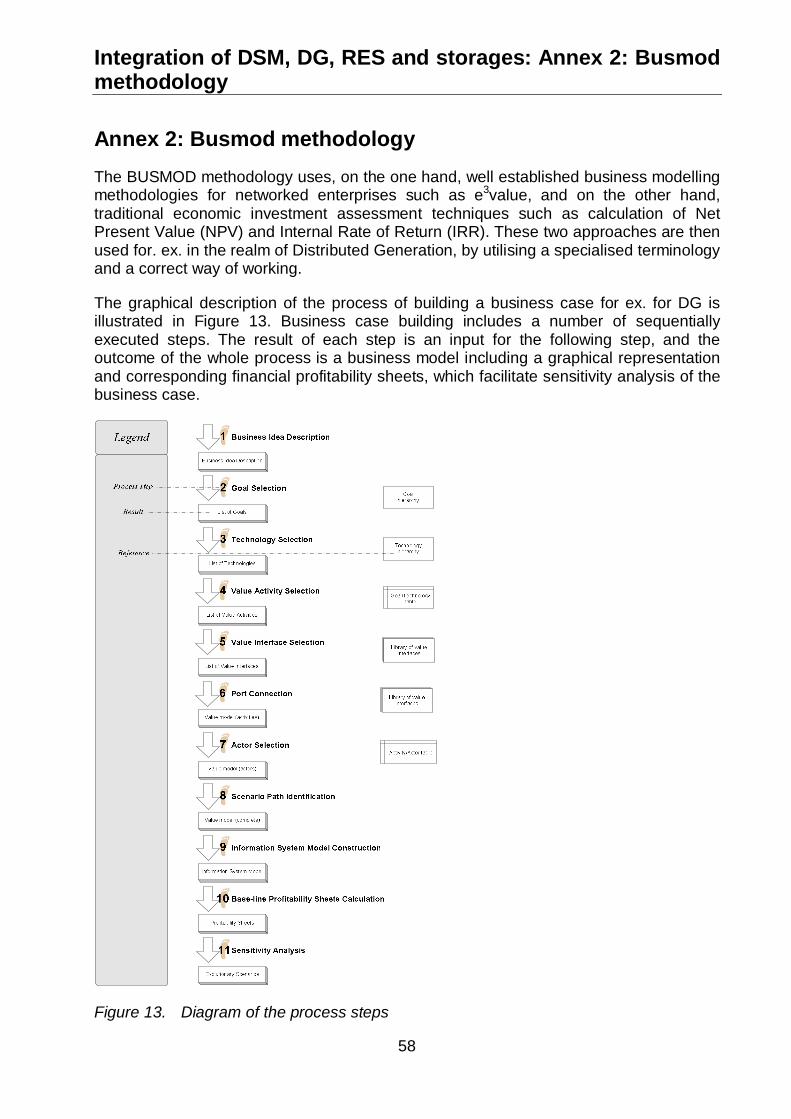
Integration of DSM, DG, RES and storages: Annex 2: Busmodmethodology
58
Annex 2: Busmod methodologyThe BUSMOD methodology uses, on the one hand, well established business modellingmethodologies for networked enterprises such as e3value, and on the other hand,traditional economic investment assessment techniques such as calculation of NetPresent Value (NPV) and Internal Rate of Return (IRR). These two approaches are thenused for. ex. in the realm of Distributed Generation, by utilising a specialised terminologyand a correct way of working.
The graphical description of the process of building a business case for ex. for DG isillustrated in Figure 13. Business case building includes a number of sequentiallyexecuted steps. The result of each step is an input for the following step, and theoutcome of the whole process is a business model including a graphical representationand corresponding financial profitability sheets, which facilitate sensitivity analysis of thebusiness case.
Figure 13. Diagram of the process steps
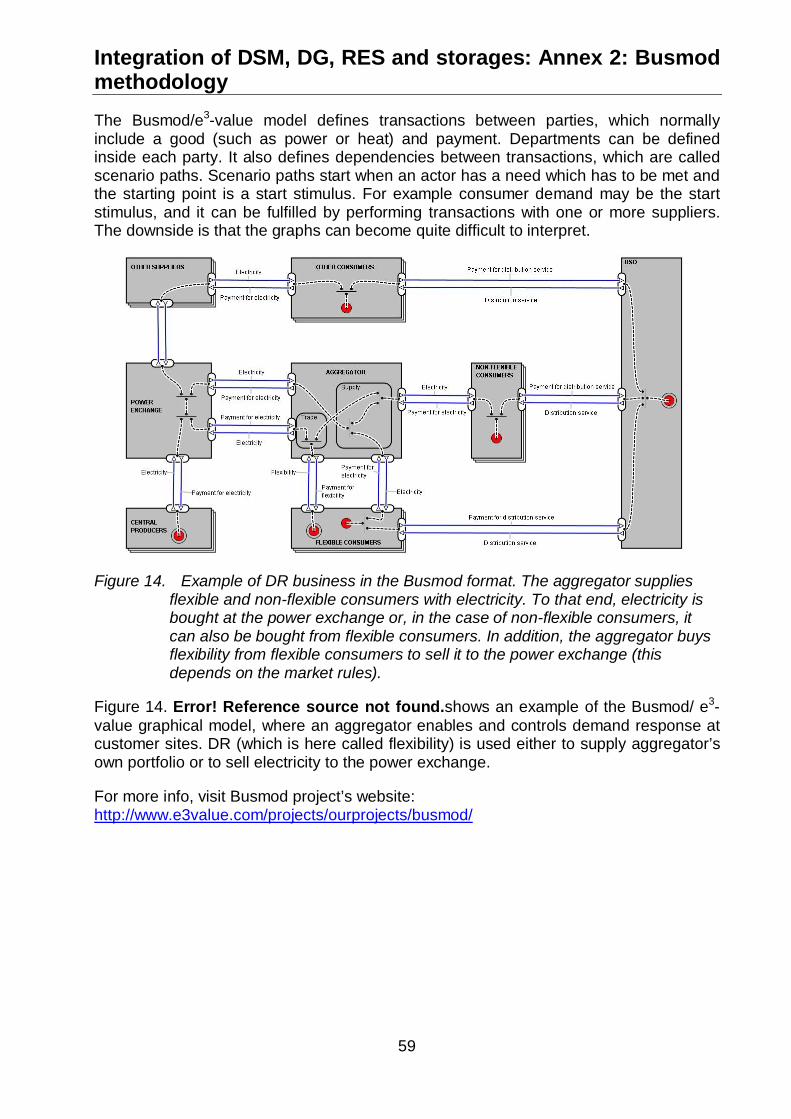
Integration of DSM, DG, RES and storages: Annex 2: Busmodmethodology
59
The Busmod/e3-value model defines transactions between parties, which normallyinclude a good (such as power or heat) and payment. Departments can be definedinside each party. It also defines dependencies between transactions, which are calledscenario paths. Scenario paths start when an actor has a need which has to be met andthe starting point is a start stimulus. For example consumer demand may be the startstimulus, and it can be fulfilled by performing transactions with one or more suppliers.The downside is that the graphs can become quite difficult to interpret.
Figure 14. Example of DR business in the Busmod format. The aggregator suppliesflexible and non-flexible consumers with electricity. To that end, electricity isbought at the power exchange or, in the case of non-flexible consumers, itcan also be bought from flexible consumers. In addition, the aggregator buysflexibility from flexible consumers to sell it to the power exchange (thisdepends on the market rules).
Figure 14. Error! Reference source not found.shows an example of the Busmod/ e3-value graphical model, where an aggregator enables and controls demand response atcustomer sites. DR (which is here called flexibility) is used either to supply aggregator’sown portfolio or to sell electricity to the power exchange.
For more info, visit Busmod project’s website:http://www.e3value.com/projects/ourprojects/busmod/
Integration of DSM, DG, RES and storages: Annex 3:Overview of IEA
60
Annex 3: Overview of IEA
Overview of the International Energy Agency (IEA) and theIEA Demand-Side Management Programme
The International Energy Agency
The International Energy Agency (IEA), established in 1974, is an intergovernmental body committed toadvancing security of energy supply, economic growth, and environmental sustainability. The policy goalsof the IEA include:
diversity, efficiency, and flexibility within the energy sector,the ability to respond promptly and flexibly to energy emergencies,environmentally-sustainable provision and use of energydevelopment and use of more environmentally-acceptable energy sources,improved energy -efficiency,research, development and market deployment of new and improved energy technologies, andundistorted energy pricesfree and open tradeco-operation among all energy market participants.
To achieve those goals, the IEA carries out a comprehensive program of energy cooperation and servesas an energy forum for its 26 member counties.
Based in Paris, the IEA is an autonomous entity linked with the Organization for Economic Cooperationand Development (OECD). The main decision-making body is the Governing Board, composed of seniorenergy officials from each Member Country. A Secretariat, with a staff of energy experts drawn fromMember countries and headed by an Executive Director, supports the work of the Governing Board andsubordinate bodies.
As part of its program, the IEA provides a framework for more than 40 international collaborative energyresearch, development and demonstration projects, known as Implementing Agreements, of which theDSM Programme is one. These operate under the IEA’s Energy Technology Collaboration Programmewhich is guided by the Committee on Energy Research and Technology (CERT). In addition, five WorkingParties (in Energy Efficiency, End Use, Fossil Fuels, Renewable Energy and Fusion Power) monitor thevarious collaborative energy agreements, identify new areas for cooperation and advise the CERT onpolicy matters.
IEA Demand Side Management Programme
The Demand-Side Management (DSM) Programme, which was initiated in 1993, deals with a variety ofstrategies to reduce energy demand. The following 19 member countries and the European Commissionhave been working to identify and promote opportunities for DSM:
Australia JapanAustria KoreaBelgium The NetherlandsCanada NorwayDenmark New ZealandFinland SpainFrance SwedenGreece United StatesIndia United KingdomItaly
Integration of DSM, DG, RES and storages: Annex 3:Overview of IEA
61
Programme Vision: In order to create more reliable and more sustainable energy systems and markets,demand side measures should be the first considered and actively incorporated into energy policies andbusiness strategies.
Programme Mission: To deliver to our stakeholders useful information and effective guidance for craftingand implementing DSM policies and measures, as well as technologies and applications that facilitateenergy system operations or needed market transformations.
The Programme’s work is organized into two clusters: The load shape cluster, and The load level cluster.
The ‘load shape” cluster includes Tasks that seek to impact the shape of the load curve over very short(minutes-hours-day) to longer (days-week-season) time periods. The “load level” cluster includes Tasksthat seek to shift the load curve to lower demand levels or shift loads from one energy system to another.
A total of 18 projects or “Tasks” have been initiated since the beginning of the DSM Programme. Theoverall program is monitored by an Executive Committee consisting of representatives from eachcontracting party to the Implementing Agreement. The leadership and management of the individual Tasksare the responsibility of Operating Agents. These Tasks and their respective Operating Agents are:
Task 1 International Database on Demand-Side Management & Evaluation Guidebook on the Impact ofDSM and EE for Kyoto’s GHG Targets - CompletedHarry Vreuls, NOVEM, the Netherlands
Task 2 Communications Technologies for Demand-Side Management - CompletedRichard Formby, EA Technology, United Kingdom
Task 3 Cooperative Procurement of Innovative Technologies for Demand-Side Management – CompletedDr. Hans Westling, Promandat AB, Sweden
Task 4 Development of Improved Methods for Integrating Demand-Side Management into ResourcePlanning - CompletedGrayson Heffner, EPRI, United States
Task 5 Techniques for Implementation of Demand-Side Management Technology in the Marketplace -CompletedJuan Comas, FECSA, Spain
Task 6 DSM and Energy Efficiency in Changing Electricity Business Environments – CompletedDavid Crossley, Energy Futures, Australia Pty. Ltd., Australia
Task 7 International Collaboration on Market Transformation - CompletedVerney Ryan, BRE, United Kingdom
Task 8 Demand-Side Bidding in a Competitive Electricity Market - CompletedLinda Hull, EA Technology Ltd, United Kingdom
Task 9 The Role of Municipalities in a Liberalised System - CompletedMartin Cahn, Energie Cites, France
Task 10 Performance Contracting - CompletedDr. Hans Westling, Promandat AB, Sweden
Task 11 Time of Use Pricing and Energy Use for Demand Management Delivery- CompletedRichard Formby, EA Technology Ltd, United Kingdom
Task 12 Energy StandardsTo be determined

Integration of DSM, DG, RES and storages: Annex 3:Overview of IEA
62
Task 13 Demand Response Resources - CompletedRoss Malme, RETX, United States
Task 14 White Certificates – CompletedAntonio Capozza, CESI, Italy
Task 15 Network-Driven DSMDavid Crossley, Energy Futures Australia Pty. Ltd, Australia
Task 16 Competitive Energy ServicesJan W. Bleyl, Graz Energy Agency, AustriaSeppo Silvonen/Pertti Koski, Motiva, Finland
Task 17 Integration of Demand Side Management, Distributed Generation, Renewable Energy Sourcesand Energy StoragesSeppo Kärkkäinen, VTT, Finland
Task 18 Demand Side Management and Climate ChangeDavid Crossley, Energy Futures Australia Pty. Ltd, Australia
Task 19 Micro Demand Response and Energy SavingBarry Watson, EA Technology Ltd, United Kingdom
Task 20 Branding of Energy EfficiencyBalawant Joshi, ABPS Infrastructure Private Limited, India
Task 21 Standardisation of Energy Savings CalculationsHarry Vreuls, SenterNovem, Netherlands
For additional Information contact the DSM Executive Secretary, Anne Bengtson, Box 47096, 100 74Stockholm, Sweden. Phone: +46 8 510 50830, Fax: +46 8 510 50830. E-mail: [email protected]
Also, visit the IEA DSM website: http://www.ieadsm.org