INTEGRATED RISK MODELLING TOOLKIT AND DATABASE … · integrated risk modelling toolkit and...
9
1 INTEGRATED RISK MODELLING TOOLKIT AND DATABASE FOR EARTHQUAKE RISK ASSESSMENT Bijan KHAZAI 1 , Christopher BURTON 2 , Paolo TORMENE 3 , Christopher POWER 4 , Marco BERNASOCCHI 5 , James E. DANIELL 6 , Benjamin WYSS 7 ABSTRACT The purpose of this paper is to outline the methodology and workflow of the Integrated Risk Modelling Toolkit and database of the Global Earthquake Model (GEM). The Integrated Risk Modelling Toolkit was developed to allow users to meaningfully integrate quantitative assessments of social and economic conditions that affect impacts and loss with physical risk estimates for earthquakes. The Integrated Risk Modelling Toolkit for integrated risk assessment is being designed to allow user-data inputs enabling high resolution and bottom-up quantitative analyses (e.g. local-level analysis that is participatory and regionally and context specific) for the development of social, economic, and integrated risk indices. Moreover, it is intended that the software tool will allow users manipulate and interact with all of the data, which may be inputs to both physical earthquake risk and social vulnerability models. INTRODUCTION For a holistic evaluation of potential adverse earthquake impacts to people and property, a set of metrics, methods, and open source software tools are being incorporated into the Global Earthquake Model’s (GEM) framework for assessing seismic risk beyond the estimation of direct physical impacts and loss of life. This is being accomplished using an integrated risk perspective by incorporating the socio-economic characteristics of populations with estimates of physical earthquake risk (i.e. estimates of human or economic loss). This integrated perspective supports the assessment of both an earthquake event’s physical impact potential as well as the human dimensions within a hazard zone. While there are a myriad of approaches to understanding seismic impacts that include the delineation of physical vulnerability, social vulnerability, and risk, it is the dynamic interrelationships between these that are the focal point for policy makers, planners, emergency managers, and other stakeholders (Cutter et al. 2008). Social vulnerability as used in the work is defined as pre-event, inherent characteristics or qualities of systems that create the potential for harm. This paper presents current developments in GEM on the open source integrated risk modelling software tool and the associated spatially-enabled and open databases, to address the differential susceptibility of populations to impacts from damaging 1 Senior Scientist, Karlsruhe Institute of Technology, Karlsruhe, Germany, [email protected] 2 Senior Scientist, GEM Foundation, Pavia, Italy, [email protected] 3 Senior Software Developer, GEM Foundation, Pavia, Italy, [email protected] 4 Research Scientist, Karlsruhe Institute of Technology, Karlsruhe, Germany, [email protected] 5 Founder, opengis.ch, Sagogn, Switzerland, [email protected] 6 Research Scientist, Karlsruhe Institute of Technology, Karlsruhe, Germany, [email protected] 7 Spatial IT Developer, GEM Foundation, Pavia, Italy, [email protected]
Transcript of INTEGRATED RISK MODELLING TOOLKIT AND DATABASE … · integrated risk modelling toolkit and...
1
INTEGRATED RISK MODELLING TOOLKIT AND DATABASE FOR
EARTHQUAKE RISK ASSESSMENT Bijan KHAZAI1, Christopher BURTON2, Paolo TORMENE3, Christopher POWER4, Marco
BERNASOCCHI5, James E. DANIELL6, Benjamin WYSS7
ABSTRACT
The purpose of this paper is to outline the methodology and workflow of the Integrated Risk Modelling Toolkit and database of the Global Earthquake Model (GEM). The Integrated Risk Modelling Toolkit was developed to allow users to meaningfully integrate quantitative assessments of social and economic conditions that affect impacts and loss with physical risk estimates for earthquakes. The Integrated Risk Modelling Toolkit for integrated risk assessment is being designed to allow user-data inputs enabling high resolution and bottom-up quantitative analyses (e.g. local-level analysis that is participatory and regionally and context specific) for the development of social, economic, and integrated risk indices. Moreover, it is intended that the software tool will allow users manipulate and interact with all of the data, which may be inputs to both physical earthquake risk and social vulnerability models.
INTRODUCTION
For a holistic evaluation of potential adverse earthquake impacts to people and property, a set of metrics, methods, and open source software tools are being incorporated into the Global Earthquake Model’s (GEM) framework for assessing seismic risk beyond the estimation of direct physical impacts and loss of life. This is being accomplished using an integrated risk perspective by incorporating the socio-economic characteristics of populations with estimates of physical earthquake risk (i.e. estimates of human or economic loss). This integrated perspective supports the assessment of both an earthquake event’s physical impact potential as well as the human dimensions within a hazard zone. While there are a myriad of approaches to understanding seismic impacts that include the delineation of physical vulnerability, social vulnerability, and risk, it is the dynamic interrelationships between these that are the focal point for policy makers, planners, emergency managers, and other stakeholders (Cutter et al. 2008). Social vulnerability as used in the work is defined as pre-event, inherent characteristics or qualities of systems that create the potential for harm. This paper presents current developments in GEM on the open source integrated risk modelling software tool and the associated spatially-enabled and open databases, to address the differential susceptibility of populations to impacts from damaging
1 Senior Scientist, Karlsruhe Institute of Technology, Karlsruhe, Germany, [email protected] 2 Senior Scientist, GEM Foundation, Pavia, Italy, [email protected] 3 Senior Software Developer, GEM Foundation, Pavia, Italy, [email protected] 4 Research Scientist, Karlsruhe Institute of Technology, Karlsruhe, Germany, [email protected] 5 Founder, opengis.ch, Sagogn, Switzerland, [email protected] 6 Research Scientist, Karlsruhe Institute of Technology, Karlsruhe, Germany, [email protected] 7 Spatial IT Developer, GEM Foundation, Pavia, Italy, [email protected]

2
earthquake events. The first part of the paper presents the methodology for the construction, and analysis of the country and sub-country level socio-economic vulnerability databases that were sourced from free and publically available global data sources. The second part of the paper will focus on ongoing work on the development of the Integrated Risk Toolkit that was designed, in part, to make use of the databases that we describe below for measuring, understanding, and communicating risk in a manner in which physical risk estimates can be meaningfully combined with the social circumstances of populations. SOCIO-ECONOMIC VULNERABILITY DATABASE For use within the Integrated Risk Modelling Toolkit, a statistically robust, representative, and comprehensive spatially-enabled set of databases were developed for the measurement of social and economic vulnerability at national level (for the globe) and at the sub-national level for 19 countries in the Asia Pacific region. The primary stage in developing the databases was the collection, harmonization and analysis of relevant socio-economic variables from open and publically available sources and the development of a comprehensive taxonomy for social and economic vulnerability that can be used to structure relevant indicators at the different scales of geography, i.e. national, sub-national levels. The first step in harmonizing a global set of socio-economic data was to ensure relevance of the data through a process of reconciling and representing indicators within the domain of social and economic vulnerability research. The aim here is to draw on and harmonise the various international initiatives and establish a global database that can support development of metrics that are methodologically robust and generalisable for constructing, evaluating and validating complex indicators and indices of socio-economic vulnerability. A social vulnerability index is a mathematical model designed to measure characteristics within social systems that create the potential for loss or harm. An indicator is a qualitative or quantitative measure derived from observed facts that simplify and communicate the reality of a complex situation (Freudenburg 2003). An index (or composite index) is the mathematical combination of individual indicators that represent different dimensions of a concept that cannot be fully captured by any individual indicator alone and whose description is the objective of the analysis (Nardo et al. 2008). The determination of the most applicable indicators for social and economic vulnerability and implementation in the socio-economic databases was accomplished through an iterative process with four steps that built progressively upon each other (Figure 1). This process is discussed in the sections below.
Figure 1 The workflow in developing the socio-economic vulnerability database
3
Survey of Vulnerability and Resilience Assessments Work started with a thorough survey of existing vulnerability and resilience studies with the aim to determine the key indicators used in quantitative vulnerability assessments in literature. The survey covered over 440 articles and books and focused on operational and multidisciplinary studies that account for a broad range of determinants in natural, technical, social and economic systems. This led to the identification of 35 key articles that were selected from a broad range of academic disciplines (geography, economics, social sciences, earthquake engineering) and were classified based on their scale of analysis and hazard type. The selection process for the basic stock of literature was guided by the following criteria:
1) To include primarily vulnerability studies that had been operationalized and empirically implemented using indicators rather than studies that focus on developing theoretical frameworks of vulnerability.
2) To cover a broad range of vulnerability assessments in order to obtain an overview of the organization of vulnerability in different research fields and to extract relevant categories to structure the knowledge domain.
3) To include studies that – according to how often they are referred to by other studies - represent key references for the knowledge domain of vulnerability assessments.
Collaborative Taxonomy Development The aim of developing the taxonomy was to conceive a solution-oriented framework to allow for a process of comparability across different socio-economic indicators typically used in socio-economic vulnerability assessments. Based on the sub-selection of the 35 key vulnerability studies, an initial list of relevant indicators allowed the creation of a “wish-list” of approximately 330 indicators to measure socio-economic vulnerability. The large number of indicators that were compiled into the “wish-list” contained varying degrees of similarity between each other. Many of the indicators were easily classifiable into broad groups such as population, economy, health etc. Thus a taxonomy – a hierarchical system of relevant categories and sub-categories used to classify and retrieve the socio-economic vulnerability data – was developed to make the search and browse capabilities of the database content functional for use in software platforms that consume the data.
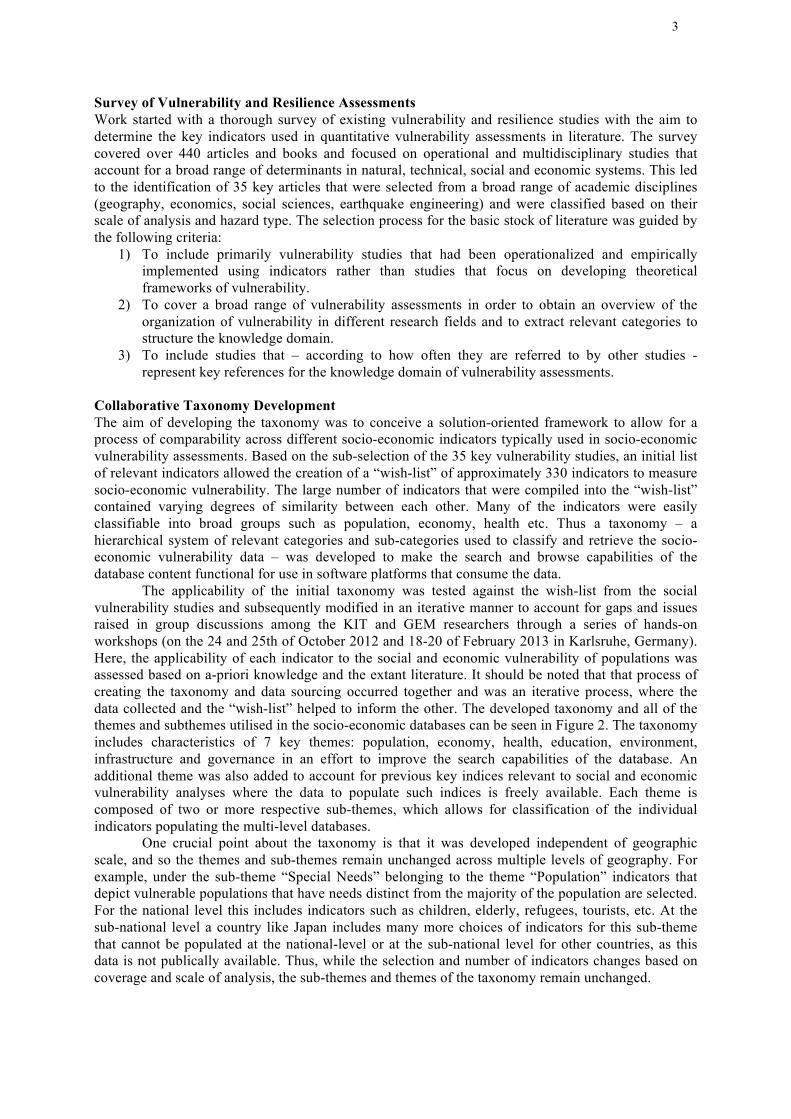
The applicability of the initial taxonomy was tested against the wish-list from the social vulnerability studies and subsequently modified in an iterative manner to account for gaps and issues raised in group discussions among the KIT and GEM researchers through a series of hands-on workshops (on the 24 and 25th of October 2012 and 18-20 of February 2013 in Karlsruhe, Germany). Here, the applicability of each indicator to the social and economic vulnerability of populations was assessed based on a-priori knowledge and the extant literature. It should be noted that that process of creating the taxonomy and data sourcing occurred together and was an iterative process, where the data collected and the “wish-list” helped to inform the other. The developed taxonomy and all of the themes and subthemes utilised in the socio-economic databases can be seen in Figure 2. The taxonomy includes characteristics of 7 key themes: population, economy, health, education, environment, infrastructure and governance in an effort to improve the search capabilities of the database. An additional theme was also added to account for previous key indices relevant to social and economic vulnerability analyses where the data to populate such indices is freely available. Each theme is composed of two or more respective sub-themes, which allows for classification of the individual indicators populating the multi-level databases.
One crucial point about the taxonomy is that it was developed independent of geographic scale, and so the themes and sub-themes remain unchanged across multiple levels of geography. For example, under the sub-theme “Special Needs” belonging to the theme “Population” indicators that depict vulnerable populations that have needs distinct from the majority of the population are selected. For the national level this includes indicators such as children, elderly, refugees, tourists, etc. At the sub-national level a country like Japan includes many more choices of indicators for this sub-theme that cannot be populated at the national-level or at the sub-national level for other countries, as this data is not publically available. Thus, while the selection and number of indicators changes based on coverage and scale of analysis, the sub-themes and themes of the taxonomy remain unchanged.
4
Figure 2 Themes and respective subthemes of the socio-economic database, labels in the red bubbles are the themes and the labels in the white bubbles are the subthemes. Data Collection The socio-economic vulnerability databases are sourced from free and publically available global data sources. No single publically available data source represented a comprehensive socio-economic database for use in social and economic vulnerability assessment at the global level or regional level. Thus, the first task was to compile the socio-economic data from across different sources into the country specific databases. 1,494 socio-economic variables were compiled and spatially referenced for 197 countries worldwide using 44 different publically available sources for the global database. At the sub-national level, a sum of 15,821 socio-economic indicators has been compiled and spatially-referenced for 19 countries in East Asia and Pacific region using publically available sources (Figure 3). The countries for which the sub-national databases were compiled are listed here according to highest count of publically available indicators (4412 for Japan) to lowest count of publically available indicators (29 for Brunei). In respective order the countries are Japan, Philippines, Taiwan, Cambodia, Vanuatu, Korea (Republic of), Myanmar, Thailand, New Zealand, China, Australia, Laos, Indonesia, Timor, Papua New Guinea, Malaysia, Vietnam, Solomon Islands and Brunei. The geographic level codes of the sub-national dataset correspond to the second sub-national level (Admin Level 2) of the Administrative Level Boundaries (SALB) Project of the United Nations. The selection of variables in all cases for the multi-level database was based on the extant literature on socio-economic vulnerability, and the indicators were classified using the taxonomy developed. In some cases, the sub-themes in the taxonomy developed based on the “wish-list” were further adjusted to be more representative of the actual data that was collected from free and publically available global data sources at the different levels of geography.
Database Reduction As variables from the different sources were not all unique, equally complete or consistent, or represented the needed dimensions of socio-economic vulnerability, a process of harmonisation had to take place to reduce the dataset to the most relevant, consistent, complete and recent set of variables. The underlying drivers that increase or decrease vulnerability are variable from country to country and the selection of indicators will always depend on the particular context or aspects of vulnerability that are being measured. Providing confidence in the database and indicators was a main objective of this work and was achieved by applying four measures of quality control and assurance to each indicator: Relevance (is the indicator relevant?); Completeness (how complete is the data?); Consistency (when was the data collected?) and Cross-Correlation (does it add new information?)

5
To reduce the full set of collected socio-economic indicators to a smaller parsimonious set of variables that potentially best represent social and economic vulnerability a two-pronged approach was applied to the national sub-national data: a statistical approach and expert-driven approach. Expert opinion informed by literature on social and economic vulnerability allowed for real-world knowledge to guide the process and prevent indicators being selected for inclusion in the databases on a purely statistical basis. Applying the knowledge of experts and reliance on the extant literature provides a qualitative solution to determining the key indicators required for a social and economic vulnerability database. This process identified 156 key indicators for the global level, and was iteratively applied to the sub-national level data.
Conversely statistical approaches were utilised to provide a statistical basis for the choice of indicators. As shown in Figure 3 the statistical approaches branch off in two distinct directions, completeness and correlation analyses. These two branches eventually join together to provide the indicators for use in the multivariate statistical analysis. Principle Components Analysis (PCA) is a multivariate technique used to consider interdependencies between variables. For the global level a PCA was used to investigate the common variance between the indicators and was interpreted to determine the statistically most important indicators for each sub-theme. The PCA was computed in SPSS version 20.0 for data reduction following the standard procedure outlined in Nardo et al., 2008. Combining the results of the PCA with the expert opinion ensured that most relevant indicators were not ignored by the statistical approach because they lacked 100% data completeness (a requirement for the PCA approach) or were correlated too highly with another variable (> ±0.9) and became redundant. A limit of ± 0.9 was utilised when considering the correlation coefficient between two variables was chosen because of a desire to only exclude those variables that are very highly correlated and together provided no significant additional information for socio-economic vulnerability.
Figure 3 Two-pronged approach for reducing the collected socio-economic data and developing the “Social and Economic Vulnerability Database”
With the information provided from the expert opinion and the PCA the indicators that passed
both processes were utilised for the social and economic vulnerability database. To provide the end user with information on applicability and justification for inclusion of an indicator in the database each indicator was provided with one of five tags. Depending upon context, an indicator may have more than one tag. Table 1 illustrates the possible tags and describes their meanings. The explanation of high, medium and low tags for “PCA chosen” indicators is based on two key pieces of information provided by the PCA: the variance explained by the extracted components and the weighting of each indicator (loading factor) in the subtheme upon the extracted components. Thus to gain a full understanding of which indicators are statistically most relevant within a subtheme the weighting of an indicator was multiplied by the variance explained by the component. The composite values within this list were then sorted from largest to smallest to provide a rank order of variables based on the statistically derived importance measure. Those indicators with factor loadings greater than ± 0.3 were removed from the social and economic vulnerability database, unless expert opinion considered them important. The list contained 317 indicators and was divided into thirds, with the indicators in the first third given the tag “PCA high” and second third “PCA Medium” and the last third “PCA Low” to signify their importance as indicators for the social vulnerability database.

6
Table 1: List of indicator tags in the social and economic vulnerability database
Indicator Tag Description
Expert Indicator was selected during the expert opinion stage
PCA High Top 1/3 of PCA indicators PCA Medium Middle 1/3 of PCA indicators
PCA Low Bottom 1/3 of PCA indicators but still loaded higher than 0.3 on a component
No PCA possible Indicators chosen by expert opinion. Indicators in the social vulnerability database with this tag will always be accompanied by the “Expert” tag.
For the sub-national database reducing the 15,821 socio-economic indicators of the 19 state
databases into a smaller parsimonious set of variables that best represent social and economic vulnerability cluster analysis was performed. Cluster Analysis (Specifically a Two Step Cluster Analysis - TSCA) groups together variables into cases that represent a common similarity and can be considered the reverse of factor analysis (Field, 2005). The TSCA investigates the variance between the indicators and was interpreted to determine the statistically most important indicators for each sub-theme. This reduced 19 socio-economic databases into a total 127 key indicators after all the analyses.
INTEGRATED RISK MODELLING TOOLKIT The Integrated Risk Modeling Toolkit is a geospatial modeling tool that will be available as part of the OpenQuake platform in November 2014. To support the integrated assessment of seismic risk within OpenQuake, the toolkit was designed to facilitate the meaningful convolution of estimates of physical earthquake risk with an index of social vulnerability. Here, the physical earthquake risk of a given study area may be calculated within OpenQuake by combining estimates of seismic hazard and exposure with physical vulnerability using a number of calculation workflows. The Integrated Risk Modelling Toolkit provides the platform for the development of socio-economic indicators and composite indices.
For the integrated risk modelling process and workflow, the Integrated Risk Modelling Toolkit leverages the QGIS platform. A GIS-based development platform was chosen explicitly to utilize a geographic information system’s ability to manipulate, analyse, manage, and present spatial information. QGIS was chosen due to its transparent and open-source philosophy in its development. As part of the tool’s design, elements of the Multi Criteria Decision Analysis (MCDA) software that was developed at the Karlsruhe Institute of Technology (KIT) was adopted. Here, the workflow for the development of indices consists of an “ideal sequence” of steps, from the selection of variables to the presentation and dissemination of the integrated risk assessment. Each step is extremely important, and coherence in the whole process is vital. Choices made in one step can have important implications for others: therefore, the analyst has not only to make the most appropriate methodological choices in each step, but also to identify whether the choices fit together. The intent is for the toolkit to guide the user through this process via a workflow that facilitates: 1) the selection of sub-indicators (variables); 2) the normalization of indicators; 3) assessment of the relationships between data; 4) weighting and aggregation; 5) risk integration; and 6) presentation of the results. A brief description of the tool’s components and the theoretical underpinnings of procedures needed to accomplish the workflow are outlined in the sub-sections below.
Variable selection: The selection of variables often comprises the first step of composite index development. It is within this context that the strengths and weaknesses of indices are derived from the quality of the underlying variables selected for a given purpose. Variables should be selected based on their relevance to the phenomenon being measured, their analytical soundness, coverage, and accessibility (Nardo et al 2008). While there may be no definitive set of indicators for a given purpose (including the measurement of social vulnerability and integrated risk), proxy measures may be used to represent a given phenomenon. Upon initiation of the tool, users are given a direct link to the GEM socio-economic vulnerability databases that provide a set of proxy variables for measuring social vulnerability that have been stringently tested for representativeness, robustness, coverage and analytical soundness. Within the QGIS interface, a series of menus are provided that will give users

7
the option to select a given study area (e.g. region, country, sub-country, etc.). The selection initiates a spatial query of the respective database to facilitate the user’s selection of relevant data and the rendering of the relevant geometries for the construction of mapped indices. Users will then have the option to populate a GIS attribute table based on the selection of data within the categorizations and sub-categorizations of variables outlined in the sections above (see Figure 4). Users will also have the opportunity input their own data in a shapefile (.shp) or comma-separated values (.csv) format.
Figure 4: Data selection module. Data normalization: Once variables are selected, they should be normalized before being aggregated into a composite index. This is because data are often compiled or delineated in a number of statistical units. Variables are normalized to avoid problems inherent when mixing measurement units, and normalization is employed to avoid having extreme values dominating a variable’s variance, and to partially correct for data quality problems. Perhaps the most desirable approach for data normalization is the use of standard deviations. This approach converts all variables to a common scale by assuming a normal distribution, e.g. a mean of 0 and a standard deviation of 1. Scaling a given indicator via a standard deviation of 1 implies that positive values represent an above average performance on a particular observation, whereas negative values indicate below average performance.
A number of methods for normalizing indicators are provided within the Integrated Risk Modelling Toolkit. Current normalization functions within the toolkit include: 1) data ranking which is the simplest normalization technique; 2) standardization (or z-scores); 3) Min-Max rescaling which normalizes indicators to have an identical range [0,1] by subtracting the minimum value and dividing by the range of indicator values; 4) logarithm transformation which is commonly used for positively skewed data; and 5) a series of quadratic or U-shaped functions. Future development within this module will include the application of additional normalization functions (e.g. Sigmoid functions) and the implementation of sensitivity tests to give users the ability to gauge the impact of the transformation of data on their index outputs. The assessment of the relationships between the sub-indicators: A multivariate analysis is a subsequent step that is utilized for composite index development. Although not currently implemented at the time of this writing, it is envisioned that software will provide the means for users to conduct exploratory data analysis to investigate the overall structure of the data. Weighting and aggregation: Central to the construction of composite indices is the need to meaningfully combine different data dimensions in a manner in which consideration is given to
8
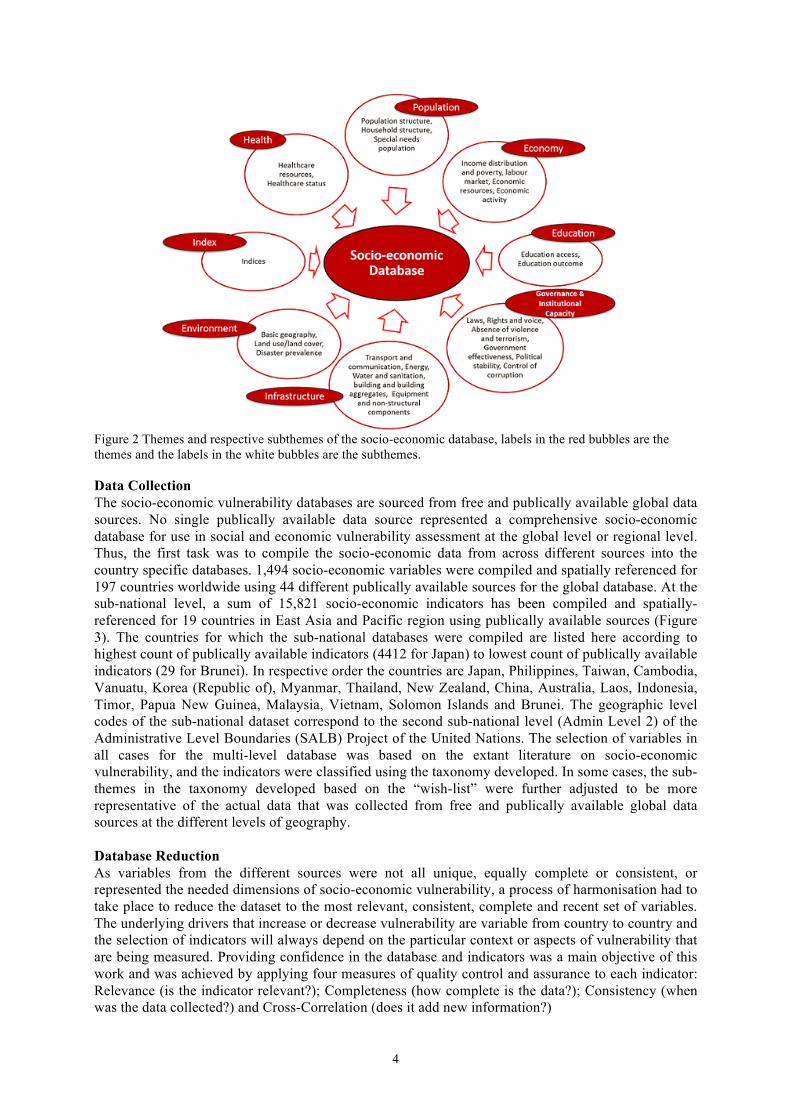
variable weighting. Most composite indices rely on equal weighting largely for simplicity. However, equal weighting implies that all variables within an index are of equal importance. The latter may not actually be the case, however. Version 1.0 of the toolkit will provide methods for weighting based on participatory approaches. These include the incorporation of weights based on the use of the Analytic Hierarchy Process (AHP) and the input of weights based on a graphical view of the hierarchical structure of the data (see Figure 5).
A complimentary step to weighting is aggregation. Different aggregation rules can be applied within the software depending on the underlying theoretical framework chosen for a modelling process. For instance, indicators or sub-indicators may be summed up (linear aggregation), multiplied to correct for compensability (i.e. the possibility of offsetting a deficit in some dimension with an outstanding performance in another), or aggregated using weighted averages. Sensitivity analysis capabilities will be included to help the user understand the impact of weighting and aggregation decisions on the model output.
Figure 5: Weighting of indicators. Risk integration: The development of an integrated risk model within the Integrated Risk Toolkit arises from the convolution of two main components: estimations of physical risk and a social vulnerability index. The convolution of the risk and social vulnerability components can be accomplished by, first, importing risk assessments from OpenQuake using the toolkit’s risk important tools, and then by standardizing the data to render it commensurate. The data can then be meaningfully combined via the use of the QGIS field calculator that is linked to the toolkit as part of the workflow to simplify the risk integration process.
A number of techniques exist for the convolution of estimates of physical risk with a social vulnerability index, and these may be implemented within the tool. One such example is a method of aggregation based on the work of Carreño et al. (2007; 2012). In this method, the direct potential
impact of an earthquake (in a general sense) is denoted as where is a total risk
index, is a physical earthquake risk estimation such as average annual loss (AAL), and is a composite social vulnerability index which is described within the context of the authors’ work as an aggrevating coefficient of the estimated loss. Presentation of the results: Composite indices and calculations of integrated risk may be visualized and presented in a number of different ways, which can influence their interpretation. Figure 6 provides an example of a mapped integrated risk analysis for counties in Portugal developed using
( )FRR FT += 1 TR
FR F

9
OpenQuake and the Integrated Risk Modelling Toolkit. When visualized in the form of a map, geographic variations in risk, social vulnerability, and integrated risk are evident. For instance, the greatest seismic risk occurs in the southeast portion of the country and includes Lisboa, the largest city and capital of Portugal. The spatial distribution of social vulnerability displays a different pattern where the socially vulnerable populations tend to reside in rural areas outside of the high-risk zones. Exceptions exist, however, where counties are exposed to considerable risk of loss and that also contain highly social vulnerable populations. These are captured within the integrated risk map.
Figure 6: Integrated risk mapping.
CONCLUSIONS
The Integrated Risk Modelling Toolkit and the social and economic vulnerability indicator databases were developed for the different geographic levels to be utilized for informed socio-economic vulnerability and integrated risk assessments within OpenQuake. The socio-economic vulnerability database does not aim to measure absolute levels of social and economic vulnerability for the globe. The underlying drivers that increase or decrease vulnerability are variable from country to country and the selection of indicators will always depend on the particular context or aspects of vulnerability that are being measured. Thus, the objective in the Integrated Risk Modelling Toolkit and the accompanying socio-economic vulnerability database is not provide a closed (one-size-fits-all) solution. On the contrary, the aim is to provide the user with a choice of indicators and a variety of methods for normalizing, weighting, aggregating and analyzing the data in order to construct the most appropriate index that is relevant to the context at hand. In the GEM Social Vulnerability and Integrated Risk Project, a number of “Use Cases” will demonstrate the development of particular indicator frameworks (i.e. variable selection, weighting, and aggregation) which are tested and validated (either statistically or through stakeholder interaction) for a set of defined contexts and can be used as example implementations of the integrated risk assessment toolkit and database. REFERENCES Carreño, M.L., O.D. Cardona, and A.H. Barbat, 2007a: Urban seismic risk evaluation: A holistic approach.
Journal of Natural Hazards, 40(1), 137-172 Cutter, S.L., C.G. Burton, and C.T. Emrich, 2010. "Disaster Resilience Indicators for Benchmarking Baseline
Conditions," Journal of Homeland Security and Emergency Management, 7(1), Article 51. Freudenberg M (2008) Composite Indicators of Country Performance: A Critical Assessment, OECD
Publishing, Paris Nardo M, Saisana M, Saltelli A, Tarantola S (2008). Handbook on Constructing Composite Indicators:
Methodology and User Guide, OECD Publishing, Paris