INTEGRATED RESOURCE PLAN 2017 - Idaho Power · 2017-12-07 · APPENDIX D: B2H SUPPLEMENT...
172
2017 IRP DECEMBER • 2017 INTEGRATED RESOURCE PLAN APPENDIX D: B2H SUPPLEMENT
Transcript of INTEGRATED RESOURCE PLAN 2017 - Idaho Power · 2017-12-07 · APPENDIX D: B2H SUPPLEMENT...

2017IRP
DECEMBER • 2017
INTEGR ATED RESOURCE PL AN
APPENDIX D: B2H SUPPLEMENT

Printed on recycled paper
SAFE HARBOR STATEMENT
This document may contain forward-looking statements, and it is important to note that the future results could differ materially from those discussed. A full discussion of the factors that could cause future results to differ materially can be found in Idaho Power’s filings with the Securities and Exchange Commission.

2017IRP
DECEMBER • 2017
INTEGR ATED RESOURCE PL AN
APPENDIX C: TECHNICAL REPORT
APPENDIX D: B2H SUPPLEMENT
ACKNOWLEDGEMENTResource planning is an ongoing process at Idaho Power. Idaho Power prepares, files, and publishes an Integrated Resource Plan (IRP) every two years. Idaho Power expects that the experience gained over the next few years will likely modify the 20-year resource plan presented in this document.
Idaho Power invited outside participation to help develop the 2017 IRP. Idaho Power values the knowledgeable input, comments, and discussion provided by the Integrated Resource Plan Advisory Council and other concerned citizens and customers.
It takes approximately one year for a dedicated team of individuals at Idaho Power to prepare the IRP. The Idaho Power team is comprised of individuals that represent many departments within the company. The IRP team members are responsible for preparing forecasts, working with the advisory council and the public, and performing all the analyses necessary to prepare the resource plan.
Idaho Power looks forward to continuing the resource planning process with customers, public-interest groups, regulatory agencies, and other interested parties. You can learn more about the Idaho Power resource planning process at idahopower.com.

Idaho Power Company Appendix D—B2H Supplement
2017 IRP Page i
TABLE OF CONTENTS Table of Contents ............................................................................................................................. i
List of Tables ................................................................................................................................. iv
List of Figures ..................................................................................................................................v
List of Appendices ...........................................................................................................................v
Executive Summary .........................................................................................................................1
Resource Need Evaluation ...............................................................................................................5
Capacity Needs ..........................................................................................................................5
IRP Guideline Language—Transmission Evaluated on Comparable Basis ..............................5
Boardman to Hemingway as a Resource ...................................................................................6
Capacity Costs .....................................................................................................................6
Energy Cost ..........................................................................................................................7
Market Overview .......................................................................................................................8
Power Markets .....................................................................................................................8
Mid-C Market ......................................................................................................................8
Mid-C and Idaho Power .....................................................................................................10
Modeling of the Mid-C Market in the IRP ........................................................................11
B2H Comparison to Other Resources ......................................................................................11
Idaho Power’s Transmission System .......................................................................................12
Transmission Capacity Between Idaho Power and the Pacific Northwest ..............................13
Montana–Idaho Path Utilization ........................................................................................15
Idaho to Northwest Path Utilization ..................................................................................16
Regional Planning—Studies and Conclusions.........................................................................16
The B2H Project ............................................................................................................................17
Project History .........................................................................................................................17
Public Participation ..................................................................................................................17
Project Activities ......................................................................................................................20
2006....................................................................................................................................20

Appendix D—B2H Supplement Idaho Power Company
Page ii 2017 IRP
2007....................................................................................................................................20
2008....................................................................................................................................20
2009....................................................................................................................................20
2010....................................................................................................................................20
2011....................................................................................................................................20
2012....................................................................................................................................21
2013....................................................................................................................................21
2014....................................................................................................................................21
2015....................................................................................................................................21
2016....................................................................................................................................21
2017....................................................................................................................................21
Route History ...........................................................................................................................22
B2H Capacity Interest ..............................................................................................................27
Capacity Rating—WECC Rating Process ...............................................................................28
B2H Design ........................................................................................................................29
Transmission Line Design ...........................................................................................29
Transmission Line Structural Loading Considerations................................................31
Transmission Line Foundation Design ........................................................................32
Lightning Performance ................................................................................................33
Earthquake Performance ..............................................................................................33
Wildfire .......................................................................................................................34
Wind Gusts/Tornados ..................................................................................................34
Ice .......................................................................................................................34
Landslide ......................................................................................................................34
Flood .......................................................................................................................35
Direct Physical Attack .................................................................................................35
B2H Design Conclusions .............................................................................................35
Project Co-Participants ..................................................................................................................35
Idaho Power Company Appendix D—B2H Supplement
2017 IRP Page iii
PacifiCorp and BPA Needs ......................................................................................................35
PacifiCorp ..........................................................................................................................36
BPA ....................................................................................................................................37
Co-Participant Expenses Paid to Date .....................................................................................37
Co-Participant Agreements ......................................................................................................38
Cost ................................................................................................................................................38
Cost Estimate ...........................................................................................................................38
Transmission Line Estimate ...............................................................................................39
Substation Estimates ..........................................................................................................39
Calibration of Cost Estimates ............................................................................................39
Costs Incurred to Date .......................................................................................................40
Cost-Estimate Conclusions ................................................................................................40
Transmission Revenue .............................................................................................................40
Potential BPA and Idaho Power Asset Swap ...........................................................................41
Benefits ..........................................................................................................................................42
Capacity ...................................................................................................................................42
Avoid Constructing New Resources (and Potentially Carbon-Emitting Resources ................43
Improved Economic Efficiency ...............................................................................................44
Renewable Integration .............................................................................................................44
Grid Reliability/Resiliency ......................................................................................................45
Resource Reliability .................................................................................................................46
Reduced Electrical Losses .......................................................................................................47
Flexibility .................................................................................................................................47
EIM .........................................................................................................................................48
B2H Complements All Resource Types ............................................................................48
B2H Benefits to Oregon...........................................................................................................49
Economic and Tax Benefits ...............................................................................................49
Local Area Electrical Benefits ...........................................................................................49

Appendix D—B2H Supplement Idaho Power Company
Page iv 2017 IRP
Risk ................................................................................................................................................50
Capital-Cost Risk .....................................................................................................................51
Market Price Risk ....................................................................................................................52
Liquidity and Market Sufficiency Risk ....................................................................................52
Data Point 1. Peak Load Analysis from Table 6 ................................................................53
Data Point 2. Pacific Northwest Power Supply Adequacy Assessment for 2022—Northwest Power Conservation Council Report ................................................................53
Data Point 3: 2016 Pacific Northwest Loads and Resources Study—BPA.......................54
Data Point 4: Northwest and California Renewable Portfolio Standards ..........................57
Market Sufficiency and Liquidity Conclusions .................................................................57
Co-Participant Risks ................................................................................................................57
Siting Risk ................................................................................................................................58
Schedule Risk...........................................................................................................................58
Catastrophic Event Risk ...........................................................................................................59
Project Activities ............................................................................................................................59
Schedule Update ......................................................................................................................59
Permitting ...........................................................................................................................59
Post-Permitting ..................................................................................................................60
Conclusions ....................................................................................................................................61
LIST OF TABLES Table 1. Total capital $/kW for select resources considered in the 2017 IRP
Table 2. High-level differences between resource options
Table 3. Pacific Northwest to Idaho Power import transmission capacity from the 2016 transmission forecast
Table 4. The Idaho to Northwest Path (WECC Path 14) summer allocation
Table 5. B2H joint permit funding capacity interests by funder
Table 6. 2026 peak load estimates—illustration of load diversity between western regions

Idaho Power Company Appendix D—B2H Supplement
2017 IRP Page v
Table 7. NERC—AC transmission circuit sustained outage metrics
Table 8. NERC forced-outage rate information for a fossil or gas power plant
Table 9. Projected annual B2H tax expenditures by county
Table 10. 2027 data points from Figure 12
LIST OF FIGURES Figure 1. Northwest regional forecast (Source: 2017 PNUCC)
Figure 2. Idaho Power transmission system map
Figure 3. Routes developed by the CAP advisory teams (2009 timeframe)
Figure 4. B2H proposed route resulting from the CAP process (2010 timeframe)
Figure 5. BLM final EIS routes
Figure 6. BLM Agency Preferred route from the 2017 BLM ROD
Figure 7. B2H route submitted in 2017 EFSC Application for Site Certificate
Figure 8. Transmission tower components
Figure 9. Comparison of total portfolio costs from 2017 IRP (Table 9.3 in 2017 IRP)
Figure 10. Correlation between Mid-C market prices and natural gas prices
Figure 11. 2021–22 LOLP by month (Source: NWPCC northwest analysis)
Figure 12. January, June, and July forecast Pacific Northwest resource surplus/deficit (Source: 2016 BPA White Book)
LIST OF APPENDICES Appendix D-1.Transmission line alternatives to the proposed B2H 500-kV
transmission line
Appendix D-2.Detailed list of notable project milestones
Appendix D-3.B2H funding agreement
Appendix D-4.B2H MOU
Appendix D-5.NTTG studies

Appendix D—B2H Supplement Idaho Power Company
Page vi 2017 IRP
This page left blank intentionally.

Idaho Power Company Appendix D—B2H Supplement
2017 IRP Page 1
EXECUTIVE SUMMARY The Boardman to Hemingway Transmission Line Project (B2H) is a planned 500-kilovolt (kV) transmission project that would span between the Hemingway 500-kV substation near Marsing, Idaho, and the proposed Longhorn Substation near Boardman, Oregon. Once operational, B2H will provide Idaho Power increased access to reliable, low-cost market energy purchases from the Pacific Northwest. Idaho Power’s planned capacity interest in B2H will increase the availability of capacity and energy of the Pacific Northwest market by 500 megawatts (MW) during the summer months, when energy demand from Idaho Power’s customers is at its highest. B2H (including early versions of the project) has been a cost-effective resource identified in each of Idaho Power’s integrated resource plans (IRP) since 2006 and continues to be a cornerstone of Idaho Power’s 2017 IRP preferred resource portfolio. In the 2017 IRP, as has been the case in prior IRPs, the B2H project is not simply evaluated as a transmission line, but rather as a resource that will be used to serve Idaho Power load. That is, the B2H project, and the market purchases it will facilitate, is evaluated in the same manner as a new combined-cycle gas plant, or a new utility-scale solar complex.
As a resource, the B2H project is demonstrated to be the most cost-effective method of serving projected customer demand. In the 2017 IRP, B2H was identified as the least-cost and least-risk resource to serve peak-hour load deficits forecast to occur beginning in 2026. As can be seen in Table 9.3, page 111 of the 2017 IRP, the four lowest-cost resource portfolios (P1, P4, P7, and P10) each included B2H. The information presented in Table 9.3 also indicates that the next lowest-cost portfolio that does not include B2H had a present-value portfolio cost of approximately $147 million dollars greater than Idaho Power’s preferred resource portfolio, P7. When compared to other individual resource options, B2H is also the least-cost option in terms of both capacity cost and energy cost. B2H is expected to have a capacity cost that is 71 percent lower than either a combined-cycle gas plant or utility-scale solar alternatives.1 B2H is also expected to have a levelized cost of energy that is 22 percent lower than a combined-cycle gas plant and 38 percent lower than utility-scale solar.2 As a resource alone, B2H is the lowest-cost alternative to serve Idaho Power’s customers in Oregon and Idaho. As a transmission line, B2H also offers incremental ancillary benefits and additional operational and resource integration flexibility.
In addition to being the least-cost, lowest-risk resource to meet Idaho Power’ resource needs, the B2H project has received national recognition for the benefits it will provide. The B2H
1 2017 IRP, page 87, Figure 7.5. 2 2017 IRP, page 89, Figure 7.6.
Footnotes continued on the next page.
Appendix D—B2H Supplement Idaho Power Company
Page 2 2017 IRP
project was selected by the Obama administration as one of seven nationally significant transmission projects that, when built, will help increase electric reliability, integrate new renewable energy into the grid, create jobs, and save consumers money. Most recently, B2H was acknowledged as complementing the Trump Administration’s America First Energy Plan, which addresses all forms of domestic energy production. In a November 17, 2017, United States (US) Department of the Interior press release,3 B2H was held up as “a Trump Administration priority focusing on infrastructure needs that support America’s energy independence…” The release went on to say, “This project will help stabilize the power grid in the Northwest, while creating jobs and carrying low-cost energy to the families and businesses who need it…” The benefits B2H is expected to bring to the region and nation have been recognized across both major political parties.
Under a 2012 B2H Permit Funding agreement, Idaho Power is allocated a 21.2-percent project interest, with PacifiCorp and Bonneville Power Administration (BPA) subscribed for the remainder of the line’s capacity. The agreement will allow Idaho Power customers to benefit from the project’s economies of scale and from load diversity between the project co-participants. While Idaho Power’s 21.2-percent share would provide for an annual average of 350 MW of west-to-east import capacity, the agreement is structured to provide Idaho Power with 500 MW of import capacity during the summer months, when Idaho Power experiences peak demand, and 200 MW of import capacity in the winter months, when the load-serving need is less.
The total cost estimate for the B2H project is $1 to $1.2 billion dollars, which includes Idaho Power’s allowance for funds used during construction (AFUDC). Co-participant AFUDC is not included in this estimate range. The total cost estimate includes a 20 percent contingency for unforeseen expenses. In the 2017 IRP, Idaho Power assumes a 21.2-percent share of the direct expenses, plus its entire AFUDC cost, which equates to approximately $258 million in B2H project expenses. Idaho Power also included costs for local interconnection upgrades totaling $16 million. The 2017 IRP was the first year for which the B2H route was relatively certain, resulting in a more accurate cost estimate compared to prior IRPs.
Idaho Power is the project manager for the permitting phase of the B2H project. The B2H project achieved a major milestone nearly 10 years in the making with the release of the Bureau of Land Management (BLM) Record of Decision (ROD) on November 17, 2017. The BLM ROD formalized the conclusion of the siting process at the federal level, as required by the National Environmental Policy Act of 1969 (NEPA). The BLM ROD provides the ability to site the B2H project on BLM-administered land.
3 blm.gov/press-release/doi-announces-approval-transmission-line-project-oregon-and-idaho

Idaho Power Company Appendix D—B2H Supplement
2017 IRP Page 3
For the State of Oregon permitting process, Idaho Power submitted the amended application for Site Certificate to the Oregon Department of Energy in summer 2017. Oregon’s Energy Facility Siting Council (EFSC) is tasked with establishing siting standards for energy facilities in Oregon and ensuring certain transmission line projects, including B2H, meet those standards.4 Before Idaho Power can begin construction on B2H, it must obtain a Site Certificate from EFSC. The Oregon EFSC process is a standards-based process based on a fixed site boundary. For a linear facility, like a transmission line, the process requires the transmission line boundary be established (a route selected) and fully evaluated to determine if the project meets established standards. Idaho Power must demonstrate a need for the project before EFSC will issue a Site Certificate authorizing the construction of a transmission line (non-generating facility). Idaho Power’s demonstration of need is based on the least-cost plan rule, for which the requirements can be met through a commission acknowledgement of the resource in the company’s IRP.5 In this case, Idaho Power seeks to satisfy EFSC’s least-cost plan rule requirement through an acknowledgement of its 2017 IRP.
As of the date of this report, Idaho Power expects the Oregon Department of Energy (ODOE) to issue a Draft Proposed Order in 2018 and a Final Order and Site Certificate in 2020. To achieve an in-service date in the mid-2020s, preliminary construction activities must commence in parallel to EFSC permitting activities. Preliminary construction activities include, but are not limited to, geotechnical explorations, detailed ground surveys, sectional surveys, right-of-way (ROW) acquisition activities, and detailed design and construction bid package development. After the Oregon permitting process and preliminary construction activities conclude, construction activities can commence.
This B2H 2017 IRP Appendix D provides context and details that support evaluating this transmission line project as a supply-side resource, explores (qualitatively and quantitatively) many of the ancillary benefits offered by the transmission line, and considers the risks and benefits of owning a transmission line connected to a market hub in contrast to direct ownership of a traditional generation resource.
4 See generally Oregon Revised Statute (ORS) 469.300-469.563, 469.590-469.619, and 469.930-469.992. 5 OAR 345-023-0020(2).

Appendix D—B2H Supplement Idaho Power Company
Page 4 2017 IRP
This page left blank intentionally.

Idaho Power Company Appendix D—B2H Supplement
2017 IRP Page 5
RESOURCE NEED EVALUATION Capacity Needs The entire Integrated Resource Plan (IRP) process is predicated on defining a need for resources in the future to serve projected customer demand.
The IRP analysis begins by developing a monthly load forecast, which incorporates the future electricity needs of our customers. The load forecast consists of both average monthly (energy) and monthly peak-hour (capacity) conditions. The existing Idaho Power resources (generating, demand side management [DSM], and transmission) are evaluated against the load forecast. The load less the available resources determines the load and resource balance. Times where the load exceeds the resources defines the need for resources to reliably serve our customers.
All resources on Idaho Power’s system are considered in the load and resource balance, including hydro, gas, coal, existing cogeneration and small-power producer (CSPP) contracts, existing power purchase agreements (PPA) (including the Public Utility Regulatory Policies Act of 1978 [PURPA]), and available import transmission capacity. All supply-side resources, all DSM and EE programs, and transmission import capacity are summed and subtracted from the appropriate load forecast—either peak hour or average monthly. If the result of load is greater than resources is, Idaho Power’s system is resource insufficient and the need for a resource is established.
As detailed in Idaho Power’s 2017 IRP, Idaho Power has a peak-demand capacity deficit in the year 2026. The Jim Bridger unit retirement evaluations in the 2017 IRP can accelerate the capacity deficit date depending on the retirement date assumptions.
Refer to Chapter 7 of Idaho Power’s 2017 IRP for more information on the planning period forecasts and establishment of need.
IRP Guideline Language—Transmission Evaluated on Comparable Basis In Order No. 07-002, the Public Utility Commission of Oregon (OPUC) adopted guidelines regarding integrated resource planning.6
Guideline 5: Transmission. Portfolio analysis should include costs to the utility for the fuel transportation and electric transmission required for each resource being considered. In addition, utilities should consider fuel transportation and electric transmission facilities as resource options, taking into account their value
6 apps.puc.state.or.us/orders/2007ords/07-002.pdf
Appendix D—B2H Supplement Idaho Power Company
Page 6 2017 IRP
for making additional purchases and sales, accessing less costly resources in remote locations, acquiring alternative fuel supplies, and improving reliability.
Boardman to Hemingway as a Resource The Boardman to Hemingway Transmission Line Project (B2H) is one of the most cost-effective IRP resources Idaho Power has considered and proven through successive IRPs. When evaluating and comparing alternative resources, two major cost considerations exist: 1) the capacity cost of the project (fixed costs) and 2) the energy cost of the project (variable costs). The 2017 IRP details the results of each component of the various portfolios in Table 9.3 of the IRP. Capital costs are derived through cost estimates to install the various projects. Energy costs are calculated through a detailed modeling analysis, using the AURORA software. Energy prices are derived based on inputs into the model, such as gas price, coal price, nuclear price, hydro conditions, etc.
Illustrating the difference between capacity and energy, a diesel generator may have a very low cost to install; however, the cost of diesel fuel and the maintenance required would be significant. Alternatively, a utility-scale solar plant will have almost no energy cost; the fuel to run the plant—the sun—is free. However, in the case of a solar plant, the capacity cost to install the plant is quite expensive. The installed capacity needed to ensure the solar is available during the Idaho Power peak is even larger.
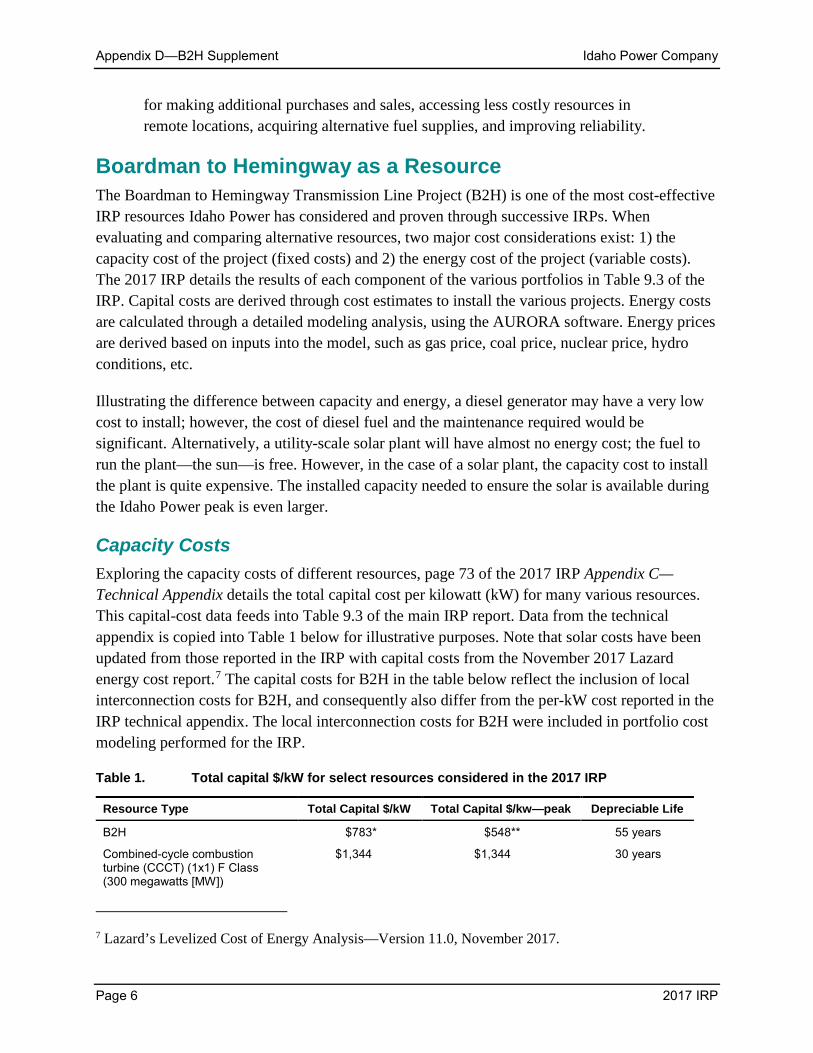
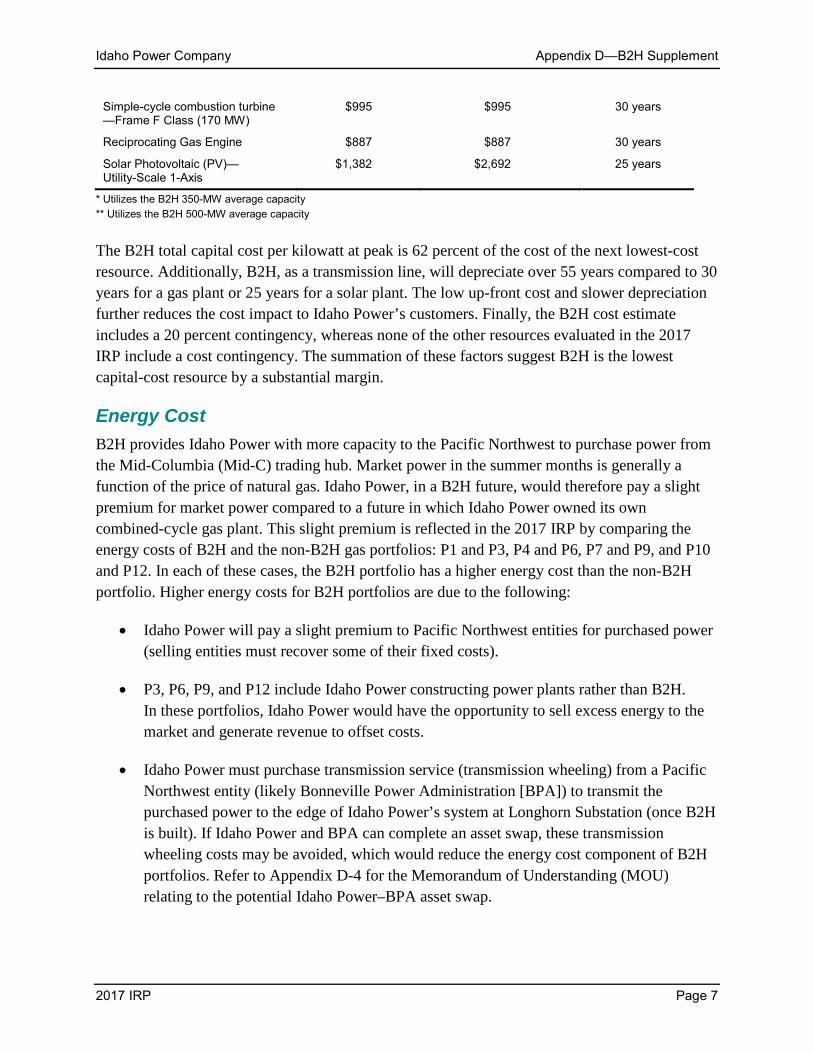
Capacity Costs Exploring the capacity costs of different resources, page 73 of the 2017 IRP Appendix C—Technical Appendix details the total capital cost per kilowatt (kW) for many various resources. This capital-cost data feeds into Table 9.3 of the main IRP report. Data from the technical appendix is copied into Table 1 below for illustrative purposes. Note that solar costs have been updated from those reported in the IRP with capital costs from the November 2017 Lazard energy cost report.7 The capital costs for B2H in the table below reflect the inclusion of local interconnection costs for B2H, and consequently also differ from the per-kW cost reported in the IRP technical appendix. The local interconnection costs for B2H were included in portfolio cost modeling performed for the IRP.
Table 1. Total capital $/kW for select resources considered in the 2017 IRP
Resource Type Total Capital $/kW Total Capital $/kw—peak Depreciable Life
B2H $783* $548** 55 years
Combined-cycle combustion turbine (CCCT) (1x1) F Class (300 megawatts [MW])
$1,344 $1,344 30 years
7 Lazard’s Levelized Cost of Energy Analysis—Version 11.0, November 2017.
Idaho Power Company Appendix D—B2H Supplement
2017 IRP Page 7
Simple-cycle combustion turbine —Frame F Class (170 MW)
$995 $995 30 years
Reciprocating Gas Engine $887 $887 30 years
Solar Photovoltaic (PV)—Utility-Scale 1-Axis
$1,382 $2,692 25 years
* Utilizes the B2H 350-MW average capacity ** Utilizes the B2H 500-MW average capacity The B2H total capital cost per kilowatt at peak is 62 percent of the cost of the next lowest-cost resource. Additionally, B2H, as a transmission line, will depreciate over 55 years compared to 30 years for a gas plant or 25 years for a solar plant. The low up-front cost and slower depreciation further reduces the cost impact to Idaho Power’s customers. Finally, the B2H cost estimate includes a 20 percent contingency, whereas none of the other resources evaluated in the 2017 IRP include a cost contingency. The summation of these factors suggest B2H is the lowest capital-cost resource by a substantial margin.
Energy Cost B2H provides Idaho Power with more capacity to the Pacific Northwest to purchase power from the Mid-Columbia (Mid-C) trading hub. Market power in the summer months is generally a function of the price of natural gas. Idaho Power, in a B2H future, would therefore pay a slight premium for market power compared to a future in which Idaho Power owned its own combined-cycle gas plant. This slight premium is reflected in the 2017 IRP by comparing the energy costs of B2H and the non-B2H gas portfolios: P1 and P3, P4 and P6, P7 and P9, and P10 and P12. In each of these cases, the B2H portfolio has a higher energy cost than the non-B2H portfolio. Higher energy costs for B2H portfolios are due to the following:
• Idaho Power will pay a slight premium to Pacific Northwest entities for purchased power (selling entities must recover some of their fixed costs).
• P3, P6, P9, and P12 include Idaho Power constructing power plants rather than B2H. In these portfolios, Idaho Power would have the opportunity to sell excess energy to the market and generate revenue to offset costs.
• Idaho Power must purchase transmission service (transmission wheeling) from a Pacific Northwest entity (likely Bonneville Power Administration [BPA]) to transmit the purchased power to the edge of Idaho Power’s system at Longhorn Substation (once B2H is built). If Idaho Power and BPA can complete an asset swap, these transmission wheeling costs may be avoided, which would reduce the energy cost component of B2H portfolios. Refer to Appendix D-4 for the Memorandum of Understanding (MOU) relating to the potential Idaho Power–BPA asset swap.

Appendix D—B2H Supplement Idaho Power Company
Page 8 2017 IRP
The B2H portfolios’ capacity costs are so low that capacity installation savings far outweigh the additional energy costs, leading B2H portfolios to be the lowest-cost option for Idaho Power’s customers.
Market Overview Power Markets A power market hub is an aggregation of transaction points (often referred to as bus points or buses). Hubs create a common point to buy and sell energy, creating one transaction point for bilateral transactions. Hubs also create price signals for geographical regions.
Six characteristics of successful electric trading markets include the following:
1. The geographic location is a natural supply/demand balancing point for a particular region with adequate available transmission.
2. Reliable contractual standards exist for the delivery and receipt of the energy.
3. There is transparent pricing at the market with no single player nor group of players with the ability to manipulate the market price.
4. Homogeneous pricing exists across the market.
5. Convenient tools are in place to execute trades and aggregate transactions.
6. Most importantly, there is a critical mass of buyers and sellers that respond to the five characteristics listed above and actively trade the market on a consistent basis. This is the definition of liquidity, which is clearly the most critical requirement of a successful trading hub.
Mid-C Market The Mid-C electric energy market hub is a hub where power is transacted both physically and financially (derivative). Power is traded both physically and financially in different blocks: long term, monthly, balance-of-month, day ahead, and hourly. Much of the activity for balance-of-month and beyond is traded and cleared through a clearing exchange, the Intercontinental Exchange (ICE). For short-term transactions, such as day-ahead and real time (hourly), trades are made primarily between buyers and sellers negotiating price, quantity, and point of delivery over the phone (bilateral transactions). In the Pacific Northwest, most of the price negotiations begin with prices displayed for Mid-C on the ICE trading platform.
The Mid-C market exhibits all six characteristics of a successful electric trading market discussed above. Figure 1 shows the relative volume of energy in the Northwest.

Idaho Power Company Appendix D—B2H Supplement
2017 IRP Page 9
Figure 1. Northwest regional forecast (Source: 2017 PNUCC)8
In the western US, the other major market hubs are California–Oregon Border (COB), Four Corners (Arizona–New Mexico border), Mead (Nevada), Mona (Utah), Palo Verde (Arizona), and SP15 (California). The Mid-C market is very liquid. In 2017, on a day-ahead trading basis, daily average trading volume during heavy-load hours during June and July ranged from nearly 40,000 megawatt-hours (MWh) to over 51,000 MWh. When combining heavy-load hours with light-load hours, on a day-ahead trading basis, the monthly volumes for June and July were each approximately 2,000,000 MWhs. These volumes are in addition to month-ahead trading volumes. Mid-C is by far the highest volume market hub in the west; frequently, Mid-C volumes are greater than the other hubs combined.
The following market participants transact regularly at Mid-C. Additionally, numerous other independent power producers trade at Mid-C.
• Avista Utility
• BPA
• Chelan County Public Utility District (PUD)
• Douglas County PUD
• Eugene Electric Board
• Idaho Power
• PacifiCorp
• Portland General Electric
8 pnucc.org/system-planning/northwest-regional-forecast

Appendix D—B2H Supplement Idaho Power Company
Page 10 2017 IRP
• Powerex
• Puget Sound Energy
• Seattle City Light
• Tacoma City Light
Energy traded at Mid-C is not necessarily physically generated in the Mid-Columbia River geographic area. For instance, Powerex is a merchant of BC Hydro in British Columbia and frequently buys and sells energy at Mid-C. A trade at Mid-C requires that transmission is available to deliver the energy to Mid-C. Transmission wheeling charges must be accounted for when transacting at Mid-C. Sellers at Mid-C must pay necessary transmission charges to deliver power to Mid-C, and buyers must pay necessary transmission charges to deliver power to load.
Mid-C and Idaho Power Historically, Idaho Power wholesale energy transactions have correlated well with the Mid-C hub due to Idaho Power’s proximity to the market hub and because it is the most liquid hub in the region. Energy at Mid-C can be delivered to, or received from, Idaho Power through a single transmission wheel through the BPA or Avista. Additionally, long-term monthly price quotes are readily available for Mid-C, making it an ideal basis for long-term planning.
Idaho Power uses the market to balance surplus and deficit positions between generation resources and customer demand, and to take advantage of price differences across the region. For example, when market purchases are more cost-effective than generating energy within Idaho Power’s generation fleet, Idaho Power customers benefit from lower net power supply cost through purchases instead of Idaho Power fuel expense. Idaho Power customers also benefit from the sale of surplus energy. Surplus energy sales are made when Idaho Power’s resources are greater than Idaho Power customer demand and when the incremental cost of these resources are below market prices. Idaho Power customers benefit from these surplus energy sales as offsets to net power supply costs through the power cost adjustment (PCA).
In 2017, Idaho Power averaged approximately 55,000 MWh of Mid-C purchases in June and July. As stated previously, the average monthly volumes at Mid-C, on a day-ahead basis, were approximately 2,000,000 MWh. Based on these averages, Idaho Power’s purchases represented less than 3 percent of the total market volumes in June and July. At 3 percent of total market volume on average in June and July, Idaho Power represents a very small fraction of the Mid-C volume during the months when Idaho Power relies on Mid-C the most.
The Mid-C market could be used more to economically serve Idaho Power customers, but Idaho Power’s ability to transact at Mid-C is limited due to transmission capacity constraints between the Pacific Northwest and Idaho. In other words, sufficient transmission capacity is currently

Idaho Power Company Appendix D—B2H Supplement
2017 IRP Page 11
unavailable during certain times of the year for Idaho Power to procure cost-effective resources from Mid-C for its customers, even though generation supply is available at the market.
Modeling of the Mid-C Market in the IRP As part of the IRP analysis, Idaho Power uses the AURORA to derive energy prices at the Mid-C market. Energy prices are derived based on inputs into the model, such as gas price, coal price, nuclear price, hydro conditions, etc. Refer to Chapter 9 of the 2017 IRP for more information on AURORA and modeling.
Energy purchases from the market require transmission to wheel the energy from the source to the utility purchasing the energy. Purchases from the Mid-C market would need to be wheeled across the BPA system to get the energy to the proposed Longhorn Substation near Boardman, Oregon.
Transmission wheeling rates and wheeling losses are included in the AURORA database and are part of the dispatch logic within the AURORA modeling. AURORA economically dispatches generating units, which can be located across any system in the West. All market energy purchases modeled in Aurora include these additional transmission costs and are included in all portfolios and sensitivities.
B2H Comparison to Other Resources The 2017 IRP provides an in-depth analysis of the B2H project compared to alternative resource options. Table 2 summarizes some of the high-level differences between B2H and other notable resource options.

Appendix D—B2H Supplement Idaho Power Company
Page 12 2017 IRP
Table 2. High-level differences between resource options
B2H Reciprocating
Engines CCCT Lithium batteries 1-axis solar PV
Intermittent renewable
Dispatchable capacity providing
Non-dispatchable (coincidental) capacity providing
Balancing, flexibility providing
Energy providing
Variable costs (primary variable cost driver)
Mid-C market Natural gas Natural gas Mid-C market No variable costs
Capital costs $450/on-peak kW $775/kW $1,250/kW $1,750/kW $2,500/on-peak kW
Fuel price risk
Wholesale power market price risk
Other Expanded access to market (Mid-C) providing abundant clean, renewable energy, highly reliable (low forced outage), as long-lived resources promote stability in customer rates, benefit to regional grid
Scalable (modeled generators 18.8-MW nameplate), relatively short-lead resource
Relatively short-lead resource with recent construction experience
Nascent, uncertainty related to performance (e.g., # of lifetime cycles), potential grid benefit depending on resource siting, scalable and potential for geographic dispersion
Renewable, clean, scalable (modeled plants 30-MW nameplate)
Notes: 1. Idaho Power’s 2016 solar integration study suggests modest impacts from solar intermittency. Study based on synthetic
solar data. Actual production from currently on-line solar projects will be reviewed in 2018 to verify study findings. 2. Solar is not dispatchable but tends to produce at fairly high levels during periods of high customer demand (on-peak
capacity factor or contribution to peak equal to 51.3 percent of installed capacity). 3. Lithium battery is a net energy consumer (roundtrip efficiency = 86 percent). Lithium battery provides energy during heavy
load hours or other high energy demand/high energy value periods; battery recharge costs tied primarily to Mid-C market costs or variable costs of Idaho Power’s system resources during light load hours.
4. B2H capital-cost estimate includes a 20-percent contingency. Lithium battery capital costs are on a declining trend; 2017 Lazard reporting projects 10 percent per year annual rate of capital cost decline. Solar capital cost decline slowing. B2H and solar capital costs are expressed in terms of $/on-peak kW, where on-peak kW for B2H are based on 500-MW summer capacity and for solar is based on on-peak capacity equal to 51 percent of installed capacity.
Idaho Power’s Transmission System Idaho Power’s transmission system is a key element to providing reliable, responsible, fair-priced energy services. A map of Idaho Power’s transmission system is shown in Figure 6.1 on page 58 of the 2017 IRP and in Figure 2. Transmission lines facilitate the delivery of economic resources and allow resources to be sited where most cost effective. In most instances,
Idaho Power Company Appendix D—B2H Supplement
2017 IRP Page 13
the most economic/best location for resources is not immediately next to major load centers (i.e., hydro along the Columbia River, wind in Wyoming, solar in the desert southwest). For much of its history, Idaho Power has taken advantage of resources outside of its major load pockets to economically serve its customers. The existing transmission lines between Idaho Power and the Pacific Northwest have been particularly valuable. Idaho Power has maximized its use of the transmission path between Idaho and the Pacific Northwest. Additional transmission capacity is required to access incremental resources to meet projected peak demand. The B2H project is the mechanism to increase capacity between the Pacific Northwest and Idaho Power’s service area.
Transmission lines are constructed and operated at different operating voltages depending on purpose, location, and distance. Idaho Power operates transmission lines at 138 kV, 161 kV, 230 kV, 345 kV, and 500 kV. Idaho Power also operates sub-transmission lines at 46 kV and 69 kV, but these voltages will not be discussed further in this appendix; the focus of this appendix is on higher voltage transmission lines used for moving bulk electricity. The higher the voltage, the greater the capacity of the line, but also the greater the construction cost and physical size requirements.
The utility industry often compares transmission lines to roads and highways. Typically, lower-voltage transmission lines (138 kV) are used to facilitate delivery of energy to substations to serve load, like a two-lane highway. Much like roads and highways can become congested, so can transmission lines. High-voltage lines are used to facilitate the bulk delivery of power, sometimes referred to as backbone transmission. Depending on the capacity needs, economics, distance (higher voltages result in less losses for longer distances), and intermediate substation requirements, either 230-kV, 345-kV, or 500-kV transmission lines are used. A 230- or 345-kV line can be compared to a multi-lane interstate, whereas a 500-kV line can be compared to a major (6+ lane) freeway used to move as many vehicles as possible.
Transmission Capacity Between Idaho Power and the Pacific Northwest Idaho Power owns 1,280 MW of transmission capacity between the Pacific Northwest transmission system and Idaho Power’s transmission system. Of this capacity, 1,200 MW are on the Idaho to Northwest path (Western Electricity Coordinating Council [WECC] Path 14), and 80 MW are on the Montana–Idaho path (WECC Path 18). A transmission path is one or more transmission lines that collectively transmit power to/from similar geographic areas. The Idaho to Northwest transmission path is comprised of three 230-kV lines, one 500-kV transmission line, and one 115-kV transmission line. The capacity limit on the path is established through a WECC rating process based on equipment overload ratings resulting from the loss of the most critical element on the transmission system. Collectively, these lines between Idaho and the Northwest have a transfer capacity rating that is greater than the individual rating of each line
Appendix D—B2H Supplement Idaho Power Company
Page 14 2017 IRP
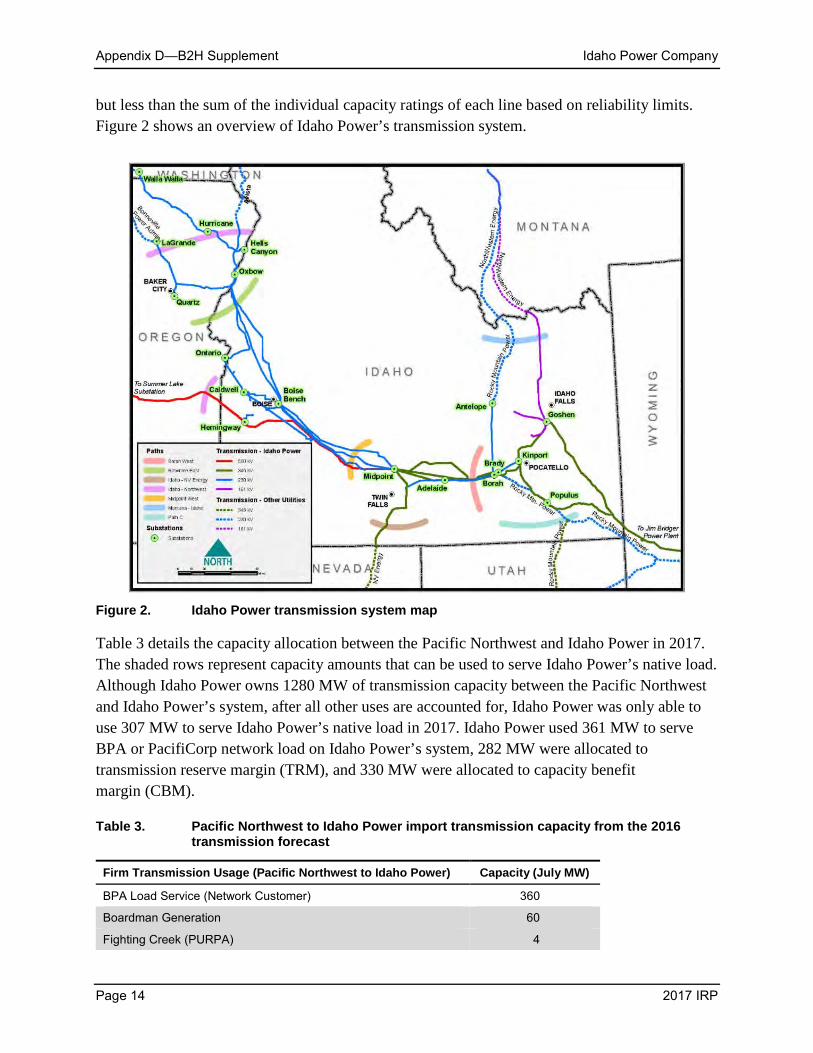
but less than the sum of the individual capacity ratings of each line based on reliability limits. Figure 2 shows an overview of Idaho Power’s transmission system.
Figure 2. Idaho Power transmission system map
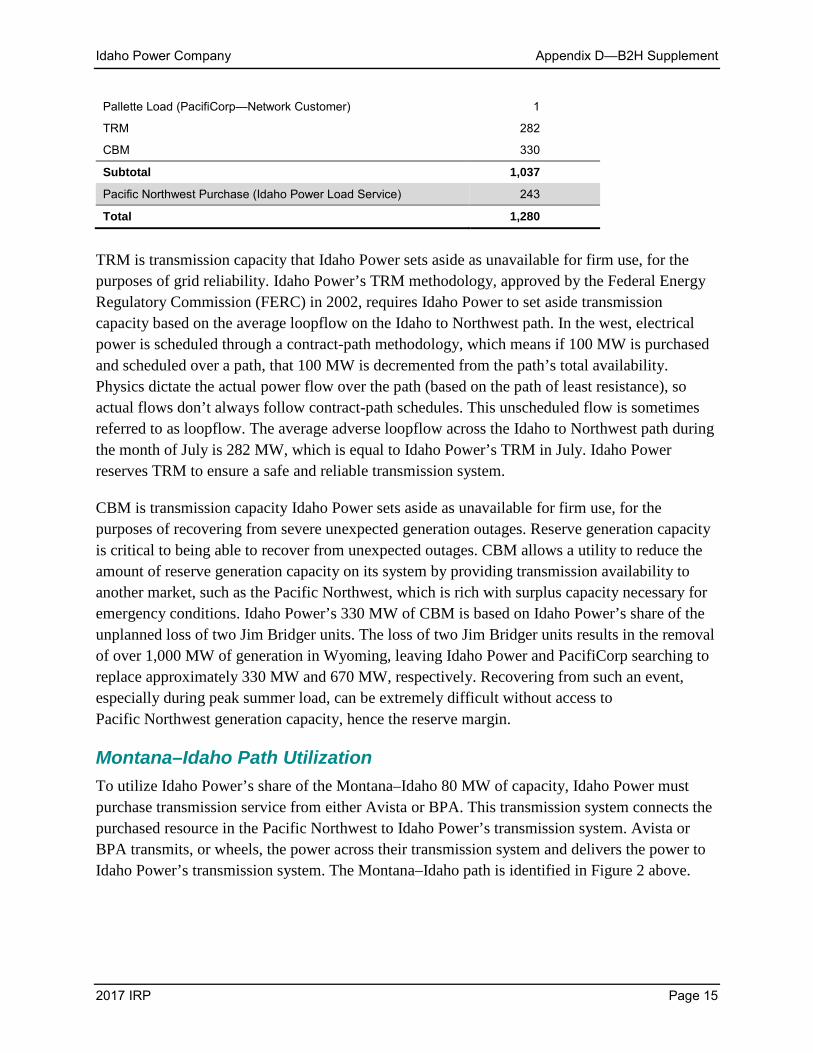
Table 3 details the capacity allocation between the Pacific Northwest and Idaho Power in 2017. The shaded rows represent capacity amounts that can be used to serve Idaho Power’s native load. Although Idaho Power owns 1280 MW of transmission capacity between the Pacific Northwest and Idaho Power’s system, after all other uses are accounted for, Idaho Power was only able to use 307 MW to serve Idaho Power’s native load in 2017. Idaho Power used 361 MW to serve BPA or PacifiCorp network load on Idaho Power’s system, 282 MW were allocated to transmission reserve margin (TRM), and 330 MW were allocated to capacity benefit margin (CBM).
Table 3. Pacific Northwest to Idaho Power import transmission capacity from the 2016 transmission forecast
Firm Transmission Usage (Pacific Northwest to Idaho Power) Capacity (July MW)
BPA Load Service (Network Customer) 360
Boardman Generation 60
Fighting Creek (PURPA) 4
Idaho Power Company Appendix D—B2H Supplement
2017 IRP Page 15
Pallette Load (PacifiCorp—Network Customer) 1
TRM 282
CBM 330
Subtotal 1,037
Pacific Northwest Purchase (Idaho Power Load Service) 243
Total 1,280
TRM is transmission capacity that Idaho Power sets aside as unavailable for firm use, for the purposes of grid reliability. Idaho Power’s TRM methodology, approved by the Federal Energy Regulatory Commission (FERC) in 2002, requires Idaho Power to set aside transmission capacity based on the average loopflow on the Idaho to Northwest path. In the west, electrical power is scheduled through a contract-path methodology, which means if 100 MW is purchased and scheduled over a path, that 100 MW is decremented from the path’s total availability. Physics dictate the actual power flow over the path (based on the path of least resistance), so actual flows don’t always follow contract-path schedules. This unscheduled flow is sometimes referred to as loopflow. The average adverse loopflow across the Idaho to Northwest path during the month of July is 282 MW, which is equal to Idaho Power’s TRM in July. Idaho Power reserves TRM to ensure a safe and reliable transmission system.
CBM is transmission capacity Idaho Power sets aside as unavailable for firm use, for the purposes of recovering from severe unexpected generation outages. Reserve generation capacity is critical to being able to recover from unexpected outages. CBM allows a utility to reduce the amount of reserve generation capacity on its system by providing transmission availability to another market, such as the Pacific Northwest, which is rich with surplus capacity necessary for emergency conditions. Idaho Power’s 330 MW of CBM is based on Idaho Power’s share of the unplanned loss of two Jim Bridger units. The loss of two Jim Bridger units results in the removal of over 1,000 MW of generation in Wyoming, leaving Idaho Power and PacifiCorp searching to replace approximately 330 MW and 670 MW, respectively. Recovering from such an event, especially during peak summer load, can be extremely difficult without access to Pacific Northwest generation capacity, hence the reserve margin.
Montana–Idaho Path Utilization To utilize Idaho Power’s share of the Montana–Idaho 80 MW of capacity, Idaho Power must purchase transmission service from either Avista or BPA. This transmission system connects the purchased resource in the Pacific Northwest to Idaho Power’s transmission system. Avista or BPA transmits, or wheels, the power across their transmission system and delivers the power to Idaho Power’s transmission system. The Montana–Idaho path is identified in Figure 2 above.

Appendix D—B2H Supplement Idaho Power Company
Page 16 2017 IRP
Idaho to Northwest Path Utilization To utilize Idaho Power’s share of the Idaho to Northwest capacity, Idaho Power must purchase transmission service from Avista, BPA, or PacifiCorp. Table 4 details a typical summer allocation of the Idaho to Northwest capacity:
Table 4. The Idaho to Northwest Path (WECC Path 14) summer allocation
Transmission Provider Idaho to Northwest Allocation (Summer West to East) (MW)
Avista (to Idaho Power) 340
BPA (to Idaho Power) 350
PacifiCorp (to Idaho Power) 510
Total Capability to Idaho Power 1,200*
* During times of very low generation at Brownlee, Oxbow, and Hells Canyon hydro plants, the Idaho to Northwest path total capability can increase to as much as 1,340 MW; low generation at these power plants does not correspond with Idaho Power’s system peak.
Avista, BPA and PacifiCorp share an allocation of capacity on the western side of the Idaho to Northwest path, and Idaho Power owns 100 percent of the capacity on the eastern side of the Idaho to Northwest path. For Idaho Power to transact across the path and serve customer load, Idaho Power’s Load Servicing Operations must purchase transmission service from Avista, BPA, or PacifiCorp to connect the selling entity, via a contract transmission path, to Idaho Power.
Construction of B2H will add 1,050 MW of capacity to the Idaho to Northwest path in the west-to-east direction, of which Idaho Power will own 500 MW in the summer months (April–September), and 200 MW in the winter months (January–March and October–December). A total breakdown of capacity rights of the B2H permitting co-participants can be found in the Project Co-Participants section of this report. The Idaho to Northwest path is identified in Figure 2 above.
Regional Planning—Studies and Conclusions The Northern Tier Transmission Group (NTTG) and Columbia Grid are regional planning organizations that are organized and operate in compliance with FERC orders 890 and 1000. The purpose of these organizations is to consolidate each member’s local transmission plans and determine a regional plan that can meet the needs of the combined member footprint in a more efficient or cost-effective manner. The NTTG and Columbia Grid develop transmission plans biennially.
B2H is a committed project in the most recent Columbia Grid 10-year plan, and it is part of the projects compromising the NTTG 2014–2015 Biennial Plan and the soon-to-be-published NTTG 2016–2017 Biennial Plan. The identified need for the B2H project in these regional planning organizations is based on transmission needs submitted by BPA, Idaho Power, and PacifiCorp.

Idaho Power Company Appendix D—B2H Supplement
2017 IRP Page 17
At NTTG, all member utilities submit their load forecasts, generation forecasts, and transmission needs. NTTG studies the members’ transmission footprints to determine the more efficient or cost-effective plan to meet those needs.
B2H has been, and remains, an integral part of NTTG’s 10-year plan. NTTG’s analysis indicated B2H is the most cost-effective and efficient project to meet the needs of the NTTG footprint.
Appendix D-5 contains the latest NTTG materials. For the most recent updates related to Idaho Power’s regional planning organization, please refer to the NTTG website at nttg.biz/.
THE B2H PROJECT Project History The B2H project originated from Idaho Power’s 2006 IRP. The 2006 IRP specified 285 MW of additional transmission capacity, increasing Idaho Power’s connection to the Pacific Northwest power markets, as a resource in the preferred resource portfolio. A project had not been fully vetted at that time but was described as a 230-kV transmission line between McNary Substation and Boise. After the initial identification in the 2006 IRP, Idaho Power evaluated numerous capacity upgrade alternatives. Considering distance, cost, capacity, losses, and substation termination operating voltages, Idaho Power determined a new 500-kV transmission line between the Boardman, Oregon, area and the proposed Hemingway 500-kV substation would be the most cost-effective method of increasing capacity. Refer to Appendix D-1 for more information on the upgrade options considered.
Transmission capacity, especially at 500 kV, can be described as “lumpy” because capacity increments are relatively large between the different transmission operating voltages. In the 2009 IRP, Idaho Power assumed 425 MW of capacity, which was 50 percent of the assumed total rating. Idaho Power’s long-standing preference was to find a partner or partners to construct B2H with to take advantage of economies of scale. In the 2011 IRP, Idaho Power assumed 450 MW of capacity. In 2012, Idaho Power achieved two major milestones: 1) PacifiCorp and BPA officially joined the B2H project as permitting co-participants and 2) Idaho Power received a formal capacity rating for the B2H project via the WECC Path Rating Process (more on this process in preceding section). In the 2013 IRP, Idaho Power began to use the negotiated capacity from the permitting agreement: 500 MW in the summer and 200 MW in the winter, a yearly average of 350 MW, for a cost allocation of 21 percent of the total project. Idaho Power used the same 21.2 percent interest in the 2015 and 2017 IRPs.
Public Participation The B2H project has involved considerable stakeholder involvement over the last 10 years. Idaho Power has hosted and participated in over 250 public and stakeholder meetings with an
Appendix D—B2H Supplement Idaho Power Company
Page 18 2017 IRP
estimated 3,000+ participants. After approximately a year of public scoping in 2008, Idaho Power paused the federal and state review process and initiated a year-long comprehensive public process to gather more input. This community advisory process (CAP) took place in 2009 and 2010. The four objectives and steps of the CAP were as follows:
1. Identify community issues and concerns.
2. Develop a range of possible routes that address community issues and concerns.
3. Recommend proposed and alternate routes.
4. Follow through with communities during the federal and state review processes.
Through the CAP, Idaho Power hosted 27 Project Advisory Team meetings, 15 public meetings, and 7 special topic meetings. In all, nearly 1,000 people were involved in the CAP, either through Project Advisory Team activities or public meetings. Additionally, numerous meetings with individuals and advocacy groups were held during and after the process.
Ultimately, the route recommendation from the CAP was the route Idaho Power brought into the National Environmental Policy Act of 1969 (NEPA) process as the proponent-recommended route. The NEPA process included additional opportunities for public comment at major milestones, and Idaho Power worked with landowners and communities along the way. Ultimately, the route selected through the NEPA process was based on the Bureau of Land Management’s (BLM) analysis and public input. For more information on the CAP, including the final report9, and Idaho Power’s initial scoping activities, visit the documents section10 on the B2H website.
Throughout the BLM’s NEPA process, including development of the Draft Environmental Impact Statement (EIS), issued Dec. 19, 2014, and prior to the Final EIS, issued Nov. 22, 2016, Idaho Power worked with landowners, stakeholders and jurisdictional leaders on route refinements and to balance environmental impacts with impacts to farmers and ranchers. For example, Idaho Power met with the original “Stop Idaho Power” group in Malheur County to help the group effectively comments and seek change from the BLM when the Draft EIS indicated a preference for a route across Stop Idaho Power stakeholder lands. BLM’s decision was modified, and the route moved away from an area of highly valued agricultural lands in the Final EIS almost two years later.
9 boardmantohemingway.com/documents/CAP%20Report-Final-Feb%202011.pdf 10 boardmantohemingway.com/documents.aspx

Idaho Power Company Appendix D—B2H Supplement
2017 IRP Page 19
Idaho Power worked with landowners in the Baker Valley, near the National Historic Oregon Trail Interpretive Center (NHOTIC), to move an alternative route along fence lines to minimize impacts to irrigated farmland, where practicable. This change was submitted by the landowners and included in the BLM’s Final EIS and ROD (issued Nov. 17, 2017). Another change in Baker County was in the Burnt River Canyon and Durkee area, where Idaho Power worked with the BLM and affected landowners to find a more suitable route than what was initially preferred in the Draft EIS. Idaho Power is still working with landowners and local jurisdictional leaders to microsite in these areas to minimize impacts.
Unfortunately, the route preferences of Idaho Power and the local communities aren’t always reflected in the BLM’s Agency Preferred route. For example, Idaho Power had worked in the Baker County area to propose a route on the backside of the NHOTIC (to the east) to minimize visual impacts, and in the Brogan area, to avoid landowner impacts. However, both route variations went through priority sage grouse habitat and were not adopted in BLM’s Agency Preferred route.
However, Idaho Power worked with Umatilla County, local jurisdictional leaders and landowners to identify a new route through the entire county, essentially moving the line further south and away from residences, ranches, and certain agriculture. This southern route variation through Umatilla County was included the BLM’s Agency Preferred route.
At the urging of local landowners along Bombing Range Road in Morrow County, Idaho Power has been working with local jurisdictional leaders, delegate representatives, farmers, ranchers, and other interested parties to gain the Navy’s consideration of an easement along the eastern edge of the Boardman Bombing Range. This cooperative effort with the local area has benefited the Project, providing an approach that meets the interests and common good for all in the area. Idaho Power is still working with the Navy to obtain that easement, but all indications point to receiving an authorization from the Navy in 2018.
Finally, in Union County Idaho Power worked with local jurisdictional leaders, stakeholder groups, such as the Glass Hill Coalition and some members of StopB2H (prior to that group’s formation) to identify new route opportunities. The Union County B2H Advisory Commission agreed to submit a route proposal to the BLM that followed existing high-voltage transmission lines, which was later identified as the Millcreek Alternative. At the same time, Idaho Power met with a large landowner to adjust the Morgan Lake Alternative route to minimize impacts to the landowners. Idaho Power understood that both the Mill Creek and Morgan Lake route variations were favored over BLM’s Agency Preferred Alternative (Glass Hill Alternative) by landowners, the Glass Hill Coalition, several stakeholders, and the Confederated Tribe of the Umatilla Indian Reservation due to concerns of impacts on areas that had no prior development. Idaho Power continued support of the community-favored routes in its amended preliminary Application for

Appendix D—B2H Supplement Idaho Power Company
Page 20 2017 IRP
Site Certificate. Idaho Power will work with Union County and local stakeholders to determine the route preference between the Morgan Lake and Millcreek alternatives.
Project Activities Below is a summary of notable activities by year since project inception. For more information about any of the activities, please visit the B2H website.
2006 Idaho Power files its IRP with a transmission line to the Pacific Northwest identified in the preferred resource portfolio.
2007 Idaho Power analyzes the capacity and cost of different transmission line operating voltages and determines a new 500-kV transmission line to be the most cost-effective option to increase capacity and meet customer needs. Idaho Power files a Preliminary Draft Application for Transportation and Utility Systems and Facilities on Federal Lands. Idaho Power scopes routes.
2008 Idaho Power submits application materials to the BLM. Idaho Power submits a Notice of Intent to the EFSC. The BLM issues a Notice of Intent to prepare an EIS; officially initiating the BLM-led federal NEPA process. Idaho Power embarks on a more extensive public outreach program to determine the transmission line route.
2009 Idaho Power pauses NEPA and EFSC activities to work with community members throughout the route as part of the CAP to identify a proposed route that would be acceptable to both Idaho Power and the public. Forty-nine routes and/or route segments were considered through CAP.
2010 The CAP concludes. Idaho Power resubmits a proposed route to the BLM based on input from the CAP. The BLM re-initiates the NEPA scoping process and solicits public comments. Idaho Power publishes its B2H Siting Study. Idaho Power files a Notice of Intent with EFSC.
2011 Additional public outreach resulted in additional route alternatives submitted to the BLM. The Obama Administration recognizes B2H as one of seven national priority projects11.
11 boardmantohemingway.com/documents/RRTT_Press_Release_10-5-2011.pdf

Idaho Power Company Appendix D—B2H Supplement
2017 IRP Page 21
2012 The ODOE conducts informational meetings and solicits comments. The ODOE issues a Project Order outlining the issues and regulations Idaho Power must address in its Application for Site Certificate. Additional public outreach and analysis resulted in route modifications and refinements submitted to the BLM. Idaho Power issues a Siting Study Supplement. Idaho Power conducts field surveys for the EFSC application. WECC adopts a new Adjacent Transmission Circuits definition with a separation distance of 250 feet, which would later modify routes in the EIS process. Idaho Power receives a formal capacity rating from WECC.
2013 Public meetings are held. Idaho Power submits its Preliminary Application for Site Certificate to the ODOE. The BLM releases preliminary preferred route alternatives and works on a Draft EIS.
2014 The BLM issues a Draft EIS identifying an Agency Preferred Alternative. The 90-day comment period opens. Idaho Power conducts field surveys for EFSC application.
2015 The BLM hosts open houses for the public to learn about the Draft EIS, route alternatives, environmental analysis. The BLM reviews public comments. Idaho Power notifies the BLM of a preferred termination location, Longhorn Substation. Idaho Power submits an application to the Navy for an easement on the Naval Weapons System Training Facility in Boardman. Idaho Power conducts field surveys for the EFSC application.
2016 Idaho Power submits a Draft Amended Application for Site Certificate to the ODOE for review. The BLM issues a Final EIS identifying an environmentally preferred route alternative and an Agency Preferred route alternative. Idaho Power incorporates the Agency Preferred route alternative into the EFSC application material. Idaho Power collaborates with local area stakeholders in Morrow County to find a routing solution on Navy-owned land. Idaho Power submits a revised application to the Navy. Idaho Power conducts field surveys for the EFSC application.
2017 Idaho Power submits an Amended Application for Site Certificate to the ODOE. The BLM issues a ROD.
For a detailed list of project activities by year, please refer to Appendix D-2.

Appendix D—B2H Supplement Idaho Power Company
Page 22 2017 IRP
Route History As stated previously, the B2H project was first identified in the 2006 IRP. At that time, the transmission line was contemplated as a line between Boise and McNary. The project evolved into a 500-kV line between the Boardman area and the Hemingway Substation. Several northern terminus substations were considered over the years, including the Boardman coal plant 500-kV yard, the proposed Grassland Substation to be constructed by Portland General Electric to integrate the then-proposed Carty Plant, and the proposed Longhorn Substation, which at the time was proposed by BPA to integrate wind onto the BPA 500-kV transmission system. During scoping, a considerable number of routes were considered to connect Hemingway and the Boardman area. Figure 3 is a snapshot of a number of routes considered early on during the CAP process (2009 timeframe). Numerous alternatives were considered, including routes through Idaho and through central Oregon. This large number of routes was further refined during the CAP process.

Idaho Power Company Appendix D—B2H Supplement
2017 IRP Page 23
Figure 3. Routes developed by the CAP advisory teams (2009 timeframe)

Appendix D—B2H Supplement Idaho Power Company
Page 24 2017 IRP
The CAP process resulted in Idaho Power submitting the route shown in Figure 4 as the company’s proposed route in the BLM-led NEPA process.
Figure 4. B2H proposed route resulting from the CAP process (2010 timeframe)

Idaho Power Company Appendix D—B2H Supplement
2017 IRP Page 25
The BLM considered Idaho Power’s proposed route, along with a number of other reasonable alternative routes, in the NEPA process. Figure 5 shows the route alternatives and variations considered in the BLM’s November 2016 Final EIS.
Figure 5. BLM final EIS routes

Appendix D—B2H Supplement Idaho Power Company
Page 26 2017 IRP
The conclusion of the BLM-led NEPA process, the BLM’s ROD, resulted in a singular route—the BLM’s Agency Preferred route. The 293.4-mile approved route will run across 100.3 miles of federal land (managed by the BLM, the U.S. Forest Service [USFS], the Bureau of Reclamation, and the U.S. Department of Defense), 190.2 miles of private land, and 2.9 miles of state lands. Figure 6 shows the BLM’s Agency Preferred route.
Figure 6. BLM Agency Preferred route from the 2017 BLM ROD
As discussed previously, the BLM-led NEPA process and the EFSC process are distinct processes. Idaho Power submitted its Amended Application for Site Certificate to the ODOE in summer 2017. The route Idaho Power submitted to the ODOE as part of the Application for Site Certificate is very similar to the BLM’s Agency Preferred route, except for a small section of private property west of La Grande. The BLM’s Agency Preferred route in this area was a surprise to Idaho Power and seemingly all stakeholders in the area. The section the BLM chose was not the county’s stated preference, nor was it the variation Idaho Power had worked with a large local landowner to modify to minimize impacts to his property.
At the time of EFSC application finalization (which was prior to the Final EIS release), Idaho Power did not feel as if there was a stakeholder consensus preference between the County’s preferred route and the modified route west of the City of La Grande. Therefore, Idaho Power brought both alternatives into the EFSC application. Idaho Power intends to continue to work with the community to finalize which of the two variations in this area will be constructed.
Idaho Power Company Appendix D—B2H Supplement
2017 IRP Page 27
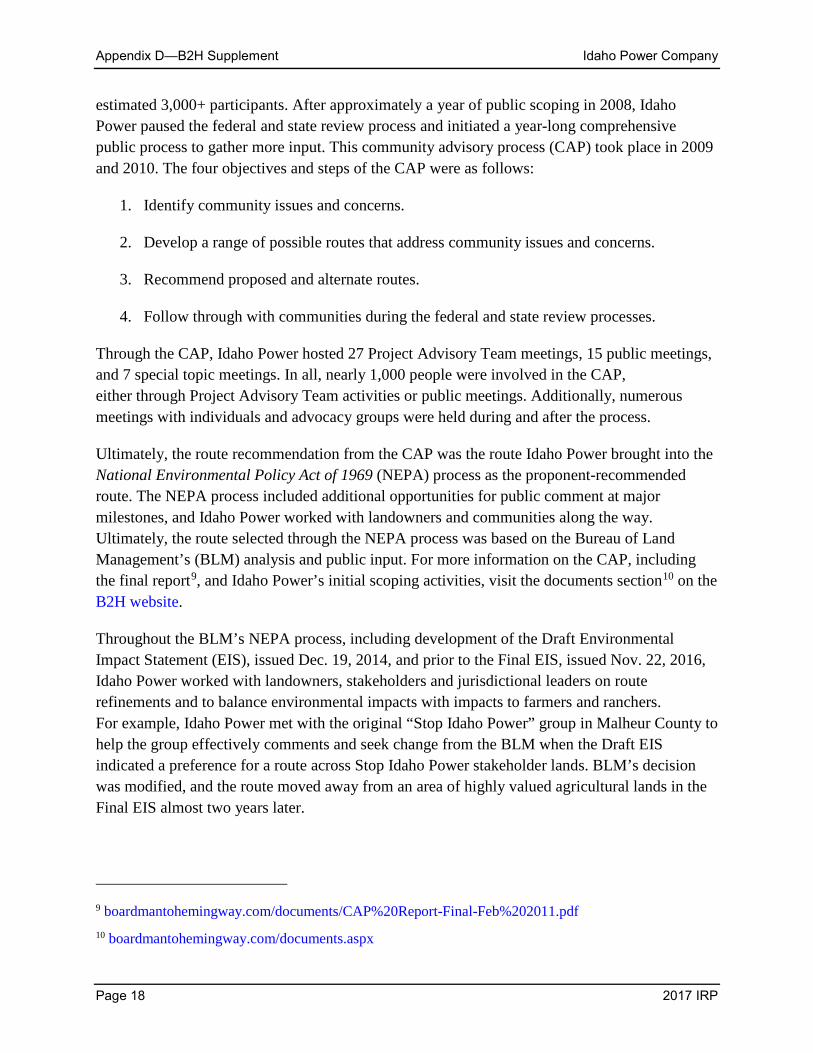
Figure 7 shows the route Idaho Power submitted in its 2017 EFSC Application for Site Certificate.
Figure 7. B2H route submitted in 2017 EFSC Application for Site Certificate
B2H Capacity Interest Per the terms of the Joint Permit Funding Agreement (see Appendix D-3), each co-participant (funder) is assigned a permitting interest based on the annual weighted capacity expressed in the project. The permitting interest is determined by the sum of a funder’s eastbound capacity interest and westbound capacity interest, divided by the total of all eastbound and westbound capacity interest. Table 5 details the capacity interest of each funder.

Appendix D—B2H Supplement Idaho Power Company
Page 28 2017 IRP
Table 5. B2H joint permit funding capacity interests by funder
Capacity Interest (West-to-East) Capacity Interest (East-to-West) Ownership %
Idaho Power 350 MW (Average) 500 MW (Summer) 200 MW (Winter)
0 MW 21.2%
PacifiCorp 300 MW 600 MW 54.5%
BPA 400 MW (Average) 250 MW (Summer) 550 MW (Winter)
0 MW 24.2%
Unallocated 0 MW 400 MW
Idaho Power’s capacity interest is seasonally shaped, with 500 MW of eastbound capacity from April through September and 200 MW of eastbound capacity from January through March and October through December. BPA’s capacity interest is seasonally shaped with 250 MW of eastbound capacity from April through September and 550 MW of eastbound capacity from January through March and October through December. PacifiCorp’s capacity is constant throughout the year. The sum of the capacity interest in the east-to-west direction is less than the rating (1,000 MW), so the unallocated capacity is divided among the funders based on their respective percentage permitting interest.
The seasonal capacity shaping is a great benefit for Idaho Power’s customers, and one of the reasons why the B2H project is such a competitive and cost-effective option in the IRP process. Idaho Power is effectively purchasing 500 MW of capacity (peak summer need) at a cost based on 350 MW of capacity.
Capacity Rating—WECC Rating Process Idaho Power coordinated with other utilities in the Western Interconnection via a peer-reviewed process known as the WECC Path Rating Process. Through the WECC Path Rating Process, Idaho Power worked with other western utilities to determine the maximum rating (power flow limit) across the transmission line under various stresses, such as high winter or high summer peak load, light load, high wind generation, and high hydro generation on the bulk power system. Based on industry standards to test reliability and resilience, Idaho Power simulated various outages, including the outage of B2H, while modeling these various stresses to ensure the power grid was capable of reliably operating with increased power flow. Through this process, Idaho Power also ensured the B2H project did not negatively impact the ratings of other transmission projects in the Western Interconnection. Idaho Power completed the WECC Path Rating Process in November 2012 and achieved a WECC Accepted Rating of 1,050 MW in the west-to-east direction and 1,000 MW in the east-to-west direction. The B2H project, when constructed, will add significant reliability, resilience, and flexibility to the Northwest power grid.
Idaho Power Company Appendix D—B2H Supplement
2017 IRP Page 29
B2H Design B2H is routed and designed to withstand catastrophic events, including, but not limited to, the following:
• Lightning
• Earthquake
• Fire
• Wind/tornado
• Ice
• Landslide
• Flood
• Direct physical attack
The following sections provide more information about the design of the B2H transmission line and address each of the catastrophic events listed above.
Transmission Line Design The details below are not inclusive of every design aspect of the transmission line but provide a brief overview of the design criteria. The B2H project will be designed and constructed to meet or exceed all required safety and reliability criteria.
The basic purpose of a transmission line is to move power from one substation to another for eventual distribution of electricity to end users. The basic components of a transmission line are the structures/towers, conductors, insulators, foundations to support the structures, and shield wires to prevent lighting from striking conductors. See Figure 8 for a cross-section of a transmission line.
For a single-circuit transmission line, such as B2H, power is transmitted via three-phase conductors (a phase can also have multiple conductors, called a bundle configuration). These conductors are typically comprised of a steel core to give the conductor tensile strength and reduce sag and of aluminum outer strands. Aluminum is used because of its conductive properties, and it provides the ability to move more power using a smaller amount of material.
Shield wires, typically either steel or aluminum, and occasionally including fiber optic cables inside for communication between substation equipment, are the highest wires on the structure. Their main purpose is to protect the phase conductors from a lightning strike.
Structures are designed to support the phase conductors and shield wires and keep them safely in the air. For the B2H project, structures were chosen to be steel lattice tower structures,

Appendix D—B2H Supplement Idaho Power Company
Page 30 2017 IRP
which provide an economical means to support large conductors for long spans over long distances. The typical structure height for B2H is 135 feet tall (structure height will vary depending on location) with a structure located roughly every 1,200 feet on average. The tower height and span length were optimized to minimize ground impacts and material requirements; taller structures could allow for longer spans (less structures on average per mile) but would be costlier due to material requirements. Again, the B2H tower and conductors were engineered to maximize benefits and minimize costs and impacts.
Foundations are the support mechanism that bind the structures to the earth and safely keep the phase conductors and shield wires in the air. For the B2H project, the foundations at each lattice tower structure are planned to be concrete-drilled pier shafts. A cylindrical hole will be drilled at each tower footing of adequate diameter and depth to support the loads applied to the structure from the shield wires and phase conductors. The loads applied to structures via shield wires and conductors are discussed in further detail below.

Idaho Power Company Appendix D—B2H Supplement
2017 IRP Page 31
Figure 8. Transmission tower components
Transmission Line Structural Loading Considerations Reliability and resiliency are designed into transmission lines. Overhead transmission lines have been in existence for over 100 years, and many codes and regulations govern the design and operation of transmission lines. Safety, reliability, and electrical performance are all incorporated into the design of transmission lines. Idaho Power’s EFSC application includes an exhaustive list of standards. Several notable standards are as follows:
• American Concrete Institute 318—Building Code Requirements for Structural Concrete
• American National Standards Institute (ANSI) standards (for material specs)
• American Society of Civil Engineers (ASCE) Manual No.74—Guidelines for Electrical Transmission Line Structural Loading

Appendix D—B2H Supplement Idaho Power Company
Page 32 2017 IRP
• National Electrical Safety Code (NESC)
• Occupational Safety and Health Administration (OSHA) 1910.269 April 11, 2014 (for worker safety requirements)
• National Fire Protection Association (NFPA) 780—Guide for Improving the Lightning Performance of Transmission Lines
NESC provides for minimum guidelines and industry standards for safeguarding persons from hazards arising from the construction, maintenance, and operation of electric supply and communication lines and equipment. The B2H project will be designed, constructed, and operated at standards that meet, and in most cases, exceed, the provisions of NESC.
Physical loads induced onto transmission structures and foundations supporting the phase conductors and shield wires for the B2H project are derived from three phenomena: wind, ice, and tension. Under certain conditions, ice can build up on phase conductors and shield wires of transmission lines. When transverse wind loading is also applied to these iced conductors, it can produce structural loading on towers and foundations far greater than normal operating conditions produce. Design weather cases for the B2H project exceed the provisions in the NESC. As an example, for a high wind case, NESC recommends 90 miles per hour (mph) winds. The criteria proposed for this project is 100 mph wind on the conductors and 120 mph wind on the structures. There are multiple loading conditions that will be incorporated into the design of the B2H project, including unbalanced longitudinal loads, differential ice loads, broken phase conductors, broken sub-phase conductors, heavy ice loads, extreme wind loads, extreme ice and wind loads, construction loads, and full dead-end structure loads.
Transmission Line Foundation Design The 500-kV single-circuit lattice steel structures require a foundation for each leg of the structure. The foundation diameter and depth shall be determined during final design and are dependent on the type of soil or rock present. The foundations will be concrete pier foundations designed to comply with the allowable bearing and shear strengths of the soil where placed. Soil borings shall be taken at key locations along the project route, and subsequent soil reports and investigations shall govern specific foundation designs as appropriate.
Common industry practices design transmission line structures to withstand wind and ice loads of NESC or greater, and are accepted as more stringent than the potential loads resulting from ground motion due to earthquakes. The 2017 NESC Rule 250A4 observes the structure capacity obtained by designing for NESC wind and ice loads at the specified strength requirements is sufficient to resist earthquake ground motions. Additionally, ASCE Manual No. 74 states transmission structures need not be designed for ground-induced vibrations caused by earthquake

Idaho Power Company Appendix D—B2H Supplement
2017 IRP Page 33
motion; historically, transmission structures have performed well under earthquake events,12, 13 and transmission structure loadings caused by wind/ice combinations and broken wire forces exceed earthquake loads.
Lightning Performance The B2H project is in an area that historically experiences 20 lightning storm days per year.14 This is relatively low compared to other parts of the US. The transmission line will be designed to not exceed a lightning outage rate of one per 100 miles per year. This will be accomplished by proper shield wire placement and structure/shield wire grounding to adequately dissipate a lightning strike on the shield wires or structures if it were to occur. The electrical grounding requirements for the project will be determined by performing ground resistance testing throughout the project alignment, and by designing adequately sized counterpoise or using driven ground rods with grounding attachments to the steel rebar cages within the caisson foundations as appropriate.
Earthquake Performance Experience has demonstrated that high-voltage transmission lines are very resistant to ground-motion forces caused by earthquake, so much so that national standards do not require these forces be directly considered in the design. However, secondary hazards can affect a transmission line, such as landslides, liquefaction, and lateral spreading. The design process considers these geologic hazards using multiple information streams throughout the siting and design process. The current B2H route evaluated geologic hazards using available electronic (geographic information system [GIS]) data, such as fault lines, areas of unstable and/or steep soils, mapped and potential landslide areas, etc. Towers located in potential geologic hazards are investigated further to determine risk. Additional analysis may include field reconnaissance to gauge the stability of the area and subsurface investigation to determine the soil strata and depth of hazard. At the time of this report, no high-risk geologic hazard areas have been identified. If, during the process of final design, an area is found to be high risk, the first option would be to micro-site—route around or span over the hazard. If avoidance is not feasible, the design team would seek to stabilize the hazard. Engineering options for stabilization include designing an array of sacrificial foundations above the tower foundation to anchor the soil or improving the subsurface soils by injecting grout or outside aggregates into the ground. If the geotechnical
12 Risk Assessment of Transmission System under Earthquake Loading. J.M. Eidinger, and L. Kemper, Jr.
Electrical Transmission and Substation Structures 2012, Pg. 183-192 © ASCE 2013. 13 Earthquake Resistant Construction of Electric Transmission and Telecommunication Facilities Serving
the Federal Government Report. Felix Y. Yokel. Federal Emergency Management Agency (FEMA). September 1990.
14 USDA RUS Bulletin 1751-801.

Appendix D—B2H Supplement Idaho Power Company
Page 34 2017 IRP
investigation determines the problematic soils are relatively shallow, the tower foundations can be designed to pass through the weaker soils and embed into competent soils.
Wildfire The transmission line steel structures are constructed of non-flammable materials, so wildfires do not pose a physical threat to the transmission line itself. However, heavy smoke from wildfires in the immediate area of the transmission line can cause flashover/arcing between the phase conductors and electrically grounded components. Standard operation is to de-energize transmission lines when fire is present in the immediate area of the line. Transmission lines generally remain in-service when smoke is present from wildfires not in the immediate vicinity of the transmission line. Alternatively, solar PV is susceptible to smoke, which can move into areas even if fires are not in the immediate vicinity of the solar generation. For example, the forest fires in the Pacific Northwest in 2017 caused much smoke along the proposed B2H corridor and in the Pacific Northwest in general. The B2H line would likely still operate for the fires not in the immediate area, whereas solar PV would likely operate at a much-reduced capacity while heavy smoke is covering the area.
Wind Gusts/Tornados Tornados are unlikely along the B2H route. As noted in the Transmission Line Structural Loading Considerations section above, the B2H transmission line is designed to withstand extreme wind loading combined with ice loading.
Ice Ice formation around the phase conductors and around the shield wires can add a substantial amount of incremental weight to the transmission line, putting extra force on the steel structures and foundations. As described in the Transmission Line Structural Loading Considerations section above, the B2H transmission line is designed to withstand heavy ice loading combined with heavy wind loading.
Landslide The siting and design process considers geologic hazards, such as landslides, liquefaction, and lateral spreading. See the Earthquake Performance section above. Through the siting and design process, steep, unstable slopes are avoided, especially where evidence of past landslides is evident. During the preliminary construction phase, geotechnical surveys and ground surveys (light detection and ranging [LiDAR] surveys) help verify potentially hazardous conditions. If a potentially hazardous area cannot be avoided, the design process will seek to stabilize the area.

Idaho Power Company Appendix D—B2H Supplement
2017 IRP Page 35
Flood The identification and avoidance of flood zones was incorporated into the siting process and will be further incorporated into the design process. Foundations and structures can be designed to withstand flood conditions.
Direct Physical Attack A direct physical attack on the B2H transmission line will remove the line’s ability to deliver power to customers. In the case of a direct attack, B2H is fundamentally no different than any other supply-side resource should a direct physical attack occur on a specific resource. However, because the B2H project is connected to the transmission grid, a direct physical attack on any specific generation site in the Pacific Northwest or Mountain West region will not limit B2H’s ability to deliver power from other generation in the region. In this context, B2H provides additional ability for generation resources to serve load if a physical attack were to occur on a specific resource or location within the region and therefore increases the resiliency of the electric grid as a whole.
If a direct physical attack were to occur on the B2H transmission line and force the line out of service, the rest of the grid would adjust to account for the loss of the line. Per the WECC facility rating process, the B2H capacity rating is such that an outage of the B2H line would not overload any other system element beyond equipment emergency ratings. Idaho Power also keeps a supply of emergency transmission towers that can be very quickly deployed to replace a damaged tower allowing the transmission line to be quickly returned to service.
B2H Design Conclusions As evidenced in this section, the B2H project is designed to withstand a wide range of physical conditions and extreme events. Because transmission lines are so vital to our electrical grid, design standards are stringent. B2H will adhere to, and in most cases, exceed, the required codes or standards observed for high voltage transmission line design. This approach to the design, construction, and operation of the B2H project will establish utmost reliability for the life of the transmission line. Additionally, as discussed in the Direct Physical Attack section, transmission lines add to the resiliency of the grid by providing additional paths for electricity should one or more generation resources or transmission lines experience a catastrophic event.
PROJECT CO-PARTICIPANTS PacifiCorp and BPA Needs PacifiCorp and BPA are co-participants on the B2H project (also referred to as funders). Collectively, Idaho Power, PacifiCorp, and BPA represent a very large electric service footprint in the western US. The fact that three large utilities have each identified the value of the B2H

Appendix D—B2H Supplement Idaho Power Company
Page 36 2017 IRP
project indicates the regional significance of the project and the value the project brings to customers throughout the West. Idaho Power, PacifiCorp, and BPA have worked closely to assign the capacity rights of the project to correlate with each party’s needs. More information about PacifiCorp’s and BPA’s needs and interest in the B2H project can be found in the following sections.
PacifiCorp PacifiCorp is a locally managed, wholly owned subsidiary of Berkshire Hathaway Energy Company. PacifiCorp is a leading western US energy services provider and the largest grid owner/operator in the West, serving 1.8 million retail customers in six western states. PacifiCorp is comprised of two business units: Pacific Power (serving Oregon, Washington, and California) and Rocky Mountain Power (serving Utah, Idaho, and Wyoming). Visit pacificorp.com for more information.
PacifiCorp has invested in the permitting of the B2H project because of the strategic value of the B2H corridor, which connects the Pacific Northwest to the Intermountain West. The existing transmission path between the two regions is fully used during key operating periods. As a potential owner in the project, PacifiCorp would be able to use its bidirectional capacity to increase reliability and efficiency for its customers. The following is a list of additional B2H benefits identified for PacifiCorp.
• Customers: PacifiCorp continues to invest to meet customers’ needs, making only critical investments now to ensure future reliability, security, and safety. The B2H project is identified as an investment that will ensure future reliability, security, and safety for PacifiCorp customers.
• Renewables: PacifiCorp continues to grow their renewable resources and transition to a lower-carbon future. The B2H project has been identified as a strategic project to facilitate PacifiCorp’s use of renewable resources across their two balancing authority areas.
• EIM: PacifiCorp was a leader in implementing the western energy imbalance market (EIM). The real-time market helps optimize the electric grid, lowering costs, enhancing reliability, and more effectively integrating resources. PacifiCorp believes the B2H project will help advance the objectives of the EIM, benefitting PacifiCorp customers and the broader region.
• Regional Benefit: PacifiCorp, as a member of the regional planning entity Northern Tier Transmission Group (NTTG), supports the conclusion that the B2H project is as a cost-effective project providing regional solutions to identified regional needs.

Idaho Power Company Appendix D—B2H Supplement
2017 IRP Page 37
• Balancing Area Consolidation: PacifiCorp operates/controls two balancing areas in the West. After the addition of B2H and portions of Gateway West, more transmission capacity will exist between PacifiCorp’s two balancing areas, providing the ability to increase operating efficiencies. B2H will provide PacifiCorp 300 MW of additional west-to-east capability and 600 MW of east-to-west capability to move resources between PacifiCorp’s two balancing authority areas.
BPA BPA is a nonprofit federal power marketing administration based in the Pacific Northwest. BPA provides approximately 28 percent of the electric power used in the Pacific Northwest, which has-an estimated population of over 13 million people. BPA also operates and maintains about three-fourths of the high-voltage transmission in its service area. BPA’s area includes Idaho, Oregon, Washington, western Montana, and small parts of eastern Montana, California, Nevada, Utah, and Wyoming. For more information, visit bpa.gov.
Similar to the Idaho Power IRP process for identifying cost-effective service alternatives, BPA identified the B2H project plus associated asset exchange as its top priority for pursuit for serving customers in southeast Idaho. BPA’s load and resource mix in southeast Idaho results in a net winter peak demand that exceeds the summer peak demand. BPA’s winter peak load couples well with Idaho Power’s summer peak load to allow for seasonal shaping of the B2H capacity. Seasonal shaping of capacity would allow BPA to own 550 MW of B2H capacity in the winter and 250 MW of capacity in the summer, dramatically increasing the cost-effectiveness of the project for BPA customers. A recent analysis performed by BPA continues to support the B2H project plus the asset exchange as its top priority for pursuit. For more information about the southeast Idaho load service analysis, visit bpa.gov.15
As a federal agency, BPA has responsibilities to comply with NEPA and consider the environmental impacts of its actions, such as participating in transmission line construction. To that end, BPA was a cooperating agency in the development of the B2H EIS and continues to coordinate with the BLM and other federal agencies. BPA will ensure an appropriate environmental review has been conducted on any BPA-proposed action associated with the project and plans to prepare a ROD to the B2H EIS as appropriate and in accordance with the B2H project’s permitting schedule.
Co-Participant Expenses Paid to Date Approximately $92 million, including allowance for funds used during construction (AFUDC), have been expended on the B2H project through September 30, 2017. Pursuant to the terms of 15 Southeast Idaho Load Service analysis:
bpa.gov/transmission/CustomerInvolvement/SEIdahoLoadService/Pages/default.aspx
Appendix D—B2H Supplement Idaho Power Company
Page 38 2017 IRP
the joint funding arrangements, Idaho Power has received approximately $48 million of that amount as reimbursement from the project participants as of September 30, 2017. Idaho Power has accrued in receivables approximately $18 million more that will be billed by Idaho Power in the future to the project co-participants for expenses Idaho Power has incurred, for a total amount reimbursable by co-participants of $66 million. Co-participants are obligated to reimburse Idaho Power for their share of any future project permitting expenditures incurred by Idaho Power.
Co-Participant Agreements Idaho Power, BPA, and PacifiCorp (collectively, the funders) entered a Joint Permit Funding Agreement on January 12, 2012, with the intent to be joint owners of the B2H line. The Joint Permit Funding Agreement provides for the permitting (state and federal), siting, and acquisition of right-of-way (ROW) over public lands. A copy of the Joint Permit Funding can be found in Appendix D-3.
Related to the project, but not specific to the B2H permitting activities, the B2H co-participants entered into an MOU on January 12, 2012, to 1) explore alternatives to establish BPA eastern Idaho load service from Idaho Power and PacifiCorp’s Hemingway Substation and 2) consider whether to replace certain transmission arrangements involving existing assets with joint ownership transmission arrangements and other alternative transmission arrangements pursuant to definitive agreements mutually satisfactory to the co-participants. In other words, in conjunction with the project, the parties agreed to explore cost-effective methods to serve customers by jointly owning facilities other than the B2H project. A copy of the MOU can be found here or in Appendix D-4.
COST Cost Estimate The total cost estimate for the B2H project is $1 to $1.2 billion dollars, which includes Idaho Power’s allowance for funds used during construction (AFUDC). Co-participant AFUDC is not included in this estimate range. The total cost estimate includes a 20-percent contingency for unforeseen expenses.
In IRP modeling, Idaho Power assumes a 21.2-percent share of the direct expenses, plus its entire AFUDC cost, which equates to approximately $258 million. Idaho Power also included costs for local interconnection upgrades totaling $16 million. The 2017 IRP was the first year for which the B2H route was relatively certain. In prior years, the estimate was based on uncertain route and terminus location information.

Idaho Power Company Appendix D—B2H Supplement
2017 IRP Page 39
Transmission Line Estimate Idaho Power has contracted with HDR to serve as the B2H project’s third-party owners’ engineer and prepare the B2H transmission line cost estimate. HDR has extensive industry experience, including experience serving as an owner’s engineer for BPA for the last seven years. HDR has prepared a preliminary transmission line design that locates every tower and access road needed for the project. HDR used utility industry experience and current market values for materials, equipment, and labor to arrive at the B2H estimate. Material quantities and construction methods are well understood because the B2H project is utilizing BPA’s standard tower and conductor design for 500-kV lines. BPA has used the proposed towers and conductor on hundreds of miles of lines currently in-service. HDR was the owner’s engineer on recent BPA projects, so HDR is also familiar with the BPA towers and conductor the B2H project is using.
Substation Estimates Idaho Power prepared the substation cost estimate for the Hemingway Substation, and BPA prepared the Longhorn Substation estimate. Idaho Power used experience designing and constructing the Hemingway Substation in 2013. The Hemingway Substation is designed to accommodate the B2H line terminal in the future. New equipment must be ordered and installed, but no station expansion will be required. The Longhorn Substation is a station proposed by BPA near Boardman, Oregon. BPA owns the land for the Longhorn Substation, but the station has yet to be constructed. BPA proposed the Longhorn Substation to integrate certain wind projects in the immediate area. BPA has extensive experience designing and constructing substations.
Calibration of Cost Estimates The B2H estimate was reviewed and approved by BPA and PacifiCorp. BPA and PacifiCorp both have recent transmission line construction projects to calibrate against. The recent projects included the following:
• BPA: Lower Monumental–Central Ferry 500-kV line (38 miles, in-service 2015)
• BPA: Big Eddy–Knight 500-kV line (39 miles, in-service 2016)
• PacifiCorp: Sigurd to Red Butte 345-kV line (160 miles, in-service 2015)
• PacifiCorp: Mona to Oquirrh 500-kV line (100 miles, in-service 2013)
Additionally, in early 2017 Idaho Power visited with NV Energy and Southern California Edison to learn from each company’s recent experience constructing 500-kV transmission lines in the West. As part of the discussions with each company, Idaho Power calibrated cost estimates and resource requirements.
The two projects were as follows:

Appendix D—B2H Supplement Idaho Power Company
Page 40 2017 IRP
• NV Energy: ON Line project (235 miles, 500 kV, in-service 2014)
• Southern California Edison: Devers to Palo Verde (150 miles, 500 kV, in-service 2013)
Costs Incurred to Date Approximately $92 million, including AFUDC, has been expended on the Boardman-to-Hemingway project through September 30, 2017. Refer to the Co-Participant Expenses Paid to Date section for co-participant reimbursements. The $92 million incurred through September 30, 2017, is included in the $1 to $1.2 billion total estimate. Idaho Power’s share of the costs incurred to-date is included B2H IRP portfolio modeling.
Cost-Estimate Conclusions The cost estimate for B2H has been thoroughly vetted. Idaho Power used third-party contractors with industry experience, relied on PacifiCorp and BPA recent transmission line construction experience, and benchmarked against multiple recent high-voltage transmission line investments in the West to arrive at the B2H construction cost estimate. Material quantities and construction methods are well understood because the B2H project is using BPA’s standard tower and conductor design for 500-kV lines. As a conservative measure, Idaho Power has added a 20 percent contingency to cover any unanticipated expenses. As a reminder, Idaho Power’s IRP analysis escalates all resource costs at a 2.1-percent inflation rate into the future so future labor and material cost escalations are accounted for in B2H IRP portfolio modeling.
Transmission Revenue The B2H transmission line project is modeled in AURORA as additional transmission capacity available for Idaho Power energy purchases from the Pacific Northwest. In general, for new supply-side resources modeled in the IRP process, surplus sales of generation are included as a cost offset in the AURORA portfolio modeling. However, historically, additional transmission wheeling revenue has not been quantified for transmission capacity additions. For the 2017 IRP, Idaho Power modeled the additional transmission wheeling revenue for the B2H project. After the B2H line is in-service, the cost of Idaho Power’s share of the transmission line will go into Idaho Power’s transmission rate base as a transmission asset. Idaho Power’s transmission assets are funded by native-load customers, network customers, and transmission wheeling customers based on a ratio of each party’s usage of the transmission system. In the IRP modeling, the estimated incremental transmission wheeling revenue from non-native-load customers was modeled as an annual revenue credit for B2H portfolios.
In the B2H analysis, Idaho Power chose to conservatively assume that third-party use (network customers and transmission wheeling customers) across Idaho Power’s transmission system would remain static following the construction of B2H. Idaho Power’s FERC transmission rate is calculated as follows:

Idaho Power Company Appendix D—B2H Supplement
2017 IRP Page 41
𝑇𝑇𝑇𝑇𝑇𝑇𝑇𝑇𝑇𝑇𝑇𝑇𝑇𝑇𝑇𝑇𝑇𝑇𝑇𝑇𝑇𝑇𝑇𝑇 𝑅𝑅𝑇𝑇𝑅𝑅𝑅𝑅 =𝑇𝑇𝑇𝑇𝑇𝑇𝑇𝑇𝑇𝑇𝑇𝑇𝑇𝑇𝑇𝑇𝑇𝑇𝑇𝑇𝑇𝑇𝑇𝑇 𝐶𝐶𝑇𝑇𝑇𝑇𝑅𝑅𝑇𝑇 ($)
𝑇𝑇𝑇𝑇𝑇𝑇𝑇𝑇𝑇𝑇𝑇𝑇𝑇𝑇𝑇𝑇𝑇𝑇𝑇𝑇𝑇𝑇𝑇𝑇 𝑈𝑈𝑇𝑇𝑇𝑇𝑈𝑈𝑅𝑅 (𝑀𝑀𝑀𝑀 ∗ 𝑦𝑦𝑅𝑅𝑇𝑇𝑇𝑇)
Per the formula above, since transmission costs will go up following the installation of B2H, and transmission usage is assumed to remain the same, Idaho Power’s transmission rate will increase. Idaho Power’s existing transmission customers will pay this higher transmission rate, resulting in incremental transmission revenue to Idaho Power.
As a specific example, based on current third-party long-term usage, Idaho Power forecasts 611 MW of third-party long-term transmission wheeling customers. Idaho Power also forecasts 250 average MW of network customers for a combined total of 861 MW usage. For each $1,000 per MW per year increase to the transmission rate (transmission costs in the equation above), Idaho Power will gain about $861,000 in transmission revenue. B2H will increase Idaho Power’s rate by over $6,000 per MW per year.
An alternative way to understand the FERC transmission rate, and B2H’s impact, is to look at the transmission system from a total load prospective. Native load, network load, and transmission customers must pay their respective share based on their usage of the system. Native load and network load usage is measured in peak MW (averaged by month), and transmission customer usage is measured by reservation amount. The total transmission usage in 2026 is forecast to be approx. 3,900 MW (including Idaho Power’s native load usage); therefore, the 861 MW of network load and transmission customer usage results in approximately 22 percent of the total transmission system usage. As such, non-Idaho Power customers are estimated to pay about 22 percent of the costs associated with B2H.
This transmission revenue will offset the cost of B2H for retail customers. In a similar manner, other portfolios include revenues from market sales of newly installed supply resources, which act to offset costs in those portfolios. This section provides a high-level explanation of the workings of Idaho Power’s FERC transmission rate. When determining the annual transmission revenue credit for B2H portfolios, Idaho Power ran a full corporate financial model, including rate of return, depreciation expense, operation and maintenance (O&M), etc.
Idaho Power believes short-term usage of the Idaho Power transmission system by third parties could substantially increase because additional capacity is created, further reducing Idaho Power customer rates. However, to be conservative, Idaho Power assumed there would be no increased short-term or long-term third-party transmission usage and only applied the higher transmission rate to the existing usage.
Potential BPA and Idaho Power Asset Swap Corresponding with the construction of B2H, Idaho Power and BPA are working to complete an asset swap that would allow Idaho Power to directly access the Mid-C market and avoid a BPA transmission wheeling charge. Such a swap would result in lower purchased-power prices for

Appendix D—B2H Supplement Idaho Power Company
Page 42 2017 IRP
Idaho Power’s customers. In return, BPA would be able to directly serve their load in southeastern Idaho and avoid an Idaho Power wheeling charge. As part of the 2017 IRP analysis, Idaho Power conservatively assumed there would be a wheeling charge to access Mid-C resources across B2H. If an asset swap were to take place, the cost of energy in B2H portfolios would be further reduced and make B2H an even more attractive project. Refer to Appendix D-4 for the MOU relating to the potential Idaho Power–BPA asset swap.
BENEFITS High-voltage transmission lines, such as B2H, are used to serve customer demand and to move energy between major markets hubs in the Western Interconnection. If the existing western US were to be overlaid with thousands of new miles of high-voltage transmission lines, the entire WECC could be optimized such that all customers would be served with the most economic resources at all times of the year. The long-term need for new supply-side resources would greatly diminish due to the vast diversity of the loads and resources across the Western Interconnection. Such a grid, of course, is economically infeasible, but projects such as B2H are being developed to allow economic resources to be shared between regions. The existing transmission grid is not perfect and many areas of the transmission grid are congested. Transmission congestion causes both economic and reliability issues.
Capacity High-voltage transmission lines provide many significant benefits to the Western Interconnection. The most significant benefit of the B2H project is the capacity benefit of the transmission line. Idaho Power is developing the B2H project to create capacity to serve peak customer demand. The capacity benefit is described in more detail in the Resource Need section.
The Pacific Northwest is a winter peaking region. Pacific Northwest utilities continue to install and build generation capacity to meet winter peak regional needs. Idaho Power operates a system with a summer peak demand. Idaho Power’s peak occurs in the late June/early July timeframe, which aligns well with spring hydro runoff conditions when the Pacific Northwest is flush with surplus power capacity. The existing transmission system between the Pacific Northwest and Idaho Power is constrained. Constructing B2H will alleviate this constraint and add 1,050 MW of transfer capability between the Pacific Northwest and Idaho Power. Both the Pacific Northwest and Idaho Power will significantly benefit from the addition of transmission capacity between the regions. The Pacific Northwest has already built the power plants and would benefit from selling energy to Idaho Power. Idaho Power needs resources to serve peak load, and a transmission line to existing, underutilized power plants is much more cost effective than building a new power plant.

Idaho Power Company Appendix D—B2H Supplement
2017 IRP Page 43
Avoid Constructing New Resources (and Potentially Carbon-Emitting Resources In the early days of the electric grid, utilities built individual power plants to serve their local load. Utilities quickly realized that if they interconnected their systems with low-cost transmission, the resulting diversity of load reduced their need to build power plants. Utilities also realized transmission allowed them to build and share larger, more cost-effective and more efficient power plants. The same opportunities exist today. In fact, B2H is being developed to take advantage of existing diversity.
Table 6 illustrates peak-load estimates, by utility and season, for 2026. The shading represents winter-peaking utilities. As seen in the table, there is significant diversity of load between the regions. The Maximum (MW) column illustrates the minimum amount of generating capacity that would be required if each region were to individually plan and construct generation to meet their own peak load need: 69,000 MW. When all regions plan together, the total generating capacity can be reduced to 63,800 MW, a nearly 10 percent reduction. Transmission connections between the regions, such as B2H, are the key to sharing installed generation capacity.
Table 6. 2026 peak load estimates—illustration of load diversity between western regions
Region Summer Peak (MW) Winter Peak (MW) Maximum (MW)
Avista 2,200 2,400 2,400
BPA 9,200 11,000 11,000
British Columbia 10,300 13,100 13,100
Chelan 600 800 800
Grant 900 900 900
Idaho Power 3,800 2,800 3,800
Nevada 9,000 6,500 9,000
Northwestern Energy 2,000 1,900 2,000
PacifiCorp—East 9,500 7,900 9,500
PacifiCorp—West 3,600 4,000 4,000
Portland General 4,000 4,100 4,100
Puget Sound 4,000 5,400 5,400
Seattle City 1,500 1,900 1,900
Tacoma 800 1,100 1,100
Total 61,400 63,800 69,000
Note: 2026 regional peak load data extracted from the WECC TEPPC 2026 Common Case. Load diversity occurs seasonally, as illustrated in Table 6, but it also occurs sub-seasonally and daily. An additional major variable in the Northwest is hydroelectric generation diversity. Over the winter, water accumulates in the mountains through snowpack. As this snow melts, water
Appendix D—B2H Supplement Idaho Power Company
Page 44 2017 IRP
flows through the region’s hydroelectric dams, and northwest utilities generate a significant amount of power. During the spring runoff, generation capacity available in the Pacific Northwest can be significantly higher than generation capacity available during the winter, or even during late summer. Idaho Power is fortunate to have a peak load that is coincident with the late spring / early summer hydro runoff. Idaho Power’s peak load occurs in late June/early July, when hot weather causes major air-conditioning load coincident with agricultural irrigation/pumping load. Idaho Power’s time window for a significant peak is quite short, with agricultural irrigation/pumping load starting to ramp down by mid-July.
Utilities have an obligation to serve customer load. This means that utilities are planning to meet peak load needs. As discussed previously, transmission congestion can cause utilities to build additional generation to serve load. Due to transmission congestion, utilities may be unable to leverage their transmission system to access dormant generation already constructed by their neighbors. The B2H project is an alternative to building new supply-side resources. As demonstrated in the 2017 IRP, the portfolios that are the most cost-effective other than B2H are portfolios with natural gas generation. In this case, B2H is an alternative to building a carbon-emitting supply-side resource.
Improved Economic Efficiency Transmission congestion causes power prices on opposite sides of the congestion to diverge. Transmission congestion is managed by dispatching less economically efficient resources to ensure the transmission system is operating securely and reliably. Congestion can have a significant cost. During peak summer conditions, the Idaho to Northwest path in the west-to-east direction becomes constrained and power prices in Idaho and to the east will generally be high, while power prices in the Pacific Northwest will be depressed due to a surplus of power availability without adequate transmission capacity to move the power out of the region. The construction of B2H will alleviate much of this constraint and create a win–win scenario where generators in the Pacific Northwest will be able to gain further value from their existing resource, and load-serving entities in the Mountain West region will be able to meet load service needs at a lower cost. The reverse situation could be true as well—the Pacific Northwest could benefit from economical resources from the Mountain West region during certain times of the years.
Renewable Integration Transmission capacity is critical to the integration of renewable generation that, at times, is curtailed due to a lack of transmission capacity to move the energy to load. Transmission is a facilitator for future generation development.

Idaho Power Company Appendix D—B2H Supplement
2017 IRP Page 45
Grid Reliability/Resiliency Transmission grid disturbances do occur. B2H will increase the robustness and reliability of the regional transmission system by adding additional high-capacity bulk electric facilities designed with the most up-to-date engineering standards. Major 500-kV transmission lines, such as B2H, substantially increase the grid’s ability to recover from major unexpected disturbances. Unexpected disturbances are difficult to predict, but below are a few examples of disturbances whose impacts would be reduced with the addition of B2H:
1. Loss of the Hemingway–Summer Lake 500-kV line with heavy west-to-east power transfer into Idaho. The loss of the Hemingway–Summer Lake 500-kV transmission line, the only 500-kV connection between the Pacific Northwest and Idaho Power, during peak summer load is one of the worst possible contingencies the Idaho Power transmission system can experience. Once Hemingway–Summer Lake 500-kV disconnects, the transfer capability of the Idaho to Northwest path is reduced by over 700 MW in the west-to-east direction. After the addition of B2H, there will be two major 500-kV connections between the Pacific Northwest and Idaho Power. The Hemingway–Summer Lake 500-kV outage would become much less severe to Idaho Power’s transmission system.
2. Loss of the Hemingway–Summer Lake 500-kV line with heavy east-to-west power transfer out of Idaho to the Pacific Northwest. In this disturbance, an existing remedial action scheme (power system logic used to protect power system equipment) will disconnect over 1,000 MW of generation at the Jim Bridger Power Plant to reduce path transfers and protect bulk transmission lines and apparatus. Due to the magnitude of the generation loss, recovery from this disturbance can be extremely difficult. After the addition of B2H, this enormous amount of generation shedding will no longer be required. With two 500-kV lines between Idaho and the Pacific Northwest, the loss of one can be absorbed by the other.
3. Loss of a single 230-kV transmission tower in the Hells Canyon area. Idaho Power owns two 230-kV transmission lines, co-located on the same transmission towers, that connect Idaho to the Pacific Northwest. Because these lines are on a common tower, Idaho Power must consider the simultaneous loss of these lines as a realistic planning event. Historically, such an outage did occur on these lines in 2004 during a day with high summer loads. By losing these lines, Idaho Power’s import capability was dramatically reduced, and Idaho Power was forced to rotate customer outages for several hours due to a lack of resource availability. After the addition of B2H, the impact of this outage would be substantially reduced.

Appendix D—B2H Supplement Idaho Power Company
Page 46 2017 IRP
Resource Reliability Transmission unavailability and unexpected forced outages have historically been a fraction of a traditional generation resource. Availability, and contribution to resource adequacy on the power grid, vary significantly by resource type. The North American Electric Reliability Corporation (NERC) has historically tracked transmission availability through a Transmission Availability Data System (TADS) and generation availability through a Generation Availability Data System (GADS) in North America. A telling sign of the reliability of a resource is the equivalent forced outage rate (EFOR). The EFOR is calculated based on the amount of time a transmission line, or generator, is either de-rated, or forced out of service while needed. De-rating a generator would be considered a partial outage, based on the de-rate amount as a percentage of the total capacity.
Table 7 provides the NERC TADS data for different transmission operating voltages. From the NERC TADS data, a 300-mile, 500-kV transmission line (B2H) would be expected to have an outage rate of 0.4 percent. Stated differently, the B2H transmission line is expected to have 99.6 percent availability.
Table 7. NERC—AC transmission circuit sustained outage metrics
Voltage Class
Circuit Miles
No. of Circuits
No. of Outages
Total Outage
Time (hr)
Frequency (SCOF) (per 100
CM per yr)
Frequency (SOF) (per
circuit per yr)
MTTR or Mean Outage Duration (hr)
200–299 kV 103,558 4,477.5 876 14,789.6 0.8459 0.1956 16.9
300–399 kV 56,791 1,623.6 394 19,766.8 0.6938 0.2427 50.2
400–599 kV 32,184 594.7 141 3,957.9 0.4381 0.2371 28.1
600–799 kV 9,451 110.0 28 342.4 0.2963 0.2545 12.2
All Voltages 201,985 6,805.8 1,439 38,856.7 0.7124 0.2114 27.0
By comparison, Table 8, lists the average EFOR for traditional fossil fuel power plants (coal, oil, gas, etc.) and the average EFOR for gas power plants.
Table 8. NERC forced-outage rate information for a fossil or gas power plant
Generation Type Unit Size EFOR
Fossil (general) All Sizes 7.96%
Fossil (general) 100–199 MW 7.49%
Fossil (general) 200–299 MW 5.85%
Gas All Sizes 9.61%
Gas 1–99 MW 9.72%
Gas 100–199 MW 6.85%
A transmission line with an EFOR of less than 1 percent, on the high end, is significantly more reliable than a power plant, which has an EFOR of 7 to 10 percent. A transmission line, of

Idaho Power Company Appendix D—B2H Supplement
2017 IRP Page 47
course, requires a resource to source the line and serve load. However, the resources purchased at the end of the transmission line can be purchased as firm, whereby the seller must be able to supply the generation no-matter what (which may require purchasing someone else’s generation if the primary unit experiences an outage). Therefore, if the resource is purchased as firm, the purchased resource would have an EFOR consistent with the transmission line, which is much more reliable than traditional supply-side generation. In the management of cost and risk, B2H will provide Idaho Power’s operators additional flexibility when managing the Idaho Power resource portfolio.
Reduced Electrical Losses During peak summer conditions, with heavy power transfers on the Pacific Northwest and Idaho Power transmission systems, the addition of the B2H project is expected to reduce electrical losses by more than 100 MW in the Western Interconnection. This is a considerable savings for the region; 100 MW of generation, that customers ultimately pay for, does not need produced to supply losses alone.
Losses on the power system are caused by electrical current flowing through energized conductors, which in turn create heat. Losses are equal to the electrical current squared times the resistance of the transmission line:
𝐸𝐸𝐸𝐸𝑅𝑅𝐸𝐸𝑅𝑅𝑇𝑇𝑇𝑇𝐸𝐸𝑇𝑇𝐸𝐸 𝐿𝐿𝑇𝑇𝑇𝑇𝑇𝑇𝑅𝑅𝑇𝑇 = 𝐶𝐶𝐶𝐶𝑇𝑇𝑇𝑇𝑅𝑅𝑇𝑇𝑅𝑅2 × 𝑅𝑅𝑅𝑅𝑇𝑇𝑇𝑇𝑇𝑇𝑅𝑅𝑇𝑇𝑇𝑇𝐸𝐸𝑅𝑅
From the electrical losses equation above, if the current doubles, the electrical losses will increase by a factor of four. By constructing the B2H line, less efficient (i.e., lower voltage) transmission lines with very large transfers are relieved, reducing the electrical current through these lines and dramatically reducing the losses due to heat.
Flexibility Advances in technology are pushing certain existing generation resources toward economic obsolescence. Any supply-side resource alternative could face the same economic obsolescence in the future. B2H is an alternative to constructing a new supply-side resource and therefore, reduces the risk of technological obsolescence. B2H will facilitate the transfer of any generation technology, ensuring Idaho Power customers always have access to the most economic resources, regardless of the resource type.
B2H capacity, when not used by B2H owners, will be available (for purchase) to other parties to make economic interstate west-to-east and east-to-west power transfers for more efficient regional economic dispatch. This provides a regional economic benefit to utilities around Idaho Power that is not factored into the analysis. Specifically, the B2H project will make additional capacity available for Pacific Northwest utilities to sell energy to southern and eastern markets in the West, and for Pacific Northwest utilities to purchase energy from southern and eastern

Appendix D—B2H Supplement Idaho Power Company
Page 48 2017 IRP
markets to meet their winter peak load service needs (southern and eastern WECC entities are mostly summer peaking). Idaho Power customers benefit from any third-party transmission purchases as the incremental transmission revenue acts to offset retail customer costs.
The existing electric system is heavily used. Because the system is so heavily used, new transmission line infrastructure, like B2H, creates additional operational flexibility. B2H will increase the ability to take other system elements out of service to conduct maintenance and will provide additional flexibility to move needed resources to load when outages occur on equipment.
EIM Idaho Power views the regional high-voltage transmission system as critical to the realization of EIM benefits, and the expansion of this transmission system (i.e., B2H) facilitates the realization of these benefits. As fluctuations in supply and demand occur for EIM participants, the market system will automatically find the best resource(s) from across the large-footprint EIM region to meet immediate power needs. This activity optimizes the interconnected high-voltage system as market systems automatically manage congestion, helping maintain reliability while also supporting the integration of intermittent renewable resources and avoiding curtailing excess supply by sending it to where demand can use it.
Idaho Power notes that EIM participation does not alter its obligations as a balancing authority (BA) required to comply with all regional and national reliability standards. Participation in the western EIM does not change NERC or WECC responsibilities for resource adequacy, reserves, or other BA reliability-based functions for a utility.
B2H Complements All Resource Types Utility-scale resource installations allow economies of scale to benefit customers in the form of lower cost per watt. For instance, residential rooftop solar is growing in popularity, but the economics of rooftop solar are outweighed by the economics of utility-scale solar installation.16 Large transmission lines allow the most economical resources to be sited in the most economical locations. As an example, single-axis tracking utility-scale solar in Salem, Oregon, is expected to have a capacity factor of approximately 15 percent (where the capacity factor is the amount of time the system generates over the course of a year). Comparatively, the same single-axis tracking utility-scale solar system in Boise, Idaho, has a capacity factor of approximately 19 percent17. If solar system prices are assumed to be equivalent in Salem and Boise, a Boise 16 The National Renewable Energy Laboratory (NREL) estimates the cost of residential rooftop solar
(PV) is approximately 2.5 times the cost of utility-scale solar on a $/Watt basis (NREL, U.S. Solar Photovoltaic System Cost Benchmark: Q1 2017).
17 NREL, System Advisory Model

Idaho Power Company Appendix D—B2H Supplement
2017 IRP Page 49
installation would generate over 30 percent more energy over the course of the year. Transmission lines provide the ability to move the most economical resources around the region.
Idaho Power views transmission lines like B2H as a complement to any resource type that allows access to the least-cost and most efficient resource, as well as regional diversity, to benefit all customers in the West.
B2H Benefits to Oregon Economic and Tax Benefits The B2H project will result in positive economic impacts for eastern Oregon communities in the form of new jobs, economic support associated with infrastructure development (i.e., lodging and food), and increased annual tax benefits to each county for project-specific property tax dollars. The annual tax benefit for the non-BPA owned portion of the line is shown in Table 9 below. BPA, as a federal entity, does not pay taxes, so BPA’s 25 percent project interest is excluded from the estimates. Idaho Power anticipates the project will add about 500 construction jobs, which will provide a temporary increase in spending at local businesses.
Table 9. Projected annual B2H tax expenditures by county
Oregon County Property Tax (excluding BPA’s 25% ownership interest)
Morrow $270,295
Umatilla $569,656
Union $629,410
Baker $1,778,282
Malheur $893,567
Total Oregon Tax Benefit $4,141,210
Local Area Electrical Benefits The B2H project will add 1,050 MW of additional transmission connectivity between the BPA and Idaho Power systems. Currently, the transmission connections between BPA and Idaho Power are fully used for existing customer commitments. Idaho Power currently serves customers in Owyhee County, Idaho, and Malheur County and portions of Baker County in Oregon. PacifiCorp, through Pacific Power, serves portions of Umatilla County. BPA provides transmission service to local cooperatives in the remainder of the project area in Morrow, Umatilla, Union, and Baker counties. Below is a summary of how these areas will benefit directly from B2H.
La Grande and Baker City are served by the Oregon Trails Electric Cooperative (OTEC). Portions of Morrow County and Umatilla County are served by Umatilla Electric Cooperative (UEC) and Columbia Basin Electric Cooperative (CBEC). OTEC, UEC, and CBEC pay BPA’s
Appendix D—B2H Supplement Idaho Power Company
Page 50 2017 IRP
network transmission rate to receive power and transmission service from the BPA system. If BPA finds less expensive solutions to meet service obligations to customers in southeast Idaho and Wyoming, costs are kept low for other BPA customers, including OTEC, UEC, and CBEC. In other words, BPA customers in Oregon benefit by finding a low-cost solution for customers in Idaho and Wyoming. BPA’s financial analysis to date has projected that a share of the B2H project with asset exchange appears the most cost-effective, long-term solution to serve customers in southeast Idaho and eastern Wyoming. Correspondingly, OTEC, UEC, and CBEC customers would also benefit from this cost-effective solution.
The B2H project provides economic development opportunities. The cost of power is a major factor in economic development and, as discussed previously, B2H, as a low-cost resource alternative, will keep power costs low compared to more expensive alternatives.
Capacity must be available on the existing system for additional economic development to take place. In Union and Umatilla counties, BPA’s McNary–Roundup–La Grande 230-kV line has limited ability to serve additional demand in the Pendleton and La Grande areas but is currently capable of meeting the 10-year load forecast. The B2H project will increase the transfer capability through eastern Oregon by 1,050 MW. This capacity will provide a significant regional benefit to the entire Northwest and specifically benefit load service to eastern Oregon and southern Idaho. It is possible this added capacity resulting from the B2H project could be used to serve additional demand in Union and Umatilla counties.
Portions of Baker County are served by Idaho Power, from Durkee to the east. BPA currently provides energy to OTEC, which serves Baker City via transmission connections between the Northwest and Idaho Power’s transmission system. At this point, the existing transmission connections between the Northwest and Idaho Power are fully used for existing load commitments, with very little ability to meet load growth requirements. The B2H project will increase the transmission connectivity between the Northwest and Idaho Power by 1,050 MW, which will allow BPA to serve additional demand in Baker City.
Finally, additional transmission capacity can create opportunities for new energy resources, which can add to the county tax base and create new jobs.
RISK Risk is inherent in any infrastructure development project. The sections below address various risks associated with the B2H project. Combining the analysis below with the risk analysis conducted in the 2017 IRP, Idaho Power believes B2H is the lowest-risk resource to meet Idaho Power’ resource needs.

Idaho Power Company Appendix D—B2H Supplement
2017 IRP Page 51
Capital-Cost Risk The capital-cost estimate for the B2H project has been well vetted. See the Cost section for an explanation of how the B2H project cost estimate was determined. Idaho Power’s share of the B2H project is $274 million, including Idaho Power’s AFUDC and local interconnection costs. For illustrative purposes, Figure 9 compares total portfolio costs for the 2017 IRP 20-year planning horizon. To determine the fixed costs associated with each portfolio, costs for each resource are levelized over the asset life, and costs beyond 2036 are not included in the analysis. The information from Figure 9 was extracted directly from the IRP Table 9.3.
The B2H project has considerable capital-cost bandwidth. The least-cost B2H portfolio (Portfolio 7) outperforms the least-cost B2H-alternative portfolio (Portfolio 9) by a 2017 net present value (NPV) of $147 million. Note that the B2H estimate already includes 20-percent capital-cost contingency. No other resources evaluated in IRP portfolios include a contingency. Based on NPV analysis over the 20-year planning horizon, Idaho Power’s cost share of the B2H project could more than double, and the least-cost B2H portfolio would still be more cost-effective than the least-cost B2H-alternative portfolio.
Figure 9. Comparison of total portfolio costs from 2017 IRP (Table 9.3 in 2017 IRP)

Appendix D—B2H Supplement Idaho Power Company
Page 52 2017 IRP
Market Price Risk The cost of dispatching gas-fired generation typically sets the market price of power at Mid-C. A stochastic risk analysis was conducted on all 2017 Idaho Power IRP portfolios, with natural gas prices ranging up to 400 percent of the planning case. Refer to IRP Table 9.4 and Table 9.5 for more information. The natural gas stochastic risk analysis in the 2017 IRP is a market price stochastic analysis because natural gas prices set the energy market prices. Figure 10 below shows three stochastic iterations comparing natural gas prices and Mid-C market prices. The solid lines represent Mid-C energy hub prices, and the dotted lines represent Sumas hub natural gas prices; the natural gas prices and market prices are very closely correlated.
Figure 10. Correlation between Mid-C market prices and natural gas prices
Based on the correlation of natural gas prices and market prices, market price risk analysis was considered for the B2H project in Idaho Power’s 2017 IRP. Results of the stochastic analysis show B2H portfolios remain the low-cost portfolios for all natural gas price sensitivities, except a 400 percent price sensitivity. However, Idaho Power believes a 400 percent energy market price increase is unlikely because a 400 percent increase in natural gas prices, along with the associated increase in energy prices, would likely result in the development of alternative resources in place of natural gas (that is, developers of more cost-effective resources would take advantage of financial opportunities if market prices increased 400 percent due to natural gas costs).
Liquidity and Market Sufficiency Risk The Pacific Northwest is a winter peaking region. Pacific Northwest utilities continue to install and build generation capacity to meet winter peak regional needs. Idaho Power operates a system
$0
$5
$10
$15
$20
$25
$30
$0
$50
$100
$150
$200
$250
2017
_01
2017
_05
2017
_09
2018
_01
2018
_05
2018
_09
2019
_01
2019
_05
2019
_09
2020
_01
2020
_05
2020
_09
2021
_01
2021
_05
2021
_09
2022
_01
2022
_05
2022
_09
2023
_01
2023
_05
2023
_09
2024
_01
2024
_05
2024
_09
2025
_01
2025
_05
2025
_09
2026
_01
2026
_05
2026
_09
2027
_01
2027
_05
2027
_09
2028
_01
2028
_05
2028
_09
2029
_01
2029
_05
2029
_09
2030
_01
2030
_05
2030
_09
2031
_01
2031
_05
2031
_09
2032
_01
2032
_05
2032
_09
2033
_01
2033
_05
2033
_09
2034
_01
2034
_05
2034
_09
2035
_01
2035
_05
2035
_09
2036
_01
2036
_05
2036
_09
$/M
MBt
u
$/M
Wh
Mid-C Market and Sumas Natural Gas
Iteration 44 Planning Case Iteration 91 Sumas Iteration 44 Sumas Planning Case Sumas Iteration 91

Idaho Power Company Appendix D—B2H Supplement
2017 IRP Page 53
with a summer peak. Idaho Power’s peak occurs in the late June/early July timeframe. The Idaho Power summer peak aligns with the Mid-C hydro runoff conditions when the Pacific Northwest is flush with surplus power capacity. The existing transmission system between the Pacific Northwest and Idaho Power is constrained. Constructing B2H will alleviate this constraint and add 1,050 MW of total transfer capability between the Pacific Northwest and the Intermountain West region. The Pacific Northwest and Idaho Power will significantly benefit from the addition of transmission capacity between the regions. The Pacific Northwest has constructed power plants to meet winter needs and would benefit from selling energy to Idaho Power in the summer. Idaho Power needs generation capacity to serve summer peak load, and a transmission line to existing underutilized power plants is much more cost-effective than building a new power plant.
See the Market Overview section of this appendix for more information about the Mid-C market hub liquidity. Based on the risk assessment, Idaho Power believes sufficient market liquidity exists.
The following data points will address the market sufficiency risk.
Data Point 1. Peak Load Analysis from Table 6 Referencing Table 6 from the Benefits section above, British Columbia and other utilities in the Pacific Northwest have forecast 2026 winter peaks that exceed their forecast 2026 summer peaks by a combined 7,600 MW. Given the difference in seasonal peaks, coupled with Columbia runoff hydro conditions aligning with Idaho Power’s summer peak, resource availability in the Pacific Northwest during Idaho Power’s summer peak is likely.
Data Point 2. Pacific Northwest Power Supply Adequacy Assessment for 2022—Northwest Power Conservation Council Report The Northwest Power and Conservation Council (NWPCC) recently studied the Northwest power system to determine resource adequacy using a five-year forecast. In July 2017, the NWPCC published their 2022 Assessment.18 The report suggests the Northwest must install 400 MW of new effective capacity by 2021 to meet the NWPCC standard.
The NWPCC, through their analysis, attempted to quantify resource adequacy through a loss-of-load probability (LOLP) analysis. In Figure 11 below, a higher LOLP indicates worse performance (more customer risk), and a lower LOLP indicates better performance. Idaho Power’s peak load occurs in a narrow window in the late June/early July timeframe. Figure 11 illustrates the Northwest has a 0 percent LOLP for the June and July months. This indicates that
18 nwcouncil.org/media/7491213/2017-5.pdf

Appendix D—B2H Supplement Idaho Power Company
Page 54 2017 IRP
the Northwest will continue to have sufficient resources available for Idaho Power to purchase and deliver to Idaho Power customers across the B2H line.
Figure 11. 2021–22 LOLP by month (Source: NWPCC northwest analysis)
Evaluating Figure 11 further, the NWPCC information suggests the Northwest region, as a whole, must add resources to address deficiencies in the winter and late summer. Resource additions to address these needs will further increase resource availability in late June/early July. This argument is further stressed in Data Point 3.
Data Point 3: 2016 Pacific Northwest Loads and Resources Study—BPA The Pacific Northwest Loads and Resources Study19, commonly called “The White Book,” is BPA’s annual publication of the federal system and the Pacific Northwest regions loads and resources for the upcoming 10-year period.
Data detailing whether Pacific Northwest resources will be available to purchase post-2025 can be found in the 2016 Pacific Northwest Loads and Resources Technical Appendix, Volume 2,
19 bpa.gov/power/pgp/whitebook/2016/index.shtml
Footnotes continued on the next page.
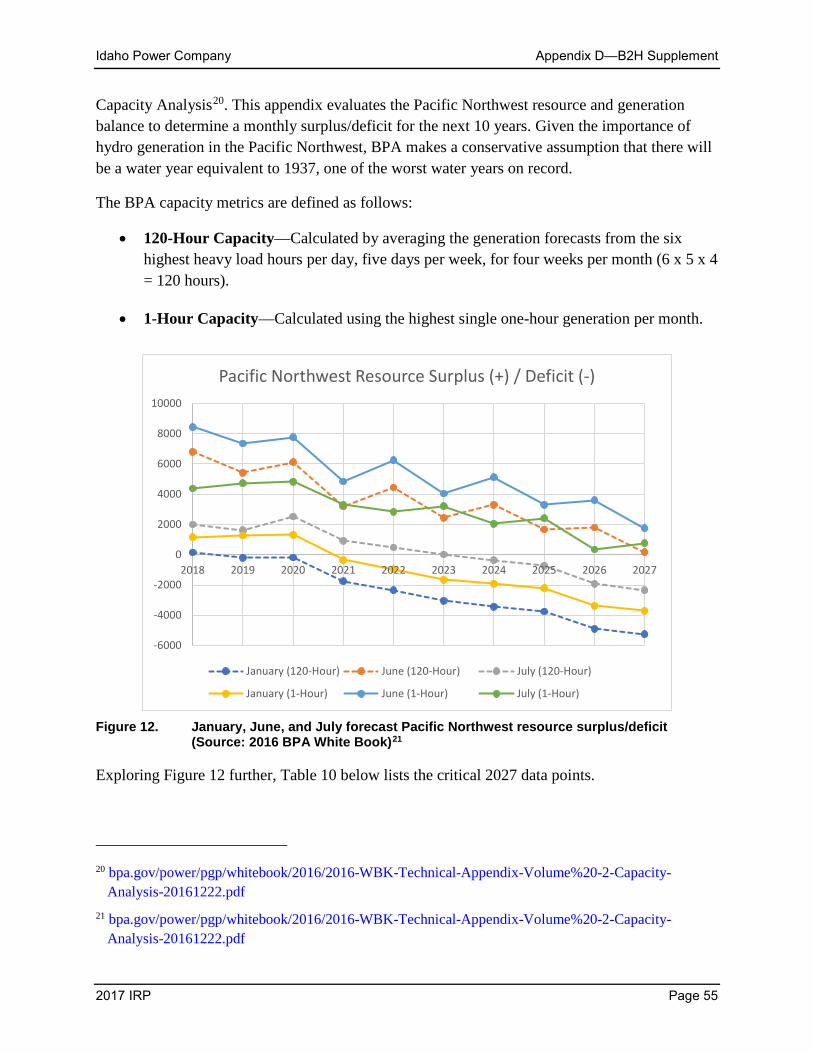
Idaho Power Company Appendix D—B2H Supplement
2017 IRP Page 55
Capacity Analysis20. This appendix evaluates the Pacific Northwest resource and generation balance to determine a monthly surplus/deficit for the next 10 years. Given the importance of hydro generation in the Pacific Northwest, BPA makes a conservative assumption that there will be a water year equivalent to 1937, one of the worst water years on record.
The BPA capacity metrics are defined as follows:
• 120-Hour Capacity—Calculated by averaging the generation forecasts from the six highest heavy load hours per day, five days per week, for four weeks per month (6 x 5 x 4 = 120 hours).
• 1-Hour Capacity—Calculated using the highest single one-hour generation per month.
Figure 12. January, June, and July forecast Pacific Northwest resource surplus/deficit
(Source: 2016 BPA White Book)21
Exploring Figure 12 further, Table 10 below lists the critical 2027 data points.
20 bpa.gov/power/pgp/whitebook/2016/2016-WBK-Technical-Appendix-Volume%20-2-Capacity-
Analysis-20161222.pdf 21 bpa.gov/power/pgp/whitebook/2016/2016-WBK-Technical-Appendix-Volume%20-2-Capacity-
Analysis-20161222.pdf
-6000
-4000
-2000
0
2000
4000
6000
8000
10000
2018 2019 2020 2021 2022 2023 2024 2025 2026 2027
Pacific Northwest Resource Surplus (+) / Deficit (-)
January (120-Hour) June (120-Hour) July (120-Hour)
January (1-Hour) June (1-Hour) July (1-Hour)
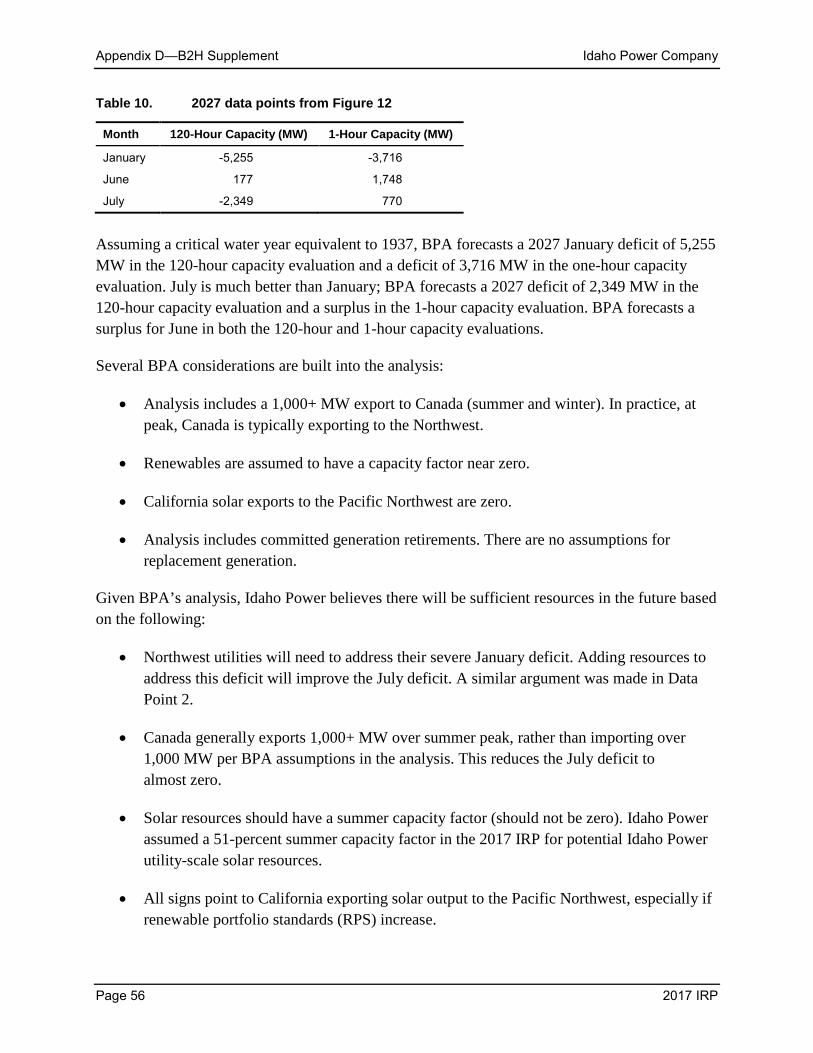
Appendix D—B2H Supplement Idaho Power Company
Page 56 2017 IRP
Table 10. 2027 data points from Figure 12
Month 120-Hour Capacity (MW) 1-Hour Capacity (MW)
January -5,255 -3,716
June 177 1,748
July -2,349 770
Assuming a critical water year equivalent to 1937, BPA forecasts a 2027 January deficit of 5,255 MW in the 120-hour capacity evaluation and a deficit of 3,716 MW in the one-hour capacity evaluation. July is much better than January; BPA forecasts a 2027 deficit of 2,349 MW in the 120-hour capacity evaluation and a surplus in the 1-hour capacity evaluation. BPA forecasts a surplus for June in both the 120-hour and 1-hour capacity evaluations.
Several BPA considerations are built into the analysis:
• Analysis includes a 1,000+ MW export to Canada (summer and winter). In practice, at peak, Canada is typically exporting to the Northwest.
• Renewables are assumed to have a capacity factor near zero.
• California solar exports to the Pacific Northwest are zero.
• Analysis includes committed generation retirements. There are no assumptions for replacement generation.
Given BPA’s analysis, Idaho Power believes there will be sufficient resources in the future based on the following:
• Northwest utilities will need to address their severe January deficit. Adding resources to address this deficit will improve the July deficit. A similar argument was made in Data Point 2.
• Canada generally exports 1,000+ MW over summer peak, rather than importing over 1,000 MW per BPA assumptions in the analysis. This reduces the July deficit to almost zero.
• Solar resources should have a summer capacity factor (should not be zero). Idaho Power assumed a 51-percent summer capacity factor in the 2017 IRP for potential Idaho Power utility-scale solar resources.
• All signs point to California exporting solar output to the Pacific Northwest, especially if renewable portfolio standards (RPS) increase.

Idaho Power Company Appendix D—B2H Supplement
2017 IRP Page 57
The 2016 Pacific Northwest Loads and Resources Study can be found on BPA’s website.
Data Point 4: Northwest and California Renewable Portfolio Standards The adoption of more aggressive RPS goals by states such as Oregon, California, and Washington will drive policy-driven resource additions. The RPS goals will also likely result in the addition of dispatchable flexible ramping resources, such as the recently constructed Port Westward 2 power plant installed by Portland General Electric.
Market Sufficiency and Liquidity Conclusions Based on the analysis summarized above and in the Markets section of this report, Idaho Power believes there will be sufficient resources in the future to source the B2H transmission line. Also, because the market balances supply and demand based on a market clearing price, liquidity risk can be modeled in economic terms. Should demand be greater than supply at the Mid-C energy hub in the future, market hub prices would reflect the scarcity accordingly (higher prices). As discussed in the Market Price Risk section, a sensitivity analysis conducted in the 2017 IRP indicates B2H remains the low-cost resource portfolio over a wide range of market price sensitivities.
Co-Participant Risks Idaho Power, BPA, and PacifiCorp, collectively referred to as co-participants or funders, are fully engaged in permitting activities but have not yet entered into construction and operating agreements. Per the 2012 Joint Funding Agreement, Idaho Power has 60 days following the publication of the BLM ROD to issue a Notice of Completion (Notice), which triggers the commencement of construction negotiations. The funders are allotted two 180-day periods (360 days total), following receipt of the Notice, to negotiate one or more definitive development and construction agreements. The BLM ROD was published on November 17, 2017. Idaho Power, PacifiCorp, and BPA have been in negotiations regarding a possible amendment to the Joint Funding Agreement that would clarify ongoing payment terms, update the milestone schedule, and modify construction agreement triggers and negotiation durations.
The funders may withdraw from the Joint Permitting Agreement at any time and for no reason, and the withdrawing funder(s) shall pay all costs up to the last day of the month of withdrawal. If one or more of these funders does not move forward with construction, withdrawals from the project, all rights, title, and interest will be transferred to the remaining funder(s) such that the remaining funder(s) shall have 100 percent of the permitting interest in the permitting project. The remaining funders may then seek other funder(s) and/or proceed with construction.
Although funder commitments are not a guarantee at this point, Idaho Power believes other parties may have interest in potential ownership in the project should one or more of the funders decide not to move forward with construction. At least one additional party was involved in the
Appendix D—B2H Supplement Idaho Power Company
Page 58 2017 IRP
original negotiations that ultimately lead to the current three-party 2012 Joint Funding Agreement. Additionally, Idaho Power has been approached by at least one entity that may have interest in the B2H project. Any consideration of additional project co-participants would be discussed and agreed on by current funders.
Changes in ownership structure could change cost allocation percentages. Refer to the Capital-Cost Risk section of this appendix for more information about capital-cost risk. For any potential changes in ownership structure, Idaho Power will evaluate the potential ownership cost and capacity allocation, and assuming cost-effective for Idaho Power customers, would request approval from the Oregon and Idaho public utility commissions for any modification in ownership.
Siting Risk Siting any new infrastructure projects comes with siting risk. The BLM ROD, which was released on November 17, 2017, was a significant milestone in the B2H project development and greatly minimized siting risk. It provided the project authorization to cross BLM land and provided the BLM Agency Preferred alternative for the remainder of the route. The USFS and Navy will tier off of the BLM’s analysis to conclude their NEPA processes. The State of Oregon EFSC process is the next major step to ensure siting risk is minimized for privately owned land in Oregon.
Schedule Risk As of the date of this appendix, Idaho Power has schedule scenarios for B2H in-service dates in 2024 or later. At a high level, activities prior to energization are permitting, co-participant agreements, preliminary construction, and material procurement and construction.
The B2H project is currently in the permitting phase of the project. For federal permitting, the B2H project recently achieved the biggest schedule milestone to date with the release of BLM’s ROD on November 17, 2017. The ROD formalized the BLM-led NEPA process and established a BLM Agency Preferred route on public and private property. The USFS ROD and a Navy ROD and easement are the next major federal permitting milestones. At this point, neither the USFS ROD nor Navy ROD are expected to be critical path schedule activities.
For the State of Oregon permitting process, the B2H project also achieved a considerable milestone in summer 2017 with the submittal of the amended Application for Site Certificate to the ODOE. The ODOE is expected to issue a Draft Proposed Order in 2018 and a Final Order and Site Certificate in 2020. The EFSC permitting process is a critical path schedule activity. Schedule risk exists for the EFSC permitting process if the ODOE does not issue a Site Certificate by late 2020.

Idaho Power Company Appendix D—B2H Supplement
2017 IRP Page 59
With the receipt of the BLM ROD and submittal of the amended Application for Site Certificate, which is expected to be deemed complete in the near future, sufficient route certainty exists to begin preliminary construction activities. Assuming co-participant agreements are in place, the current B2H schedule plans to commence preliminary construction activities prior to the receipt of a Site Certificate to achieve an in-service date in the mid-2020s. The B2H co-participants have not formally decided on the contracting method for the project, so the preliminary construction and construction schedule activities remain preliminary until contracts are in place.
Idaho Power believes schedule flexibility exists if the EFSC process is delayed. For instance, certain schedule activities could be condensed by employing more resources or certain activities. Additionally, certain schedule activities could overlap if planned appropriately, such as ROW acquisition and construction.
Currently, Idaho Power believes there is sufficient schedule flexibility to achieve a 2026 in-service date. Idaho Power, BPA, and PacifiCorp plan to negotiate construction agreements in 2018, which should provide additional clarity to the schedule.
Catastrophic Event Risk As detailed in B2H Design section, the B2H transmission line is designed to withstand a variety of extreme weather conditions and catastrophic events. Like most infrastructure, the B2H project is susceptible to direct physical attack. However, unlike some other supply-side resources, B2H adds to the resiliency of the electrical grid by providing additional capacity to transfer energy throughout the region should a physical attack or other catastrophic event occur elsewhere on the system. Additionally, Idaho Power also keeps a supply of emergency transmission towers that can be quickly deployed to replace a damaged tower, allowing the transmission line to be quickly returned to service.
PROJECT ACTIVITIES Schedule Update Permitting The B2H projected achieved a major milestone with the release of the BLM ROD on November 17, 2017. The BLM ROD formalized the conclusion of the siting process and federally required NEPA. The BLM ROD provides the B2H project the ability to site the project on BLM-administered land. The BLM-led NEPA process took nearly 10 years to complete and involved extensive stakeholder input. Refer to the Project History and Route History sections of this report for more information on project history and public involvement. The next steps in the federal permitting process include a USFS ROD and Navy ROD; both are expected in 2018. Both the USFS and Navy will use the BLM’s environmental analysis.
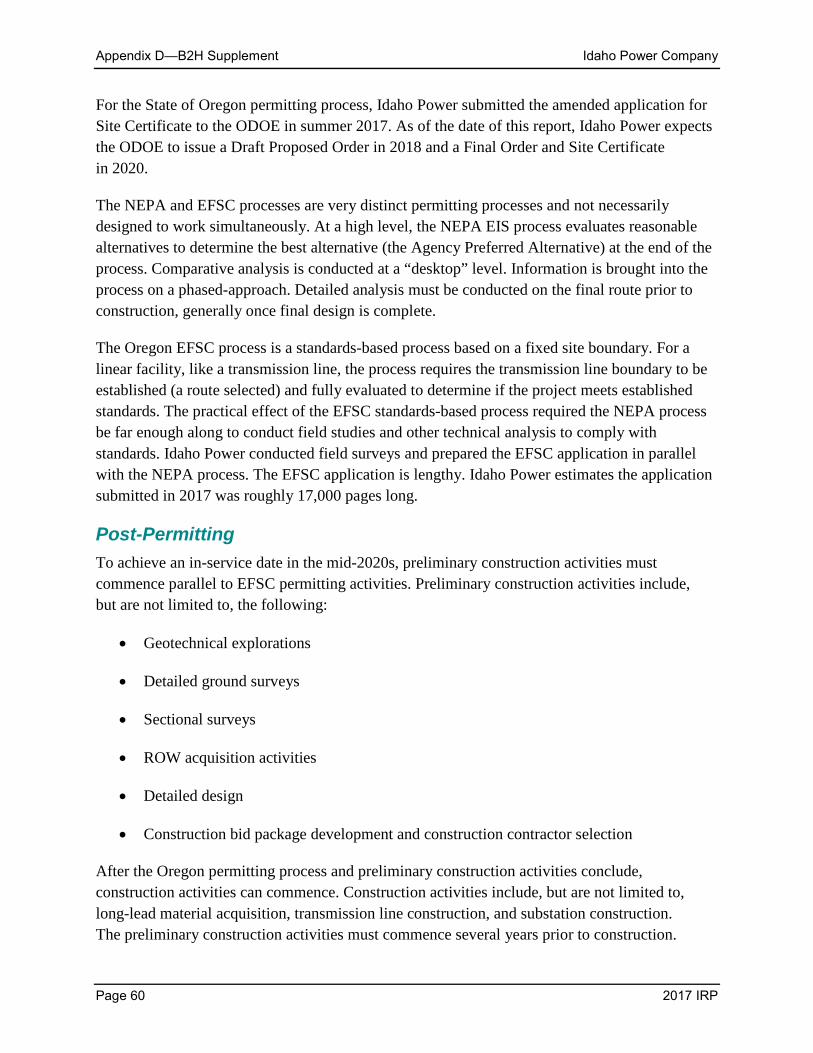
Appendix D—B2H Supplement Idaho Power Company
Page 60 2017 IRP
For the State of Oregon permitting process, Idaho Power submitted the amended application for Site Certificate to the ODOE in summer 2017. As of the date of this report, Idaho Power expects the ODOE to issue a Draft Proposed Order in 2018 and a Final Order and Site Certificate in 2020.
The NEPA and EFSC processes are very distinct permitting processes and not necessarily designed to work simultaneously. At a high level, the NEPA EIS process evaluates reasonable alternatives to determine the best alternative (the Agency Preferred Alternative) at the end of the process. Comparative analysis is conducted at a “desktop” level. Information is brought into the process on a phased-approach. Detailed analysis must be conducted on the final route prior to construction, generally once final design is complete.
The Oregon EFSC process is a standards-based process based on a fixed site boundary. For a linear facility, like a transmission line, the process requires the transmission line boundary to be established (a route selected) and fully evaluated to determine if the project meets established standards. The practical effect of the EFSC standards-based process required the NEPA process be far enough along to conduct field studies and other technical analysis to comply with standards. Idaho Power conducted field surveys and prepared the EFSC application in parallel with the NEPA process. The EFSC application is lengthy. Idaho Power estimates the application submitted in 2017 was roughly 17,000 pages long.
Post-Permitting To achieve an in-service date in the mid-2020s, preliminary construction activities must commence parallel to EFSC permitting activities. Preliminary construction activities include, but are not limited to, the following:
• Geotechnical explorations
• Detailed ground surveys
• Sectional surveys
• ROW acquisition activities
• Detailed design
• Construction bid package development and construction contractor selection
After the Oregon permitting process and preliminary construction activities conclude, construction activities can commence. Construction activities include, but are not limited to, long-lead material acquisition, transmission line construction, and substation construction. The preliminary construction activities must commence several years prior to construction.
Idaho Power Company Appendix D—B2H Supplement
2017 IRP Page 61
The material acquisition and construction activities are expected to take 3 to 4 years. The specific timing of each of the preliminary construction and construction activities will be coordinated with the project co-participants.
CONCLUSIONS This B2H 2017 IRP appendix provides context and details that support evaluating the B2H transmission line project as a supply-side resource, explores (qualitatively and quantitatively) many of the ancillary benefits offered by the transmission line, and considers the risks and benefits of owning a transmission line connected to a market hub in contrast to direct ownership of a traditional generation resource.
As discussed in this report, once operational, B2H will provide Idaho Power increased access to reliable, low-cost market energy purchases from the Pacific Northwest. B2H (including early versions of the project) has been a cost-effective resource identified in each of Idaho Power’s Integrated Resource Plans (IRP) since 2006 and continues to be a cornerstone of Idaho Power’s 2017 IRP preferred resource portfolio. In the 2017 IRP, B2H was identified as the least-cost and least-risk resource to serve peak-hour load to resource deficits that are forecast to occur beginning in 2026. When compared to other individual resource options, B2H is also the least-cost option in terms of both capacity cost and energy cost. B2H is expected to have a capacity cost that is 71 percent lower than either a combined-cycle gas plant or utility-scale solar alternatives.22 B2H is also expected to have a levelized cost of energy that is 22 percent lower than a combined-cycle gas plant and 38 percent lower than utility-scale solar.23
B2H project brings additional benefits beyond cost-effectiveness. The B2H project will increase the efficiency, reliability, and resiliency of the electric system by creating an additional pathway for energy to move between major load centers in the West. The B2H project also provides the flexibility to integrate any resource type and move existing resources during times of congestion, benefiting customers throughout the region. Idaho Power believes B2H provides value to the system beyond any individual resource because it enhances the flexibility of the existing system and facilitates the delivery of cost-effective resources not only to Idaho Power customers, but also to customers throughout the Pacific Northwest and Mountain West regions.
The company must demonstrate a need for the project before EFSC will issue a Site Certificate authorizing the construction of a transmission line. The need demonstration can be met through a commission acknowledgement of the resource in the company’s IRP.24 In this case, Idaho Power
22 2017 IRP, Page 87, Figure 7.5. 23 2017 IRP, Page 89, Figure 7.6. 24 OAR 345-023-0020(2).

Appendix D—B2H Supplement Idaho Power Company
Page 62 2017 IRP
seeks to satisfy EFSC’s least-cost plan rule’s requirement through an acknowledgement of its 2017 IRP.

Idaho Power Company Appendix D—B2H Supplement
2017 IRP Page 63
Appendix D-1. Transmission line alternatives to the proposed B2H 500-kV transmission line
Table D-1 Comparison of Transmission Line Capacity Scenarios—New Lines from Longhorn to Hemingway
Scenario Line
Capacity1 Potential Path 14
West-East Increase2 Losses on
New Circuit(s)3
a. Longhorn to Hemingway 230 kV single circuit 956 MW 525 MW 10.8%
b. Longhorn to Hemingway 230 kV double circuit 1,912 MW 915 MW 9.5%
c. Longhorn to Hemingway 345 kV single circuit 1,434 MW 730 MW 6.6%
d. Longhorn to Hemingway 500 kV single circuit 3,214 MW 1,050 MW 4.2%
e. Longhorn to Hemingway 500 kV—two separate lines 6,428 MW 2,215 MW 3.7%
f. Longhorn to Hemingway 500 kV double circuit 6,428 MW 1,235 MW 2.9%
g. Longhorn to Hemingway 765 kV single circuit 4,770 MW 1,200 MW 2.4% 1 Line Capacity is the thermal rating of the assumed conductors and does not account for system limitations of voltage, stability, or
reliability requirements. 2 Potential Rating is based upon study results to date to meet reliability design requirements for the WECC ratings processes, not
including simultaneous interaction studies. 3 Estimated Losses are percent losses for the new line at the Potential Rating loading level. Annual energy losses are dependent
on total system loss reductions. All of the scenarios would likely yield a total system loss reduction for the flow levels above. Table D-2 Comparison of Transmission Line Capacity Scenarios – Rebuild Existing Lines to the Northwest
Scenario Line Capacity1 Potential Path 14 Increase2
Losses on New Circuit(s)3
Length of Line/ New ROW4
h. Replace Oxbow-Lolo 230 kV with Hatwai - Hemingway 500 kV
3,214 MW 430 MW W-E
675 MW E-W
3.8% 255 Miles/136 Miles
i. Replace Oxbow-Lolo 230 kV with Hatwai - Hemingway 500 kV - No double circuiting with existing lines
3,214 MW 710 MW W-E
745 MW E-W
4.1% 255 Miles/167 Miles
j. Replace Walla Walla to Brownlee 230 kV with Sacajawea Tap- Hemingway 500 kV
3,214 MW 400 MW W-E
675 MW E-W
3.5% 288 Miles/150 Miles
k. Replace Walla Walla to Pallette 230 kV with Sacajawea Tap- Hemingway 500 kV - No double circuiting with existing lines
3,214 MW 720 MW W-E
730 MW E-W
3.8% 288 Miles/181 Miles
l. Build double circuit 500 kV/230 kV line from McNary to Quartz. Build 500kV from Quartz to Hemingway.
3,214 MW 765 MW W-E
870 MW E-W
3.9% 298 Miles/168 Miles
1 Line Capacity is the thermal rating of the assumed conductors and does not account for system limitations of voltage, stability, or reliability requirements.
2 Potential Rating is based upon study results to date to meet reliability design requirements for the WECC ratings processes, not including simultaneous interaction studies.
3 Estimated Losses are percent losses for the new line at the Potential Rating west-east loading level. Annual energy losses are dependent on total system loss reductions. All of the scenarios would likely yield a total system loss reduction for the flow levels above.
4 In addition to utilizing existing 230 kV right-of-way (“ROW”), each of the scenarios above will require new ROW to be obtained.

Appendix D—B2H Supplement Idaho Power Company
Page 64 2017 IRP
This page left blank intentionally.
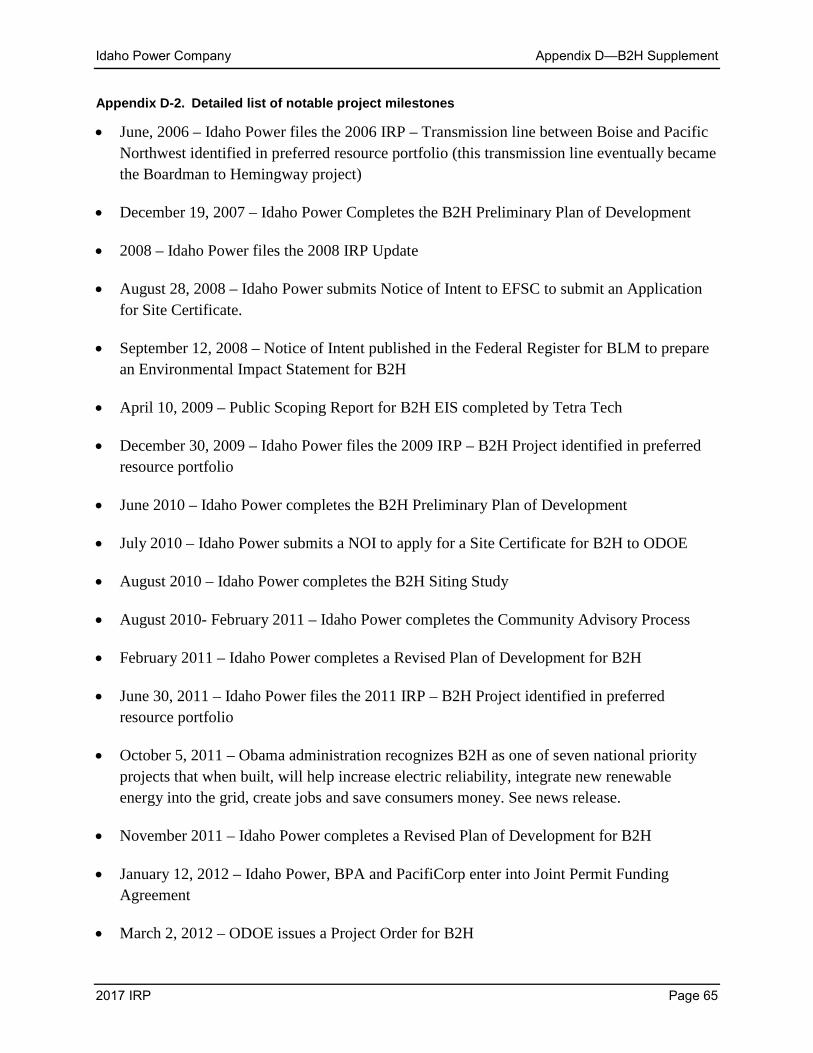
Idaho Power Company Appendix D—B2H Supplement
2017 IRP Page 65
Appendix D-2. Detailed list of notable project milestones
• June, 2006 – Idaho Power files the 2006 IRP – Transmission line between Boise and Pacific Northwest identified in preferred resource portfolio (this transmission line eventually became the Boardman to Hemingway project)
• December 19, 2007 – Idaho Power Completes the B2H Preliminary Plan of Development
• 2008 – Idaho Power files the 2008 IRP Update
• August 28, 2008 – Idaho Power submits Notice of Intent to EFSC to submit an Application for Site Certificate.
• September 12, 2008 – Notice of Intent published in the Federal Register for BLM to prepare an Environmental Impact Statement for B2H
• April 10, 2009 – Public Scoping Report for B2H EIS completed by Tetra Tech
• December 30, 2009 – Idaho Power files the 2009 IRP – B2H Project identified in preferred resource portfolio
• June 2010 – Idaho Power completes the B2H Preliminary Plan of Development
• July 2010 – Idaho Power submits a NOI to apply for a Site Certificate for B2H to ODOE
• August 2010 – Idaho Power completes the B2H Siting Study
• August 2010- February 2011 – Idaho Power completes the Community Advisory Process
• February 2011 – Idaho Power completes a Revised Plan of Development for B2H
• June 30, 2011 – Idaho Power files the 2011 IRP – B2H Project identified in preferred resource portfolio
• October 5, 2011 – Obama administration recognizes B2H as one of seven national priority projects that when built, will help increase electric reliability, integrate new renewable energy into the grid, create jobs and save consumers money. See news release.
• November 2011 – Idaho Power completes a Revised Plan of Development for B2H
• January 12, 2012 – Idaho Power, BPA and PacifiCorp enter into Joint Permit Funding Agreement
• March 2, 2012 – ODOE issues a Project Order for B2H

Appendix D—B2H Supplement Idaho Power Company
Page 66 2017 IRP
• June 2012 – Idaho Power completes a Supplemental Siting Study for B2H
• October 2, 2012 – BPA identifies B2H as the best option for meeting load growth in southeastern Idaho
• November 27, 2012 – Idaho Power receives formal capacity rating from Western Electricity Coordinating Council (WECC)
• February 28, 2013 – Idaho Power submits Preliminary Application for Site Certificate to Oregon Department of Energy
• June 28, 2013 – Idaho Power files the 2013 IRP
• December 19, 2014 – Draft EIS and Land-use Plan Amendments Published in Federal Register
• December 22, 2014 – ODOE issues amended Project Order for B2H
• June 22, 2015 – Idaho Power submits easement application to Navy to site on Naval Weapons System Training Facility Boardman (aka “Bombing Range”)
• June 30, 2015 – Idaho Power files the 2015 IRP – B2H Project identified in the preferred resource portfolio
• November 25, 2016 – BLM issues the Final EIS for B2H
• November 18, 2016 – Idaho Power submits revised application to Navy, updating the route on Navy property based on collaborative routing solution
• January 20, 2017 – Donald Trump inaugurated as 45th President of the United State
• June 29, 2017 – Idaho Power submits electronic version of Amended Preliminary Application for Site Certification to ODOE
• June 30, 2017 – Idaho Power files the 2017 Integrated Resource Plan (IRP) – B2H Project identified in the preferred resource portfolio
• July 19, 2017 – Idaho Power submits hard copies of Amended Preliminary Application for Site Certification to ODOE.
• November 17, 2017 – BLM issues a Record of Decision (ROD) for the B2H. The Record of Decision was signed by the Assistant Secretary of Lands and Minerals, U.S. Department of Interior.

Idaho Power Company Appendix D—B2H Supplement
2017 IRP Page 67
Appendix D-3. B2H funding agreement
See the attached document.

Appendix D—B2H Supplement Idaho Power Company
Page 68 2017 IRP
This page left blank intentionally.


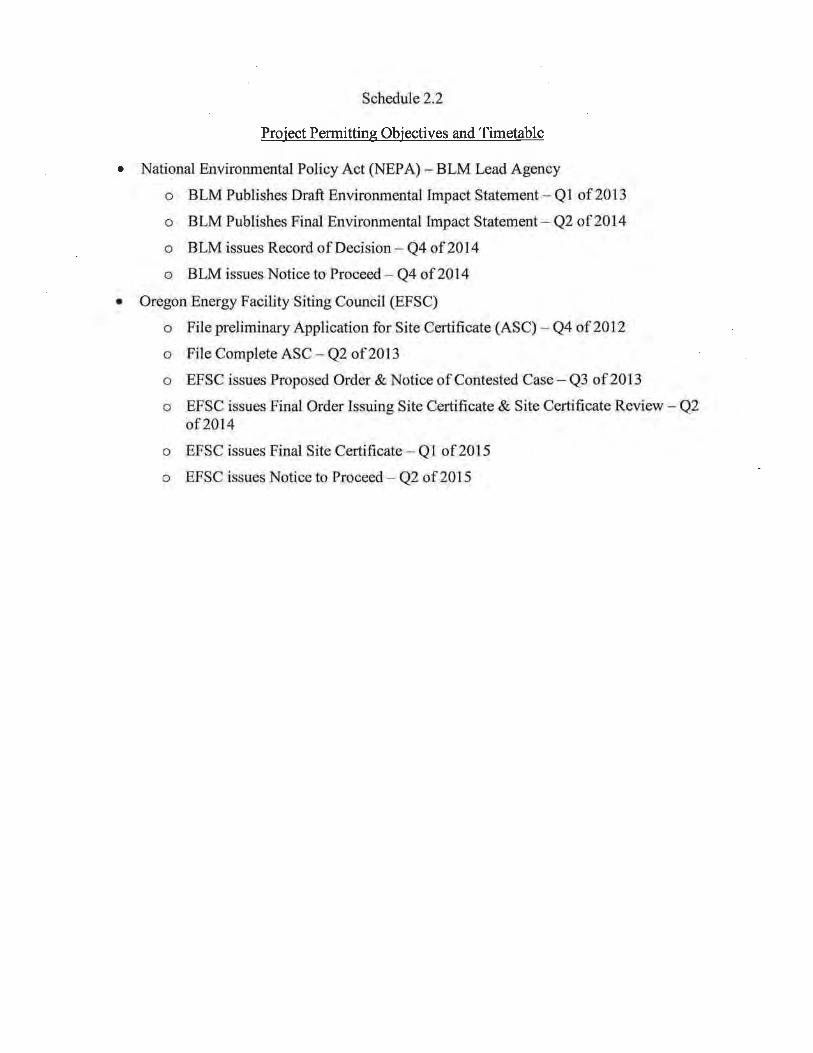

Idaho Power Company Appendix D—B2H Supplement
2017 IRP Page 117
Appendix D-4. B2H MOU
See the attached document.

Appendix D—B2H Supplement Idaho Power Company
Page 118 2017 IRP
This page left blank intentionally.


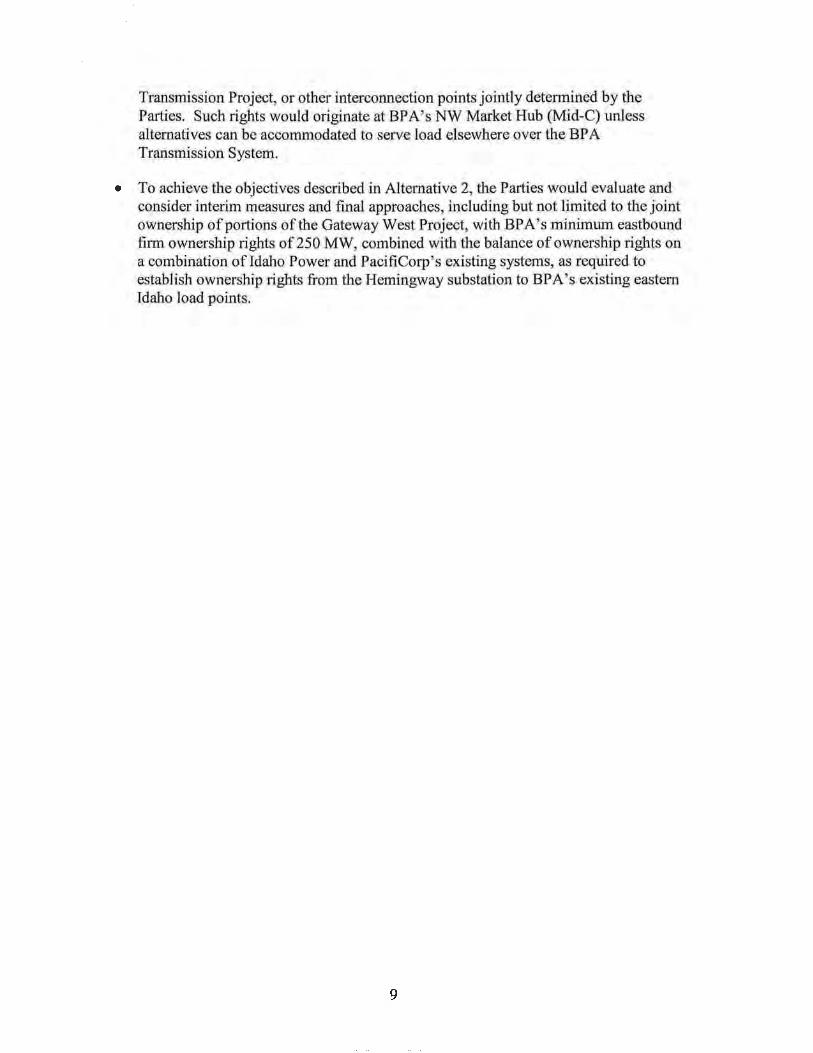

Appendix D—B2H Supplement Idaho Power Company
Page 130 2017 IRP
This page left blank intentionally.

Idaho Power Company Appendix D—B2H Supplement
2017 IRP Page 131
Appendix D-5. NTTG studies
See the attached document.

Appendix D—B2H Supplement Idaho Power Company
Page 132 2017 IRP
This page left blank intentionally.

NTTG 2016-2017 Revised Draft Final Regional Transmission Plan Version 3.2
1
NTTG 2016-2017
REVISED DRAFT FINAL
REGIONAL TRANSMISSION PLAN
Draft 09.01.17
Note: this is a draft report and may change as a
result of stakeholder comments or edits by NTTG
Date, 2017

NTTG 2016-2017 Revised Draft Final Regional Transmission Plan NTTG Steering Committee Approval: MM, DD, 2017
2
Executive Summary ......................................................................................................................... 3
The Northern Tier Transmission Group ............................................................................................ 4
Participating Utilities ................................................................................................................................ 6
Purpose of the Plan ......................................................................................................................... 6
Plan Development Process............................................................................................................... 6
Biennial Cycle ........................................................................................................................................... 7
Biennial Study Plan................................................................................................................................... 7
Study Methodology .................................................................................................................................. 8
Production-Cost Modeling ............................................................................................................................... 9
Power-Flow Cases ............................................................................................................................................ 9
Data Submission .................................................................................................................................... 10
Forecasted Loads Transmission Projects ....................................................................................................... 11
Public Policy Consideration Scenario Requests ........................................................................................ 13
Regional Economic Study Requests ......................................................................................................... 13
Initial Regional Transmission Plan Development ..................................................................................... 13
Interregional Project Coordination .......................................................................................................... 15
Stress-conditioned Case Study Results .................................................................................................... 17
Stressed Hours for Study with Production-Cost Modeling ............................................................................ 17
Development of Change Cases ................................................................................................................ 20
Change Case Results ............................................................................................................................... 20
High Southern Idaho Import Case .................................................................................................................. 23
High Southern Idaho Export Case .................................................................................................................. 23
High Wyoming Wind Case .............................................................................................................................. 24
Interregional Transmission Projects .............................................................................................................. 24
Reliability Conclusions ............................................................................................................................ 24
Economic Evaluations ............................................................................................................................. 25
Capital-related Cost Metric ............................................................................................................................ 25
Energy-loss Metric ......................................................................................................................................... 25
Reserve Metric ............................................................................................................................................... 25
Economic Metric Analysis Conclusion ............................................................................................................ 26
Planning Process Flow Map (Coming) ...................................................................................................... 27
Final Regional Transmission Plan ............................................................................................................ 27
Cost Allocation ....................................................................................................................................... 28
Next Steps.............................................................................................................................................. 28
NTTG 2016-2017 Regional Transmission Plan Supporting Materials ......................................................... 29
Glossary ................................................................................................................................................. 29
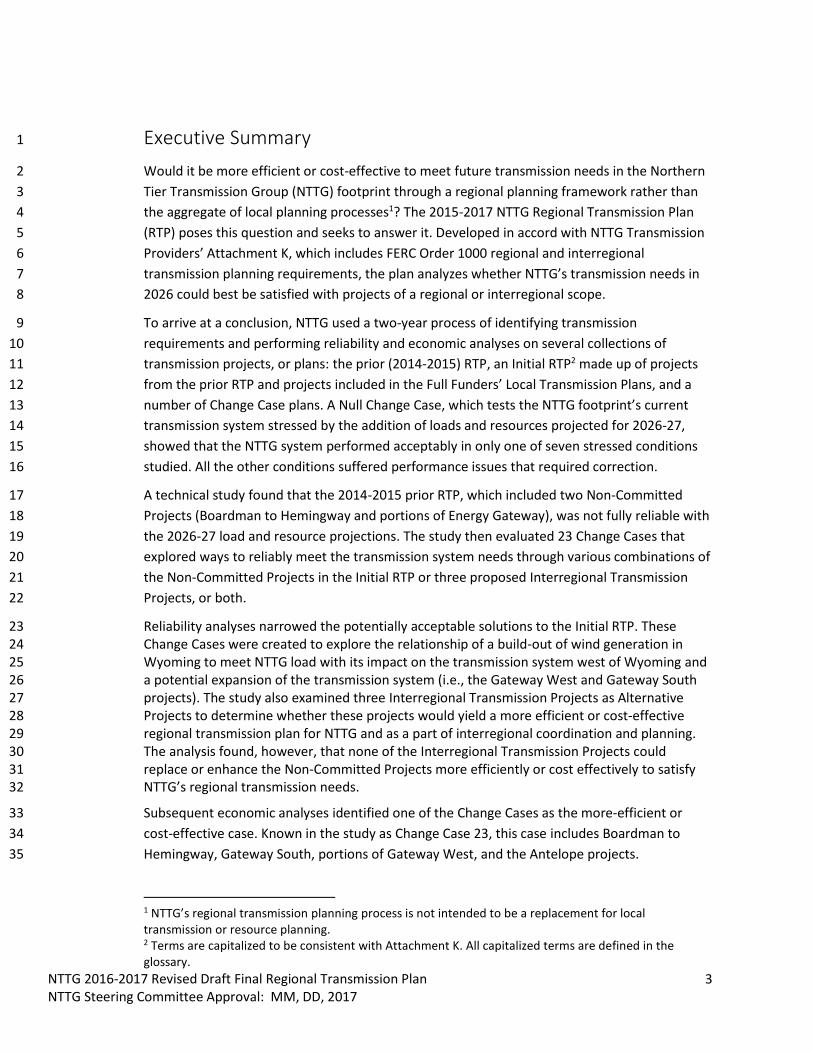
NTTG 2016-2017 Revised Draft Final Regional Transmission Plan NTTG Steering Committee Approval: MM, DD, 2017
3
Executive Summary 1
Would it be more efficient or cost-effective to meet future transmission needs in the Northern 2
Tier Transmission Group (NTTG) footprint through a regional planning framework rather than 3
the aggregate of local planning processes1? The 2015-2017 NTTG Regional Transmission Plan 4
(RTP) poses this question and seeks to answer it. Developed in accord with NTTG Transmission 5
Providers’ Attachment K, which includes FERC Order 1000 regional and interregional 6
transmission planning requirements, the plan analyzes whether NTTG’s transmission needs in 7
2026 could best be satisfied with projects of a regional or interregional scope. 8
To arrive at a conclusion, NTTG used a two-year process of identifying transmission 9
requirements and performing reliability and economic analyses on several collections of 10
transmission projects, or plans: the prior (2014-2015) RTP, an Initial RTP2 made up of projects 11
from the prior RTP and projects included in the Full Funders’ Local Transmission Plans, and a 12
number of Change Case plans. A Null Change Case, which tests the NTTG footprint’s current 13
transmission system stressed by the addition of loads and resources projected for 2026-27, 14
showed that the NTTG system performed acceptably in only one of seven stressed conditions 15
studied. All the other conditions suffered performance issues that required correction. 16
A technical study found that the 2014-2015 prior RTP, which included two Non-Committed 17
Projects (Boardman to Hemingway and portions of Energy Gateway), was not fully reliable with 18
the 2026-27 load and resource projections. The study then evaluated 23 Change Cases that 19
explored ways to reliably meet the transmission system needs through various combinations of 20
the Non-Committed Projects in the Initial RTP or three proposed Interregional Transmission 21
Projects, or both. 22
Reliability analyses narrowed the potentially acceptable solutions to the Initial RTP. These 23 Change Cases were created to explore the relationship of a build-out of wind generation in 24 Wyoming to meet NTTG load with its impact on the transmission system west of Wyoming and 25 a potential expansion of the transmission system (i.e., the Gateway West and Gateway South 26 projects). The study also examined three Interregional Transmission Projects as Alternative 27 Projects to determine whether these projects would yield a more efficient or cost-effective 28 regional transmission plan for NTTG and as a part of interregional coordination and planning. 29 The analysis found, however, that none of the Interregional Transmission Projects could 30 replace or enhance the Non-Committed Projects more efficiently or cost effectively to satisfy 31 NTTG’s regional transmission needs. 32
Subsequent economic analyses identified one of the Change Cases as the more-efficient or 33
cost-effective case. Known in the study as Change Case 23, this case includes Boardman to 34
Hemingway, Gateway South, portions of Gateway West, and the Antelope projects. 35
1 NTTG’s regional transmission planning process is not intended to be a replacement for local transmission or resource planning. 2 Terms are capitalized to be consistent with Attachment K. All capitalized terms are defined in the glossary.

NTTG 2016-2017 Revised Draft Final Regional Transmission Plan Version 3.2
4
Stakeholder input on the RTP was accepted and evaluated throughout the biennial planning 36 cycle. NTTG posted the Draft RTP in December 2016 (Quarter 4) for stakeholder comment and 37 the Draft Final RTP in Quarter 6 for public comment. The Planning Committee will vote to 38 recommend submittal of the RTP to the NTTG Steering Committee in Quarter 7. Steering 39 Committee approval of the RTP will be requested in Quarter 8. 40
41
42
The Northern Tier Transmission Group 43
The Northern Tier Transmission Group (NTTG) was formed in 2007 to promote effective 44
planning and use of the multi-state electric transmission system within the Northern Tier 45
footprint. NTTG provides a forum where all interested stakeholders, including transmission 46
providers, customers and state regulators, can participate in planning, coordinating and 47
implementing a robust transmission system. 48
NTTG fulfills requirements of the Federal Energy Regulatory Commission (FERC) Order 1000 for 49
each public utility transmission provider to participate in a regional transmission planning 50
process that produces a regional transmission plan and, if appropriate, includes a regional cost-51
allocation method. 52
NTTG evaluates transmission projects that move power across the regional bulk electric 53
transmission system, serving load in its footprint and delivering electricity to external markets. 54
The transmission providers belonging to Northern Tier serve more than 4 million retail 55

NTTG 2016-2017 Revised Draft Final Regional Transmission Plan Version 3.2
5
customers with more than 29,000 miles of high-voltage transmission lines. These 56
57
58
59
60
members provide service across much of Utah, Wyoming, Montana, Idaho and Oregon, and 61
parts of Washington and California. 62
Figure 1. Map of western North America showing NTTG members' transmission lines.

NTTG 2016-2017 Revised Draft Final Regional Transmission Plan Version 3.2
6
NTTG works with other entities—the Western Electricity Coordinating Council (WECC) for 63
reliability planning and neighboring Planning Regions (e.g., ColumbiaGrid, WestConnect and 64
California Independent System Operator (CAISO)) for interregional project coordination. 65
Participating Utilities 66
Deseret Power Electric Cooperative 67 Idaho Power 68 Montana Alberta Tie Ltd. (MATL) 69 NorthWestern Energy 70 PacifiCorp 71 Portland General Electric 72 Utah Associated Municipal Power Systems (UAMPS) 73
Purpose of the Plan 74
The NTTG Regional Transmission Plan (RTP) aims to produce, if possible, a more efficient or 75
cost-effective regional plan to transmit energy compared with a plan that rolls up the local 76
Transmission Providers’ transmission plans and other Change Case transmission plans studied. 77
This study process complies with FERC Order No. 1000, Attachment K—Regional Planning 78
Process. This planning cycle marks the first time that NTTG implemented FERC Order 1000 79
interregional project coordination with the other western regional transmission planning 80
organizations. 81
Plan Development Process 82
The Regional Transmission Plan is developed through a two-year process: 83
1) Identification of the transmission requirement for the NTTG footprint, derived from the data 84
submissions 85
2) Reliability analysis and evaluation of the Initial RTP and Alternative Projects (including 86
interregional projects) through Change Cases 87
3) Economic analysis and evaluation comparing the annualized incremental costs of the Initial 88
RTP and the two most-efficient Change Cases 89
4) Selection of the project or projects that yield a regional transmission plan that is more 90
efficient or cost-effective than the other regional transmission plans studied 91
5) Any projects that were submitted for the purposes of cost allocation and selected into the 92
RTP will go through the cost allocation process if they are deemed to be eligible for cost 93
allocation. 94

NTTG 2016-2017 Revised Draft Final Regional Transmission Plan Version 3.2
7
Biennial Cycle 95
NTTG follows a two-year, eight-quarter planning cycle to produce the 10-year Regional 96
Transmission Plan. In the first step, the Planning and Cost Allocation Committees pre-qualify3 97
Transmission Developers who properly submit their transmission project to be considered for 98
regional cost allocation (should the sponsor’s project be selected in the Regional Transmission 99
Plan for cost allocation). The biennial cycle includes steps to collect, evaluate and analyze 100
transmission and non-transmission data, produce and publish a draft plan, gather stakeholder 101
and public input, update the plan and complete the cycle with the publishing of a RTP. 102
103 Figure 2. NTTG uses an eight-quarter biennial planning cycle. 104
105
Biennial Study Plan 106
The Biennial Study Plan outlines the process that NTTG follows to develop its 10-year RTP. It 107
provides the framework to guide plan development. It also describes NTTG’s process to 108
determine if a properly submitted Interregional Transmission Project (ITP) would yield a 109
transmission plan that is a more cost-effective or efficient solution to NTTG’s regional 110
transmission needs. 111
The NTTG Planning Committee manages the study plan. The Planning Committee establishes 112
the Technical Work Group (TWG) subcommittee to develop the study plan. The TWG also 113
performs the necessary technical evaluations for the RTP and assesses any projects, including 114
ITPs, submitted to NTTG. TWG members are NTTG Planning Committee members or their 115
3 A project sponsor must have their project pre-qualified before the beginning of the 2016-2017 biennial planning cycle (i.e., the last quarter of the prior planning cycle) pursuant to Attachment K, Section Pre-Qualification for Cost Allocation.

NTTG 2016-2017 Revised Draft Final Regional Transmission Plan Version 3.2
8
designated technical representatives. They have access to and expertise in power-flow analysis 116
for power systems or production-cost modeling, or both. 117
Developed during Quarter 2 of the biennial planning cycle, the study plan establishes the: 118
Study methodology and criteria 119
Study assumptions based on the loads, resources, point-to-point transmission requests, 120
desired flows, constraints and other technical data submitted in Quarter 1 and updated 121
in Quarter 5 of the regional planning cycle 122
Software analysis tools 123
2026 production-cost-model database and hours to be selected for reliability analysis 124
Evaluation criteria for reliability and transmission service obligations 125
Capital cost, energy losses and reserve-sharing metric calculations 126
Public policy requirements and considerations 127
The study plan was posted for stakeholder comment, recommended for approval by the 128
Planning Committee and approved by the Steering Committee during Quarter 2 of the biennial 129
cycle. Due to data submission changes provided in Quarter 5, the study plan was revised in 130
Quarter 6. Any differences between what is stated in the study plan and the process stated in 131
Attachment K of the NTTG FERC Order 1000 defer to Attachment K. 132
Study Methodology 133
To determine the more efficient or cost-effective transmission plan, the TWG subcommittee 134
conducted reliability and economic studies in accordance with the 2016-2017 Study Plan. The 135
Study Plan and ultimately the RTP reflect the Full Funder’s Attachment K requirements to 136
satisfy its transmission needs. NTTG’s regional transmission planning does not investigate local 137
transmission planning or generation decisions related to integrated resource planning. Rather, 138
NTTG’s methodology uses a regional perspective to question the Initial RTP’s roll-up of Non-139
Committed regional transmission project(s) to identify, if possible, a regional transmission plan 140
that is more efficient or cost effective than the aggregated Full Funder’s transmission plans. In 141
conducting its regional studies, NTTG uses regional transmission and non-transmission 142
alternatives (if any) to honor the local transmission needs. As part of the study, NTTG assumed 143
that the local existing and new generation additions have (or will have) firm transmission rights 144
to move their power from the generator to load. NTTG’s reliability studies did not re-dispatch 145
existing generation down to relieve congestion such that the new generation additions could 146
move their power to load without potentially creating congestion. 147
The reliability studies used production-cost modeling and power-flow studies. The production-148
cost and power-flow models represent data for the western interconnection load, resource and 149
transmission topology. In developing the data for these two models, NTTG started with a WECC 150
production cost model (version TEPPC CC1.3) and WECC power-flow model (version 25hs1a) 151
and modified the modeling data in NTTG’s footprint for its regional studies. For the studies 152
including one or more interregional transmission project that relied on increased wind 153

NTTG 2016-2017 Revised Draft Final Regional Transmission Plan Version 3.2
9
generation within NTTG’s footprint (e.g., adding new wind resource in Wyoming), NTTG 154
adjusted generation levels down in the region receiving the power. The goal of the adjustments 155
was to ensure western interconnection load and resource balance. NTTG consulted with the 156
planning region receiving the power (i.e., California ISO) for their generation reductions. 157
The results of the production-cost modeling were used to identify seven hours of high stress on 158
the transmission system. These seven hours were then subjected to reliability analysis using a 159
power-flow model. The input and output data for these selected hours were transferred from 160
the production-cost model (i.e., GridView) to a power-flow model (i.e., PowerWorld) to 161
perform the technical reliability analysis. By taking these steps, a consistent set of analysis tools 162
can be engaged to evaluate the reliability performance. 163
Next, economic studies employed the Attachment K’s three metrics—capital-related costs, 164
energy losses, and reserves—to analyze Change Case plans that were deemed reliable to 165
further determine the cost effectiveness of the NTTG transmission plan. 166
Production-Cost Modeling 167
The TWG examined 8,760 hours of data using GridView4 production-cost software to establish 168
stressed conditions within the NTTG footprint. To set the stressed conditions, TWG used and 169
modified a dataset from the Transmission Expansion Planning Policy Committee (TEPPC) of the 170
Western Electricity Coordinating Council (WECC). The TEPPC case included a representation of 171
the load, generation and transmission topology of the WECC interconnection-wide 172
transmission system 10 years into the future. 173
The study plan identified seven stressed conditions that affect the NTTG area for study. After all 174
hours of data were run through the GridView production-cost program, the results were 175
analyzed and the hours representative of the seven stressed conditions were identified. For a 176
more detailed discussion of the conditions and hours, see the section on stress-conditioned 177
case study results. 178
Power-Flow Cases 179
For the next step in the process, the TWG used PowerWorld5 simulation software to convert 180
the production-cost model for the seven stressed hours into power-flow cases. Each of the 181
stressed cases was then reviewed by the TWG to ensure that the case met steady-state system 182
performance criteria (no voltage issues or thermal overloads). Bubble diagrams showing the 183
inter-area flows for each of the stressed cases are included in the Draft Final RTP, available on 184
the NTTG website. 185
4 GridView is a registered ABB product 5 PowerWorld is a registered trademark of PowerWorld Corp.

NTTG 2016-2017 Revised Draft Final Regional Transmission Plan Version 3.2
10
186
Data Submission 187
Information flows in to NTTG during quarters 1 and 5 of the biennial cycle. Transmission 188
Providers and stakeholders may supply data on forecasted firm energy obligations and 189
commitments required to support the transmission system within the NTTG footprint. The data 190
may include load forecasts, resources, transmission topology, transmission service and public 191
policy requirements submissions. Regional transmission projects submitted in Quarter 1 are 192
shown in Table LMJ and include those from the prior Regional Transmission Plan, Full Funder 193
Local Transmission Plans (LTP), Sponsored Projects, unsponsored projects and Merchant 194
Transmission Developer projects. No projects that were eligible for cost allocation were 195
submitted into NTTG’s 2016-17 regional planning process. 196
JANUARY 2016 DATA SUBMITTAL – TRANSMISSION ADDITIONS BY 2026 197
Sponsor From To Voltage
Cir
cuit
Type
Re
gio
nal
ly
Sign
ific
ant6
Co
mm
itte
d
Projects
Deseret G&T
Bonanza Upalco 138 kV 2 LTP No No New Line
Idaho Power
Hemingway Boardman/ Longhorn
500 kV 1 LTP & pRTP Yes No B2H Project
Hemingway Bowmont 230 kV 2 LTP Yes No New Line (associated with Boardman to Hemingway)
Bowmont Hubbard 230 kV 1 LTP Yes No New Line (associated with Boardman to Hemingway)
Cedar Hill Hemingway 500 kV 1 LTP Yes No Gateway West Segment #9 (joint with PacifiCorp East)
Cedar Hill Midpoint 500 kV 1 LTP Yes No Gateway West Segment #10
Midpoint Borah 500 kV 1 LTP Yes No (convert existing from 345 kV operation)
King Wood River 138 kV 1 LTP No No Line Reconductor
Willis Star 138 kV 1 LTP No No New Line
Enbridge SE Alberta DC 1 LTP Yes No MATL 600 MW Back to Back DC Converter
PacifiCorp East
Aeolus Clover 500 kV 1 LTP & pRTP Yes No Gateway South Project – Segment #2
Aeolus Anticline 500 kV 1 LTP & pRTP Yes No Gateway West Segments 2&3
Anticline Jim Bridger 500 kV 1 LTP & pRTP Yes No 345/500 kV Tie
Anticline Populus 500 kV 1 LTP & pRTP Yes No Gateway West Segment #4
Populus Borah 500 kV 1 LTP Yes No Gateway West Segment #5
Populus Cedar Hill 500 kV 1 LTP Yes No Gateway West Segment #7
Antelope Goshen 345 kV 1 LTP Yes No Nuclear Resource Integration
Antelope Borah 345 kV 1 LTP Yes No Nuclear Resource Integration
Windstar Aeolus 230 kV 1 LTP & pRTP Yes No Gateway West Segment #1W
Oquirrh Terminal 345 kV 2 LTP Yes Yes Gateway Central
6 Regionally significant transmission projects are generally those that effect transfer capability between areas of NTTG. Projects that are mainly for local load service are not regionally significant. Projects that are not regionally significant will be placed into all change cases and not tested for impact on the Regional Transmission Plan. The future facilities submitted in the LTP’s will be removed in the Null Case
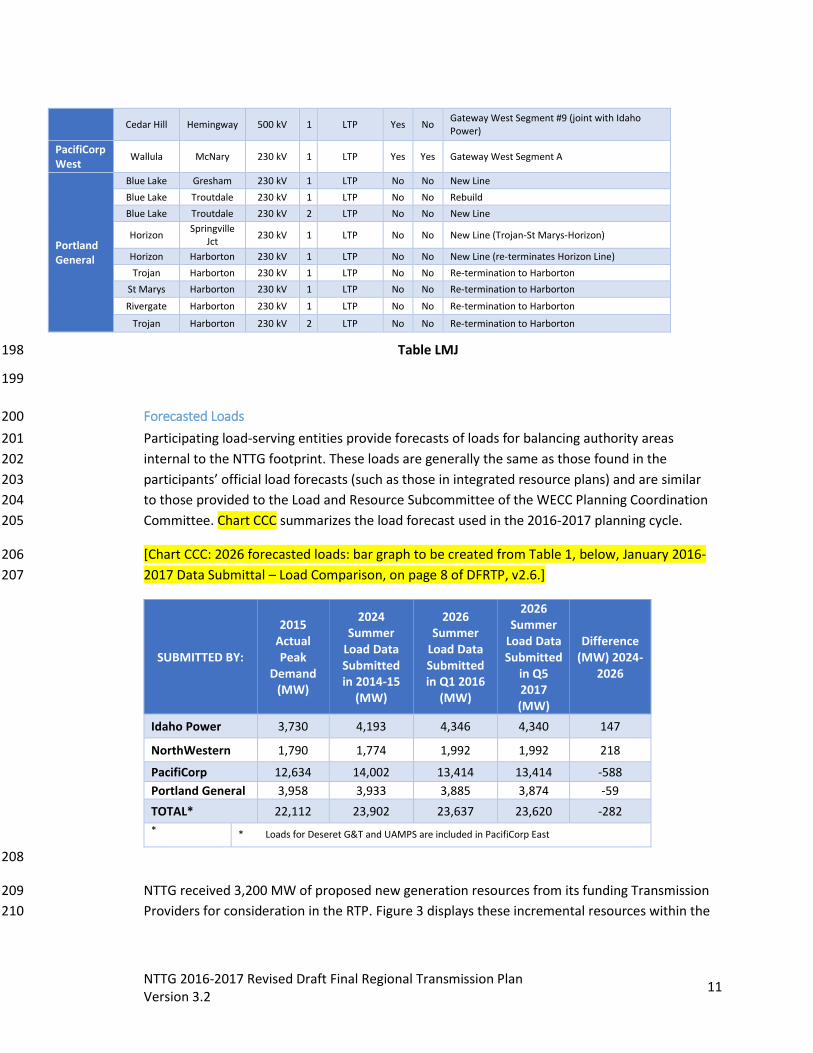
NTTG 2016-2017 Revised Draft Final Regional Transmission Plan Version 3.2
11
Cedar Hill Hemingway 500 kV 1 LTP Yes No Gateway West Segment #9 (joint with Idaho Power)
PacifiCorp West
Wallula McNary 230 kV 1 LTP Yes Yes Gateway West Segment A
Portland General
Blue Lake Gresham 230 kV 1 LTP No No New Line
Blue Lake Troutdale 230 kV 1 LTP No No Rebuild
Blue Lake Troutdale 230 kV 2 LTP No No New Line
Horizon Springville
Jct 230 kV 1 LTP No No New Line (Trojan-St Marys-Horizon)
Horizon Harborton 230 kV 1 LTP No No New Line (re-terminates Horizon Line)
Trojan Harborton 230 kV 1 LTP No No Re-termination to Harborton
St Marys Harborton 230 kV 1 LTP No No Re-termination to Harborton
Rivergate Harborton 230 kV 1 LTP No No Re-termination to Harborton
Trojan Harborton 230 kV 2 LTP No No Re-termination to Harborton
Table LMJ 198
199
Forecasted Loads Transmission Projects 200
Participating load-serving entities provide forecasts of loads for balancing authority areas 201
internal to the NTTG footprint. These loads are generally the same as those found in the 202
participants’ official load forecasts (such as those in integrated resource plans) and are similar 203
to those provided to the Load and Resource Subcommittee of the WECC Planning Coordination 204
Committee. Chart CCC summarizes the load forecast used in the 2016-2017 planning cycle. 205
[Chart CCC: 2026 forecasted loads: bar graph to be created from Table 1, below, January 2016-206
2017 Data Submittal – Load Comparison, on page 8 of DFRTP, v2.6.] 207
SUBMITTED BY:
2015 Actual Peak
Demand (MW)
2024 Summer
Load Data Submitted in 2014-15
(MW)
2026 Summer
Load Data Submitted in Q1 2016
(MW)
2026 Summer
Load Data Submitted
in Q5 2017 (MW)
Difference (MW) 2024-
2026
Idaho Power 3,730 4,193 4,346 4,340 147
NorthWestern 1,790 1,774 1,992 1,992 218
PacifiCorp 12,634 14,002 13,414 13,414 -588
Portland General 3,958 3,933 3,885 3,874 -59
TOTAL* 22,112 23,902 23,637 23,620 -282
* * Loads for Deseret G&T and UAMPS are included in PacifiCorp East
208
NTTG received 3,200 MW of proposed new generation resources from its funding Transmission 209
Providers for consideration in the RTP. Figure 3 displays these incremental resources within the 210

NTTG 2016-2017 Revised Draft Final Regional Transmission Plan Version 3.2
12
NTTG footprint and compares submissions from the prior RTP with submissions for quarters 1 211
and 5 of the current cycle. 212
213
Figure 3. Comparison of forecasted resources 214
In Quarter 5, Northwestern submitted 550 MW of new Montana wind generation. Also 215
PacifiCorp indicated that its recently submitted integrated resource plan increased the amount 216
of Wyoming wind power from 887 MW to 1,100 MW. As shown in Figure 3, the total resource 217
forecast of 3,200 MW submitted this cycle was reduced by 392 MW, or 12.25 percent, from the 218
3,592 MW forecast in 2024. Following the Quarter 1 data submittal, the owners of the Colstrip 219
1 and 2 coal-fired plants announced a plan to retire the units before 2026. The owners of the 220
Valmy 1 and 2 coal plants in Nevada also plan to decommission the plants by 2025, a decade 221
earlier than originally planned. Both sets of retirements were assumed in the 2016-2017 222
studies and are reflected in Quarter 5 values shown in Figure 3. 223
In the 2014-15 study cycle, Power Company of Wyoming (PCW) submitted 3,000 MW of wind 224
resources associated with the TransWest Express project. PCW asked that those resources not 225
be included in the NTTG 2014-15 Regional Plan. Those resources, to serve loads outside the 226
NTTG footprint in California, have been submitted with an Interregional Transmission Project in 227
the 2016-17 study cycle. 228
In support of the proposed transmission additions or upgrades, NTTG received four firm 229
transmission-service-obligation submissions (contractual requirements to provide service)—230
two each from Idaho Power and PacifiCorp. These are shown in the following map. [Reference 231
Report 2.6 Table 4. Map will need to be created. Use the map from page 9 of the 2014-15 RTP 232

NTTG 2016-2017 Revised Draft Final Regional Transmission Plan Version 3.2
13
as a guide. Two vectors West to East across ID-Northwest to Boise area and to Idaho Falls area, 233
another vector North to South from Arco to Utah, and a fourth vector east to west from 234
Wyoming.] 235
Submitted by MW Start Date POR POD
Idaho Power 500/200 2021 Northwest IPCo
250/550 2022 LGBP BPASEID
PacifiCorp East 540 2024 Antelope Network
1100 2026 Miners / Point
of Rocks Network
Table 4 – Transmission Service Obligations 236
Public Policy Consideration Scenario Requests 237
238
In Quarter 1, Renewable Northwest (RNW) and the Northwest Energy Coalition (NWEC) jointly 239
submitted a Public Policy Consideration request for a scenario analysis study. The group asked 240
NTTG to study a faster phase-out of coal plants while developing utility-scale renewable 241
resources and replacing Colstrip units 1, 2 and 3 with either wind only or a combination of wind 242
and natural gas combustion. 243
Members of the TWG and representatives from RNW and NWEC reviewed the request and 244
agreed to some modifications. These modifications, and the associated study assumptions, are 245
documented in the NTTG 2016-2017 Study Plan, Attachment 3 of the Draft Final RTP. 246
The study results suggested that a replacement of wind or a combination of wind and gas for 247
coal may be feasible. This study, however, neither constituted a path study nor conveyed or 248
implied transmission rights. Additional analysis would be required to understand the full 249
impacts of coal plant decommissioning. 250
Public Policy Considerations are considered to be relevant factors not established by local, state 251
or federal laws or regulations. The results of PPC analysis may inform the RTP but do not result 252
in the inclusion of additional projects in the RTP. 253
A full report of the study can be found in Appendix D of the NTTG 2016-2017 Draft Final RTP. 254
Regional Economic Study Requests 255
NTTG received no regional economic study requests. 256
Initial Regional Transmission Plan Development 257
The starting point for the biennial planning process was development of the Initial RTP. This 258 exercise used a bottom-up approach to merge the projects in the prior RTP (2014-2015) and 259

NTTG 2016-2017 Revised Draft Final Regional Transmission Plan Version 3.2
14
the Full Funding Transmission Providers’ local transmission plans into a single regional 260 transmission plan. Next, the TWG analyzed the Initial RTP through Change Case plans, which 261 included or excluded Non-Committed regional projects and Interregional Transmission Projects. 262 These Change Case plans helped to determine whether Alternative Projects could be added or 263 substituted, or if one or more Non-Committed Projects could be deferred, or both, to yield a 264 regional transmission plan more efficient or cost effective than the Initial RTP. The results of 265 this analysis led to the formation of the Draft RTP. 266
267 Figure 4. The red and green lines represent the projects comprising the prior RTP from 2014-2016. These include 268 Boardman to Hemingway, in the northwest sector of the above map, and an Alternative Project with four 269 transmission elements across four states. 270
The following Non-Committed regional projects comprised the Initial RTP: 271
Boardman to Hemingway (Longhorn-Hemingway) 500 kV (red) 272
Gateway West 273
o Windstar-Aeolus 230 kV (green) 274
o Aeolus-Anticline (Jim Bridger) 500 kV (green) 275
o Anticline-Populus 500 kV (green) 276
o Populus-Borah 500 kV (blue) 277
o Populus- Cedar Hill 500 kV (green) 278
o Cedar Hill-Hemingway 500 kV (green) 279
o Cedar Hill- Midpoint 500 kV (green) 280
o Borah-Midpoint 345 to 500 kV conversion (dark green) 281

NTTG 2016-2017 Revised Draft Final Regional Transmission Plan Version 3.2
15
o Midpoint-Hemingway #2 500 kV (blue) 282
Gateway South 283
o Aeolus-Clover 500 kV (red) 284
Antelope 285
o Goshen-Antelope 345 kV (red) 286
o Antelope-Borah 345 kV (red) 287
288
289 Figure 5. Map showing Non-Committed regional projects comprising the 2016-2017 Initial RTP. 290
291
Interregional Project Coordination 292
As part of interregional coordination, NTTG and the other regional entities in the Western 293
Interconnection collaborate during their transmission planning processes to coordinate their 294
interregional transmission planning data. These coordination efforts inform each planning 295
region’s transmission plans. A properly submitted Interregional Transmission Project is 296
evaluated as an Alternative Project in NTTG’s regional planning process. The set of 297
uncommitted projects (regional, interregional or both) that results in the more efficient or cost-298
effective regional transmission plan forms the basis of NTTG’s Regional Transmission Plan. 299
300

NTTG 2016-2017 Revised Draft Final Regional Transmission Plan Version 3.2
16
SUMMARY OF Q1-2016 INTERREGIONAL PROJECTS SUBMITTED TO NTTG
Project Name Company Relevant Planning Region(s)
Termination From
Termination to
Status In
Service Date
Cross-Tie Transmission Project
TransCanyon, LLC
NTTG, WC Clover, UT Robinson Summit, NV
Conceptual 2024
SWIP-North Great Basin Transmission LLC
NTTG, WC Midpoint, ID Robinson Summit, NV
Permitted 2021
TransWest Express Transmission Project
TransWest Express, LLC
NTTG, WC and CAISO
Sinclair, WY Boulder City, NV
Conceptual 2020
Table X. Three Interregional Transmission Projects were submitted for consideration during 301
formation of the Initial RTP in Quarter 1 of the biennial cycle. 302
303
304
305
Figure 6. Three Interregional Transmission Projects were evaluated during the planning cycle. 306

NTTG 2016-2017 Revised Draft Final Regional Transmission Plan Version 3.2
17
Southwest Intertie Project (SWIP). Great Basin Transmission, LLC (GBT), an affiliate of LS 307
Power, submitted the 275-mile northern portion of the Southwest Intertie Project (SWIP) as an 308
ITP. SWIP-North would connect the Midpoint 500-kV substation in NTTG’s planning area to the 309
Robinson Summit 500-kV substation in the WestConnect area with a 500-kV single-circuit AC 310
transmission line. The SWIP is expected to have a bi-directional WECC-approved path rating of 311
approximately 2,000 MW. If GBT is selected to build SWIP‐North, development, final design and 312
construction activities could be completed to support energizing the project within an 313
estimated 36‐42 months. 314
Cross-Tie Transmission Line. TransCanyon submitted the 213-mile Cross-Tie Transmission Line 315
for consideration as an ITP. TransCanyon proposes to build a 1500-MW, 500-kV high-voltage 316
alternating current (HVAC) line between central Utah and east-central Nevada. The line would 317
connect PacifiCorp’s proposed 500-kV Clover substation with the existing 500-kV Robinson 318
Summit substation. TransCanyon expects the project to be in-service by the end of 2024. 319
TransWest Express Transmission Project. TransWest proposed a 730-mile, phased 320
1,500/3,000 MW, ±600 kV, high-voltage direct current (HVDC) transmission system with 321
terminals in south-central Wyoming and southeastern Nevada. The federal Bureau of Land 322
Management and Western Area Power Administration published the Final Environmental 323
Impact Statement (FEIS) for the TWE Project in May 2015. 324
Stress-conditioned Case Study Results 325
Stressed Hours for Study with Production-Cost Modeling 326
The TWG used GridView production-cost software to review 8,760 hours of data to identify 327
stressed conditions within the NTTG footprint. A case representing the year 2026 was obtained 328
from the WECC TEPPC. This case included a representation of the load, generation and 329
transmission topology of the WECC interconnection-wide transmission system 10 years in the 330
future. The TWG identified corrections to the data needed to align with data submitted in the 331
first quarter of the biennial planning cycle. TWG shared these changes with the other regional 332
planning entities and WECC to include in their future studies. The TWG then agreed to use this 333
modified TEPPC case in creating the stressed cases discussed below. 334
After processing all 8,760 hours through the production-cost program, the TWG analyzed the 335
data and identified seven stressed conditions to study: 336
High NTTG summer peak 337
High NTTG winter peak 338
High Montana-Northwest (Path 8) flows 339
High southern Idaho import (Idaho-Northwest Eastbound) 340
High southern Idaho-Northwest export (Idaho-Northwest westbound) 341
High NE-SE (Path Tot2) flows 342
Other conditions the might warrant transmission system reinforcement 343 344
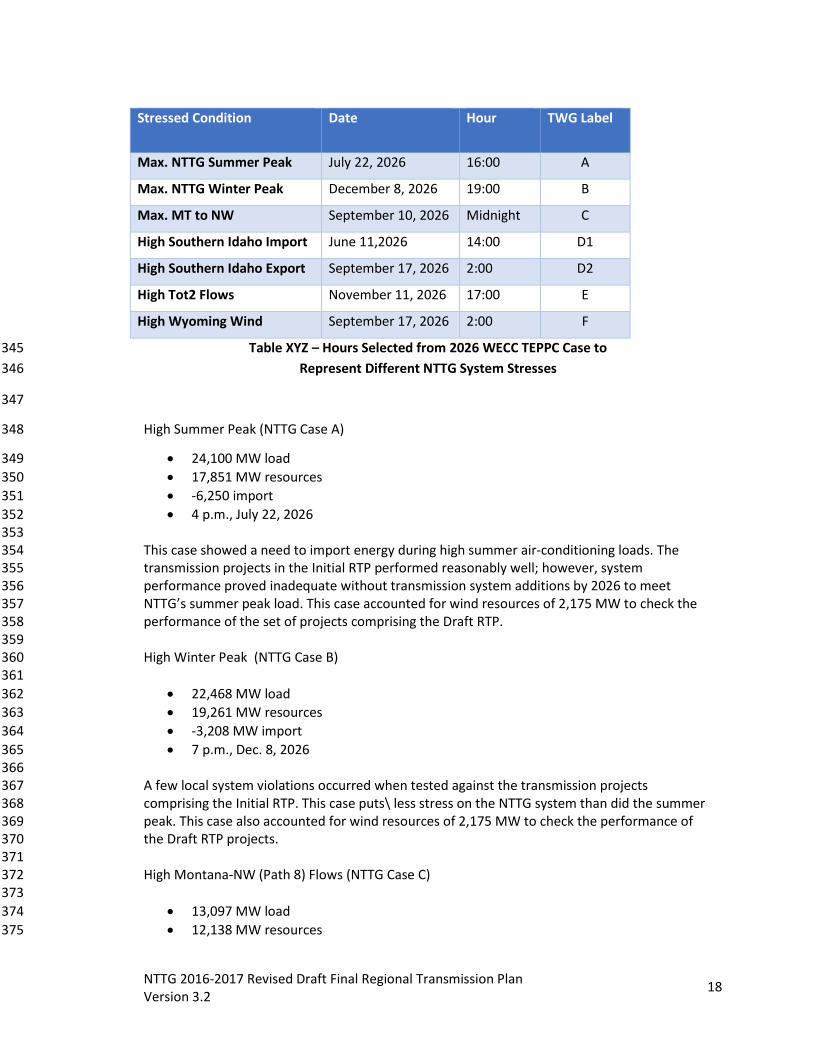
NTTG 2016-2017 Revised Draft Final Regional Transmission Plan Version 3.2
18
Stressed Condition
Date Hour TWG Label
Max. NTTG Summer Peak July 22, 2026 16:00 A
Max. NTTG Winter Peak December 8, 2026 19:00 B
Max. MT to NW September 10, 2026 Midnight C
High Southern Idaho Import June 11,2026 14:00 D1
High Southern Idaho Export September 17, 2026 2:00 D2
High Tot2 Flows November 11, 2026 17:00 E
High Wyoming Wind September 17, 2026 2:00 F
Table XYZ – Hours Selected from 2026 WECC TEPPC Case to 345
Represent Different NTTG System Stresses 346
347
High Summer Peak (NTTG Case A) 348
24,100 MW load 349
17,851 MW resources 350
-6,250 import 351
4 p.m., July 22, 2026 352 353 This case showed a need to import energy during high summer air-conditioning loads. The 354 transmission projects in the Initial RTP performed reasonably well; however, system 355 performance proved inadequate without transmission system additions by 2026 to meet 356 NTTG’s summer peak load. This case accounted for wind resources of 2,175 MW to check the 357 performance of the set of projects comprising the Draft RTP. 358 359 High Winter Peak (NTTG Case B) 360 361
22,468 MW load 362
19,261 MW resources 363
-3,208 MW import 364
7 p.m., Dec. 8, 2026 365 366 A few local system violations occurred when tested against the transmission projects 367 comprising the Initial RTP. This case puts\ less stress on the NTTG system than did the summer 368 peak. This case also accounted for wind resources of 2,175 MW to check the performance of 369 the Draft RTP projects. 370 371 High Montana-NW (Path 8) Flows (NTTG Case C) 372 373
13,097 MW load 374
12,138 MW resources 375

NTTG 2016-2017 Revised Draft Final Regional Transmission Plan Version 3.2
19
-959 MW import 376
12:00 midnight, Sept. 10, 2026 377 378 This case tested transmission system capabilities with high electricity flows from Montana to 379 the Northwest. This scenario was used for the public policy consideration study, which analyzed 380 the impact of an accelerated phase-out of Colstrip units 1, 2 and 3 with either wind only or a 381 combination of wind and gas. See the Public Policy Consideration Scenario Requests section for 382 results of the study. 383 384 High Southern Idaho Import (NTTG Case D1) 385 386
16,382 MW load 387
9,159 MW resources 388
-7,223 MW import 389
2 p.m., June 11, 2026 390 391 Under conditions with the eastbound path from the Northwest to Idaho operating at a 2,244 392 MW deficit, and the NTTG system importing 7,223 MW, the NTTG transmission topology could 393 not import enough power to support load service obligations in southern Idaho. With the 394 addition of transmission projects comprising the Initial RTP, however, the NTTG system would 395 perform well, with a few local violations. 396 397 High Southern Idaho Export ( NTTG Case D2) 398 399
11,935 MW load 400
14,683 MW resources 401
2,748 MW export 402
2 a.m., Sept 17, 2026 403 404 In this export scenario, with the Idaho to Northwest Path 8 flow at 3,391 MW, the existing 405 NTTG system would be incapable of supporting expected transfers and meeting transmission 406 requirements in 2026. Adding in the projects from the Initial RTP, the system performed well, 407 with one contingency that caused a series cap bank to overload. That bank, however, has 408 reached the end of its useful life and is likely to be replaced before 2026. 409 410 High NE-SE (Path Tot2) flows (NTTG Case E) 411 412
16,625 MW load 413
16,620 MW resources 414
5 MW export 415
5 p.m., Nov. 11, 2026 416 417 This case evaluated the performance of the Interregional Transmission Projects in supporting 418 transfers between regions. These additional interregional transfers were not identified in Q1 to 419 meet or defer NTTG’s 2026 footprint resource requirements. The case showed near balance in 420 the NTTG footprint between loads and resources, with a small 5 MW import, along with a Tot2 421

NTTG 2016-2017 Revised Draft Final Regional Transmission Plan Version 3.2
20
flow of 1,566 MW. This case accounted for wind resources of 2,175 MW to check the 422 performance of the Draft RTP. 423 424 High Wyoming wind production (NTTG Case F) 425 426
11,935 MW load 427
15,015 MW resources 428
3,081 MW export 429
2 a.m., Sept. 17, 2026 430 431 This case, as others, was studied at the 2,175-MW wind level, which includes the addition of 432 1,100 MW of wind capacity. The added wind generation in the Wyoming area worsened 433 reliability issues observed in Wyoming and confirmed the need for additional transmission to 434 use these resources to their fullest extent. The RTP addresses these reliability concerns and 435 relieves the transmission constraints. 436 437
Development of Change Cases 438
For each of the seven stress-conditioned cases, the TWG prepared a Null Change Case and 439 analyzed reliability results. The Null case represents roughly today’s transmission topology 440 made to serve loads and resource requirements in 2026. Only the Heavy Winter case 441 performed acceptably. All the other conditions revealed performance issues that required 442 varying degrees of correction, with the heavy summer case needing the least correction and 443 the high Wyoming wind case needing the most. In instances where the transmission system 444 was not adequately stressed to historical norms, the TWG slightly modified system conditions 445 to ensure that the transmission system was studied under reasonably stressed conditions. 446 447
Change Case Results 448
To efficiently study the wide range of potential combinations of Non-Committed Projects, the 449 TWG proposed a Change Case matrix in the study plan. Once the stressed power-flow cases 450 had been selected and developed, the TWG modified the matrix to better reflect the 451 recommended analysis. The TWG provided stakeholders with the opportunity for input on 452 whether a particular combination of uncommitted regional or interregional projects should be 453 analyzed. No comments were received. The matrix was subsequently vetted through the 454 Planning Committee and the Steering Committee. 455 456 Table XX, below, is the Change Case matrix used by the TWG. 457
458
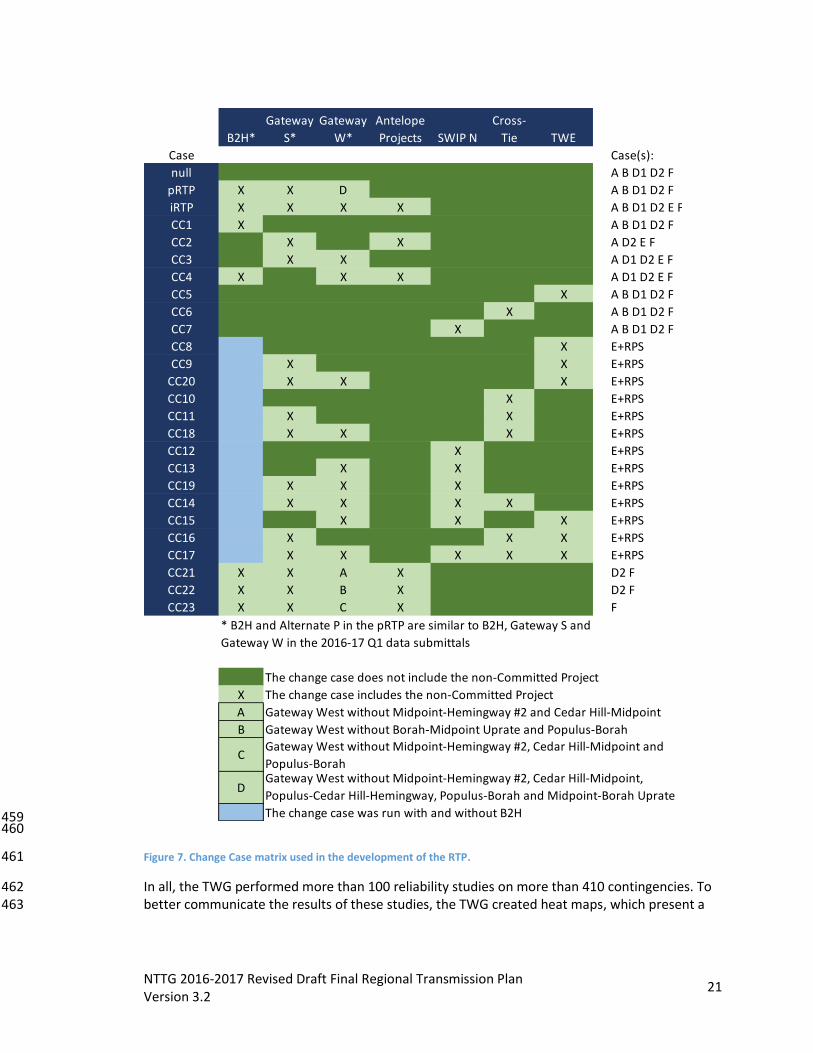
NTTG 2016-2017 Revised Draft Final Regional Transmission Plan Version 3.2
21
459 460
Figure 7. Change Case matrix used in the development of the RTP. 461
In all, the TWG performed more than 100 reliability studies on more than 410 contingencies. To 462 better communicate the results of these studies, the TWG created heat maps, which present a 463
B2H*
Gateway
S*
Gateway
W*
Antelope
Projects SWIP N
Cross-
Tie TWE
Case Case(s):
null A B D1 D2 F
pRTP X X D A B D1 D2 F
iRTP X X X X A B D1 D2 E F
CC1 X A B D1 D2 F
CC2 X X A D2 E F
CC3 X X A D1 D2 E F
CC4 X X X A D1 D2 E F
CC5 X A B D1 D2 F
CC6 X A B D1 D2 F
CC7 X A B D1 D2 F
CC8 X E+RPS
CC9 X X E+RPS
CC20 X X X E+RPS
CC10 X E+RPS
CC11 X X E+RPS
CC18 X X X E+RPS
CC12 X E+RPS
CC13 X X E+RPS
CC19 X X X E+RPS
CC14 X X X X E+RPS
CC15 X X X E+RPS
CC16 X X X E+RPS
CC17 X X X X X E+RPS
CC21 X X A X D2 F
CC22 X X B X D2 F
CC23 X X C X F
The change case does not include the non-Committed Project
X The change case includes the non-Committed Project
A Gateway West without Midpoint-Hemingway #2 and Cedar Hill-Midpoint
B Gateway West without Borah-Midpoint Uprate and Populus-Borah
C
D
The change case was run with and without B2H
* B2H and Alternate P in the pRTP are similar to B2H, Gateway S and
Gateway W in the 2016-17 Q1 data submittals
Gateway West without Midpoint-Hemingway #2, Cedar Hill-Midpoint,
Populus-Cedar Hill-Hemingway, Populus-Borah and Midpoint-Borah Uprate
Gateway West without Midpoint-Hemingway #2, Cedar Hill-Midpoint and
Populus-Borah

NTTG 2016-2017 Revised Draft Final Regional Transmission Plan Version 3.2
22
weighted7 graphical performance of a Change Case on a specific flow condition. A full heat map 464 analysis of the Change Cases is included in the final Draft RTP. 465
466
467 Figure 8. Heat map of the D2-Null Case 468
469 Figure 8, for example, shows the general location where performance issues (e.g., an 470 overloaded transmission line) occurred for a contingency. The accumulation of overloads and 471 voltage issues are represented by the color spectrum from blue to red, or “cooler” to “hotter.” 472 These violations occur when transmission systems cannot handle anticipated transfers across 473 that area’s transmission lines. In particular, this heat map, using existing Wyoming wind 474 resources dispatched at about 600 MW, indicates that transmission additions are necessary to 475 integrate the projected wind resources. 476 477
7 High voltage conditions had a weighting of 1; Low voltage conditions had a weighting of 3; and overloads of branches had a weighting of 5. For example, a zone in which 10 contingencies caused an overload of one branch in that zone would receive a total weight of 50 (i.e., 10 x 5), which would then be translated into a color on the map. A blue color represents a weighted total of about 10, green is a count up to 30, yellow is a count up to 50 and red is for a weighted count exceeding about 70.

NTTG 2016-2017 Revised Draft Final Regional Transmission Plan Version 3.2
23
478 Figure 9. Heat map of the High Southern Idaho export case with the Initial RTP facilities included 479
The heat map in Figure 9 shows how the addition of the Initial RTP projects produced a 480
dramatic improvement of transmission performance when compared with the Null Case. 481
High Southern Idaho Import Case 482
Combining the Boardman to Hemingway project with the Gateway West and Gateway South 483 Non-Committed Projects eliminated violations in flow conditions visible in the Null Case. 484 Change Case 3 tested whether Gateway West or Gateway South, or both, could replace or 485 compare with the Boardman-to-Hemingway line. They couldn’t. The projects contained in the 486 prior RTP also failed to alleviate the violations. 487 488
High Southern Idaho Export Case 489
Adding the Boardman-to-Hemingway project relieved stress across the Idaho-Northwest 490 cutplane, but significant issues remained east of Hemingway. Adding the eastern portion of 491 Gateway West and Gateway South outlined in the prior RTP eliminated the performance issues 492 in Wyoming and between Idaho and Montana, but those additions increased the stress across 493 southern Idaho. The Initial RTP and Change Cases 21 and 23 resolved these issues. 494 495

NTTG 2016-2017 Revised Draft Final Regional Transmission Plan Version 3.2
24
High Wyoming Wind Case 496
Without significant reinforcements, the transmission system in Wyoming could not handle both 497 existing and future planned wind resources while maintaining all other Wyoming area 498 generating resources at their typical high capability in an export scenario. 499 500 With wind production at the 1,300-MW level in the Null Case (no new transmission supporting 501 2026 loads), the system performed poorly. Nor did the projects in the prior RTP solve problems. 502 Adding the Initial RTP projects resolved all violations except for a series capacitor bank. That 503 bank has reached the end of its useful life, however, and is due for replacement. 504 505 In Quarter 6, the case was tested to see if Change Cases 1 through 4 would support the 506 increased level of Wyoming wind. The Null Case (no new transmission) was unable to be solved 507 with wind above 1,800 MW. Testing Change Case 4 required adding the Aeolus-Anticline 500-508 kV line to eliminate a number of contingencies that failed to solve in Wyoming. Change Case 509 23, which is essentially Change Case 4a with Gateway South added, performed well with 510 Wyoming wind modeled at 2,175 MW. 511
Interregional Transmission Projects 512
Change Cases 5 through 20 tested whether the three Interregional Transmission Projects 513 (ITP)—alone, in combination with other ITPs or in combination with the Non-Committed 514 Projects—could satisfy NTTG’s transmission needs on a regional or interregional basis more 515 efficiently or cost effectively than through local planning processes. The ITPs were added to the 516 null cases without any additional resources to serve NTTG load beyond those resources 517 identified in the Quarter 1 and Quarter 5 data submittals. The ITPs did not provide the NTTG 518 footprint with regional benefits, the testing showed, either by significantly reducing 519 performance issues or by displacing NTTG Non-Committed Projects. 520 521 The Initial RTP also was analyzed to determine whether it would be capable of supporting the 522 interregional resource transfers proposed by the ITPs. Given the relatively long distances of the 523 ITPs, the local integration performance issues identified in Wyoming were solvable. 524 525
Reliability Conclusions 526
Based on the above study results, the TWG concluded that both Change Cases 21 and 23 and 527 the Initial RTP satisfy NTTG reliability criteria. In Quarter 5, the TWG tested Change Case 23 and 528 the wind resource additions at various load and flow levels on the Heavy Summer, Heavy 529 Winter, High Tot2 and High Wyoming wind cases. The TWG study found the NTTG area would 530 be reliably served in the year 2026 only by including the following Non-Committed regional 531 projects: 532 533
Boardman to Longhorn (formerly Hemingway) 534 The Energy Gateway projects including segments: 535
Windstar-Aeolus 230 kV 536
Aeolus-Clover 500 kV 537
Aeolus-Anticline 500 kV 538
Anticline-Populus 500 kV 539
Populus-Cedar Hill-Hemingway 500 kV 540

NTTG 2016-2017 Revised Draft Final Regional Transmission Plan Version 3.2
25
Antelope Transmission Project including: 541
Antelope – Borah 345 kV 542
Antelope – Goshen 345 kV 543
Antelope 345/230 kV transformers and interconnection facilities 544 545 The ITPs were evaluated to determine whether one or more of them could defer or replace 546 NTTG’s Non-Committed Projects. The TWG concluded that none of the ITPs solved NTTG’s 547 reliability performance issues and, thus, were included in the final NTTG RTP. 548 549
Economic Evaluations 550
To determine whether the Initial RTP or a Change Case transmission plan was more cost 551 effective, the TWG used three economic metrics, as determined in the Biennial Study Plan. The 552 three metrics—capital-related costs, power flow losses and reserves—and results are discussed 553 below. 554
Capital-related Cost Metric 555
Development of the capital-related cost metric required three steps. The first step validated 556 the capital cost of the Project Sponsor’s Q1 submitted project. The second step used those 557 results to estimate the annual capital-related costs. The third step levelized the net present 558 value annual capital-related costs for the Initial RTP and the Change Case plans. 559
Energy-loss Metric 560
The energy-loss metric captures the change in energy generated, based on system topology, to 561
serve a given amount of load. A reduction in losses for a Change Case would represent a 562
benefit, since less energy would be required to serve the same load. The two Change Cases 563
with fewer Gateway West transmission segments—Change Cases 21 and 23—had losses higher 564
than, or in some cases equal to, the Initial RTP. Losses were higher in the two Change Cases 565
because the electrical flows in the Initial RTP were redistributed to fewer lines. From a loss 566
perspective alone, the Initial RTP case had fewer losses and as such was the more efficient 567
case. 568
Reserve Metric 569
The reserve metric evaluates the opportunities for two or more parties to save money by 570
sharing a generating resource that would be enabled by transmission. The metric is a 10-year 571
look at the increased load and generation additions in the NTTG footprint and the incremental 572
transmission additions that may be included in the Draft RTP. 573
In the study cycle, the TWG analyzed Gateway West, Gateway South, Boardman to Hemingway, 574
SWIP North and the Cross-Tie projects. To evaluate these projects, the NTTG footprint was 575
segmented into five zones, and a sixth external zone was included to study the SWIP North and 576
the Cross-Tie projects. The six zones produced 122 viable sharing combinations. Of those, the 577
analysis of the annual net savings over each theoretical participant’s standalone alternative 578
suggested that only 34 viable combinations were economic. 579

NTTG 2016-2017 Revised Draft Final Regional Transmission Plan Version 3.2
26
Note that this metric includes generation capital costs in its evaluation and, as such, may only 580
be appropriate for cost allocation purposes. It should not drive the selection of a Draft RTP. 581
Whether these cost savings warrant jointly sharing the costs of reserve capacity is up to the 582
parties to decide. 583
For the NTTG metric analysis, the Initial RTP and the two alternative Change Cases each 584
supported viable economic combinations. Since these Change Cases could contain the same 585
benefit value, the Change in Reserve metric did not factor into the Draft RTP selection decision. 586
Economic Metric Analysis Conclusion 587
The sum of the annual capital-related cost metric, loss metric (monetized) and reserve metric 588
(monetized) yielded an incremental cost for the Initial RTP and the Change Case plans. The set 589
of projects with the lowest incremental cost, after adjustment by the plan’s effects on 590
neighboring regions—Change Case 23 (see Figure 10, below)—was then incorporated into the 591
Draft RTP. Note that the incremental cost was computed as the levelized annual capital-related 592
cost, minus NTTG loss benefit, minus monetized reserve benefit. 593
594
595
Figure 10. Change Case 23, comprising Boardman to Hemingway, Gateway South, portions of Gateway West, and 596 the Antelope projects, produced the lowest incremental cost. 597

NTTG 2016-2017 Revised Draft Final Regional Transmission Plan Version 3.2
27
Planning Process Flow Map (Coming) 598
599
Final Regional Transmission Plan 600
Based on the study assumptions and reliability and economic conclusions discussed above, the 601
more efficient or cost-effective plan is Change Case 23. Change Case 23 is a staged variant of 602
the Initial RTP. For the transfers submitted in Quarter 1 and Quarter 5, the facility segments 603
shown in Figure 11, below, were not necessary for the transfers studied in the Change Cases. 604
These segments would likely be necessary at higher transfer levels. 605
606
Figure 11. These transmission line segments from the Initial RTP were not included in the final RTP. 607
NTTG’s final Draft RTP emerged after a rigorous reliability analysis of the NTTG Transmission 608
Providers’ rollup of their local area plans and assumption of Non-Committed regional 609
transmission projects, augmented with stakeholder Interregional Transmission Projects. This 610
technical analysis was followed by an economic metric analysis that selected NTTG’s more 611
efficient and cost-effective regional transmission plan, shown below in Figure 12. 612

NTTG 2016-2017 Revised Draft Final Regional Transmission Plan Version 3.2
28
613
Figure 12. These projects comprise NTTG's final RTP. See the legend for the identity of individual projects. 614
Legend for Fig. 12 615
Red in upper left: Boardman to Hemingway 616
Green: Gateway West 617
Red at bottom: Gateway South Gate 618
Dark green in middle: Gateway West—upgrade of existing line from 345 kv to 500 kv 619
Red at center: Antelope projects 620
621
Cost Allocation 622
The SWIP-North project sponsors were the only project sponsors to request cost allocation; 623
however, they failed to comply with the requirement to submit pre-qualification data by Oct. 624
31, 2015. As a result, no projects that were eligible for cost allocation were submitted into 625
NTTG’s 2016-17 regional planning process. 626
627
Next Steps 628
Publication of the NTTG Regional Transmission Plan completes the two-year planning process 629
begun in January 2016. The 2016-2017 NTTG RTP identified a need for new transmission 630
capacity to serve forecasted load in 10 years. The plan also identified a set of transmission 631
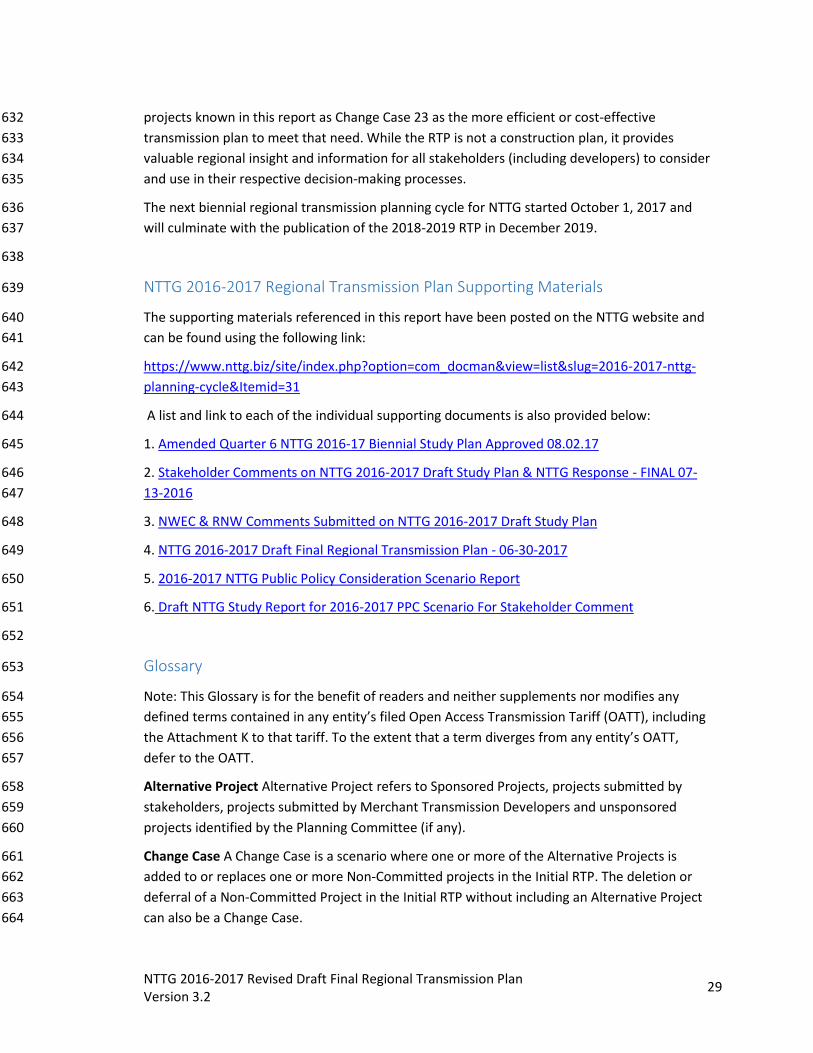
NTTG 2016-2017 Revised Draft Final Regional Transmission Plan Version 3.2
29
projects known in this report as Change Case 23 as the more efficient or cost-effective 632
transmission plan to meet that need. While the RTP is not a construction plan, it provides 633
valuable regional insight and information for all stakeholders (including developers) to consider 634
and use in their respective decision-making processes. 635
The next biennial regional transmission planning cycle for NTTG started October 1, 2017 and 636
will culminate with the publication of the 2018-2019 RTP in December 2019. 637
638
NTTG 2016-2017 Regional Transmission Plan Supporting Materials 639
The supporting materials referenced in this report have been posted on the NTTG website and 640
can be found using the following link: 641
https://www.nttg.biz/site/index.php?option=com_docman&view=list&slug=2016-2017-nttg-642
planning-cycle&Itemid=31 643
A list and link to each of the individual supporting documents is also provided below: 644
1. Amended Quarter 6 NTTG 2016-17 Biennial Study Plan Approved 08.02.17 645
2. Stakeholder Comments on NTTG 2016-2017 Draft Study Plan & NTTG Response - FINAL 07-646
13-2016 647
3. NWEC & RNW Comments Submitted on NTTG 2016-2017 Draft Study Plan 648
4. NTTG 2016-2017 Draft Final Regional Transmission Plan - 06-30-2017 649
5. 2016-2017 NTTG Public Policy Consideration Scenario Report 650
6. Draft NTTG Study Report for 2016-2017 PPC Scenario For Stakeholder Comment 651
652
Glossary 653
Note: This Glossary is for the benefit of readers and neither supplements nor modifies any 654
defined terms contained in any entity’s filed Open Access Transmission Tariff (OATT), including 655
the Attachment K to that tariff. To the extent that a term diverges from any entity’s OATT, 656
defer to the OATT. 657
Alternative Project Alternative Project refers to Sponsored Projects, projects submitted by 658
stakeholders, projects submitted by Merchant Transmission Developers and unsponsored 659
projects identified by the Planning Committee (if any). 660
Change Case A Change Case is a scenario where one or more of the Alternative Projects is 661
added to or replaces one or more Non-Committed projects in the Initial RTP. The deletion or 662
deferral of a Non-Committed Project in the Initial RTP without including an Alternative Project 663
can also be a Change Case. 664

NTTG 2016-2017 Revised Draft Final Regional Transmission Plan Version 3.2
30
Committed Project A Committed Project is a project that has all permits and rights of way 665
required for construction, as identified in the submitted development schedule, by the end of 666
Quarter 1 of the current regional planning cycle. 667
Draft Regional Transmission Plan Draft Regional Transmission Plan refers to the version of the 668
Regional Transmission Plan that is produced by the end of Quarter 4 and presented to 669
stakeholders for comment in Quarter 5. 670
Draft Final Regional Transmission Plan Draft Final Regional Transmission Plan refers to the 671
version of the Regional Transmission Plan that is produced by the end of Quarter 6, presented 672
to stakeholders for comment in Quarter 7 and presented, with any necessary modifications, to 673
the Steering Committee for adoption in Quarter 8. 674
Initial Regional Transmission Plan Initial Regional Transmission Plan comprises projects 675
included in the prior Regional Transmission Plan and projects included in the Full Funders Local 676
Transmission Plans and accounts for future generation additions and deletions (e.g., 677
announced coal retirements). 678
Interregional Transmission Project An Interregional Transmission Project is a proposed new 679
transmission project that would directly interconnect electrically to existing or planned 680
transmission facilities in two or more planning regions and that is submitted into the regional 681
transmission planning processes of all such planning regions. 682
Merchant Transmission Developer Merchant Transmission Developer refers to an entity that 683
assumes all financial risk for developing and constructing its transmission project. A Merchant 684
Transmission Developer recovers the costs of constructing the proposed transmission project 685
through negotiated rates instead of cost-based rates. 686
Non-Committed Project A project that is not a Committed Project 687
Sponsored Project A Sponsored Project is a project proposed by a Project Sponsor. 688
689
690