Integrated Microfluidic Liquid-Liquid Extraction for Cocaine
164
POUR L'OBTENTION DU GRADE DE DOCTEUR ÈS SCIENCES acceptée sur proposition du jury: Prof. J. Brugger, président du jury Prof. N. de Rooij, Dr A. Homsy, directeurs de thèse Dr P. Jouy, rapporteur Dr B. E. Rapp, rapporteur Prof. H. Shea, rapporteur Integrated Microfluidic Liquid-Liquid Extraction for Cocaine Detection in Human Saliva THÈSE N O 5589 (2012) ÉCOLE POLYTECHNIQUE FÉDÉRALE DE LAUSANNE PRÉSENTÉE LE 12 DECEMBRE 2012 À LA FACULTÉ DES SCIENCES ET TECHNIQUES DE L'INGÉNIEUR LABORATOIRE DE CAPTEURS, ACTUATEURS ET MICROSYSTÈMES PROGRAMME DOCTORAL EN MICROSYSTÈMES ET MICROÉLECTRONIQUE Suisse 2012 PAR Philip WÄGLI
Transcript of Integrated Microfluidic Liquid-Liquid Extraction for Cocaine

POUR L'OBTENTION DU GRADE DE DOCTEUR ÈS SCIENCES
acceptée sur proposition du jury:
Prof. J. Brugger, président du juryProf. N. de Rooij, Dr A. Homsy, directeurs de thèse
Dr P. Jouy, rapporteur Dr B. E. Rapp, rapporteur Prof. H. Shea, rapporteur
Integrated Microfluidic Liquid-Liquid Extraction for Cocaine Detection in Human Saliva
THÈSE NO 5589 (2012)
ÉCOLE POLYTECHNIQUE FÉDÉRALE DE LAUSANNE
PRÉSENTÉE LE 12 DECEMBRE 2012
À LA FACULTÉ DES SCIENCES ET TECHNIQUES DE L'INGÉNIEURLABORATOIRE DE CAPTEURS, ACTUATEURS ET MICROSYSTÈMES
PROGRAMME DOCTORAL EN MICROSYSTÈMES ET MICROÉLECTRONIQUE
Suisse2012
PAR
Philip WäGLI


Abstract
On-site drug testing using easily accessible body fluids, such as saliva, has gained a lot of
importance both for road safety and forensic applications. However, saliva is a complex,
inhomogeneous amalgam with many different compounds, whose concentrations change
between people and over time. This leads to a wide range of fluid properties, e.g., viscosity,
surface tension, making saliva pretreatment in microfluidic systems extremely challenging.
We present the development, fabrication and characterization of a low-cost, portable microsys-
tem to detect cocaine in human saliva. The chip combines multiphase liquid-liquid extraction
to transfer the cocaine from the infrared (IR) light absorbing saliva to the IR-transparent
solvent, perchloroethylene (PCE), together with on-chip cocaine detection by IR-spectroscopy
(IR-laser, waveguide, detector). This miniaturized sensing platform has been developed as
part of the Nano-Tera project IrSens.
Saliva is a suitable matrix for the analysis of small molecules such as cocaine, but it is found to
be a challenge to process this complex fluid on a microfluidic chip due to the risk of clogging.
The characterization of the rheological behavior of saliva is described and then a suitable
sample pretreatment method is presented. The low-cost UV-curable polymer NOA81 was
chosen as microfluidic chip material and characterized for microfluidic applications. For
research applications a new, highly flexible, and low-cost NOA81 rapid prototyping method
is presented based on scotch-tape masters. Furthermore, this thesis introduces a microflu-
idic chip design combining a simple and robust droplet generation method together with
a geometry for droplet merging in order to perform continuous droplet-based liquid-liquid
extraction. The extraction efficiency of the system was evaluated by state-of-the-art mass
spectrometry measurements. The microfluidic chip has been integrated in an optofluidic
microsystem transferring cocaine from human saliva to the IR-transparent organic solvent
PCE and thereby enabling cocaine detection by IR-spectroscopy.
In this thesis we achieved to develop a simple and robust droplet generation method re-
sulting in precise and controlled droplet sizes, and which allowed to process complex fluids
such as human saliva without clogging. Furthermore, a droplet-based liquid-liquid extraction
system which transfers the cocaine continuously from human saliva to the organic solvent
PCE was established. For these liquids the developed system yielded a two to three times
iii

higher extraction efficiency than state-of-the-art devices. In addition, we demonstrated that
our system has the potential for cocaine preconcentration in PCE, which is crucial for IR
spectroscopy, our final application.
Keywords: microfluidic, saliva, cocaine, UV-curable adhesive NOA81, rapid prototyping,
continuous liquid-liquid extraction, droplet generation, droplet coalescence, IR-spectroscopy
iv

Résumé
Le dépistage sur site de substances psychotropes dans les fluides corporels tels que la salive a
gagné en importance de nos jours, car il permet non seulement d’améliorer la sécurité routière,
mais aussi les applications en expertises médico-légales. Cependant, la salive est un amalgame
complexe et hétérogène avec beaucoup de composants différents, dont les concentrations
changent selon les individus et au fil du temps. Cela conduit à une large gamme de propriétés
fluidiques, comme par exemple la viscosité ou la tension superficielle, ce qui rend le traitement
de la salive dans les systèmes microfluidiques extrêmement difficile. Dans cette thèse, nous
présentons le développement, la fabrication et la caractérisation d’un micro-système portable
et à faible coût, pour la détection quantitative de la cocaïne dans la salive humaine. Cette puce
est la combinaison d’un procédé microfluidique d’extraction multiphasique de la cocaïne à
partir de la salive vers un solvant transparent à l’infrarouge (IR), le perchloroéthylène (PCE),
avec la détection de la cocaïne par spectroscopie IR (laser IR, guide d’ondes, détecteur). Cette
plate-forme miniaturisée de détection a été développée dans le cadre du projet Nano-Tera
IrSens.
La salive est une matrice appropriée pour l’analyse de petites molécules telles que la co-
caïne, mais le véritable défi consiste à traiter ce fluide complexe dans une puce microfluidique
en raison du risque d’obstruction des canaux. Le comportement rhéologique de la salive est
présenté ainsi que notre méthode de prétraitement d’échantillons adapté pour notre puce
microfluidique. L’adhésif UV photosensible NOA81 a été choisi comme matériau à faible coût
pour la puce, et a été caractérisé pour nos applications microfluidiques. Une méthode de
prototypage rapide, flexible et à faible coût est présentée sur la base de moules réalisés avec
des bandes adhésives. En outre, cette thèse présente une structure simple pour la génération
robuste de gouttelettes qui permet de manipuler les liquides complexes sans obstruer nos
micro-canaux. Un système microfluidique est présenté, intégrant la génération de gouttelettes
et une géométrie pour la coalescence de ces gouttelettes, de façon à effectuer l’extraction
liquide-liquide à base des gouttelettes d’une manière continue. L’efficacité d’extraction de
notre système a été évaluée par une méthode d’analyse de pointe, le spectromètre de masse.
Le système microfluidique présenté a ensuite été intégré dans un système optofluidique qui
transfère la cocaïne de la salive humaine au solvant organique PCE et qui permet de détecter
la cocaïne par spectroscopie IR.
v

Dans cette thèse les résultats à souligner sont multiples. Une méthode robuste de géné-
ration de gouttelettes résultant sur des tailles de gouttelettes précises et contrôlées a été
développée. En particulier cette méthode permet de manipuler les fluides complexes comme
la salive humaine, sans obstruction de nos micro-canaux. De plus, un système d’extraction
liquide-liquide a été réalisé permettant le transfert continu de la cocaïne à partir de la salive
vers le solvant organique PCE. Notre système montre une efficacité d’extraction au moins
deux à trois fois supérieure à celle de l’état de l’art. Notre système présente même un potentiel
pour la préconcentration, ce qui s’avère crucial pour notre application finale, la spectroscopie
IR.
Mots-clés : microfluidique, salive, cocaïne, colle photosensible UV NOA81, prototypage
rapide, extraction liquide-liquide continue, génération de gouttelettes, coalescence de goutte-
lettes, spectroscopie infrarouge
vi

Zusammenfassung
Die Vor-Ort Analyse leicht zugänglicher Körperflüssigkeiten wie Speichel hat sowohl im Zu-
sammenhang mit der Strassenverkehrssicherheit als auch für forensische Anwendungen stark
an Bedeutung gewonnen. Allerdings ist Speichel eine komplexe, inhomogene Flüssigkeit, be-
stehend aus vielen verschiedenen Bestandteilen, deren Konzentrationen zeitlich und zwischen
verschiedenen Personen variieren. Dies führt zu starken Veränderungen der Flüssigkeitseigen-
schaften, wie zum Beispiel der Viskosität oder der Oberflächenspannung, was das Analysieren
von Speichel in einem Mikrofluidiksystem extrem erschwert. Wir präsentieren hier die Ent-
wicklung, Herstellung und Charakterisierung eines kostengünstigen, portablen Mikrosystems
zum Nachweis von Kokain im menschlichen Speichel. Der hier vorgestellte Mikrofluidikchip
verbindet dazu eine mehrphasen Flüssig-Flüssigextraktion (um das Kokain vom Infrarotlicht
absorbierenden Speichel in das infrarottransparente Lösungsmittel Perchloroethylen (PCE)
zu transferieren), mit einer auf dem Mikrochip integrierten Kokaindetektion mittels Infrarot-
spektrometrie (Infrarotlaser, Wellenleiter, Detektor). Diese miniaturisierte Sensorplattform
wurde im Rahmen des Nano-Tera Projektes IrSens entwickelt.
Der menschliche Speichel bietet zwar eine leicht zugängliche Matrix zur Analyse kleiner Mole-
küle wie Kokain, stellt aber gleichzeitig auf Grund des Verstopfungsrisikos der Mikrofluidik-
Kanäle auf dem Chip durch diese komplexe Körperflüssigkeit eine grosse Herausforderung
bei der Verarbeitung dar. Das rheologische Verhalten des Speichels wurde analysiert und ein
geeignetes Verfahren zur Vorbehandlung von Speichelproben definiert. Das kostengünstige
und UV-härtende Polymer NOA81 wurde als Chipmaterial gewählt und spezifisch für mi-
krofluidik Anwendungen charakterisiert. Für dieses Polymermaterial wird hier eine schnelle,
hochflexible und günstige Methode zur Prototypenherstellung präsentiert, welche auf simplen
Klebeband-Abformvorlagen basiert. Zudem wurde ein Mikrofluidikchip entwickelt, welcher
eine neue, absolut einfache und robuste Technik der Tröpfchenerzeugung mit einer Geometrie
zur Tröpfchenzusammenführung vereint um somit eine kontinuierliche, tröpfchenbasierte
Flüssig-Flüssigextraktion durchführen zu können. Die Extraktionseffizienz dieses Chips wurde
mit einem Massenspektrometer neuster Generation evaluiert. Der entwickelte Fluidikchip ist
Teil eines optofluidischen Mikrosystems, welches das Kokain aus dem menschlichen Speichel
in das infrarottransparente organische Lösungsmittel PCE transferiert und somit überhaupt
die Kokaindetektion mittels Infrarotspektrometrie erlaubt.
vii

Während dieser Doktorarbeit ist es gelungen eine einfache Methode zur Erzeugung von
Tröpfchen mit kontrollierter Grösse zu entwickeln, welche ohne zu verstopfen komplexe
Flüssigkeiten wie den menschlichen Speichel verarbeiten kann. Zudem wurde ein tröpf-
chenbasiertes Flüssig-Flüssigextraktionsverfahren entwickelt, welches das Kokain aus dem
menschlichen Speichel in das organische Lösungsmittel PCE transferiert. Das geschaffene
System hatte eine mindestens zwei- bis dreimal höhere Extraktionseffizienz als diejenige gän-
giger mikrofluidik Extraktionssysteme. Weiter konnten wir aufzeigen, dass unser System das
Potential zur Kokain-Vorkonzentration im organischen Lösungsmittel hat, was entscheidend
ist für unsere Endanwendung, die Infrarotspektrometrie.
Schlüsselwörter: Mikrofluidik, Speichel, Kokain, UV-härtender Klebstoff NOA81, Prototy-
penherstellung, kontinuierliche Flüssig-Flüssigextraktion, Tröpfchenerzeugung, Tröpfchenzu-
sammenführung, Infrarotspektrometrie
viii

ContentsAbstract (English/Français/Deutsch) iii
Table of Contents xii
1 Introduction 1
1.1 Microfluidics . . . . . . . . . . . . . . . . . . . . . . . . . . . . . . . . . . . . . . . . 1
1.2 Microfluidic Systems Involved in Real Sample Analysis . . . . . . . . . . . . . . . 5
1.2.1 Commercialized Microfluidic Systems . . . . . . . . . . . . . . . . . . . . 5
1.2.2 Saliva Analysis with Microfluidic Devices . . . . . . . . . . . . . . . . . . . 7
1.2.3 Microfluidic Chips used in Combination with IR-Detection . . . . . . . . 9
1.3 Project IrSens . . . . . . . . . . . . . . . . . . . . . . . . . . . . . . . . . . . . . . . 10
1.3.1 Objectives & Concept of the Project . . . . . . . . . . . . . . . . . . . . . . 10
1.3.2 Relevance of the Project . . . . . . . . . . . . . . . . . . . . . . . . . . . . . 11
1.3.3 Involved Partners and their Roles . . . . . . . . . . . . . . . . . . . . . . . 11
1.4 Objectives of this Thesis . . . . . . . . . . . . . . . . . . . . . . . . . . . . . . . . . 11
2 Materials & Methods 15
2.1 Human Saliva . . . . . . . . . . . . . . . . . . . . . . . . . . . . . . . . . . . . . . . 15
2.1.1 Composition of Human Saliva . . . . . . . . . . . . . . . . . . . . . . . . . 15
2.1.2 Cocaine in Human Saliva . . . . . . . . . . . . . . . . . . . . . . . . . . . . 16
2.1.3 Collection and Preparation of Human Saliva Samples . . . . . . . . . . . 19
2.1.4 Saliva Samples in the IrSens Project . . . . . . . . . . . . . . . . . . . . . . 26
2.1.5 Adjustment of the pH-Value of Human Saliva . . . . . . . . . . . . . . . . 27
2.1.6 Rheological Characteristics of Human Saliva . . . . . . . . . . . . . . . . . 28
2.2 Reference System for Cocaine Measurements . . . . . . . . . . . . . . . . . . . . 31
2.2.1 Sample Preparation for Mass Spectrometry . . . . . . . . . . . . . . . . . 31
2.3 Materials used for Microfluidic Devices . . . . . . . . . . . . . . . . . . . . . . . . 33
2.3.1 Comparison of relevant Properties for Microfluidic Applications between
Glass and Polymer . . . . . . . . . . . . . . . . . . . . . . . . . . . . . . . . 34
2.3.2 Material Requirements for Microfluidics . . . . . . . . . . . . . . . . . . . 35
2.3.3 Polymer Materials used in this Work . . . . . . . . . . . . . . . . . . . . . . 35
2.4 Rapid Prototyping of Microfluidic Devices . . . . . . . . . . . . . . . . . . . . . . 36
2.4.1 Master Fabrication . . . . . . . . . . . . . . . . . . . . . . . . . . . . . . . . 36
2.4.2 Fabrication & Assembly of the Microfluidic Device for the project IrSens 39
ix

Contents
2.5 Microfluidic Measurement Setup . . . . . . . . . . . . . . . . . . . . . . . . . . . . 40
2.6 Discussion . . . . . . . . . . . . . . . . . . . . . . . . . . . . . . . . . . . . . . . . . 41
2.7 Summary . . . . . . . . . . . . . . . . . . . . . . . . . . . . . . . . . . . . . . . . . . 42
3 Characterization of Microfluidic Channels Made of UV-Curable Adhesive 43
3.1 Chemical Resistance Against Mid-IR-Transparent Organic Solvents . . . . . . . 44
3.1.1 Method . . . . . . . . . . . . . . . . . . . . . . . . . . . . . . . . . . . . . . . 44
3.1.2 Results . . . . . . . . . . . . . . . . . . . . . . . . . . . . . . . . . . . . . . . 45
3.2 Cocaine Adsorption . . . . . . . . . . . . . . . . . . . . . . . . . . . . . . . . . . . . 46
3.2.1 Method . . . . . . . . . . . . . . . . . . . . . . . . . . . . . . . . . . . . . . . 46
3.2.2 Results . . . . . . . . . . . . . . . . . . . . . . . . . . . . . . . . . . . . . . . 47
3.3 Adjustable Wetting Behavior . . . . . . . . . . . . . . . . . . . . . . . . . . . . . . 48
3.3.1 Method . . . . . . . . . . . . . . . . . . . . . . . . . . . . . . . . . . . . . . . 48
3.3.2 Results . . . . . . . . . . . . . . . . . . . . . . . . . . . . . . . . . . . . . . . 49
3.3.3 Application . . . . . . . . . . . . . . . . . . . . . . . . . . . . . . . . . . . . 52
3.4 UV-Characteristics . . . . . . . . . . . . . . . . . . . . . . . . . . . . . . . . . . . . 54
3.4.1 Method . . . . . . . . . . . . . . . . . . . . . . . . . . . . . . . . . . . . . . . 55
3.4.2 Results . . . . . . . . . . . . . . . . . . . . . . . . . . . . . . . . . . . . . . . 55
3.4.3 Application . . . . . . . . . . . . . . . . . . . . . . . . . . . . . . . . . . . . 55
3.5 Low-Cost Rapid Prototyping . . . . . . . . . . . . . . . . . . . . . . . . . . . . . . 57
3.5.1 Replication Capability . . . . . . . . . . . . . . . . . . . . . . . . . . . . . . 58
3.5.2 Bonding Strength . . . . . . . . . . . . . . . . . . . . . . . . . . . . . . . . . 59
3.6 Summary . . . . . . . . . . . . . . . . . . . . . . . . . . . . . . . . . . . . . . . . . . 60
4 Robust Droplet Generation Based on a Simple Geometry 63
4.1 Introduction . . . . . . . . . . . . . . . . . . . . . . . . . . . . . . . . . . . . . . . . 63
4.2 Theory & Fundamental Principles . . . . . . . . . . . . . . . . . . . . . . . . . . . 66
4.2.1 Basic Conditions for Droplet Generation Based on Dimensionless Numbers 66
4.2.2 Droplet Generation at a Step Between a Shallow and a Deep Microfluidic
Channel . . . . . . . . . . . . . . . . . . . . . . . . . . . . . . . . . . . . . . 67
4.3 Design . . . . . . . . . . . . . . . . . . . . . . . . . . . . . . . . . . . . . . . . . . . 68
4.4 Results . . . . . . . . . . . . . . . . . . . . . . . . . . . . . . . . . . . . . . . . . . . 68
4.4.1 Basic Conditions for PCE Droplet Generation in Saliva . . . . . . . . . . . 69
4.4.2 Robust Droplet Generation . . . . . . . . . . . . . . . . . . . . . . . . . . . 70
4.4.3 Investigations on the Droplet size . . . . . . . . . . . . . . . . . . . . . . . 70
4.4.4 Flow Field Characteristics during Droplet Generation . . . . . . . . . . . 71
4.4.5 Parallelization of the Droplet Generation . . . . . . . . . . . . . . . . . . . 74
4.5 Discussion . . . . . . . . . . . . . . . . . . . . . . . . . . . . . . . . . . . . . . . . . 74
4.6 Summary . . . . . . . . . . . . . . . . . . . . . . . . . . . . . . . . . . . . . . . . . . 75
x

Contents
5 Passive Phase Coalescence of Organic Solvent Droplets Dispersed in Saliva 77
5.1 Introduction . . . . . . . . . . . . . . . . . . . . . . . . . . . . . . . . . . . . . . . . 77
5.1.1 Surfactants and Interfacial Tension . . . . . . . . . . . . . . . . . . . . . . 77
5.1.2 Different Approaches for Microfluidic Passive Coalescence . . . . . . . . 78
5.2 Theory & Fundamental Principles . . . . . . . . . . . . . . . . . . . . . . . . . . . 81
5.2.1 Droplet Coalescence Stages . . . . . . . . . . . . . . . . . . . . . . . . . . . 81
5.2.2 Compressive Merging . . . . . . . . . . . . . . . . . . . . . . . . . . . . . . 81
5.2.3 Decompressive Merging . . . . . . . . . . . . . . . . . . . . . . . . . . . . . 81
5.2.4 Avalanche Coalescence . . . . . . . . . . . . . . . . . . . . . . . . . . . . . 82
5.3 Design . . . . . . . . . . . . . . . . . . . . . . . . . . . . . . . . . . . . . . . . . . . 82
5.3.1 Chemically Assisted Merging Approaches . . . . . . . . . . . . . . . . . . 82
5.3.2 Physically Assisted Merging Approach . . . . . . . . . . . . . . . . . . . . . 83
5.4 Results . . . . . . . . . . . . . . . . . . . . . . . . . . . . . . . . . . . . . . . . . . . 86
5.5 Discussion . . . . . . . . . . . . . . . . . . . . . . . . . . . . . . . . . . . . . . . . . 87
5.6 Summary . . . . . . . . . . . . . . . . . . . . . . . . . . . . . . . . . . . . . . . . . . 87
6 Liquid-Liquid Extraction of Cocaine from Human Saliva 89
6.1 Introduction . . . . . . . . . . . . . . . . . . . . . . . . . . . . . . . . . . . . . . . . 89
6.1.1 Microfluidic H-filter . . . . . . . . . . . . . . . . . . . . . . . . . . . . . . . 90
6.1.2 Slugs in a Capillary . . . . . . . . . . . . . . . . . . . . . . . . . . . . . . . . 91
6.1.3 Droplet-Based Liquid-Liquid Extraction . . . . . . . . . . . . . . . . . . . 92
6.2 Theory & Fundamental Principles . . . . . . . . . . . . . . . . . . . . . . . . . . . 93
6.3 Design . . . . . . . . . . . . . . . . . . . . . . . . . . . . . . . . . . . . . . . . . . . 94
6.3.1 Principle of the Microfluidic System for Droplet-Based Liquid-Liquid
Extraction . . . . . . . . . . . . . . . . . . . . . . . . . . . . . . . . . . . . . 94
6.3.2 Design Variations . . . . . . . . . . . . . . . . . . . . . . . . . . . . . . . . . 95
6.4 Results . . . . . . . . . . . . . . . . . . . . . . . . . . . . . . . . . . . . . . . . . . . 95
6.4.1 pH Value Optimized Extraction Conditions . . . . . . . . . . . . . . . . . . 96
6.4.2 Influence of the Flow Rates on the Extraction Efficiency . . . . . . . . . . 97
6.4.3 Influence of the Geometrical Dimensions on the Extraction Efficiency . 98
6.4.4 Extraction Efficiency at Different Concentrations . . . . . . . . . . . . . . 100
6.4.5 Influence of the Induced Turbulences on the Extraction Efficiency . . . . 100
6.5 Discussion . . . . . . . . . . . . . . . . . . . . . . . . . . . . . . . . . . . . . . . . . 101
6.5.1 Improvements of the extraction efficiency . . . . . . . . . . . . . . . . . . 101
6.5.2 Changes from the First to the Second Extraction System . . . . . . . . . . 102
6.5.3 Comparison with the State of the Art . . . . . . . . . . . . . . . . . . . . . 102
6.6 Summary . . . . . . . . . . . . . . . . . . . . . . . . . . . . . . . . . . . . . . . . . . 103
7 Integrated Cocaine Sensor for Saliva Samples based on IR-Spectroscopy 105
7.1 Introduction . . . . . . . . . . . . . . . . . . . . . . . . . . . . . . . . . . . . . . . . 105
7.2 Theory & Fundamental Principles . . . . . . . . . . . . . . . . . . . . . . . . . . . 106
7.3 Design . . . . . . . . . . . . . . . . . . . . . . . . . . . . . . . . . . . . . . . . . . . 107
7.3.1 Optical Waveguide . . . . . . . . . . . . . . . . . . . . . . . . . . . . . . . . 107
xi

Contents
7.3.2 Integration with the Microfluidic System . . . . . . . . . . . . . . . . . . . 108
7.3.3 Optical Experimental Setup . . . . . . . . . . . . . . . . . . . . . . . . . . . 109
7.3.4 Microfluidic Experimental Setup . . . . . . . . . . . . . . . . . . . . . . . . 109
7.4 Results . . . . . . . . . . . . . . . . . . . . . . . . . . . . . . . . . . . . . . . . . . . 111
7.5 Discussion . . . . . . . . . . . . . . . . . . . . . . . . . . . . . . . . . . . . . . . . . 113
7.6 Summary . . . . . . . . . . . . . . . . . . . . . . . . . . . . . . . . . . . . . . . . . . 116
8 Summary & Outlook 117
8.1 Summary . . . . . . . . . . . . . . . . . . . . . . . . . . . . . . . . . . . . . . . . . . 117
8.2 Outlook . . . . . . . . . . . . . . . . . . . . . . . . . . . . . . . . . . . . . . . . . . . 119
A Appendix:
UPLC-MS Cocaine Calibration Curve 121
Bibliography 140
Glossary 141
Acknowledgements 145
Curriculum Vitae 149
List of Publications 151
xii

1 Introduction
Handling fluids on the micro scale involves very different phenomena from what we are
used to in our daily life. Some physical effects, neglectable at the macro scale, become
predominant. Although nowadays many of these effects are observable, mastering them well
is not so straightforward and building complex microfluidic systems involving several effects
is even more challenging. On the other hand these phenomena open up a huge variety of
new possibilities. Now the whole trick is to take advantage of these high-potential micro
scale effects for every day applications and integrate them in commercial products. This is
one of the key drivers behind the growth in the field of microfluidics during the last years
[1, 2]. Furthermore there is a wide range of applications in the areas such as cosmetics,
pharmaceutics, medical applications, food industry, and drug testing in forensics, where the
sample volumes are limited.
In this chapter some microfluidic basics are explained, an overview of real sample analysis
systems is given, and the project IrSens as well as the goal of this thesis are presented.
1.1 Microfluidics
Microfluidics is a multidisciplinary field interconnecting physics, chemistry, engineering,
micro-, and biotechnology. Microfluidics is also called the art of precisely controlling microliter
volumes of fluids. This implies the size of channels and other features on a microfluidic chip
are in the milimeter to micrometer range. The dimensions are demonstrated with the volume
and the side length of a cube in Table 1.1.
In microfluidics typically different liquids are mixed, separated, moved or used themselves as
transport medium to handle small particles or even biological cells. The fluid flow is either
passively controlled by e.g. capillary forces or by using active techniques such as centrifugal
forces, pumps, and valves. Commonly used pumps for microfluidics provide fluids at constant
pressure or constant flow rate.
1

Chapter 1. Introduction
Table 1.1: Typical dimensions of microfluidic systems.
Volume Side length of the cube
1nL 10−3mm3 100µm
1µL 1mm3 1mm
1mL 1cm3 1cm
Surface-to-volume ratio
Reducing the dimensions of a fluidic system to the micro scale increases the surface-to-volume
ratio. Consequently the relative importance of surface forces (e.g. surface tension, shear stress)
increases as well versus body forces (e.g. gravitational forces, centrifugal forces, inertial forces)
which is expressed by [1] as
surface forces
volume forces∝ `2
`3 −−−→`→0
∞. (1.1)
The relatively larger surface also affects strongly the energy transfer (e.g. heat exchange) and
matter transfer (e.g. diffusion) through surfaces.
Diffusion in a semi-infinite slab
According to Fick’s first law of diffusion, the flux j of a matter per area [kg ·m−2 · s−1] from an
interface in direction z [m] into a semi-infinite slab is given by [3]
j =−Dδc
δz, (1.2)
whereas c is the concentration of the matter [kg ·m−3] and D the diffusion constant [m2 · s−1].
The diffusion constant scales roughly with the inverse of the size of the molecule and also
depends on its shape. Therefore, small molecules have a large diffusion constant and are able
to move a longer average distance per time than a large molecule.
Rewritten using the mass balance on a infinite small slab (∆z → 0) the diffusion law reads
δc
δt= D
δ2c
δ2z. (1.3)
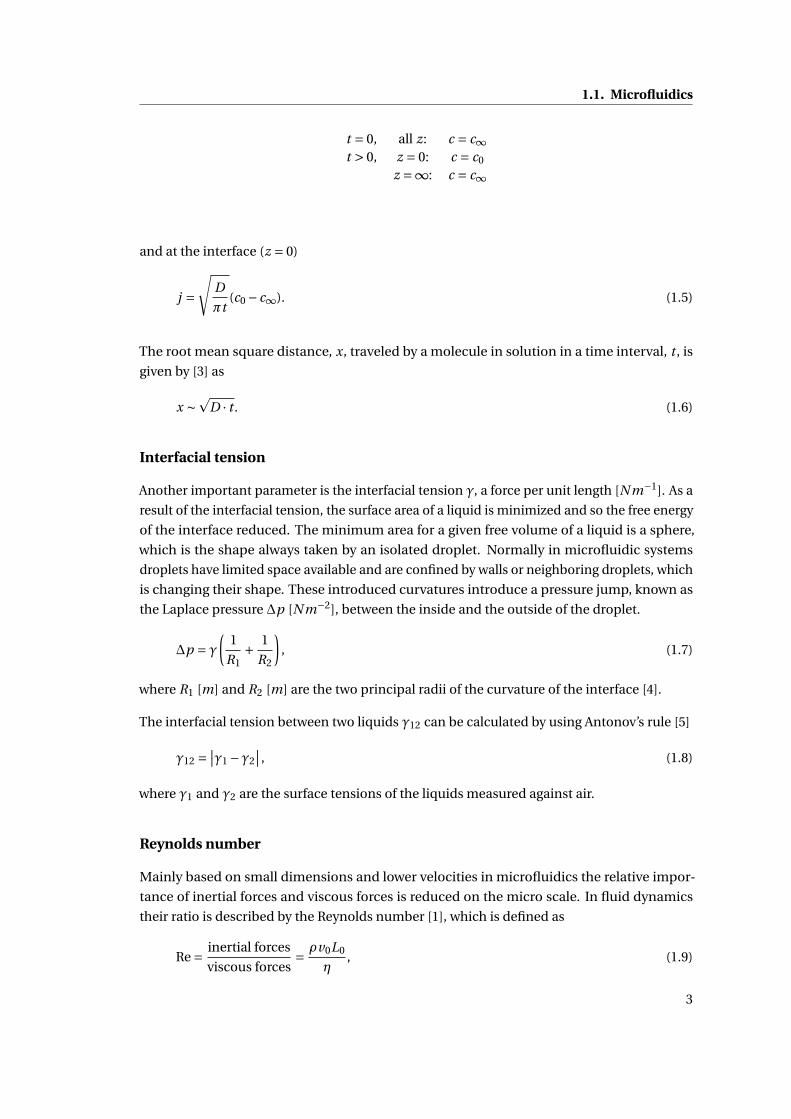
For the following boundary conditions the time-dependent flux becomes
j =√
D
πtexp
(−z2
4Dt
)(c0 − c∞) (1.4)
2
1.1. Microfluidics
t = 0, all z: c = c∞t > 0, z = 0: c = c0
z =∞: c = c∞
and at the interface (z = 0)
j =√
D
πt(c0 − c∞). (1.5)
The root mean square distance, x, traveled by a molecule in solution in a time interval, t , is
given by [3] as
x ∼p
D · t . (1.6)
Interfacial tension
Another important parameter is the interfacial tension γ, a force per unit length [N m−1]. As a
result of the interfacial tension, the surface area of a liquid is minimized and so the free energy
of the interface reduced. The minimum area for a given free volume of a liquid is a sphere,
which is the shape always taken by an isolated droplet. Normally in microfluidic systems
droplets have limited space available and are confined by walls or neighboring droplets, which
is changing their shape. These introduced curvatures introduce a pressure jump, known as
the Laplace pressure ∆p [N m−2], between the inside and the outside of the droplet.
∆p = γ(
1
R1+ 1
R2
), (1.7)
where R1 [m] and R2 [m] are the two principal radii of the curvature of the interface [4].
The interfacial tension between two liquids γ12 can be calculated by using Antonov’s rule [5]
γ12 =∣∣γ1 −γ2
∣∣ , (1.8)
where γ1 and γ2 are the surface tensions of the liquids measured against air.
Reynolds number
Mainly based on small dimensions and lower velocities in microfluidics the relative impor-
tance of inertial forces and viscous forces is reduced on the micro scale. In fluid dynamics
their ratio is described by the Reynolds number [1], which is defined as
Re = inertial forces
viscous forces= ρv0L0
η, (1.9)
3

Chapter 1. Introduction
where ρ is the fluid density [kg ·m−3], v0 and L0 are the characteristic fluid velocity [m · s−1]
and the characteristic length [m] of the system, and η is the dynamic viscosity [N ·m−2 · s] of
the fluid. If Re À 1, then the inertial forces dominate which results in chaotic flows. If Re ¿ 1,
viscous forces are predominant resulting in laminar flows, where streamlines never cross.
Based on the small dimensions of micro systems, the Re of microfluidic systems is usually
less than 1 representing the conditions of perfect laminarity. This allows finely control of
the flow trajectories and parallel flow even of miscible liquids. This is of advantage for many
microfluidic systems for chemical applications such as the microfluidic H-filter [6] or the field
of optofluidics [7–9]. On the other hand, the laminar flow conditions allow mixing only by
diffusion, which is much slower than what we expect in such confined volumes. Fast mixing
of liquids in microfluidic devices asks for special geometries [10, 11].
Capillary number
On the micro scale the relative effect of viscous forces and surface tension forces acting across
an interface between two immiscible fluids becomes important. Their ratio is described by
the capillary number [1], which is defined as
Ca = viscous forces
surface tension forces= ηv0
γ, (1.10)
where η is the dynamic viscosity [N ·m−2 · s], v0 the characteristic fluid velocity [m · s−1] and γ
is the interfacial tension [N ·m−1].
For Ca ¿ 1 the flow is dominated by capillary forces and interfacial tension. Droplet generation
in a continuous two-phase flow becomes feasible [1, 12]. A critical capillary number for droplet
generation of 10−3 was given by [4].
Bond number
Another dimensionless number is the Bond number, which compares gravity to interfacial
tension. The Bond number is defined as [1]
Bo = gravitational forces
surface tension forces= ∆ρg L2
0
γ, (1.11)
where ∆ρ is the difference of the densities of the involved liquids, g the gravitational accelera-
tion, L0 a characteristic length, and γ the interfacial tension.
For Bo ¿ 1 the flow is dominated by interfacial tensions and the gravity can be ignored.
4

1.2. Microfluidic Systems Involved in Real Sample Analysis
1.2 Microfluidic Systems Involved in Real Sample Analysis
Since complete microfluidic systems for analysis were first presented [13], they have been
called miniaturized total-analysis-systems (µTAS) or more general lab-on-a-chip (LOC) de-
vices. Typically they include a system of fluidic channels, sites for chemical or biological
reactions and detections, alongside with pumping elements and electronics for data acqui-
sition and control. Balslev et al. of MIC-DTU Denmark presented a nice example of an
integrated LOC system for optical analysis of chemical reactions (see Figure 1.1) [14]. This
system is a hybrid polymer/silicon device based on a silicon substrate containing integrated
photo diodes, while the laser, the waveguides, a mixer, and the microfluidic channels are
made in a SU-8 polymer film on top of the substrate. This section will give an overview of
commercially available devices, a more specific state of the art of microfluidic devices for
saliva analysis and a list of examples of microfluidic chips used together with IR-detection.
Figure 1.1: LOC device with integrated microfluidic dye laser, optical waveguides, microfluidicnetwork, and photodiodes. [14]
1.2.1 Commercialized Microfluidic Systems
For several microfluidic applications – mostly in biology – devices have been commercialized.
Here we like to highlight some examples: Caliper Life Sciences has focused much energy on
providing microfluidic chips for separation and analysis of DNA [15]. BioTrove developed a
device to perform thousands of nanoliter-volume PCRs [16]. Some companies have moved
away from DNA-and protein-based microfluidics. Cellix, founded in 2004, provides a chip with
microfluidic channels which mimic the in vivo conditions of blood vessels [17]. An overview
of companies which entered successfully the microfluidic market is presented in [18].
There are systems available which use for pumping the capillary effect such as the autonomous
chip "ABORh-Card" of Micronics [19] shown in Figure 1.2a. The fully-integrated, credit card
sized device is used to determine the presence of human blood group antigens during blood
transfusions. Otherwise also complete systems with disposable microfluidic chips together
with a chip holder and external pumping are provided as for example the "Fluidic Connect
Pro" of Micronit Microfluidics [20] presented in Figure 1.2b.
5

Chapter 1. Introduction
(a) ABORh-Card of Micronics based on capillarypumping [19].
(b) Chip holder for external pumping of MicronitMicrofluidics with disposable microfluidic part [20].
Figure 1.2: Commercialized microfluidic devices with active and passive pumping.
(a) iSTAT system for detection of electrolyte levelsand limited immunoassays [22].
(b) Disc-based microfluidic system for blood analy-sis sold by Abaxis [23].
Figure 1.3: Commercialized POC devices with readout unit and disposable microfluidic part.
Microfluidic point-of-care diagnostic devices represent a large part of commercialized systems.
Here most popular are the lateral flow tests, which use a membrane or paper strip to indicate
the presence of protein markers in a liquid. They also work with capillary action, they form a
visible band and are interpreted by eye only e.g. the product of Diagnostics For All [21] which
is in development. Otherwise the systems commonly include a readout unit and a low-cost
disposable microfluidic chip as presented in Figure 1.3. The iSTAT system was one of the first
commercially available LOC products. It combines miniature fluidics and electrochemical
detection of electrolyte levels and limited immunoassays [22]. Abaxis used the compact disc-
based approach for blood chemistry analysis to test for small molecule and protein markers
for different diseases [23]. In [2] a broad review of commercialized point-of-care diagnostic
devices together with potential systems in development is presented.
Although a large part of the excitement behind microfluidics is in its potential for practical
applications, surprisingly only few LOC-based systems have been successfully introduced in
6

1.2. Microfluidic Systems Involved in Real Sample Analysis
the market so far [2]. There is a huge growth over the last years [1], but the so called "killer
application" as the accelerometers in MEMS, has not been established yet. George Whitesides
of Harvard University believes the solution will be found through an application: "We need to
find applications where it is the result that is the value, not the device." [18]
1.2.2 Saliva Analysis with Microfluidic Devices
Saliva can be collected easily in a non invasive way and drugs have a well defined ratio
between the concentration in blood plasma and saliva [24]. That is why many research
groups work with saliva as diagnostic fluid in microfluidic devices. They look for various
analytes, but mainly for small molecules dissolved in saliva. Different detection techniques like
optical, electrophoretic, chromatographic, electrochemical, immunochemical, or preencoded
microbead-based techniques are investigated. Table 1.2 provides an overview of the reported
techniques together with the associated analytes and the research group working on this
technique.
The Groups of Yager and Wong focus on surface plasmon resonance imaging (SPRI) [25–27].
Researchers around Singh, Niki and Landers explore electrophoretic techniques [28–31] and
Bhansali is using electrochemical detection. The group of Bau approaches the topic with
chromatography [32–34]. Several other groups functionalize microarrays or microbeads and
choose optical detection also using fluorescence.
Nowadays, there are already quite a number of different (mainly immunoassay based), lateral
flow tests or so called drug test strips commercially available for saliva, e.g. DrugWipe®,
Cozart®, OraSure® (see section 1.2.1).
These lateral flow tests are lacking on reliability. Evanescent field spectroscopy (SPRI) seems to
be the most promising technique to detect molecules in saliva. This technique is independent
of the charge/polarizability of the sample (unlike electrophoretic methods), generates a
directly detectable signal without time delay (unlike chromatographic techniques), does
not need any functionalization (unlike immunoassays) and is label-free (unlike fluorescent
label based optical techniques). Evanescent field methods are favored to techniques where
the light is sent through the sample due to the high absorption of IR radiation in water (see
Figure 1.6 in section 1.4).
There are also research groups detecting cocaine in microfluidic devices. Scheller and Stemme
are using mass sensitive piezoelectric/amperometric sensors, called quartz crystal microbal-
ance (QCM) in combination with an immunoassay. They are able to detect 10−7 −10−9M of
cocaine in water or buffers within 20min [35, 36]. Wang presented an electrochemical device
based on functionalized nanoparticles to detect cocaine in centrifuged saliva with a limit of
detection of 10−7M (= 40ng /mL) [37]. Techniques using functionalization show a good limit
of detection but not with a reasonable time-to-result.
7

Chapter 1. Introduction
Table 1.2: Techniques of saliva analysis in microfluidic devices.
Detection TechniqueSaliva Preparation
Analytes in Saliva Channel dim.[µm]depth/with/length
Res. Group
Surface Plasmon Resonance Imaging - SPRIfiltering:syringe filter, ultra filtration, microfluidic H-filter
small molecule analytes(hormones, drugs metabolites,pathogens and markers of oral can-cer, protein markers of systemic disease,drug monitoring of antiepileptic drugs)
62/3600/60000 Yager [25, 26]
Surface Plasmon Resonance Imaging - SPRIadding protease inhibitors for sample preservation,centrifugation
interleukin-8(protein secreted by cells)
50/500/2400 Wong [27]
Electrophoretic immunoassaywith fluorescence detection readoutoff-chip: centrifugation, on-chip: filtration
protein bio-markers of periodontal dis-ease
∼70/∼70/n.a. Singh [28]
Electrophoresismembrane filtration
bio-markers for oral diseases(pathogens like porphyromonas gingi-valis, tanerella forsythensis, treponemadenticola)
25/100/n.a. Singh [29]
Electrophoresisdiluting: 10% saliva in distilled water
NO-metabolites n.a./n.a./25000 Niki [30]
Capillary Electrophoresispreconcentration, centrifugation, filtration,diluting: 25% saliva, 10% 0.1M HCl
hydroxyl radical bio-markers 250/1500-2000/2800(trapezoidal shape)
Landers [31]
Chromatography with optical detection (UpLink reader)on-chip: cell lysis
bacterial pathogens 250-500/250-500/n.a. Bau [32]
Chromatography with optical detection using UPT(Upconverting Phosphor Technology)
some filtration by using OraSure® collector
pathogens n.a. Bau [33]
Chromatography using immobilized proteinswith fluorescence detection readoutdilution
antibodies of HIV 380/var./var. Bau [34]
Magnetic bead-based microfluidic platformwith fluorescence detection readoutcell lysis
gDNA(genetic detection)
n.a. Lee [38]
Preencoded microbead-based detectionwith fluorescence detection readoutdilution
interleukin-8 380/var./var. Bau [34]
Microsphere-based antibody arraywith fluorescence detection readoutcentrifugation
bio-markers(inflammatory cytokines)
chamber Walt [39]
Electrochemical detection using functionalized electrodesfreeze-thawing, centrifugation
cortisol chamber Bhansali [40]
Electrochemical detection using functionalized nanoparticlescentrifugation
cocaine chamber Wang [37]
Pattern-based microarrays with optical readoutanalysis in aqueous solution
peptides array of wells Anslyn [41]
Test strip based optical fiber microarrayn.a.
bio-markers for renal and pulmonarydisease
test strips Walt [42]
Gel-based microarrayn.a.
microbial species diffusion system Stahl [43]
Quantum dot bioconjugate microarraywith fluorescence detection readoutdilution 25% in PBS
proteins(cancer markers)
n.a. McDevitt [44]
Immunochemical-based test strip, DrugWipe®
n.a.cocaine n.a. Samyn [45, 46]
Enzyme immunoassay, Cozart®
n.a.cocaine and its metabolites n.a. Cooper [47]
Enzyme-linked immunoassay, OraSure®
n.a.cocaine metabolites n.a. Kidwell [48]
8

1.2. Microfluidic Systems Involved in Real Sample Analysis
(a) Piezoactuated flow-through micro dispenser for off-line liquidchromatography [59].
(b) Experimental setup and micro machined flow cell for on-line capillary electrophoresis [55].
Figure 1.4: Microfluidic sample preparation used in combination with IR detection.
1.2.3 Microfluidic Chips used in Combination with IR-Detection
The combination of IR-light-based analyte detection with microfluidic systems represents an
extraordinary effort, mainly due to the poor availability of materials for microfluidic chips
which are transparent at wavelengths of the required IR spectra. However, this combination
would result in strong qualitative analyte identification and complement the separation
information [49].
Microfluidic separation techniques have been combined with IR detection methods such as
IR spectroscopy, Fourier transformed IR spectroscopy (FT-IR), attenuated total reflection IR
spectroscopy (ATR-IR) or the related surface enhanced Raman spectroscopy (SERS). Chro-
matography based separation techniques such as liquid chromatography, high performance
liquid chromatography or size exclusion chromatography, are the mostly applied separation
methods [50–53]. The chromatography approach looks promising, but it is hard to integrate
the long channels on a small microfluidic chip. Also electrophoretic separation techniques
such as capillary electrophoresis (CE) and sequential-injection-capillary electrophoresis (SI-
CE) are tested [53–58].
The separation method is either performed off-line with an independent system such as
the piezoactuated flow-through micro dispenser shown in Figure 1.4a or on-line integrated
together with the detection device such as the presented capillary electrophoresis system in
Figure 1.4b.
9

Chapter 1. Introduction
Figure 1.5: Concept of the integrated sensing platform for fluids based on IR spectroscopy.
1.3 Project IrSens
The work of this thesis is part of the integrated project IrSens, which is scientifically evaluated
by the Swiss National Science Foundation (SNSF), financed by the Swiss Confederation and
funded by Nano-Tera. The project started in 2009 for a duration of four years under the full
title "Integrated sensing platform for gases and liquids in the near and mid-infrared range".
This section provides an overview of the project including a short description of the objectives
and the concept, the project relevance and a list of involved partners (adapted form the project
description). Further information can be found on www.nano-tera.ch.
1.3.1 Objectives & Concept of the Project
The IrSens project aims to design and build an integrated optical sensor platform with high
performance and reliability which will leverage on the new source, detector and interaction
cell technologies to create a new sensor element with improved performance and lowered
cost. The improvements will be demonstrated by two pilot applications, the first one sensing
in the gas phase, the second one sensing in the liquid phase.
The compact sensing platform for gases is based on a multi path absorption cell with various
compact semiconductor light source and detector types. Infrared absorption spectroscopy
can be used to detect a wide variety of gases. To demonstrate its suitability for breath analysis,
the first part of this project is focused on the detection of exhaled CO2.
The integrated sensing platform for fluids is based on IR laser spectroscopy as well. The idea is
to couple the light source and the detector to an optical module where the analyte in liquid
will flow through a built-in microfluidic channel as shown in Figure 1.5. The microfluidic
system will take care of the on-chip sample pretreatment as well. To improve the limit of
detection and increase the analyte concentration the analyte has to be transfered to a less
absorbing solvent by liquid-liquid extraction. This sensing platform is intended to be used
mainly in bio-medical applications with an emphasis on detection of drugs and doping agents
10

1.4. Objectives of this Thesis
in human body fluids: specifically, a first targeted demonstrative application for this sensor
would be the cocaine detection in human saliva.
1.3.2 Relevance of the Project
There is an increasing demand for sensitive, selective, and portable detectors to trace com-
ponents in gases and liquids, e.g. due to increasing concerns about atmospheric pollutants,
and a need for improved medical screening capabilities for early detection of diseases and
abuse of drugs. In this context, the project IrSens aims building a platform based on optical
spectroscopy in the near and mid-infrared range. This method allows probing the vibrational
frequencies of the targeted molecules - most of which are located in the near and mid-infrared
range, and to obtain an unambiguous signature of the investigated gas or liquid. Section 1.2
already highlighted the advantages of a microfluidic system for integrated sample preparation
such as portability, automation, reduction of the sample and reagent volume. Furthermore,
this section also presented the huge pool of new available techniques as well as the potential
for commercialization of microfluidic systems.
1.3.3 Involved Partners and their Roles
In the Nano-Tera project IrSens nine groups of five Swiss research institutes are involved
working towards two pilot applications for a gas and liquid sensing platform. Table 1.3 gives
an overview of their main tasks.
1.4 Objectives of this Thesis
As mentioned in section 1.3, the aim of this research in the framework of the project IrSens
is to develop a portable microfluidic system for cocaine detection in human saliva by IR-
spectroscopy.
A low-cost, disposable chip is required which is easy to fabricate. Therefore, the chip material
is chosen to be a polymer. Polymers are challenging materials and require specific character-
ization. Not only the material itself, but also the fabrication process should be simple and
low-cost, thus rapid prototyping is investigated.
The cocaine is detected by absorption IR-spectroscopy. Unfortunately saliva (99% water)
is strongly absorbing where the characteristic absorption peak of the cocaine molecule is
located (shown in Figure 1.6). So one of the tasks has been to come up with a microfluidic
sample pretreatment design to bring the cocaine from saliva to an IR-transparent solvent by
liquid-liquid extraction.
For better extraction efficiency due to the larger liquid-liquid interface I followed the approach
of droplet-based liquid-liquid extraction. Therefore, I produced first droplets of the organic
solvent (acceptor phase) tetrachloroethylene (PCE) in saliva (donor phase) containing cocaine
11

Chapter 1. Introduction
Table 1.3: IrSens project partners and their tasks.
Main task Partner
Development of near- and mid-infrared optical sources
Development of quantum cascade laser (QCL) Group of Jérôme Faist, ETHZ
Development of vertical-cavity surface-emitting laser (VC-SEL)
Group of Eli Kapon, EPFL
Development of the detection system
Development of quantum cascade detectors (QCD) Groupe of Daniel Hofstetter, UniNe
Signal analysis Group of Edoardo Charbon, EPFL
Herbert Looser, FHNW
Development of a compact and portable optical sensorfor human breath analysis
Benchmark setup Group of Markus Sigrist, ETHZ
Demonstrator device Group of Lukas Emmenegger, EMPA
Development of a compact and portable optical sensorfor liquids
Benchmark setup Group of Markus Sigrist, ETHZ
Waveguide based optical detection Group of Hans Peter Herzig, EPFL
Microfluidic sample preparation Group of Nico de Rooij, EPFL
Figure 1.6: Top: Absorption spectra of water and overlapping an over-saturated suspension[1.3mg /mL] of cocaine in water. Bottom: Absorption spectra of the cocaine suspension withsubtracted water background. Cocaine shows two strong absorptions peaks at around wavenumber 1700cm−1, but only the left one at 1750cm−1 is characteristic. The other overlapswith an absorption peak of caffeine.
12
1.4. Objectives of this Thesis
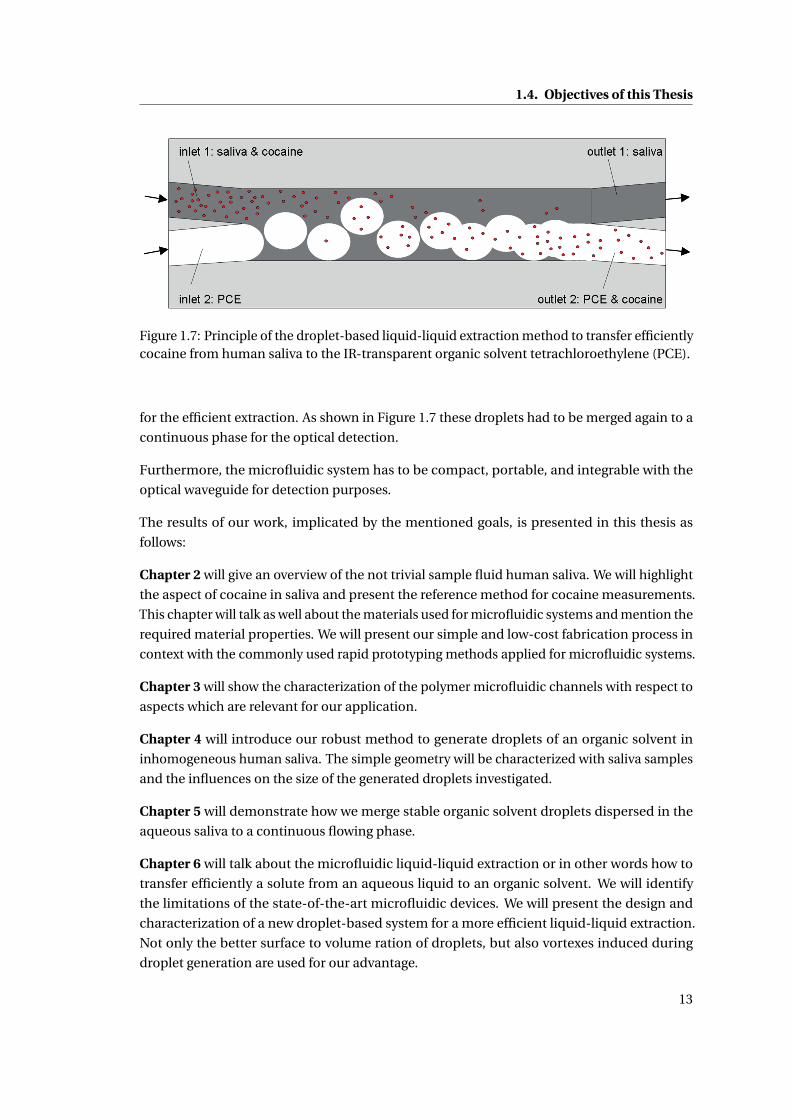
Figure 1.7: Principle of the droplet-based liquid-liquid extraction method to transfer efficientlycocaine from human saliva to the IR-transparent organic solvent tetrachloroethylene (PCE).
for the efficient extraction. As shown in Figure 1.7 these droplets had to be merged again to a
continuous phase for the optical detection.
Furthermore, the microfluidic system has to be compact, portable, and integrable with the
optical waveguide for detection purposes.
The results of our work, implicated by the mentioned goals, is presented in this thesis as
follows:
Chapter 2 will give an overview of the not trivial sample fluid human saliva. We will highlight
the aspect of cocaine in saliva and present the reference method for cocaine measurements.
This chapter will talk as well about the materials used for microfluidic systems and mention the
required material properties. We will present our simple and low-cost fabrication process in
context with the commonly used rapid prototyping methods applied for microfluidic systems.
Chapter 3 will show the characterization of the polymer microfluidic channels with respect to
aspects which are relevant for our application.
Chapter 4 will introduce our robust method to generate droplets of an organic solvent in
inhomogeneous human saliva. The simple geometry will be characterized with saliva samples
and the influences on the size of the generated droplets investigated.
Chapter 5 will demonstrate how we merge stable organic solvent droplets dispersed in the
aqueous saliva to a continuous flowing phase.
Chapter 6 will talk about the microfluidic liquid-liquid extraction or in other words how to
transfer efficiently a solute from an aqueous liquid to an organic solvent. We will identify
the limitations of the state-of-the-art microfluidic devices. We will present the design and
characterization of a new droplet-based system for a more efficient liquid-liquid extraction.
Not only the better surface to volume ration of droplets, but also vortexes induced during
droplet generation are used for our advantage.
13

Chapter 1. Introduction
Chapter 7 will present the integrated sensing device for cocaine detection in human saliva. It
will show the integration of the microfluidic system for sample pretreatment together with the
IR-laser detection by means of an optical waveguide crossing the microfluidic channel.
Chapter 8 will summarize the findings of this research and give an outlook on the future of
the developed liquid-liquid extraction system.
14

2 Materials & Methods
This chapter gives an overview of human saliva. It presents the advantages of this body fluid as
a matrix for the analysis of small molecules such as cocaine, but also identifies the numerous
challenges we are facing to when using saliva in microfluidic devices. We highlight the aspect
of cocaine in saliva and define our reference method for cocaine measurements. This chapter
also presents the materials commonly used for microfluidic devices and mentions the required
material properties for point-of-care devices. NOA81 is the polymer material we have chosen
to work with. Here we present the appropriate, low-cost, highly flexible, and time-efficient
rapid prototyping method we developed for this UV-curable polymer to fabricate microfluidic
systems for research applications.
2.1 Human Saliva
This section presents background information found in literature about the human body fluid
saliva which is the matrix of our analyte cocaine. Of course also some data about cocaine
itself are listed. In addition we determined some project relevant characteristics of human
saliva before and after pretreatment. Furthermore, the sample collection and preparation is
discussed.
2.1.1 Composition of Human Saliva
Basically saliva refers to the complex mixture of body fluids originating from the salivary
glands, the gingival fold, oral mucosa transudate, and the mucous of the pharynx (throat) and
the nasal cavity. One of the primary function of saliva in the oral cavity is lubrication, which
supports eating, swallowing, and speech [60].
Salivary fluid is an exocrine secretion and has been described as a diluted polymer (mucin)
solution containing long entangled molecule chains, some of which are bonded by secondary
chemical interactions [61, 62]. The composition and consistency of saliva varies greatly
15

Chapter 2. Materials & Methods
between and also within individuals. The saliva composition changes over time as well as with
different levels of physical activity [63, 64].
Saliva consists of approximately 99% water. It contains a variety of electrolytes and proteins,
represented by the relatively large mucosal glycoproteins, the enzymes, the immunoglob-
ulins, and some smaller polypeptides and oligopeptides of importance to oral health. In
saliva are also enclosed nitrogenous products, such as urea and ammonia, some traces of
hormones, non-adherent oral bacteria and human cells like epithelial cells as well as blood
cells. Furthermore, you find therein food debris as well as traces of medications or chemical
products [65, 66]. The components listed above generally occur in small amounts and their
concentration varies with changing saliva secretion flow rate [67].
Table 2.1 shows the composition of human saliva. It is not possible to indicate the exact
composition, neither to give a lot of verified concentrations. This domain is not so deeply
investigated and the significant inter-subject and intra-subject variations make the characteri-
zation difficult.
2.1.2 Cocaine in Human Saliva
Cocaine (C17H21NO4), chemically known as [1R−(exo,exo)]−3−(benzoyl ox y)−8−methyl−8 − azabi c ycl o[3.2.1]oct ane − 2 − car box yl i caci dmethyl ester , is a relatively compact
molecule and shows a molecular weight of 303.4Da. Its skeletal model is shown in Figure
2.1. Cocaine exists in several forms: as free base alkaloid or as cocaine hydrochloride (salt
form). One gram of the free base cocaine dissolves in 600mL water, 6.5mL alcohol or 0.7mL
chloroform. The hydrochloride form is much more soluble. One gram dissolves in 0.4mL
water, but it is also much less stable and decomposes fast. The hydrochloride is not heat- and
light-resistant.[68]
Figure 2.1: Skeletal model of a cocaine molecule [68].
At human physiological pH (7.35–7.45), the tertiary amine group of cocaine would be proto-
nated resulting in a net positive charge. The pKa(15°C) of cocaine is at a pH value of 8.61. In the
human body, the active cocaine degenerates. The primary metabolites of cocaine are called
benzoylecgonine, norcocaine, ecgonine methyl ester, and are formed in the liver. Parallel
consummation of cocaine and alcohol results in a still active molecule called cocaethylene.
16

2.1.H
um
anSaliva
Table 2.1: Composition of human saliva with cocaine.
component weight unstimulated concentration stimulated conc. radius
water 18Da [69] 99% [65]
electrolytes sodium Na+ 0.022kDa [69] 2−26mmol/L [24] 13−80mmol/L [24] 1.02Å [69]
potassium K+ 0.039kDa [69] 13−40mmol/L [24] 13−38mmol/L [24] 1.51Å [69]
calcium Ca2+ 0.040kDa [69] 0.5−2.8mmol/L [24] 0.2−4.7mmol/L [24] 1.12Å [69]
chloride Cl− 0.035kDa [69] n.a. n.a. 0.08Å [69]
magnesium Mg2+ 0.024kDa [69] 0.15−0.6mmol/L [24] n.a. 0.72Å [69]
bicarbonate HCO−3 0.061kDa [69]
phosphate PO3−4 0.094kDa [69] n.a. 1.5−25mmol/L [24] n.a.
proteins enzymes α-amylase 46−60kDa [70] ++++ n.a. n.a.
0.4g /L (0.008mmol/L) [24]
lysozyme 14kDa [70] + n.a. n.a.
kallikrein n.a. + n.a. n.a.
statherins 5.400kDa [71] ++ n.a. n.a.
cystatins n.a. ++ n.a. n.a.
proline-rich proteins PRPs (proline C5 H9 NO2) 6−36kDa [70] ++++ n.a. n.a.
immunoglobulins secretory immunoglobulin A/sIgA 155kDa [70] +++ n.a. n.a.
194mg /L (0.001mmol/L) [24]
immunoglobulin G/IgG 144kDa [70] + n.a. 53Å [24]
14.4mg /L (0.0001mmol/L) [24]
immunoglobulin M/IgM 70kDa [72] + n.a. n.a.
2.1mg /L (0.00003mmol/L) [24]
immunoglobulin D/IgD n.a. + n.a. n.a.
immunoglobulin E/IgE n.a. + n.a. n.a.
glycoproteins mucosal glycoproteins/MG1,MG2 2−40∗103kDa [73], ++++ n.a. n.a.
150−200kDa [70] 0.001% [24]
extra-parotid glycoprotein 18−20kDa [70] + n.a. n.a.
haptocorrin 60−80kDa [70] + n.a. n.a.
zinc-α2-glycoprotein 41kDa [70] + n.a. n.a.
albumin 67.500kDa [70] + n.a. 36Å [24]
β-microseminoprotein 11kDa [70] + n.a. n.a.
nitrogeneous urea CO(N H2)2 60.060kDa [69] 3.4mmol/L [74] n.a. n.a.
products ammonia N H3 17.031kDa [69] 2−6mmol/L [75] n.a. n.a.
hormones estrogens 0.270−0.288kDa n.a. n.a. n.a.
progestins n.a. 100−800pmol/L [24] n.a. n.a.
androgens n.a. n.a. n.a. n.a.
corticosteroids n.a. 9−27nmol /L [24] n.a. n.a.
lipids n.a. 8−10mg /100mL [24] n.a. n.a.
cells human n.a. ∼ 8mi l l i on/mL n.a. 2−25µm [76]
bacterial n.a. ∼ 500mi l l i on/mL n.a. 0.1−2.5µm [76]
3.75∗105 colony forming uni t s/mL [77]
cocaine 0.303kDa [78] > 1µg /mL [45, 79, 80] n.a. n.a.
n.a: no certified values found (+) <1%, (++) 1–5%, (+++) 5–15%, (++++) >15% of total protein amount in saliva [70]
17

Chapter 2. Materials & Methods
Figure 2.2: Metabolites of cocaine [82].
When smoking cocaine (pyrolysis) anhydroecgonine methyl ester is formed. Figure 2.2
presents the different metabolites resulting from cocaine degeneration. [81, 82]
Cocaine is produced from the leaves of the plant Erythroxylon coca or by synthesis. Today
Colombia is the world’s leading producer of cocaine. More than three–quarters of the world’s
annual yield of cocaine has been produced in Colombia, both from cocaine base imported
from Peru or Bolivia, and from locally grown coca plants.
There are different ways of consumption. Cocaine is swallowed, smoked, injected or sniffed.
It is an appetite suppressant, an anesthetic and a powerfully addictive stimulant drug that
increases the level of dopamine, a brain chemical associated with pleasure and movement, in
the brain’s reward circuit. It makes the consumers feeling really euphoric. After this first effect,
the consumers fall into a depression. This behavior is mostly responsible for the addiction
already after the first contact. Abusing cocaine has a variety of effects on the human body,
such as constricted blood vessels, dilated pupils, and increased body temperature, heart rate,
and blood pressure.
In Switzerland cocaine is an illegal drug and a zero tolerance policy is followed [83]. The Amer-
ican Substance Abuse and Mental Health Services Administration (SAMHSA) has proposed an
oral fluid screening cutoff of 20ng /mL with cocaine as the target analyte [84, 85].
Samyn et al. showed in an on-site study of 6 subjects (3 smoking, 3 intranasal applications) that
for cocaine users, the saliva concentrations of cocaine exceeded 1000ng /mL (2–4 hours after
the last drug abuse) [45]. Cooper et al. found 28−360ng /mL cocaine and 18−263ng /mL of
18

2.1. Human Saliva
the metabolite benzoylecgonine in saliva samples of cocaine users [47]. To test drug detectors
Wang et al. prepared sample concentrations of 12.5−1000ng /mL [82]. In general drugs have
a well defined ratio between the concentration in blood plasma and saliva [24]. For cocaine
the oral fluid to blood concentration ratio is about 3, slightly increasing with time [86, 87].
Up to three hours after consumption traces of cocaine remain in the mouth (not when injected).
Already after one hour, cocaine is extracted from blood by saliva glands and secreted again into
the oral cavity. The half-life of cocaine is roughly 0.7−1.5h. The time, which cocaine remains
detectable can vary depending on factors like the weight, age, health of the consumers and
frequency of use of the drug. Generally speaking it is detectable in saliva, blood, and urine for
some days and in hair even for months [79, 88].
2.1.3 Collection and Preparation of Human Saliva Samples
This section explains the background of saliva sample collection, reports on its advantages
and disadvantages, and presents the conditions under which samples are usually collected.
Different methods to collect bigger amounts of saliva are explained and compared in terms of
the flow rate. An overview on the most important saliva collector types for lab analysis is given
and some commercially available tools are listed. The last section presents the state of the art
of commonly used saliva sample preparation steps.
Why Collecting Saliva Samples?
To date, oral fluid screening systems for the detection of drugs of abuse have been used in only
a few countries, but now an increasing number of countries are planning to introduce them as
a legal screening device [89].
Collecting saliva as diagnostic fluid brings along many amenities. The main advantage is
the non-invasive and painless collection of samples. Therefore, they can be obtained more
frequently than it would be practical with blood tests. To monitor the patient’s health and the
disease state in shorter time intervals is a highly desirable goal for health care research and
health promotion.
Compared with other techniques as blood sampling, saliva is easy to handle, because it does
not clot. Only minimal trained personal is required (cost factor). Depending on the application
even the ability for self-collection outside of the clinical setting exists.
Small and simple devices can be used for saliva collection and the hygienic standards are less
demanding than for blood tests, which facilitates point-of-care (POC) testing. For on-site drug
testing, the police can take saliva and urine samples. Saliva is preferred to get a snap shot view
of the analyte concentration in the body to probe recent consumption whereas urine gives
more information about consumption some days ago, which is more interesting for workplace
testing and doping tests in sports.
Furthermore, an increasing number of systemic diseases and conditions have been shown
to be reflected diagnostically in saliva. Some substances may reach saliva by passing from
19

Chapter 2. Materials & Methods
Figure 2.3: Saliva is produced in the sublingual, the submandibular, and the parotid glands.Within each of them, a fine mesh of capillaries surrounds a network of ducts that carry salivato the mouth. Blood vessels that crowd around the lobed structures make transferring water,salts, and many circulating proteins and molecules. [90]
blood through the spaces between cells (see Figure 2.3). Hence, most compounds found in
blood are present in saliva as well. This way, oral fluids can be viewed as a filtrate of blood.
Especially, saliva represents a window to the human body for small molecular weight analytes
[64]: correlations between salivary and blood serum concentrations have been established
for several pharmaceuticals [6]. Also a variety of drugs of abuse levels, including those of
marijuana, cocaine, and alcohol, can be monitored [25, 91–93].
In conclusion, saliva is an emergent diagnostic fluid for medical and forensic applications as
depicted above, but it also shows some disadvantages. The main drawback is the unstable
and low concentration of most analytes in saliva. Finally, it is also a matter of the acceptance
in public. There are behavioral perception and cultural reservations against using saliva. In
western countries, for example, the act of spitting is taken as an insult, whereas in some other
cultures it can be considered a blessing. [92]
Conditions for the Saliva Collection
The conditions in the oral cavity (influenced by smoking, meals, and drinks) strongly have an
impact on the composition and behavior of saliva. In addition the composition varies with the
saliva flow as explained in section 2.1.1.
Therefore, conditions of collection as similar as possible have to be taken into consideration
to get comparable measurements. Common guidelines for saliva sample collection do not
exist. Different studies follow different instructions, but over all the rules are within the
same scope: saliva samples are usually collected before brushing teeth and applying make-
up (lipstick). The subjects should refrain from smoking, eating, and drinking for 1–2 hours.
20

2.1. Human Saliva
As a preparation step the mouth is rinsed with cool water to remove food debris and other
non-salivary contaminants. [27, 40, 94]
Methods for Collecting Whole Saliva Samples
Traditionally several methods are used for the collection of large quantities of whole mouth
saliva (the liquid with all ingredients as it appears in the oral cavity). Usually for all of them
the subjects are instructed to tilt their heads forward, keep the eyes open and make as few
movements as possible. [94]
Draining Method The saliva drains out between parted lips into a receptacle held near the
mouth.
Spitting Method The saliva is collected in the oral cavity behind closed lips and is expecto-
rated repeatedly into a receptacle.
Suction Method A tube can be used to suck saliva from under the tongue, the floor of the
mouth into a vessel.
Swab Method Cotton (or synthetic) swabs are inserted under the tongue to absorb saliva
collection on the floor of the mouth.
Stimulated versus Non-Stimulated Collection
The average of total daily flow of saliva ranges from 0.5−1.5L, depending on the individual
[65]. There are daily and annual variations of the flow rate. Low flow rates occur during sleep,
whereas peaks occur during high activity or stimulation periods. In general, in summer the
flow is much smaller compared to the flow rate in winter time [67, 95]. Also opened/closed
eyes, the position and angle of the head, as well as the extent of movements influence the
salivary flow rate [94].
Gustatory and masticatory stimuli increase the salivary flow at the collection. For detection of
analytes in saliva non-stimulated samples are preferred due to the higher concentration of the
molecules of interest. Navazesh et al. measured the flow rate of stimulated and non-stimulated
saliva collection methods [94]. In a study they compared the different collection methods and
found that resting salivary flow values were roughly equivalent for all the mentioned collection
techniques (see Table 2.2).
Based on the spitting technique, different methods of salivary stimulation were evaluated; two
gustatory methods (drops and filter paper) and one masticatory method (chewing). The first
gustatory stimulus was a 0.1M citric acid solution (0.17g ) applied as droplets on the tongue.
For the filter paper method, 0.1mL of the citric acid solution was applied on a filter paper disc
(diameter = 2cm) which was then gently pressed on the tongue. As masticatory stimulus a
polyvinyl acetate gum base was used for chewing at a rate of 20str okes/mi n.
21

Chapter 2. Materials & Methods
Table 2.2: Whole mouth salivary flow rates for different collection methods. [94]
Collection Methods Flow Rate (g /mi n)
Draining Method 0.47 ± 0.06
Spitting Method 0.47 ± 0.06
Suction Method 0.54 ± 0.12
Swab Method 0.52 ± 0.08
Table 2.3: Whole mouth salivary flow rates for different methods of salivary stimulation. [94]
Stimulation Methods Flow Rate (g /mi n)
Drops Method 2.64 ± 0.22
Filter Paper Method 1.51 ± 0.21
Chewing Method 2.38 ± 0.52
The stimuli induce significantly higher salivary flow rates compared to resting levels, but also
the between- and within-subject variances were higher. As shown in Table 2.3 stimulation
produced a remarkable higher flow rate, whether individual resting flow rates at the beginning
were low or high.
After around five minutes stimulating the flow, saliva gets highly diluted. Due to this dilution,
stimulating will inevitably also change the pH and concentration of the analyte in the oral
fluid. For instance for cocaine, the concentration lowers about five-fold [96].
To conclude the way of saliva collection is not crucial. The quantity is given by the natural flow
rate of saliva and is independent of the collection method [94]. The flow rate (rate of secretion)
can be stimulated but that tends to dilution after a few minutes of collection (lower analyte
concentration).
Commercially Available Saliva Collection Tools
Whole saliva collected as mentioned in the section "Methods for Collecting Whole Saliva
Samples" is often contaminated with food and other debris from the mouth, and is also
relatively viscous. This is why it can be difficult to work with saliva in the laboratory. In addition,
the collected volume will often be less than 1mL. To handle these challenges the following
three general saliva collecting methods got established: wipe collectors, swab collectors, and
collectors on device. In the following subsections, each type is described and illustrated with
an example. Table 2.4 presents a selection of commercially available collectors reported in
22

2.1. Human Saliva
literature. Most of them are used for immunoassay based drug tests. The detection limit for
cocaine is also reported in Table 2.4 as well.
Wipe Collectors The subject wipes or just places a cotton or foam pad collector mounted on
a stick in the mouth and let it draw oral fluid. Usually a container is also provided for
the later transport to the lab. Some of these containers are empty and only seal against
contamination, sometimes they contain liquid preservatives to stabilize and dilute the
samples. As an example Figure 2.4 shows the wipe saliva collector OraSure®.
Figure 2.4: Wipe saliva collection tool: OraSure®; white pad collector on blue stick providedwith transportation bag containing liquid preservatives. [97]
Swab Collectors Using the swab collectors the subject is asked to chew for a certain time
on the swab which draws saliva. The masticatory motion stimulates the salivary flow
primarily and in addition the swabs are also available prepared with citric acid for
gustatory stimulation (refer to section 2.1.3). Figure 2.5 shows the commonly available
swab collector called Salivette®. Here the subject places the cotton swab in the mouth,
chews it for about 1 minute, and put it then into the Salivette® tube within a closable
insert. After saliva extraction in the lab (e.g. by centrifugation), this closed inner tube
containing the swab can be hygienically disposed.
Figure 2.5: Swab saliva collection tool: Salivette® system with stopper, swab, insert, andSalivette® tube (left to right). [98]
Collector on device Collection and testing are here integrated in one device. During the test
(holding or wiping in mouth), saliva is collected directly at the collection pad on the
device, which eliminates sample adulteration or contamination. As an example of such
an integrated collector the device OraTect® is presented in Figure 2.6.
Figure 2.6: Collection on device tool: OraTect®. [97]
23

Chapter 2. Materials & Methods
Table 2.4: Selection of collectors reported in literature (roughly split into the presented meth-ods; wipe collectors, swab collectors, and collectors on device) [64, 99, 100]. For immunoassaybased drug tests the detection limit for cocaine is indicated.
Name of collector Method of operation cocaine det. limit
OraSure® wipe and preservative diluent 1.5ng /mL [48]
Oracol absorbent foam swab which is then cen-trifuged
n.a.
DrugWipe® wipe only (tongue or skin) 50ng /mL [101, 102]
Cozart® collector absorbent foam pad plus diluent 10−300ng /mL [103]
Dräger Drug Test® absorbent foam pad with diluent n.a.
Intercept® absorbent foam pad with diluent n.a.
OralScreen® absorbent foam pad only, drops appliedto device
15ng /mL [104]
QuantisalTM absorbent foam pad plus diluent n.a.
SalivaScreen® absorbent foam pad, drops applied to de-vice
30−40ng /mL [46]
Salivette® cotton wool swab which is then filteredand centrifuged
n.a.
Toxiquick® absorbent bud, saliva squeezed in syringeto apply on device
50ng /mL [105]
OralLab® collector squeezed to apply saliva in testcartridge
10−20ng /mL [46, 106]
Transorb® wicks absorbent, filtering devices n.a.
Mini-UniPrepTM collection and integrated filtration n.a.
OraTect® absorbent directly connected to device 20ng /mL [102, 107]
UpLinkTM absorbent directly connected to device 200ng /mL [102]
OraLine® direct application to oral cavity, or use ofother collectors
25ng /mL [108]
24

2.1. Human Saliva
Depending on the application only the most important challenges mentioned at the beginning
of this section are solved. The problem of contamination is reduced by a provided sealed
container or by collecting directly onto the device. To overcome the low sample volumes, the
collected sample can be mixed with a dedicated diluter (reduction of the analyte concentra-
tion), which also can take over the function of a preservative. In general the viscosity of the
saliva samples can be reduced by the common freeze-thaw-centrifugation (FTC) technique.
During this process the long protein chains are broken and then separated.
To sum up, there are many different collectors commercially available (Table 2.4). Three
general methods got established: wipe collectors, swab collectors, and collectors on device.
Detection devices integrated on the collector show reliabilities of 60−80% [109].
The problem of contamination can be reduced by collecting directly onto the device. To
overcome the low sample volumes, the collected sample can be mixed with a dedicated diluter,
which can also take over the function of a preservative. Using swab or some kinds of wipe
collectors reduces the viscosity directly, because debris and some bulky proteins remain in
the swab tissue. Actually all techniques influence in some way the composition of saliva due
to different transfer efficiencies of the different components. [99, 110]
Regardless of the collection method for the subsequent analysis, the samples are usually
filtered or centrifuged to further reduce the viscosity. For filtration, often syringe filters
showing a pore size of 0.2µm are used [26]. Centrifugation to remove bulky proteins is typically
performed in a small tube at 4000 times g for around 10mi n [64].
Preparation of Saliva Samples
The tiny microfluidic channels, junctions, and nozzles are at high risk of clogging, because
whole saliva samples show a high viscoelasticity and often contain food debris and cells as
mentioned in section 2.1.1. Therefore, some basic sample preparation steps are inevitable.
Here, we present a list of state-of-the-art techniques applied to whole saliva samples as sample
preparation steps prior to be used as liquid in microfluidic devices:
– filtration:
* syringe filter
* ultra filtration
* microfluidic H-filter
– centrifugation
– dilution
– freeze-thawing
– cell lysis
For our application the filtration preparation method presented among others by Yager et al.
seems to be the most interesting. It is a flexible, portable, and low-cost technique. Centrifu-
gation already needs a machine in the lab. Dilution is not applicable in our case due to the
25

Chapter 2. Materials & Methods
(a) Clogged microfluidic channel by food de-bris, cells, and large proteins present in unfil-tered saliva.
(b) Saliva filtered by PES syringe filters (poresize 0.2µm) in a microfluidic channel.
Figure 2.7: Effect of saliva filtration.
already low analyte concentration in saliva. Freeze-thawing and cell lysis are rejected because
they alter the cocaine molecule.
2.1.4 Saliva Samples in the IrSens Project
Saliva donors were chosen randomly with good variation of gender and age. Prior the sample
collection, the donors were asked to refrain from eating, drinking, and smoking for at least
one hour and to rinse their mouth with water. We collected human saliva samples using
the spitting method (see section 2.1.3). No stimulation, neither mechanical (chewing) nor a
chemical stimulant, was applied to avoid dilution and consequently a decrease of the analyte
concentration.
Saliva samples were processed individually for the saliva characterization experiments. To get
a more representative, averaged sample, the saliva collected from different donors was mixed
together for all the other experiments such as the absorption or extraction measurements.
The samples were filtered to remove food debris and a big part of the long glycoproteins (see
Figure 2.7) as suggested in [26]. We used PES (polyethersulfone) syringe filters showing a pore
size of 0.2µm (Carl Roth GmbH, Karlsruhe, Germany). This filtering step reduced the saliva
volume by a factor of around 2. The small cocaine molecules passed through the filter. No
change of the cocaine concentration in saliva was observed comparing the concentration in
filtered and unfiltered samples.
The pH value of the sample was adjusted and stabilized at pH 9 by adding 10% of a buffer
concentrate (Titrisol® buffer concentrate, Merck, Switzerland). This pH value was chosen to
be higher than the pKa value of cocaine for better extraction conditions, but still as low as
possible, since components of the buffer may attack the substrate of the optical waveguide of
the final integrated system (hydroxide OH− attacks silicon).
26

2.1. Human Saliva
no buffer buffered to pH9
buffered to pH10
buffered to pH11
7
8
9
10
+4.5%
-1.1%
-0.8%
pH v
alue
30min 50min 65min 210min
-0.2%
Figure 2.8: Time evolution of the pH value (in %) of natural and buffered (10% buffer concen-trate) human saliva samples. pH measurements were performed by an ISFET-based sensor in500µg /mL cocaine spiked saliva samples. Error bars indicate the standard deviation for 19samples of different donors.
Finally saliva samples were spiked with powder of free base cocaine (purity higher than 98%,
Lipomed, Switzerland). The cocaine was purchased with the permission of the Cantonal Drug
Administration of Neuchâtel.
2.1.5 Adjustment of the pH-Value of Human Saliva
Saliva is slightly acidic in steady state, showing a normal pH value of 6 to 7. The pH value in
salivary flow can be in the range from 5.3 at low flow conditions up to 7.8 at the peak flow. [66]
Saliva has a certain buffering capacity to buffer to the physiological pH value of around 7.
There are three main buffering systems involved (see Table 2.1):
– phosphate buffer, stable
– protein buffering system, stable mostly active to buffer acids
– bicarbonate buffer system, changes when exposed to air
The bicarbonate buffer system is no more balanced, when saliva is exposed to air. CO2 escapes,
which decreases the H3O+ concentration in saliva and results in a higher pH value. [111]
Adding cocaine (base) to saliva, the pH value slightly increases. In our study with samples
of 19 donors the pH value increased from 7.44 to 7.75 by adding 500µg /mL of cocaine. The
pH value then further increased (4.5%) over time mainly due to the unbalanced bicarbonate
buffer system. The value can be stabilized by adding 10% of Titrisol® buffer concentrate,
whereas smaller concentrations of buffer (1%) were not able to stop the raise of the pH value
(see Figure 2.8).
27

Chapter 2. Materials & Methods
2.1.6 Rheological Characteristics of Human Saliva
In this section we present the basic theory, some references as well as our own measurements
of some important rheological characteristics of saliva samples such as the viscosity, the
viscoelasticity, and the surface tension.
Viscosity
Viscosity is the measure of the internal friction of a liquid. This internal friction becomes
apparent when a layer of a liquid is moved in relation to another layer. The friction is larger,
when the amount of force (shear stress) required to cause this movement (shear rate) is larger.
Viscosity is defined as the ratio of shear stress to shear rate, which is given by
η= shear stress
shear rate= τ
|ξ| [Pa · s], (2.1)
where τ is the shear stress [Pa] and |ξ| the shear rate [s−1]. Water at 20◦C has a viscosity of
1.002mPa · s = 1.002cP [68].
Ostwald-de Waele model This model is a two-parameter power-law model, a simplification
of the Carreau-Yasuda model. The Ostwald-de Waele model describes the viscosity as a
function of the shear rate.
η (|ξ|) = m · |ξ|n−1 [1], (2.2)
whereas m is a parameter called flow consistency index and n is the flow behavior index:
n < 1, non-Newtonian shear-thinning,n = 1, Newtonian fluid with η=m,n > 1, non-Newtonian shear-thickening.
Water is an example of a Newtonian fluid, where the shear stress is directly proportional to
the shear rate. So called pseudo-plastic, or non-Newtonian shear-thinning fluids show lower
viscosity at higher shear rates, and are usually solutions of large, polymeric molecules in a
solvent with small molecules.
Shear-thinning Saliva Saliva is a shear-thinning, non-Newtonian fluid. High molecular
weight glycoproteins (mucins)(see section 2.1.1) are responsible for this complex rheological
behavior [62]. At rest or low shear rates the long protein chains are in irregular order, and
therefore a resistivity against flow is observed (i.e. high viscosity). At higher shear rates the
mucins disentangle and become aligned in parallel to the driving force, what allows them to
slip on each other more easily. In conclusion, the viscosity of saliva decreases with increasing
28

2.1. Human Saliva
Figure 2.9: Shear rate-dependent viscosities of several human saliva samples of a single donoron different days (fine lines), averaged and smoothed values (boxes), the fitted Carreau-Yasudamodel (bolt line), and as comparison a representative Newtonian fluid (circles) [73].
shear rates as presented in Figure 2.9. Helton and Yager measured at shear rates up to 0.02s−1
almost constant viscosity of around 400mPa · s. In the range of 0.02s−1 to 1000s−1 they
observed the transition region. For higher shear rates saliva is in the Newtonian regime [73].
Waterman et al. derived for saliva a dynamic viscosity of 104Pa · s [60]. Davis concludes
saliva is a highly viscoelastic fluid and shows viscosity values of 0.01Pa · s to 40Pa · s in a
frequency range of 2.5∗ 10−3H z to 10H z [112]. This demonstrates the high inter-subject
and intra-subject variations what is also confirmed by Rantonen, Panu [110] and our own
measurements (see Figure 2.10).
We measured the viscosity of saliva as well, but in a smaller range of shear rate. These results
correspond well with the measurements of Helton and Yager [73] (compare Figure 2.10a and
2.9). Furthermore, we investigated the effects of sample preparation on the viscosity. Our
viscosity measurements presented in Figure 2.10 are recorded with a Brookfield Viscosimeter
LV DV-ll+Pro (Brookfield, Germany) using a spindle CPE-40. The measuring inaccuracy was
around 2% (max 9%). Samples were prepared as described in section 2.1.4. Filtration (removing
some of the large gylcoproteins) reduced the viscosity overall, but the shear-thinning behavior
remained as shown in Figure 2.10a. Spiking with cocaine and dilution with buffer reduced
obviously the shear-thinning behavior. But the effect was considered as pH-value independent
as presented in Figure 2.10b.
The curves of Figure 2.10 describing the shear rate dependent viscosity can be fitted well to
the Ostwald-de Waele model showing R-square values > 0.97 (see Table 2.5).
Studies in literature report considerable reduction of the salivary viscosity by 17−50% within
only three hours, caused by proteolytic degradation of mucins by the bacteria present in our
mouth [62].
29

Chapter 2. Materials & Methods
200 400 600 800 1000 12001.0
1.2
1.4
1.6
1.8
2.0
2.2
2.4
2.6
2.8
3.0
3.2
3.4
3.6
3.8
visc
osity
[cP
]
shear rate [s^(-1)]
donor 1 donor 2 donor 3 donor 4 donor 5 average
(a) Influence of filtration on the viscosity. Solid sym-bols represent the measured values before filtrationand empty symbols the values after filtration.
200 400 600 800 1000 12001.0
1.1
1.2
1.3
1.4
1.5
1.6
1.7
visc
osity
[cP
]
shear rate [s^(-1)]
filt. saliva filt. saliva (coc) filt. saliva (coc) buff.(average) filt. saliva (coc) buff.(pH9) filt. saliva (coc) buff.(pH10) filt. saliva (coc) buff.(pH11) filt. saliva (coc) buff.(pH13)
(b) Influence of spiking filtered saliva (mixture of 19donors) with 500µg /mL of cocaine and the effect ofadditional buffering on the viscosity.
Figure 2.10: Shear rate dependent viscosity measurements of human saliva samples.
Table 2.5: Fitting parameters of the Ostwald-de Waele model for the curves presented in Figure2.10.
curve m n
Figure 2.10a: unfiltered saliva 15.05 0.6893
Figure 2.10a: filtered saliva 22.52 0.6020
Figure 2.10b: filtered saliva 6.76 0.7433
Figure 2.10b: filtered saliva with cocaine 4.65 0.7846
Figure 2.10b: buffered, filtered saliva with cocaine 1.567 0.9414
30

2.2. Reference System for Cocaine Measurements
Viscoelasticity
The viscoelasticity is described by the frequency dependent dynamic moduli G’ (elastic storage
modulus, representing the solid-like component) and G” (viscous loss modulus, representing
the liquid-like component). In the frequency range of 0.5−10H z values < 1 were determined
for the ratio of G” to G’, which indicates saliva to be a more elastic and gel-like solution [73].
Surface Tension
The surface tension of different human saliva samples was measured with a Kibron AquaPi
(EZ-Pi) (Krüss, Germany). Samples were prepared as described in section 2.1.4. Filtration did
not influence the surface tension (see Figure 2.11a), whereas adding cocaine or buffer solution
to saliva reduced its surface tension (see Figure 2.11b). Bases (cocaine or buffer) introduced
in water disturb the hydrogen bonds between water molecules, which resulted in this lower
surface tension.
2.2 Reference System for Cocaine Measurements
The method commonly used to detect cocaine in human body fluids is mass spectrometry
(MS). The machine used is a heavy, non-portable laboratory apparatus (Figure 2.12). Our
reference measurements were performed by the Swiss Laboratory for Doping Analyses (LAD)
at the Centre Hospitalier Universitaire Vaudois (CHUV) in Lausanne. This laboratory is accred-
ited by the World Anti-Doping Agency since 1991 and ISO 17025 certified. The samples were
measured with a class leading ultra performance liquid chromatography - mass spectrometer
(UPLC-MS). The machine Xevo TQ-S from Waters is designed for the most demanding quan-
titative UPLC-MS applications [113]. It features an off-axis ion source technology, known as
StepWave, for accurate, robust, and reproducible measurements with an overall measurement
uncertainty of 5%. In the system the column UPLC BEH C18 1.7µm was used.
A calibration curve was recorded using well defined cocaine concentration standards (see
Appendix A). Linearity was observed for the concentration range 5−2500ng /mL. Higher
concentrations had to be diluted for the measurement. Our samples were always analyzed the
same day as the microfluidic experiment was performed because it was observed that most of
the cocaine in saliva was transformed to its metabolites within 5 days as also observed by [88].
2.2.1 Sample Preparation for Mass Spectrometry
Sample preparation protocol for cocaine detection in human saliva
100µL of the saliva sample was mixed with 500µL dilution solution (80% acetonitrile, 20%
water) and 400µL water. Then 5µL of the mixture was injected in the mass spectrometer.
31

Chapter 2. Materials & Methods
d o n o r 1 d o n o r 2 d o n o r 3 d o n o r 4 d o n o r 5 a v e r a g e0
1 0
2 0
3 0
4 0
5 0
6 0
7 0
surfa
ce te
nsion
[mN/m
]
s a m p l e
u n f i l t e r e d s a l i v a f i l t e r e d s a l i v a
(a) Filtration has no significant influence on the surface tension.
f i l t . s a l i v a
f i l t . s a l i v a ( c o c )
f i l t . s a l i v a ( c o c ) b u f f . ( a v e r a g e )
f i l t . s a l i v a ( c o c ) b u f f . ( p H 9 )
f i l t . s a l i v a ( c o c ) b u f f . ( p H 1 0 )
f i l t . s a l i v a ( c o c ) b u f f . ( p H 1 1 )
f i l t . s a l i v a ( c o c ) b u f f . ( p H 1 3 )
4 6
4 8
5 0
5 2
5 4
5 6
5 8
6 0
surfa
ce te
nsion
[mN/m
]
(b) Influence of spiking filtered saliva (mixture of samples of 19 donors) with 500µg /mL ofcocaine and the effect of additional buffering on the surface tension.
Figure 2.11: Surface tension measurements of different human saliva samples. Error barsindicate the standard deviation for 3 independent measurements.
32

2.3. Materials used for Microfluidic Devices
Figure 2.12: Ultra performance liquid chromatography - mass spectrometer Xevo TQ-S fromWaters [113].
Sample preparation protocol for cocaine detection in PCE
100µL of the PCE sample was mixed with 900µL dilution solution (80% acetonitrile, 20% water)
and then the liquid completely evaporated. The container containing only the cocaine was
refilled with 1mL of water and well mixed before 5µL were injected in the spectrometer for
the analysis.
2.3 Materials used for Microfluidic Devices
First microfluidic systems were fabricated by the well-developed techniques of the microelec-
tronics and integrated circuit industry. Microfluidic channel networks can be achieved by
photolithographic steps and by wet and dry etching: Plasma etching results in nearly vertical
channel walls, anisotropic wet etching produces V-shaped grooves and isotropic wet etching
produces D-shaped channels. More complex 3D networks of microfluidic channels can be
made by bonding several patterned layers together. [114]
These devices made in glass, silicon or quartz, are slowly replaced by cheaper polymer devices
mainly because the price of the substrate material is too high for high volume production.
Furthermore, for glass, silicon or quartz are too many fabrication steps involved, which raises
the time and cost of fabrication and the geometrical designs are limited.
Much work has been focused on creating inexpensive, disposable polymer devices for high-
throughput production. Most commercially available devices are fabricated in polymers such
as polycarbonate (PC) and polymethylmethacrylate (PMMA). Micronics (founded in 1996 and
acquired by Sony in 2011) was one of the first companies who recognized the importance of
33

Chapter 2. Materials & Methods
Table 2.6: Comparison between polymers and glass properties with respect to their use formicrofluidic applications.
Polymer Glass
Manufacturingcosts
low relative to glass, especially formass production
higher in cost, especially for large-area substrates and due to clean-room facilities
Fabrication com-plexity
simpler than for glass time consuming and expensive wetchemistry
Clean-room facili-ties
not necessary often required
Material proper-ties
wide selection of polymers with dif-ferent properties
less variability
Operation temper-ature
limited because of low glass transi-tion temperature
higher relative to polymers
Optical properties optical transparency lower than glass excellent optical properties, very lowautofluorescence
Bonding different options: adhesives, thermalfusion, plasma, ultrasonic and me-chanical clamping
time consuming compared to poly-mers: thermal, adhesive and anodicbonding
Surface treatment available, but not yet well established established using silanes
Compatibility withorganic solvents orstrong acids
generally not compatible with mostorganic solvents and strong bases oracids
good resistance
Geometrical flexi-bility
many different channel cross-sections possible
limited
Permeability togasses
generally higher permeability relativeto glass
no permeability
plastics in developing POC diagnostics. They developed thin-film laminate-techniques and
injection-molding for microfluidic chips (see Figure 1.2a) [19, 115].
An overview of the most commonly used materials and developed fabrication methods for
polymers such as hot embossing, injection molding, and different casting methods was
presented by C.E. White in 2003 [116].
2.3.1 Comparison of relevant Properties for Microfluidic Applications betweenGlass and Polymer
Glass is an amorphous solid material. Polymer materials show a porous structure and consist
of long, high molecular mass polymer chains. This completely different chemical structure
results also in different material properties. Table 2.6 compares glass and polymers with
respect to relevant properties for microfluidic applications. The presented table was adapted
and simplified from [117].
34

2.3. Materials used for Microfluidic Devices
2.3.2 Material Requirements for Microfluidics
Microfluidic material requirements have been discussed by several authors in the literature
[117–119] and correspond basically to the points listed in Table 2.6.
Regarding Table 2.6 for some criteria glass shows better material properties. But depending
on the final product, the less expensive polymers might be the better choice, because these
criteria, for which glass performs better than polymers, are less relevant or even neglectable
for a specific application.
For polymers attention has to be paid especially to thermal properties and chemical resistance
against certain solvents or strong acids. For observations in microfluidic devices the optical
properties (transparency, autofluorescence) play an important role. For sensing applications
the adsorption properties definitely have to be investigated.
2.3.3 Polymer Materials used in this Work
The microfluidic devices used in this project were mainly realized using UV-curable adhesive
NOA81 from Norland Optical Adhesive (Norland Products Inc, Cranbury, NJ, USA). NOA81
contains among other substances mercapto-esters and its polymerization is a thiol-ene based
crosslinking [120]. Compared to polydimethylsiloxane (PDMS), NOA81 has better chemical
resistance, is impermeable to air and water vapor, and is less prone to swelling upon contact
with fluids [121]. The higher stiffness of the cured polymer (compared to PDMS) of around
1GPa [122, 123] allows higher clamping pressures, which is needed for droplet generation on
a microfluidic chip at high flow rates.
NOA81 was used either in its pure form, or modified by mixing 1 wt% of APTES (Sigma-Aldrich
GmbH, Buchs, Switzerland) in the uncured polymer. The surface modifications on the UV-
cured polymer were performed either by oxygen plasma or by vapor-phase silanization using
the fluoro-silane FOTCS (ABCR GmbH, Karlsruhe, Germany).
This polymer is designed for optical applications, but already in 2008 molding-based fabrica-
tion methods for microfluidic chips using NOA81 have been reported. Advantages of this novel
material over the commonly used PDMS for low-cost microfluidic devices were presented, but
a useful characterization of NOA81 was still missing. [122]
SU-8 from MicroChem (Newton, MA, USA), a negative epoxy resist, was processed by pho-
tolithography. SU-8 is a material which is known for very precise prototypes and devices [124].
We used this epoxy to fabricate masters for molding.
PDMS is probably the most commonly used polymer material for microfluidic devices, but it
shows poor chemical resistance [125]. Therefore, its use is mainly restricted to aqueous fluids
and not a suitable material for the microfluidic channels in our project. We used PDMS (PDMS
184, Sylgard, Dow Corning, Midland, MI, USA) for pattern transfer in context with molding
techniques.
35

Chapter 2. Materials & Methods
2.4 Rapid Prototyping of Microfluidic Devices
The first microfluidic systems were fabricated by the established fabrication technologies of
microelectronics and microelectromechanical systems (MEMS) which allow for the develop-
ment of a wide range of devices with different functionalities [114]. By replacing silicon and
glass with polymer materials, new fabrication technologies were developed as presented in
this section.
For research applications rapid prototyping methods are used [126]. These methods enable
low-cost chip production and facilitate rapid design changes at the cost of high-volume
production [127–130]. Rapid prototyping of microfluidic devices commonly implies liquid
polymer casting on a structured master, polymer curing, demolding of the structured hard
polymer and its bonding to a substrate in order to close the channels.
Here in this section we present methods to make the masters as well as the overall rapid
prototyping process we developed for the polymer NOA81 with respect to the IrSens project.
2.4.1 Master Fabrication
Typically masters for rapid prototyping are made in glass or silicon or with a little bit higher
geometrical flexibility by photolithographical structuring of an SU-8 epoxy layer. In this
section the method using SU-8 is explained and in a second part we present our own master
fabrication method based on Scotch-tape which is much more efficient in terms of fabrication
time and is really low-cost, since no clean room environment is required. The Scotch-tape can
be cut by hand, using a CNC-cutter or with higher precision also by a CNC-laser.
PDMS Master Based on SU-8 Photolithography
Figure 2.13 presents the well established process mainly used for fabrication of microfluidic
systems made of soft polymers like PDMS. We applied this method at the beginning of the
thesis to build structured PDMS parts, which were then used again as masters for NOA81
molding [131].
Scotch-Tape Master
We developed our own method to build low-cost Scotch-tape based masters for polymer
molding inspired by a Chips & Tips article [132].
Common microscope glass slides were cleaned with ethanol and then we stuck gently a film of
Scotch-tape on top (avoiding air bubbles being trapped). The negative structure of the desired
microfluidic channels was printed on paper which was then put under the glass slide. This
pattern was easily transfered to the Scotch-tape film by following the lines (visible through the
glass slide) with the scalpel. An advanced example is shown in Figure 2.14.
36

2.4. Rapid Prototyping of Microfluidic Devices
Figure 2.13: PDMS master fabrication: First SU-8 epoxy on a glass substrate was structuredby standard photolithography. PDMS was casted and cured on this SU-8 structure and thendemolded to be used as a master itself.
Figure 2.14: Picture of a Scotch-tape master with rough and smooth tape and showing differentchannel heights realized by different amounts of Scotch-tape layers.
Our method allows building multi-layer masters easily, which is extremely time consuming
with the other well established methods. Furthermore, our method makes it possible to
adjust the wetting behavior of the channel walls by employing Scotch-tapes with different
roughnesses.
Multi-Layer Masters Based on cutting the structures by hand, our method shows quite
weak accuracy in lateral dimensions (~200µm), but the height of the channels was very well
controlled. The Scotch-tape we used showed a homogeneous and almost not compressible
thickness of 49±2µm. The fact that the Scotch-tape is not compressible allows building multi-
layer masters very precisely in the vertical dimension (unlike other tapes showing variations
in the height over more than 50%). The height of stacks with different amounts of layers was
measured (Alpha-Step IQ Surface Profiler, KLA-Tencor, error ±2µm) and a linear dependency
found as shown in Figure 2.15.
37

Chapter 2. Materials & Methods
0 2 4 6 8 1 0 1 2 1 40
1 0 0
2 0 0
3 0 0
4 0 0
5 0 0
6 0 0
7 0 0
�����
�����
�
l a y e r s o f s c o t c h - t a p e
Figure 2.15: Thickness of the stack increases linearly with the amount of Scotch-tape layers.
(a) Principle of dynamic contact anglemeasurements: The advancing contactangle is measured when the dropletis growing, the receding contact anglewhen the droplet is shrinking.
1 . 6 1 . 8 2 . 0 2 . 2 2 . 40
2 0
4 0
6 0
8 0
1 0 0
1 2 0
1 4 0
1 6 0
�������
�������
�������
���
����
�������
�
����������� ��������������
�������������
��������
(b) The smooth NOA81 surface is more hydrophilic with andadvancing contact angle of 99 °. It shows better wettability bywater than the rough surface with an advancing contact angleof 128 °.
(c) Growing water droplets on a smooth and a rough NOA81 surfaceduring the advancing contact angle measurement.
Figure 2.16: Wetting behavior of water on pure NOA81 surfaces molded and cured on roughand smooth Scotch-tape.
38

2.4. Rapid Prototyping of Microfluidic Devices
Wetting Behavior Using Scotch-tape on the master with different roughness results in differ-
ent wetting behavior of the replicated microfluidic channel walls. The NOA81 surface molded
on the smooth, transparent tape (Transparent Scotch 550, 3M, France) is more hydrophilic
than the one molded on the mat tape (Magic Scotch 810, 3M, France). This was investigated
by dynamic contact angle measurements with water droplets (see Figure 2.16).
2.4.2 Fabrication & Assembly of the Microfluidic Device for the project IrSens
For the development of the microfluidic system we performed rapid prototyping based on
the Scotch-tape masters (presented in section 2.4.1). An overview of the fabrication process is
given in Figure 2.17.
Figure 2.17: Fabrication process for NOA81 chips molded on Scotch-tape masters: A micro-scope glass slide was cleaned with ethanol first (1), then a Scotch-tape was stuck on top (2)and the desired negative structure of the microfluidic channel was cut out by hand with ascalpel(3). On this Scotch-tape master NOA81 was casted and cured under the UV-lamp (4).The demolded structured NOA81 part (5) was then bonded to a glass or silicon substrate bymeans of oxygen plasma (6).
39

Chapter 2. Materials & Methods
NOA81 was casted on the Scotch-tape masters and then cured by exposure to UV-light
(1.5mW /cm2 at 365nm wavelength for 22mi n). Then the cured polymer was separated
from the master which remained reusable for around 5-10 other molding cycles. Fluidic inlet
and outlet holes were drilled into the channels to have later on access to the microfluidic
channels. The structured NOA81 part was then exposed to oxygen plasma twice for 15s (400W ,
2.45G H z, 500−700mTor r , 400cm3/mi n O2 flow) together with the substrate (silicon or glass)
before both parts were pressed together for bonding. Metallic connectors were glued (2 tone
epoxy, Devcon) on top of the holes of the microfluidic chip to be able to connect the tub-
ings. For aging of the polymers, the chips were put in the oven at 60 °C for at least 12h [123].
A completed microfluidic chip on a glass substrate is shown in Figure 2.18. An additional
temperature treatment at 130 °C for 1h improved the bonding between NOA and the glass
substrate.
Figure 2.18: NOA81 microfluidic chip bonded on a microscope glass slide with metallicconnectors glued on top for the tubing.
2.5 Microfluidic Measurement Setup
Our microfluidic chips (see Figure 2.18) were analyzed upside down under a microscope
(Olympus) with the microfluidic measurement setup presented in Figure 2.19. Liquids were
provided with two syringe pumps (PHD 2000 Infusion/Withdraw, Harvard Apparatus). If
needed, the pressure at the microfluidic outlets was adjusted by the pressure control system
(MFCS-8C, Fluigent). Images and video sequences were acquired using a high-speed camera
(Phantom V210, Vision Research). To get bright enough pictures at high frame rates (short
exposure time), a transmission setup for the illumination was chosen (see Figure 2.19b). The
light source was placed under the chip , only separated by a light diffusor.
40

2.6. Discussion
(a) Image of the arrangement of the different com-ponents.
(b) Schematic of the chip holder.
Figure 2.19: Microfluidic measurement setup.
2.6 Discussion
The human body fluid saliva is the perfect matrix for non-invasive, POC detection e.g. for
roadside testing. Small molecules present in blood are expressed through the saliva glands and
can be found in saliva as well in a fixed ratio [79]. On the other hand, saliva is a really complex
fluid showing huge inter- and intra-subject variations. The very fast changing concentrations
of the ingredients influence the analyte level, the pH value, and the rheological properties
[63, 64]. The latter ask for a highly robust microfluidic systems. Furthermore, saliva is a
non-Newtonian fluid, which does not make it impossible to use saliva as a diagnostic fluid
in microfluidic devices, but it is definitely challenging [73]. We characterized the rheological
properties of saliva before and after the basic sample pretreatment, which includes filtration
and pH value stabilization (important for repeatability of our extraction process).
Mass spectrometry is the state-of-the-art method for cocaine detection in human saliva. We
used a class leading ultra performance liquid chromatography - mass spectrometer in collabo-
ration with the Swiss Laboratory for Doping Analyses for our cocaine reference measurements.
We presented materials used to build microfluidic devices together with specific material
requirements which are important for LOC devices. Polymers are finding their way to microflu-
idic applications, but still today it is a challenge to find the appropriate polymer material for a
complex microfluidic system which fulfills all the relevant material requirements for a specific
application. We decided to work with NOA81, a material designed for optical applications, but
suggested as a promising material also for microfluidic chip fabrication [122, 133]. Due to the
new field of application still many material properties need to be characterized and verified
which was done in the framework of this project and will be presented in the next chapter.
41

Chapter 2. Materials & Methods
A new material asks also for a suitable fabrication method. In research and development, rapid
prototyping techniques are popular [125, 128–130]. We developed our own low-cost, highly
flexible, and time-efficient rapid prototyping method for NOA81. This method is not as precise
as other established ones, but the achieved fabrication accuracy is more than enough for our
application. Feature sizes smaller than ~10µm are anyway not applicable with human saliva
samples because of the risk of microfluidic channel clogging. If higher accuracy is needed,
the Scotch-tape could be structured by laser cutting, which on the other hand implies higher
costs and longer fabrication time.
2.7 Summary
In this chapter we put an emphasis on the nature of saliva and its usage as a sample liquid
for the detection of small analytes, e.g. cocaine, in the human body. We explained and
characterized the applied saliva sample pretreatment before using the saliva samples on
microfluidic chips. We focused on the influence of these pretreatments on the rheological
behavior of the human body fluid. Furthermore, the advantages of polymers as chip material
for microfluidic systems were explained. We developed our own low-cost, time-efficient, and
highly flexible microfluidic chip fabrication method for the UV-curable polymer NOA81. We
also present the basic microfluidic measurement setup to analyze the fabricated devices.
42

3 Characterization of Microfluidic Chan-nels Made of UV-Curable Adhesive
During the last decade polydimethylsiloxane (PDMS) has become one of the most commonly
used and reported material in literature for low-cost molding-based fabrication methods
of microfluidic systems [127]. However, its application range is limited by poor mechanical
strength and chemical resistance against most non-aqueous solvents. The group of Whitesides
investigated the solvent compatibility of PDMS-based microfluidic devices [125]. The major
problem they observed was swelling. Furthermore, stable surface modifications to adjust the
wetting behavior are lacking for PDMS [134, 135].
In 2008, Norland Optical Adhesives (NOA 81 and NOA63) were suggested as a substitute of
PDMS for rapid prototyping of microfluidic devices [122, 136]. These UV-curable glues were
originally designed to bond optical components or fiber optics, but are also well suited for
molding based replication of microfluidic structures [121, 122, 131, 136].
Since NOA is a new material for microfluidic applications, not many material properties
are known and need to be investigated. This chapter shows the characterization of NOA81
polymer microfluidic channels with respect to project relevant aspects. The resistance against
IR-transparent organic solvents is important, because cocaine will be extracted to such a
matrix for IR-spectroscopy. The cocaine absorption has to be investigated since we would not
like to lose our analyte in the chip material. Because we are working with a two-phase system
(aqueous and organic phase) to control the wetting behavior of channel walls is essential. We
also characterize the materials UV-characteristics and its performance for rapid prototyping.
Results are always put in relation to values of the commonly used material PDMS.
This chapter is based on a journal publication in Sensors and Actuators B [137] as well as on
the conference contributions to µTAS 2010 [138] and the IMCS 2012 [139].
43

Chapter 3. Characterization of Microfluidic Channels Made of UV-Curable Adhesive
(a) The delamination length l was measured fromthe channel wall with respect to time.
(b) Image of the delamination and indicated de-lamination length. Here is shown the example ofa NOA81 chip exposed to acetone (l = 28µm after2mi n).
Figure 3.1: Delamination occurring on plasma-bonded NOA81 channels during their exposureto organic solvents.
3.1 Chemical Resistance Against Mid-IR-Transparent Organic Sol-
vents
The compatibility of NOA81 chips with different organic solvents was evaluated with an
emphasis on IR-transparent organic solvents, which could be used as carrier medium of
the analytes for IR-spectroscopy. The results of this section were published in Sensors and
Actuators B [137].
3.1.1 Method
In order to test the chemical compatibility, microfluidic chips with a simple meander shaped
microfluidic channel were fabricated of NOA81 by rapid prototyping (as explained in section
2.4.2). The structured part as well as a thin film of NOA81 (cover plate) were treated by oxy-
gen plasma, and then bonded together as shown in Figure 3.1a. In this way an all-polymer
microfluidic channel made of NOA81 was achieved.
The microfluidic chips were analyzed under the microscope as described in section 2.5. Differ-
ent organic solvents were pumped through the microfluidic channels at a rate of 1µL/mi n.
The solvents attack the bonding site first. The delamination of the microfluidic-channel-part
from the flat cover plate (starting at the microfluidic channels) was characterized to quantify
the chemical compatibility of the solvents with the microfluidic chip. Measuring from the
channel wall, we determined the length of the delamination l with respect to time (see Figure
3.1).
44

3.1. Chemical Resistance Against Mid-IR-Transparent Organic Solvents
Figure 3.2: Delamination distance of the bonding site of NOA81 chips for exposure to differentorganic solvents. Measurement data with a measurement uncertainty of ±5µm is plottedtogether with the corresponding fitted Washburn equation.
3.1.2 Results
Our samples resisted against the following IR-transparent (mid-infrared range, around a
wavelength of λ = 6µm) organic solvents with low polarity: n-pentane, n-hexane, cyclo-
hexane, n-heptane, isopropyl alcohol, and tetrachloroethylene. At least for more than 5 hours
no effect, neither swelling, nor delamination, was observed under the microscope. Ethanol,
toluene, methanol, and ethyl acetate, which are all as well transparent at a wavelength around
6 µm, attacked slowly the bonding site of the NOA81 chips. These solvents will only be suited
for microfluidic experiments on NOA81 chips limited in time, e.g. for disposable chips. The
delamination front advanced much faster with Tetrahydrofuran (THF) and chloroform, as
well as with non-IR-transparent (at λ= 6µm) solvents like dimethylformamide (DMF), 1,2-
dichloroethane, acetonitrile, and acetone.
The delamination (Figure 3.1) we observed for some organic solvents is most probably based
on swelling of the polymer. For solvents affecting the NOA81 chips the delamination distance
is plotted over time in Figure 3.2. The obtained results show a diffusion-limited behavior and
are in accordance with the classical Washburn equation [140, 141]. This theory suggest the
relation of the diffusion distance l to the time t as
l~t12 . (3.1)
We fitted our results to the Washburn equation with a linear delamination coefficient, which is
given for each solvent in Table 3.1. For these measurements only oxygen plasma bonded chips
were studied in detail. A few tests indicated, that the same behavior was valid for microfluidic
chips bonded by UV-curing, which also supports the assumption that delamination was
caused by swelling. Cracks were never observed in the NOA81 microfluidic chips, unlike for
other solvent-resistant polymer materials [142].
45

Chapter 3. Characterization of Microfluidic Channels Made of UV-Curable Adhesive
Table 3.1: Organic solvents used for compatibility tests in NOA81 chips bonded by oxy-gen plasma with corresponding delamination coefficient of the Washburn relation and IR-transparency in the midinfrared wavelength range around 6µm.
solvent delam. coeff. delamination IR-transp.
water 0 no no
n-pentane 0 no yesn-hexane 0 no yescyclo-hexane 0 no yesn-heptane 0 no yesisopropyl alcohol 0 no yestetrachloroethylene 0 no yes
ethanol 1.45 slow yestoluene 1.72 slow yesmethanol 2.84 slow yesethyl acetate 4.37 slow yes
THF 8.24 fast yesDMF 14.62 fast no1,2-dichloroethane 17.96 fast noacetonitrile 19.10 fast noacetone 20.94 fast nochloroform 25.65 fast yes
3.2 Cocaine Adsorption
PDMS is known as a good adsorbent of cocaine. Because of this adsorption property, PDMS is
even commonly used for solid-phase micro-extraction (SPME) of cocaine [143, 144]. Adsorp-
tion on our microfluidic channel walls represent a loss. Such a loss of the analyte (cocaine) has
to be avoided. So for our sensing project we are looking for a polymer material with preferably
low adsorption of the analyte. This section presents the results of the adsorption tests on
NOA81 channel walls contributed to the IMCS 2012 [139].
3.2.1 Method
We made all-polymer NOA81 microfluidic channels by means of rapid prototyping using a
SU-8 based master as described in section 2.4 and section 3.1.1. The design is shown in Figure
3.3a and consists of a simple serpentine microfluidic channel (150µm wide and 40µm deep).
The total surface of the UV-curable adhesive exposed to the liquid, including inlet and outlet
ports, was 12.65mm2.
46

3.2. Cocaine Adsorption
(a) Design of the meander microfluidicchannel of uniform width (150µm).
(b) Schematic of the adsorption test setup: 1) glass syringe,2) Teflon tube (2.5cm), 3) Viton connector, 4) metallic socket,5) polymer microfluidic chip, 5) Teflon tube (1.5cm), 7) glassreservoir used for the transfer to the mass spectrometer (MS).
Figure 3.3: Cocaine adsorption measurement setup.
Different cocaine concentrations dissolved in saliva and tetrachloroethylene were flowed
through the microfluidic chips at a flow rate of 10µl/mi n. Saliva was collected from healthy
adult volunteers (pH 6.8±0.2), filtered through a commercially available PES 0.22µm syringe
filter, and spiked with cocaine.
The same concentrations were also pumped through a reference system consisting only of the
tubing (of equal length) as presented schematically in Figure 3.3b. The cocaine concentration
(c) of the samples flowed through the polymer microfluidic chip and the reference system was
determined by liquid chromatography - mass spectrometry (see section 2.2) and then used to
calculate the recovery rate (r ).
r = cmi cr o f lui di cs y stem
cr e f er ences y stem·100% (3.2)
3.2.2 Results
A very high recovery rate of the cocaine was observed in the aqueous (saliva) and organic
(tetrachloroethylene) solvent. Except for the lowest cocaine concentration (20ng /ml ), the
saliva samples showed recovery rates higher than 92% (see Table 3.2). Low values of the
standard deviation confirm stable recovery rates. We observed low adsorption at low flow rates
for microfluidic systems. Theoretically, we expect even less adsorption at higher flow rates.
The whole adsorption test was repeated with polymer microfluidic chips aged for 3 month.
No significant difference between fresh and old chips was measured.
From literature we already know the UV-curable polymer NOA81 shows low adsorption of
proteins (interleukins) from blood [145]. Compared to these values, we observed in our study
of molecule adsorption an even better, remarkably high recovery rate for the analyte cocaine.
47

Chapter 3. Characterization of Microfluidic Channels Made of UV-Curable Adhesive
Table 3.2: Mean recovery rate, standard deviation (SD), and coefficient of variation (CV)given in % for the solvents saliva and tetrachloroethylene as function of different cocaineconcentrations.
cocaine concentration human saliva tetrachloroethylene
recovery rate SD CV recovery rate SD CV
20ng /mL 85 21 24 86 11 13
2µg /mL 93 4 5 91 12 14
20µg /mL 92 13 14 89 16 18
400µg /mL 101 8 8 100 2 2
3.3 Adjustable Wetting Behavior
In this section different methods to modify the surface properties of NOA81 are investigated
and quantitatively characterized by dynamic contact angle measurements. As a new ap-
proach to make the surface of the polymerized NOA81 more hydrophobic, we mixed APTES
((3-aminopropyl)triethoxysilane) as an additive to the uncured polymer by the thiol-ene click
reaction (efficient, and high yielding addition of functional groups) [146]. This allows ho-
mogeneous control over the wetting behavior, which is difficult to achieve with liquid [147]
or vapor-phase surface treatments, particularly of those parts located deep within closed
microfluidic systems. The common vapor-phase silanization using FOTS ((Tridecafluoro-
1,1,2,2-tetrahydrooctyl)trichlorosilane) was applied to NOA81 as a reference treatment. These
findings were confirmed by AFM (atomic force microscopy) as well as by XPS (X-ray photoelec-
tron spectroscopy) measurements. We also give examples of multi-phase flow microfluidic
systems where the adjustment of the wetting behavior of microfluidic channel walls plays an
important role.
The results and applications presented in this section were published in the journal Sensors
and Actuators B [139].
3.3.1 Method
Sheets of PDMS were cured at room temperature on silicon wafers to achieve homogeneous
and flat PDMS surfaces. For the analysis of modified NOA81 surfaces, the UV-glue was cured
sandwiched between two of these PDMS sheets (in contact with the PDMS side molded on
the silicon wafers). The approximately 1mm thick, cured NOA81 layer was then transferred
onto a glass substrate for more convenient handling.
To study the wetting behavior of cured NOA81, dynamic contact angle measurements using
water droplets on the sample of interest in ambient air were performed with an optical contact
48

3.3. Adjustable Wetting Behavior
(a) Measurement of the advancing (Θa ) and reced-ing (Θr ) contact angle on both sides of a waterdroplet on a surface of NOA81 with a mass fractionof 1% APTES.
(b) Comparison of the dynamic contact angles ofdifferent NOA81 surfaces with error bars and indica-tion of the stability over time by storage in ambientair.
Figure 3.4: Dynamic wetting behavior analysis on different NOA81 surfaces.
angle goniometer (Drop Shape Analysis System DSA 10, Krüss GmbH, Hamburg, Germany).
For each sample the advancing (growing droplet) and receding (shrinking droplet) contact
angles were measured (see schematic in Figure 3.4a). The static contact angle at equilibrium
of the water droplet can be calculated from the dynamic contact angles using the theory of
Tadmor [148].
The topography of the NOA81 surfaces was evaluated by surface roughness analysis using an
AFM (Veeco Dimension 3100, Digital Instruments, Mannheim, Germany) in the tapping mode
on 3µm x 3µm areas.
XPS (Axis Ultra DLD, Kratos Analytical, Manchester, U.K.) was applied to investigate the
chemical composition of the surfaces. Depth profiles were achieved by performing ion etching
between two different measurements. Measurements were performed at 60◦ inclination for
better surface sensitivity and at 90◦ for the depth profiles measurements.
3.3.2 Results
A typical dynamic wetting behavior test result is shown in Figure 3.4a. A comparison of all the
modified surfaces is presented in Figure 3.4b and Table 3.3. Without any modification NOA81
was hydrophilic, showing an advancing contact angle ofΘa = 80±3◦ and a receding contact
angle ofΘr = 20±7◦. After oxygen plasma treatment, the surfaces showed a reasonably stable
perfect wettability in air (stable at least for 4 days,Θa = 30±3◦,Θr = 10±7◦ after 26 days). Static
contact angle measurements on NOA81 surfaces of Hung et al. confirm these results [121].
Storage of the samples in water further enhanced the hydrophilicity of the plasma-treated
surfaces. The plasma treatment on NOA81 was much more stable compared to PDMS. The
plasma-treated PDMS surfaces recover fast their hydrophobic character if allowed to react
49

Chapter 3. Characterization of Microfluidic Channels Made of UV-Curable Adhesive
Table 3.3: Dynamic contact angles (advancing and receding) measured 26 days after fabrica-tion and calculated, corresponding equilibrium contact angles using the theory of Tadmor[148] for different NOA81 surfaces.
NOA81 surface contact angle [◦]
advancing receding equilibrium
pure 80±3 20±7 48±5
oxygen plasma treated 30±3 10±7 21±5
1% mass fraction of APTES 115±3 59±3 81±3
vapour phase silanisation (FOTS) 113±3 61±3 82±3
with ambient air (change of contact angle from 15◦ to 79◦ within 200mi n) [134]. Following
the concept developed in [149, 150], we added 1 wt% of APTES to uncured NOA81 and un-
like vapor-phase silanization using APTES in gas phase, the surfaces were found to be more
hydrophobic (Θa = 115±3◦, Θr = 59±3◦). Samples stored in water recovered their original
hydrophilicity after 10 days, but no change was observed (at least for more than 10 days) if the
samples were stored in a low polar solvent, like e.g. toluene.
By mixing this additive in NOA81, we obtained similar hydrophobicity, both in terms of contact
angle and stability in time (>40 days) as the hydrophobicity originating from a vapor-phase
silanization using FOTCS after plasma activation of the surface (Θar = 113±3◦,Θr = 61±3◦).
This reference treatment is a well-known method of chemically modifying silicon, glass, and
PDMS surfaces [151].
Adding larger mass fractions of APTES in uncured NOA81 (> 1%) did not increase its hydropho-
bicity, but inhibited the polymerization of the UV-glue. Probably a competitive reaction with
the amine groups in NOA81 runs even before the UV-polymerization. NOA81 with more than
7% APTES by weight was hard to cure completely.
This simple modification using APTES allows easy control over the wetting behavior of micro-
and nanoscale parts hidden deep in microfluidic systems, which is hard to achieve by surface
modification techniques, e.g vapor-phase silanizations. The characterization of NOA81 sur-
faces was performed with a number of samples from different fabrication batches at different
times of the year. This assesses the reproducibility of these results.
Generally, changes in wetting behavior stem from modifications of surface topography or
chemistry. A roughness analysis was performed by AFM on both NOA81 surfaces and on
samples of NOA81 containing APTES. No difference in roughness was found. Samples of
pure NOA81 and APTES-modified NOA81 showed height deviations taken from the mean
data plane of 0.7±0.2nm (see Figure 3.5). In addition, no differences were found between
fresh and 20 days old samples. Therefore, a change in the topography based on the additive
50

3.3. Adjustable Wetting Behavior
(a) AFM image of a surface of pure NOA81for roughness analysis; Root mean squareaverage of height deviations measured fromthe mean data plane RMS (Rq) = 0.697nm.
(b) AFM image of a surface of NOA81 con-taining 1 wt% APTES for roughness analysis;RMS (Rq) = 0.665nm.
Figure 3.5: AFM roughness evaluation.
binding energy [eV] binding energy [eV] binding energy [eV]
Figure 3.6: Comparison of XPS spectra of pure NOA81 and NOA81 with 1% APTES by weight.Measurements were performed at 60◦ inclination for better surface sensitivity.
APTES mixed in NOA81 could then be excluded. Images of samples containing APTES were
much more difficult to acquire, most probably due to electrostatic forces, which resulted in a
blurring effect (as seen when Figure 3.5a and Figure 3.5b are compared).
This phenomenon, together with the fact that the induced hydrophobicity (resulting from
the additive APTES) was fading in water, already indicate, that the hydrophobicity of the
surfaces of samples containing APTES is based on a chemical modification. Indeed, XPS
measurements confirmed a different chemistry on the surfaces (see Figure 3.6). However,
our interpretation of XPS measurements could not go deeper in the understanding of the
changes in the surface chemistry, since the specific chemical identity of NOA81 is being
withheld as a trade secret by the provider. The polymerization of NOA81 is based on thiol-ene
crosslinking [120, 121] potentially enhanced by the use of isothiocyanates as the formation of
urethanes has been reported to be characteristic for NOA polymers [136]. In the latter case, the
formation of a urethane by means of amine-thiocyanate reaction is possible allowing APTES to
be chemically bound to the polymer chains [146, 152], which could be confirmed by the lower
51

Chapter 3. Characterization of Microfluidic Channels Made of UV-Curable Adhesive
sulfur concentration found on samples containing APTES. We expect the ends of the polymer
chains holding an APTES molecule to be exposed to the surface for entropy equilibrium
reasons. The resulting apolar methyl groups of APTES on the surface (fact supported by
the higher carbon concentration measured by XPS) would then be responsible for the more
hydrophobic surface.
3.3.3 Application
A method for the fabrication of a closed microfluidic channel with hydrophilic and hydropho-
bic surfaces was developed and is presented here as an application for the adjustable wetting
behavoir of NOA81 surfaces.
Fabrication process of closed, all-polymer microfluidic channels with adjustable wetting
behavior
Microfluidic channels with adjustable wetting behavior can be fabricated by adapting the
process described in section 3.1.1. Completely hydrophilic channels were fabricated by
exposing both parts to oxygen plasma before assembly. The joining of two NOA81 parts
containing APTES and further UV-curing resulted in an entire hydrophobic channel. With
the presented simple rapid prototyping technique, a closed, all-polymer microfluidic channel
with hydrophilic and hydrophobic surfaces in the same microfluidic channel can be realized
easily. A microfluidic channel with vertically separated wetting properties was achieved by
joining two differently modified parts: A hydrophobic thin sheet of NOA81 containing APTES
was combined with a hydrophilic structured part (treated with O2-plasma) or vice versa (see
Figure 3.7, left). Horizontal separation of the wetting properties was obtained, when the two
liquid polymers, NOA81 and NOA81 containing APTES, were casted on the same master at
the specific places; pure NOA81 at locations, which should be hydrophilic, NOA81 containing
APTES at locations, which have to be more hydrophobic in the end (see Figure 3.7, right).
Figure 3.7: Rapid prototyping methods for hybrid chips showing hydrophilic and hydrophobicsurfaces in the same microfluidic channel. Vertically (left) and horizontally (right) separatedwetting behavior can be achieved.
52

3.3. Adjustable Wetting Behavior
Figure 3.8: Left: Oil-in-water droplet generation: Ethyl acetate droplets generated in saliva (col-ored with amarant) in a hydrophilic microfluidic channel (flow rates: ethyl acetate 0.3µL/mi n,saliva 6µL/mi n). Right: Water-in-oil droplet generation: Saliva (colored with amarant)droplets generated in ethyl acetate in a hydrophobic microfluidic channel (flow rates: saliva0.5µL/mi n, ethyl acetate 20µL/mi n).
Applications for chemical resistant microfluidic chips with adjustable surface properties
As a first example, microfluidic flow-focusing devices (MFFD) were fabricated for oil-in-water
and water-in-oil droplet generation (see Figure 3.8). To allow oil droplet generation in an
aqueous environment, fully hydrophilic, pure oxygen-plasma treated NOA81 microchannels
must be used. First, they were filled completely with the aqueous solvent (saliva colored with
amarant) and then the organic solvent (ethyl acetate) was added through the channel located
in the middle. By adjusting the ratio of the flow rates of the aqueous to the organic solvent, the
droplet sizes can be varied. For water-in-oil droplet generation the opposite is valid, and fully
hydrophobic channels were needed. The hydrophobicity of NOA81 surfaces was induced by
mixing small amounts of APTES in the uncured polymer before molding as described before.
The microfluidic systems were able to withstand a pressure drop of more than 15 bar (flow
rate of 360µL/mi n) without any deformation, which is several times higher than what PDMS
based systems allow [122].
For the second application, an all-polymer hybrid channel (hydrophilic and hydrophobic
surfaces) was realized to demonstrate the successful handling of a multi-phase flow (see Figure
3.7, left). The microfluidic channels were T-shaped with two inlets and one outlet. For this
experiment the two fluids were introduced in the channels at the same flow rate of 1µL/mi n.
In pure, untreated NOA81 samples the organic solvent (toluene, 0.8669g /mL, similar density
as water) flowed next to the water (colored red with 5mM amaranth). However, when the same
fluids flowed in hydrophilic channels with a hydrophobic (NOA81 & APTES) cover, a vertical
separation of the laminar flow was established, with the organic solvent flowing preferentially
along the hydrophobic surface (see Figure 3.9a). This behavior was confirmed using a so called
microfluidic H-filter with two inlets, two outlets, and hydrophilic / hydrophobic side walls (see
Figure 3.7, right and Figure 3.9b). In this H-filter configuration, we clearly observe the aqueous
53

Chapter 3. Characterization of Microfluidic Channels Made of UV-Curable Adhesive
phase (red) separated from the organic phase (transparent) as it follows the hydrophilic walls
of the microfluidic channel. Both observations of the applications of the multi-phase flow
handling are consistent with previous studies of surface-directed liquid motion control in
microfluidic channels [153].
(a) (A) Microscopic top view of the junction of un-treated NOA81 channels (50µm wide, 20µm deep),where the organic solvent and the colored watermeet (same flow rate of 1µL/mi n). The two phasesare flowing next to each other. (B) Hybrid NOA81channel (50µm wide, 20µm deep) with a hydrophilic(solid line) bottom side and hydrophobic (dottedline) top side. The organic solvent and the coloredwater meet with the same flow rate of 1µL/mi n).A vertically separated laminar flow is established,whereupon the organic solvent flows alongside thehydrophobic surface.
(b) Microfluidic H-filter chip with two inlets andtwo outlets. Water colored with amaranth is intro-duced on the left-hand side, hexane on the right-hand side. (A) Schematic view of the situationon a chip without surface modification: A paral-lel laminar flow is established and the liquids stayon their appropriate side. (B) Schematic view onthe same situation on a chip with hydrophilic (solidline) and hydrophobic (dotted line) channel walls:The liquids are forced to switch sides and leave themain channel on the opposite side (water on thehydrophilic side, hexane on the hydrophobic side).(C) Picture of the situation on the real chip withmodified walls as described in (B).
Figure 3.9: Application of hybrid NOA81 chips.
3.4 UV-Characteristics
For the UV-curable adhesive NOA81, optical characterization for fluorescent based detection
systems is missing. In this section we present a comparison of fluorescent emission spectra of
various types of NOA as well as the time evolution of the spectra of the most promising one -
NOA81. As an application, we show the capillary electrophoresis (CE)-injection of a fluorescent
54

3.4. UV-Characteristics
dye, and its detection by means of fluorescence microscopy. This optical characterization of
NOA was presented in the µTAS 2010 conference [138].
3.4.1 Method
In the visible light range, NOA81 is transparent. For more specific optical characterization of
the material, samples of different NOA types were compared with PDMS samples (all of the
same uniform thickness, 2mm) using a spectrofluorimeter (Infinite M200, Tecan, Switzerland).
NOA samples were cured by exposure to UV-light (1.5mW /cm2 at 365nm wavelength for
22mi n). For the analysis, two different wavelengths were used for excitation (470nm and
546nm).
3.4.2 Results
At the excitation wavelength of 470nm, the fluorescence emission of NOA81 is higher than the
one of PDMS (see Figure 3.10a). But the emission intensity is only half of the intensity of NOA63,
which is recommended for fluorescence applications [154]. At the excitation wavelength of
546nm, NOA81 has a comparable fluorescence emission as PDMS (see Figure 3.10b). The low
auto-fluorescence of NOA81 at 546nm makes it as suitable as PDMS for fluorescence detection
based devices. Figure 3.11a shows the evolution of the fluorescent emission spectrum of
NOA81 at the excitation of 470nm. The intensity decreased after fabrication and was stable
after 8 days. For the excitation at 546nm, the spectra were stable already after 2 days (see
Figure 3.11b).
3.4.3 Application
As an application, we present the fluorescence microscopy detection of a CE-injected plug of
Rhodamine B in a chip made of NOA81.
Fabrication of a Capillary Electrophoresis Chip
The device for CE consisted of a classical T-channel (50µm wide, 20µm deep) and was fabri-
cated by rapid prototyping of NOA81 as explained before in section 2.4. For NOA81 molding, a
PDMS master was used, which was a replica of an isotropically etched glass wafer (see Figure
3.12a).
Fluorescence Microscopy Detection through a NOA81 Chip
The CE experiments were performed with a Zeiss Axiovert S100 fluorescence microscope (Carl
Zeiss AG, Germany) equipped with a Xenon 100W power light source and a high-sensitivity
CCD camera (Kappa AG, Germany). A programmable HVS 448-6000D 8-channel high-voltage
55

Chapter 3. Characterization of Microfluidic Channels Made of UV-Curable Adhesive
(a) Excitation at λex = 470nm. (b) Excitation at λex = 546nm.
Figure 3.10: Comparison of fluorescent emission spectra of different NOAs and PDMS asreference value. The spectra are recorded 20 days after chip fabrication. The gray regionaround each plot represents the standard deviation of the measurement.
(a) Excitation at λex = 470nm. (b) Excitation at λex = 546nm.
Figure 3.11: Evolution of fluorescent emission spectra of NOA81 for two different excitationwavelengths; directly after the UV-curing, 1 day after the fabrication, 2 days later, and aftera temperature treatment of 60◦ C for 2h, 8 and 20 days later. The intensity is decreasing andstable 8 days after the fabrication. The gray region around each plot represents the standarddeviation of the measurement.
56

3.5. Low-Cost Rapid Prototyping
supply (LabSmith, CA, USA) allowed to apply three different voltage sequences for the sample
loading and injection inside the separation channel of the microchip. We set the injection
method and the corresponding voltages according to [155]. As demonstrated by the intensity
profile in Figure 3.13, the fluorescence intensity peak of Rhodamine B was easily detectable in
the NOA81 microchannel thanks to the low autofluorescence of this material.
(a) Design of the microfluidic capillary electrophore-sis chip. The channel lengths are given in mm.
(b) Image of the microfluidic chip for capillary elec-trophoresis experiments made by rapid prototypingof NOA81.
Figure 3.12: Capillary electrophoresis chip.
(a) CE injection of a sample of Rhodamine B (200µM ,λex = 540nm,λem = 625nm) in a 10mM sodiumphosphate running buffer at pH 9. An electric fieldof 330V /cm was applied along the NOA81 sepa-ration channel. The plot shows the mean inten-sity measurement of a well defined plug over time,6.2mm away from the channel intersection.
(b) Relative pixel intensity picture of the RhodamineB plug captured by the CCD camera.
Figure 3.13: Capillary electrophoresis experiment in a polymer NOA81 chip.
3.5 Low-Cost Rapid Prototyping
For the rapid prototyping method presented in section 2.4 two things are important: First, the
material has to be able to wet the master and flow in between tiny structures to reproduce
them. Second, the material needs to show a good bonding strength to a substrate material,
which closes the microfluidic channels.
57

Chapter 3. Characterization of Microfluidic Channels Made of UV-Curable Adhesive
3.5.1 Replication Capability
NOA81 shows a really high replication capability. Even nano structures can be reproduced
as proven by the replica of an AFM XYZ-calibration nano-grid (see Figure 3.14). The nano
grid CS-20NG (Innovative Solutions, Bulgaria) shows structures of a pitch size of 500nm and a
vertical height of 20nm.
In the context of replication, the feature shrinkage from the master to the replica is important
as well. Relative to PDMS a neglectable shrinkage of less than 1% was measured for NOA81.
Values for the materials PDMS and NOA81 are given in Table 3.4.
(a) AFM XYZ calibration nano grid CS-20NG [156]. (b) AFM measurement of the replicated nanogrid.
Figure 3.14: Replication of nano structures by NOA81.
Table 3.4: Shrinkage of sizes of nanofeatures from master to replica.
Silicon-PDMS PDMS-NOA81
vertical 37,9±3,6% 0,4±0,5%
horizontal 0,4±0,5% 0,6±0,7%
58

3.5. Low-Cost Rapid Prototyping
3.5.2 Bonding Strength
A good bonding strength is important to be able to apply pressure on the liquids in the
microfluidic chip. We exposed test samples to oxygen plasma (2x 15s, 400W , 2.45G H z, 500−700mTor r , 400cm3/mi n O2 flow) for surface activation before bonding. The failure stress
was evaluated on 10mm x 10mm test samples with a pull tester (Instron 3344, UK) (see Figure
3.15). NOA81, bonded to a NOA81 surface, failed at 0.59MPa, the combination NOA81-glass
at 1.40MPa and NOA81 joined with a silicon substrate separated at 0.94MPa. These values
are all higher than the optimized bonding strength achieved with PDMS (see Table 3.5) [157].
(a) Tensile stress measurement until failure(debonding) of a NOA81 test part bonded on aglass substrate.
N O A 8 1N O A 8 1
N O A 8 1g l a s s
N O A 8 1s i l i c o n
0 . 00 . 20 . 40 . 60 . 81 . 01 . 21 . 41 . 61 . 8
tensile
stres
s [MP
a]
(b) Overview of failure stress for NOA81 test samplesbonded to different substrates. Error bars indicatethe standard deviation for at least three measurementcurves of each material combination.
Figure 3.15: Evaluation of the oxygen plasma bonding strength of NOA81.
Table 3.5: Comparison of the bonding strength of NOA81 and PDMS.
Substrate NOA81 PDMS[157].
NOA81 / PDMS 0.59MPa 0.40MPa
glass 1.40MPa 0.51MPa
silicon 0.94MPa n.a.
59

Chapter 3. Characterization of Microfluidic Channels Made of UV-Curable Adhesive
3.6 Summary
There has been an increasing need for novel materials with better chemical compatibility, easy
and more stable surface modifications, and a simple and cost-effective fabrication process.
In 2008, Norland Optical Adhesives (NOA81 and NOA63) were suggested as a substitute of
PDMS for rapid prototyping of microfluidic devices [122, 136]. These UV-curable glues were
originally designed to bond optical components or fiber optics, but are also well suited for
molding based replication of microfluidic structures [121, 122, 131, 136].
It was presented that NOA is a solvent-resistant (toluene), biocompatible (culture of HeLa cells)
material with native hydrophilicity enabling one to fill microfluidic channels with aqueous
solutions by capillary forces [121, 154]. Both NOA81 and NOA63 are transparent in the visual
range allowing observation of colored liquids or beads through the material. Besides the acti-
vation of the NOA81 surfaces by oxygen plasma, no report about other surface modifications
was found in literature.
In conclusion, several interesting aspects of an indeed promising, but widely unknown ma-
terial were presented. We performed a broad characterization of microfluidic channels to
evaluate NOA81 as chip material for the IrSens project.
NOA81 chips showed a much higher chemical resistance against organic solvents compared
to PDMS. Our chips were resistant against the IR-transparent (at a wavelength of 6µm) or-
ganic solvents n-pentane, n-hexane, cyclo-hexane, n-heptane, isopropyl alcohol, and tetra-
chloroethylene. Neither swelling, nor delamination was observed after 5 hours of exposure.
The solvents ethanol, toluene, methanol, and ethyl acetate showed slow delamination of the
chip bonding site (most probably due to swelling), and therefore they would be suited for
microfluidic experiments limited in time, e.g. on disposable systems.
Further, we presented a study of the adsorption of cocaine molecules by microfluidic devices
made of NOA81. Remarkable low adsorption values (up to 100% recovery rate) were found
by mass spectrometry measurements. This makes NOA81 to a potential polymer for forensic
applications.
This chapter also presented simple and reasonably stable wettability control procedures for
polymerized NOA81 surfaces. As an alternative to the vapor-phase surface treatments, the
same modification of the wetting behavior (change to hydrophobic) was achieved by mixing
an additive in the uncured, bulk polymer. This allows homogeneous control over the wetting
behavior, particularly of those parts located deep within closed microfluidic systems, which is
difficult to achieve with vapor-phase treatments. The wetting behavior of APTES-modified
NOA81 was due to changes in the surface chemistry and not from a modification in surface
topography.
Some aspects important for rapid prototyping were investigated as well. NOA81 was able
to reproduce by molding nanostructures with a neglectable feature shrinking. Compared to
PDMS, NOA81 showed also better bonding capabilities to substrates such as silicon, glass or
the polymer itself.
60

3.6. Summary
A new suitable polymer chip material was found meeting all the relevant material requirements
given by the application in the project IrSens, such as the compatibility to IR-transparent
solvents, the low cocaine adsorption, the adjustable wetting behavior as well as the suitability
for low cost prototyping. In this chapter the mentioned material properties were investigated
and illustrated by different applications.
61


4 Robust Droplet Generation Based ona Simple Geometry
This chapter introduces our robust method to generate continuously droplets of an organic
solvent in the inhomogeneous saliva without clogging. The robustness of the simple geometry
is proofed by using the complex fluid saliva together with the organic solvent PCE to generate
droplets. Furthermore, the main influences on the droplet size are investigated.
The results shown here, were presented at the µTAS 2012 conference in Japan [158].
4.1 Introduction
Besides drop on demand techniques [159], most of the microfluidic methods produce droplets
through passive techniques. In order to produce droplets, the dynamic flow field in such
passive devices is used to deform the interface between two immiscible liquids and therefore
induce interfacial instabilities. Based on the different physical droplet generation mechanisms,
the passive devices can be split in three main groups as suggested by [4]: i) breakup in co-
flowing streams (Figure 4.1a), ii) breakup in cross-flowing streams (Figure 4.1b) and iii) breakup
in elongational strained flows (Figure 4.1c). The droplet size is set by a competition between
the pressure caused by external flow and viscous shear stresses on the one hand and the
capillary pressure based on the interfacial tension resisting the deformation on the other
hand.
i) Breakup in Co-Flowing Streams
For this droplet generation mechanism, a co-axial injection device is used, e.g. a thin cylindri-
cal capillary in a squared microfluidic channel as shown in Figure 4.1a. The dispersed phase
is injected through the capillary. The physics responsible for the breakup in droplets is the
Rayleigh-Plateau instability [160].
63

Chapter 4. Robust Droplet Generation Based on a Simple Geometry
(a) Co-axial injection device:breakup in co-flowing streamsbased on Rayleigh-Plateauinstability.
(b) T-shaped junction: breakupin cross-flowing streams based onshear stress and flow obstruction.
(c) Flow-focusing device: breakupin elongational strained flowsbased on hydrodynamic focusing.
Figure 4.1: State of the art of passive droplet generation devices [4].
ii) Breakup in Cross-Flowing Streams
Droplet generation in a T-junction shown in Figure 4.1b was first reported by [161]. Two
different regimes for droplet generation can be distinguished [162]. If the side-channel is
smaller than the main channel, droplets rip off at the junction based on shear-stress. If
the dimension of the side-channel is comparable to the main channel, the dispersed phase
entering through the side-channel blocks the main channel. Pressure is built up by the
continuous phase in the main channel behind the plug of the dispersed phase until a droplet
is pinched off.
For large scale droplet generation in high-throughput applications, the structures used for
droplet generation are arranged in parallel. For breakup in cross-flowing streams two different
mechanisms were reported. Firstly, the microchannel emulsification (MCE) was introduced
by [163] and applied by [164, 165] (see Figure 4.2a). They inject the dispersed phase through
an array of small side channels (orthogonal, in plane), over a terrace, into the main channel
containing the continuous phase. The droplets are generated upon entering the main channel
due to shear-stresses and Laplace pressure gradients (between the side and the main channel)
[166].
Secondly, droplets are produced using only shear-stresses when the dispersed phase is pushed
from perpendicular side channels into the main channel (see Figure 4.2b). These systems were
called straight-through microchannel emulsification devices (SMCE) [167, 168] or micro-sieve
devices [169].
iii) Breakup in Elongational Strained Flows
Hydrodynamic Focusing The flow focusing device for droplet generation shown in Figure
4.1c was first presented by [171, 172]. Here the dispersed phase is squeezed by two counter-
flowing streams of the continuous phase and focused through a nozzle (hydrodynamic focus-
ing). Droplets are generated after relaxation in a wider collection channel also based on the
Rayleigh-Plateau instability. Here four different main regimes of droplet generation can be
observed: squeezing, dripping, jetting, and thread formation. Droplet diameters depend on
64

4.1. Introduction
(a) Droplet breakup in cross-flowing streams: schematic ofa microchannel emulsificationdevice [164].
(b) Droplet breakup in cross-flowing streams: schematic of astraight-through microchannelemulsification device [168].
(c) Droplet breakup in elonga-tional strained flows: array of struc-tures using hydrodynamic focus-ing [170].
Figure 4.2: Parallelization of droplet generation features for high-throughput applications.
many parameters, but also depend linearly on the flow rates. For the different regimes as well
as for the prediction of the droplet size no clear laws are available [4].
For high-throughput applications, parallelization of many droplet-generating features using
hydrodynamic focusing was introduced by [170] (see Figure 4.2c).
Capillary Focusing Droplet generation by capillary focusing is another physical mechanism
to break up droplets in elongational strained flows. Here the devices called nano-terrace
(shown in Figure 4.3), consist of a nano-scale channel (nano-terrace) ending up in a deeper
and larger microfluidic channel (reservoir) as first reported by [12, 173]. Both fluids are flowing
in parallel over the nano-terrace separated by a meniscus which induces a cross-stream
pressure difference (laplace pressure, see section 1.1). The fluids are forced to balance their
pressures when arriving at the reservoir, meaning the dispersed phase has to move locally
faster. Based on the insufficient supply of the dispersed phase, the droplets are snapped-off.
The droplet size was reported to be linearly related to the nanochannel height [12].
Figure 4.3: Nano-terrace device: breakup in elongational strained flows based on capillaryfocusing [12].
65
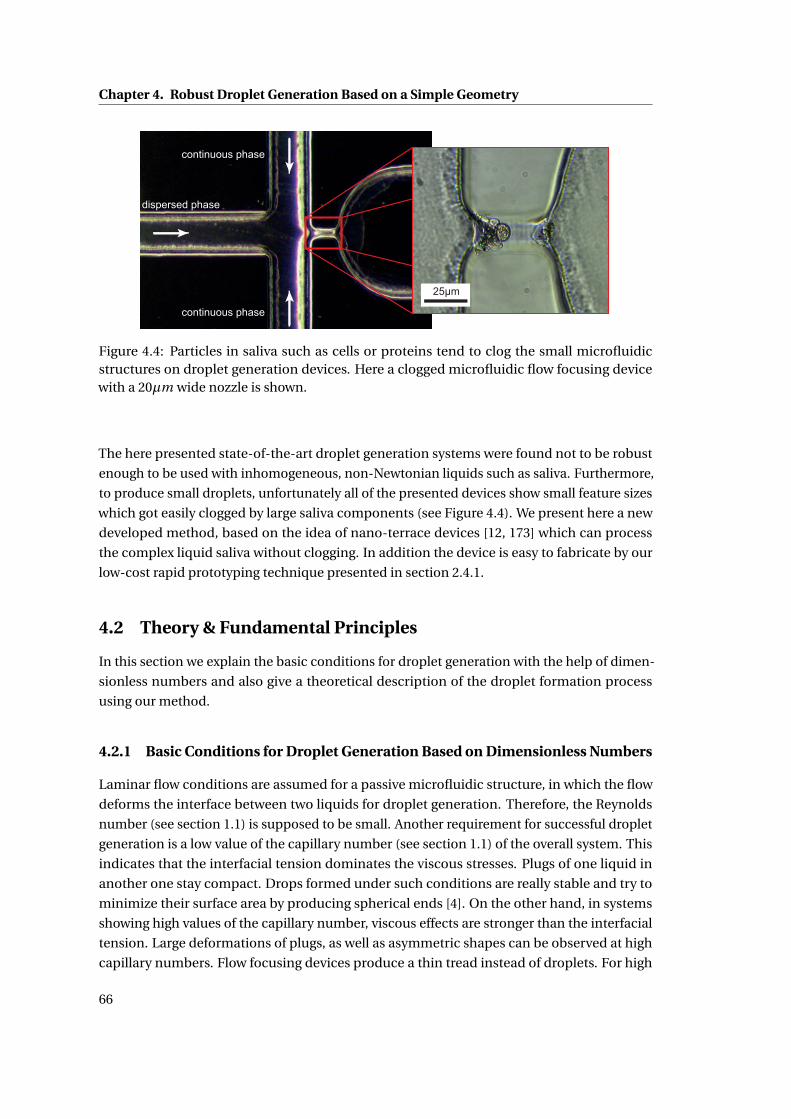
Chapter 4. Robust Droplet Generation Based on a Simple Geometry
Figure 4.4: Particles in saliva such as cells or proteins tend to clog the small microfluidicstructures on droplet generation devices. Here a clogged microfluidic flow focusing devicewith a 20µm wide nozzle is shown.
The here presented state-of-the-art droplet generation systems were found not to be robust
enough to be used with inhomogeneous, non-Newtonian liquids such as saliva. Furthermore,
to produce small droplets, unfortunately all of the presented devices show small feature sizes
which got easily clogged by large saliva components (see Figure 4.4). We present here a new
developed method, based on the idea of nano-terrace devices [12, 173] which can process
the complex liquid saliva without clogging. In addition the device is easy to fabricate by our
low-cost rapid prototyping technique presented in section 2.4.1.
4.2 Theory & Fundamental Principles
In this section we explain the basic conditions for droplet generation with the help of dimen-
sionless numbers and also give a theoretical description of the droplet formation process
using our method.
4.2.1 Basic Conditions for Droplet Generation Based on Dimensionless Numbers
Laminar flow conditions are assumed for a passive microfluidic structure, in which the flow
deforms the interface between two liquids for droplet generation. Therefore, the Reynolds
number (see section 1.1) is supposed to be small. Another requirement for successful droplet
generation is a low value of the capillary number (see section 1.1) of the overall system. This
indicates that the interfacial tension dominates the viscous stresses. Plugs of one liquid in
another one stay compact. Drops formed under such conditions are really stable and try to
minimize their surface area by producing spherical ends [4]. On the other hand, in systems
showing high values of the capillary number, viscous effects are stronger than the interfacial
tension. Large deformations of plugs, as well as asymmetric shapes can be observed at high
capillary numbers. Flow focusing devices produce a thin tread instead of droplets. For high
66

4.2. Theory & Fundamental Principles
Figure 4.5: The schematics illustrate the influence of a small or large value of the capillarynumber (Ca) on a plug flow and the flow behavior in a flow focusing device. At low capillarynumbers a plug remains compact and highly spherical droplets can be produced by a flowfocusing device. At large capillary numbers, plugs get deformed and show asymmetric shapes.Under such conditions a flow focusing device produces a thin (sometimes piling) tread insteadof droplets.
viscous core-annular flows also piling of the tread was observed [174]. The mentioned flow
characteristics are visualized in Figure 4.5.
Small values of the Reynolds number and the capillary number of a microfluidic system do
not exclude inertial effects in certain situations of local high-speed flows such as the droplet
breakup situations [4].
4.2.2 Droplet Generation at a Step Between a Shallow and a Deep MicrofluidicChannel
The droplet generation at a step between a shallow and a deep microfluidic channel can be
explained theoretically by the capillary focusing effect. A quantitative theory for this effect
was developed to explain the droplet generation in nano-terrace devices (see Figure 4.3) [12].
The continuous phase and the dispersed phase are brought together in a microfluidic channel.
The two liquids flow side by side in the shallow channel before the step. They are separated by
a meniscus which induces a cross-stream pressure difference between them (Laplace pressure,
hydrodynamic constraints). The two liquids are forced to balance their pressures when they
arrive at the larger volume of the deeper channel (pressure drop of approximately 2γh , where h
is the inlet channel (also refer to Figure 5.6) height and γ the interfacial tension [173]). This
pressure drop causes an acceleration of the dispersed phase, leading to a thread thinning
(tongue-like shape) and subsequent a snap-off of the droplet due to the insufficient supply by
the dispersed phase (see droplet generation sequence in Figure 4.6).
67

Chapter 4. Robust Droplet Generation Based on a Simple Geometry
Figure 4.6: PCE droplet generation in saliva by the capillary focusing effect at the step downafter the 50µm deep microfluidic inlet channel. The liquids flow from right to the left over thestep: 8µL/mi n saliva, 2µL/mi n PCE. Droplet generation with a period of ∼ 30ms.
4.3 Design
For our droplet generation method only a simple step in the microfluidic channel was required.
Figure 4.7 provides a 3D schematic of the droplet generation devices. Droplets were generated
from a microfluidic channel into the microfluidic outlet of the chip as shown in Figure 4.7a.
If the droplets needed to be further processed on the microfluidic chip, the generation took
place at the step between a shallow and a deep part of the microfluidic channel (see Figure
4.7b).
Such a simple step was easy to build with the developed rapid prototyping technique using
multilayer scotch-tape masters as presented in section 2.4.1, because the lateral dimensions
were found not to be of critical importance (see section 4.4.3). However, for well controlled
droplet generation a clearly defined edge of the step is required (straight cut with a scalpel),
otherwise the PCE tongue could split into two filaments (symmetric or asymmetric) producing
droplets in parallel (satellite droplets) as also observed in nano-terrace device by [173].
4.4 Results
In this section we first verify the basic conditions for PCE droplet generation in saliva by
checking the values of the dimensionless numbers. Then the droplet generation mechanism
is presented. The influences on the droplet size are investigated and the flow field during the
generation process is described by observations using fluorescent beads mixed in saliva. Also
the potential for high-throughput droplet generation is demonstrated.
68

4.4. Results
(a) Droplet generation at the outlet of a microfluidic channel.
(b) Droplet generation at the step down between a shallow and a deep microfluidic channel.
Figure 4.7: Schematic of the droplet generation devices.
4.4.1 Basic Conditions for PCE Droplet Generation in Saliva
The Reynolds number (see equation 1.9 in section 1.1) as well as the capillary number (see
equation 1.10 in section 1.1) of the microfluidic system need to show a low value to allow
droplet generation. Both were calculated here for our system according to the theory given in
section 1.1 with the values listed in table 4.1. For comparison, the capillary number was also
calculated by a specific formula for the nano-terrace device given by [12]. All calculated values
are low (< 1), which indicates good conditions for droplet generation.
Re = ρv0L0
η= 0.1987
C a = ηv0
γ= 0.0005
C anano−ter r ace = 6ηv0wnano−ter r ace
γhnano−ter r ace= 0.0283
69

Chapter 4. Robust Droplet Generation Based on a Simple Geometry
Table 4.1: Values used for the calculation of the Reynolds number and the capillary number.
symbol quantity value remark
ρ density 1000N s2/m4 density of continuous phase: water(saliva)
v0 characteristic velocity 0.0066m/s assuming 20µL/mi n in the 50µm x1mm inlet channel
L0 characteristic length 0.00005m inlet channel height
wnano−ter r ace characteristic width 0.0005m 12 inlet channel width, as suggested by[12]
hnano−ter r ace inlet channel height 0.00005m
η viscosity 0.00166N s/m2 viscosity of continuous phase, mea-sured at low shear rate, see section2.1.6
γ interfacial tension 0.0232N /m see section 5.1
4.4.2 Robust Droplet Generation
As already presented in Figure 4.6, we found an absolutely simple and robust method to
generate droplets without clogging. At the step we were able to produce droplets of uniform
size. The variations of the droplet diameters were found to be smaller than 3%.
The droplet generation method was independent of the microfluidic chip material, but the
materials surface energy determined whether oil or water droplets were generated in the
two-phase system. Oil-in-water droplet generation, such as the PCE droplet generation in the
aqueous saliva, required a hydrophilic chip. Inversely using a hydrophobic chip, water droplets
were generated. We verified this phenomenon by producing water droplets in a hydrophobic
PDMS chip. As oil-phase, the PDMS compatible [125, 175] organic solvent perfluorodecalin
was used.
Furthermore, the orientation of the droplet generation chip and the density of the liquids were
not relevant. Figure 4.6 shows downward droplet generation, whereas Figure 7.10 presents
upward droplet generation. Our system for PCE droplet generation in saliva showed for the
Bond number a small value of 0.066, which also stated that the gravity effects could be ignored
(see section 1.1).
4.4.3 Investigations on the Droplet size
The diameter of droplets generated with our method at a step, mainly depended on the height
of the inlet channel; the higher the inlet channel, the larger the diameter of the generated
70

4.4. Results
0 50 100 150 200 250 300 350 4000
100200300400500600700800900
10001100120013001400
(a) The diameter of the droplets mainly depends(linearly) on the inlet channel depth.
0 1 2 3 4 5 6 7 8 90
100200300400500600700800900
10001100120013001400
(b) As secondary effects also the higher flow rateratio and the higher total flow rate can increase thedroplet size. Here droplets generated from a 50µmdeep channel were investigated.
Figure 4.8: Influences on the diameter of the droplets. Error bars indicate the standarddeviation for at least 10 measurements.
droplets. We observed the droplet diameter to be 3-5 times larger than the inlet channel height.
Figure 4.8a shows the linear dependence of the droplet size on the inlet channel height. Such
a linear relation was also observed for the droplets generated by a nano-terrace device [12].
Beside this linear dependence on the inlet channel height, we also found secondary influences
such as the ratio of the flow rates of the two immiscible liquids or the total flow rate (see Figure
4.8b). Applying a higher flow rate of the dispersed phase liquid (in our case PCE) resulted in a
longer feeding time of the droplet before the snap-off and accordingly to droplets of larger
diameter. As mentioned also the higher total flow rate resulted in larger droplet diameter. We
assume in this case the higher flow rate stabilized the PCE thread in saliva before the snapp-off
and thus also allowed a longer feeding time (droplet generation explanation in section 4.2.2).
The dependence of the droplet size on the width of the inlet channel was also investigated.
Droplets generated in 50µm high channels of different widths (800µm,1200µm,2000µm) were
compared. No tendency was observed, neither by repeating the experiment at different total
flow rates.
4.4.4 Flow Field Characteristics during Droplet Generation
The flow field during PCE droplet generation in saliva with our method was explored by using
fluorescence microscopy. Fluorescent beads (Polybead Barboxylate Microspheres, diameter
0.452µm, Polysciences, Germany) were used to visualize the flow during droplet generation.
The beads got excited with blue light through a filter (BP 450−490nm). The emitted light of the
beads was collected after a color splitting mirror (cut FT 510nm) excluding the excitation light
and another filter (BP 515−565nm). The experiments were performed with a Zeiss Axiovert
71

Chapter 4. Robust Droplet Generation Based on a Simple Geometry
Figure 4.9: Fluorescence microscopy image of the same situation (horizontally mirrored) asshown in step 3 of Figure 4.6: Slug flow of PCE in saliva spiked with fluorescent beads passingover the step down (100µm to 400µm deep channel) forming a PCE droplet (main liquid flowrates from the right to the left: 20µL/mi n saliva, 5µL/mi n PCE). The directions of the motionof the fluorescent beads are highlighted in the figure with white arrows. Black arrows indicatethe PCE flow. While the droplet was formed, small vortexes got established on both sides ofthe tongue for a few milliseconds.
S100 fluorescence microscope (Carl Zeiss, Germany) equipped with a Xenon 100W power light
source and a high-speed camera (Phantom V210, Vision Research, USA). The visualization
of the flow using fluorescent beads was only feasible due to the low autofluorescence of the
microfluidic chip material NOA81 (see section 3.4).
Our overall system for droplet generation showed laminar flow conditions with a low value
of the Reynolds number (see section 4.4.1). During the droplet generation process inertial
effects can be observed in certain situations of local high-speed flows as stated by [4]. Figure
4.9 shows the location of the step for droplet generation. The slug flow of PCE (dark no beads)
in saliva (spiked with fluorescent beads) passing over the step was forming a PCE droplet.
While the droplet was formed, we observed vortexes on both sides of the PCE tongue for a
few milliseconds. The directions of the motion of the fluorescent beads are highlighted in
the figure by means of white arrows. Black arrows indicate the PCE flow. The PCE droplet
generated in the deeper channel does not appear dark, because it is surrounded by saliva
containing fluorescent beads.
In the same location, a time dependent series of fluorescence microscopy images is shown
in Figure 4.10. Here the main directions of the motion of the fluorescent beads are indicated
by white arrows. First saliva was flowing around the tip of the PCE slug (tongue) as a laminar
flow. The PCE tongue was growing in the direction of the step (at 37ms). When the tip
of the tongue slopped over the step, its shape changed immediately, which induced a first
generation of vortexes on both sides of the tongue (at 77−86ms). These vortexes were able
to bring fluorescent beads from locations close to the channel wall in the proximity of the
72

4.4. Results
100µm
0ms
37ms
77ms
58ms
94ms
86ms
95ms
99ms
96ms
91ms
Figure 4.10: Series of fluorescence microscopy images to visualize the flow during the PCEdroplet generation (compare with images of the droplet generation process shown in Figure4.6) in saliva spiked with fluorescent micro beads (diameter of beads 0.452µm). Main flowrates from right to the left: 20µL/mi n saliva, 5µL/mi n PCE.
73

Chapter 4. Robust Droplet Generation Based on a Simple Geometry
PCE tongue (91−95ms). While the droplet was growing, the PCE feeding tread was shrinking
to a sharp tip (95ms). The snap-off of the PCE droplet pulled saliva from both sides to the
center of the channel where the two saliva streams clashed together and created a second
generation of smaller vortexes rotating in the opposite direction as the first generation (96ms).
Afterwards the flow of saliva was again laminar around the PCE tongue (99ms) as observed at
the beginning of the cycle (0ms).
4.4.5 Parallelization of the Droplet Generation
Our droplet generation method was successfully applied for high-throughput applications. To
generate many droplets at once, several input channels were combined for droplet generation
into a common outlet. Figure 4.11 shows a chip with the parallelization of four inlet channels.
An estimated throughput in the range of 1L/h could be reached with our device.
(a) Chip for parallelized droplet generation. Several(here 4) channels supply the liquids (blue: inletsof the aqueous phase, yellow: inlets of the organicphase) for droplet generation at the central outlet.
(b) Our normal setup for droplet generation wasused (see section 2.5). The insert shows a camera im-age of 4 channels generating droplets in parallel (ineach channel: saliva at 8µL/mi n, PCE at 2µL/mi n).
Figure 4.11: Parallelization of the droplet generation allows high throughput.
4.5 Discussion
With our robust droplet generation method we produced monodispersed droplets with a
variation of the droplet diameter smaller than 3%, which is comparable to the variation of 1%
achieved with the much more expensive and complex nano-terrace devices [12].
Also the liquid supply for our devices was straight forward by using common syringe pumps.
Nano-terrace devices ask for an additional integrated flow control system to reduce the flow
rates to the nL/mi n range [173, 176].
The diameter of the droplets generated at the step was linearly related to the inlet channel
height like in nano-terrace devices [12]. With our method we also observed secondary influ-
ences such as the ratio of the flow rates of the two liquids or the total flow rate. For nano-terrace
devices no obvious secondary effects were observed [12, 173].
Thus, under certain conditions, we are able to predict the size of the generated droplets. With
74

4.6. Summary
our method we can design a device to create droplets as required, which is not possible or
much more challenging for other droplet generation systems such as the flow focusing devices
[4, 173].
Applications for microfluidic droplet-generating devices in various fields including food,
cosmetic, pharmaceutical, and chemical industry require high-throughput devices. This
challenge is approached on microfluidic chips by parallelization of the droplet-generating
features (see Figure 4.2). As presented in section 4.4.5, parallelization is also possible with
our droplet generation method. The limiting factor, not only for our method, is not the dense
packing of microfluidic structures, but the limited space available for connectors and the
tubing (connection to the macro world) [170, 177].
Lack of space for fluidic connectors can be avoided by using microchannel emulsification
devices, but they are not efficient enough for industrial applications [178].
We observed vortexes during the droplet generation process. Vortexes allow faster mixing
on chip, which is normally a challenging task for microfluidic devices with laminar flow
conditions [179, 180]. The vortexes generated with our device enable much better mixing
(higher extraction efficiency, see chapter 6) than co-flow devices such as microfluidic H-filters,
where material transfer is limited to diffusion processes. Vortexes were also observed in other
droplet generation devices [4], such as the flow focusing devices, but they tend to clog much
faster by using saliva samples (see Figure 2.7).
4.6 Summary
We aimed to develop a new droplet generation method based on the ideas of [12, 173], but
which is able to process the complex liquid saliva without clogging. In addition, the device
should be easy to fabricate by using our low-cost rapid prototyping technique.
A simple step was found to be the geometry of choice for robust PCE droplet generation in
human saliva. No small features were involved which could be clogged by saliva components.
Our droplet generation method was even independent of the chip orientation and generated
monodispersed droplets (smaller than 3%). Droplets were produced at the microfluidic outlet
or at a step in a microfluidic channel to further process the droplets on chip. The developed
droplet generation method also allowed high throughput by parallelization of the droplet
generation feature. The droplet size was mainly related (linearly) to the geometry of the
device (inlet channel height), which allowed to predict the droplet size. Vortexes observed
during the droplet generation process enhanced mixing, which is usually difficult to achieve
in microfluidic channels due to the laminar flow.
75


5 Passive Phase Coalescence of OrganicSolvent Droplets Dispersed in Saliva
This chapter presents our approach to merge organic solvent droplets dispersed in a continu-
ous aqueous phase, or more specific to merge PCE droplets in human saliva. We had to find a
solution not only to merge two droplets, but a device which is merging continuously dispersed
droplets to a continuous phase, because only in a continuous phase the optical detection (by
means of waveguide spectroscopy) of the cocaine can be performed (see chapter 7).
Parts of the results shown here, were presented at the µTAS 2012 conference in Japan [158].
Some of the prototypes of physical merging devices were fabricated in the framework of an
EPFL student project [181].
5.1 Introduction
Separation of the dispersed and continuous phase of a two phase droplet system is a subject
of considerable importance in chemical engineering. To run a droplet merging process on
microfluidic chip-level scale is still a challenge, since often macrofluidic methods such as the
gravitational or the centrifugational approach cease to hold in applications using continuous
flows in microfluidic channels. First, we present here the influence of surfactants and the
interfacial tension of the involved liquids on the droplet stability, and afterwards different
approaches for microfluidic passive coalescence.
5.1.1 Surfactants and Interfacial Tension
In general (in a system without surfactants), droplets show a higher tendency to merge when
the interfacial tension between the involved liquids is lower [182].
Surfactants lower the interfacial tension, but they also have a strong influence on emulsions
and are generally used to stabilize droplets against coalescence. Surfactant molecules arrange
themselves perpendicular to the interface as a monolayer between the two phases; the polar
hydrophilic part facing the aqueous phase and the apolar hydrophobic part facing the organic
77

Chapter 5. Passive Phase Coalescence of Organic Solvent Droplets Dispersed in Saliva
Figure 5.1: The figure on the left shows heptane droplets generated in colored (with ama-rant) water by a flow focusing device (see Figure 4.1c) which merge spontaneously furtherdownstream in the microfluidic channel (Figures further to the right are further downstream).
phase. This adsorption at the liquid-liquid interface is the reason for the reduced interfacial
tension. Increasing the interfacial tension in a system with surfactants results in separation of
the surfactant molecules at the liquid-liquid interface (rupture of the surfactant monolayer)
and allows better merging [182].
Droplets of organic solvents, such as PCE or heptane, generated in pure water merge sponta-
neously in a microfluidic channel as demonstrated in Figure 5.1. However, micro droplets of
organic solvents generated in saliva are stable. The reason for this behavior is found in the
surfactant proteins SP-A, SP-B, SP-C, and SP-D enclosed in saliva. These surfactants avoiding
the coalescence, are responsible in the human body for the immune defense [183].
These facts were confirmed by comparing interfacial tension measurements in the water-
PCE system and the saliva-PCE system. The interfacial tension between water and PCE is
γw ater−PC E = 47.48mN /m [184]. A much smaller value of γsal i va−PC E = 8± 2mN /m was
measured for the interfacial tension between saliva and PCE using a Kibron AquaPi (EZ-Pi)
surface-tensiometer (Krüss, Germany).
For verification the interfacial tension was calculated alternatively by using Antonov’s rule
(see equation 1.8 in section 1.1) and the surface tension of the liquids measured against air. A
surface tension for PCE of γPC E = 32.2±0.1mN /m was measured (reference literature γPC E =31.7mN /m [68]) and for the filtered, buffered, and spiked saliva (see section 2.1.4) a value of
γsal i va = 55.4±0.6mN /m was measured (reference literature γpur esal i va = 24.6−67.2mN /m
[185]). This resulted in a calculated interfacial tension between saliva and PCE ofγsal i va−PC E =23.2mN /m which is more than the initially measured value of γsal i va−PC E = 8±2mN /m, but
is still significantly less than the interfacial tension between water and PCE.
5.1.2 Different Approaches for Microfluidic Passive Coalescence
To date most of the microfluidic systems made for droplet coalescence only merge pairs of
droplets (batch like process) [186, 187]. Though, in the field of microfluidics a wide variety
of microfluidic devices has been employed for merging droplets. They can be divided into
two categories: passive and active coalescence devices [188]. Passive devices use specialized
78

5.1. Introduction
(a) Droplet collision device. Twoupstream T-junctions are used togenerate droplets as shown in inset(A). The resulting droplet streamsinteract at a third T-junction down-stream. The merged droplets thenflow into a single outlet as shownin inset (B) [190].
(b) Channel width modulation de-vice; Time sequence showing adroplet pair passing through asymmetrical coalescence cham-ber: approach, collision, relax-ation, separation, fusion, and exit.The width expands from 36µm to72µm. From top to bottom, thetime elapses as followed in ms: 0,3, 5, 7, 7.1, and 10 [186].
(c) Pillar induced merging; a firstdroplet is immobilized in a pil-lar array due to surface tension.The continuous phase is allowedto pass by. A second arrivingdroplet is pushing from behind un-til compressive coalescence hap-pens [187].
Figure 5.2: State of the art of droplet merging devices.
geometries or surface wetting to cause merging. Active devices employ external forces such as
electrical or magnetic fields [189]. Active devices are able to achieve a higher degree of control
and flexibility, but this goes along with increased system complexity and higher cost. Here we
will focus on the most widely used passive devices with the end goal in mind of fabricating a
merging device for a low-cost, disposable, polymer diagnostic chip.
Collision Merging
For collision merging the droplets collide and are pressed together by the liquid flow until
coalescence happens. Figure 5.2a shows an example of a collision device, in which droplets to
be merged are brought together via two separate channels at a T-junction [190]. This approach
requires precise synchronization of the droplets and tuning of flow parameters to ensure
merging.
Channel Width Modulation
A popular form of droplet merging is to widen up the channel, either gradually or abruptly,
taking advantage of Bernoulli’s principle to slow down the front drop and thus bringing the
second drop in close proximity. At this point, compressive merging can occur. The channel
is then narrowed again which causes decompressive merging due to the acceleration of the
first droplet into the narrower part of the channel (Bernoulli effect). A gradual change in the
width of the channel allows merging for a wider range of droplet sizes and flow rates [186].
Figure 5.2b presents a channel width modulation device; the time sequence shows a pair of
79

Chapter 5. Passive Phase Coalescence of Organic Solvent Droplets Dispersed in Saliva
droplets passing through a symmetrical coalescence chamber; approach, collision, relaxation,
separation, fusion, and exit.
Pillar Induced Merging
A more complex to fabricate device, uses an array of pillars to immobilize one or more droplets,
allowing compressive merging to occur (see Figure 5.2c). Multiple drops may be held in the
array of pillars, depending on the number of pillars (length of the pillar array). The final drop
size may be tuned by changing the length of the pillar array. When the array is occupied, the
pressure at the inlet of the array increases due to the blockage of the channel. This overcomes
the force of surface tension holding the merged droplet in the array and pushes the merged
droplet out of the array. In case the droplets were not merged due to compressive merging,
then decompressive merging can occur, when the first droplet leaves the pillar array. This
opportunity for both types of merging (compressive and decompressive) to occur makes this
type of device quite robust.
Surface Wettability
Surface modification can be used to induce fusion of several droplets flowing through a
microfluidic channel. The effect is based on a surface energy pattern on the walls of the
channel. A device to merge aqueous droplets dispersed in an oil by a short hydrophilic part in
an intrinsic hydrophobic channel was presented in [191]. This merging approach does not
seem to be so robust and depends on many parameters such as the surface energy, droplet
size, channel size, and the flow rates.
Phase inversion
While there has been much investigation on merging two droplets (batch process), relatively
little literature exists for continuous phase inversion through passive droplet coalescence
(continuous process). A so called ’phase inversion’ device is shown in Figure 5.3. This design
offers insight into how our goal of continuous droplet coalescence may be achieved: the con-
tinuous phase is removed by perpendicular drainage channels and the droplets are collected
in a chamber downstream. The droplets merge when they get accelerated towards the smaller
channel exit by decompressive merging [192].
Based on the examples presented in this introduction, we first tried to merge the PCE droplets
dispersed in saliva by chemical approaches. Since this was not successful, we focused on the
physical approach - the mechanical deformation of the droplets.
80

5.2. Theory & Fundamental Principles
Figure 5.3: Phase inversion device: The continuous phase is removed by perpendiculardrainage channels and the droplets are collected in a chamber downstream. The dropletsmerge when they get accelerated towards the smaller channel exit. [192].
5.2 Theory & Fundamental Principles
5.2.1 Droplet Coalescence Stages
The droplet coalescence process can be broken into four distinct stages: 1) initial approach; 2)
drainage of the continuous phase separating the droplets; 3) film rupture and 4) confluence
[186]. In certain cases these steps can be closely linked or one or more steps may occur
spontaneously.
5.2.2 Compressive Merging
The simplest and best known merging method is called compressive merging, in which
droplets are compressed and brought in close proximity. The Van der Waal’s forces then
pull the droplets in contact and drain the remaining continuous phase between them [186].
Depending on factors such as interfacial tension, availability of surfactants, temperature, etc.,
the film will rupture more or less spontaneously and the droplets will merge. Examples for
the compressive merging principle are the collision merging or pillar induced merging (see
section 5.1.2).
5.2.3 Decompressive Merging
This merging method may be more robust than compressive merging due to the active
drainage of the fluid between the droplets [186]. However, a more complex mechanism
is involved here. Droplets which are close together are pulled apart, reducing the pressure be-
tween them. Therefore, the fluid film is drained and the surfaces deformed in locally stressed
interfaces. On both droplets a nipple of a small radius and therefore high Laplace pressure
occurs (see also section 1.1) [186, 193]. This causes the interface to rupture and to form a
bridge between the droplets. Once such a bridge is established, the droplets will confluence.
Examples for the decompressive merging principle are the channel width modulation merging
or the phase inversion merging (see section 5.1.2).
81

Chapter 5. Passive Phase Coalescence of Organic Solvent Droplets Dispersed in Saliva
Figure 5.4: Observation of an avalanche of coalescence events. The time corresponding to thesuccessive images (downwards), are indicated in the figure.[194].
5.2.4 Avalanche Coalescence
If the droplets are already in close contact, a single merging event may cause further merging
events in an avalanche effect [192, 194]. The shape relaxation of two droplets merging may
induce decompressive merging in nearby droplets as shown in Figure 5.4. The probability
of merging depends on the angle between the droplets during coalescence, with highest
probability of merging, when the droplets are aligned in a row (co-linear) [192].
5.3 Design
Merging droplets of organic solvents in human saliva is a challenging task due to the presence
of surfactant proteins as introduced in section 5.1. We designed and tested several chemically
assisted merging approaches which are presented in section 5.3.1. Unfortunately these ap-
proaches were found not to be successful. More promising was the physically assisted merging
method presented here in section 5.3.2. The physically assisted merging method deforms the
droplets to allow compressive and decompressive merging (see section 5.2). Furthermore, this
section presents the method and the developed layout of our microfluidic chip.
5.3.1 Chemically Assisted Merging Approaches
Increasing pH value The pH value of saliva was increased up to ∼ pH12 by means of a
sodium hydroxide solution (0.1mol/L). With this approach we tried to make some of the
surfactants in saliva completely apolar and consequently inactive. PCE droplets remained
stable and did not merge.
82

5.3. Design
Surfactants We added different surfactants (Triton X-100, cetyl trimethylammonium bro-
mide (CTBA), dioctyl sodium sulfosuccinate(DSS) and isopropyl alcohol (IPA)) in different
concentrations (0.01%, 1%, and 5%) to saliva. Surfactants align themself as a monolayer at
the interface between the aqueous and organic phase and generally stabilize the droplets
which is actually the opposite of what we aimed for. We added surfactants of different size and
different structure than the natural surfactant proteins of saliva. Thereby, we tried to destroy
the monolayer of the natural saliva surfactant proteins and to allow coalescence. PCE droplets
remained stable and did not merge. By adding isopropyl alcohol (acting as surfactant under
these conditions) the nucleic acids of saliva precipitated (alcohol) and a sort of veil appeared
in saliva.
Anti-foaming agent To cause merging, we tried adding the anti-foaming agent pluronic
F-12 (surfactant). We prepared (melting, mixing) a solution of 10w t% pluronic F-12 in water
and mixed the solution 1 : 1 with saliva. PCE droplets remained stable and did not merge.
Salting out An organic phase is ’less soluble’ in a salty aqueous phase (effect known for iso-
propyl alcohol). Therefore, we tried to cause coalescence by increasing the NaCl concentration,
even a saturated salty solution was not able to merge the PCE droplets in saliva.
Surface Wettability Following the surface wetting coalescence principle presented in section
5.1.2 [191] we also adjusted the wetting behavior of our channel, on one hand chemically (see
section 3.3) and on the other hand by changing the surface roughness of the microfluidic
channel walls (see section 2.4.1). The effect of different surface wettability was found not to be
strong enough to merge the stable PCE droplets in saliva.
Temperature We also tried to cause coalescence by increased temperatures as suggested
by [195]. The microfluidic chip containing the PCE droplets dispersed in saliva was mounted
on a hotplate which was heated up to 50 °C. No coalescence was observed, but at higher
temperatures the microfluidic chip risks to debond.
5.3.2 Physically Assisted Merging Approach
Our physical merging approach can be broken in two stages: First, we drained out the con-
tinuous phase saliva to get densely packed droplets. These droplets were then compressed,
deformed, and accelerated in a second stage in order to cause merging by compressive and
decompressive coalescence (see section 5.2.2 and 5.2.3).
83

Chapter 5. Passive Phase Coalescence of Organic Solvent Droplets Dispersed in Saliva
(a) Design of a microscale structure (replicated from a mastermade in the cleanroom). The side-channels for drainage have awidth of 85µm.
(b) Scotch-tape master of a drainagestructure with channels for drainageshowing a width of ∼ 400µm.
Figure 5.5: Microfluidic structures to drain out the saliva (continuous phase) and to keep thePCE droplets in the central channel for merging.
Drainage of the Continuous Phase
We replicated by rapid prototyping (see section 2.4) a structure on a master made in the
cleanroom by photolithography showing small drainage channels (85µm wide, 50µm deep,
see Figure 5.5a) to drain out saliva (as suggested by [196]). These channels were too small and
got clogged by both saliva components and parts of PCE droplets.
A device showing much larger perpendicular drainage channels (∼ 400µm wide, 50µm deep,
see Figure 5.5b) was replicated from a scotch-tape master. This structure also suffered from
clogging by PCE droplets and additionally the flow was unbalanced due to the different
channel widths.
The solution for effective saliva draining without clogging was found by replacing the array of
perpendicular drainage channels by one extremely wide drainage channel which was shallower
(50µm) than the main channel (600µm)(extraction channel). The droplets preferred to stay in
the deep main channel instead of being squeezed into the shallow side-channel as long as the
height of the shallow channel was smaller than the droplet size. The height of the drainage
channel was set to 50µm which represents the minimum feature size in the vertical direction
using scotch-tape masters (1 layer of tape). Figure 5.6 shows this saliva drainage channel
integrated in the extraction system and also defines the glossary of the different components
of the total microfluidic extraction system.
With our method, the shallow drainage channel was not clogged by saliva components and
PCE droplets were normally too large to enter the shallow drainage channel. However, in case
a PCE droplet became stuck in the drainage channel, it did not completely block the flow,
because the drainage channel was wide enough.
Merging Device
The merging geometry we designed was inspired by the phase inversion device (see Figure
5.3). It was based also on the channel width modulation devices, but instead of changing
the channel width, we changed the channel depth. The direction of the channel modulation
84

5.3. Design
Figure 5.6: Definition of the glossary of different channels on the microfluidic extractionsystem.
(width or depth) has no influence since our system shows a small Bond number, indicating
that gravitational effects can be neglected (see section 1.1).
To merge the densely packed droplets we used a step between a deep and a shallow mi-
crofluidic channel. Droplet coalescence in our system was based on two different methods;
compressive and decompressive merging. For compressive merging the droplets were brought
into close contact and then mechanically pressed against the end of the deep extraction
channel (see Figure 5.7). Decompressive merging was observed when a droplet accelerated
away from its neighbor into the shallower PCE output channel (constant flow rate, smaller
cross-section (Bernoulli effect), see Figure 5.7). This separation resulted in a local pressure
drop between the droplets, then the draining of the remaining fluid film of the continuous
phase, and finally in the formation of two facing nipples with locally stressed interfaces (high
Laplace pressure) and droplet coalescence as explained in section 5.2.3. Since the droplets
were densely packed, sometimes also avalanche coalescence took place.
Figure 5.7: Schematic (cross-section view) of the two different modes of droplet merging atthe step between a deep and shallow microfluidic channel.
85

Chapter 5. Passive Phase Coalescence of Organic Solvent Droplets Dispersed in Saliva
Figure 5.8: Scheme of the merging chip with different channel depths and surface propertiestogether with a microscopy image of the zone within the dashed frame showing the drainageof the aqueous phase and the merging of the organic phase.
The PCE droplets were merged and the PCE left the device as continuous organic phase
through the PCE output channel. An initially designed separation wall between the PCE outlet
channel (150µm deep) and the saliva drainage channel (50µm deep) was removed in order to
allow the remaining saliva in the PCE outlet, to change to the saliva side. Separation of the
two liquids is supported on one hand by the different channel depth and on the other hand by
different wettability of the channel walls (adjustable channel wettability by using scotch-tape
masters, see section 2.4.1). The saliva drainage channel showed a smooth hydrophilic channel
surface, whereas the PCE outlet channel was rough and more hydrophobic.
5.4 Results
For characterization, our devices were tested with our measurement setup presented in section
2.5. The coalescence of the PCE droplets was verified optically. Figure 5.8 presents a schematic
of the merging part of the chip with different channel depths and surface properties, together
with a microscopy image of the drainage and merging process. PCE droplets arrive in the
deep extraction channel. First, the continuous aqueous saliva is drained out via a shallow
side-channel. Also some PCE droplets might escape unintentionally through the drainage
channel. The droplets are pushed together against the end of the extraction channel and they
merge by entering the PCE outlet channel. The PCE leaves as a continuous phase.
The merging system was working best by using droplets with a diameter of ∼ 600µm diameter
produced by a step of 150µm. These droplets were too large to enter the 50µm deep saliva
drainage channel. The droplets merged well at the step between the 600µm deep extraction
channel and the 150µm deep PCE outlet channel, when they were squeezed into the channel
of a depth of roughly 14 of the droplet diameter. Smaller droplets produced at a step from a
50µm or 100µm deep inlet channel (1 or 2 scotch-tape layers) did not merge.
86

5.5. Discussion
5.5 Discussion
The developed method, continuously merging organic solvent droplets (stabilized by sur-
factants), is a passive droplet merging method and thus it does not come along with added
system complexity and fabrication cost.
The literature describes mainly merging of two droplets (batch processing) which is of interest,
if example given, the droplets are considered as a reaction chamber, but there were only a few
ideas presented how to merge successively many individual droplets to a continuous phase.
Furthermore, mainly systems with aqueous droplets dispersed in an organic solvent were
studied. To the best of our knowledge we present here the first system which merges continu-
ously organic solvent droplets in aqueous solution (amongst other things predetermined by
our hydrophilic chip material), whereas the aqueous solvent is a non standardized human
body fluid already containing some surfactants. Our method does not include small drainage
channels which tend to clog by processing saliva, but a shallow and wide clogging-resistant
drainage channel.
We combined the drainage and the simple step in the microfluidic channel resulting in droplet
coalescence. The system has shown to merge successfully PCE droplets in human saliva, but
still the system shows some restrictions such as the droplet size or the flow rate.
If the droplets were too small (diameter smaller than twice the depth of the PCE outlet channel),
they were not squeezed, accelerated, and separated enough to merge (by decompressive
coalescence) when entering the shallower channel.
If the flow rates were too high, coalescence failed, because the continuous phase between the
droplets could not be drained fast enough. For our design coalescence became critical at flow
rates higher than ∼ 40µL/mi n.
In the design shown in Figure 5.6 and 5.8 the PCE outlet channel leaves the main extraction
channel at the side. In the opposite corner a dead zone of stagnant flow was observed. The
design was then improved by arranging the PCE outlet channel co-linearly to the extraction
channel.
5.6 Summary
We aimed to merge PCE droplets dispersed in human saliva. The droplets were stable due to
the surfactant proteins already present in saliva, unlike PCE droplets dissolved in water which
merge spontaneously.
The surface tension between both liquids needed to be increased which induced stressed
interfaces and resulted in easier coalescence. Several chemically assisted merging approaches
were tested and failed, such as increasing the pH value, the salting out method, elevated
temperatures, adjusted surface wettability, or the addition of anti-foaming agents and different
surfactants.
We developed a physical, passive method to merge continuously the PCE droplets dispersed
87

Chapter 5. Passive Phase Coalescence of Organic Solvent Droplets Dispersed in Saliva
in saliva. First, the continuous phase was drained out by a shallow side-channel (low risk of
clogging) and then the droplets were physically deformed by the microfluidic chip geometry
(step in the main channel from a deep to a shallow channel) resulting in coalescence based on
the compressive and decompressive merging principle.
88

6 Liquid-Liquid Extraction of Cocainefrom Human Saliva
We aimed to transfer cocaine from a saliva sample to an IR-transparent, organic phase in
order to allow detection by waveguide based IR-spectroscopy. Here we present a new and
promising droplet-based liquid-liquid extraction method as well as a compact microfluidic
extraction system (ES) including on the same chip droplet generation (see chapter 4), liquid-
liquid extraction, and droplet merging (see chapter 5). Here we present the optimization of
the extraction efficiency of our extraction system within a certain given range which allows
stable operation of the overall system.
The results shown here, were presented at the µTAS 2012 conference in Japan [158].
6.1 Introduction
Liquid-liquid extraction methods are currently used in several fields, mostly analytical chem-
istry, chemical engineering, and biology. Liquid-liquid extraction is a passive diffusion-based
technique to extract solutes from a specified phase. No chemical reaction takes place. The
transfer of matter from one liquid to another is driven by unbalanced chemical potentials
between the two liquid phases.
It is a promising approach to use liquid-liquid extraction in microfluidic systems, since there
the extraction process is orders of magnitude faster than in non-miniaturized systems [197].
This comes from the fact that the diffusion time scales as the square of the system size (see
equation 1.6 in section 1.1), and obviously the distances of travel are much shorter.
Liquid phase microextraction through a porous hollow fiber membrane was presented to
extract drugs from human biological samples [198]. The extraction times were long (15−60mi n) and such a membrane risks to be blocked.
Another microfluidic extraction system was using a fluid film instead of a solid membrane
[199]. A stable three-layer flow system, water / organic solvent / water, was established in a
microfluidic channel. In the continuous laminar flow, the solute (methyl red) was extracted
across the microchannel from the donor (water) to the acceptor phase (water) through the
89

Chapter 6. Liquid-Liquid Extraction of Cocaine from Human Saliva
(a) Microfluidic co-flow geometryfor liquid-liquid extraction - a socalled microfluidic H-filter [203].Schematic of the working principleis shown in Figure 6.2.
(b) Slug-based liquid-liquid extrac-tion. Acetic acid is extracted froman organic phase (kerosene mixedwith a silicone oil) to water slugscontaining KOH and phenol redpH indicator [202].
(c) Droplet-based liquid-liquidextraction. Microfluidic waterdroplets, occupying the entirewidth of the channel, extractfluorescein from the externalcontinuous phase octanol [197].
Figure 6.1: State of the art of microfluidic liquid-liquid extraction devices.
organic solvent phase (cyclohexane).
Simpler were the microfluidic extractions of solutes from an aqueous to an organic solvent in
a parallel laminar flow as presented by [200, 201].
Besides these co-flow approaches (H-filters) for liquid-liquid extraction, also slugs in a capil-
lary were studied [202] or the droplet-based liquid-liquid extraction method [197] was investi-
gated (see Figure 6.1).
6.1.1 Microfluidic H-filter
The microfluidic H-filter (see Figure 6.1a) was developed at the University of Washington in the
late 90’s [204–206]. An H-filter is a co-flow geometry, which can be used for filtration purposes
or liquid-liquid extraction. Two liquids are brought together in one channel (diffusion channel)
as a parallel flow. Based on the laminar flow conditions, the liquids do not mix and can be
separated again after the continuous filtration/extraction process. Only driven by diffusion,
particles or molecules change from one liquid to the other. The traveled distance of a solute
depends on its diffusion coefficient. The diffusion coefficient scales roughly with the inverse of
the size of the molecule (the hydrodynamic radius) [3]. Therefore, solutes with high diffusion
coefficients can be separated from components of the sample with lower diffusion coefficients
(see Figure 6.2). In a two-phase system, the solutes are extracted by diffusion to the liquid
showing better solubility of the solute.
We investigated the extraction potential of a microfluidic H-filter for our application (cocaine
extraction from saliva to the organic solvent PCE) by studying the equation for a traveled
distance of a molecule and by a comsol simulation (chemical reaction engineering module) of
cocaine diffusion in a co-flow device.
The time-depended root-mean-square distance traveled by a molecule in solution is given
by equation 1.6 in section 1.1. The diffusion coefficient of cocaine in water is as small as
2.7 ·10−9 m2
s (lower in saliva due to obstruction by proteins) as determined by [207]. Assuming
90

6.1. Introduction
Figure 6.2: Working principle of a microfluidic H-filter. Square particles show a larger diffusioncoefficient than the round ones and therefore, they travel faster to the other liquid and can befiltered out.
Figure 6.3: Comsol simulation of the cocaine concentration distribution when water andnon-Newtonian saliva are flowing side by side in a microfluidic channel.
a retention time in the microfluidic system of 1s for a molecule, the diffused distance is at
most 50µm. This is a reasonable distance for really small microfluidic channels (H-filters
with channel widths smaller than 100µm [205]). But by far, this is not enough for our saliva
system which asks for larger channels, because of the high risk of channel clogging by saliva
components (see Figure 2.7a).
Even smaller diffusion distances perpendicular to the flow were determined by a numerical
simulation of a parallel flow of water and saliva with cocaine (300µg /mL) in co-flow in a
microfluidic channel (see Figure 6.3).
6.1.2 Slugs in a Capillary
In this liquid-liquid extraction method, slugs of immiscible liquids flow through a capillary or
a microfluidic channel (see Figure 6.1b). Mass transfer takes place at their interface, based
on diffusion. Liquid circulations within the slugs get established, which are stimulated by the
shear between the stationary fluid at the wall and the slug axis (see Figure 6.4). These internal
circulations are responsible for an enhancement in the interfacial mass transfer due to the
induced additional mixing.
91

Chapter 6. Liquid-Liquid Extraction of Cocaine from Human Saliva
Figure 6.4: Schematic of the internal circulations generated within an immiscible slug flow[202].
6.1.3 Droplet-Based Liquid-Liquid Extraction
Droplet-based liquid-liquid extraction was suggested by [197](see Figure 6.1c). They provided
theoretical calculations of the extraction time (defined by the equilibrium conditions) and
presented an experiment extracting fluorescent markers. Using this droplet-based extraction
technique, droplets of a diameter equal to the channel width flow through a channel and a
solute is extracted from the continuous phase to the droplet phase. The theoretical maximum
of transfered mass is defined by the volume of the continuous phase between two droplets.
Larger distances between the droplets provide more solute to be extracted. They observed a
saturation level several times lower than the expected theoretical equilibrium value (partition
coefficient), because of the inhomogeneity of the concentration field inside and outside the
droplet at all times. Close to the droplet surface, depleted zones in the external continuous
phase were observed (see Figure 6.1c).
Liquid-liquid extraction with a co-flow device is a continuous process, which allows easier
separation of the two phases for further processing after the extraction. However, the slug- and
droplet-based extraction methods are more efficient due to the induced liquid circulations
and a relatively larger interface between both phases for the mass transfer. Assuming two
liquid phases of the same volume, a droplet in cube shows an interface around 3 times larger
compared to a configuration, in which the two liquids are arranged besides each other (larger
surface-to-volume ratio, see Figure 6.5).
Figure 6.5: A droplet in cube shows an interface around 3 times larger compared to two liquidsof the same volume arranged besides each other. This larger surface-to-volume ratio favorsthe liquid-liquid extraction.
92

6.2. Theory & Fundamental Principles
6.2 Theory & Fundamental Principles
Liquid-liquid extraction is a diffusion-based, passive process, which is driven by an unbal-
anced chemical potential (concentration differences). Solutes also migrate to the phase in
which they are more soluble until the equilibrium conditions are reached. The equilibrium
can be manipulated by adapting the conditions such as the pH value.
Cocaine dissolved in water is negatively charged (ionized) at a pH value of 7 (acidic behavior).
In this polar form, cocaine is supposed to show better solubility in polar water than in a apolar
organic solvent [198].
pKa is the acid dissociation constant, a measure of the strength of an acid in solution. It is the
equilibrium constant of the acid-base reaction. Cocaine has a pKa value of 8.6 [68]. For pH
values higher than 8.6 most of the cocaine is found in the unionized, apolar form. Under such
conditions, cocaine prefers to be dissolved in the apolar organic solvent, rather than in the
polar water.
Consider the equilibrium of an acid in a two-phase system (here aqueous saliva and the
organic solvent PCE) at an aqueous phase pH value, such that the acid is partially ionized. The
distribution of a solute between the aqueous and organic phase is defined as the partition
coefficient (PC) or distribution coefficient (DC) and depends on the pH and the pKa value.
The distribution coefficient is defined as the ratio of the concentration of the solute in the
organic phase to the concentration of all species in the aqueous phase at a given pH, whereas
the organic phase is assumed to contain only unionized species [208]:
DC = [sol ute]PC E
[sol ute]i oni zedsal i va + [sol ute]uni oni zed
sal i va
. (6.1)
The partition coefficient is defined as the ratio of the unionized solute in each phase, such as
[208]
PC = [sol ute]PC E
[sol ute]uni oni zedsal i va
. (6.2)
The partition coefficient can also be estimated from the distribution coefficient, knowing the
pKa and pH value of the system as described by [208, 209]:
log (PC ) = log (DC )− log
(1
1+10pK a−pH
). (6.3)
For pH values above the pKa value, the distribution coefficient and the partition coefficient
are the same.
93

Chapter 6. Liquid-Liquid Extraction of Cocaine from Human Saliva
Figure 6.6: Schema of the extraction system explaining the different steps of the liquid-liquidextraction: After the inlet, saliva with cocaine flows in parallel with PCE. Droplets are generatedat the step to increase the surface-to-volume ratio which allows faster liquid-liquid extraction.After the extraction, saliva is drained out and the PCE droplets merged to a continuous phase.Towards the outlet, the two phases flow in parallel, but now cocaine is dissolved in the PCE.
6.3 Design
6.3.1 Principle of the Microfluidic System for Droplet-Based Liquid-Liquid Ex-traction
The aim of our microfluidic droplet-based liquid-liquid extraction system is to bring cocaine
from saliva to the IR-transparent PCE, in which it will be detected by IR-spectroscopy.
As presented in section 6.1, it has been suggested to replace co-flow devices by droplet-based
extraction systems showing higher extraction efficiencies, mainly due to the better surface-to-
volume ratio and internal circulations.
We designed the microfluidic system shown schematically in Figure 6.6, which produces
droplets for enhanced liquid-liquid extraction. After the cocaine extraction to PCE, the system
merges the organic solvent droplets again to a continuous phase for the cocaine detection by
IR-spectroscopy.
Via inlets, saliva containing cocaine was brought in a shallow microfluidic channel together
with PCE. Both phases were flowing in parallel towards a step in the microfluidic channel.
There, PCE droplets were generated in saliva as explained in chapter 4. In the extraction
channel, cocaine was transfered from saliva into the PCE droplets driven by the chemical
potential. After the performed liquid-liquid extraction, the PCE droplets were merged again to
a continuous phase as presented in chapter 5. To allow coalescence of the PCE droplets, first
the continuous phase saliva was drained out by a shallow side-channel and then the droplets
94

6.4. Results
were merged at the end of the extraction channel. Towards the outlet, a continuous phase of
PCE was flowing besides the saliva, like in the inlet channel, but now with most of the cocaine
dissolved in the organic phase (PCE).
6.3.2 Design Variations
We used two different designs. The liquid-liquid extraction method was developed with a first
extraction system (ES 1) shown in Figure 6.7a. For the integration with the optical detection
waveguide chip, the design was adapted and called second extraction system (ES 2) (see Figure
6.7b). The footprint of the ES 2 was reduced compared to ES 1 by folding the design twice.
Furthermore, the outlet channel was arranged collinear with the extraction channel. This
way a dead zone of stagnant flow in the extraction channel (on the opposite side of the outlet
channel) could be avoided.
The vertical dimensions of the microfluidic channels were given by a multiple of the thickness
of the scotch-tape used for the scotch-tape masters (see section 2.4.1). The depth of the inlet
channel was 50µm (ES 1) and 200µm (ES 2), the depth of the extraction channel always 600µm,
of the saliva drainage channel 50µm and of the PCE outlet channel 150µm (see Figure 5.6 and
5.8).
The lateral dimensions denoted in Figure 6.7 were varied according to Table 6.1. Versions A, B,
and C of the ES 2 showed similar total length, measured from the PCE inlet to the PCE outlet.
ES 2A featured a 6mm long and 100µm deep shallow channel part in the extraction channel.
ES 2B showed a shorter extraction channel and ES 2C wider extraction channels than the other
two designs.
6.4 Results
The goal was to maximize the extraction efficiency of the developed system. Our droplet-
based approach for liquid-liquid extraction showed fabulous extraction efficiencies and even
allowed cocaine preconcentration. But to successfully operate the whole extraction system,
the parameters could only be varied within a certain range, which does not allow to tap the
full potential of this droplet-based extraction method.
In this section we present the optimization of the extraction efficiency of the extraction system
by pointing out the influences of several parameters. First, the pH value is adjusted and then
the extraction efficiency is evaluated for varying geometrical dimensions. The extraction
efficiency was always determined by comparing the concentration of cocaine extracted to PCE
with the one of cocaine in saliva. The cocaine concentration was measured by an appropriate
mass spectrometry method (UPLC-MS) which is described in section 2.2.
95

Chapter 6. Liquid-Liquid Extraction of Cocaine from Human Saliva
(a) First extraction system ES 1 used for system development.
(b) Second extraction system ES 2 which was more compact for the integration with the optical waveg-uide for detection. Some of the chips showed an additional shallow part in the extraction channel asindicated. Spaces were designed for the integration of the optical waveguide which were sealed afterbonding by PE.
Figure 6.7: Design of the microfluidic extraction systems with dimensions of the microfluidicchannels (width w, length l from the PCE inlet to the outlet, length l’ of the extraction channel,see Table 6.1).
6.4.1 pH Value Optimized Extraction Conditions
To measure the distribution coefficient, we mixed 1µg /mL cocaine in saliva together with the
same volume of PCE. After 24 hours, at equilibrium conditions, the cocaine concentrations
in saliva and PCE were determined by mass spectrometry (section 2.2). At pH 7 already 94%
of the cocaine was found in PCE. At pH 8 more than 99% of the cocaine was transfered to
96

6.4. Results
Table 6.1: Dimensions of the microfluidic channels on the extraction systems (ES) (see alsoFigure 6.7). The depth of the inlet channel was 50µm (ES 1) and 200µm (ES 2), the extractionchannel always 600µm, the saliva drainage channel 50µm and the PCE outlet channel 150µm(see Figure 5.6 and 5.8).
device ES 1A ES 1B ES 2A ES 2B ES 2C
length of the first part l1[mm] n.a. n.a. 23.5 21.0 25.0
length of the first part (extraction channel only) l ′1[mm] n.a. n.a. 14.51) 12.0 18.0
length of the second part l2[mm] n.a. n.a. 11.5 11.5 12.0
length of the third part l3[mm] n.a. n.a. 33.0 30.5 30.0
length of the third part (extraction channel only) l ′3[mm] n.a. n.a. 15.0 12.5 13.0
width of the first part w1[mm] 1.5 0.7 0.5 0.5 0.9
width of the second part w2[mm] 1.5 0.7 0.9 1.0 1.1
width of the third part w3[mm] 1.5 0.7 1.0 1.1 1.3
total length ltot [mm] 41.0 25.0 68.0 63.0 67.0
total length of the extraction channel l ′tot [mm] 36.0 18.0 41.0 36.0 43.0
footprint of the extraction channel A[mm2] 54.0 12.6 32.6 31.3 46.3
1) contains a 6mm long and 100µm deep shallow channel part
PCE. From these data, the distribution and partition coefficient for cocaine in the saliva-PCE
system were calculated (see Figure 6.8). For pH values higher than 9 most of the cocaine was
unionized (pKa = 8.6) and the distribution and partition coefficient showed the same values.
As explained in section 6.2, more cocaine is extracted by PCE when the cocaine is unionized.
Therefore, the pH value has to be at least higher than the pKa of 8.6. It was chosen always to
adjust the pH value to 9 for saliva samples as a sample pretreatment step (see section 2.1.4).
This way more than 99% of the cocaine was dissolved in PCE and we could avoid the risk of
etching our silicon substrate of the optical waveguide by components of buffers for higher pH
values (hydroxide).
6.4.2 Influence of the Flow Rates on the Extraction Efficiency
The extraction efficiency grew with the total flow rate (saliva flow rate + PCE flow rate) of the
system (see Figure 6.9). The extraction efficiency also benefited from unbalanced flow rates
(higher saliva than PCE flow rate). More cocaine was available for the same amount of PCE.
Saliva was flowing through a bead of packed PCE droplets in the extraction channel where
the cocaine was absorbed by the PCE droplets. This unbalance of the flow rates even allowed
preconcentration of cocaine in PCE and thus, an extraction efficiency higher than 100% (see
Figure 6.9). The design ES 1A had a wider and longer extraction channel than design ES 1B
and showed higher extraction efficiency.
97

Chapter 6. Liquid-Liquid Extraction of Cocaine from Human Saliva
7 8 9 10 110.0
0.5
1.0
1.5
2.0
2.5
3.0
3.5
4.0
log(
DC
) /
log
(PC
)
pH value
measured distribution coefficient calculated partition coefficient
8.6
Figure 6.8: Distribution coefficient of cocaine in PCE and human saliva measured by UPLC-MSand calculated partition coefficient (see equation 6.3 in section 6.2) [209]. The higher thepH value, the more cocaine is uncharged and preferably found in the apolar PCE. Error barsindicate the propagated measurement error of the UPLC-MS measurement.
������������ �����������!�����������������!����������
������������ �����������!���������������!������������
������������ ������ ����!����������������!�������������
������������ ������ ����!�����������������!����������
������������ ������ ����!���������������!�������������
������������ ������ ����!�����������������!����������
� �� �� � �� ��� ��� ��� �� ���e x t r a c t i o n e f f i c i e n c y [ % ]
Figure 6.9: Effect of different flow rates and flow rate ratios on the extraction efficiency. Theunbalanced flow rates (more saliva than PCE) allowed preconcentration of cocaine in PCE andtherefore an extraction efficiency higher than 100%. The extraction efficiency was determinedmeasuring the cocaine concentrations in PCE and saliva by mass spectrometry (UPLC-MS)(error bars indicate the propagated measurement error).
6.4.3 Influence of the Geometrical Dimensions on the Extraction Efficiency
Flow rate parameters were chosen so that the extraction systems were working robustly
(20µL/mi n saliva spiked with cocaine, 5µL/mi n PCE). Compared to microfluidic H-filters
(flow rates 20µL/mi n) with the same total length (PCE in contact with saliva) and a channel
width of 1.5mm, our extraction system (ES 2) showed a 2-3 times better extraction efficiency,
but also a higher standard deviation (see Figure 6.10). The measurement uncertainty was
calculated using the standard deviation of measurements performed on several chips with the
98

6.4. Results
H-filter Extractionsystem 2A
Extractionsystem 2B
Extractionsystem 2C
0
10
20
30
40
50ex
tract
ion
effic
ienc
y [%
]
(a) Comparison of the extraction efficiency of dif-ferent dimensions of the channels. In addition thedesign 2A contains a shallow part in the extractionchannel acting like the droplet generation step (seeTable 6.1) which increases notably the extractionefficiency and the deviation.
H-filter Extractionsystem 2A
0
10
20
30
40
50
extra
ctio
n ef
ficie
ncy
[%]
(b) Extraction system 2A compared with H-filter ofexact the same length for two different cocaine con-centrations in saliva.
Figure 6.10: Comparison of the extraction efficiency of microfluidic H-filters and our extractionsystems. Our extraction systems show a better extraction efficiency. The extraction efficiencywas determined measuring the cocaine concentrations in PCE and saliva by mass spectrometry(UPLC-MS). Error bars indicate the standard deviation for measurements performed with 5 to10 devices.
same geometry (same master used for molding, see section 2.4). The standard deviation was
larger than the propagated error of the mass spectrometry measurements (∼ 10%). The large
deviation of the measurements was most likely due to the turbulent flow conditions (vortexes)
in our system causing it to be larger than the deviation measured with the microfluidic H-filter
which provides stable laminar flow conditions. Five to ten devices were measured per data
point. A larger data set would provide more information about how to improve the accuracy
of the measurements.
Comparing the values of ES 2 (averaged design B&C) with the ones of ES 1 (averaged design
A&B) which were achieved under the same conditions (20µL/mi n saliva with 500µg /mL
cocaine, 5µL/mi n PCE), the extraction efficiencies of ES 2 are a little bit lower, probably
because of the different surface to volume ratio. For the ES 2, 4 times larger droplets (based
on a 200µm deep inlet channel instead of 50µm for ES 1) were required for a better and more
stable merging capability.
The lateral geometrical dimensions of the channels (length, width) were varied, but no signifi-
cant influence on the extraction efficiency was observed. However, microfluidic extraction
systems with the design ES 2A showed significant better extraction efficiencies than the other
two (ES 2B&C). As mentioned in Table 6.1, this design contains in addition a 6mm long,
100µm deep shallow part in the extraction channel, which squeezed the passing droplets. This
influence will be further investigated and verified in section 6.4.5.
99
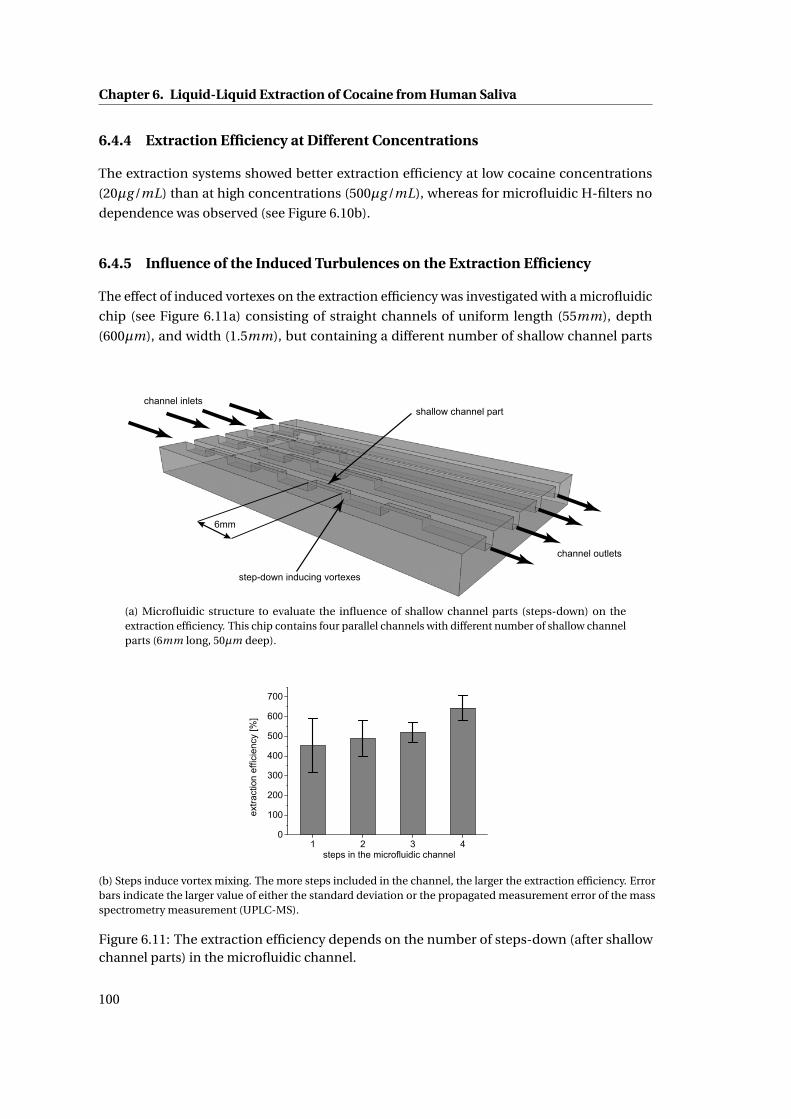
Chapter 6. Liquid-Liquid Extraction of Cocaine from Human Saliva
6.4.4 Extraction Efficiency at Different Concentrations
The extraction systems showed better extraction efficiency at low cocaine concentrations
(20µg /mL) than at high concentrations (500µg /mL), whereas for microfluidic H-filters no
dependence was observed (see Figure 6.10b).
6.4.5 Influence of the Induced Turbulences on the Extraction Efficiency
The effect of induced vortexes on the extraction efficiency was investigated with a microfluidic
chip (see Figure 6.11a) consisting of straight channels of uniform length (55mm), depth
(600µm), and width (1.5mm), but containing a different number of shallow channel parts
(a) Microfluidic structure to evaluate the influence of shallow channel parts (steps-down) on theextraction efficiency. This chip contains four parallel channels with different number of shallow channelparts (6mm long, 50µm deep).
1 2 3 40
100
200
300
400
500
600
700
extra
ctio
n ef
ficie
ncy
[%]
steps in the microfluidic channel
(b) Steps induce vortex mixing. The more steps included in the channel, the larger the extraction efficiency. Errorbars indicate the larger value of either the standard deviation or the propagated measurement error of the massspectrometry measurement (UPLC-MS).
Figure 6.11: The extraction efficiency depends on the number of steps-down (after shallowchannel parts) in the microfluidic channel.
100

6.5. Discussion
(6mm long and 50µm deep). Applying the same conditions as for the extraction systems
(20µL/mi n saliva with 500µg /mL cocaine, 5µL/mi n PCE) droplets were produced at the first
step. The following shallow parts did not merge the droplets (no drainage). The droplets were
squeezed and during the shape relaxation at the step after a shallow part, the same vortex
phenomenon (inducing mixing) occurred as it was observed at the droplet generation step
(see section 4.4.4). In these test channels no merging geometry was integrated. The droplets
were collected at the outlet and merged by a centrifuge prior the determination of the cocaine
concentration by mass spectrometry (see section 2.2).
An obvious trend was observed: The more steps-down integrated in the microfluidic channel,
the higher the extraction efficiency (see Figure 6.11).
6.5 Discussion
In this section we discuss the improvements of the extraction efficiency of our system and
the modifications from the first to the second extraction system. Then we also compare our
system with the state-of-the-art microfluidic H-filter.
6.5.1 Improvements of the extraction efficiency
We improved the extraction conditions of cocaine to PCE by increasing the pH value above the
cocaine pKa value of 8.6. Already at pH 9, more than 99% of the cocaine was transfered to PCE.
Therefore, we adjusted the pH only to 9 avoiding the risk of etching our silicon substrate of the
optical waveguides by components of the buffers for higher pH values (see section 2.1.4).
Our microfluidic liquid-liquid extraction approach using small (smaller than the microfluidic
channel width) droplets showed fabulous efficiencies and even allowed preconcentration of
the solute in the organic solvent unlike other droplet-based approaches which even failed to
reach the theoretical equilibrium value given by the distribution coefficient [197]. Within the
integrated extraction system the extraction efficiency was limited (to 20−30%) by parameters,
which were fixed to enable successful and stable operation of the extraction system. We
had to find a tradeoff between maximized extraction efficiency (up to 180%, using flow rates
of 40µL/mi n (saliva) and 2µL/mi n (PCE)) and successful operation of the system (droplet
coalescence for detection in a continuous organic phase). To optimize the extraction efficiency,
small droplets with large surface-to-volume ratio should be produced with highly unbalanced
flow rate ratios at high flow rates to induce vortex mixing; however, in these conditions our
system was not able to merge the droplets for the following detection.
A much higher saliva than PCE flow rate (such as 40µL/mi n (saliva) and 2µL/mi n (PCE),
see Figure 6.9) would provide more cocaine for a certain amount of PCE and would result
in preconcentration. However, the drainage channel we designed was not large enough to
drain all saliva from a highly unbalanced flow rate ratio, which inhibited coalescence of the
101

Chapter 6. Liquid-Liquid Extraction of Cocaine from Human Saliva
PCE droplets. For the ES 2 the flow rate ratio of saliva to PCE was found to be optimal for
coalescence at a ratio of 4 : 1.
The lateral dimensions of the microfluidic channels had no significant influence on the extrac-
tion efficiency. Much more obvious was the effect of shallow parts integrated in the extraction
channel, which squeezed the droplets and during their shape relaxation, turbulences were
induced in the laminar flow. The higher the number of shallow parts (more vortex mixing), the
larger the extraction efficiency. Increasing the number of shallow channel parts from one to
four, a 45% higher extraction efficiency was observed in a test device (see Figure 6.11b). In
order to proof the increased extraction efficiency in system ES 2A was caused by the explained
vortex mixing, the additional shallow channel part (see Figure 6.7b) was removed. Indeed
this resulted in a 10−20% lower extraction efficiency (comparable with the other extraction
systems without additional shallow part, see Figure 6.10a).
6.5.2 Changes from the First to the Second Extraction System
The main geometrical improvement was the collinear arrangement of the PCE outlet channel
with the extraction channel to avoid a region of stagnant flow in the extraction channel.
Furthermore, to reduce the footprint of the microfluidic device, the channel was bended twice
in the second extraction system, which was then more convenient for the integration with the
optical waveguide.
On the second extraction system, larger droplets were produced to avoid them to enter and
clog the saliva drainage channel.
As explained above (section 6.5.1) in order to obtain the optimum extraction conditions,
droplets should be generated with highly unbalanced flows and at high flow rates (to induce
vortex mixing); however, in these conditions the designed system was no more able to merge
the droplets (not enough saliva drainage). For the ES 2 the flow rate ratio of saliva to PCE was
found to be optimal at a ratio of 4 : 1. Therewith, the designed drainage channel managed
to drain out enough saliva to cause merging of the PCE droplets at the step-up at the end of
the extraction channel. The stable operation of the system was observed up to 20µL/mi n
saliva flow rate and 5µL/mi n PCE flow rate. PCE droplet coalescence could not always be
ensured for larger saliva to PCE flow rates such as 24µL/mi n:6µL/mi n, 32µL/mi n:8µL/mi n
or 40µL/mi n:10µL/mi n.
6.5.3 Comparison with the State of the Art
We developed a microfluidic liquid-liquid extraction system to transfer cocaine from human
saliva to the IR-transparent organic solvent PCE under continuous flow conditions. The state-
of-the-art microfluidic H-filter also would allow continuous extraction and in addition easy
separation of the liquids after extraction [204, 205], but our system showed a 2-3 times better
extraction efficiency. To perform best, the H-filter would require microfluidic channels smaller
than 50µm (diffusion length of cocaine), but they would be clogged immediately by saliva.
102

6.6. Summary
Compared to H-filters, slug-based extraction systems not only depend on diffusion, but also
on induced liquid circulations which allow additional mixing in the laminar flow [202]. Also
in our system mixing is supported by vortexes created during the droplet generation step as
explained in section 4.4.4.
The droplet based approach suggested by [197], shows a better surface-to-volume ratio for
higher extraction efficiency than the slug-based approach (see Figure 6.5). Furthermore, the
smaller the PCE droplets in the same amount of saliva are, the better this ratio. The suggestion
of a droplet-based approach is a promising idea, but ends up with an emulsion after the
extraction process instead of two separated phases, which does not allow further processing
or detection. Droplets as large as the channel width were proposed, which resulted in a
limited volume of the continuous phase between the droplets and also depleted regions were
observed (see Figure 6.1c). To overcome the diffusion limited problem (see section 6.1.1) in
our system, vortexes generated by shallow channel parts induced mixing and so they provided
a more homogeneous solute distribution and a higher extraction efficiency (see Figure 6.11).
Furthermore, our droplets were smaller than the channel width. The continuous phase could
flow around the droplets. If the continuous phase was flowing at higher flow rate (compared to
the dispersed phase), even cocaine preconcentration up to 180% in PCE droplets was achieved
(see Figure 6.9). Our droplet-based approach therefore provides an attractive method of
microfluidic liquid-liquid extraction.
6.6 Summary
The set goal was to transfer cocaine from the saliva sample to an IR-transparent organic phase
in order to be detected by waveguide IR-spectroscopy in the continuous organic phase.
Here we presented a liquid-liquid extraction system which transfered continuously cocaine
from human saliva to the organic solvent PCE. We followed and improved the idea of droplet-
based liquid-liquid extraction. Our approach of producing droplets smaller than the width of
the microfluidic channel achieved promising results based on vortex mixing in the laminar
system (up to 40% higher extraction efficiency in a test device) and on unbalanced flow rates
allowing cocaine preconcentration in PCE (extraction efficiencies up to 180% measured).
We presented a compact microfluidic system including on the same chip: droplet generation
(see chapter 4), liquid-liquid extraction, and droplet merging (see chapter 5). This integrated,
serial arrangement of the components fixed some parameters within a certain range, which
did not allow to tap the full potential of this droplet-based extraction method.
However, our system developed for droplet-based liquid-liquid extraction showed a 2-3 times
larger extraction efficiency than the state-of-the-art microfluidic H-filter. Optimized con-
ditions for most efficient extraction at robust system performance (for ES 2) were found at
the flow rate ratio of 4 : 1 with the following flow rates; 20µL/mi n saliva spiked with cocaine,
5µL/mi n PCE.
103

7 Integrated Cocaine Sensor for SalivaSamples based on IR-Spectroscopy
The results shown in this chapter are based on the knowledge developed and presented in
the previous chapters. Here we present an integrated optofluidic device which is the output
of a close collaboration together with the micro-optics group of Prof. Hans Peter Herzig at
EPFL. Germanium strip waveguides on silicon substrates were integrated with microfluidic
systems to detect cocaine as a pilot demonstration in the framework of the project IrSens. In
the evanescent field of the waveguide, cocaine absorbed the light of a wavelength near 5.8µm
which was emitted from a quantum cascade laser.
Some of the information presented in this chapter was both published in the journal Lab on a
Chip [210] and at the µTAS 2012 conference [158].
7.1 Introduction
Integrated optofluidic systems including microfluidics and laser detection of chemical ana-
lytes were first demonstrated in 2006 [14] (see section 1.2).
Chemical detection and identification based on mid-infrared (mid-IR) spectroscopy have
been widely used for samples in gases, liquids, or solids. In the condensed phase, attenuated
total reflection Fourier transform infrared spectroscopy (ATR-FTIR) conveniently probes the
analyte in the evanescent field. Such tabletop setups are limited to laboratories due to their
large footprint [211, 212]. During the last few decades, the progress of mid-IR spectroscopy
with mid-IR fiber probes or planar waveguides largely reduced the device size and the required
sample volume [213]. Such waveguides were based on silver halides, chalcogenide glasses,
GaAs or hollow waveguides [214–218]. In addition, mid-IR quantum cascade lasers (QCLs)
provide light sources with high power, high tunability, and compact sizes which can further
reduce the size of sensor systems [219].
Microfluidic systems have been used in combination with IR-detection as presented in section
1.2.3. The most commonly used techniques are chromatography and electrophoresis on a
separate microfluidic chip for sample preparation and preconcentration prior to the conven-
tional IR-detection.
105

Chapter 7. Integrated Cocaine Sensor for Saliva Samples based on IR-Spectroscopy
Figure 7.1: Planar chalcogenide waveguide integrated with microfluidic sensor [216].
Recently, optical waveguide-based detection techniques were presented in combination with
microfluidic systems. A SU-8/PDMS microfluidic device integrated with a planar chalcogenide
glass waveguide on a silicon substrate was presented in 2007 for detection of N-methylaniline
at the wavelength of 1.55µm (see Figure 7.1) [216]. A limit of detection of 0.7 vol. % (7µg /mL)
was achieved for N-methylaniline in a non-absorbing solvent (carbon tetrachloride). Ultra-
sensitive mid-infrared evanescent field sensors combining thin-film strip waveguides with
quantum cascade lasers were published in 2011 [220]. Acetic anhydride was detected with a
wavelength of 10.3µm with a limit of detection of 19.4 ng (= 18pL droplets deposited on the
waveguide surface).
Beside, commercial products combining QCLs and flow cells for the detection of oil in water
are available [221].
7.2 Theory & Fundamental Principles
An optical waveguide is a physical structure that guides electromagnetic waves in the optical
spectrum. The most common types of optical waveguides are the optical fibers and rectangular
waveguides. The latter can be split in strip waveguides and the flatter slab waveguides, also
called planar waveguides. Compared to a slab waveguide, a strip waveguide has higher fraction
of energy in the evanescent field and hence shows increased limits of detection [220].
For the optical detection, we used a single-mode total reflection strip waveguide, in which
the light bounced several times forming a surrounding evanescent field. An evanescent wave
is a near-field standing wave with an intensity that decays exponentially with distance from
the boundary at which the wave was formed. Evanescent waves are a general property of
wave-equations and occur in all phenomena to which a wave-equation applies. They are
formed at the boundary between two materials with different wave propagation properties.
Their highest intensity is within one third of a wavelength from the surface (interface between
two materials) of formation. The evanescent field waves can be excited very efficiently with
light near the visible range. [222]
106

7.3. Design
Figure 7.2: Scheme of the waveguide spectroscopy sensor concept in liquid. The light emittedfrom the QCL is coupled into a Si/Ge single-mode waveguide. The evanescent field of themode (about 5% of the injected light) is then interacting with the analyte within the liquid.After analyte interaction, the light is collected and focused onto a quantum cascade detector.
The analyte (cocaine) in the liquid phase was detectable because it absorbs energy of the
evanescent field surrounding this waveguide (see schematic in Figure 7.2). The information
about the analyte concentration can be determined by measuring the intensity of the light
at the waveguide output. The wavelength of the laser light was chosen to accord with the
characteristic absorption peaks of cocaine [223].
7.3 Design
This section presents the design of both parts of the optofluidic system. First we describe the
optical waveguide and then we present the two different integrated microfluidic systems. The
first optofluidic system is called ’detection-evaluation system’ and detects different cocaine
concentrations in PCE. The second device is called ’extraction-detection system’ and integrates
the liquid-liquid extraction and the waveguide detection.
In this section also the optical and microfluidic experimental setup for the characterization of
the optofluidic systems is introduced.
7.3.1 Optical Waveguide
The mid-IR waveguide is made from a mono-crystalline Ge layer grown on a Si substrate, by
means of standard photolithography and reactive ion etching using C F4. Intrinsic Ge and
Si have low absorption in a wide range of mid-IR. This material combination is Si-process
compatible and can be integrated with the current Si technology. Figure 7.3 shows the cross
section view of the fabricated strip waveguide. The waveguide is designed for single mode,
transverse magnetic polarization at the wavelength of 5.8µm, while the thickness is 2µm and
the width 2.9µm [224].
107

Chapter 7. Integrated Cocaine Sensor for Saliva Samples based on IR-Spectroscopy
1μm
Figure 7.3: Image of the cross section of a Ge waveguide on silicon, taken with a scanningelectron microscope. The waveguide was designed for the wavelength of 5.8µm (thickness2µm, width 2.9µm).
7.3.2 Integration with the Microfluidic System
The single-mode strip waveguides were integrated with a microfluidic system made by rapid
prototyping of NOA81 as explained in section 2.4.2. After usage, the low-cost, disposable,
polymer microfluidic system can be detached from the optical substrate by soaking everything
in acetone and the waveguide can be recycled.
In the microfluidic system, small openings were fabricated to let the waveguides enter the
microfluidic channel. These gaps were sealed afterwards by melted polyethylene or by epoxy
glue (2 tone epoxy, Devcon) which absorb less IR-light than the material of the microfluidic
system [123].
Two different integrated systems were fabricated and tested. On the one hand, the simplified
’detection-evaluation system’, where the microfluidic part consists only of simple straight
channels (1mm wide, 7mm long, and 50µm deep), showing one microfluidic inlet and one
microfluidic outlet per channel (see Figure 7.4). The microfluidic channel sits over an optical
waveguide of ∼ 8mm length. This system was built to verify the detection method and to
determine the limit of detection in PCE.
1cm
Figure 7.4: Integrated ’detection-evaluation system’ with two waveguides covered by simplestraight microfluidic channels showing one inlet and one outlet per channel.
108

7.3. Design
On the other hand, a more complex integrated optofluidic system, the so called ’extraction-
detection system’, was built. The ’extraction-detection system’ combines the droplet-based
microfluidic liquid-liquid extraction of cocaine from human saliva and the strip waveguide
detection in PCE. Compared to the ’detection-evaluation system’ this device shows an around
4 times longer optical waveguides (∼ 23.8mm). Figure 7.5 shows the microfluidic system,
the design of the waveguides as well as a photograph of the complete integrated ’extraction-
detection system’.
7.3.3 Optical Experimental Setup
The integrated sensing devices, consisting of an optical waveguide and a microfluidic system,
were evaluated by a QCL light source emitting light at a wavelength of 5.71±0.01µm (wave
number 1750± 5cm−1). The laser was provided by our collaborators of the group of Prof.
Jérôme Faist at ETHZ and was fabricated as described in [225].
The measurement setup consisted of a tabletop optical system measuring the waveguide
output. The light emitted from the QCL was coupled into the strip waveguide with a 1/f ZnSe
doublet. After interaction with the sample in the liquid chamber, the light went through a
waveguide bend and was redirected to a liquid nitrogen cooled MCT (mercury cadmium
telluride) detector by two parabolic mirrors. The use of a bended waveguide avoided the QCL
stray light of the emission axis from being detected, which increased the signal to noise ratio.
The setup is presented in Figure 7.6.
7.3.4 Microfluidic Experimental Setup
Here the fluidic setups for the simple ’evaluation-detection system’ and the more complex
’extraction-detection system’ are explained.
Detection-Evaluation System
For the ’detection-evaluation system’ no saliva was involved but different concentrations of
cocaine in PCE . The PCE solutions were pumped with a syringe pump at a constant flow rate.
Different concentrations were selected continuously while pumping by using a six-way valve.
For easy characterization of the ’detection-evaluation system’ pure PCE was alternated with
PCE solutions with cocaine. Step by step the concentrations were changed between 100µg /mL,
300µg /mL, and 1000µg /mL.
Extraction-Detection System
The flow rate in the fluidic system of the ’extraction-detection system’ was also controlled by a
syringe pump (see Figure 7.7). PCE was provided in parallel with either pure saliva or saliva
spiked with cocaine (chosen by a fluidic valve). First pure saliva was injected into the system,
109

Chapter 7. Integrated Cocaine Sensor for Saliva Samples based on IR-Spectroscopy
(a) This 3D schematic shows the microfluidic part upside down with the surfacebonded to the substrate (with waveguides) on top. In red the position of theintegrated waveguides is indicated.
(b) Design of the optical waveguides in blue. The yellow square represents thefootprint of the microfluidic system.
(c) Image of the NOA81 microfluidic system integrated with the opti-cal waveguides on a silicon substrate.
Figure 7.5: Integrated optofluidic ’extraction-detection system’.
110

7.4. Results
(a) Image of the experimental setup. (b) Schematic of the included components.
Figure 7.6: Optical components of the measurement setup for both integrated systems: QCLlight source, light beam shaping components, optofluidic sensing device and the MCT detec-tor.
Figure 7.7: Tubing for the integrated setup using only one syringe pump: 1) syringe pump, 2)syringe with PCE (small diameter), 3) syringe with saliva, 4) syringe with cocaine spiked saliva,5) selection valve, 6) optofluidic chip, 7) microfluidic waste.
then saliva experienced the same pretreatment (see section 2.1.4) but spiked with cocaine
(500µg /mL), followed again by the pure saliva. By selecting different syringe diameters also
the flow rate ratio between PCE and saliva was adjustable.
7.4 Results
Different cocaine concentrations dissolved in PCE were measured with the ’detection-evaluation
system’ (see Figure 7.5) by pumping the liquids through the microfluidic device at a flow rate
of 50µL/mi n. The waveguide output light intensity was detected promptly when we switched
between different concentrations of cocaine as shown in Figure 7.8. Between each concentra-
tion, we added 5-7 minutes of pure PCE solvent. The signal always reached again the baseline
while pure PCE was flowing in the channel. The device responded well to each change of
the concentration. The transmission drop (energy absorption of the cocaine molecules) was
linearly proportional to the cocaine concentration, while the lowest detected concentration
was 100µg /mL.
111

Chapter 7. Integrated Cocaine Sensor for Saliva Samples based on IR-Spectroscopy
The ’extraction-detection system’ first extracted cocaine from saliva to PCE, then detected
cocaine further downstream in the microfluidic channel with the optical waveguide. Figure
7.9 shows the detection of 500µg /mL cocaine by switching between pure and spiked saliva at
constant flow rates of 20µL/mi n for saliva and of 5.4µL/mi n for PCE.
Figure 7.8: Waveguide output intensity with different cocaine concentrations in the organicsolvent PCE using the short waveguides on the ’detection-evaluation system’: in the dynamicmeasurement, the smallest detected concentration was 100µg /ml .
0 2 4 6 8 1 0 1 20 . 6
0 . 7
0 . 8
0 . 9
1 . 0
� � � � � �
� � � � � � � � �� � � � �
� � � � � � � � � � �
Norm
alized
outpu
t (I/I ma
x)
� � � � � � �
� � � � � �
� � � � � � � � � � �� � � � � � � � � �
� � � � � � � � �
Figure 7.9: Optical detection of cocaine extracted from saliva to PCE on chip during the mea-surement using the integrated optofluidic ’extraction-detection system’. The concentration ofcocaine in saliva was switched between zero and 500µg /mL.
112

7.5. Discussion
Table 7.1: LOD of different systems detecting cocaine in saliva or systems using integratedoptical waveguides.
System Analyte Matrix LOD Time to result Reference
our ’detection-evaluation system’ cocaine PCE 100µg /mL real time [158, 210]
our ’extraction-detection system’ cocaine saliva 500µg /mL real time [158, 210]
tabletop ATR-IR spectrometer cocaine saliva (evaporated) 10µg /mL ∼ 10mi n [223]
different immunoassay systems cocaine saliva ng /mL-range ∼ 20mi n see Table 2.4
mass spectrometry cocaine saliva ng /mL-range several hours [228]
integrated chalcogenide waveguide N-methylaniline carbon tetrachloride 7µg /mL (0.7vol .%) n.a. [216]
integrated GaAs waveguide acetic anhydride air (droplets on waveguide) 18pL/19.4ng n.a. [220]
7.5 Discussion
The lowest detected cocaine concentration in PCE of our integrated ’detection-evaluation
system’ was 100µg /mL. This simple device featured a really fast response time compared
to less reliable and portable systems based on immunoassay (where the time-to-results can
exceed 20mi n, see section 1.2.2) or compared to the reliable state-of-the-art cocaine detection
by mass spectrometry (time to result: several hours) which makes it applicable for trustable
real-time measurements. Even a faster response than the one shown in Figure 7.8 can be
achieved by shortening the supply tubing as presented in [210] or by directly integrating the
pumping on the microfluidic system by micro pumps [226, 227].
Using the more complex ’extraction-detection system’ a cocaine concentration of 500µg /mL
in saliva was extracted to PCE and detected. Concentrations in real saliva samples can exceed
1000ng /mL for 2-4 hours after consumption [45]. By detecting a cocaine concentration of
500µg /mL we are far from this concentration as well as from the detection limit of 20ng /mL
proposed by the SAMHSA (see section 2.1.2). Table 7.1 compares the limit of detection (LOD)
of different systems detecting cocaine in saliva or systems using integrated optical waveguides.
Furthermore, the device developed here not only lacks of a fairly high LOD, but the system
needs also to be calibrated before application in the field.
The integrated optofluidic system, the so called ’extraction-detection system’, showed much
higher relative sensitivity compared to measurements in PCE with the simple ’detection-
evaluation system’ (compare Figure 7.9 to Figure 7.8). This increase resulted from the usage of
a longer optical waveguide.
The relative sensitivity was better, but the detected intensity of the signal was at a really low
level (less than 0.1mV ), because when the optical waveguides were in contact with the highly
light absorbing aqueous liquid once, the output signal dropped and stayed low.
The microfluidic system is working well, continuously extracting cocaine from saliva to PCE
and then merging PCE droplets towards the waveguide area as shown in Figure 7.10. However,
our system suffered from a basic fluidic design flaw occurring during the initialization phase
of the microfluidic system: as explained in Figure 7.11, the initialization phase started from an
empty microfluidic channel. PCE droplets were produced in saliva. Since the PCE droplets
113

Chapter 7. Integrated Cocaine Sensor for Saliva Samples based on IR-Spectroscopy
Figure 7.10: Integrated ’extraction-detection system’ on the chip holder performing the mi-crofluidic droplet-based liquid-liquid extraction (continuous operation) while real time opticaldetection.
were embedded in the aqueous continuous phase saliva, the channel walls always got wetted
first by saliva (step 1, Figure 7.11b). The same applied for the hydrophilic optical waveguide
channel (step 2, Figure 7.11b). The PCE droplets arriving first at the step were stopped,
squeezed, and then merged together (step 3, Figure 7.11b). Meanwhile the saliva continued
to flow over the optical waveguide instead of separating out via the shallow drainage side-
channel. As soon as the pressure on the droplets was high enough, they merged and a
continuous phase of PCE left through the shallower channel containing the optical waveguide
(continuous operation phase). Since saliva was in contact with the hydrophilic surface of the
optical waveguide first, a very thin lubrication film of saliva was remaining on the waveguide
in the continuous operation phase (PCE surrounded by a thin film of saliva, slug-like flow)
[4, 229, 230]. Assuming the slug-like flow is comparable to the phenomenon of a large inviscid
bubble moving at small capillary number in a microfluidic channel, the thickness of the
lubrication film e can be estimated by the nonlinear law eh ∝C a
23 [231], where h is the height
of the microfluidic channel. The capillary number of 0.00715 in our system would result in an
estimated thickness of this lubrication film of ∼ 5µm.
We tried to prevent the saliva-waveguide contact by initializing the microfluidic system with
channels filled with PCE - with and without blocking the PCE outlet by a valve during the
initialization phase. It could not be avoided that saliva touched the optical waveguide and
remained as a thin layer on the surface of the waveguide. To overcome this issue, it could be
tried to make the optical waveguide completely hydrophobic by a surface treatment which
should force the saliva to leave only through the hydrophilic saliva outlet channel. Another
approach could be to design an additional PCE outlet channel in parallel to the detection
channel. This way, one channel would be closed after the initialization phase and another
channel (pre-filled with PCE) then opened for the detection only.
114

7.5. Discussion
(a) Image of the microfluidic system during the initializa-tion phase (step 3): The PCE droplets were stopped atthe step and saliva fills both the drainage and the detec-tion channel. The yellow line indicates the location of theseries of cross section views shown in Figure 7.11b.
(b) This schema shows the initialization andthe continuous operation phase of the mi-crofluidic system. The initialization phase ispresented in three steps: 1) Continuous phasesaliva with embedded PCE droplets were fill-ing the empty hydrophilic channel, 2) Salivareached the step first and started to wet thechannel with the waveguide, 3) PCE dropletswere stopped at the step and were squeezedtogether while saliva flowed over the waveg-uide. In the continuously operating state, PCEdroplet were merged and continuous organicphase left through the channel, but a very thinsaliva film was remaining on the waveguide(slug flow).
Figure 7.11: Initialization of the microfluidic droplet-based extraction system.
The mentioned saliva layer (∼ 5µm) covering the optical waveguide after the initialization
phase absorbed most likely the largest amount of energy of the evanescent field which shows
its highest intensity at about one third of the used wavelength measured from the waveguide
(5.7µm/3 = 1.9µm) (see section 7.2). The evanescent field technique is of advantage for the
detection of analytes in a highly absorbing matrix, because the field only interacts within a thin
layer of the liquid. In the case of a large volume of a transparent matrix (PCE) surrounded by a
thin highly light absorbing saliva layer, a transmission measurement (light shining through
the sample) in combination with an IR-transparent chip material, would probably be better
suitable, since the liquid-liquid extraction of cocaine from saliva to PCE was shown to be
efficient (see chapter 6).
115

Chapter 7. Integrated Cocaine Sensor for Saliva Samples based on IR-Spectroscopy
Regarding the waveguide detection system, the limit of detection of our device could be
improved by using longer waveguides and an integrated splitter with a reference waveguide.
The noise needs to be reduced by stabilizing the temperature and by avoiding mechanical
vibrations. Furthermore, there is a shift of the average output-power observed based on the
fluctuation of alignment between the laser and the waveguide. This could be avoided by
integration of the waveguide and the light source on the same substrate.
The QCL light source and the optical waveguide are already portable, but the additional
components of the optical system are still based on a tabletop setup and not applicable for a
POC device.
To handle the liquids in the microfluidic system a bulky syringe pump was used. This driving
system is not handy for a portable POC system. The syringe pump SPS01 from LabSmith is
much smaller and portable [232]. There are also portable, battery powered pumps available on
the market with a footprint of a coin e.g. Bartels Micropumps [226] or pumps from Osmotex
[227]. The pumps mp6 from Bartels (Bartels Mikrotechnik, Dortmund, Germany) were tested,
but not applied in the research project, because they show lower accuracy in terms of the flow
rate and need to be calibrated before use.
However, to the best of our knowledge we showed in this chapter for the first time the suc-
cessful integration of a low-cost microfluidic system for sample preparation together with
optical detection by IR spectroscopy. Thanks to the microfluidic liquid-liquid extraction of
cocaine from the highly absorbing saliva to an IR-transparent solvent, cocaine detection by
IR-spectroscopy was feasible (see absorption spectra in Figure 1.6).
7.6 Summary
In this chapter we presented with two systems the successful integration of a low-cost microflu-
idic part with the IR-waveguide spectrometry chip. The first ’detection-evaluation system’
measured quantitatively different cocaine concentrations in PCE with a LOD of 100µg /mL.
The second ’extraction-detection system’ performed the liquid-extraction of cocaine from
saliva to PCE together with the detection on the same device with a LOD of 500µg /mL in
saliva. The low limit of detection of the ’extraction-detection system’ suffered from an issue
occurring during the initialization of the microfluidic system which reduced the detectable
signal intensity. The microfluidic system performed well, but the combination with an evanes-
cent field detection was not the most suitable one. Nevertheless, for the first time cocaine
detection in human saliva succeeded on a compact, integrated optofluidic system, even if the
LOD of our systems did not reach our expectations.
116

8 Summary & Outlook
The goal of this research was to develop a compact, portable microfluidic system for cocaine
detection in human saliva by IR-spectroscopy. We also wanted to develop a low-cost, dispos-
able chip which is easy to fabricate by a low-cost rapid prototyping method. Therefore, we
chose polymer as the chip material which satisfied the above requirements, but asked for
further specific material characterization. Furthermore, the microfluidic system itself had to
be integrable with the optical waveguide for detection purpose. The task of the microfluidic
device was to transfer cocaine from the IR-light absorbing saliva to an IR-transparent organic
solvent enabling its detection.
Saliva is a good matrix for road side testing, but also a complex, non-Newtonian fluid which
tends to clog microfluidic channels. Hence, it required specific description and sample
pretreatment. We characterized the UV-polymer NOA81 for microfluidic applications and
developed a simple rapid prototyping method using scotch-tape masters. Equipped with these
tools we designed a new microfluidic droplet-based liquid-liquid extraction method to transfer
cocaine from saliva to the IR-transparent organic solvent PCE. Our system included a simple
and robust droplet generation method as well as a merging geometry. Then, this microfluidic
system was successfully integrated with a waveguide chip for the optical detection of cocaine.
8.1 Summary
First, for our application we emphasized the nature of saliva and its usage as an easily accessi-
ble sample matrix for the detection of cocaine in the human body. We explained the saliva
sample pretreatment, which had to be applied prior to its processing on microfluidic chips
in order not to clog the microfluidic channels and to allow reproducible measurements. We
focused on the influence of these pretreatments on the rheological behavior of this body fluid.
Second, the advantages of polymers as chip material for microfluidic systems were highlighted
and we presented a low-cost, time-efficient, and highly flexible microfluidic chip fabrication
method for the UV-curable polymer NOA81 (chapter 2).
117

Chapter 8. Summary & Outlook
A new suitable polymer chip material was found which met the relevant material requirements
of the project IrSens. The third aspect involved the investigation of microfluidic and IrSens
project relevant material properties, including the compatibility to IR-transparent solvents,
the low cocaine adsorption, the adjustable wetting behavior as well as the suitability for low
cost prototyping. The material characterization was presented, and the mentioned material
properties were illustrated by different applications (chapter 3).
We developed a droplet-based microfluidic liquid-liquid extraction method to transfer cocaine
from saliva to the IR-transparent organic solvent PCE including droplet generation and droplet
merging. Therefore, we aimed to develop a new, simple, and robust droplet generation
method, which can process the complex liquid saliva without clogging. The fourth aspect
concerned the droplet generation geometry (chapter 4). This geometry did not involve small
features, which could be clogged by saliva components. Our droplet generation method was
independent of the chip orientation and produced monodispersed droplets (smaller than
3%). Micro droplets could be produced at the microfluidic outlet or at a step in a microfluidic
channel (for further processing of the droplets on chip). The method also enabled high
throughput by parallelization of the droplet generation feature. The size of the generated
droplets mainly depended (linearly) on the inlet channel height of the device which allowed
to predict the droplet size. In the flow field, vortexes were observed, occurring during the
droplet generation process and enhancing the mixing in the normally laminar flow of such a
microfluidic channel.
In the fifth endeavor, after extracting cocaine, we aimed to merge PCE droplets, which were
dissolved in the human saliva, so that the cocaine could be detected by the optical waveguide
(chapter 5). Droplets in saliva were stabilized by surfactant proteins already present in saliva,
avoiding spontaneous droplet coalescence.
Several chemically assisted merging approaches were tested and failed, such as the increase
in the pH value, the salting out method, elevated temperatures, adjusted surface wettability,
or the addition of anti-foaming agents and different other surfactants.
Therefore, a physical, passive method was developed to continuously merge the droplets. The
continuous saliva phase was drained out by a shallow side-channel and then the PCE droplets
were physically deformed by the microfluidic chip geometry resulting in coalescence based
on the physical compressive and decompressive merging principles.
The sixth aspect of the project addressed the efficiency of transferring cocaine from saliva to
the organic PCE solvent using our compact droplet-based extraction system (chapter 6). Our
approach of producing droplets smaller than the width of the microfluidic channel, achieved
promising results (extraction efficiencies up to 180%) based on generated vortexes inducing
mixing in the laminar system and also based on unbalanced applied flow rates enabling
cocaine preconcentration in PCE.
The integrated, serial arrangement of the system components (droplet generation, liquid-
liquid extraction, droplet merging, detection) only permitted to set some parameters within
certain ranges, which did not allow us to tap the full potential of the presented droplet-
118
8.2. Outlook
based extraction method. However, our system showed at least 2-3 times higher extraction
efficiencies than the state-of-the-art microfluidic H-filter.
The seventh aspect of this work involved the successful integration of the low-cost microfluidic
parts with the IR-waveguide spectrometer chips (chapter 7). The first ’detection-evaluation
design’ measured quantitatively different cocaine concentrations in PCE with a LOD of
100µg /mL. The second ’extraction-detection design’ involved the liquid-liquid extraction
of cocaine form saliva to PCE together with the detection on the same device with a LOD
of 500µg /mL in saliva. The second ’extraction-detection design’ suffered from an issue oc-
curring during the initialization of the microfluidic system, which reduced dramatically the
detectable signal intensity. The microfluidic system performed well, but the combination with
an evanescent field detection method was not the most suitable one. Nevertheless, for the
first time cocaine detection in human saliva succeeded on a compact, integrated optofluidic
system, even if the LOD of our systems did not reach our expectations.
8.2 Outlook
Future work aiming at the improvement and industrialization of the droplet based liquid-
liquid extraction system developed in this thesis should focus on five main aspects.
First, we developed a low-cost, highly flexible, and time-efficient rapid prototyping method
for NOA81 using scotch-tape masters. If higher accuracy is needed, the scotch-tape could be
structured by laser cutting. However, this method was designed for flexible lab work and is not
suited for mass production.
Second, the geometry of the extraction system has to be improved, so that we can tap the full
potential of the presented droplet-based liquid-liquid extraction method. Additional shallow
parts with steps in the microfluidic channels would enhance the mixing by vortexes for better
extraction efficiency. Further, a particular improvement of the merging part is required to
merge small droplets with a huge surface-to-volume ratio, which are produced at high flow
rates inducing turbulences for mixing purposes and at highly unbalanced flow rates (requiring
larger drainage channels).
Third, the detection limit of the integrated system of the microfluidic part and the optical
waveguide could be improved greatly by avoiding water (saliva) contact with the optical
waveguide during the initialization phase, because a thin, but highly absorbing aqueous
lubrication layer remains on the optical waveguide.
Fourth, the portability of the device needs to be enabled by replacing the tabletop syringe
pumps. Compact, portable, and battery-powered micropumps can be integrated with the
microfluidic system.
Fifth, the integrated ’extraction-detection system’ needs to be calibrated and the accuracy
119

Chapter 8. Summary & Outlook
of the extraction system to be verified. In this thesis only saliva samples spiked with cocaine
were used. The high inter- and intra-subject variations of saliva samples might also influence
the accuracy of our liquid-liquid extraction system.
120

A Appendix:UPLC-MS Cocaine Calibration Curve
For the the cocaine measurements at the Swiss Laboratory for Doping Analyses (LAD) a
calibration curve for the ultra performance liquid chromatography - mass spectrometer (Xevo
TQ-S from Waters) was recorded using well defined cocaine concentration standards. The
calibration curve (Figure A.1) showed linearity for the concentration range 5-2500ng/mL.
Higher concentrations had to be diluted before measuring.
Figure A.1: Cocaine calibration curve for the UPLC-MS, Xevo TQ-S from Waters.
121


Bibliography
[1] H. Bruus. Theoretical Microfluidics. Oxford University Press, 2008.
[2] C.D. Chin, V. Linder, and S.K. Sia. Commercialization of microfluidic point-of-care
diagnostic devices. Lab on a Chip, 12(12):2118–2134, 2012.
[3] E.L. Cussler. Diffusion, Mass Transfer in Fluid Systems. Cambridge University Press,
Cambridge UK, 2nd edition, 1997.
[4] C.N. Baroud, F. Gallaire, and R. Dangla. Dynamics of microfluidic droplets. Lab on a
Chip, 10(16):2032–2045, 2010.
[5] G.N. Antonov. Journal of Chemical Physics, 5:372, 1907.
[6] P. Yager, T. Edwards, E. Fu, K. Helton, K. Nelson, M.R. Tam, and B.H. Weigl. Microfluidic
diagnostic technologies for global public health. Nature, 442(7101):412–418, 2006.
[7] V.R. Horowitz, D.D. Awschalom, and S. Pennathur. Optofluidics: field or technique? Lab
on a Chip, 8(11):1856–1863, 2008.
[8] D. Psaltis, S.R. Quake, and C.H. Yang. Developing optofluidic technology through the
fusion of microfluidics and optics. Nature, 442(7101):381–386, 2006.
[9] D.B. Wolfe, R.S. Conroy, P. Garstecki, B.T. Mayers, M.A. Fischbach, K.E. Paul, M. Prentiss,
and G.M. Whitesides. Dynamic control of liquid-core/liquid-cladding optical waveg-
uides. Proceedings of the National Academy of Sciences of the United States of America,
101(34):12434–12438, 2004.
[10] W. Buchegger, C. Wagner, B. Lendl, M. Kraft, and M. Vellekoop. A highly uniform
lamination micromixer with wedge shaped inlet channels for time resolved infrared
spectroscopy. Microfluidics and Nanofluidics, 10(4):889–897, 2010.
[11] T.M. Floyd, M.A. Schmidt, and K.F. Jensen. Silicon micromixers with infrared detection
for studies of liquid-phase reactions. Industrial & Engineering Chemistry Research,
44(8):2351–2358, 2005.
[12] F. Malloggi, N. Pannacci, R. Attia, F. Monti, P. Mary, H. Willaime, P. Tabeling, B. Ca-
bane, and P. Poncet. Monodisperse colloids synthesized with nanofluidic technology.
Langmuir, 26(4):2369–2373, 2009.
123

Bibliography
[13] A. Manz, N. Graber, and H.M. Widmer. Miniaturized total chemical analysis systems: A
novel concept for chemical sensing. Sensors and Actuators B: Chemical, 1(1–6):244–248,
1990.
[14] S. Balslev, A.M. Jorgensen, B. Bilenberg, K.B. Mogensen, D. Snakenborg, O. Geschke, J.P.
Kutter, and A. Kristensen. Lab–on–a–chip with integrated optical transducers. Lab on a
Chip, 6(2):213–217, 2006.
[15] Caliper Life Sciences
www.caliperlifesciences.com, accessed June 16th 2012.
[16] BioTrove
www.biotrove.com, accessed June 16th 2012.
[17] Cellix Inc.
www.cellixltd.com, accessed June 16th 2012.
[18] N. Blow. Microfluidics: in search of a killer application. Nature Methods, 4:665 – 670,
2007.
[19] Micronics Inc.
www.micronics.net, accessed June 16th 2012.
[20] Micronit Microfluidics
www.micronit.com, accessed June 16th 2012.
[21] Diagnostics For All
www.dfa.org, accessed June 16th 2012.
[22] N. Peled. Design and implementation of a microchemistry analyzer. Pure & Applied
Chemistry, 68(10):1837–1841, 1996.
[23] Abaxis Inc.
www.abaxis.com, accessed June 16th 2012.
[24] J.O. Tenovuo. Human Saliva: Clinical Chemistry and Microbiology, volume 2. CRC Press,
Boca Raton, Florida, 1989.
[25] E. Fu, T. Chinowsky, K. Nelson, K. Johnston, T. Edwards, K. Helton, M. Grow, J.W. Miller,
and P. Yager. SPR imaging-based salivary diagnostics system for the detection of small
molecule analytes. Annals of the New York Academy of Sciences, 1098(Oral-Based
Diagnostics):335–344, 2007.
[26] K.L. Helton, K.E. Nelson, E. Fu, and P. Yager. Conditioning saliva for use in a microfluidic
biosensor. Lab on a Chip, 8(11):1847–1851, 2008.
[27] C.-Y. Yang, E. Brooks, Y. Li, P. Denny, C.-M. Ho, F. Qi, W. Shi, L. Wolinsky, B. Wu, D.T.
Wong, and C.D. Montemagno. Detection of picomolar levels of interleukin-8 in human
saliva by SPR. Lab on a Chip, 5(10):1017–1023, 2005.
124

Bibliography
[28] A.E. Herr, A.V. Hatch, W.V. Giannobile, D.J. Throckmorton, H.M. Tran, J.S. Brennan, and
A.K. Singh. Integrated microfluidic platform for oral diagnostics. Annals of the New York
Academy of Sciences, 1098(Oral-Based Diagnostics):362–374, 2007.
[29] A.E. Herr, A.V. Hatch, D.J. Throckmorton, H.M. Tran, J.S. Brennan, W.V. Giannobile,
and A.K. Singh. Microfluidic immunoassays as rapid saliva-based clinical diagnostics.
Proceedings of the National Academy of Sciences, 104(13):5268–5273, 2007.
[30] T. Miyado, Y. Tanaka, H. Nagai, S. Takeda, K. Saito, K. Fukushi, Y. Yoshida, S. Wakida, and
E. Niki. High-throughput microfluidic devices for no assay based on electrophoretic
separation. In Microtechnology in Medicine and Biology, pages 66–68, 2005.
[31] D.J. Marchiarullo, J.Y. Lim, Z. Vaksman, J.P. Ferrance, L. Putcha, and J.P. Landers. Towards
an integrated microfluidic device for spaceflight clinical diagnostics: Microchip-based
solid-phase extraction of hydroxyl radical markers. Chromatography A, 1200(2):198–203,
2008.
[32] Z. Chen, M.G. Mauk, J. Wang, W.R. Abrams, P.L.A.M. Cortjens, R.S. Niedbala, D. Malamud,
and H.H. Bau. A microfluidic system for saliva-based detection of infectious diseases.
Annals of the New York Academy of Sciences, 1098(Oral-Based Diagnostics):429–436,
2007.
[33] W.R. Abrams, C.A. Barber, K. Mccann, G. Tong, Z. Chen, M.G. Mauk, J. Wang, A. Volkov,
P. Bourdelle, P.L.A.M. Corstjens, M. Zuiderwijk, K. Kardos, S. Li, H.J. Tanke, R.S. Nied-
bala, D. Malamud, and H. Bau. Development of a microfluidic device for detection of
pathogens in oral samples using upconverting phosphor technology (UPT). Annals of
the New York Academy of Sciences, 1098(Oral-Based Diagnostics):375–388, 2007.
[34] X. Qiu, J. Thompson, Z. Chen, C. Liu, D. Chen, S. Ramprasad, M. Mauk, S. Ongagna,
C. Barber, W. Abrams, D. Malamud, P. Corstjens, and H. Bau. Finger-actuated, self-
contained immunoassay cassettes. Biomedical Microdevices, 6:1175–86, 2009.
[35] C. Teller, J. Halamek, J. Zeravik, W.F.M. Stöcklein, and F.W. Scheller. Development of
a bifunctional sensor using haptenized acetylcholinesterase and application for the
detection of cocaine and organophosphates. Biosensors and Bioelectronics, 24(1):111–
117, 2008.
[36] T. Frisk, D. Ronnholm, W.V.D. Wijngaart, and G. Stemme. A micromachined interface
for airborne sample-to-liquid transfer and its application in a biosensor system. Lab on
a Chip, 6(12):1504–1509, 2006.
[37] Y. Du, C. Chen, J. Yin, B. Li, M. Zhou, S. Dong, and E. Wang. Solid-state probe based
electrochemical aptasensor for cocaine: A potentially convenient, sensitive, repeatable,
and integrated sensing platform for drugs. Analytical Chemistry, 82(4):1556–1563, 2010.
125

Bibliography
[38] K.-Y. Lien, C.-J. Liu, P.-L. Kuo, and G.-B. Lee. Bead-based microfluidic platform inte-
grated with optical detection devices for rapid detection of genetic deletion from saliva.
In MEMS Conference, pages 340–343, Sorrento, Italy, 2009.
[39] T.M. Blicharz, W.L. Siqueira, E.J. Helmerhorst, F.G. Oppenheim, P.J. Wexler, F.F. Little,
and D.R. Walt. Fiber-optic microsphere-based antibody array for the analysis of inflam-
matory cytokines in saliva. Analytical Chemistry, 81(6):2106–2114, 2009.
[40] K. Sun, N. Ramgir, and S. Bhansali. An immunoelectrochemical sensor for salivary
cortisol measurement. Sensors and Actuators B: Chemical, 133(2):533–537, 2008.
[41] B.E. Collins and E.V. Anslyn. Pattern-based peptide recognition. Chemistry – A, European
Journal, 13(17):4700–4708, 2007.
[42] D.R. Walt, T.M. Blicharz, R.B. Hayman, D.M. Rissin, M.Bowden, W.L. Siqueira, E.J.
Helmerhorst, N.Grand-Pierre, F.G. Oppenheim, J.S. Bhatia, F.F. Little, and J.S. Brody.
Microsensor arrays for saliva diagnostics. Annals of the New York Academy of Sciences,
1098(Oral-Based Diagnostics):389–400, 2007.
[43] E.M. Starke, J.C. Smoot, J.-H. Wu, W.-T. Liu, D. Chandler, and D.A. Stahl. Saliva-based
diagnostics using 16S rRNA microarrays and microfluidics. Annals of the New York
Academy of Sciences, 1098(Oral-Based Diagnostics):345–361, 2007.
[44] J.V. Jokerst, A. Raamanathan, N. Christodoulides, P.N. Floriano, A.A. Pollard, G.W. Sim-
mons, J. Wong, C. Gage, W.B. Furmaga, S.W. Redding, and J.T. Mcdevitt. Nano-bio-
chips for high performance multiplexed protein detection: Determinations of cancer
biomarkers in serum and saliva using quantum dot bioconjugate labels. Biosensors and
Bioelectronics, 24(12):3622–3629, 2009.
[45] N. Samyn and C. Van Haeren. On-site testing of saliva and sweat with drugwipe and de-
termination of concentrations of drugs of abuse in saliva, plasma and urine of suspected
users. Legal Medicine, 113(3):150–154, 2000.
[46] J.M. Walsh, R. Flegel, D.J. Crouch, L. Cangianelli, and J. Baudys. An evaluation of rapid
point-of-collection oral fluid drug-testing devices. Analytical Toxicology, 27(7):429–439,
2003.
[47] G. Cooper, L. Wilson, C. Reid, D. Baldwin, C. Hand, and V. Spieher. Validation of the
cozart microplate EIA for cocaine and metabolites in oral fluid. Analytical Toxicology,
28(6):498–503, 2004.
[48] D.A. Kidwell, J.D. Kidwell, F. Shinohara, C. Harper, K. Roarty, K. Bernadt, R.A. Mccaulley,
and F.P. Smith. Comparison of daily urine, sweat, and skin swabs among cocaine users.
Forensic Science International, 133(1–2):63–78, 2003.
[49] P.J. Viskari and J.P. Landers. Unconventional detection methods for microfluidic devices.
Electrophoresis, 27(9):1797–1810, 2006.
126

Bibliography
[50] T.D. Nguyen Hong, M. Jouan, N. Quy Dao, M. Bouraly, and F. Mantisi. Coupling of
high-performance liquid chromatography with raman spectrometry. Chromatography
A, 743(2):323–327, 1996.
[51] B. Saegmueller, G. Brehm, and S. Schneider. In situ generated photolytic silver in a
gelatin matrix: an approach for high-throughput sers spectroscopy applying microtiter
plates. Applied Spectroscopy, 54(12):1849–1856, 2000.
[52] M.A. De Jesus, K.S. Giesfeldt, and M.J. Sepaniak. Factors affecting the sorption of model
environmental pollutants onto silver polydimethylsiloxane nanocomposite raman sub-
strates. Applied Spectroscopy, 58(10):1157–1164, 2004.
[53] J. Kuligowski, G. Quintas, M. De La Guardia, and B. Lendl. Analytical potential of mid-
infrared detection in capillary electrophoresis and liquid chromatography: A review.
Analytica Chimica Acta, 679(1–2):31–42, 2010.
[54] S. Kulka, G. Quintas, and B. Lendl. On-line capillary electrophoresis FTIR detection for
the separation and characterization of proteins. Vibrational Spectroscopy, 42(2):392–396,
2006.
[55] S. Kulka, G. Quintas, and B. Lendl. Automated sample preparation and analysis using a
sequential-injection-capillary electrophoresis (SI-CE) interface. Analyst, 131(6):739–744,
2006.
[56] S. Kulka, N. Kaun, J.R. Baena, J. Frank, P. Svasek, D. Moss, M.J. Vellekoop, and B. Lendl.
Mid-ir synchrotron radiation for molecular specific detection in microchip-based analy-
sis systems. Analytical and Bioanalytical Chemistry, 378(7):1735–1740, 2004.
[57] T. Pan, R.T. Kelly, M.C. Asplund, and A.T. Woolley. Fabrication of calcium fluoride
capillary electrophoresis microdevices for on-chip infrared detection. Chromatography
A, 1027(1–2):231–235, 2004.
[58] R.M. Connatser, L.A. Riddle, and M.J. Sepaniak. Metal-polymer nanocomposites for in-
tegrated microfluidic separations and surface enhanced raman spectroscopic detection.
Separation Science, 27(17–18):1545–1550, 2004.
[59] M. Haberkorn, J. Frank, M. Harasek, J. Nilsson, T. Laurell, and B. Lendl. Flow-through
picoliter dispenser: A new approach for solvent elimination in FT-IR spectroscopy.
Applied Spectroscopy, 56(7):902–908, 2002.
[60] H.A. Waterman, C. Blom, H.J. Holterman, E.J. s’Gravenmade, and J. Mellema. Rheologi-
cal properties of human saliva. Archives of Oral Biology, 33(8):589–596, 1988.
[61] B.K.B. Berkovitz, G.R. Holland, and B.J. Moxham. Oral anatomy, histology and embryol-
ogy, volume 3. Mosby, New York, 2002.
[62] S.S. Davis. The rheological properties of saliva. Rheologica Acta, 10(1):28–35, 1971.
127

Bibliography
[63] P.H. Gann, S. Giovanazzi, L. Van Horn, A. Branning, and R.T. Chatterton. Saliva as a
medium for investigating intra- and interindividual differences in sex hormone levels in
premenopausal women. Cancer Epidemiol Biomarkers Prev, 10(1):59–64, 2001.
[64] K.R. Atkinson, K.R. Lo, S.R. Payne, J.S. Mitchell, and J.R. Ingram. Rapid saliva process-
ing techniques for near real-time analysis of salivary steroids and protein. Clinical
Laboratory Analysis, 22(6):395–402, 2008.
[65] P.D.V. de Almeida, A.M.T. Gregio, and M.A.N. Machando. Saliva composition and func-
tions: A comprehensive review. Contemporary Dental Practice, 9(3):72–80, 2008.
[66] S.P. Humphrey and R.T. Williamson. A review of saliva: Normal composition, flow, and
function. Prosthetic Dentistry, 85(2):162–169, 2001.
[67] C. Dawes. Rhythms in salivary flow rate and composition. Chronobiology, 2:253–279,
1974.
[68] S. Budavari, M.J. O’Neil, A. Smith, P.E. Heckelman, and J.F. Kinneary. The Merck Index.
Merck & Co., Inc., 12th edition, 1996.
[69] D.R. Lide. Handbook of Chemistry and Physics, volume 89. CRC Press, London, 2009.
[70] L.C.P.M. Schenkels, E.C.I. Veerman, and A.V. Nieuw Amerongen. Biochemical composi-
tion of human saliva in relation to other mucosal fluids. Critical Reviews in Oral Biology
and Medicine, 6(2):161–175, 1995.
[71] H. Berg, I.C. Cecilia, L. Lindh, and T. Arnebrant. Intraoral lubrication of PRP-1, statherin
and mucin as studied by AFM. Biofouling, 20(1):65–70, 2003.
[72] P.H. Wiernik, J.M. Goldman, J.P. Dutcher, and R.A. Kyle. Neoplastic diseases of the blood.
Cambridge University Press, 4th edition, 2003.
[73] K.L. Helton and P. Yager. Interfacial instabilities affect microfluidic extraction of small
molecules from non-Newtonian fluids. Lab on a Chip, 7(11):1581–1588, 2007.
[74] C. Dawes and G.H. Dibdin. Salivary concentrations of urea released from a chewing
gum containing urea and how these affect the urea content of gel-stabilized plaques
and their pH after exposure to sucrose. Caries Research, 35:344–353, 2001.
[75] G.C. Battistone and G.W. Burnett. The free amino acid composition of human saliva.
Archives of Oral Biology, 3(3):161–170, 1961.
[76] P. Praeve, U. Faust, W. Sittig, and D.A. Sukatsch. Handbuch der Biotechnologie. Olden-
bourg, 4th edition, 1994.
[77] J.V. Houte and D.B. Green. Relationship between the concentration of bacteria in saliva
and the colonization of teeth in humans. Infection and Immunity, 9(4):624–630, 1974.
128

Bibliography
[78] E.G.C. Clarke. Clarke’s isolation and identification of drugs in pharmaceuticals, body
fluids, and post-mortem materials. The Pharmaceutical Press, London, 2nd edition,
1986.
[79] A.J. Jenkins, J.M. Ovler, and E.J. Cone. Comparison of heroin and cocaine concentrations
in saliva with concentrations in blood and plasma. Journal of Analytical Toxicology,
19(6):359–374, 1995.
[80] E. Reynolds. Martindale the Extra Pharmacopoeia. The Pharmaceutical Press, London,
29th edition, 1989.
[81] N.A. Larsen, B. Zhou, A. Heine, P. Wirsching, K.D. Janda, and I.A. Wilson. Crystal structure
of a cocaine-binding antibody. Molecular Biology, 311(1):9–15, 2001.
[82] W.-L. Wang, W.D. Darwin, and E.J. Cone. Simultaneous assay of cocaine, heroin and
metabolites in hair, plasma , saliva and urine by gas chromatography- mass spectrome-
try. Chromatography B, 660:279–290, 1994.
[83] Verkehrsregelnverordnung Schweiz (VRV)
www.admin.ch/ch/d/sr/741_11/a2.html, accessed June 16th 2012.
[84] I. Kim, A.J. Barnes, R. Schepers, E.T. Moolchan, L. Wilson, G. Cooper, C. Reid, C. Hand,
and M.A. Huestis. Sensitivity and specificity of the cozart microplate eia cocaine oral
fluid at proposed screening and confirmation cutoffs. Clinical Chemistry, 49(9):1498–
1503, 2003.
[85] E.M. Munoz, S. Lorenzo-Abalde, A. Gonzaez-Fernandez, O. Quintela, M. Lopez-
Rivadulla, and R. Riguera. Direct surface plasmon resonance immunosensor for in
situ detection of benzoylecgonine, the major cocaine metabolite. Biosensors and Bio-
electronics, 26(11):4423–4428, 2011.
[86] E.J. Cone, M. Hillsgrove, and W.D. Darwin. Simultaneous measurement of cocaine,
cocaethylene, their metabolites, and "crack" pyrolysis products by gas chromatography-
mass spectrometry. Clinical Chemistry, 40(7):1299–1305, 1994.
[87] E.J. Cone, K. Kumor, L.K. Thompson, and M. Scherer. Correlation of saliva cocaine
levels with plasma levles and with pharmacologic effects after intravenous cocaine
administation in human subjects. Analytical Toxicology, 12:200–206, 1988.
[88] W. Schramm, R.H. Smith, P.A. Craig, and D.A. Kidwell. Drugs of abuse in saliva: a review.
Analytical Toxicology, 16(1):1–9, 1992.
[89] European research project ROadSIde Testing Assessment
www.rosita.org, accessed June 16th 2012.
[90] D.T. Wong. Salivary diagnostics. American Scientist, 96(1), 2008.
129

Bibliography
[91] R. Lennox, M.L. Dennis, C.K. Scott, and R. Funk. Combining psychometric and biometric
measures of substance use. Drug and Alcohol Dependence, 83(2):95–103, 2006.
[92] D.T. Wong. Salivary diagnostics powered by nanotechnologies, proteomics and ge-
nomics. American Dental Association, 137(3):313–321, 2006.
[93] I.D. Mandel. SALIVARY DIAGNOSIS – More than a lick and a promise. Journal of the
American Dental Association, 124(1):85–87, 1993.
[94] M. Navazesh and C.M. Christensen. A comparison of whole mouth resting and stimu-
lated salivary measurement procedures. Dental Research, 61(10):1158–1162, 1982.
[95] W.H. Rowe and I.L. Shannon. The biochemistry of human saliva in: Health and disease
in Salivary glands and their secretion. University of Michigan Press, 1972.
[96] K. Kato, M. Hillsgrove, L. Winhold, D.A. Gorelick, W.D. Darwin, and E.J. Cone. Cocaine
and metabolite excretion in saliva under stimulated and nonstimulated conditions.
Analytical Toxicology, 17:338–341, 1993.
[97] Saliva Drug Test Center
www.salivadrug.com, accessed June 16th 2012.
[98] SciMart
www.scimart.com/product/detail/salivette-synthetic-swab-for-cortisol-
determination-100pack/, accessed June 16th 2012.
[99] C. Holm-Hansen, G. Tong, C. Davis, W.R. Abrams, and D. Malamud. Comparison of oral
fluid collectors for use in a rapid point-of-care diagnostic device. Clinical and Vaccine
Immunology, 11(5):909–912, 2004.
[100] O.H. Drummer. Drug testing in oral fluid. Chinical Biochemical Review, 27:147–159,
2006.
[101] A. Burnett, W. Fan, P. Upadhya, J. Cunningham, E. Linfield, G. Davies, H. Edwards,
T. Munshi, and A. O’neil. Analysis of drugs-of-abuse and explosives using terahertz
time-domain and Raman spectroscopy. volume 6120, page 61200M. SPIE, 2006.
[102] D.J. Crouch, J.M. Walsh, R. Flegel, L. Cangianelli, J. Baudys, and R. Atkins. An evaluation
of selected oral fluid point-of-collection drug-testing devices. Analytical Toxicology,
29(4):244–248, 2005.
[103] G. Cooper, L. Wilson, C. Reid, L. Main, and C. Hand. Evaluation of the cozart rapiscan
drug test system for opiates and cocaine in oral fluid. Forensic Science International,
150(2–3):239–243, 2005.
[104] Craig Medical Distribution Inc.
www.craigmedical.com/saliva_drug_osr.htm, accessed June 16th 2012.
130

Bibliography
[105] Biomar Diagnostic Systems GmbH
www.biomar.de/schnellteste/drogen/toxiquick%20allgemein.pdf, accessed June 16th
2012.
[106] M. Concheiro, A. De Castro, O. Quintela, A. Cruz, and M. Lopez-Rivadulla. Confirma-
tion by lc-ms of drugs in oral fluid obtained from roadside testing. Forensic Science
International, 170(2–3):156–162, 2007.
[107] G. Cooper, L. Wilson, C. Reid, L. Main, and C. Hand. Evaluation of the cozart rapiscan
drug test system for opiates and cocaine in oral fluid. Forensic Science International,
150(2-3):239–243, 2005.
[108] Drug Testing World
www.drugtestingworld.com/drug-test-kits-cocaine-drug-tests-c-38_10.html, accessed
June 16th 2012.
[109] S.M. Wille, N. Samyn, M.M. Ramirez-Fernandez, and G. De Boeck. Evaluation of on-site
oral fluid screening using drugwipe-5(+), rapidstat and drug test 5000 for the detection
of drugs of abuse in drivers. Forensic Science International, 198(1–3):2–6, 2010.
[110] P.J.F. Rantonen and J.H. Meurman. Viscosity of whole saliva. Acta Odontologica Scandi-
navica, 56(4):210 – 214, 1998.
[111] M. Levy, B. Koeppen, and B. Stanton. Berne & Levy Principles of Physiology. Mosby, 4th
edition, 2005.
[112] S.S. Davis. Saliva is viscoelastic. Cellular and Molecular Life Sciences, 26(12):1298–1300,
1970.
[113] Waters Inc.
www.waters.com, accessed June 16th 2012.
[114] A. Manz and J.C.T. Eijkel. Miniaturization and chip technology. what can we expect?
Pure and Applied Chemistry, 73(10):1555–1561, 2001.
[115] B.H. Weigl, R. Bardell, T. Schulte, F. Battrell, and J. Hayenga. Design and rapid pro-
totyping of thin-film laminate-based microfluidic devices. Biomedical Microdevices,
3(4):267–274, 2001.
[116] C.E. White. Advanced methods, materials, and devices for microfluidics. PhD thesis,
2003.
[117] U. Attia, S. Marson, and J. Alcock. Micro-injection moulding of polymer microfluidic
devices. Microfluidics and Nanofluidics, 7(1):1–28, 2009.
[118] A. De Mello. Plastic fantastic? Lab on a Chip, 2(2):31N–36N, 2002.
131

Bibliography
[119] H. Becker and L.E. Locascio. Polymer microfluidic devices. Talanta, 56(2):267–287,
2002.
[120] B.-S. Chiou, R.J. English, and S.A. Khan. Rheology and photo-cross-linking of thiol-ene
polymers. Macromolecules, 29(16):5368–5374, 1996.
[121] L.H. Hung, R. Lin, and A.P. Lee. Rapid microfabrication of solvent-resistant biocompati-
ble microfluidic devices. Lab on a Chip, 8(6):983–987, 2008.
[122] D. Bartolo, G. Degre, P. Nghe, and V. Studer. Microfluidic stickers. Lab on a Chip,
8(2):274–279, 2008.
[123] MSDS NOA81, Norland Products Inc.
www.norlandprod.com/adhesives/noa%2081.html, accessed June 16th 2012.
[124] O. Frey, T. Holtzman, R.M. Mcnamara, D.E.H. Theobald, P.D. van der Wal, N.F. de Rooij,
J.W. Dalley, and M. Koudelka-Hep. Simultaneous neurochemical stimulation and record-
ing using an assembly of biosensor silicon microprobes and su-8 microinjectors. Sensors
and Actuators B: Chemical, 154(2):96–105, 2010.
[125] J.N. Lee, C. Park, and G.M. Whitesides. Solvent compatibility of poly(dimethylsiloxane)-
based microfluidic devices. Analytical Chemistry, 75(23):6544–6554, 2003.
[126] A. Waldbaur, H. Rapp, K. Länge, and B.E. Rapp. Let there be chip - towards rapid
prototyping of microfluidic devices: one-step manufacturing processes. Analytical
Methods, 3:2681–2716, 2011.
[127] D.C. Duffy, J.C. Mcdonald, O.J.A. Schueller, and G.M. Whitesides. Rapid prototyping of
microfluidic systems in poly(dimethylsiloxane). Analytical Chemistry, 70(23):4974–4984,
1998.
[128] J.P. Rolland, E.C. Hagberg, G.M. Denison, K.R. Carter, and J.M. De Simone. High-
resoultion soft lithography: Enabling materials for nanotechnologies. Angewandte
Chemie, 43:5796–5799, 2004.
[129] B.K. Lee, L.-Y. Hong, H.Y. Lee, D.-P. Kim, and T. Kawai. Replica mold for nanoimprint
lithography from a novel hybrid resin. Langmuir, 25(19):11768–11776, 2009.
[130] L.M. Campos, T.T. Truong, D.E. Shim, M.D. Dimitriou, D. Shir, I. Meinel, J.A. Gerbec,
H.T. Hahn, J.A. Rogers, and C.J. Hawker. Applications of photocurable pmms thiol-ene
stamps in soft lithography. Chemistry of Materials, 21(21):5319–5326, 2009.
[131] P. Wägli, A. Homsy, and N.F. de Rooij. Norland optical adhesive (NOA81) microchannels
with adjustable surface properties and high chemical resistance against IR-transparent
organic solvents. Procedia Engineering, 5:460–463, 2010.
132

Bibliography
[132] A.B. Shrirao and R. Perez-Castillejos. Simple fabrication of microfluidic devices by
replicating scotch-tape masters (http://blogs.rsc.org/chipsandtips/, accessed May 20th
2010). Chips & Tips, May 17th 2010.
[133] P. Wägli, A. Homsy, and N.F. de Rooij. Norland optical adhesive (NOA81) microchannels
with adjustable wetting behavior and high chemical resistance against a range of mid–
infrared–transparent organic solvents. Sensors and Actuators B: Chemical, 156(2):994–
1001, 2011.
[134] B.T. Ginn and O. Steinbock. Polymer surface modification using microwave-oven-
generated plasma. Langmuir, 19(19):8117–8118, 2003.
[135] J. Bibette, F. Leal-Calderon, V. Schmitt, and P. Poulin. Emulsion Science. Springer, New
York, 2007.
[136] S.H. Kim, Y. Yang, M. Kim, S.-W. Nam, K.-M. Lee, N.Y. Lee, Y.S. Kim, and S. Park. Sim-
ple route to hydrophilic microfluidic chip fabrication using an ultraviolet (UV)-cured
polymer. Advanced Functional Materials, 17(17):3493–3498, 2007.
[137] P. Wägli, A. Homsy, and N.F. de Rooij. Norland optical adhesive (NOA81) microchannels
with adjustable wetting behavior and high chemical resistance against a range of mid-
infrared-transparent organic solvents. Sensors and Actuators B: Chemical, 156(2):994–
1001, 2011.
[138] P. Wägli, B Guélat, A. Homsy, and N.F. de Rooij. Microfluidic devices made of UV-curable
glue (NOA81) for fluorescence detection based applications. In International Confer-
ence on Miniaturized Systems for Chemistry and Life Sciences (MicroTAS), Groningen,
Netherlands, 2010.
[139] P. Wägli, P.D. van der Wal, A. Homsy, and N.F. de Rooij. UV-curable adhesive as the
low-cost material of choice for microfluidic forensic applications. In International
Meeting on Chemical Sensors (IMCS), Nürnberg, Germany, 2012.
[140] E.W. Washburn. Physical Review, 17:273–283, 1921.
[141] A. Han, G. Mondin, N.G. Hegelbach, N.F. de Rooij, and U. Staufer. Filling kinetics of
liquids in nanochannels as narrow as 27 nm by capillary force. Colloid and Interface
Science, 293(1):151–157, 2006.
[142] T.-H. Yoon, S.-H. Park, K.-I. Min, X. Zhang, S.J. Haswell, and D.-P. Kim. Novel inorganic
polymer derived microreactors for organic microchemistry applications. Lab on a Chip,
8:1454–1459, 2008.
[143] H. Lai, I. Corbin, and J.R. Almirall. Headspace sampling and detection of cocaine,
mdma, and marijuana via volatile markers in the presence of potential interferences
by solid phase microextraction-ion mobility spectrometry (spme-ims). Analytical and
Bioanalytical Chemistry, 392(1–2):105–113, 2008.
133

Bibliography
[144] J. Pawliszyn. Handbook of solid phase microextraction. Chemical Industry Press of
China, 2009.
[145] A. Homsy, P. van der Wal, W. Doll, R. Schaller, S. Korsatko, M. Ratzer, M. Ellmerer, T.R.
Pieber, A. Nicol, and N.F. de Rooij. Development and validation of a low cost blood
filtration element separating plasma from undiluted whole blood. Biomicrofluidics,
6(1):012804, 2012.
[146] A.B. Lowe. Thiol-ene "click" reactions and recent applications in polymer and materials
synthesis. Polymer Chemistry, 1(1):17–36, 2009.
[147] S. Silvestrini, D. Ferraro, T. Toth, M. Pierno, T. Carofiglio, G. Mistura, and M. Maggini.
Tailoring the wetting properties of thiolene microfluidic materials. Lab on a Chip,
12(20):4041–4043, 2012.
[148] R. Tadmor. Line energy and the relation between advancing, receding, and young
contact angles. Langmuir, 20(18):7659–7664, 2004.
[149] R. Bongiovanni, M. Sangermano, G. Malucelli, and A. Priola. Uv curing of photoinitiator-
free systems containing bismaleimides and diacrylate resins: bulk and surface proper-
ties. Progress in Organic Coatings, 53(1):46–49, 2005.
[150] J.A. Muck, M.P. Chatrathi, G. Chen, N. Mittal, S.D. Spillman, and S. Obeidat. Bulk
modification of polymeric microfluidic devices. Lab on a Chip, 5(2):226–230, 2005.
[151] B. Bhushan, D. Hansford, and K.K. Lee. Surface modification of silicon and polydimethyl-
siloxane surfaces with vapor-phase-deposited ultrathin fluorosilane films for biomedical
nanodevices. Vacuum Science & Technology A: Vacuum Surfaces and Films, 24(4):1197–
1202, 2006.
[152] H. Maeda, N. Ishida, H. Kawauchi, and K. Tuzimura. Reaction of fluorescein-
isothiocyanate with proteins and amino acids. Biochemistry, 65(5):777–783, 1969.
[153] B. Zhao, J.S. Moore, and D.J. Beebe. Surface-directed liquid flow inside microchannels.
Science, 291(5506):1023–1026, 2001.
[154] E.P. Dupont, R. Luisier, and M.A.M. Gijs. Noa 63 as a UV-curable material for fabrication
of microfluidic channels with native hydrophilicity. Microelectronic Engineering, 87(5–
8):1253–1255, 2010.
[155] R. Bharadwaj, J.G. Santiago, and B. Mohammadi. Design and optimization of on-chip
capillary electrophoresis. Electrophoresis, 23:2729–2744, 2002.
[156] Budget Sensors, Bulgaria
www.budgetsensors.com, accessed June 16th 2012.
134

Bibliography
[157] S. Bhattacharya, A. Datta, J.M. Berg, and S. Gangopadhyay. Studies on surface wettabil-
ity of poly(dimethyl) siloxane (PDMS) and glass under oxygen-plasma treatment and
correlation with bond strength. Microelectromechanical Systems, 14(3):590–597, 2005.
[158] P. Wägli, Y.-C. Chang, P.D. van der Wal, L Hovzdara, A. Homsy, H.P. Herzig, and N.F.
de Rooij. Droplet based liquid-liquid extraction and on-chip IR-waveguide-spectroscopy
detection of cocaine in human saliva. In International Conference on Miniaturized
Systems for Chemistry and Life Sciences (MicroTAS), Okinawa, Japan, 2012.
[159] J. Xu and D. Attinger. Drop on demand in a microfluidic chip. Micromechanics and
Microengineering, 18(6):065020–065030, 2008.
[160] C. Cramer, P. Fischer, and E.J. Windhab. Drop formation in a co-flowing ambient fluid.
Chemical Engineering Science, 59(15):3045–3058, 2004.
[161] T. Thorsen, R.W. Roberts, F.H. Arnold, and S.R. Quake. Dynamic pattern formation in a
vesicle-generating microfluidic device. Physical Review Letters, 86(18):4163–4166, 2001.
[162] P. Garstecki, M.J. Fuerstman, H.A. Stone, and G.M. Whitesides. Formation of droplets
and bubbles in a microfluidic T-junction-scaling and mechanism of break-up. Lab on a
Chip, 6(3):437–446, 2006.
[163] S. Sugiura, M. Nakajima, H. Ushijima, K. Yamamoto, and M. Seki. Preparation charac-
teristics of monodispersed water-in-oil emulsions using microchannel emulsification.
Chemical Engineering of Japan, 34(6):757–765, 2001.
[164] I. Kobayashi, K. Uemura, and M. Nakajima. Formulation of monodisperse emulsions
using submicron-channel arrays. Colloids and Surfaces A: Physicochemical and Engi-
neering Aspects, 296:285–289, 2007.
[165] I. Kobayashi, Y. Wada, K. Uemura, and M. Nakajima. Microchannel emulsification for
mass production of uniform fine droplets: integration of microchannel arrays on a chip.
Microfluidics and Nanofluidics, 8(2):255–262, 2010.
[166] E. van der Zwan, K. Schroen, and R. Boom. A geometric model for the dynamics of
microchannel emulsification. Langmuir, 25(13):7320–7327, 2009.
[167] I. Kobayashi, S. Mukataka, and M. Nakajima. Production of monodisperse oil-in-water
emulsions using a large silicon straight-through microchannel plate. Industrial and
Engineering Chemistry Research, 44(15):5852–5856, 2005.
[168] I. Kobayashi, T. Takano, R. Maeda, Y. Wada, K. Uemura, and M. Nakajima. Straight-
through microchannel devices for generating monodisperse emulsion droplets several
microns in size. Microfluidics and Nanofluidics, 4(3):167–177, 2008.
[169] K. Wang, Y. Lu, J. Xu, and G. Luo. Droplet generation in micro-sieve dispersion device.
Microfluidics and Nanofluidics, 10(5):1087–1095, 2011.
135

Bibliography
[170] T. Nisisako and T. Torii. Microfluidic large-scale integration on a chip for mass produc-
tion of monodisperse droplets and particles. Lab on a Chip, 8(2):287–293, 2008.
[171] S.L. Anna, N. Bontoux, and H.A. Stone. Formation of dispersions using ’flow focusing’
in microchannels. Applied Physics Letters, 82(3):364–366, 2003.
[172] R. Dreyfus, P. Tabeling, and H. Willaime. Ordered and disordered patterns in two-phase
flows in microchannels. Physical Review Letters, 90(14):1445051–1445054, 2003.
[173] L. Shui, A. Van Den Berg, and J. Eijkel. Scalable attoliter monodisperse droplet formation
using multiphase nano-microfluidics. Microfluidics and Nanofluidics, 11(1):87–92, 2011.
[174] S. Darvishi and T. Cubaud. Lubrication of highly viscous core-annular flows in microflu-
idic chambers. Fluids Engineering, 133(3):0312031–0312037, 2011.
[175] R. Dangla, F. Gallaire, and C.N. Baroud. Microchannel deformations due to solvent-
induced PDMS swelling. Lab on a Chip, 10(21):2972–2978, 2010.
[176] E. Tamaki, A. Hibara, H.-B. Kim, M. Tokeshi, and T. Kitamori. Pressure-driven flow
control system for nanofluidic chemical process. Chromatography A, 1137(2):256–262,
2006.
[177] C. Neumann, A. Voigt, L. Pires, and B.E. Rapp. Design and characterization of a platform
for thermal actuation of up to 588 microfluidic valves. Microfluidics and Nanofluidics,
in press.:1–10, 2012.
[178] K.C. van Dijke, K. Schroen, A. van der Padt, and R. Boom. Edge emulsification for
food-grade dispersions. Food Engineering, 97(3):348–354, 2010.
[179] A.D. Stroock, S.K.W. Dertinger, A. Ajdari, I. Mezic, H.A. Stone, and G.M. Whitesides.
Chaotic mixer for micochannels. Science, 295(5555):647–651, 2002.
[180] W. Buchegger, C. Wagner, P. Svasek, B. Lendl, M. Kraft, and M.J. Vellekoop. Fabrica-
tion and characterization of a vertical lamination micromixer for mid-ir spectroscopy.
Sensors and Actuators B: Chemical, 159(1):336–341, 2011.
[181] A. Peters. Passive discrete phase coalescence and extraction in droplet based microflu-
idic devices. Semester thesis EPF Lausanne, 2012.
[182] H. Gu, M.H.G. Duits, and F. Mugele. Droplets formation and merging in two-phase flow
microfluidics. Molecular Sciences, 12(4):2572–2597, 2011.
[183] L. Bräuer, S. Möschter, S. Beileke, K. Jäger, F. Garreis, and F. Paulsen. Human parotid
and submandibular glands express and secrete surfactant proteins A, B, C and D. Histo-
chemistry and Cell Biology, 132(3):331–338, 2009.
[184] A.H. Demond and A.S. Lindner. Estimation of interfacial tension between organic
liquids and water. Environmental Science & Technology, 27(12):2318–2331, 1993.
136

Bibliography
[185] A. Preetha and R. Banerjee. Comparison of artificial saliva substitutes. Trends in Bioma-
terials & Artificial Organs, 18(2):178–186, 2005.
[186] N. Bremond, A.R. Thiam, and J. Bibette. Decompressing emulsion droplets favors
coalescence. Physical Review Letters, 100(2):0245011–0245014, 2008.
[187] X. Niu, S. Gulati, J.B. Edel, and A.J. Demello. Pillar-induced droplet merging in microflu-
idic circuits. Lab on a Chip, 8(11):1837–1841, 2008.
[188] C.-X. Zhao and A.P.J. Middelberg. Two-phase microfluidic flows. Chemical Engineering
Science, 66(7):1394–1411, 2011.
[189] C. Priest, S. Herminghaus, and R. Seemann. Controlled electrocoalescence in microflu-
idics: Targeting a single lamella. Applied Physics Letters, 89(13):134101–134103, 2006.
[190] G.F. Christopher, J. Bergstein, N.B. End, M. Poon, C. Nguyen, and S.L. Anna. Coalescence
and splitting of confined droplets at microfluidic junctions. Lab on a Chip, 9(8):1102–
1109, 2009.
[191] L.M. Fidalgo, C. Abell, and W.T.S. Huck. Surface-induced droplet fusion in microfluidic
devices. Lab on a Chip, 7(8):984–986, 2007.
[192] N. Bremond, H. Domejean, and J. Bibette. Propagation of drop coalescence in a
two-dimensional emulsion: A route towards phase inversion. Physical Review Letters,
106(21):214502, 2011.
[193] A. Lai, N. Bremond, and H.A. Stone. Separation-driven coalescence of droplets: an
analytical criterion for the approach to contact. Fluid Mechanics, 632:97–107, 2009.
[194] D.Z. Gunes, X. Clain, O. Breton, G. Mayor, and A.S. Burbidge. Avalanches of coalescence
events and local extensional flows - stabilisation or destabilisation due to surfactant.
Colloid and Interface Science, 343(1):79–86, 2010.
[195] B. Xu, N.-T. Nguyen, and T.N. Wong. Temperature-induced droplet coalescence in
microchannels. Biomicrofluidics, 6(1):012811–012818, 2012.
[196] D.E. Angelescu and D. Siess. Microfluidic phase separation. In IEEE Sensors, Irvine, CA,
USA, 2005.
[197] P. Mary, V. Studer, and P. Tabeling. Microfluidic droplet-based liquid-liquid extraction.
Analytical Chemistry, 80(8):2680–2687, 2008.
[198] S. Pedersen-Bjergaard and K.E. Rasmussen. Bioanalysis of drugs by liquid-phase mi-
croextraction coupled to separation techniques. Journal of Chromatography B, 817(1):3–
12, 2005.
[199] M. Surmeian, M.N. Slyadnev, H. Hisamoto, A. Hibara, K. Uchiyama, and T. Kitamori.
Three-layer flow membrane system on a microchip for investigation of molecular trans-
port. Analytical Chemistry, 74(9):2014–2020, 2002.
137

Bibliography
[200] A. Smirnova, K. Mawatari, A. Hibara, M.A. Proskurnin, and T. Kitamori. Micro-
multiphase laminar flows for the extraction and detection of carbaryl derivative. Analyt-
ica Chimica Acta, 558(1–2):69–74, 2006.
[201] M. Tokeshi, T. Minagawa, and T. Kitamori. Integration of a microextraction system:
Solvent extraction of a co-2-nitroso-5-dimethylaminophenol complex on a microchip.
Journal of Chromatography A, 894(1–2):19–23, 2000.
[202] J.R. Burns and C. Ramshaw. The intensification of rapid reactions in multiphase systems
using slug flow in capillaries. Lab on a Chip, 1(1):10–15, 2001.
[203] Microfluidics tutorial University of Washington
www.faculty.washington.edu/yagerp/microfluidicstutorial/hfilter/hfilterhome.htm, ac-
cessed June 16th 2012.
[204] J.P. Brody, T.D. Osborn, F.K. Forster, and P. Yager. A planar microfabricated fluid filter.
Sensors and Actuators A: Physical, 54(1–3):704–708, 1996.
[205] M.R. Holl, P. Galambos, F.K. Forster, J.P. Brody, M.A. Afromowitz, and P. Yager. Op-
timal design of a microfabricated diffusion-based extraction device. ASME Meeting,
DSC59:189–195, 1996.
[206] J.P. Brody and P. Yager. Diffusion-based extraction in a microfabricated device. Sensors
and Actuators A: Physical, 58(1):13–18, 1997.
[207] M.T.F. Abedul, J.R.B. Rodriguez, A.C. Garcia, and P.T. Blanco. Voltammetric determina-
tion of cocaine in confiscated samples. Electroanalysis, 3(4-5):409–412, 1991.
[208] R.A. Scherrer and S.M. Howard. Use of distribution coefficients in quantitative structure-
activity relations. Medicinal Chemistry, 20(1):53–58, 1977.
[209] D.C. Scott and J.W. Clymer. Estimation of distribution coefficients form the partition
coefficient and pKa. Pharmaceutical Technology, 11:30–40, 2002.
[210] Y.-C. Chang, P. Wägli, V. Paeder, A. Homsy, L. Hvozdara, P.D. van der Wal, J. Di Francesco,
N.F. de Rooij, and H.P. Herzig. Cocaine detection by a mid-infrared waveguide integrated
with a microfluidic chip. Lab on a Chip, 3:3020–3023, 2012.
[211] N.J. Harrick. Study of physics and chemistry of surfaces from frustrated total internal
reflections. Physical Review Letters, 4(5):224–226, 1960.
[212] J. Fahrenfort. Attenuated total reflection: A new principle for the production of useful
infra-red reflection spectra of organic compounds. Spectrochimica Acta, 17(7):698–709,
1961.
[213] A.C. Mcintyre, M.L. Bilyk, A. Nordon, G. Colquhoun, and D. Littlejohn. Detection of
counterfeit scotch whisky samples using mid-infrared spectrometry with an attenuated
total reflectance probe incorporating polycrystalline silver halide fibres. Analytica
Chimica Acta, 690(2):228–233, 2011.
138

Bibliography
[214] L. Hvozdara, S. Gianordoli, G. Strasser, W. Schrenk, K. Unterrainer, E. Gornik, C.S.S.S.
Murthy, M. Kraft, V. Pustogow, B. Mizaikoff, A. Inberg, and N. Croitoru. Spectroscopy in
the gas phase with gaas/algaas quantum-cascade lasers. Applied Optics, 39(36):6926–
6930, 2000.
[215] O. Eyal, V. Scharf, S. Shalem, and A. Katzir. Single-mode mid-infrared silver halide planar
waveguides. Optics Letters, 21(15):1147–1149, 1996.
[216] J. Hu, V. Tarasov, A. Agarwal, L. Kimerling, N. Carlie, L. Petit, and K. Richardson. Fab-
rication and testing of planar chalcogenide waveguide integrated microfluidic sensor.
Optical Express, 15(5):2307–2314, 2007.
[217] C. Charlton, M. Giovannini, J. Faist, and B. Mizaikoff. Fabrication and characterization of
molecular beam epitaxy grown thin-film gaas waveguides for mid-infrared evanescent
field chemical sensing. Analytical Chemistry, 78(12):4224–4227, 2006.
[218] K. Seong-Soo, C. Young, and B. Mizaikoff. Miniaturized mid-infrared sensor technologies.
Analytical and Bioanalytical Chemistry, 390:231–237, 2008.
[219] J. Faist, F. Capasso, D.L. Sivco, C. Sirtori, A.L. Hutchinson, and A.Y. Cho. Quantum
cascade laser. Science, 264(5158):553–556, 1994.
[220] X. Wang, S.-S. Kim, R. Rossbach, M. Jetter, P. Michler, and B. Mizaikoff. Ultra-sensitive
mid-infrared evanescent field sensors combining thin-film strip waveguides with quan-
tum cascade lasers. Analyst, 137(10):2322–2327, 2012.
[221] Quantared Technologies, Vienna, Austria
www.quantared.com, accessed June 16th 2012.
[222] A. Karalis, J.D. Joannopoulos, and M. Soljacic. Efficient wireless non-radiative mid-range
energy transfer. Annals of Physics, 323(1):34–48, 2008.
[223] M.-C. Hans, M. Gianella, and M.W. Sigrist. Sensing cocaine in saliva with attenuated total
reflectioninfrared (atr-ir) spectroscopy combined with a one-step extraction method.
In SPIE, volume 8229, pages 822919 1–822919 7, San Francisco, California, USA, 2012.
[224] Y.-C. Chang, V. Paeder, L. Hvozdara, J.-M. Hartmann, and H.P. Herzig. Low loss germa-
nium strip waveguides on silicon for the mid-infrared. Optics Letters, ID 167799, in
press., 2012.
[225] B. Hinkov, A. Bismuto, Y. Bonetti, M. Beck, S. Blaser, and J. Faist. Single-mode quantum
cascade lasers with power dissipation below 1w. Electronics Letters, 48(11), 2012.
[226] Bartels Mikrotechnik, Dortmund, Germany
www.bartels-mikrotechnik.de, accessed June 16th 2012.
[227] Osmotex, Alpnach, Switzerland
www.osmotex.ch, accessed June 16th 2012.
139

Bibliography
[228] L. Perrenoud. Swiss laboratory for doping analyses (LAD). Lausanne, Switzerland, 2012.
[229] F. Fairbrother and A.E. Stubbs. Studies in electroendosmosis. part vi the bubble-tube
methods of measurement. Chemical Society, 1935.
[230] G.I. Taylor. Deposition of a viscous fluid on the wall of a tube. Fluid Mechanics, 10:161–
165, 1961.
[231] F.P. Bretherton. The motion of long bubbles in tubes. Fluid Mechanics, 10:166–188, 1961.
[232] LabSmith, Livermore, CA, USA
www.labsmith.com/microfluidicssyringepump.html, accessed June 16th 2012.
140

Glossary
List of Symbols
A area
Bo Bond number
C a Capillary number
C F4 tetrafluoromethane
D diffusion coefficient
DC distribution coefficient
e thickness of lubrication film
ES extraction system
g gravitational acceleration
G ′ elastic storage modulus
G ′′ viscous loss modulus
Ga As gallium arsenide
Ge germanium
h height
j flux of matter per surface area
L0 characteristic length
l length
m flow consistency index
n flow behavior index
p pressure
PC partition coefficient
pH measure of the activity of the (solved) hydrogen ion
pK a equilibrium constant for a chemical reaction
R droplet radius
Re Reynolds number
Si silicon
t time
v0 characteristic velocity
w width
x distance in x-direction
141

Glossary
z distance in z-direction
Z nSe zinc selenide
γ interfacial tension
ξ shear rate
η dynamic viscosity
λ wavelength
Θ contact angle
ρ density
τ shear stress
List of Abbreviations
AF M atomic force microscopy
APT ES ((3-aminopropyl)triethoxysilane)
AT R − I R attenuated total reflection infrared spectroscopy
C E capillary electrophoresis
C HUV Centre Hospitalier Universitaire Vaudois
C T B A cetyl trimethylammonium bromide
CV coefficient of variation
DMF dimethylformamide
DN A deoxyribonucleic acid
DSS dioctyl sodium sulfosuccinate
E MPA Eidgenössische Materialprüfungsanstalt Dübendorf
EPF L Ecole Polytechnique Fédérale de Lausanne
ES extraction system
ESPC I Ecole Supérieure de Physique et de Chimie Industrielles de la ville de Paris
ET H Z Eidgenössische Technische Hochschule Zürich
F H NW Fachhochschule Nordwestschweiz
FOT S ((tridecafluoro-1,1,2,2-tetrahydrooctyl)trichlorosilane)
F T − I R Fourier transformed infrared spectroscopy
I PA isopropyl alcohol
I R infrared
I r Sens integrated sensing platform for gases and liquids in the near and mid-infrared
range (Nano-Tera project)
I SF ET ion-sensitive field-effect transistor
L AD Swiss Laboratory for Doping Analyses
LMT S Microsystems for Space Technologies Laboratory
LOC lab-on-a-chip
LOD limit of detection
MC E microchannel emulsification
MC T mercury cadmium telluride
142

Glossary
ME MS micro electro-mechanical system
MF F D microfluidic flow-focusing device
MS mass spectrometry
µT AS micro total analysis system
NO A81 Norland Optical Adhesive 81
PC polycarbonate
PC E perchloroethylene / tetrachloroethylene
PC R polymerase chain reaction
PDMS polydimethylsiloxane
PES polyethersulfone
P M M A polymethylmethacrylate
POC point-of-care
QC D quantum cascade detector
QC L quantum cascade laser
QC M quartz crystal microbalance
S AML AB Sensors, Actuators, and Microsystems Laboratory
S AM HS A Substance Abuse and Mental Health Services Administration, USA
SD standard deviation
SI −C E sequential-injection capillary electrophoresis
SMC E straight-trough microchannel emulsification
SP surfactant protein
SP ME solid-phase micro-extraction
SPRI surface plasmon resonance imaging
SU −8 high aspect ratio epoxy based photoresist
T HF tetrahydrofuran
Uni Ne Université Neuchâtel
U PLC −MS ultra performance liquid chromatography - mass spectrometer
UV ultra violet
V C SEL vertical-cavity surface-emitting laser
X PS X-ray photoelectron spectroscopy
143


Acknowledgements
In 2009 I hesitated to accept the PhD position in the Swiss French part, but in retrospect this
was definitely one of the best decisions in my life and I would not miss a single day! In SAMLAB
I found a very inspiring environment where high level research meets the atmosphere of the
Mediterranean way of life, what made me rich in scientific and social experiences.
First of all, I like to thank my thesis director Prof. Nico de Rooij for giving me the opportunity to
work in the stimulating environment of SAMLAB, for providing a lab with excellent infrastruc-
ture, and for giving me the chance to interact with specialists in the field of microtechnology
and to present my research at many international conferences all around the world.
My gratitude goes to my co-director and supervisor Alexandra Homsy. I thank her for the
introduction to the interesting field of microfluidics, for her careful supervision and guidance,
her trust, and the time and efforts she devoted to our project IrSens. I also highly appreciated
the flexibility and personal responsibility I had during the last years.
I also gratefully acknowledge Prof. Jürgen Brugger, Dr. Bastian E. Rapp, Dr. Pierre Jouy, and
Prof. Herbert Shea for kindly accepting to be the co-examiners in my PhD exam.
Special thanks also go to the rest of SAMLAB’s microfluidic team, Luca Ribetto and Blaise
Guélat for the great collaboration, for sharing know-how, experiences, and resources.
Another important personality in SAMLAB is Peter van der Wal. Especially during the last year
he did a great job as my first-point-of-contact. I like to thank him for his essential support for
chemical issues, all the scientific and non-scientific suggestions, the long discussions, and the
thousands of nasty but finally fruitful questions.
I also should express my gratitude to Karine Frossard for the incredible efficient support with
administrative issues and to my office mate Claudio Novelli for the IT support and the great
time we had together sharing the office.
In SAMLAB I met colleagues with valuable advice and at the same time wonderful open-
minded friends from all around the world. I am grateful for all the time we spent together
studying, experimenting, sharing ideas and experiences, but also for the leisure time at aperi-
tifs, at festivals, at BBQs, at concerts as well as at sport or excursions. Furthermore, SAMLAB
people were a great and rich source of saliva samples for my experiments. I would like to
thank Terunobu Akyiama, Dara Bayat, Roland Bitterli, Danick Briand, Michael Canonica, El
Hadji Malick Camara, Jérôme Courbat, David de Koninck, Cécile Fattebert, Olivier Frey, Franz
145

Acknowledgements
Friedrich, Sebastian Gautsch, Nicolas Golay, Rokhaya Gueye, Don Isarakorn, Pattanaphong
Janphuang, Fabio Jutzi, Sébastien Lani, Robert Lockhart, Fréderic Loizeau, Olivier Lässer,
Francisco Molina Lopez, Jonathan Masson, Giorgio Mattana, Wilfried Noell, Yves Pétremand,
Sotiria Psoma, Jason Ruan, Rahel Strässle, Sara Talaei, Andres Vasquez Quintero, Peter Vettiger,
Stefan Weber, and Yexian Wu.
Moreover, I also like to mention people from LMTS sharing labs with us: Prof. Herbert Shea,
Samin Akbari, Seun Araromi, Caglar Ataman, Subha Chakraborty, Simon Dandavino, Kaustav
Ghose, Luc Maffli, Muhamad Niklaus, Myriam Poliero, Andres Punning, Pille Rinne, Samuel
Rosset, Jun Shintake, and Vinu Venkatraman.
I also got the opportunity to supervise the EPFL master students Loïc Hans and Allen Peters
and like to thank them for their work and contribution to our project.
Thank also goes to people of CSEM; to division C for fabrication support, to the Microscopy
Service of Massoud Daddras and Mireille Leboeuf for the AFM images and special thanks go
to Nicolas Blondiaux of division N for the inputs and discussions about surface chemistry and
wetting behavior.
The frame of my thesis was given by the Nano-Tera project IrSens of the Swiss National Science
Foundation, which is acknowledged here for the financial support. We also acknowledge the
SNF R’Equip program for the funding of the high speed data acquisition test bench.
It was a pleasure to work with many motivated collaborators on this Nano-Tera project to-
wards the same goal. I like to thank especially a couple of institutes we had close collabo-
ration with: I sincerely thank Kerstin Hans, Michele Gianella, and Prof. Markus Sigrist of
ETHZ/D-PHYS/IQE/LSSL for the preliminary studies for cocaine detection and the system
integration, Yu-Chi Chang, Joab Di Francesco, Lubos Hvozdara, and Prof. Hans Peter Herzig of
EPFL/STI/IMT/OPT for the fabrication of optical wave guides and Pierre Jouy, Yargo Bonetti,
and Prof. Jérôme Faist of ETHZ/D-PHYS/IQE/QOG mainly for the project coordination.
I also appreciate the inputs and the discussions with the polymer specialist Bastian Rapp of the
Institute of Microstructure Technology at the Karlsruhe Institute of Technology in Germany,
and the exchange of know-how about the processing of UV-glue for microfluidic devices
with Marie-Caroline Jullien and Fabrice Monti of the group of Prof. Patrick Tabeling of the
Microfluidics, MEMS and Nanostructures Laboratory at the ESPCI Paris, France.
I would also like to acknowledge Laure Aeschimann of NanoWorld for providing the nano-
structures for the replication tests of our rapid prototyping method.
I also like to thank Laurent Perrenoud of the Swiss Laboratory for Doping Analyses (LAD) in
Lausanne for the efficient collaboration for the cocaine reference measurements using their
state of the art mass spectrometer. Thanks goes also to Christian Berchtold of the Institute of
Chemistry of ETH in Zürich for further cocaine measurements and the development of a new
detection routine.
146

Acknowledgements
Finally, I would like to thank all my friends and family for the unlimited support, the loyalty
and abundance of patience throughout my years of study. My sister Claudine and my brother
Michel particular for discussions prior to tough choices, for being close, even if being physically
at the other end of the world. Special thank goes to my parents Irmgard and Georges, who
support me, whenever and whatever I decide to do. I appreciate their infinite trust and the
possibility to do, whatever I am up to. They managed to put me on a track; I am persuaded
that it is still the right one.
147


Philip Wägli Swiss, born 1983
Education
06/2009 – 12/2012 École Polytechnique Fédérale, Lausanne/Neuchâtel Doctoral School in Microsystems and Microelectronics PhD student in The Sensors, Actuators and Microsystems Laboratory
project: IrSens – Integrated infrared sensing platform for liquids
Research on enhanced microfluidic liquid-liquid extraction systems
PhD Thesis: "Integrated Microfluidic Liquid-Liquid Extraction for
Detection of Cocaine in Human Saliva"
10/2006 – 09/2008 Eidgenössische Technische Hochschule, Zürich Master of Science ETH in Mechanical Engineering Focus specialization in Micro-/Nanosystems and Biomedical Engineering
Master Thesis: "Towards All-Polymer µ–TAS: Analysis of the Influence of
Humidity, Varying Concentrations of Ethanol in Water, and
Different Biomolecules on SU-8 Polymer Micro Resonators"
Semester Thesis: "DNA-Assisted Micro/Nano Pattern Reproduction Process"
10/2002 – 07/2005 Eidgenössische Technische Hochschule, Zürich Bachelor of Science ETH in Mechanical Engineering Focus specialization in Micro-/Nanosystems
Bachelor Thesis: "Fabrication and Characterization of Micromechanical
Test Structures for the Determination of Intrinsic Thin
Film Stress in Polyimide"
08/1998 – 07/2002 Gymnasium Kirchenfeld, Bern Matura in the department of math and natural science Matura Thesis: "Design and Visualization of a Building"
Work Experience
02/2009 – 5/2009 Chair of micro and Nanosystems ETHZ, Zürich project: WIPSS - wireless implantable passive strain sensor
Development of a fabrication process for polymer MEMS
01/2007 – 12/2007 Micro- and Nanoscience Platform (MNSP), Zürich Build-up of a data base of leading companies in micro- and nanoscience
assistance for the conference “INDUSTRY DAY 2008”
Languages
German native language
English conversational - around working knowledge, C1*
French conversational, B2/C1*
Spanish basic, A1*
*Common European Framework of Reference for Language
149


List of Publications
Publications related to this thesis
Y.-C. Chang, P. Wägli, V. Paeder, A. Homsy, L. Hvozdara, P. van der Wal, J. Di Francesco, N.F.
de Rooij and H.P. Herzig. Cocaine detection by a mid-infrared waveguide integrated with a
microfluidic chip. Lab on a Chip, 12:3020–3023, 2012. doi:10.1039/C2LC40601B.
P. Wägli, A. Homsy and N.F. de Rooij. Norland optical adhesive (NOA81) microchannels with
adjustable wetting behavior and high chemical resistance against a range of midinfrared-
transparent organic solvents. Sensors and Actuators B: Chemical, 156(2):994–1001, 2011. doi:
10.1016/j.snb.2011.02.005.
P. Wägli, Y.-C. Chang, P.D. van der Wal, L. Hovzdara, A. Homsy, H.P. Herzig and N.F. de Rooij.
Droplet based liquid-liquid extraction and on-chip IR-waveguide-spectroscopy detection of
cocaine in human saliva. In International Conference on Miniaturized Systems for Chemistry
and Life Sciences (MicroTAS), Okinawa, Japan, 2012.
P. Wägli, A. Homsy and N.F. de Rooij. UV-curable adhesive as the low-cost material of choice
for microfluidic forensic applications. In International Meeting on Chemical Sensors (IMCS),
Nürnberg, Germany, 2012. doi: 10.5162/IMCS2012/P1.9.5.
P. Jouy, Y. Bonetti, K. Hans, M. Gianella, M. Sigrist, M. Mangold, L. Emmenegger, P. Wägli, A.
Homsy, Y.-C. Chang, J. Di Francesco, L. Hvozdara, H.P. Herzig, H. Looser, D. Hofstetter, J. Faist
and B. Tuzson. Liquid and gas spectroscopy platform with QCLs and QCDs. In International
Quantum Cascade Lasers School & Workshop, Baden near Vienna, Austria, 2012.
P. Wägli, A.Homsy and N.F. de Rooij. Improved method for liquid-liquid extraction on lowcost
polymer chips. In Gordon Research Conference - Physics & Chemistry of Microfluidics, Waterville
Valley, USA, 2011.
P. Wägli, A. Homsy and N.F. de Rooij. UV-curable glue (NOA81) for fabrication of a closed
microfluidic channel with hydrophilic and hydrophobic surfaces. In Conference on Advances
in Microfluidics and Nanofluidics & Asia-Pacific International Symposium on Lab on Chip,
Singapore, 2011.
151

List of Publications
Y.-C. Chang, V. Paeder, P. Wägli, L. Hvozdara and A. Homsy. Mid-infrared waveguide evanescent
field chemical sensor for liquids. In Conference on Lasers and Electro Optics - European
Quantum Electronics Conference (CLEO Europe), Munich, Germany, 2011.
Y.-C. Chang, V. Paeder, J.-M. Hartmann, P. Wägli and A. Homsy. Singlemode mid-infrared
waveguide for evanescent sensor scheme in liquids. In International Conference on Microtech-
nologies in Medicine and Biology (MMB), Lucerne, Switzerland, 2011.
P. Wägli, A. Homsy and N.F. de Rooij. Norland optical adhesive (NOA81) microchannels with
adjustable surface properties and high chemical resistance against IR-transparent organic
solvents. Procedia Engineering,5:460–463, 2010. doi: DOI: 10.1016/j.proeng.2010.09.146.
P. Wägli, B. Guélat, A. Homsy and N.F. de Rooij. Microfluidic devices made of UV-curable
glue (NOA81) for fluorescence detection based applications. In International Conference on
Miniaturized Systems for Chemistry and Life Sciences (MicroTAS), Groningen, Netherlands,
2010.
A. Homsy, L. Ribetto, B. Guélat, P. Wägli and N.F. de Rooij. Microfluidics. In Concertation
and Consultation Workshop on Micro-Nano-Bio Convergence Systems (MNBS), Neuchâtel,
Switzerland, 2010.
Publications not related to this thesis
F. Umbrecht, P. Wägli, S. Dechand, F. Gattiker, J. Neuenschwander, U. Sennhauser and C.
Hierold. Wireless implantable passive strain sensor: design, fabrication and characterization.
Journal of Micromechanics and Microengineering, 20(8):085005, 2010.
S. Schmid, P. Wägli and C. Hierold. Biosensor based on all-polymer resonant microbeams. In
MEMS Conference, Sorrento, Italy, 2009.
S. Schmid, P. Wägli and C.Hierold. All-polymer microstring resonant humidity sensor with
enhanced sensitivity due to change of intrinsic stress. In EUROSENSORS Conference, Dresden,
Germany, 2008.
152