
PLASTIC-BASED STRUCTURALLY PROGRAMMABLE MICROFLUIDIC ... · plastic-based structurally programmable...
102
AFRL-IF-RS-TR-2005-202 Final Technical Report May 2005 PLASTIC-BASED STRUCTURALLY PROGRAMMABLE MICROFLUIDIC BIOCHIPS FOR CLINICAL DIAGNOSTICS University of Cincinnati Sponsored by Defense Advanced Research Projects Agency DARPA Order No. J302 APPROVED FOR PUBLIC RELEASE; DISTRIBUTION UNLIMITED. The views and conclusions contained in this document are those of the authors and should not be interpreted as necessarily representing the official policies, either expressed or implied, of the Defense Advanced Research Projects Agency or the U.S. Government. AIR FORCE RESEARCH LABORATORY INFORMATION DIRECTORATE ROME RESEARCH SITE ROME, NEW YORK
Transcript of PLASTIC-BASED STRUCTURALLY PROGRAMMABLE MICROFLUIDIC ... · plastic-based structurally programmable...

AFRL-IF-RS-TR-2005-202 Final Technical Report May 2005 PLASTIC-BASED STRUCTURALLY PROGRAMMABLE MICROFLUIDIC BIOCHIPS FOR CLINICAL DIAGNOSTICS University of Cincinnati Sponsored by Defense Advanced Research Projects Agency DARPA Order No. J302
APPROVED FOR PUBLIC RELEASE; DISTRIBUTION UNLIMITED. The views and conclusions contained in this document are those of the authors and should not be interpreted as necessarily representing the official policies, either expressed or implied, of the Defense Advanced Research Projects Agency or the U.S. Government.
AIR FORCE RESEARCH LABORATORY INFORMATION DIRECTORATE
ROME RESEARCH SITE ROME, NEW YORK

STINFO FINAL REPORT This report has been reviewed by the Air Force Research Laboratory, Information Directorate, Public Affairs Office (IFOIPA) and is releasable to the National Technical Information Service (NTIS). At NTIS it will be releasable to the general public, including foreign nations. AFRL-IF-RS-TR-2005-202 has been reviewed and is approved for publication APPROVED: /s/ PETER J. ROCCI Project Engineer FOR THE DIRECTOR: /s/ JAMES A. COLLINS, Acting Chief Advanced Computing Division Information Directorate

REPORT DOCUMENTATION PAGE Form Approved
OMB No. 074-0188 Public reporting burden for this collection of information is estimated to average 1 hour per response, including the time for reviewing instructions, searching existing data sources, gathering and maintaining the data needed, and completing and reviewing this collection of information. Send comments regarding this burden estimate or any other aspect of this collection of information, including suggestions for reducing this burden to Washington Headquarters Services, Directorate for Information Operations and Reports, 1215 Jefferson Davis Highway, Suite 1204, Arlington, VA 22202-4302, and to the Office of Management and Budget, Paperwork Reduction Project (0704-0188), Washington, DC 20503 1. AGENCY USE ONLY (Leave blank)
2. REPORT DATEMay 2005
3. REPORT TYPE AND DATES COVERED Final Jun 00 – Jun 04
4. TITLE AND SUBTITLE PLASTIC-BASED STRUCTURALLY PROGRAMMABLE MICROFLUIDIC BIOCHIPS FOR CLINICAL DIAGNOSTICS
6. AUTHOR(S) Chong H. Ahn, Joseph H. Nevin, Gregory Beaucage
5. FUNDING NUMBERS G - F30602-00-1-0569 PE - 63739E PR - E117 TA - 00 WU - 56
7. PERFORMING ORGANIZATION NAME(S) AND ADDRESS(ES) University of Cincinnati P O Box 210030, Dept. ECECS Cincinnati OH 45221-0030
8. PERFORMING ORGANIZATION REPORT NUMBER N/A
9. SPONSORING / MONITORING AGENCY NAME(S) AND ADDRESS(ES) Defense Advanced Research Projects Agency AFRL/IFT 3701 North Fairfax Drive 525 Brooks Road Arlington VA 22203-1714 Rome NY 13441-4505
10. SPONSORING / MONITORING AGENCY REPORT NUMBER AFRL-IF-RS-TR-2005-202
11. SUPPLEMENTARY NOTES AFRL Project Engineer: Peter J. Rocci/IFT/(315) 330-4654 [email protected]
12a. DISTRIBUTION / AVAILABILITY STATEMENT APPROVED FOR PUBLIC RELEASE; DISTRIBUTION UNLIMITED.
12b. DISTRIBUTION CODE
13. ABSTRACT (Maximum 200 Words) The objective of this project is to develop a smart disposable polymer lab-on-a-chip for clinical diagnostics and point-of-care testing, which has the sampling/identifying capability of fast and reliable measurements of metabolic parameters from a human body with minimum invasion. The fully integrated disposable biochip is capable of precise volume control with smart microfluidic manipulation without costly on-chip microfluidic components. The biochip has a unique power source using on-chip pressurized air reservoirs, for microfluidic manipulation, avoiding the need for complex microfluidic pumps. Through the project, an innovative, fully integrated, plastic microfluidic lab-on-a-chip has been successfully developed and characterized for the dual applications of a stand-alone smart disposable polymer lab-on-a-chip as well as a wrist watch-type blood analyzer.
15. NUMBER OF PAGES14. SUBJECT TERMS Biosensor Array, Clinical Diagnostics, Point-of-care Testing (POCT), Lab-on-a-Chip, On-chip Pressure Generator, Smart Passive Microfluidic Systems, Structurally Programmable Microfluidic Systems (sPROMs), Disposable Plastic Biochip
16. PRICE CODE
17. SECURITY CLASSIFICATION OF REPORT
UNCLASSIFIED
18. SECURITY CLASSIFICATION OF THIS PAGE
UNCLASSIFIED
19. SECURITY CLASSIFICATION OF ABSTRACT
UNCLASSIFIED
20. LIMITATION OF ABSTRACT
UL
NSN 7540-01-280-5500 Standard Form 298 (Rev. 2-89) Prescribed by ANSI Std. Z39-18 298-102
102

i
Table of Contents LIST OF FIGURES........................................................................................................................................II LIST OF TABLES ....................................................................................................................................... IV I. EXECUTIVE SUMMARY......................................................................................................................... 1 II. PROBLEM DEFINITION......................................................................................................................... 5 III. APPROACHES ........................................................................................................................................ 7 1. PLASTIC MICROFLUIDIC COMPONENTS ........................................................................................ 7
1.1 Material Properties of COC ........................................................................................................... 7 1.2 Plastic Micromachining Technologies........................................................................................... 8
2. NOVEL STRUCTURALLY PROGRAMMABLE MICROFLUIDIC SYSTEMS (SPROMS).............. 28
2.1 sPROMs (structurally PROgrammable Microfluidic system)....................................................... 28 2.2 Micro Passive Valve for Microfluidic Control.............................................................................. 29 2.3 Microfluidic Multiplexer with Integrated Microdispenser............................................................ 33 2.4 Functional On-chip Pressure Generators for Delivering Fluid on Biochips................................ 38
3. STRUCTURAL AND CFD ANALYSIS................................................................................................ 48
3.1 Enhancement to Computational Speed of Filling/Emptying Simulations...................................... 48 3.2 Incorporation of Dynamic Contact Angles in Filling/Emptying Simulations .............................. 48 3.3 Numerical Design Studies on the Microdispenser ....................................................................... 48
4. NOVEL BIOCHEMICAL SENSORS AND ASSAYS FOR BLOOD ANALYSIS................................ 51
4.1 Principle of Oxygen, Glucose and Lactate Sensors ...................................................................... 51 4.2 Sensor Fabrication........................................................................................................................ 52 4.3 Biosensor Characterization and Design Optimization ................................................................. 54
5. DEVELOPMENT OF IC CIRCUITS AND ANALYZER ..................................................................... 58
5.1 System Components with Surface Mount Technology................................................................... 58 5.2 ASIC Design and Testing .............................................................................................................. 61
6. FULLY INTEGRATED SMART DISPOSABLE LAB-ON-A-CHIP.................................................... 62
IV. PROBLEMS ENCOUNTERED ............................................................................................................ 67 1. PLASTIC MICROFLUIDIC COMPONENTS ........................................................................................ 67
2. BIOSENSOR ARRAY............................................................................................................................. 68
3. DETECTION CIRCUIT........................................................................................................................... 70
V. LESSONS LEARNED ............................................................................................................................ 70 1. PLASTIC MICROFLUIDIC COMPONENTS ........................................................................................ 70
2. BIOSENSOR ARRAY............................................................................................................................. 71
3. ELECTRICAL DETECTION SYSTEM.................................................................................................. 71
VI. RESULTS .............................................................................................................................................. 72 1. SPROMS BASED MICROFLUIDIC SYSTEM...................................................................................... 72
2. BIOSENSOR ARRAY FOR MULTI METABOLIC PARAMETERS MONITORING......................... 74
VII. CONCLUSION..................................................................................................................................... 76 VIII. APPENDICES.................................................................................................................................... 78

ii
APPENDIX A: LIST OF PUBLICATIONS FROM THE PROJECT .....................................................78 APPENDIX B: LIST OF THESES FROM THE PROJECT.................................................................85
List of Figures FIGURE I-1. CONCEPTUAL DRAWING OF A PROPOSED PLASTIC-BASED STRUCTURALLY PROGRAMMABLE
MICROFLUIDIC BIOCHIP FOR CLINICAL DIAGNOSTICS ............................................................................. 1 FIGURE I-2. SCHEMATIC SKETCH SHOWING: (A) DETAILS OF MULTILAYER PLASTIC DISPOSABLE BIOCHIP AND
(B) WRISTWATCH ANALYZER FOR DETECTING POINT-OF-CARE TESTING WITH BIOCHIP. ......................... 2 FIGURE I-3. SCHEMATIC STRUCTURES OF PO2 SENSOR AND GLUCOSE/LACTATE SENSOR. ............................... 3 FIGURE I-4. DEVELOPED PLASTIC-BASED STRUCTURALLY PROGRAMMABLE MICROFLUIDIC SYSTEM: (A)
FULLY INTEGRATED DISPOSABLE BIOCHIP, (B) HAND-HELD ANALYZER FOR POINT-OF-CARE TESTING. .. 4 FIGURE III- 1. MEASURED OPTICAL TRANSPARENCY AND ABSORPTION CHARACTERISTICS FOR DIFFERENT
WAVE LENGTHS. UV RANGE IS TRANSPARENT FOR CYCLIC OLEFIN COPOLYMER (COC). .................... 8 FIGURE III-2. SCHEMATIC REPRESENTATION OF THE PROCESS FLOW FOR BIOCHIP FABRICATION USING PLASTIC MICROMACHINING TECHNIQUES………………………………………………………10 FIGURE III- 3. SEM PHOTOGRAPHS: (A) AND (B) SHOW A PASSIVE VALVE STRUCTURE USING SU 8 WITH AN
ASPECT RATIO OF ~10 (25 µM WIDE AND 250 µM TALL)....................................................................... 10 FIGURE III-4 SEM PHOTOS OF MICROFLUIDIC STRUCTURES: (A) DISPENSER; (B) MULTIPLEXER; AND (C) AND
(D) MICROCHANNELS. .......................................................................................................................... 11 FIGURE III-5. SEM MICROGRAPHS OF THE ELECTROPLATED NICKEL MICROSTRUCTURES: (A) PASSIVE
VALVESTRUCTURE WITH ASPECT RATIO OF 6 AND (B) MICROFLUIDIC RESERVOIR (C) AND (D) MICROCHANNELS. ................................................................................................................................ 12
FIGURE III-6. (A) SEM PHOTOMICROGRAPH OF A GRAPHITE-BASED X-RAY MASK, (B) SEM PHOTOMICROGRAPH OF 400 µM TALL SU-8 STRUCTURES WITH ASPECT RATIOS OF UP TO 20:1, (C) OPTICAL MICROGRAPH OF THE TOOL USED FOR ELECTROFORMING OF MICRO MOLD INSERT ON CYLINDRICAL SHAFT, AND (D) SEM PHOTOMICROGRAPH OF ELECTROFORMED TEST MICRO MOLD INSERT FOR CONTINUOUS HOT EMBOSSING. ......................................................................................... 13
FIGURE III-7. SEM PHOTOMICROGRAPHS OF NI MICRO MOLD INSERT FOR PLASTIC MICRONEEDLE ARRAY. . 13 FIGURE III-8. SCHEMATIC DIAGRAM OF AN INJECTION MOLDING MACHINE WITH MOLDING BLOCK ............. 14 FIGURE III-9. SCHEMATIC ILLUSTRATION OF REPLACEABLE MOLD-DISK TECHNIQUE................................... 15 FIGURE III-10. PHOTOGRAPH OF THE CUSTOM DESIGNED INJECTION MOLDING BLOCK................................. 15 FIGURE III-11. SCHEMATIC DESCRIPTION OF INJECTION MOLDING USING RAPID THERMAL PROCESS (A)
SURFACE HEATING OF THE MOLD DISK USING IR SOURCE; (B) CLOSURE OF MOLDING BLOCK; (C) FILLING PHASE OF THE INJECTED POLYMER; AND (D) COMPLETE FILLING, SOLIDIFICATION AND EJECTION OF THE FINAL POLYMER PART. ......................................................................................................................... 16
FIGURE III-12. COMPARISON OF THE SEM PICTURES OF MICRONEEDLES: (A) WITHOUT RTP PROCESS AND (B) WITH RTP PROCESS ............................................................................................................................. 17
FIGURE III-13. MEASURED INJECTION FILL DEPTH AT VARIOUS IR EXPOSURE TIMES, FLOW RATES AND MOLDING BLOCK TEMPERATURE: (A) CYCLIC OLEFIN COPOLYMER (COC); (B) POLYCARBONATE (PC); AND (C) POLYMETHYL METHACRYLATE (PMMA)............................................................................... 19
FIGURE III-14. CONTACT ANGLE MEASUREMENT RESULTS FOR: (A) CASE 2; (B) CASE 3; (C) NATIVE COC; (D) CASE 6; AND (E) CASE 8 AS LISTED ABOVE IN TABLE III-1.................................................................... 21
FIGURE III-15. EFFECT OF RF POWER ON CHANGE IN CONTACT ANGLE DUE TO CF4 PLASMA. ..................... 21 FIGURE III-16. EFFECT OF RF EXPOSURE DURATION ON CHANGE IN CONTACT ANGLE DUE TO CF4 PLASMA.22 FIGURE III-17. EFFECT OF CF4 FLOW RATE ON CHANGE IN CONTACT ANGLE DUE TO CF4 PLASMA. ............ 22 FIGURE III-18. EFFECT OF OXYGEN FLOW RATE ON CHANGE IN CONTACT ANGLE DUE TO CF4/O2 PLASMA. 23 FIGURE III-19. ATR (ATTENUATED TOTAL REFLECTANCE) SPECTRUM OF (A) COC SUBSTRATE BEFORE AND
AFTER TREATMENT WITH CF4 + O2 PLASMA AND (B) BEFORE AND AFTER TREATMENT WITH O2 PLASMA. .............................................................................................................................................. 24
FIGURE III-20. MICROPHOTOGRAPHS OF MULTI-LAYER MICROFLUIDIC DEVICES ASSEMBLED USING LOW TEMPERATURE THERMOPLASTIC ASSEMBLY TECHNIQUES.................................................................... 25
FIGURE III-21. SEM SHOWING CROSS-SECTIONAL VIEW OF MULTI-LAYER BONDED DEVICE. ....................... 25

iii
FIGURE III-22. DEPENDENCE OF BOND STRENGTH ON: (A) TEMPERATURE; (B) PRESSURE; AND (C) CONTACT ANGLE.................................................................................................................................................. 27
FIGURE III-23. SCHEMATIC SKETCH OF A MICROFLUIDIC MULTIPLEXER DESIGNED USING SPROMS PRINCIPLES. THE FLOW IS DESIGNED TO SEQUENTIALLY FILL ACCORDING TO NUMBERING ON THE CHANNELS 1 THROUGH 7. .................................................................................................................... 28
FIGURE III-24. ABRUPT TRANSITION PASSIVE MICROVALVE (A) 3D VIEW AND (B) 2D VIEW. ....................... 29 FIGURE III-25. FLOW PROFILE AND RESULTANT DEAD VOLUMES AT: (A), (B) ABRUPT GEOMETRY PASSIVE
VALVE AND (C), (D) ROUND GEOMETRY PASSIVE VALVE...................................................................... 31 FIGURE III-26. PSEUDO-HYDROPHILIC EFFECT FOR: (A) TAPER AND (B) ROUND GEOMETRY PASSIVE VALVES.
THE INSERTS SHOW MAGNIFIED VIEWS OF THE LIQUID MENISCUS AS IT IS PASSING THROUGH THE TRANSITION REGION. ........................................................................................................................... 31
FIGURE III-27. PRESSURE RESPONSE OF THE ABRUPT, ROUND AND TAPER GEOMETRIES FOR CONSTANT FLOW RATE CONDITION AT INLET................................................................................................................... 32
FIGURE III-28. SCHEMATIC SKETCH OF THE FIXED-VOLUME METERING MICRODISPENSER. .......................... 33 FIGURE III-29. MICROPHOTOGRAPHS SHOWING ACTUAL OPERATION SEQUENCE OF THE MICRODISPENSER: (A)
RESERVOIR FILLING; (B) RESERVOIR FILLED; (C) START DISPENSING; AND (D) DISPENSING COMPLETE AND LIQUID TRANSFERRED TO MEASUREMENT CHANNEL. ................................................................... 34
FIGURE III-30. PRECISION MEASUREMENT RESULTS OF THE MICRODISPENSER. ............................................ 35 FIGURE III-31. LONG-TERM RELIABILITY ANALYSIS RESULTS OF THE MICRODISPENSER. ............................. 35 FIGURE III-32. MICROFLUIDIC MULTIPLEXER WITH INTEGRATED DISPENSER USED TO DEMONSTRATE THE
SPROMS CONCEPT. ............................................................................................................................. 36 FIGURE III-33. MICROPHOTOGRAPHS SHOWING ACTUAL OPERATION OF A SEQUENTIAL, EQUAL VOLUME
MULTIPLEXER WITH INTEGRATED DISPENSER: (A) FILL DISPENSER; (B) DISPENSER PRECISE LIQUID VOLUME; (C) FIRST LEVEL SEQUENTIAL DIVISION; (D) BEGIN SECOND LEVEL DIVISION; (E) CONTINUED SECOND LEVEL DIVISION; AND (F) COMPLETE SEQUENTIAL MULTIPLEXING SEQUENCE. ....................... 37
FIGURE III-34. SCHEMATIC DRAWING OF THE DISPOSABLE AIR-BURSTING DETONATOR AS AN ALTERNATIVE ON-CHIP POWER SOURCE. ..................................................................................................................... 38
FIGURE III-35. CONSUMED ELECTRICAL POWER IN DRIVING FLUIDS FOR: (A) CONVENTIONAL MICROPUMP AND (B) AIR-BURSTING DETONATOR. ................................................................................................... 39
FIGURE III-36. DYNAMIC THERMO-MECHANICAL SIMULATION USING CFD-ACE+ PACKAGE: (A) TEMPERATURE PROFILE ON THE TOP SURFACE AT 10 MS; (B) TEMPERATURE PROFILE ON THE TOP SURFACE AT 100 MS; AND (C) TEMPERATURE PROFILE ON THE BOTTOM SURFACE AT 100 MS. ............. 39
FIGURE III-37. DYNAMIC THERMO-MECHANICAL SIMULATIONS OF THE HEATER. TRIGGER POINT A IS THE GLASS TRANSITION TEMPERATURE OF THE MEMBRANE........................................................................ 40
FIGURE III-38. FABRICATED DEVICE: (A) AIR-BURSTING DETONATOR INTEGRATED WITH MICROCHANNEL; (B) THE DETONATOR MEMBRANE BEFORE BURSTING; AND (C) THE DETONATOR AFTER BURSTING. ........... 40
FIGURE III-39. DYNAMIC PRESSURE MEASUREMENT OF THE AIR-BURSTING DETONATOR WITH SERPENTINE MICRO- CHANNEL. WITH FLUID IN THE MICROCHANNEL, DYNAMIC PRESSURE DROP MAKES PRESSURE DIFFERENCE (�P) AND TIME DELAY (�T). ........................................................................................... 41
FIGURE III-40. SCHEMATIC ILLUSTRATION OF THE FUNCTIONAL ON-CHIP PRESSURE GENERATOR USING AIBN AS SOLID PROPELLANT. ........................................................................................................................ 42
FIGURE III-41. AIBN DECOMPOSITION MECHANISM..................................................................................... 42 FIGURE III-42. DISSOCIATION CHARACTERISTICS OF AIBN. THE GRAPH SHOWS DECOMPOSITION OF AIBN.43 FIGURE III-43. ELECTROTHERMAL SIMULATION RESULTS: (A) THE HEATER STRUCTURE; (B) THE
TEMPERATURE DISTRIBUTION OF AIBN ON A PLASTIC SUBSTRATE; (C) THE TEMPERATURE DISTRIBUTION ALONG THE LINE A–A’; AND (D) THE TEMPERATURE DISTRIBUTION ON THE CROSS-SECTION OF THE DEVICE....................................................................................................................... 44
FIGURE III-44. INTEGRATION OF THE DEVICE WITH MICROFLUIDIC CHANNEL: (A) MAGNIFIED VIEW OF AIBN ON THE MICROHEATER AND (B) PHOTOGRAPH OF THE PACKAGED DEVICE. .......................................... 45
FIGURE III-45. GENERATED GAS PRESSURE VS. TIME FOR DIFFERENT APPLIED CURRENTS IN THE OPEN MICROFLUIDIC CHANNEL. .................................................................................................................... 46
FIGURE III-46. THE CONTROLLABLE PRESSURE GENERATION OF 150 UM THICK AIBN WITH A 3.2 MM X 3.2 MM MICROHEATER (10.5W AT ROOM TEMPERATURE); (A) FABRICATED ON-CHIP PRESSURE GENERATOR (B) GENERATED GAS PRESSURE IN THE 8 UL CLOSED CHAMBER VS. DIFFERENT APPLIED CURRENTS..... 47
FIGURE III-47. MAXIMUM GAS PRESSURE IN THE 8 UL CLOSED CHAMBER VS. DIFFERENT AMOUNTS AIBN. 47

iv
FIGURE III-48. EFFECT OF DOWNSTREAM CONDITIONS ON AIR SPLITTING PROCESS AT 2 UL/MIN AIR FLOW RATE: (A) SHOWS NO LIQUID IN THE EXIT CHANNEL OF THE RESERVOIR, WHILE (B) SHOWS LIQUID...... 50
FIGURE III-49. ELECTROCHEMICAL AND ANALYTICAL PRINCIPLE OF THE DEVELOPED BIOSENSOR FOR PARTIAL OXYGEN CONCENTRATION SENSING....................................................................................... 51
FIGURE III-50. MICROPHOTOGRAPH OF THE BIOSENSOR ARRAY SHOWING THE DIFFERENT BIOSENSORS. NOTE THAT A BORDER HAS BEEN ADDED AROUND THE PATTERNED AREAS FOR EASY VISUALIZATION.53
FIGURE III-51. LINEARITY CHARACTERIZATION RESULTS OF BIOSENSOR ARRAY. ........................................ 54 FIGURE III-52. CHARACTERIZATION RESULTS OF BIOSENSOR: (A) DYNAMIC RESPONSE AND (B) EFFECT OF
ELECTRODE AREA. ............................................................................................................................... 55 FIGURE III-53. EFFECT OF TEMPERATURE VARIATION ON GLUCOSE SENSOR OUTPUT. .................................. 56 FIGURE III-54. PRINCIPLES OF USING CALIBRATION BUFFER TO ADJUST FOR TEMPERATURE VARIATION: (1)
MEASURE BACKGROUND OFFSET (I0); (2) MEASURE SIGNAL FROM BUFFER SOLUTION (I1), WHICH CONTAINS KNOWN ANALYTE CONCENTRATION; AND (3) MEASURE THE SAMPLE SIGNAL (I2) TO CALCULATE THE CONCENTRATION....................................................................................................... 57
FIGURE III-55. RESULTS FOR THE SENSOR RESPONSE WITH AND WITHOUT CALIBRATION TECHNIQUE.......... 58 FIGURE III-56. BIOCHIP CARTRIDGE INSERTED INTO ANALYZER MODULE FOR MULTI-PARAMETER
DETECTION. ......................................................................................................................................... 59 FIGURE III-57. BLOCK DIAGRAM OF THE DETECTION AND DISPLAY CIRCUIT USED IN THE HANDHELD
ANALYZER. .......................................................................................................................................... 59 FIGURE III-58. HANDHELD ANALYZER: (A) OPEN VIEW AND (B) PACKAGED ANALYZER WITH BIOCHIP.
PACKAGED ANALYZER IS APPROXIMATELY 5.25” X 3.25” X 1.25”...................................................... 61 FIGURE III-59. ASIC DESIGNS : (A) BCD TO SEVEN SEGMENT DISPLAY DRIVER IN ABN AMI 1.5µM
TECHNOLOGY, (B) AIBN PULSE DRIVER IN ABN AMI 1.5 µM TECHNOLOGY. ..................................... 62 FIGURE III-60. BOND STRENGTH OF UV ADHESIVE AFTER SURFACE MODIFICATION OF COC SUBSTRATE.... 63 FIGURE III-61. FABRICATION SEQUENCE OF THE METALLIC POUCH: (A); (B) FORMING OF ALUMINUM FOIL
OVER MOLDING CAVITY; (C) FILLING OF CALIBRATION SOLUTION; (D) SEALING WITH MEDICAL GRADE ADHESIVE LINED METAL TAPE; AND (E) FABRICATED DEVICE. ............................................................. 64
FIGURE III-62. ACTUAL DEMONSTRATION OF ON-CHIP CALIBRATION SOLUTION STORAGE POUCH: (A) MECHANICAL PRESSURE IS APPLIED TO POUCH; (B); (C); AND (D) CALIBRATION SOLUTIONS FLOWS OUT OF THE POUCH AND FILLS THE BIOSENSOR RESERVOIRS. ...................................................................... 64
FIGURE III-63. OPERATION SEQUENCE: (A) SAMPLE BLOOD USING MICRONEEDLE (BIOCHIP IS THEN LOADED INTO ANALYZER); (B) LOAD CALIBRATION IN SENSOR CHAMBER; (C) MEASURE SIGNAL; (D) FIRE AIR-BURSTING DETONATORS; AND (E) LOAD BLOOD TO SENSOR CHAMBERS AND MEASURE ANALYTES...... 65
FIGURE III-64. FULLY INTEGRATED DISPOSABLE BIOCHIP. DIMENSION OF THE BIOCHIP IS 1” X 1” X 0.25”. . 66 FIGURE III-65. MICROPHOTOGRAPHS SHOWING MICROFLUIDIC OPERATION OF DISPOSABLE BIOCHIP: (A)
LOAD SAMPLE SOLUTION; (B) FIRE AIR-BURSTING DETONATORS TO PUSH SAMPLE; (C) START FLUIDIC MULTIPLEXING; AND (D) SAMPLE SOLUTION DELIVERED TO SENSOR RESERVOIR. ................................ 66
FIGURE VI-1. FULLY INTEGRATED DISPOSABLE BIOCHIP. DIMENSION OF THE BIOCHIP IS 1” X 1” X 0.25”. ... 72 FIGURE VI-2. WHOLE BLOOD TEST FOR EVALUATING OPERATION OF THE DISPOSABLE BIOCHIP AND
ANALYZER SYSTEM: (A) SAMPLING WHOLE BLOOD USING A MICRONEEDLE; (B) LOADING CALIBRATION IN THE BIOSENSOR RESERVOIR; (C) DELIVERING BLOOD SAMPLE TO THE BIOSENSOR RESERVOIR USING ON-CHIP PRESSURE GENERATOR; AND (D) MEASURING ANALYTE......................................................... 74
FIGURE VI-3. MEASURED BIOCHIP OUT FOR DIFFERENT HUMAN BLOOD SAMPLES. (A) OXYGEN CONCENTRATIONS, (B) GLUCOSE CONCENTRATIONS AND (C) LACTATE CONCENTRATIONS. ................. 75
List of Tables Table III-1. Plasma Processing Conditions for Surface Modification of COC Substrates ........................... 20 TABLE III-2. ISO-10993 BIOCOMPATIBILITY CRITERIA OF SELECTED UV ADHESIVE LOCTITE 3211™......... 63

1
I. Executive Summary The objective of this project is to develop a smart disposable polymer lab-on-a-chip
for clinical diagnostics and point-of-care testing, which has the sampling/identifying capability of fast and reliable measurements of metabolic parameters from a human body with minimum invasion. To achieve this goal, an innovative, fully integrated, plastic microfluidic lab-on-a-chip has been successfully developed and characterized for the dual applications of a stand-alone smart disposable polymer lab-on-a-chip as well as a wrist watch-type blood analyzer.
Figure I-1 shows a conceptual drawing of the proposed plastic-based structurally programmable microfluidic biochip for clinical diagnostics. The plastic fluidic chip includes a smart passive microfluidic manipulation system based on the structurally programmable microfluidic system (sPROMs) technology, allowing for preprogrammed sets of microfluidic sequencing with only an on-chip pressure source. The integration of an air-bursting detonator or a chemical propellant on the chip allows us to utilize a simple alternative fluid-driving source, thus eliminating costly, nondisposable active microfluidic pumps. The biochip also contains an integrated biosensor array for simultaneous detection of multiple clinically relevant parameters. Thus, the disposable smart plastic biochip is composed of fully integrated modules of plastic fluidic chips for fluid driving, sequencing and biochemical sensors. Figure I-2 shows the schematic sketch of the disposable lab-on-a-chip with a wristwatch-sized analyzer.
Figure I-1. Conceptual drawing of a proposed plastic-based structurally programmable microfluidic biochip for clinical diagnostics
The biochip is inserted into the analyzer unit where the microfluidic sequencing is initiated by a trigger signal from the electronic controller. After the sample solution (blood) is delivered to the biosensor array, the electrochemical detection circuitry on the analyzer is used to determine the concentrations of the various analytes. As a
Air bladder
Air bladder
Calibration buffer Biochemical sensor
Waste out
Dispenser
Blood sample in
Air bladder
Air / buffer reservoir
Mixer

2
demonstration vehicle, the biochip has the specific goal to detect and identify three metabolic parameters: PO2 (partial pressure of oxygen), lactate, and glucose from blood.
Figure I-2. Schematic sketch showing: (a) details of multilayer plastic disposable biochip and (b) wristwatch analyzer for detecting point-of-care testing with biochip.
The microfluidic systems played a key role of the project. The major aspects of the microfluidic systems were to control fluids or samples which will be analyzed and to deliver any biochemical samples into sensing chambers. The reason for using a microfluidic system in biochemical analysis/detection application is that a) it requires small volume of samples and reagents and b) it promises fast analysis/detection.
To realize the microfluidic systems, all microfluidic components such as passive microvalves, microchannels, reservoirs and sPROMs have been realized on polymer substrates and fully characterized. In addition, related microfluidic techniques also have been developed such as wafer-to-wafer or device-to-wafer bonding techniques and microfluidic interconnection techniques. Several prototype microfluidic devices have been
Inlet ports
Pressurized air bladders
Microneedle array
Air-bursting “Detonator”
sPROMs
Biochemical sensors
Watch & Display cap
Wrist watch band
Action buttons

3
designed and developed to verify their capabilities. Consideration of integration issues and biochemical compatibility issues has been extensively explored to achieve the project goal.
Another critical element of the biochip is the on-chip air-bursting or nitrogen propellant detonator. The air-bursting detonator uses pressurized gas, which is compressed and stored in a chamber capped with a thin membrane. The membrane has a heater lithographically defined to serve as the detonator. When a brief pulse of electrical energy is sent to the microheater, the heater temperature rises rapidly and melts the membrane. As soon as the membrane is broken, the pressurized gas rushes out, pushing the fluid samples into the microchannel through the ruptured membrane. As another method, a chemical propellant such as AIBN to generate nitrogen gas has been screen-printed on the microheater, so that the nitrogen propellant produces nitrogen when it was heated up to a certain temperature. Low power consumption is guaranteed, since only pulsed power is used to burst the pressurized gas. This eliminates the use of complex micropumps as well as bulky batteries required to power the pumps. The use of a smart passive microfluidic control system with an on-chip power source allows for the development of fully integrated, yet low-cost disposable biochips.
The basic concept of the biosensor, used in this project, for PO2, glucose, and lactate, which are key metabolic parameters in human blood, was based on an amperometric detection principle, which is currently used for commercially available amperometric-type biosensors, originally proposed by Clark et. al. Figure I-3 illustrates structure of biochemical sensors for PO2, glucose, and lactate. Small volume rapid methods of biochemical detection have been also developed. The sensitivity of the biosensor has been enhanced with specially designed microelectrodes configuration and electronic control.
PO2 sensor structure and materials
Plastic substrate
Reference electrode(Ag/AgCl)
Counter electrode(Pt or Au)
O2 permeable membrane(Silicone, Nafion, Teflon, etc.) Solid electrolyte
(Polyvinylpyrrolidone + KCl)
Glucose permeable membrane
(Polyurethanel)
Immobilized enzyme(Glucose oxidase on
polyacrylamide)
Reference electrode(Ag/AgCl)
Counter electrode(Pt or Au)
Plastic substrate Plastic substrate
Glucose sensor structure and materialsPO2 sensor structure and materials
Plastic substrate
Reference electrode(Ag/AgCl)
Counter electrode(Pt or Au)
O2 permeable membrane(Silicone, Nafion, Teflon, etc.) Solid electrolyte
(Polyvinylpyrrolidone + KCl)
Glucose permeable membrane
(Polyurethanel)
Immobilized enzyme(Glucose oxidase on
polyacrylamide)
Reference electrode(Ag/AgCl)
Counter electrode(Pt or Au)
Plastic substrate Plastic substratePlastic substrate
Reference electrode(Ag/AgCl)
Counter electrode(Pt or Au)
O2 permeable membrane(Silicone, Nafion, Teflon, etc.) Solid electrolyte
(Polyvinylpyrrolidone + KCl)
Glucose permeable membrane
(Polyurethanel)
Immobilized enzyme(Glucose oxidase on
polyacrylamide)
Reference electrode(Ag/AgCl)
Counter electrode(Pt or Au)
Plastic substrate Plastic substrate
Glucose sensor structure and materials Figure I-3. Schematic structures of PO2 sensor and glucose/lactate sensor.
The electronic systems were designed for the control of microfluidic components,
data capture of the sensing signals from biosensors and analysis aspects of the research. The microfluidic system had to be controlled sequentially. In addition, the biochemical detection principle required highly sensitive analyzing circuitry since the signal level from the biochemical sensor is low. To fulfill all these requirements toward a hand-held analyzer system for biochemical detection, a microcontroller board along with analog and digital signal controllers, power drivers for an on-chip pressure generator, an AD/DA converter and a display unit were designed. Most of the system was an analog design and
4
involved some digital design depending on the specifications of the output that had to be generated. All parts of the electronic and control system were built using printed circuit boards (PCB) to minimize the system size and to optimize performance. In order to achieve a hand-held biochip analyzer, it is essential to convert the circuit designed in PCB based system and surface mount technology (SMT) based system into application specific integrated circuit (ASIC) form. To this end, an analog to digital converter, digital to analog converter and a binary to seven segment LCD display driver have been designed, fabricated and successfully tested in ASIC fabricated chip form. All the ASIC designs were completed using ABN AMI 1.5µm technology.
Combining microfluidic systems, electronic/control circuit systems, and biosensors, a hand-held system analyzer for rapid and affordable point-of-care testing has been designed, developed and fully characterized to meet the goal of the project. The whole system is shown in Figure I-4.
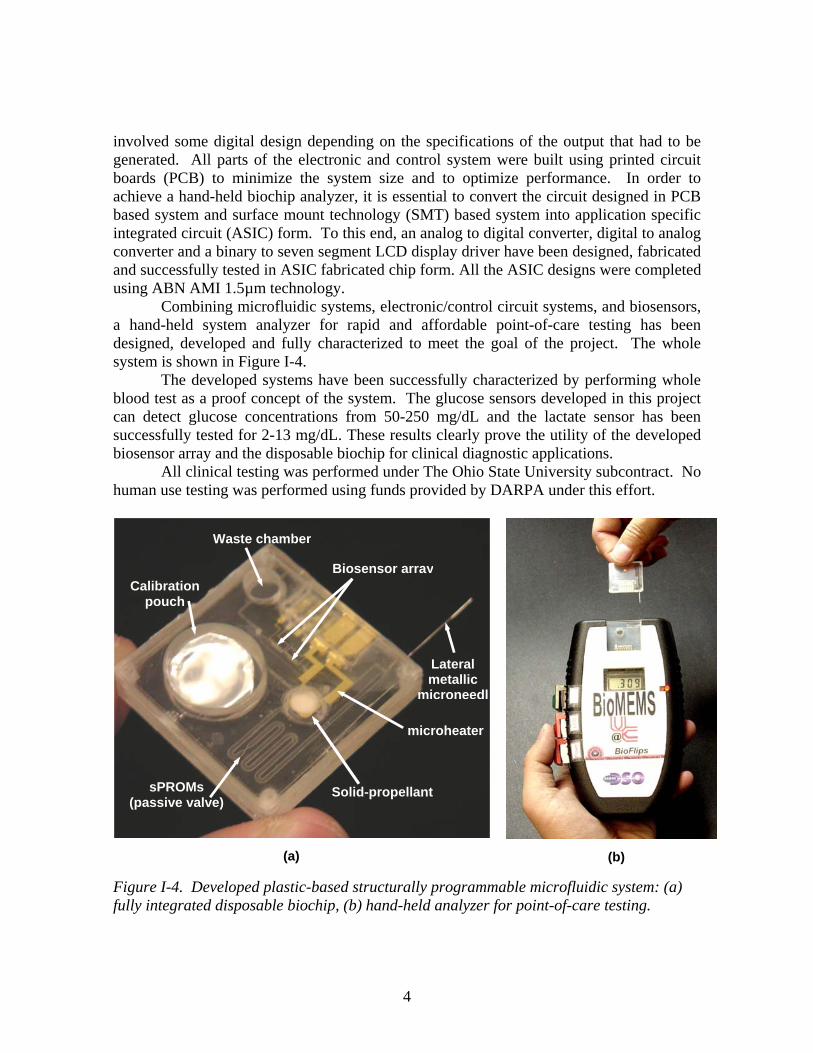
The developed systems have been successfully characterized by performing whole blood test as a proof concept of the system. The glucose sensors developed in this project can detect glucose concentrations from 50-250 mg/dL and the lactate sensor has been successfully tested for 2-13 mg/dL. These results clearly prove the utility of the developed biosensor array and the disposable biochip for clinical diagnostic applications.
All clinical testing was performed under The Ohio State University subcontract. No human use testing was performed using funds provided by DARPA under this effort.
Figure I-4. Developed plastic-based structurally programmable microfluidic system: (a) fully integrated disposable biochip, (b) hand-held analyzer for point-of-care testing.
Solid-propellant
Waste chamber
Lateral metallic
microneedl
Calibration pouch
Biosensor array
sPROMs (passive valve)
microheater
(a) (b)

5
II. Problem Definition As the research problems in this project, we focused our work on the realization of
plastic microfluidic components and systems, development of biosensor arrays and implementation of a compact biochip analyzer. Plastic Microfluidic Components and Systems
In realization of plastic microfluidic components, much effort was spent on development of plastic microfluidic components using BioMEMS technologies. By further understanding the blood behavior in microchannels, specific modifications were added into biochip design for improving the biocompatibility of entire biochip.
Detailed problems include:
• Design and development of structure PROgramable Microfluidic system (sPROMs) for successfully controlling the fluidic behavior in biochip.
• Development of plastic micromachining technologies for constructing the desired microfluidic structures.
• Development of assembly techniques for integration of all constructed microfluidic layers.
• Development of micro-needles for blood sampling. • Development and optimization of an on-chip power source for providing
microfluidic driving force. • Reliable and low temperature device-to-wafer bonding technology. • Biochip interface to electronic circuit analyzer. • Development of methods for storing a calibration solution on-chip. • Microfluidic manipulation sequence. • Development of smart disposable plastic lab-on-a-chip. • Development of a disposable cartridge for point-of-care testing.
Biosensor Array
The developed electrochemical biosensor array is capable of rapid and accurate measuring multiple analyte concentrations in human blood samples. Detailed problem includes:
• Design and development of a disposable biosensor array constructed on a plastic substrate.
• Development of the biosensor array capable of measuring multiple analyte concentrations in human blood samples.
• Development of new fabrication technologies required by the construction of disposable biosensor array.
• Development of a pre-calibration mechanism for eliminating the temperature dependency for biochip field use.
• Investigation and development of a blood biocompatible biosensor array.

6
• Design and development of the sensor-to-circuit interface. Electronic Control System and Analyzer
Design of the biochip analyzer circuit in Application Specific Integrated Circuit (ASIC) form involved the design of analog, digital and mixed signal circuits in single ASIC. This was challenging apart from the constraint on the availability of the number of pins. Design was performed to eliminate noise in the analog circuit due to switching action in the digital part of the circuit, to maintain signal integrity, and to avoid latch up problems. Detailed problems include:
• Entire circuit on Surface Mount Technology (SMT)-based system has to be converted into an ASIC based system using ABN AMI 1.5 µm technology.
• Size of the biochip analyzer circuit board should be reduced from 3.5 inch x 3.5 inch to a wrist watch size (approximately 1.5 inch x 1.5 inch)
• Design a low power circuit of the currently developed prototype in order to avoid using high power batteries and hence reduce the size of the entire biochip analyzer system.
• Make the system more user friendly such that user can modify the test procedure based on the requirements of the analyte which needs to be measured.

7
III. Approaches As stated, the major objective of the project was to develop a plastic-based
structurally programmable microfluidic lab-on-a-chip for clinical diagnostics. Therefore, we divided the project into six research areas: (1) Plastic Microfluidic Component; (2) Novel Structurally Programmable Microfluidic Systems (sPROMs); (3) Structural and CFD Analysis; (4) Biochemical Sensors and Assays for Blood Analysis; (5) Control Topology and IC Circuits; and (6) Fully Integrated Smart Disposable Lab-on-a-Chip and Analysis Systems. Each task is closely related to each other for the final system and extensive collaboration was enforced to overcome any problem encountered while performing the project. Approaches used to research the project goals are described below.
1. Plastic Microfluidic Components
Various plastic micromachining technologies, such as injection molding, embossing, fusion bonding, and ultra-violet adhesive bonding, were developed in this work for constructing the components of the disposable microfluidic biochips. The optimization of these technologies enhanced the fabrication procedure of biochip to make them more compatible towards a mass production process and hence, greatly reduce the manufacture costs. 1.1 Material Properties of COC
Our immediate mission for developing the low-cost biochip was to select a suitable plastic material as the major substrate for each component. Thus, the choice of plastic substrate was, at a basic level, an important factor in this work. According to the properties of molecular structure, plastic materials can be classified into three groups: thermoplastics (e.g. polycarbonate (PC)), elastomers (e.g. poly(dimethylsiloxane) (PDMS)) and thermosets (e.g. Bakelite). A wide range in physical and chemical properties of plastics can be observed from material to material, which indicates that a variety of fabrication methods are needed based on application purposes. Due to the high extension of elastomers and brittle structure of thermosets, thermoplastics are the best option for a plastic disposable biochip. An ideal material candidate should be (but not limited to be): available in a pure form at low cost, compatible with biological samples, insoluble in desired chemical reagents, adjustable surface properties, easily machinable and replicable for mass production, good optical properties, etc. In our investigation, Cyclic Olefin Copolymer (COC) is highly suitable for the biochip application.
Some of the advantages of using COC include the following. • COC can be injection molded at very high flow rates (~ 55 gm per 10 min)
compared to other polymer materials. PC and PMMA can only be injected at 27 gm and 25 gm per 10 min. respectively. The lower viscosity of COC at processing temperatures allows for lower injection pressure and better fills.
• COC exhibits extremely low water absorption, typically an order of magnitude lower than PC or PMMA.
• Most metallic films exhibit excellent adhesion to the COC substrate.

8
• COC is resistant to most polar solvents such as acetone, methanol and isopropyl alcohol. This allows the use of standard photolithography techniques with COC substrates.
• A significant advantage is the wide UV transmittance exhibited by COC. Figure III-1 shows the UV transmittance characteristics of COC compared with PC and PMMA. COC has excellent optical properties, which are also advantageous for fluorescein-based biochemical analyses and bio-optical applications.
Figure III- 1. Measured optical transparency and absorption characteristics for different wave lengths. UV range is transparent for Cyclic Olefin Copolymer (COC).
1.2 Plastic Micromachining Technologies
The plastic micromachining processes are broadly classified into two categories, (i) replication techniques (for mass production / prototyping) and (ii) serial techniques (for prototyping). Of all the above techniques, commercial success of plastic micromachining relies mainly on the replication technologies; the serial techniques are very time consuming and are good only for prototyping, in some cases they also present a great deal of technical and qualitative problems for many applications. Therefore, much interest has been focused in recent years towards the development of the replication technologies. All the replication technologies are well established for macro machining, and are also applied to the micro world with some modifications and improvements. The materials for processing are also borrowed from the macro regime and are so far successfully implemented to micromachining. There has been very little effort to specialize materials for the micro world as only minimal consumption is expected even for a commercial manufacturing plant.
The replication technology involves the fabrication of the master mold, which is fabricated using the micromachining technology and is described in following sections. The use of the microfabrication technology instead of the conventional machining approach gives a lot of advantages e.g. micron and sub micron feature replication, design flexibility,
0
20
40
60
80
100
0 200 400 600 800 1000Wave length [nm]
Inte
nsity
[%] Olefin
copolymers Poly-carbonate
PMMA

9
accurate fabrication, decreased surface nonuniformities and low surface roughness of the master mold. As nondestructive replication from the mold is feasible, the cost of making the mold is diminished by the production capability of the replication technology. The different replication technologies have their own advantages and disadvantages. High Aspect Ratio Ni Mold Fabrication Based on UV-LIGA Process
Our first goal for the project was to develop a generic deep-X-ray lithography (known as “LIGA”) process and SU-8 based UV-LIGA process. First, we focused on the development of the low cost X-ray mask technology for the LIGA process using two different technologies: a graphite substrate-based X-ray mask technology and a polyimide membrane-based X-ray mask technology. Both X-ray mask technologies are inexpensive and suitable for general LIGA processes. Fabrication of the graphite membrane mask was started with fly cutting and polishing a densified 4-inch diameter graphite disk. Then, a Ti/Cu seed layer was sputtered on the graphite. Either SU-8 or thick photoresist (Shipley SJR 5740) was spun, and patterned. Gold electroplating was carried out through a polymer mold to achieve 13 µm or thicker gold absorbers. Fabrication of a polyimide membrane mask was started with mounting of 13 or 25 µm thick polyimide film on aluminum stretcher. The stretched film was annealed in an oven and it was followed by a sputtering of Ti/Cu as a seed layer and SU-8 or SJR 5740 patterning. Finally, gold with a thickness of 13 µm or thicker was electroplated.
As a low cost alternative to the LIGA technology, UV-LIGA technology using SU-8 for the fabrication of a high precision metallic micro mold insert was developed. A variety of test microstructures were fabricated using SU-8 with aspect ratios of up to 20:1 and thicknesses of 200 µm and 400 µm (Figure 4-b). The UV LIGA-based plastic micromachining process consists of four main steps: photolithography, electroplating for mold master fabrication, plastic chip fabrication and final assembly/packaging, as shown in Figure III-2.

10
Figure III- 2. Schematic representation of the process flow for biochip fabrication using plastic micromachining techniques
SU 8 photolithography was optimized for the fabrication of microchannel structures.
Figure III-3 and III-4 shows SEM micrographs of some of the fabricated SU 8 structures using the developed process. From the SEM micrographs it can be observed that the sidewalls are very vertical and the surface is smooth and aspect ratios of up to 10 were successfully realized. The conditions for SU 8 photolithography was optimized for microfabrication of structures of up to 250 µm in height with aspect ratios of up to 10. Critical problems were addressed during the optimization of the process.
Figure III- 3. SEM photographs: (a) and (b) show a passive valve structure using SU 8 with an aspect ratio of ~10 (25 µm wide and 250 µm tall)
Mask design and fabrication
Ni substate preparation by lapping and polishing
UV exposure of SU-8 photoresist through
Develop SU-8
Electroplate Ni
Remove SU-8
Molding & bonding

11
Figure III-4 SEM photos of microfluidic structures: (a) dispenser; (b) multiplexer; and (c) and (d) microchannels.
Some of the results of the electroplating for the mold fabrication are shown in Figure III-5. From the SEM micrographs, it can be observed that the non uniformities of electroplating have been minimized to a large extent using the established electroplating scheme. The mold also showed good adhesion to the substrate because of the 3 µm surface finish of the substrate. It withstood injection molding and hot embossing cycles without any damage to the electroplated microstructures.

12
Figure III-5. SEM micrographs of the electroplated nickel microstructures: (a) passive valvestructure with aspect ratio of 6 and (b) microfluidic reservoir (c) and (d) microchannels.
Based on the development of base technologies, we focused on the development of a unique micro mold insert that enables continuous hot embossing of micro plastic components. In order to realize such micro mold inserts, we developed a generic technology that can electroform high precision metallic parts on metallic cylindrical shafts. In this project, a 3/4 inch diameter AISI 316 stainless steel cylinder was used as a substrate. It was cleaned by Wood’s strike etching process and a thin Ni layer was plated on the sample to get better adhesion and uniform deposits on non-planar substrates. An exposed blank polymethyl methacrylate (PMMA) sheet was developed and rinsed and the PMMA sheet was wrapped around the stainless steel cylinder and clamped using the wrapping tool (Figure III-6 (c)). Electroplating was carried out for the wrapped-around PMMA mold and the PMMA mold was removed. Figure III-6 (d) shows an SEM photomicrograph of the realized mold insert on a stainless steel cylinder.

13
(a) (b) (c) (d)
Figure III-6. (a) SEM photomicrograph of a graphite-based X-ray mask, (b) SEM photomicrograph of 400 µm tall SU-8 structures with aspect ratios of up to 20:1, (c) optical micrograph of the tool used for electroforming of micro mold insert on cylindrical shaft, and (d) SEM photomicrograph of electroformed test micro mold insert for continuous hot embossing.
A substantial amount of work has been done to realize a LIGA-based metallic micro mold insert for plastic microneedle array replication. Based on experimental results, we chose nickel as a substrate material for mold insert for microneedle arrays. Ground and polished 3-inch diameter Ni plate was activated in C-12 activator for 1 minute at –2 volts to clean the surface and promote the adhesion. Commercially available PMMA sheet (with a thickness of 1 mm or 2 mm) was bonded using methyl methacrylate (MMA) bonding solutions and fly cut down to 200 µm. The PMMA sheet was exposed to X-ray and it was developed by four cycles of 20 minute developing and 40 minute rinsing. Ni electroplating was carried out to create Ni metallic micro mold inserts on Ni substrate. Due to the requirement of injection molding, the surfaces of the micro mold insert must be very smooth. Therefore, the surface of electroplated Ni was polished gently using SiC or alumina powder. Figure III-7 shows SEM photomicrographs of nickel mold insert for a microneedle array.
Figure III-7. SEM photomicrographs of Ni micro mold insert for plastic microneedle array.
14
Micro Injection Molding Technique for Fast Duplication of Mold Patterns
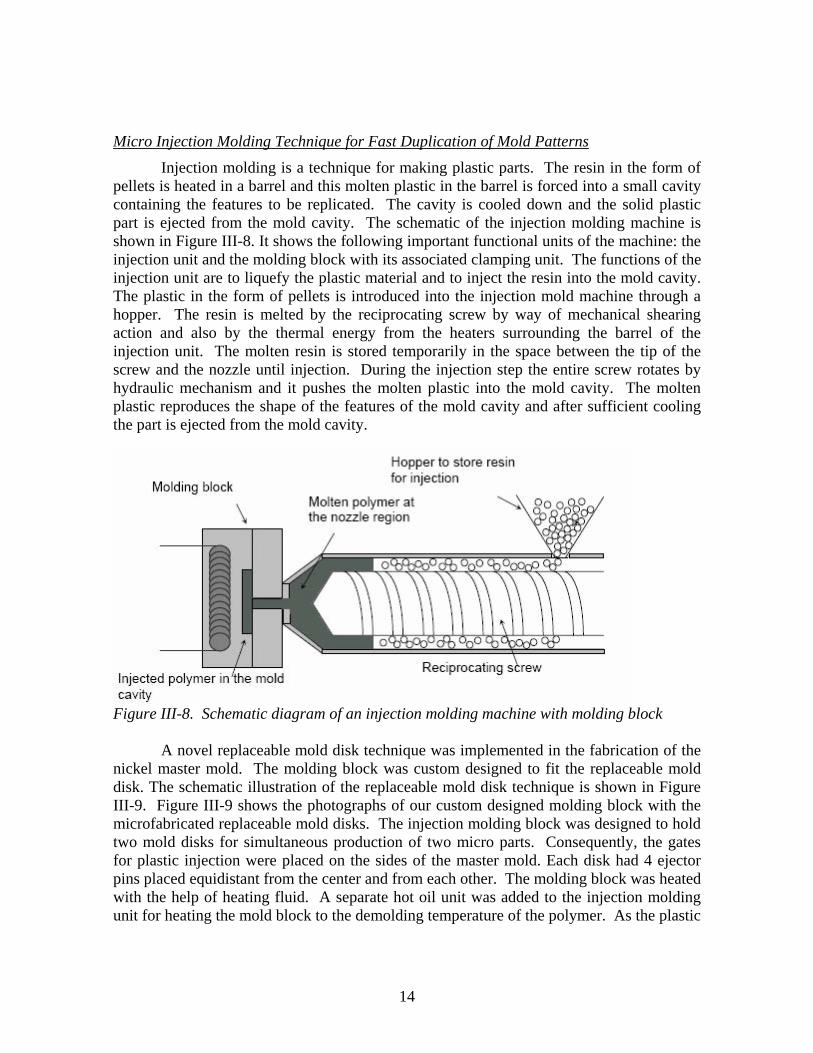
Injection molding is a technique for making plastic parts. The resin in the form of pellets is heated in a barrel and this molten plastic in the barrel is forced into a small cavity containing the features to be replicated. The cavity is cooled down and the solid plastic part is ejected from the mold cavity. The schematic of the injection molding machine is shown in Figure III-8. It shows the following important functional units of the machine: the injection unit and the molding block with its associated clamping unit. The functions of the injection unit are to liquefy the plastic material and to inject the resin into the mold cavity. The plastic in the form of pellets is introduced into the injection mold machine through a hopper. The resin is melted by the reciprocating screw by way of mechanical shearing action and also by the thermal energy from the heaters surrounding the barrel of the injection unit. The molten resin is stored temporarily in the space between the tip of the screw and the nozzle until injection. During the injection step the entire screw rotates by hydraulic mechanism and it pushes the molten plastic into the mold cavity. The molten plastic reproduces the shape of the features of the mold cavity and after sufficient cooling the part is ejected from the mold cavity.
Figure III-8. Schematic diagram of an injection molding machine with molding block
A novel replaceable mold disk technique was implemented in the fabrication of the nickel master mold. The molding block was custom designed to fit the replaceable mold disk. The schematic illustration of the replaceable mold disk technique is shown in Figure III-9. Figure III-9 shows the photographs of our custom designed molding block with the microfabricated replaceable mold disks. The injection molding block was designed to hold two mold disks for simultaneous production of two micro parts. Consequently, the gates for plastic injection were placed on the sides of the master mold. Each disk had 4 ejector pins placed equidistant from the center and from each other. The molding block was heated with the help of heating fluid. A separate hot oil unit was added to the injection molding unit for heating the mold block to the demolding temperature of the polymer. As the plastic

15
enters the mold cavity at melting temperature, rapid cooling to room temperature will result in micro cracks on the surface of the plastic. Hot oil circulation through the molding block is very critical to avoid microcracks on the surface. The temperature is maintained at the demolding temperature recommended by the manufacturer for each polymer.
Figure III-9. Schematic illustration of replaceable mold-disk technique
Figure III-10. Photograph of the custom designed injection molding block

16
Rapid Thermal Process (RTP) for Micro Injection Molding In a typical injection molding process, the plastic is melted and then injected into
the cavity of a closed mold, whose shape is transferred to plastic microstructures on cooling down. Inside the mold cavity, the resin continues to flow and fill the mold cavity till the polymer cools down to a highly viscous melt, where the flow stops, and the part can be ejected. In order to ensure good flow properties during injection, thermoplastics with low or medium viscosity are preferred. So the filling of the mold cavity and subsequently the micro patterns depends on the viscosity of the polymer melt, injection speed, molding block temperature, and the nozzle temperature of the injection unit.
The molding block is normally heated to an elevated temperature (below the glass transition temperature of the injected polymer) to help uniform flow of polymer throughout the mold cavity. A higher mold temperature could improve the fill characteristics but would also significantly increase the process time. In the rapid thermal process, the “surface” of a Ni mold disk is heated with IR radiation using a high power halogen lamp. The radiation from the IR source is focused on the surface of the Ni disk and the surface temperature of the replaceable Ni micromold disk reaches a temperature higher than the nozzle temperature in a few seconds. Then, the molding block is closed and the molten plastic is injected from the nozzle at high injection speeds. When the molten plastic enters the mold cavity, it experiences an isothermal environment. The melt temperature and the Ni mold disk surface temperature will be the same at the instant when the plastic is injected. So there will be no heat transfer taking place inside the cavity for a very small period of time and the surface heat of the Ni mold disk will help the plastic to be in a state of low viscosity. As a result of this, complete filling of the mold disk cavity can be achieved without any considerable increase in the cycle time of operation of the injection mold machine. An illustration of the complete cycle of the rapid thermal process is summarized in Figure III-11. The cycle time is almost identical to the conventional molding process. Since only the surface of the micromold is heated, it reduces any need to heat and cool the whole molding block every time when a plastic part is made. Thus, the process using RTP with infrared radiation provides a more economical and feasible source for large-scale production.
Figure III-11. Schematic description of injection molding using rapid thermal process (a) surface heating of the mold disk using IR source; (b) closure of molding block; (c) filling phase of the injected polymer; and (d) complete filling, solidification and ejection of the final polymer part.
17
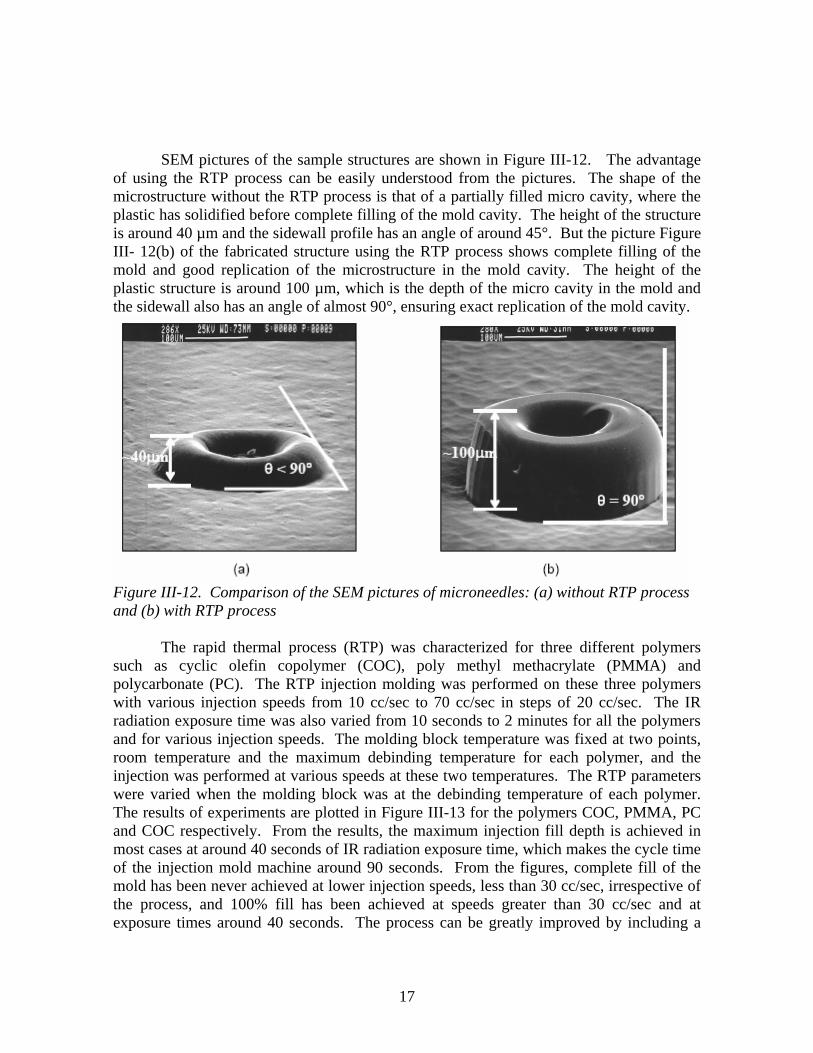
SEM pictures of the sample structures are shown in Figure III-12. The advantage
of using the RTP process can be easily understood from the pictures. The shape of the microstructure without the RTP process is that of a partially filled micro cavity, where the plastic has solidified before complete filling of the mold cavity. The height of the structure is around 40 µm and the sidewall profile has an angle of around 45°. But the picture Figure III- 12(b) of the fabricated structure using the RTP process shows complete filling of the mold and good replication of the microstructure in the mold cavity. The height of the plastic structure is around 100 µm, which is the depth of the micro cavity in the mold and the sidewall also has an angle of almost 90°, ensuring exact replication of the mold cavity.
Figure III-12. Comparison of the SEM pictures of microneedles: (a) without RTP process and (b) with RTP process
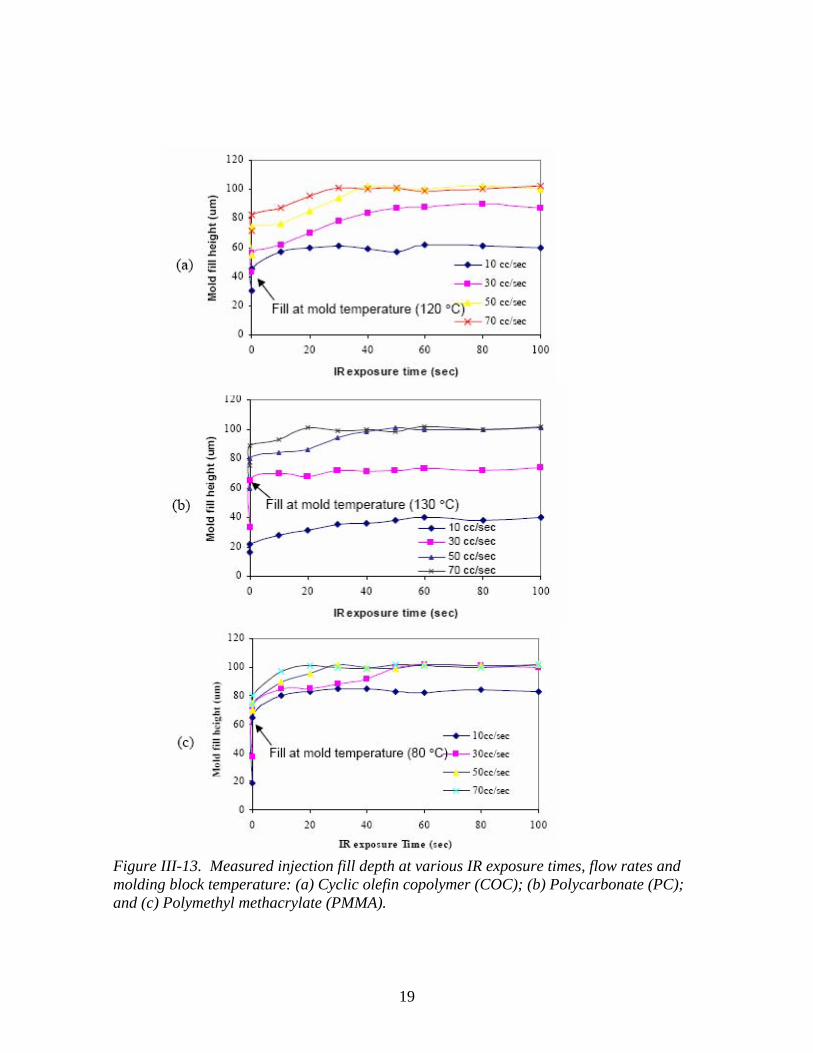
The rapid thermal process (RTP) was characterized for three different polymers
such as cyclic olefin copolymer (COC), poly methyl methacrylate (PMMA) and polycarbonate (PC). The RTP injection molding was performed on these three polymers with various injection speeds from 10 cc/sec to 70 cc/sec in steps of 20 cc/sec. The IR radiation exposure time was also varied from 10 seconds to 2 minutes for all the polymers and for various injection speeds. The molding block temperature was fixed at two points, room temperature and the maximum debinding temperature for each polymer, and the injection was performed at various speeds at these two temperatures. The RTP parameters were varied when the molding block was at the debinding temperature of each polymer. The results of experiments are plotted in Figure III-13 for the polymers COC, PMMA, PC and COC respectively. From the results, the maximum injection fill depth is achieved in most cases at around 40 seconds of IR radiation exposure time, which makes the cycle time of the injection mold machine around 90 seconds. From the figures, complete fill of the mold has been never achieved at lower injection speeds, less than 30 cc/sec, irrespective of the process, and 100% fill has been achieved at speeds greater than 30 cc/sec and at exposure times around 40 seconds. The process can be greatly improved by including a

18
thermal shield between the replaceable Ni mold disk and the molding block, since there is a huge temperature gradient between the disk surface and the molding block surface. Use of higher-powered IR source can greatly help to reduce the cycle time. The obtained results clearly revealed the advantages of the rapid thermal process. The cycle time for the full process was reduced to 90 seconds.
This process time clearly shows the advantage of the rapid thermal process over the conventional high aspect ratio injection molding, where the cycle time required was several minutes. Thus the injection molding technique using the rapid thermal process is a favorable alternative to the conventional high aspect ratio injection molding and the cycle time can be greatly reduced, thereby reducing the injection molding costs and increasing the throughput of the process.
19
Figure III-13. Measured injection fill depth at various IR exposure times, flow rates and molding block temperature: (a) Cyclic olefin copolymer (COC); (b) Polycarbonate (PC); and (c) Polymethyl methacrylate (PMMA).

20
With the introduction of the RTP injection process, we have achieved highly reproducible microstructures (micro channel, passive valve, etc) on a COC wafer. We have successfully characterized the various material properties of COC that are relevant to biochip fabrication including optimizing the injection molding process and a thorough analysis of the surface properties of the COC substrate. These results are of great relevance to the actual biochip fabrication as explained in subsequent sections.
Surface Modification of COC Substrates
For most biochip applications, the surface characteristics (contact angle, non specific adsorption, free surface energy, etc.) of a plastic substrate are of greater interest to us than the bulk properties of the plastic material. From a fabrication perspective, the bulk properties of the plastic (rigidity, mechanical strength etc.) are also important.
The native surface of an injection-molded COC wafer exhibits a contact angle of ~ 920 with water. Passive microfluidic controlling generally requires a strongly hydrophobic surface. In this work, we utilized plasma treatment to increase the contact angle of native COC surface. The surface modification should affect the surface free energy (and in turn the contact angle) as well as the biocompatibility characteristics of the COC substrates.
As a well-established technique for surface modification, plasma processing is widely used for multiple MEMS applications. In addition, we prefer this technique due to its capacity for batch fabrication therefore satisfying the low cost requirement for disposable biochips. Table III-1 shows the plasma processing conditions used to modify the surface characteristics of the COC substrate. The contact angles were measured after the thermal bonding process, in which the plasma treated COC samples were heated to 120 0C and cooled down under pressure to insure good bonding and sealing.
Flow Rate (sccm) Power Duration Contact angle
Case # Ar O2 CF4 (Watts) (seconds) (degree)
1 20 0 0 200 120 ~5o 2 10 0 0 150 120 21o 3 10 0 0 100 120 48o 4 10 0 0 25 120 78o 5 0 0 10 100 120 100o 6 0 2 10 150 120 109o 7 0 3 10 150 120 122o 8 0 4 10 200 120 136o
Table III-1. Plasma Processing Conditions for Surface Modification of COC Substrates

21
Figure III-14. Contact angle measurement results for: (a) case 2; (b) case 3; (c) native COC; (d) case 6; and (e) case 8 as listed above in Table III-1.
Figure III-15. Effect of RF power on change in contact angle due to CF4 plasma.
(a)
(d)
θ = 48o θ = 92o
θ = 109o θ = 136o
θ = 21o
(b) (c)
(e)

22
Figure III-16. Effect of RF exposure duration on change in contact angle due to CF4 plasma.
Figure III-17. Effect of CF4 flow rate on change in contact angle due to CF4 plasma.

23
Figure III-18. Effect of oxygen flow rate on change in contact angle due to CF4/O2 plasma.
The effect of RF power is shown in Figure III-15. The contact angle increases with more RF power as more activated fluorine species can react with the surface at higher powers. However, it is also possible that at very high powers the implantation reaction is overshadowed by the physical etching process and the surface may be damaged. Increasing power beyond 200 W leads to substantial surface damage (visually evident as slight haze on the surface).
For a constant RF power, increasing the duration of exposure to plasma allows more time for the surface modification reaction and the contact angle increases with more plasma time. However, beyond ~ 240 seconds, the contact angle value levels off indicating that for the given power setting and gas composition the surface reaction has saturated (Figure III-16). This curve is not very dependent on the RF power setting and saturation is observed at slightly different times for higher RF powers but with increased saturation contact angles.
For hydrophobic surface treatment, the CF4 gas flow rate has very little effect on the contact angle as shown n Figure III-17. It is observed that the contact angle varies from 104° - 110° which is within the deviation range for multiple samples, hence it is reasonable to assume that CF4 gas flow rate has little to no effect on the surface modification process. Surprisingly, a mixture of O2 and CF4 plasma can produce more hydrophobic surfaces. As shown in Figure III-18, increasing the oxygen flow rate from 0 – 5 sccm (for a fixed CF4
flow rate of 10 sccm), increases the contact angle from 104° - 136°. In fact, the highest possible contact angles are achieved when using a mixed of O2/CF4 (O2 (4 sccm) + CF4 (10 sccm)) rather than CF4 alone.
The surfaces of the plasma-modified surfaces were examined with attenuated total reflectance (ATR) technique. Figure III-19 shows the ATR spectrum of an oxygen plasma treated COC sample and a (O2 + CF4) plasma treated sample, compared with native COC spectrum. Figure III- 19(a) shows the effect of combined (CF4 + O2) plasma on the COC

24
surface. The native COC surface has a strong CH2 peak and a smaller C-H peak. After plasma treatment, both the peaks are almost completely wiped out and replaced by C-F peak and a C=O (ketone) peak. The C-F peak is significantly more dominant and can explain the higher hydrophobicity of the substrate.
Figure III-19. ATR (attenuated total reflectance) spectrum of (a) COC substrate before and after treatment with CF4 + O2 plasma and (b) before and after treatment with O2 plasma.
Figure III- 19(b) shows the effects of oxygen plasma. As shown in Figure III-
19(b), the CH2 peak and C-H peak are both reduced in magnitude and a new CH-O peak is seen. The polar nature of the (CH-O) can explain the increase in hydrophilic behavior of the substrate. Thus, by choosing the appropriate gases for plasma, power and duration, we can predictably modify the surface of the plastic substrate such as COC across a wide spectrum of contact angles ranging from very hydrophilic (~ 50) to very hydrophobic (1360).
Thermoplastic Fusion Bonding of COC The most common technology for plastic bonding is to glue a cover to the channel.
However, this approach has a high risk of channel blockage. Also, the addition of a glue layer introduces non-uniform channel surface properties; therefore the glue biocompatibility, the bubble generation, and the water absorption of the glue layer become important concerns. We extensively investigated thermoplastic fusion bonding for assembling microfluidic layers. Well-controlled thermoplastic fusion bonding offers certain favorable advantages for biochip assembly: high bonding strength, minimal channel deformation and uniform channel surface properties.
The novel low-temperature bonding process involved heating the samples to ~ 15 °C lower than the Tg and applying a high bonding force. This method was successfully applied to achieve multi-layer bonding for COC substrates that had the microchannel pattern on their surface. Figure III-20 shows a microphotograph of the multi-level bonded microfluidic device. Notice that the color of the dye remains the same after the channels crossover, clearly proving that microfluidic channels are on distinct layers. Up to 5 layers have been bonded simultaneously using this method.
(b) (a)
0
0.1
0.2
0.3
0.4
4.00
Abs
orba
nce
Wavenumber (cm-1 X 10³) 1.002.003.00
CH
2
C=O
C –
H
C –
F
0
0.1
0.2
0.3
0.4
1.002.003.004.00
Abs
orba
nce
Wavenumber (cm-1 X 10³)
CH
– O
CH
2
C –
H

25
Figure III-20. Microphotographs of multi-layer microfluidic devices assembled using low temperature thermoplastic assembly techniques.
In this project, we developed a novel low temperature bonding process where by the
temperature of the COC substrate is maintained ~ 20 – 40 0C below its Tg (glass transition temperature). Two microfluidic layers are well bonded under applied high pressure (tens of MPa). The bond strength is enough to ensure the formation of a leakage free microchannel, and more importantly, the low temperature bonding minimizes the deformation of the microchannels substantially. A cross-section SEM image of the bonded device (shown in Figure III-21), clearly shows that the channels have been bonded with minimal deformation. Another factor that could potentially affect the bond strength of the fusion-bonded substrate is the surface condition of the plastic, i.e. whether it is hydrophilic or hydrophobic. Following the plasma modification, as described in the previous section, the substrates were bonded at a temperature of 120 0C and pressure of 10 MPa, to evaluate the effect of the surface modification.
Figure III-21. SEM showing cross-sectional view of multi-layer bonded device.
Microfluidic channels Layer 2
Layer 1
Layer 3

26
The various parameters that affect the bond strength during thermoplastic fusion bonding were investigated to determine their significance in the bonding process. The effects of temperature, pressure and plasma modification on the surface have been experimentally characterized. Figure III-22(a) shows the effect of varying temperature on the bond strength. As expected, increasing the temperature leads to higher bond strength as the higher temperature allows for greater interdiffusion across the bond interface. Figure III-22(b) shows the effect of increasing pressure on the bond strength. As the pressure is increased from a low value, the bond strength increases and then peaks at a pressure of ~5 MPa. The applied pressure forces intimate contact of the two substrates being bonded. Applying more pressure than required to obtain good contact does not achieve any further increase in bond strength. Figure III- 22(c) shows the effect of plasma treatment on the bond strength. This graph leads to a couple of interesting observations. First, one would expect that as the surface is treated to be more hydrophilic, the bond strength would be higher. However, we see that the bond strength peaks at ~ 45 – 500 contact angle and then decreases as the surface is treated more hydrophilic. Lower contact angles are generated by using high power RF plasma as explained earlier.

27
Figure III-22. Dependence of bond strength on: (a) temperature; (b) pressure; and (c) contact angle.

28
2. Novel structurally Programmable Microfluidic Systems (sPROMs) Compared with its macro-scale compartment, a microfluidic device can not be
treaded as a miniaturized version. While the physical scale is going down, the microfluidic behavior exhibits many unique phenomena due to the increased channel surface area and the effect of laminar flow. To date, the research in microfluidics has presented great advantages for micro analytical devices. The microfluidic technology is an ideal solution for precise control of µL - nL volumes of samples and reagents. Active components such as microvalves or micropumps have limited application for disposable biochips because such devices are expensive in cost, complex in structure, and difficult to control. As a consequence, the development of a passive microfluidic system becomes a fast-growing area for production of small, fast and easy-to-operate disposable biochips. This section discusses the details in theory of passive microvalves, the principle of structure programmable microfluidic systems (sPROMs) and the application of a multiplexer.
The concept of sPROMs was described previously as follows: “sPROMs is a passive microfluidic control technique where a set of microfluidic manipulations are carried out in a pre-programmed sequence. The microfluidic operations and their sequence are determined primarily by the structural arrangement of the system without the need for an external control signal”. sPROMs is analogous to the programmable read-only memory (PROM) of a computer where a specified set of instructions is hard-wired into the PROM chip.
2.1 sPROMs (structurally PROgrammable Microfluidic system)
The basic concept of sPROMs is to control fluidic sequence by usage of a series of passive valves at pre-programmed locations. Each passive valve holds a specific flow resistance in order to manipulate the fluidic network. A multiplexer is shown in Figure III-23 to demonstrate the sPROMs conception.
Figure III-23. Schematic sketch of a microfluidic multiplexer designed using sPROMs principles. The flow is designed to sequentially fill according to numbering on the channels 1 through 7.
For point-of-care diagnostic analysis, it is preferable to operate multiple tests
simultaneously with one sample. Generally the sample is difficult to obtain and the amount

29
is limited for supplying several biochips. A general method is to flow the sample over a biosensor array, which consists of several sensors to detect different chemicals. The immediate concern with this method is the cross-talk among various biochemical reactions over each sensor area. The ideal solution is to locate each biosensor in its own single channel and successfully split-and-guide the sample solution into each channel. The sPROM digitally controls the flow direction and ensures successful separation of the fluid with a definite flow sequence. At the split-off point, a passive microvalve is placed in one of the channels to ensure that the fluid will first fill up the other channel. As shown in Figure III-23, fluid will first flow into channel 2 then in channel 3 because of restriction (or passive valve) R1. The passive microvalve is designed so that after fluid fills up channel 2, the laminar flow pressure drop in that channel exceeds the pressure drop across R1 and the fluid rushes into channel 3. Each of these pressures can be calculated theoretically as described in the following section. At the end of each channel pair, there are passive valves (R2 and R3) of unequal dimensions, with required flow pressure drops ∆PR2 and ∆PR3 respectively, which further regulate flow. In this case ∆PR2 < ∆PR3, so that fluid first moves past R2 and fills up channel 4. Now the pressure drops exceed ∆PR3 and fluid rushes into channel 5. By extending this arrangement, fluid can be manipulated to an exact location as desired. In this case, the delivery sequence is 1,2,3,4 etc. as shown clearly in Figure 8. By changing the locations of the passive valves and/or their relative values with respect to channel size, we can program the fluid delivery sequence of the system.
This system works on the principle that the pressure drop across the channels is small compared to the pressure drop across the passive microvalves. This allows the microvalves to serve as primary regulators of the flow sequence.
2.2 Micro Passive Valve for Microfluidic Control
The structure passive microfluidic control system is based on the investigation and development of micro passive valve theory, which describes a method of regulating fluid flow by introducing an abrupt dimension change in a microchannel. Figure III-24 shows the most basic configuration of a micro passive valve.
Figure III-24. Abrupt transition passive microvalve (a) 3D view and (b) 2D view.
As shown in Figure III- 24(b), the liquid travels from the left wide channel (w1)
into the right narrow channel (w2). The liquid experiences a dimension change at the interface of the two channels (point A). The pressure gradients required to push the fluid

30
traveling in the left side channel (preceding the passive valve) can be calculated from equation (III-1) (Hagen-Poiseuille expression for a rectangular channel):
3.12
1 wh
QLP
µ=∆ (III-1)
where L is the length of the microchannel, µ is the viscosity of the fluid, Q is the
flow rate, w is the width and h is the height of the microchannel. Once the liquid reaches point A, it suddenly encounters an abrupt change in the width of the microchannel (height remains same). The abrupt decrease in width results in a pressure gradient increase in order to move the liquid farther. The required pressure to push the liquid into the narrow channel can be derived from the principle of virtual work.
In case of very low flow rates, the surface tension effects are dominant in controlling the flow characteristics. Since the fluid entering the narrow channel would experience a higher surface-area to volume ratio, the surface energy of the system would increase accordingly. This can be used to derive the expression for pressure needed to overcome the passive valve as:
⎥⎥⎦
⎤
⎢⎢⎣
⎡⎟⎟⎠
⎞⎜⎜⎝
⎛+−⎟⎟
⎠
⎞⎜⎜⎝
⎛+=∆
22112
1111)cos(2hwhw
P cl θσ (III-2)
where w1, h1, w2, and h2 are width and height of the left and right channels
respectively, σl is the surface tension, and θc is the contact angle of water with the hydrophobic substrate.
For most surface micromachining processes, a transition in width is easily achievable whereas variable depth is more difficult to implement. Hence, setting h1 = h2, equation (III-2) is simplified to
⎥⎦
⎤⎢⎣
⎡−=∆
212
11)cos(2ww
P cl θσ (III-3)
The passive valve shown in Figure III-23 is not an optimum geometry for the
biochip application. When the advancing front reaches the passive valve, it is held there until a high pressure, enough to overcome the passive valve, is applied. The fluid then shoots out of the passive valve at a fairly high velocity. This is expected because once the passive valve is “broken,” very little pressure is required to maintain flow through the narrow channel. However, Figure III-25(a) and (b) illustrates the problem with this design. This geometry leads to flow separation at the 90˚ corners and as a result, a significant amount of fluid is trapped in these corners when the receding front passes through the valve. On the other hand, when a plug of fluid is passed through the geometry shown in Figure III-25(c) and (d), the receding front exits cleanly without leaving behind any evident residue. Thus it would seem that the abrupt geometry is not very well suited for our

31
applications. As a result we have investigated other geometries that can act as effective passive valves without generating any dead volume.
Figure III-25. Flow profile and resultant dead volumes at: (a), (b) abrupt geometry passive valve and (c), (d) round geometry passive valve.
Based on Equation (III-3) it may seem that the taper and round geometries would
not act as effective passive valves since in the width-transition zone the relative difference between W1 and W2 is very small. However, both these geometries can act as effective passive valves because of the so-called “pseudo-hydrophilic” effect. Figure III-26 shows the flow profile through a taper geometry and round geometry respectively. As shown in Figure III-26, the shape of the meniscus initially resembles the hydrophobic meniscus as expected. However, when the liquid passes through the tapered region (or curved region), the meniscus is forced to assume a hydrophilic shape in order to maintain the contact angle with the channel wall. Hence, the liquid is sucked in via capillary forces through the transition region. Since the inlet pressure at this stage is just enough to overcome the surface tension drop (of the entrance channel) and the laminar flow drop, the liquid stops once it reaches the passive valve. At this point to cause further displacement, the meniscus would have to be forced back it hydrophobic shape and then overcome the surface tension drop of the narrow channel. Thus these geometries can also act as effective passive valves.
Figure III-26. Pseudo-hydrophilic effect for: (a) taper and (b) round geometry passive valves. The inserts show magnified views of the liquid meniscus as it is passing through the transition region.
The pseudo-hydrophilic effect is also seen to a smaller extent in the abrupt geometry passive valve. In this case, the meniscus does not attain a fully-concave shape but it straightens out to a flat shape as it approaches the passive valve. The taper and round

32
geometry passive valves were simulated using the same inlet conditions as the abrupt geometry and the performance of the three is compared in Figure III-27. Note that the pressure traces have been offset on the time scale to permit easy comparison of the three curves. Figure III-27 shows that the taper and round geometries can also act as effective passive valves. In fact, the threshold pressure required to push the liquid beyond the taper and round geometries of the passive valves is actually higher than the pressure for the abrupt geometry valve, indicating these geometries are more effective passive valves.
Figure III-27. Pressure response of the abrupt, round and taper geometries for constant flow rate condition at inlet.
In this section extensive design and simulation information is provided for the passive microvalves. Initially, an approximate analytical expression is presented. Since the analytical expression fails to capture all the performance details of the passive valve, extensive simulations were conducted to analyze the effect of various parameters on passive microvalve performance. Since the abrupt geometry passive valve exhibits significant dead volumes, alternate valve geometries are also studied. Exhaustive experimental data was gathered for the passive valves to verify the simulation and analytical results. Finally as a proof-of-concept for sPROMs, a microfluidic multiplexer was designed and successfully tested for sequential liquid delivery.

33
2.3 Microfluidic Multiplexer with Integrated Microdispenser The microdispenser module forms a key microfluidic component of the disposable
biochip. The sampled fluid volume is loaded into the fixed-volume metering microdispenser, which in turn dispenses an exact volume of liquid for further biochemical analysis.
Figure III-28 shows a schematic sketch of the microdispenser module. The microdispenser operates on the principle of graduated volume measurement where the geometry of the reservoir determines the volume of the microdispenser. The sampled fluid is introduced through the fluid inlet at a low flow rate. The fluid passes through passive valve 1 and the following narrow channel to enter the reservoir. The air inlet is designed to be much smaller than the fluid path between passive valve 1 and the reservoir. This ensures that the fluid does not enter the air inlet. Passive valve 2 at the end of the reservoir prevents the fluid from leaving the reservoir. As long as the applied fluid driving pressure is less than the pressure required to overcome passive valve 2, the fluid will be contained completely within the reservoir.
Figure III-28. Schematic sketch of the fixed-volume metering microdispenser.
Then air pressure, higher than the resistance of passive valve 2, is applied via the air
inlet line. This causes a split in the liquid column in the narrow section following passive valve 1. At this stage the volume of the fluid contained within the reservoir is isolated within the dispenser. At higher air pressures, the fluid within the reservoir is pushed out toward the right. The fluid is ejected from the reservoir and enters the measurement channel. The measurement channel is designed to accommodate a slightly larger volume than dispensed from the reservoir. Passive valve 3 at the end of the measurement channel stops the ejected fluid from flowing past it unless a higher pressure is applied. An on-chip scale is fabricated in close proximity of the measuring channel to record the position of the rear end of the fluid column. Using the on-chip scale, we can measure the exact length of the fluid column and use that to calculate the dispensed volume.

34
Figure III-29. Microphotographs showing actual operation sequence of the microdispenser: (a) reservoir filling; (b) reservoir filled; (c) start dispensing; and (d) dispensing complete and liquid transferred to measurement channel.
Figure III-29 shows an actual operation sequence of the microdispenser. Figure III-29 (b) shows that the liquid injected is held by passive valve 2 and Figure III-29 (c) shows that once air-pressure is applied via the air inlet, a split is caused in the liquid column and the fluid is ejected towards the right. Figure III-29 (d) shows the dispensed volume is held by passive valve 3 and at this stage the length (and hence volume) can be calculated using the on-chip scale. In experiments, only the region in the immediate vicinity of the scale was viewed using a stereomicroscope for measuring the length of the fluid column.
The on-chip scale has 25 µm wide scale bars separated by a distance of 25 µm. The measurement channel for all the fabricated devices is 100 µm wide. Thus, we can measure fluid volumes with resolution of 50 pL (assuming a height of 100 µm). This corresponds to a measurement uncertainty of 0.05% for a measured volume of 100 nL, which is well within the acceptable measurement error range.
Figure III-30 shows the precision measurement results obtained using the on-chip scale. These results are measured for 15 consecutive dispensing cycles for each of the designed dispensers. As Figure III-30 clearly shows all three devices have excellent repeatability characteristics. The variation (standard deviation) was 0.3% for the 50 nL dispenser, 0.45% for the 100 nL dispenser and 0.3% for the 150 nL dispenser.

35
Figure III-31 shows the long-term performance characteristics of the microdispenser. A set of 25 readings was recorded once every week over a period of six weeks. As shown in Figure III-31, the dispensed volume is very stable over a period of many weeks.
Figure III-30. Precision measurement results of the microdispenser.
Figure III-31. Long-term reliability analysis results of the microdispenser.

36
The basic principle of operation of the fluidic multiplexer is the same as micro passive valves. Figure III-32 shows a schematic sketch of the microfluidic multiplexer with integrated microdispenser. Figure III-32 highlights one of the advantages of the sPROMs approach. The microdispenser and the multiplexer can be designed and optimized as separate devices and then simply combined through an appropriately designed connecting channel to develop a more functional microfluidic device.
Figure III-32. Microfluidic multiplexer with integrated dispenser used to demonstrate the sPROMs concept.
This highlights an advantage of the sPROMs technique where individual
microfluidic devices can be designed and characterized and can also be easily integrated with one another. The addition of the microfluidic multiplexer allows for complex fluid handling where the dispensed volume is divided into four equal volumes and delivered sequentially to each outlet. If the only requirement from the multiplexer is exact fluid division (not necessarily in a sequential fashion) then a much simpler non-sequential multiplexer can also be used. This is accomplished by removing the passive valves in Figure III-32.

37
Figure III-33. Microphotographs showing actual operation of a sequential, equal volume multiplexer with integrated dispenser: (a) fill dispenser; (b) dispenser precise liquid volume; (c) first level sequential division; (d) begin second level division; (e) continued second level division; and (f) complete sequential multiplexing sequence.
Figure III-33 shows the actual operation of the non-sequential multiplexer with
integrated dispenser. As Figure III-33 clearly shows, the designed dispense volume is successfully ejected without leaving any residues in the dispenser. Furthermore, as the liquid travels down the multiplexer, it is divided equally without any loss in volume. The multiplexer with integrated dispenser was characterized using the same techniques described in the microdispenser section. The accuracy of the integrated device was characterized at 99.2 % and the variation between 25 dispensing cycles was less than 0.5 % at each outlet.
Integration of the microfluidic multiplexer with the microdispenser allows for controlled division of the dispensed volume that can be either sequentially or simultaneously delivered. The multiplexer design was optimized based on the guidelines explained in previous chapters and successful multiplexing action was achieved for equal and non-equal volume division. The fabricated devices have been characterized to verify that the multiplexers are capable of high accuracy sample division using simple pressure control at the air inlet. In use the microfluidic multiplexer expands the potential applications for the microdispenser; for example, in the unequal volume multiplexer, a dispensed volume of 250 nL was divided into four volume of 100, 75, 50 and 25 nL respectively with an accuracy of ~ 99 %. This method of fluid division is particularly appealing for combinatorial chemistry applications where multiple concentration (obtained by mixing the unequally divided sample volumes with equally divided buffer volumes) analysis can be performed using very simple control techniques. Other designs of the multiplexers can be applied for a variety of µTAS applications such as clinical chemistry analysis, DNA analysis, and protein chips.
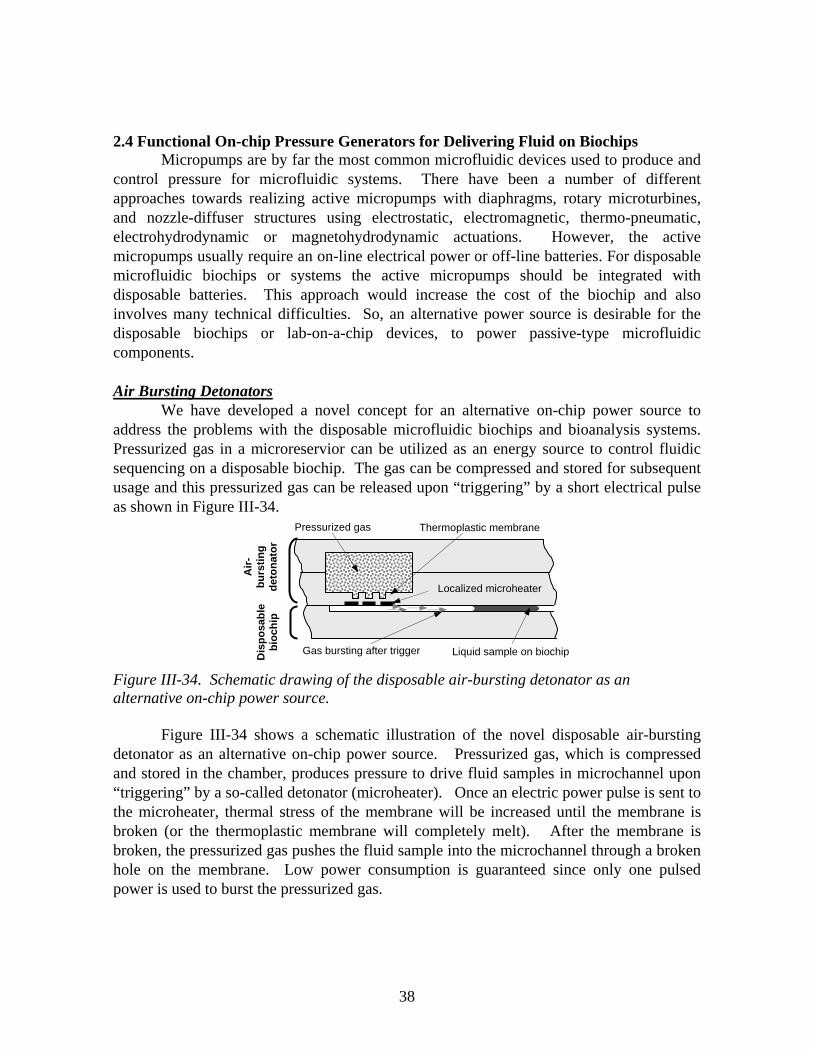
38
2.4 Functional On-chip Pressure Generators for Delivering Fluid on Biochips Micropumps are by far the most common microfluidic devices used to produce and
control pressure for microfluidic systems. There have been a number of different approaches towards realizing active micropumps with diaphragms, rotary microturbines, and nozzle-diffuser structures using electrostatic, electromagnetic, thermo-pneumatic, electrohydrodynamic or magnetohydrodynamic actuations. However, the active micropumps usually require an on-line electrical power or off-line batteries. For disposable microfluidic biochips or systems the active micropumps should be integrated with disposable batteries. This approach would increase the cost of the biochip and also involves many technical difficulties. So, an alternative power source is desirable for the disposable biochips or lab-on-a-chip devices, to power passive-type microfluidic components.
Air Bursting Detonators
We have developed a novel concept for an alternative on-chip power source to address the problems with the disposable microfluidic biochips and bioanalysis systems. Pressurized gas in a microreservior can be utilized as an energy source to control fluidic sequencing on a disposable biochip. The gas can be compressed and stored for subsequent usage and this pressurized gas can be released upon “triggering” by a short electrical pulse as shown in Figure III-34.
Figure III-34. Schematic drawing of the disposable air-bursting detonator as an alternative on-chip power source.
Figure III-34 shows a schematic illustration of the novel disposable air-bursting detonator as an alternative on-chip power source. Pressurized gas, which is compressed and stored in the chamber, produces pressure to drive fluid samples in microchannel upon “triggering” by a so-called detonator (microheater). Once an electric power pulse is sent to the microheater, thermal stress of the membrane will be increased until the membrane is broken (or the thermoplastic membrane will completely melt). After the membrane is broken, the pressurized gas pushes the fluid sample into the microchannel through a broken hole on the membrane. Low power consumption is guaranteed since only one pulsed power is used to burst the pressurized gas.
Pressurized gas
Gas bursting after trigger Liquid sample on biochip
Thermoplastic membrane
Localized microheater
Air-
burs
ting
deto
nato
r D
ispo
sabl
e bi
ochi
p

39
Figure III-35. Consumed electrical power in driving fluids for: (a) conventional micropump and (b) air-bursting detonator.
In the device shown in Figure III-35, the detonator will have its own “pressure
discharge” characteristics due to the gas flow resistance of the hole and the microfluidic channel. The characteristics of this microfluidic “battery” can be easily adjusted by changing the conditions of the microheater having different sizes of the hole, which produces different gas flow resistances and pressure drops.
Figure III-36. Dynamic thermo-mechanical simulation using CFD-ACE+ package: (a) temperature profile on the top surface at 10 ms; (b) temperature profile on the top surface at 100 ms; and (c) temperature profile on the bottom surface at 100 ms.
Dynamic thermo-mechanical simulation was first conducted by CFD-ACE+ to investigate the temperature profile and thermal stress on the microheater and membrane. Constant material properties (conductivity, resistivity, and specific heat) were reasonably assumed for simulation and the external convection boundary conditions were applied to all boundary surfaces considering heat dissipation by air convection. Figure III-36 shows the thermal profile on the membrane as a function of time.
(b)
Time Ele
ctric
al
pow
er
Consumed energy
Time
Flui
d m
otio
n
Mechanical work
(a)
Time Ele
ctric
al
pow
er Consumed energy
Time
Flui
d m
otio
n Mechanical work
(a) (b) (c)
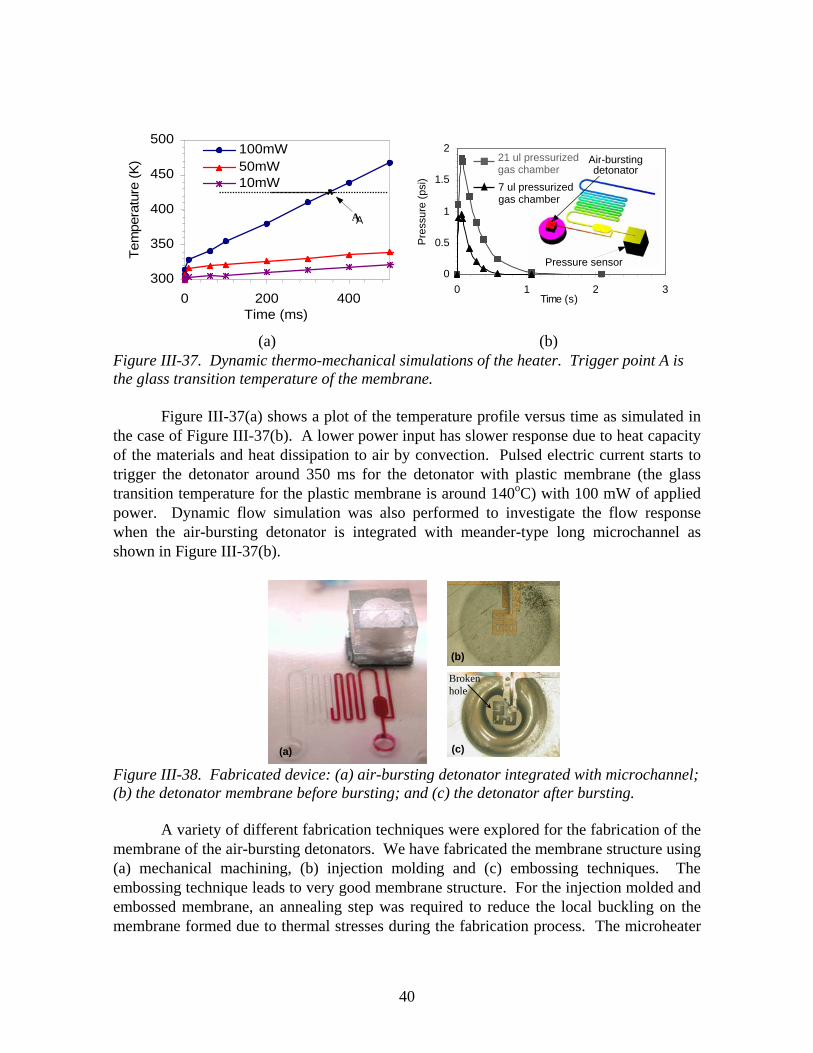
40
(a) (b)
Figure III-37. Dynamic thermo-mechanical simulations of the heater. Trigger point A is the glass transition temperature of the membrane.
Figure III-37(a) shows a plot of the temperature profile versus time as simulated in
the case of Figure III-37(b). A lower power input has slower response due to heat capacity of the materials and heat dissipation to air by convection. Pulsed electric current starts to trigger the detonator around 350 ms for the detonator with plastic membrane (the glass transition temperature for the plastic membrane is around 140oC) with 100 mW of applied power. Dynamic flow simulation was also performed to investigate the flow response when the air-bursting detonator is integrated with meander-type long microchannel as shown in Figure III-37(b).
Figure III-38. Fabricated device: (a) air-bursting detonator integrated with microchannel; (b) the detonator membrane before bursting; and (c) the detonator after bursting.
A variety of different fabrication techniques were explored for the fabrication of the membrane of the air-bursting detonators. We have fabricated the membrane structure using (a) mechanical machining, (b) injection molding and (c) embossing techniques. The embossing technique leads to very good membrane structure. For the injection molded and embossed membrane, an annealing step was required to reduce the local buckling on the membrane formed due to thermal stresses during the fabrication process. The microheater
(a) (c)
(b)
Broken hole
0
0.5
1
1.5
2
0 1 2 3Time (s)
Pre
ssur
e (p
si)
Air-bursting detonator
Pressure sensor
21 ul pressurized gas chamber 7 ul pressurized gas chamber
300
350
400
450
500
0 200 400Time (ms)
Tem
pera
ture
(K)
100mW 50mW 10mW
A A

41
pattern was formed by electroplating a nickel pattern onto the membrane structure. Figure III-38(a) shows a fabricated device. Figure III-38(b) and (c) show the
membrane with the heater pattern before and after thermal actuation.
Figure III-39. Dynamic pressure measurement of the air-bursting detonator with serpentine micro- channel. With fluid in the microchannel, dynamic pressure drop makes pressure difference (�P) and time delay (�t).
The device shown in Figure III-38(a) was coupled to a microfluidic channel to
monitor the dynamic pressure response of the air-bursting detonators. Figure III-39 shows the dynamic pressure response of the air-bursting detonators. Comparison with Figure 28 shows that the response of the air-bursting detonators matches the simulation results closely. As shown in Figure III-39, the addition of a liquid in the microchannel causes an increase in the time as well as magnitude of the peak pressure. The additional time difference can be easily attributed to the delay caused by the liquid motion. The increase in pressure may seem counter-intuitive. When one considers a liquid plug within a microchannel, there exists a finite pressure drop across the advancing and the receding meniscus of the liquid front. The additional pressure drop seen in Figure III-39 can be attributed to this pressure differential across the liquid meniscus that is superimposed on the pressure delivered by the air-bursting detonator.
AIBN Based Solid Chemical Propellant
Figure III-40 shows a schematic drawing of the novel functional on-chip pressure
generator using AIBN (azobis-isobutyronitrile) as solid propellant. The new device does not require either bursting membranes or pre-stored pressurized air, so the device guarantees a simpler structure with easier fabrication steps. Compared with a conventional pumping system, it will not have a valve leakage problem, complex micropump structures, or complex control circuits. In addition, solid chemical propellants such as AIBN generate nitrogen gas with a low ignition temperature, which is extremely suitable for biochip or lab-
00.20.40.60.8
11.21.41.61.8
0 1 2 3 4Time (s)
Pre
ssur
e (p
si)
21ul chamber (without fluid in the microchannel)
21ul chamber (with fluid in the microchannel)
∆P
∆t

42
on-a-chip applications as a power source for driving fluid. The pressure for driving liquid samples in a microfluidic system can be functionally generated on demand by applying thermal energy, which is controlled by electrical power, to a solid propellant. It results in converting chemical energy to mechanical work. Among several solid propellants, AIBN has been adopted in this work due to its low operating temperature and nitrogen gas generation with nontoxic by-products such as free-radicals.
Figure III-40. Schematic illustration of the functional on-chip pressure generator using AIBN as solid propellant.
Figure III-41. AIBN decomposition mechanism.
As described in Figure III-41, upon application of a specific temperature, AIBN
decomposes and produces nitrogen gas and free-radicals. The thermal dissociation of AIBN at various temperatures has been investigated using a TGA (thermogravimetric analyzer). The TGA works under the principle of the heat response of the materials under investigation. The AIBN was heated under an inert atmosphere (N2) at a controlled heating rate of 20 °C/min. Upon heating AIBN, two stages of decomposition were observed. The preliminary dissociation, which occurred at around 65–67 °C, led to the controlled release of only nitrogen gas and the second dissociation temperature was around the melting point of AIBN (105 °C), shown in Figure III-42. According to the chemical equation, the remaining weight of AIBN was reduced to 87% of its original weight after all the nitrogen
CN
C CH3CH3
N Heating up to 70 oC
N2 + 2 C
CH3
CH3
CN
CN
C CH3CH3
N
Fluid sample
MicroheaterLow ignition temperature solid propellant (AIBN) Teflon matrix
Nitrogen gas is released during the heating

43
gas was released. In Figure III-42, it is shown that the temperature is around 100 °C when the remaining weight of AIBN becomes 87%. It provides an optimized design of microheater whose working temperature on the AIBN to release nitrogen gas should be between 70 °C and 100 °C.
Figure III-42. Dissociation characteristics of AIBN. The graph shows decomposition of AIBN.
AIBN takes the form of a fine white powder, so a matrix is required to keep the
powder on the microheater under a shock or vibration environment. The matrix for immobilizing AIBN powder should have a good adhesion with both metal and AIBN. The matrix must cure rapidly at a low temperature, and low mechanical strength, so that the generated nitrogen gas can easily break and pass through the matrix during bursting. Teflon was chosen as the matrix material. When 9% Teflon is mixed with solvent, after spin-coating, the solvent evaporates at room temperature under the fume hood.
An electrothermal simulation package (from Coventor) was used to investigate the temperature profile of the microheater on different substrates and with different power inputs. The thermal conductivity of the COC (Cyclic Olefin Copolymer) plastic substrate is 0.13 W/mK. According to the thermal measurement, the thermal conductivity of AIBN in the Teflon matrix in the ratio of 1:3 is 0.12 W/mK. These material properties were applied to the simulation model. The natural convection was applied to the top and bottom surfaces as boundary conditions. The simulation results as in Figure III-43 showed that the temperature difference between the top and bottom layers of AIBN shows less than approximately 0.8 °C. The temperature difference over the whole area of the heater is less than 10 °C. In the heater design, the center of the heater will reach the highest temperature, whereas the lowest temperature will be at the edge of the heater. According to the material

44
characterization of AIBN, the working temperature should be controlled between 70°C and 100°C. From the simulation, the heater can meet the desired operation condition for AIBN, since the center of the heater is still lower than 100°C, while the edge of the heater reaches 70°C.
Figure III-43. Electrothermal simulation results: (a) the heater structure; (b) the temperature distribution of AIBN on a plastic substrate; (c) the temperature distribution along the line A–A’; and (d) the temperature distribution on the cross-section of the device.
A plastic material such as cyclic olefin copolymer (COC) was chosen as the
substrate to reduce the power consumption of the whole device due to its low thermal conductivity. Since Au shows good adhesion with this plastic substrate, a 5000 Å of Au as

45
the material of the igniter was deposited directly on the plastic substrate using an electron beam evaporator. Then a negative photoresist (e.g. SU-8/2005) was spun on the substrate wafer and patterned to make the microheater structure. Finally, the remaining photoresist was removed with SU-8 removal after etching Au. To realize a new functional on-chip pressure generator at a low-cost, screen-printing techniques have been adopted to deposit AIBN over the igniter. So, AIBN with a matrix needs a proper viscosity to attain good control of the shape of printed patterns. After several printing tests, AIBN was mixed with spin-on Teflon in a ratio of 1:3 to form an AIBN matrix. An 8 inch x 10 inch steel stencil frame with designed patterns was used as the mask for screen-printing. This matrix was deposited at a thickness of 75 um over the Au microheater structure on a plastic substrate using a screen-printer. The matrix was cured at room temperature in the fume hood of a clean room for 16 hr after the screen-printing. Then, the device was integrated with a plastic microfluidic system using UV curable epoxy bonding as shown in Figure III-44. The microfluidic system, which was made by plastic injection molding techniques, has the long meander-type channel of 70 mm. The cross section of the microfluidic channel is 50 um x 100 um.
(a) (b) Figure III-44. Integration of the device with microfluidic channel: (a) magnified view of AIBN on the microheater and (b) photograph of the packaged device.
In the experiments, a pressure sensor was attached directly to the liquid inlet of the
microfluidic channel to minimize the measurement error after injecting dyed D.I. water in the microreservoir. Then a programmable DC power supply and digital multimeter were controlled by PC-based interface software to apply constant current to the microheater while the voltage signals from the pressure sensor were recorded. The power supply was turned off once the fluid samples flowed out of the outlet of the microchannel. The dynamic flow response of the fluid sample driven by this functional on-chip pressure generator depends on the geometry of the microfluidic channel and the surface conditions between the liquid and the channel. The experiment shows that the output pressure from the AIBN can be functionally produced by controlling applied power as shown in Figure
AIBN
Microheater
500 um

46
III-45. The total energy consumption of this novel functional on-chip pressure generator was around 189 mJ at a current of 145 mA.
In addition, the controllable pressure generation was characterized with 150 um thick AIBN over a 3.2 mm x 3.2 mm microheater. The on-chip pressure generator was glued with a pressure sensor, which has an 8 ul cavity inside. After applying the specified current for 5 s, the on-chip pressure room temperature. The generated pressure after cooling for different applied currents is shown in Figure III-46. The generated pressure can be controlled by applying different values of current. Also different amounts of AIBN with constant 150 um thickness and different surface areas were characterized. The on-chip pressure generator with the pressure sensor was placed inside an oven at 100 °C until the maximum pressure was reached. After cooling the on-chip pressure generator with the pressure sensor in D.I. water at room temperature, the relationship between maximum pressure generation and different amounts of AIBN was obtained and the plot is shown in Figure III-47. Based on the flow resistance of a microfluidic-based varying the amount of AIBN.
Figure III-45. Generated gas pressure vs. time for different applied currents in the open microfluidic channel.
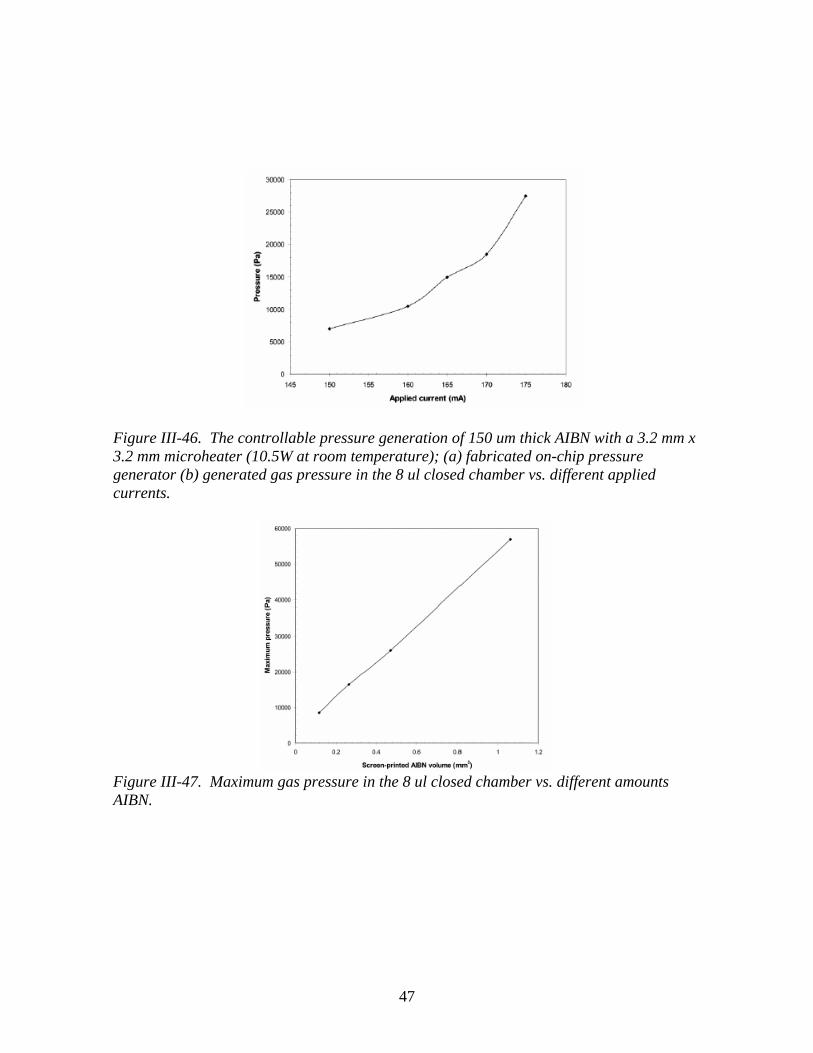
47
Figure III-46. The controllable pressure generation of 150 um thick AIBN with a 3.2 mm x 3.2 mm microheater (10.5W at room temperature); (a) fabricated on-chip pressure generator (b) generated gas pressure in the 8 ul closed chamber vs. different applied currents.
Figure III-47. Maximum gas pressure in the 8 ul closed chamber vs. different amounts AIBN.

48
3. Structural and CFD Analysis
The computational fluid dynamics (CFD) analysis was focused on speeding up the liquid filling and emptying simulations by making the underlying algorithm that computes the motion of the liquid-air interface more efficient, and then applying the enhanced code for further studying the flow characteristics & performance of the metering and liquid dispensing chamber. We also made significant progress on the numerical design analysis and optimization of the biosensor. 3.1 Enhancement to Computational Speed of Filling/Emptying Simulations
The computational speed of the liquid filling and emptying simulations had earlier been very slow due to the generation of artificially high air flow velocities near the liquid-air interface, which forced the computational algorithm to set the time steps used in the transient simulations to an extremely small value (microseconds range). This would necessitate the use of almost 1 million time steps to compute filling processes over a 1 second time period, which would slow down the entire simulation significantly (1.5-2.5 weeks for each filling simulation). Please note that these numerical artifacts did not have any appreciable affect on the accuracy of the solutions (due to the large difference in the densities of the air and liquid phases). However, computing speed was a serious technical challenge, which we needed to overcome.
We overcame this challenge by using some novel numerical techniques to damp out the large air velocities near the interface. This procedure resulted in a significant speed-up in the simulation time from weeks to a few hours (or at most a few days when the simulation domain was quite large). The results described in this report are based on the enhanced software code. 3.2 Incorporation of Dynamic Contact Angles in Filling/Emptying Simulations
In all of the previous simulations reported in the last report, we used a 120 degrees contact angle based on the input data provided by U.C. However, upon review of experimental video images of the liquid dispensing process, it became quite clear that although the advancing front had a contact angle close to 120 o, the receding interface had a much smaller contact angle.
Based on an extensive literature search, we were able to find experimental data that listed the receding contact angles for water in different PDMS polymer grafts (DeSimone et al., Macromolecules, 24:5330, 1991). Based on this information, we redid all of the simulations involving the receding front by choosing a 40 o contact angle. To assess the sensitivity of the results to this input data, we repeated some simulations with a 60 o contact angle. 3.3 Numerical Design Studies on the Microdispenser Model Parameters

49
The volume-of-fluid (VOF) methodology in CFD-ACE+ was used in the design simulations. The material properties and boundary conditions used in the simulations were as follows: Liquid parameters Viscosity 1.78e-3 kg/m.s Density 1000 kg/m3 Liquid Surface tension 0.073 N/m Boundary conditions Either fixed inlet velocity or fixed inlet pressure Exit boundary fixed pressure
The reason we used fixed inlet pressures and inlet velocities in some of the simulations was for the following reason. Experimental data clearly indicated that although a precision syringe pump capable of pumping low volumetric flow rates is used in the studies, there is a build-up of back-pressure in the pump at times when a burst pressure has to be overcome in the microfluidic system. This back-pressure results in a flow rate that is initially much higher than that of the prescribed flow rate (e.g. the 50 nanoliter reservoir unloads in less than 1 sec with an initial delay of a few seconds when the syringe pump is turned on with a prescribed air flow rate of 2 ul/min. Theoretically speaking, it should start to empty out as soon as the pump is turned on and should take approximately 1.5 seconds to do so.) Upon dissipation of this back-pressure, the flow rate tends to stabilize at the lower “dialed-in” flow rate.
Figure III-48 shows an asymmetric filling process in the reservoir for the 3kPa inlet pressure case. The 4 kPa filling case exhibits symmetry. This seems to indicate that surface tension effects may be more important when the filling pressure is lower, which tends to pull the liquid interface in a certain direction. The slight asymmetry imparted to the liquid front while it moves through the inlet line due to the presence of the pneumatic channel may be one of the reasons why the liquid interface tends to pull in that direction. When the inlet pressure head is increased by 33 %, apparently the higher flow momentum seems to overcome the surface tension forces, and hence the interface motion is relatively more symmetric along the direction of the filling (horizontal direction). The mass flow rate plot shows the increased resistance to the motion of the liquid front when the front tries to overcome the burst pressure needed to break through into the reservoir, which slows down flow into the reservoir. Once this obstacle is overcome, the flow rate picks up and stabilizes at a relatively constant value (see 4 kPa curve) until it reaches the reservoir exit where flow stops due to the presence of the passive valve with a burst pressure higher than 4 kPa.
Effect of Conditions Downstream of Reservoir We examined the effects of conditions downstream of the reservoir on the air
splitting process in the liquid inlet channel. Two scenarios were simulated: (a) The dispenser reservoir is filled with liquid only till the location of the downstream passive
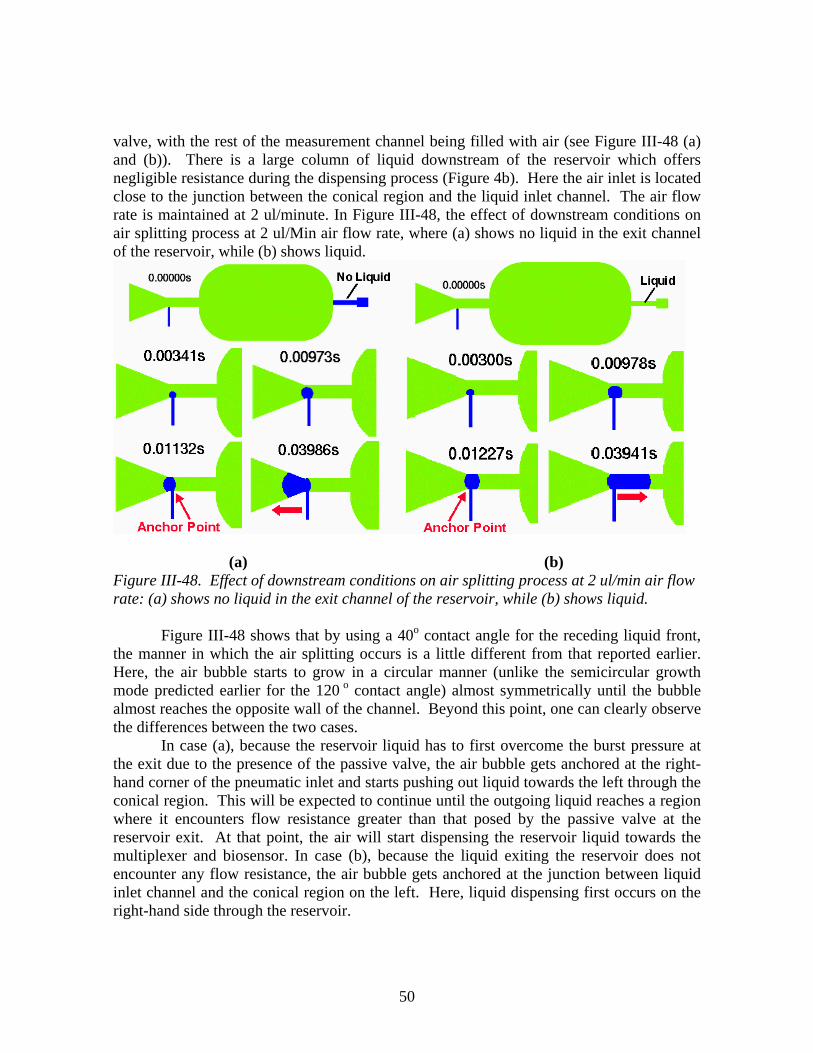
50
valve, with the rest of the measurement channel being filled with air (see Figure III-48 (a) and (b)). There is a large column of liquid downstream of the reservoir which offers negligible resistance during the dispensing process (Figure 4b). Here the air inlet is located close to the junction between the conical region and the liquid inlet channel. The air flow rate is maintained at 2 ul/minute. In Figure III-48, the effect of downstream conditions on air splitting process at 2 ul/Min air flow rate, where (a) shows no liquid in the exit channel of the reservoir, while (b) shows liquid.
(a) (b) Figure III-48. Effect of downstream conditions on air splitting process at 2 ul/min air flow rate: (a) shows no liquid in the exit channel of the reservoir, while (b) shows liquid.
Figure III-48 shows that by using a 40o contact angle for the receding liquid front, the manner in which the air splitting occurs is a little different from that reported earlier. Here, the air bubble starts to grow in a circular manner (unlike the semicircular growth mode predicted earlier for the 120 o contact angle) almost symmetrically until the bubble almost reaches the opposite wall of the channel. Beyond this point, one can clearly observe the differences between the two cases.
In case (a), because the reservoir liquid has to first overcome the burst pressure at the exit due to the presence of the passive valve, the air bubble gets anchored at the right-hand corner of the pneumatic inlet and starts pushing out liquid towards the left through the conical region. This will be expected to continue until the outgoing liquid reaches a region where it encounters flow resistance greater than that posed by the passive valve at the reservoir exit. At that point, the air will start dispensing the reservoir liquid towards the multiplexer and biosensor. In case (b), because the liquid exiting the reservoir does not encounter any flow resistance, the air bubble gets anchored at the junction between liquid inlet channel and the conical region on the left. Here, liquid dispensing first occurs on the right-hand side through the reservoir.
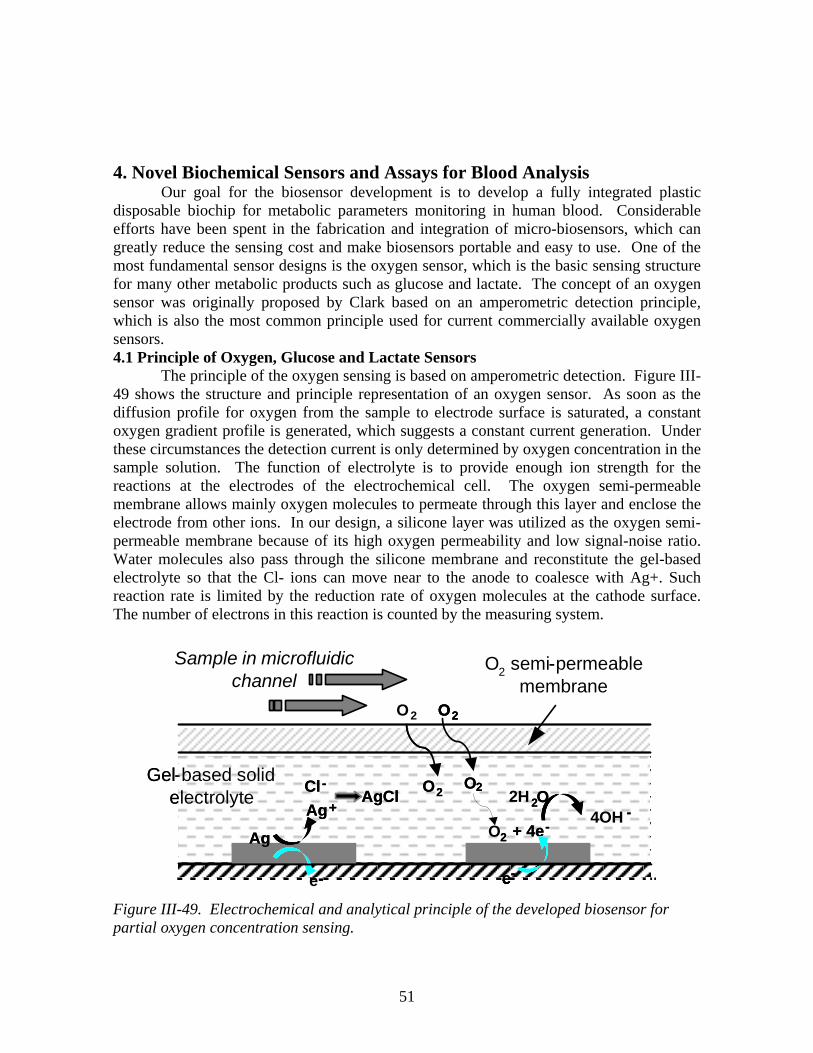
51
4. Novel Biochemical Sensors and Assays for Blood Analysis
Our goal for the biosensor development is to develop a fully integrated plastic disposable biochip for metabolic parameters monitoring in human blood. Considerable efforts have been spent in the fabrication and integration of micro-biosensors, which can greatly reduce the sensing cost and make biosensors portable and easy to use. One of the most fundamental sensor designs is the oxygen sensor, which is the basic sensing structure for many other metabolic products such as glucose and lactate. The concept of an oxygen sensor was originally proposed by Clark based on an amperometric detection principle, which is also the most common principle used for current commercially available oxygen sensors. 4.1 Principle of Oxygen, Glucose and Lactate Sensors
The principle of the oxygen sensing is based on amperometric detection. Figure III-49 shows the structure and principle representation of an oxygen sensor. As soon as the diffusion profile for oxygen from the sample to electrode surface is saturated, a constant oxygen gradient profile is generated, which suggests a constant current generation. Under these circumstances the detection current is only determined by oxygen concentration in the sample solution. The function of electrolyte is to provide enough ion strength for the reactions at the electrodes of the electrochemical cell. The oxygen semi-permeable membrane allows mainly oxygen molecules to permeate through this layer and enclose the electrode from other ions. In our design, a silicone layer was utilized as the oxygen semi-permeable membrane because of its high oxygen permeability and low signal-noise ratio. Water molecules also pass through the silicone membrane and reconstitute the gel-based electrolyte so that the Cl- ions can move near to the anode to coalesce with Ag+. Such reaction rate is limited by the reduction rate of oxygen molecules at the cathode surface. The number of electrons in this reaction is counted by the measuring system.
Ag Ag+
-
Cl - AgCl
O2 + 4e-
e-
2H 2O4OH -
O2
O2O2
Ag Ag+
-
Cl - AgCl
O2 + 4e-
e-
2H 2O4OH -
O2
O2O2
Sample in microfluidicchannel O2 semi-permeable
membrane
Gel- based solidelectrolyte
Ag Ag+
-
Cl - AgCl
O2 + 4e-
e-
2H 2O4OH -
O2
O2O2
Ag Ag+
-
Cl - AgCl
2 + 4e-
e-
2O-
O2
O2O2
-
Gel- based solidelectrolyte
e
Figure III-49. Electrochemical and analytical principle of the developed biosensor for partial oxygen concentration sensing.

52
i= nFADO2
∆ [O2]di= nFADO2
∆ [O2]d
The electrochemistry for macro scale gives the relationship between current and
analyte concentration as:
(III-4) where i is the signal measured by the amplifying circuit, n is the number of
electrons that are exchanged during reaction (four electrons for oxygen sensing), F represents the Faraday constant, A represents the area of the cathode, Do2 is the diffusion constant that varies according to the semi-permeable material, ∆[O2] represents the difference of oxygen concentration between sample and electrode surfaces, and d is defined as total thickness of the membrane and gel-based electrolyte layer. In actual experiments, Do2 is taken as the mean of the semi-permeable membrane and electrolyte layer. In the saturation case, the oxygen concentration near the electrode surface can be assumed to be zero so that ∆[O2] can be directly assumed as the oxygen concentration in the sample. Using equation (III-4), we can calculate the currents for different experimental conditions. Such parameters include membrane material, thickness of membrane and solid electrolyte layer, area of electrodes, distance between electrodes and the shape of electrodes.
The glucose and lactate sensors are constructed by adding two layers on top of the oxygen sensor. In a glucose sensor for example, the glucose molecules are converted to gluconic acid; thereby hydrogen peroxide is generated in the presence of glucose oxidase enzyme. This reaction proceeds as shown below:
(III-5)
At the applied voltage crossing the electrodes, 700mV, the following reaction proceeds at the surface of working electrode
(III-6)
The generated electrons will be recorded by the detection circuit and utilized to calculate the glucose concentration. The glucose oxidase must be entrapped in a matrix material to prevent enzyme loss during testing. During fabrication, the process temperature has to be limited to ensure that the enzyme will not be denatured. A similar reaction will occur for lactate molecules in the presence of the lactate oxidase enzyme.
The rate of enzyme reaction is designed to overwhelm the glucose diffusion rate so that every glucose molecule that passes through glucose semi-permeable membrane will be oxidized and generate one hydrogen peroxide molecule, which will be detected as described above.
4.2 Sensor Fabrication
A significant challenge in developing fully integrated chip-based biosensors is the inability to store liquid electrolytes on-chip. This incompatibility of liquid solution with modern micro-machining technology is a big obstacle for disposable and cheap sensing systems. Our approach is to introduce a low melting point solid electrolyte during biosensor fabrication, so that a portable and low cost detection system can be achieved. The
Glucose Glucose oxidase Gluconic acid + H2O2
H2O2 2H+ +2e- + O2

53
electrolyte can be reconstituted just before biochemical detection. This technique is also compatible with mass-manufacturing approaches such as spin coating and screen-printing allowing us to maintain the low cost requirement for the disposable biochip.
The fabrication sequence for the biosensor array (oxygen, glucose and lactate sensors) is described below. 1000 Å thick gold was deposited on 3-inch COC wafer with 300 Å thick titanium as an adhesion layer. The gold layer was patterned using positive photoresist-based lithography. 2 µm thick silver was electroplated on the gold patterns to form a gold-silver electrode pair.
After patterning the electrodes, the various layers were deposited by spin coating and screen-printing. The gel-based electrolyte was heated to 65oC under continuous stirring. The liquefied electrolyte was spin-coated over the electrode area to achieve a 3 um thick electrolyte. The gel-based electrolyte was cured at room temperature. After the gel-based electrolyte layer dried at room temperature (30 minutes), the silicone layer was spin-coated and cured for 8 hours before enzyme coating. Glucose oxidase was immobilized onto the top of the constructed microelectrodes by using a Polyacrylamide solution, which is prepared by dissolving acrylamide power in deionized water (final concentration 40 % acrylamide and 0.5 % crosslinker) in an Eppendorf tube. The enzyme was added into the solution at ratio of 1:1 and mixed on a vortex shaker (total volume at 70 µL). Different enzyme concentrations can be achieved by varying the mixing ratios. Immediately before screen-printing, 15 µL of 2 % ammonium persulfate (AP) and 15 µL of 0.5 % tera-ethyl-methylenediamine (TEMED) were mixed in. After screen-printing, the above mixture cured as a water insoluble matrix and served as the glucose oxidizing layer. A polyurethane layer was screen-printed on top as a glucose semi-permeable membrane, and cured in air at room temperature for 8 hours before sensor testing.
Figure III-50. Microphotograph of the biosensor array showing the different biosensors. Note that a border has been added around the patterned areas for easy visualization.
Figure III-50 shows a microphotograph of the fabricated biosensor array with an oxygen, glucose and lactate sensor. The fabrication sequence is based on a similar principle and/or fabrication process and can be batch processed, thereby reducing the fabrication complexity and the cost of the device. The materials involved in the biosensor assembly, specifically the solid electrolyte and the enzyme layers, are sensitive to temperature variations. For example, the heat involved in fusion bonding would definitely
Glucose sensor
Oxygen sensor
Lactate sensor
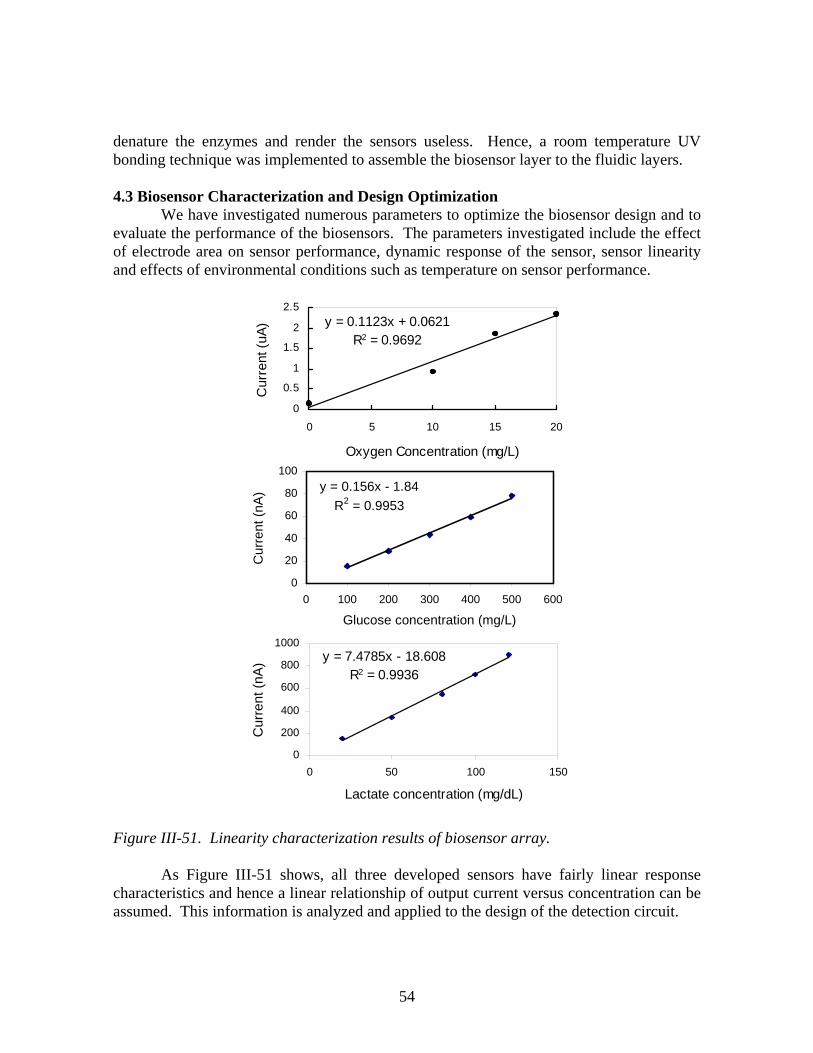
54
denature the enzymes and render the sensors useless. Hence, a room temperature UV bonding technique was implemented to assemble the biosensor layer to the fluidic layers.
4.3 Biosensor Characterization and Design Optimization
We have investigated numerous parameters to optimize the biosensor design and to evaluate the performance of the biosensors. The parameters investigated include the effect of electrode area on sensor performance, dynamic response of the sensor, sensor linearity and effects of environmental conditions such as temperature on sensor performance.
Figure III-51. Linearity characterization results of biosensor array.
As Figure III-51 shows, all three developed sensors have fairly linear response
characteristics and hence a linear relationship of output current versus concentration can be assumed. This information is analyzed and applied to the design of the detection circuit.
y = 0.1123x + 0.0621R2 = 0.9692
0
0.5
1
1.5
2
2.5
0 5 10 15 20
Oxygen Concentration (mg/L)
Cur
rent
(uA)
y = 7.4785x - 18.608R2 = 0.9936
0
200
400
600
800
1000
0 50 100 150
Lactate concentration (mg/dL)
Cur
rent
(nA
)
y = 0.156x - 1.84
R2 = 0.9953
0
20
40
60
80
100
0 100 200 300 400 500 600
Glucose concentration (mg/L)
Cur
rent
(nA
)

55
Figure III-52. Characterization results of biosensor: (a) dynamic response and (b) effect of electrode area.
Figure III-52 shows the characterization results of the sensor array in terms of the dynamic response and effect of electrode area. Figure III-52(a) shows that the response time of the oxygen sensor is less than a minute, reaching saturation values in ~50 s. The sensor response times are amongst the fastest reported and can be further improved by optimization of membrane/electrolyte thickness. The results of Figure III-52(b) are in agreement with equation (III-4), which predicts and increased area would lead to higher signals.
Point-of-care testing is usually performed in outdoor environments, where the temperature may vary from –30.0oC to 45.0oC. Many parameters that determine the sensor performance, such as electrochemical reaction rate, chemical species diffusion rate, electron mobility, etc. are highly temperature dependent. The glucose sensor performance under different temperatures is recorded and plotted in Figure III-53, in which a significant temperature dependency is observed. Although the sensor array has a good performance at room temperature, such dependency predicts that a large measurement error will occur in real environments. However, the linearity of the graph suggests that a calibration buffer with known analyte concentrations can be used to cancel out the temperature dependence.
0
2
4
6
8
10
0 2 4 6 8 10Area of Sensor (mm2)
Pea
k C
urre
nt (u
A)
(b)
0
0.2
0.4
0.6
0.8
1
1.2
0 50 100 150 200Time (s)
Cur
rent
(uA
)
[O2] = 18mg/L
[O2] = 9mg/L
[O2] = 0mg/L
(a)

56
Figure III-53. Effect of temperature variation on glucose sensor output.
An approach to minimize the temperature effect is shown in Figure III-54. A calibration solution was injected before the sample solution and the sensor response is then recorded and plotted. Since the sensor has linear responses at various temperatures, the plotted curve can be extracted and used to cancel out the temperature effect.
The calibration process is performed in three steps (shown in Figure III-54). Before the buffer solution arrives at the sensor surface, the background offset of electronic circuit is measured and stored as I0. The signal from the calibration buffer is then measured (I1) to plot the current versus concentration curve (solid line as shown in Figure III-54). After loading the sample solution, the actual signal is recorded as I2.
0
50
100
150
200
250
300
350
0 30 60 90 120 150
Glucose Concentration (mg/dL)
Cur
rent
(nA
)
Glucose Concentration (mg/dL)
9 0C
* 15 0C 25 0C 30 0C 35 0C
Cur
rent
(nA
)

57
Figure III-54. Principles of using calibration buffer to adjust for temperature variation: (1) measure background offset (I0); (2) measure signal from buffer solution (I1), which contains known analyte concentration; and (3) measure the sample signal (I2) to calculate the concentration.
(2)
Buffer loading
Sample loading
(1)
(3)
No loading
*
*
Calibration
I 2
I 1
I 0
ConcentrationC 1 C 2
Measurement
*
Calibration Principles
(1)
(2)
(3)
Cur
rent

58
Figure III-55. Results for the sensor response with and without calibration technique.
Figure III-55 shows the measured signal with and without the calibration method. In case of no calibration method, the sensor exhibits large deviations when the temperature various from 9 0C to 40 0C. Such deviation predicts failures in actual point-of-care measurements. The introduction of calibration method greatly removes the temperature and therefore, the metabolic monitoring by using the biosensor array are extended from laboratory measurements to point-of-care diagnostics
5. Development of IC Circuits and Analyzer
The disposable biochip is designed is to work with a portable analyzer module that supplies the control signals for the microfluidic sequencing and also has the detection and display units for analyzing the biochemical input.
5.1 System Components with Surface Mount Technology
The control and detection circuitry were implemented on a multilayer PCB using SMT (surface mount technology) IC’s to minimize the size of the device. The LCD used for displaying the concentration of fluid analytes was a 3-1/2 digit static duty, elastomer version LCD that met the low power consumption and small size specifications. The overall board dimensions were 2.5” x 2.5” x 1.5” including the batteries. The total power consumption of the board was estimated to be 0.4 W. Figure III-56 shows the SMT board with a biochip mounted in the cartridge holder.
Temperature 0C
0
50
100
150
200
250
0 5 10 15 20 25 30 35 40
Con
cent
ratio
n (m
g/dL
)C
once
ntra
tion
(mg/
dL)
Result without calibration method
Result with calibration method
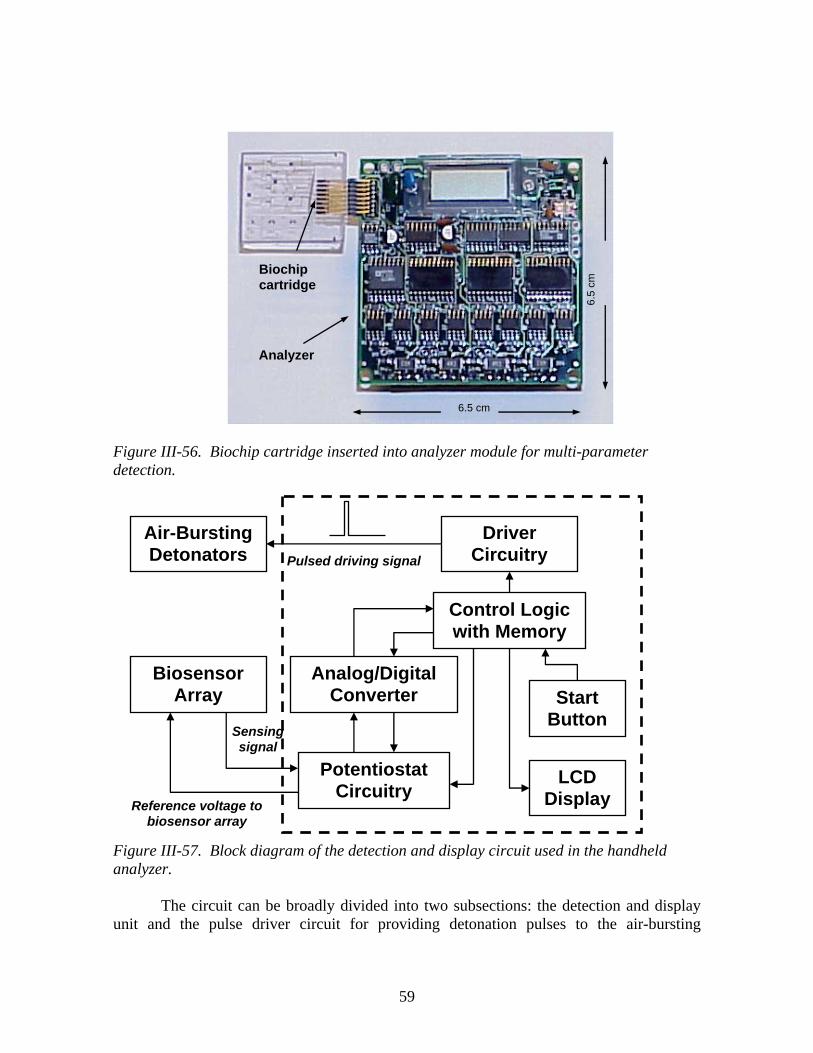
59
Figure III-56. Biochip cartridge inserted into analyzer module for multi-parameter detection.
Figure III-57. Block diagram of the detection and display circuit used in the handheld analyzer.
The circuit can be broadly divided into two subsections: the detection and display unit and the pulse driver circuit for providing detonation pulses to the air-bursting
6.5
cm
Analyzer
Biochip cartridge
6.5 cm
Air-Bursting Detonators
LCD Display
Sensing signal
Reference voltage to biosensor array
Biosensor Array
Analog/Digital Converter
Driver Circuitry
Potentiostat Circuitry
Control Logic with Memory
Start Button
Pulsed driving signal

60
detonators. Figure III-57 shows a block diagram of the detection and display circuit implemented for the biosensor control. The subsystems of this unit are further described below.
Detection System: The detection system consists of a voltage reference to provide the power supplies to the electrodes in the biosensor and a detection circuit to convert the output signal from the biosensors to a voltage signal. This signal is then amplified; the peak value is detected and displayed. The power supply to the electrodes needs to be a constant voltage that would not drop below 550 mV, which is required to initiate the electrochemical reaction at the biosensor. Biasing the electrodes to an excess voltage would cause excess thermal dissipation and would disrupt the biosensor performance. When a bias signal is provided to the anode, the reaction starts and current from the electrodes rises linearly and saturates at a peak value in the range of 100 nA–20 uA (depending on the type of sensor). An operational amplifier with a very low offset voltage and current was used in a current to voltage (I–V) converter configuration to amplify the current signal to an equivalent voltage signal.
Control Logic Circuitry: The control logic circuit is basically an analog to digital converter that converts the peak value of the output signal from the detection system into a digital value. The sampling interval is adjusted such that the analog value is acquired when the biosensor signal has saturated at its peak value. This value is stored in an eight-bit register. The output signals for each of the three sensors are sequentially multiplexed using an analog multiplexer. Each input channel is selected by external control signals and is directed to the display where the data is displayed after being reconverted to an analog format. The display is conducted in a cyclic fashion, where one analyte concentration is displayed at a time in a sequential fashion.
Display Driver Circuitry: This is an interface between the detection/control logic circuitry and the LCD display. A display driver is required to generate appropriate front plane and backplane waveforms and, hence, switch on the corresponding segments so that the analog value is displayed on the LCD. A square wave is supplied to the backplane electrodes of the LCD display and to the driver IC. The driver IC modifies the phase input depending on the input data.
Pulse Driver Circuit: The driver circuit is designed to sequentially “detonate” multiple membranes with a fixed time delay where each membrane detonation requires a 280-mA current pulse for 800-ms duration. A set of delay elements is constructed using monostable multivibrators with 555 timers. A start pulse is applied to the first timer, which introduces a delay of 2.5 s and activates the driver element. The start pulse is also propagated to the next timer element and after a further delay of 2.5 sec, the second driver element is activated. A total of four delay timers and driver elements have been implemented on the SMT boards allowing for sequential control over four air-bursting detonators. The duration of the delay timers is externally adjustable. The driver element is a Darlington pair configuration of bipolar junction transistors to supply a constant current to the detonator heaters. The designed Darlington pair driver element can provide a continuous current of up to 2 A if required and is more than sufficient to provide the specified current pulse for the air-bursting detonators. The designed SMT boards have been fully tested and characterized. Extensive biosensor testing has been conducted using

61
the developed SMT boards. Figure III-58 shows the developed SMT electronics system packaged into a portable,
handheld analyzer. The packaged analyzer includes the SMT electronics board, batteries and the biochip cartridge holder. The entire packaged system is only 5.25” x 3.25” x 1.25” in size.
Figure III-58. Handheld analyzer: (a) open view and (b) packaged analyzer with biochip. Packaged analyzer is approximately 5.25” X 3.25” X 1.25”. 5.2 ASIC Design and Testing
Scaling the SMT components onto application-specific IC (ASIC) chips can significantly reduce the size of the electronic system. With this goal, we have designed and tested two ASIC chips:
Analog ASIC: consisting of I–V circuits for electrochemical detection, voltage reference, comparator circuitry, and compensation circuitry for the op-amp.
Mixed-Signal ASIC: consisting of analog-to-digital converter, digital-to-analog converter, Clock Generator, and the Control Circuitry for the display driver.
The designed ASIC chips (single channel) were successfully tested to obtain a reliable signal from the biosensors. We are currently developing advanced versions of the ASIC design that are capable of acquiring data from a biosensor array. The second-generation ASIC chips would also have the delay control elements for the detonator activation. The start signal from the ASIC chips would then be amplified by using discrete power components and the resultant current pulse can be used to melt the detonator membrane.
Biochip socket
Display
Power/Reset switches
SMT board
Batteries
Biochip

62
Figure III-59. ASIC designs : (a) BCD to seven segment display driver in ABN AMI 1.5µm technology, (b) AIBN pulse driver in ABN AMI 1.5 µm technology.
6. Fully Integrated Smart Disposable Lab-on-a-Chip The fabricated disposable smart polymer lab-on-a-chip is only 1” x 1” x 0.25” in
dimension. The topmost layer has the biosensor patterns, the next two layers constitute the microfluidic control system with and the last two layers are used for the membrane and reservoirs of the on-chip pressure generator. The calibration solution is contained within an on-chip metallic pouch.
UV Bonding Technique for Biochip Assembly
We have optimized the various aspects of plastic micromachining that are integral to the biochip fabrication. Previous chapters presented a detailed overview of the development of the plastic micromachining techniques including mold fabrication, embossing, injection molding and thermoplastic fusion bonding. The biosensor array used for the disposable biochip includes temperature sensitive layers such as the solid electrolyte and the enzyme layer. These layers prohibit the use of high-temperature fusion bonding techniques. In order to assemble biosensors at low-temperature we have optimized the UV bonding technique. We have selected a biocompatible UV adhesive (Loctite 3211™) for developing a room temperature bonding process. Table III-2 shows the biocompatibility characteristics of the selected UV-adhesive.

63
ISO test Criteria Satisfied? 10993-4 Hemocompatibility/in vitro hemocompatibility assay Yes 10993-5 Cytotoxicity Yes 10993-6 Implantation test Yes 10993-10 Intracutaneous injection Yes 10993-11 Acute systemic injection Yes
TABLE III-2. ISO-10993 BIOCOMPATIBILITY CRITERIA OF SELECTED UV ADHESIVE LOCTITE 3211™
The UV-epoxy is screen-printed in order to maintain the low-cost and easy
manufacturability objectives of the biochip. After screen-printing the UV-epoxy, the sealing substrate is bought in contact and the assembly is exposed to UV light. Exposure to UV leads to cross-linking of the epoxy and yields high bond strength.
One of the factors that could potentially affect the bond strength is the surface condition of the plastic substrates. To implement the sPROMs-based microfluidic devices, a strongly hydrophobic substrate is required. Hence we have also analyzed the effect of surface modification on the bond strength of the UV epoxy. Figure III-60 shows that the bond strength is strongly dependent on the surface condition of the COC substrate and at strongly hydrophobic condition; very poor bonding or no bonding is achieved. These results are similar to the trend observed for thermoplastic fusion bonding. We have already developed techniques for selective surface modification and these are applied to treat only the microfluidic channels to desired hydrophobic state.
0
0.5
1
1.5
2
2.5
0 50 100 150 200Contact Angle [deg]
Nor
mal
Bon
d S
treng
th [M
Pa]
Figure III-60. Bond strength of UV adhesive after surface modification of COC substrate.

64
On-Chip Pouch for Calibration Solution Storage As mentioned previously, a significant addition to the biochip design involves the incorporation of a metallic pouch for on-chip storage of the calibration buffer. Figure III-61 shows a schematic sequence of the pouch fabrication.
Figure III-61. Fabrication sequence of the metallic pouch: (a); (b) forming of aluminum foil over molding cavity; (c) filling of calibration solution; (d) sealing with medical grade adhesive lined metal tape; and (e) fabricated device.
A casting mold is made out of a rigid plastic substrate with a cavity of a defined volume. A thin aluminum foil (thickness ~ 50 um) is then spread and formed over this cavity as shown in Figures III-62(a) and (b). Then, the calibration buffer solution is filled into the open cavity. Finally, the pouch is sealed with a metallic tape with a medical grade adhesive lining. The fabricated pouch volume is approximately 60 uL.
The cartridge holder has a spring-loaded ball that can be deflected downwards when a flat biochip is introduced in the socket. The biochip contains a flexible adhesive membrane at the bottom that holds the pouch in position and also allows the deflection necessary for breaking the pouch. As the biochip is being inserted, the ball is pushed downwards. When the chip is completely inserted, the ball is pushed back up by the spring below. The ball then deflects the thin membrane and crushes the pouch to release the calibration buffer solution. The pressure generated due to this deflection is enough to push the buffer solution to the desired location.
Figure III-62. Actual demonstration of on-chip calibration solution storage pouch: (a) mechanical pressure is applied to pouch; (b); (c); and (d) calibration solutions flows out of the pouch and fills the biosensor reservoirs.
(a) (b)
(c) (d) (e)
(a) (b) (c) (d)
On-Chip pouch
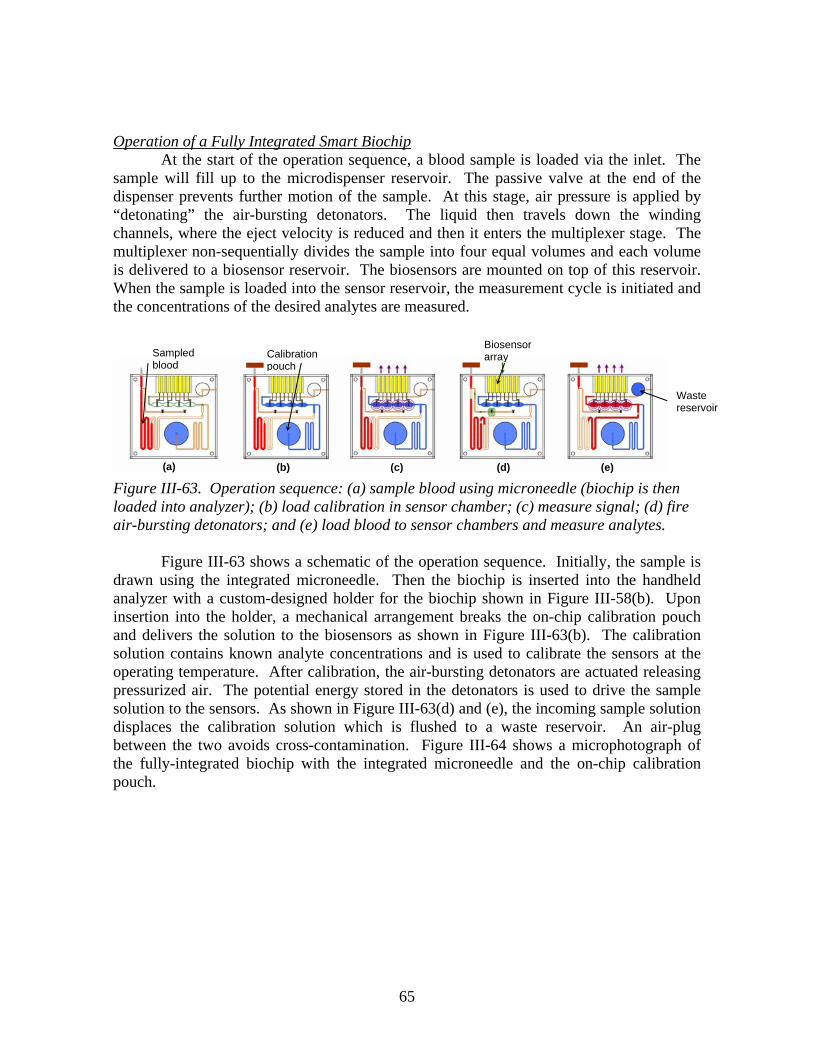
65
Operation of a Fully Integrated Smart Biochip At the start of the operation sequence, a blood sample is loaded via the inlet. The
sample will fill up to the microdispenser reservoir. The passive valve at the end of the dispenser prevents further motion of the sample. At this stage, air pressure is applied by “detonating” the air-bursting detonators. The liquid then travels down the winding channels, where the eject velocity is reduced and then it enters the multiplexer stage. The multiplexer non-sequentially divides the sample into four equal volumes and each volume is delivered to a biosensor reservoir. The biosensors are mounted on top of this reservoir. When the sample is loaded into the sensor reservoir, the measurement cycle is initiated and the concentrations of the desired analytes are measured.
Figure III-63. Operation sequence: (a) sample blood using microneedle (biochip is then loaded into analyzer); (b) load calibration in sensor chamber; (c) measure signal; (d) fire air-bursting detonators; and (e) load blood to sensor chambers and measure analytes.
Figure III-63 shows a schematic of the operation sequence. Initially, the sample is drawn using the integrated microneedle. Then the biochip is inserted into the handheld analyzer with a custom-designed holder for the biochip shown in Figure III-58(b). Upon insertion into the holder, a mechanical arrangement breaks the on-chip calibration pouch and delivers the solution to the biosensors as shown in Figure III-63(b). The calibration solution contains known analyte concentrations and is used to calibrate the sensors at the operating temperature. After calibration, the air-bursting detonators are actuated releasing pressurized air. The potential energy stored in the detonators is used to drive the sample solution to the sensors. As shown in Figure III-63(d) and (e), the incoming sample solution displaces the calibration solution which is flushed to a waste reservoir. An air-plug between the two avoids cross-contamination. Figure III-64 shows a microphotograph of the fully-integrated biochip with the integrated microneedle and the on-chip calibration pouch.
(a) (b) (c) (e) (d)
Calibration pouch
Biosensor arraySampled
blood
Waste reservoir
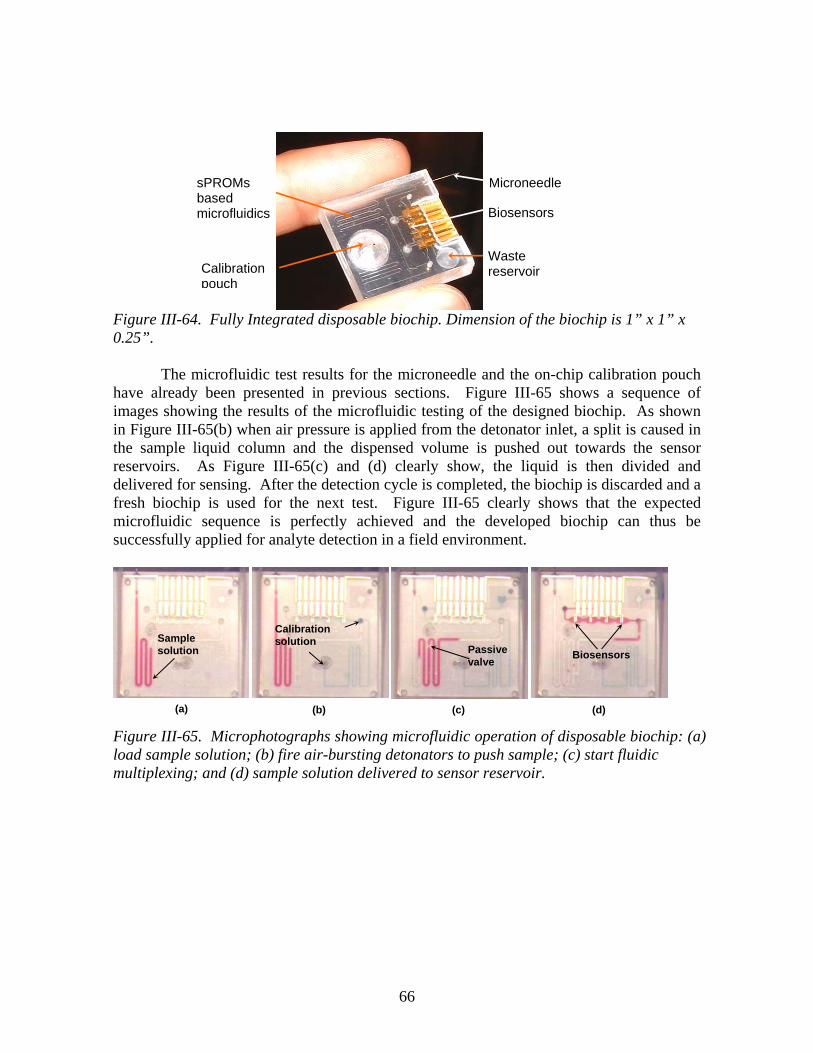
66
Figure III-64. Fully Integrated disposable biochip. Dimension of the biochip is 1” x 1” x 0.25”.
The microfluidic test results for the microneedle and the on-chip calibration pouch have already been presented in previous sections. Figure III-65 shows a sequence of images showing the results of the microfluidic testing of the designed biochip. As shown in Figure III-65(b) when air pressure is applied from the detonator inlet, a split is caused in the sample liquid column and the dispensed volume is pushed out towards the sensor reservoirs. As Figure III-65(c) and (d) clearly show, the liquid is then divided and delivered for sensing. After the detection cycle is completed, the biochip is discarded and a fresh biochip is used for the next test. Figure III-65 clearly shows that the expected microfluidic sequence is perfectly achieved and the developed biochip can thus be successfully applied for analyte detection in a field environment.
Figure III-65. Microphotographs showing microfluidic operation of disposable biochip: (a) load sample solution; (b) fire air-bursting detonators to push sample; (c) start fluidic multiplexing; and (d) sample solution delivered to sensor reservoir.
Microneedle
Biosensors
Waste reservoir Calibration
pouch
sPROMs based microfluidics
(a) (b) (d)
Sample solution
Calibration solution
Biosensors
(c)
Passive valve

67
IV. Problems Encountered Various expected/unexpected problems were encountered during the project
development. Most encountered problems were solved except a few specific problems. System specifications were modified to solve those problems. 1. Plastic Microfluidic Components Blood Separation through thin passive valves
Major problems came from our lack of knowledge of human blood performance in microfluidic channels as expected. From the concept of sPROMs, narrower passive valves require higher pressure to allow fluid passing and provide wider pressure manipulating ranges. In the initial biochip layout, we fabricated 20 µm wide micro channels and operated successfully with water based samples. However, human blood sample, which is a complex liquid of cells, platelets, plasma, and a variety of biological molecules, exhibits large differences in microfluidic performance compared with water tests. From the entrance of the 20-µm-wide passive valve, the bloods sample starts to separate into plasma and blood cells. The plasma part passes the passive valve region faster than the cells. We observed the front half of blood came into lighter color and the rear section of blood showed darker and darker color, where the slow moving blood cells got more and more concentrated. In the modified biochip design, we selected a wider passive valve configuration (150 µm) to minimize these phenomena. In the real blood microfluidic testing, there is no blood separation observed any more. Alignment of different microfluidic layers
The biochip contains 5 layers of microfluidic structures. During the assembly of these layers, we continuously encountered problems in aligning the structures. The misalignment of interconnects between each layer can evolve many uncertainties such as higher pressure drop, bubble generation, bonding leakage. This problem was solved by the application of double side injection molding techniques, in which two Ni molds are used for each microfluidic layer. One Ni mold contains the microfluidic structure pattern and the other Ni mold has 8 pins for the alignment holds. Before the injection molding, the two Ni molds were carefully aligned to each other within the maximum displacement less than 50 µm. By using this method, each plastic microfluidic layer obtains 8 through-holes with satisfactory accuracy. During the assembly, metal pins penetrate all these holes so that all the layers are aligned automatically. This approach greatly improved the assembly accuracy and reduced the fabrication time. Thickness variation of the microfluidic structures
This is an inherited problem in electroplating of Ni over large area containing various aspect ratios. In the design, the total thickness of the microfluidic is fixed at 130 µm, while the width of channels varies from 150 µm to 2 mm. The fact that a narrower region has higher current density ends up with the problem of different electroplated thicknesses. We have thoroughly explored this phenomena and investigated the relationship between current

68
density and thickness non-uniformity. The optimized electroplating conditions present a fairly uniform structure with the maximum thickness variation less than 10 µm. Vertical plastic micro-needle array
Our initial plan for blood sampling was to use a vertical plastic micro-needle array. We have extensively studied a high aspect ratio plastic structure with a 600 µm height and 100 µm tip diameter. The through-hole in the micro-needle is achieved by laser drilling. Such structure meets all our proposed requirements in micro-needle dimensions. However, the fabricated plastic micro-needle encountered great difficulties in penetrating the skin and sampling the blood. One reason is due to the lack of data in human test. On the other hand, the plastic needle did not exhibit enough rigidity and sharpness to penetrate the skin. All of the trials helped a lot but were not perfect. Hence, we substituted the plastic micro-needle with a parallel metallic needle, which proved to meet all the minimum invasive sampling requirements. From air-bursting detonator to AIBN propellant
In order to drive fluidics in micro channels, an on-chip power source is highly needed. The initial design was to store compressed air on-chip by fabricating a thin membrane sealing a micro-cavity. The thin membrane is later destroyed by the heat from the attached metallic heater. We have optimized the entire air-bursting detonator and performed numerous tests. The slight problem that we encountered is the difficulty in how to slowly release the compressed air, since the melted membrane always opened the micro-cavity rapidly and freed all the compressed air. Such an abrupt air release made the fluidic movement in the microchannel too fast to be controlled and left liquid residue on the channel sidewall. While we tried all the methods to slowly control the air release, there are still some difficulties in optimizing the entire process. As a substitution, we constructed an AIBN based actuator, in which the heated AIBN gradually dissociates and generates N2 gas. The release of N2 gas can be well controlled by providing a different heating procedure, such as a controlled current amplitude and heating time. In the final biochip layout, the AIBN propellant shows a powerful capability to accurately manipulate the microfluidics.
2. Biosensor Array Membrane biocompatibility with human blood sample
Major problems came from the lack of membrane and blood properties as expected. Conventional blood gas analyzers utilizes Teflon™ as the oxygen permeable membrane, which was a good reference at the starting stage. The Teflon™ worked perfectly with water samples while it introduced many problems in blood samples. Based on our research, proteins and cells have a huge affinity to attach to the Teflon™ membrane surface. Such properties make the blood easily stick to the Teflon membrane and reluctant to continuously travel in the microchannel. Also, in a short period of time (<1 min), the blood sample starts to coagulate and blocks the microchannel entirely. We tried various materials candidates and tested their biocompatibility with the human blood sample. Based on these results, the silicone membrane shows satisfactory properties in that the human blood
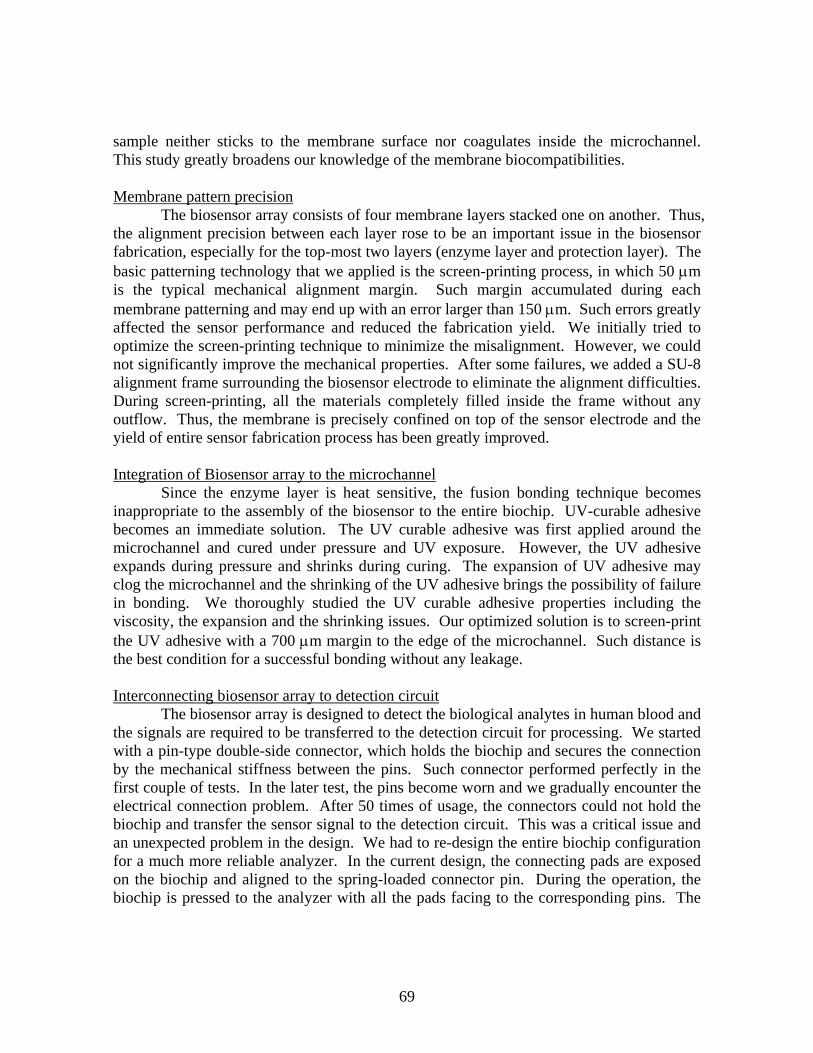
69
sample neither sticks to the membrane surface nor coagulates inside the microchannel. This study greatly broadens our knowledge of the membrane biocompatibilities. Membrane pattern precision
The biosensor array consists of four membrane layers stacked one on another. Thus, the alignment precision between each layer rose to be an important issue in the biosensor fabrication, especially for the top-most two layers (enzyme layer and protection layer). The basic patterning technology that we applied is the screen-printing process, in which 50 µm is the typical mechanical alignment margin. Such margin accumulated during each membrane patterning and may end up with an error larger than 150 µm. Such errors greatly affected the sensor performance and reduced the fabrication yield. We initially tried to optimize the screen-printing technique to minimize the misalignment. However, we could not significantly improve the mechanical properties. After some failures, we added a SU-8 alignment frame surrounding the biosensor electrode to eliminate the alignment difficulties. During screen-printing, all the materials completely filled inside the frame without any outflow. Thus, the membrane is precisely confined on top of the sensor electrode and the yield of entire sensor fabrication process has been greatly improved.
Integration of Biosensor array to the microchannel
Since the enzyme layer is heat sensitive, the fusion bonding technique becomes inappropriate to the assembly of the biosensor to the entire biochip. UV-curable adhesive becomes an immediate solution. The UV curable adhesive was first applied around the microchannel and cured under pressure and UV exposure. However, the UV adhesive expands during pressure and shrinks during curing. The expansion of UV adhesive may clog the microchannel and the shrinking of the UV adhesive brings the possibility of failure in bonding. We thoroughly studied the UV curable adhesive properties including the viscosity, the expansion and the shrinking issues. Our optimized solution is to screen-print the UV adhesive with a 700 µm margin to the edge of the microchannel. Such distance is the best condition for a successful bonding without any leakage.
Interconnecting biosensor array to detection circuit
The biosensor array is designed to detect the biological analytes in human blood and the signals are required to be transferred to the detection circuit for processing. We started with a pin-type double-side connector, which holds the biochip and secures the connection by the mechanical stiffness between the pins. Such connector performed perfectly in the first couple of tests. In the later test, the pins become worn and we gradually encounter the electrical connection problem. After 50 times of usage, the connectors could not hold the biochip and transfer the sensor signal to the detection circuit. This was a critical issue and an unexpected problem in the design. We had to re-design the entire biochip configuration for a much more reliable analyzer. In the current design, the connecting pads are exposed on the biochip and aligned to the spring-loaded connector pin. During the operation, the biochip is pressed to the analyzer with all the pads facing to the corresponding pins. The

70
force on the lid holds the biochip and secures the electrical connections. This spring-loaded pin design is perfect for thousands of analyzer use without any chance of failure.
3. Detection Circuit Problems encountered in designing an SMT based prototype system are (a) high requirement of supply current from the battery source due to high quiescent current requirement of individual components used in SMT based circuit and (b) sampling and display times are not easily adjustable. Problems encountered in designing the ASIC are (a) unavailability of a large number of pins in the ABN AMI 1.5 µm technology mixed signal fabrication process and (b) extreme high cost for prototype ASIC design in a package with a large number of pins. V. Lessons Learned
The most valuable experience gained in this project was to successfully achieve the project goals through the collaboration with the multidisciplinary research groups. In performing a multidisciplinary biochip project, the work required knowledge from various research fields, such as electrical engineering, mechanical engineering, material science, biochemistry, electrochemistry and medical science. Every group was learning from each of the other groups. Without the extensive discussion and cooperation, the development of entire biochip would have been impossible. Experiences obtained from this project can be expanded for developing and optimizing an improved microfluidic based analysis systems, for various applications in biotechnologies and diagnostics as well as bio-warfare detections.
1. Plastic Microfluidic Components
The most important lesson that we learned is a better understanding of blood sample performance in microfluidic systems. Being a typical non-Newtonian fluid, the behavior of blood in micro channels is absolutely different from its water counterpart. Such unique behaviors include blood coagulation in the microchannel, blood separation at passive valve regions, non specific bonding of blood ingredients on the channel side wall, etc. Such effects are of significant concern in the total system performance. Many of the system modifications are due to the measurement of human blood samples.
We experienced not only fabrication and development challenges of each individual microfluidic component but also enormous challenges from the assembly process. Numerous bonding techniques had been investigated, studied and developed such as double-side injection molding and UV-adhesive room temperature bonding. The better understanding of these bonding techniques allowed us to pursue a new boding technique in developing plastic microfluidic lab-on-a-chip devices. Conventional silicon or glass-based MEMS fabrication technologies were inadequate for this project. So, the study of the polymer based microstructure opened our eyes to see that polymer MEMS must be a promising approach for the inexpensive lab-on-a-chips or biochips.

71
2. Biosensor Array
Our two most important experiences are: (a) development and fabrication of biosensor array over a plastic substrate and (b) integration of biosensor array with other biochip components. With the use of newly developed microfabrication techniques, the biosensor array could be successfully constructed on a plastic substrate and compatible with mass-production requirements. Most of our past experience in electrochemical detection was based on room temperature tests, in which calibration was not a critical issue. However, in the field test of our initial version of biochip, we observed a significant temperature dependency. Thus, we modified the entire biochip design and detection circuit logic to eliminate the temperature effect. This was a very helpful experience for the development of all types of stand-alone biochip for field applications. The other lesson was learned during the integration of the biosensor array with microfluidic components. Such experiences include the development of room-temperature bonding techniques, patterning each biosensor membrane, and the alignment during integration, etc.
The blood biocompatibility of membrane material was another valuable experience. The unexpected blood sticking on membrane surface occurred in many of our initial developed biosensors. We realized that the biocompatibility was the most critical difference between a whole blood analyzer and a well-known plasma analyzer. Blood physical and chemical properties became a general concern in every aspect of biochip developments.
3. Electrical Detection System An important lesson learned through this project is how to work closely with inter- related researchers. We learned to define problems more accurately and solve them as a team with good communication among the research members. We have also learned to manage time more efficiently and accomplish tasks within the scheduled period of time. Being creative and innovative in the design stage was essential for the success of the development of desired system. In addition to the excellent achievements through the interdisciplinary team work, we have been well educated on how to efficiently coordinate with team leaders and team members.

72
VI. Results
All the biochip components were tested and characterized individually for both microfluidic performance and bio-electrochemical detection capabilities. The microfluidic component is able to deliver a calibration solution to the biosensor first and then transport human blood sample into the sensing reservoir. In the electrochemical biosensor array test, the actual experiment was performed in the Ohio State University Hospital by the usage of human blood. The analyte concentrations were first tested by the biochip. Then, the reading was compared with the results from a conventional blood analyzer. All the processes/results were video-recorded for future analysis.
1. sPROMs Based Microfluidic System
The sPROMs based microfluidic system is the main biochip component for the handling of calibration solutions and human blood samples. An AIBN based air-bursting actuator was developed as the on chip power source. Each biochip component was integrated together and inserted into the handheld type analyzer. All the microfluidic structures were made by cyclic olefin copolymer (COC) micromachining techniques, which included surface plasma treatment, injection molding, thermal casting, fusion bonding, and UV-adhesive bonding. By using the plastic substrate and by applying all these technologies, the entire fabrication cost can be greatly reduced so that the mass-production of disposable biochip becomes feasible. All the microfluidic layers were assembled by using the fusion bonding as discussed in section III. Since the biosensor contains glucose/lactate oxidase, which can not survive high temperature, the UV curable adhesive bonding technique was investigated and used for assembling the biosensor array into the microfluidic layers. The aluminum pouch, which was developed for storing the calibration solution, was assembled into the biochip to accomplish the disposable biochip for clinical analysis. Figure VI-1 shows a microphotograph of the fully-integrated biochip with the integrated microneedle and the on-chip calibration pouch.
Figure VI-1. Fully integrated disposable biochip. Dimension of the biochip is 1” x 1” x 0.25”.
AIBN based on-chip power source
Metallic microneedle for blood sampling sPROMs based
microfluidics
Aluminum pouch for storing calibration solution
Biosensor array

73
Initially, the human blood sample enters the biochip microchannel through the micro-needle. We used a flexible plastic tube to store the blood sample. When the micro-needle penetrates the side wall of the plastic tube, a small pressure (2~3 psi, similar to human vein blood pressure) was applied outside the tube so that the blood injection was smooth and easy to control, as shown in Figure VI-2(a). A passive valve was used to prevent the blood sample from flowing into the biosensor region. In the biochip layout, we fabricated a 3 mm wide channel near to the passive valve to allow the excessive blood flow. The channel also functions as an indicator: as soon as the blood fills half-way inside the wide channel, the blood injection should be stopped, as shown in Figure VI-2(b). The biochip was then inserted into the analyzer and the lid was closed to reinforce the electrode contact. Immediately after the analyzer detects the metal contact, the detection circuit starts to measure the background noise and the value was stored for future calculation. A metal bump was located on the analyzer lid, so that when the lid was closed, the pouch would be broken and the inside solution was driven into the sensing reservoir, as shown in Figure VI-2(c). At this moment, the biosensor array starts to acquire measurement data from the calibration solution and the data was stored in the detection circuit also. It takes 30 seconds for the biosensor array to reach the saturation status. Then, the analyzer begins to provide 130 mA through the AIBN heater for 12 seconds. The generated N2 gas was compressed in the chamber before it started to drive the blood sample. After the compressed N2 pressure becomes larger than the necessary value to overcome the passive valve, the blood begins to migrate inside the channel until it fills the sensing reservoir for the biosensor array to measure the value, as shown in Figure VI-2(d).
From the video, the entire system is proven to have an effective capability for successfully handling the calibration solution and human blood sample. The blood sample travels smoothly in the micro-channels by the power from AIBN firing. The power supply to the AIBN heater was controlled precisely so that the blood sample stops moving after filling the sensing reservoir. Although the blood sample passes four microfluidic layers and travels through various microchannels of all kinds of dimensions, there is actually no bubble generation observed. In other words, the microfluidic component of this biochip is highly compatible for the human blood handling.
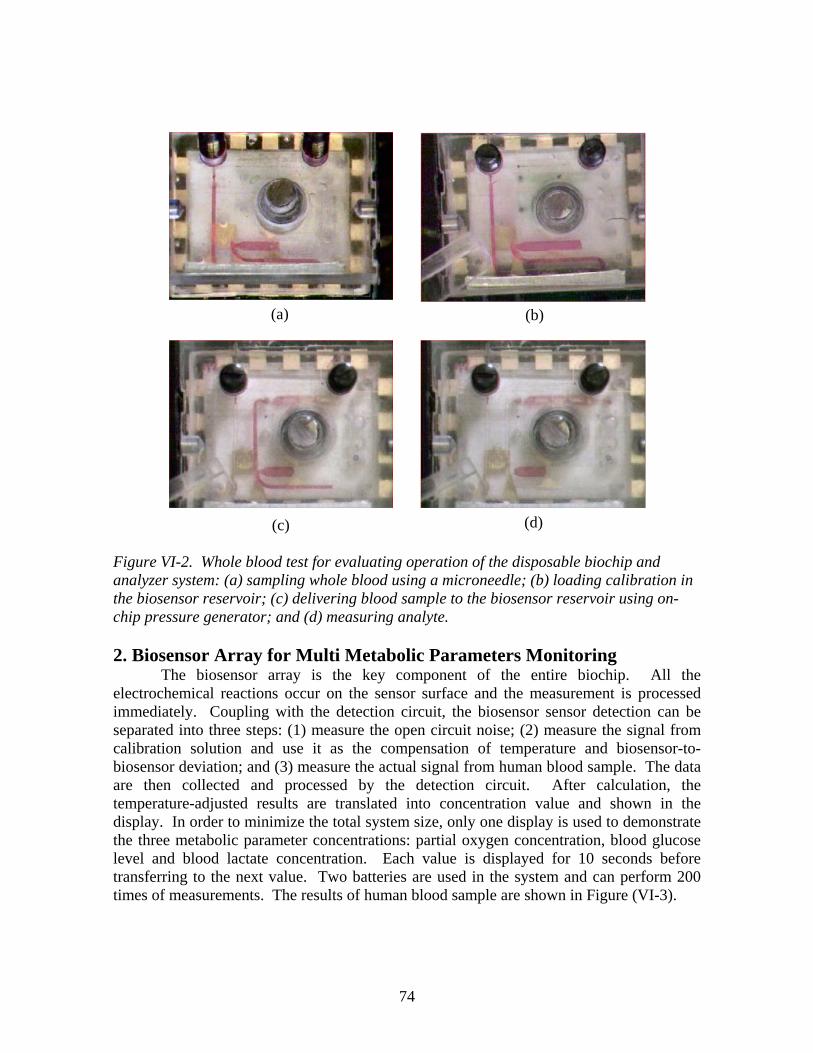
74
Figure VI-2. Whole blood test for evaluating operation of the disposable biochip and analyzer system: (a) sampling whole blood using a microneedle; (b) loading calibration in the biosensor reservoir; (c) delivering blood sample to the biosensor reservoir using on-chip pressure generator; and (d) measuring analyte. 2. Biosensor Array for Multi Metabolic Parameters Monitoring
The biosensor array is the key component of the entire biochip. All the electrochemical reactions occur on the sensor surface and the measurement is processed immediately. Coupling with the detection circuit, the biosensor sensor detection can be separated into three steps: (1) measure the open circuit noise; (2) measure the signal from calibration solution and use it as the compensation of temperature and biosensor-to-biosensor deviation; and (3) measure the actual signal from human blood sample. The data are then collected and processed by the detection circuit. After calculation, the temperature-adjusted results are translated into concentration value and shown in the display. In order to minimize the total system size, only one display is used to demonstrate the three metabolic parameter concentrations: partial oxygen concentration, blood glucose level and blood lactate concentration. Each value is displayed for 10 seconds before transferring to the next value. Two batteries are used in the system and can perform 200 times of measurements. The results of human blood sample are shown in Figure (VI-3).
(a) (b)
(c) (d)

75
Figure VI-3. Measured biochip out for different human blood samples. (a) Oxygen concentrations, (b) glucose concentrations and (c) lactate concentrations.
Blood glucose concentration (mg/dL)
Bio
chip
Out
put C
urre
nt
(nA
)
0
200
400
600
800
1000
0 100 200 300 400
0
1
2
3
4
5
0 100 200 300 400Blood oxygen concentration
(mmHg)
Bio
chip
Out
put (µA
)
0
50
100
150
200
250
300
0 2 4 6 8Blood lactate concentration (mmol/dL)
Bio
chip
Out
put (
nA)
(a)
(b)
(c)

76
VII. Conclusion
A smart disposable polymer lab-on-a-chip for clinical diagnostics and point-of-care testing, which has the sampling/identifying capability of fast and reliable measurements of metabolic parameters for human blood, has developed and characterized using the innovative, fully integrated, polymer lab-on-a-chip technologies developed from this project. Through this project, four progressive versions of the smart disposable polymer lab-on-a-chip cartridge have been designed and developed, since the problems encountered during the project require the improvement of the developed lab-on-a-chip. The final version of smart disposable polymer lab-on-a-chip has been successfully characterized by Bissell’s Physiology Laboratory (Dr. Bissell (MD) is a Co-PI of this project) in the Ohio State University. The blood sample consumed for a test was approximately 7 ul, and its total analysis time was around 100 seconds for both sample injection and sensing steps.
The microfluidic systems played a key role in the project. Major aspects of the microfluidic systems were to control the fluidics delivery from sampling/storing location to sensing chambers. To realize these microfluidic functions, all microfluidic components such as passive microvalves, microchannels, reservoirs and sPROMs have been realized on polymer substrates and fully characterized. In addition, related microfluidic technologies also have been developed such as wafer-to-wafer or device-to-wafer bonding techniques and microfluidic interconnection techniques. Several prototype microfluidic devices have been designed and developed to verify their capabilities. Consideration on integration issues and biochemical compatibility issues has been extensively explored to achieve the project goal.
Another critical element of the biochip is the on-chip air-bursting or nitrogen propellant detonator. The air-bursting detonator uses pressurized gas, which is compressed and stored in a chamber capped with a thin membrane. On the other hand, chemical propellants, such as AIBN has been screen-printed on the microheater. The applied current heated up the material to a certain temperature and nitrogen gas was released during the disassociation of the chemical propellants. Low power consumption is guaranteed, since only pulsed power is used to burst the pressurized gas. This eliminates the use of complex micropumps as well as bulky batteries required to provide energy in pump manipulation. The use of a smart passive microfluidic control system with an on-chip power source allows for the development of fully integrated, yet low-cost disposable biochips.
The basic concept of the biosensors was based on the amperometric detection principle. Partial oxygen level (PO2), glucose and lactate concentrations were measured in human blood sample. Compared with commercial available biosensors in clinical usage, the developed biosensor array exhibits many advantages such as disposable material, compact size, rapid detection, temperature insensitivity, etc. Many micromachining techniques have been developed or modified in order to realize the fabrication of the biosensor array. Those new techniques include spray-coating, screen-printing, UV-adhesive bonding, etc. The sensitivity of the biosensor has been enhanced with specially designed a microelectrodes configuration and electronic control.

77
The integrated blood analyzer system combines a smart biochip cartridge, interface socket, and ASIC electronic/control circuit. The entire custom-designed analyzing system is capable for simultaneously measuring multiple analytes in human blood. In the meantime, each acquired data is processed by the system and translated into concentrations. Such a device is ideal for clinical diagnostics and point-of-care testing tasks, since the complete system was finalized at a size of potable hand-held type.
The disposable smart biochip platform, which has been developed in this project, can be expanded to various applications of biotechnologies and clinical diagnostics.

78
VIII. APPENDICES
Over 50 proceeding and journal papers were published from the project. They are listed in Appendix A.
5 Ph.D and 5 Master degrees have been awarded for the topics related to the project, and most of them had been fully or partially supported from the project. They are listed in Appendix B and all abstracts from doctoral theses are attached. Appendix A: List of Publications from the Project
1. C. H. Ahn, J. -W. Choi, G. Beaucage, J. Nevin, J. -B. Lee, A. Puntambekar, and J,
Y. Lee, "Disposable Smart Lab on a Chip for Point-of-Care Clinical Diagnostics" (Invited Paper), Proceedings of the IEEE, Special Issue on Biomedical Applications for MEMS and Microfluidics, Vol. 92, pp. 154 - 173, 2004.
2. C. –C. Hong, J. –W. Choi, and C. H. Ahn, "A Novel In-Plane Passive Microfluidic
Mixer With Modified Tesla Structures," Lab on a Chip, 2004, volume 4, issue 2, pp.109-113.
3. K. Kim, D. S. Park, H. Lu, W. Che, K. Kim, J-B. Lee, and C. H. Ahn, “A tapered hollow metallic microneedle array using backside exposure of SU-8,” Journal of Micromechanics and Microengineering, vol. 14, no. 4, pp. 597-603, April 2004.
4. C. -C. Hong, S. Murugesan, S. Kim, G. Beaucage, J. -W. Choi and C. H. Ahn, "A
Functional On-Chip Pressure Generator Using Solid Chemical Propellant for Disposable Lab-on-a-Chip," Lab. Chip., 3, pp. 281 - 286, 2003.
5. A. Puntambekar, J.-W. Choi, C. H. Ahn, S. Kim, and V. B. Makhijani, "Fixed-
Volume Metering Microdispenser Module," Lab on a Chip, Vol. 2, Issue 4, pp. 213-218, 2002.
6. A. Puntambeker and C. H. Ahn, "Self-aligning Microfluidic Interconnects for
Glass and Plastic Based Microfluidic Systems," Journal of Micromechanics and Microengineering (JMM), Vol. 12, No. 1, pp. 35-40, 2002.
7. K. Kim, S. W. Park, J-B. Lee, H. Manohara, Y. Desta, M. Murphy, and C. H. Ahn,
“Rapid replication of polymeric and metallic high aspect ratio microstructures using PDMS and LIGA technology,” Microsystem Technologies, vol. 9, no. 1-2, pp. 5~10, November 2002.
8. A. Puntambekar, X. Zhu, R. Cole and C. H. Ahn, "Integration of Metallic
Microneedles with Disposable Biochips for Minimally Invasive Blood Sampling," Proceedings of the 7th International Conference on Micro Total Analysis Systems

79
(micro-TAS 2003), California, USA, October 5-9, 2003, p.599-602.
9. C. Gao, X. Zhu, M. Dutta, S. Chilukuru, J. H. Nevin, J.-W. Choi and C. H. Ahn, "Development of Inexpensive Biosensor Array for Point-of-Care Testing," Proceedings of the 7th International Conference on Micro Total Analysis Systems (micro-TAS 2003), California, USA, October 5-9, 2003, p.797-800.
10. X. Zhu, C. Gao, J. Kai, J, Do, J.-W. Choi and C. H. Ahn, "A novel Dynamic
Electrochemical Transduction Mechanism for Low Concentration Analyte Detection," Proceedings of the 7th International Conference on Micro Total Analysis Systems (micro-TAS 2003), California, USA, October 5-9, 2003, p.801-804.
11. A. Puntambekar and C.H. Ahn, "A novel Microdispenser Array for Accurate Off-
Chip Dispensing for Microarray Applications," Proceedings of the 7th International Conference on Micro Total Analysis Systems (micro-TAS 2003), California, USA, October 5-9, 2003, p. 975-978.
12. J. Kai, Y. S. Sohn and C. H. Ahn, "Protein Microarray on Cyclic Olefin Copolymer
(COC) for Disposable Protein Lab-on-a-Chip," Proceedings of the 7th International Conference on Micro Total Analysis Systems (micro-TAS 2003), California, USA, October 5-9, 2003, p.1101-1104.
13. J. Han, S. H. Lee, A. Puntambekar, S. Murugesan, J.-W. Choi, G. Beaucage and C.
H. Ahn, "UV Adhesive Bonding Techniques at Room Temperature for Plastic Lab-on-a-Chip," Proceedings of the 7th International Conference on Micro Total Analysis Systems (micro-TAS 2003), California, USA, October 5-9, 2003, pp.1113-1116.
14. A. Puntambekar, C. Hong, C. Gao, X. Zhu, R. Trichur, J. Han, S. H. Lee, J. Kai, J.
Do, R. Rong, S. Chilukuru, M. Dutta, L. Ramasamy, S. Murugesan, R. Cole, J. Nevin, G. Beaucage, J. B. Lee, J. Y. Lee, M. Bissell, J.-W. Choi and C. H. Ahn, "Smart Disposable Plastic Lab-on-a-Chip for Point-of-Care-Testing (POCT)," Proceedings of the 7th International Conference on Micro Total Analysis Systems (micro-TAS 2003), California, USA, October 5-9, 2003, pp.1291-1294.
15. A. Jain, A. Puntambekar and C. H. Ahn, "A novel Bioparticle Separation
Technique Using Sequential Pressure Pulses," Proceedings of the 7th International Conference on Micro Total Analysis Systems (micro-TAS 2003), California, USA, October 5-9, 2003, p.1017-1020.
16. R. Rong, J.-W. Choi, and C. H. Ahn, "A Functional Magnetic Bead or Biocell
Sorter Using Fully Integrated Magnetic Micro/Nano Tips," Proceedings of the 16th IEEE MEMS Workshop (MEMS '03), Kyoto, Japan, Jan 19-23, 2003, pp. 530-533.

80
17. A. Bedekar, S. Krishnamoorthy, A. Puntambekar, J.-W. Choi, C.H. Ahn, “System-
Level Design Analysis of Disposable Smart Plastic Biochips For Clinical Diagnostic Applications”, LabAutomation2003, Palm Springs, CA, 2003.
18. J.-W. Choi, A. Puntambekar, C.-C. Hong, C. Gao, X. Zhu, R. Trichur, J. Han, S.
Chilukuru, M. Dutta, S. Murugesan, S. Kim, Y.-S. Sohn, J. H. Nevin, G. Beaucage, J.-B. Lee, J. Y. Lee, M. G. Bissell, and C. H. Ahn, "A Disposable Plastic Biochip Cartridge with On-Chip Power Sources for Blood Analysis," Proceedings of the 16th IEEE MEMS Workshop (MEMS '03), Kyoto, Japan, January 19-23, 2003, pp. 447-450.
19. C.-C. Hong, S. Murugesan, S. Kim, G. Beaucage, J.-W. Choi, and C. H. Ahn, "A
Functional On-Chip Pressure Generator Using Solid Chemical Propellant for Disposable Lab-on-a-Chip," Proceedings of the 16th IEEE MEMS Workshop (MEMS '03), Kyoto, Japan, January 19-23, 2003, pp. 16-19.
20. C.-C. Hong, J.-W. Choi, and C. H. Ahn, "A Disposable On-Chip Air Detonator for
Driving Fluids on Point-of-Care Systems," Proceedings of the 6th International Conference on Micro Total Analysis Systems (micro-TAS 2002), Nara, Japan, November 3-7, 2002, pp. 949-951.
21. C. Gao, H. L. R. Rilo, J.-W. Choi, and C. H. Ahn, "A Microfluidic Biosystem for
Metabolic Monitoring of Human Islet Cells with Integrated Biosensors," Proceedings of the 6th International Conference on Micro Total Analysis Systems (micro-TAS 2002), Nara, Japan, November 3-7, 2002, pp. 787-789.
22. R. Trichur, S. Kim, S. H. Lee, Y. A. Abdelaziez, D. E. Starkey, H. B. Halsall, W. R.
Heineman, and C. H. Ahn, "A New Plastic CE Chip with Wide Optical Clarity Using Cyclic Olefin Copolymers (COC)," Proceedings of the 6th International Conference on Micro Total Analysis Systems (micro-TAS 2002), Nara, Japan, November 3-7, 2002, pp. 560-562.
23. A. Puntambekar, S. Murugesan, R. Trichur, H. J. Cho, S. Kim, J.-W. Choi, G.
Beaucage, and C. H. Ahn, "Effect of Surface Modification on Thermo-Plastic Fusion Bonding for 3-D Microfluidics," Proceedings of the 6th International Conference on Micro Total Analysis Systems (micro-TAS 2002), Nara, Japan, November 3-7, 2002, pp. 425-427.
24. A. Puntambekar, R. Trichur, J.-W. Choi, and C. H. Ahn, "3-D Microfluidic
Networks for Combinatorial Chemistry," Proceedings of the 6th International Conference on Micro Total Analysis Systems (micro-TAS 2002), Nara, Japan, November 3-7, 2002, pp. 422-424.
81
25. S. Krishnamoorthy, B. Prabhakarpandian, A. Bedekar, S. Sundaram, A. Puntambekar, J.-W. Choi, C.H. Ahn, “Microfluidic Devices for Biodiagnostic Applications”, Advanced Technology Applications for Combat Casualty Care (ATACCC) 2002 Conference, St. Pete Beach, FL, Sept 9-13, 2002.
26. S. Krishnamoorthy, J. J. Feng, and V. B. Makhijani, “Analysis of Physico-
Chemical Processes in an Amperometric Oxygen Biosensor” In: Proc. Fifth International Conference on Modeling and Simulation of Microsystems (MSM 2002), San Juan, Puerto Rico, April, 2002.
27. J. Kai, Y.-S. Sohn, and C. H. Ahn, "Study on Protein (IgG) Adsorption in Terms of
Surface Modification of Cyclic Olefin Copolymer (COC) for Protein Biochip," Proceedings of the 6th International Conference on Micro Total Analysis Systems (micro-TAS 2002), Nara, Japan, November 3-7, 2002, pp. 419-421.
28. R. Trichur, S. Kim, X. Zhu, J. W. Suk, C.-C. Hong, J.-W. Choi, and C. H. Ahn,
"Development of Plastic Microneedles for Transdermal Interfacing Using Injection Molding Techniques," Proceedings of the 6th International Conference on Micro Total Analysis Systems (micro-TAS 2002), Nara, Japan, November 3-7, 2002, pp. 395-397.
29. C. H. Ahn, J.-W. Choi, A. Puntambekar, C.-C. Hong, X. Zhu, C. Gao, R. Trichur,
S. Chilukuru, M. Dutta, S. Murugesan, S. Kim, Y.-S. Sohn, J. H. Nevin, G. Beaucage, J.-B. Lee, J. Y. Lee, and M. G. Bissell, "Disposable Biochip Cartridge for Clinical Diagnostics toward Point-of-Care Systems," Proceedings of the 6th International Conference on Micro Total Analysis Systems (micro-TAS 2002), Nara, Japan, November 3-7, 2002, pp.187-189.
30. S. Kim, R. Trichur, G. Beaucage, C. H. Ahn, and B. H. Kim, "New Plastic
Microinjection Molding Technique for Extremely Tall Plastic Structures using Remote Infrared Radiation Heating Method," Proceedings of the 10th Solid-State Sensor, Actuator and Microsystems Workshop, Hilton Head Island, SC, June 2-6, 2002, pp. 206-209.
31. C. Gao, J.-W. Choi, M. Dutta, S. Chilukuru, J. H. Nevin, J. Y. Lee, M. G. Bissell,
and C. H. Ahn, "A Fully Integrated Biosensor Array for Measurement of Metabolic Parameters in Human Blood," Proceedings of the 2nd Second Annual International IEEE-EMBS Special Topic Conference on Microtechnologies in Medicine & Biology, Madison, WI, May 2-4, 2002, pp. 223-226.
32. C. Gao, J.-W. Choi, and C. H. Ahn, "A Novel Glucose Biosensor with Gel-Based
Solid Electrolyte and Microheater Structure for Rapid Detection," Proceedings of the 7th World Congress on Biosensors, Kyoto, Japan, May 15-17, 2002, P2-3.68.

82
33. C. H. Ahn, J.-W. Choi, S. Kim, Y. S. Sohn, A. Puntambeker, S. Murugesan, G. Beaucage, and J. H. Nevin, "Disposable Smart Plastic Biochips For Clinical Diagnostics," BioMEMS Conference, Material Research Society (MRS), San Francisco, April 1-3, 2002 (Invited).
34. C. H. Ahn, S. Kim, H. J. Cho, S. Murugesan, G. Beaucage, "Surface Modification
Of Cyclic Olefinic Copolymers For Bio-Mems Microfluidic Devices," BioMEMS Conference, Material Research Society (MRS), San Francisco, April 1-3, 2002.
35. C.-C. Hong, J.-W. Choi, and C. H. Ahn, "Disposable Air-Bursting Detonator As an
Alternative On-Chip Power Source," Proceedings of the 15th IEEE MEMS Workshop (MEMS '02), Las Vegas, NV, January 20-24, 2002, pp. 240-243.
36. X. Zhu, J.-W. Choi, and C. H. Ahn, "A New Laser Micromachining Technique
Using a Mixed-Mode Ablation Approach," Proceedings of the 15th IEEE MEMS Workshop (MEMS '02), Las Vegas, NV, January 20-24, 2002, pp. 152-155.
37. V.B. Makhijani, A.J. Reich, A. Puntambekar, C.-C Hong and C. H. Ahn,
“Simulation of Flow in Structurally Programmable Microfluidic Channels”, In: Technical Proc. 4th International Conf. on Modeling and Simulation of Microsystems, Hilton Head, SC, Laudon, M and Romanowicz, B, (Eds.), Computational Publications, Cambridge, MA, pp. 266-269, 2001.
38. K. Kim, S. W. Park, J-B. Lee, H. Manohara, Y. Desta, M. Murphy, and C. H. Ahn,
“Rapid replication of polymeric and metallic high aspect ratio microstructures using PDMS and LIGA technology,” The 4th International Workshop on High Aspect Ratio Microstructure Technology, Baden-Baden, Germany, June 2001.
39. C. H. Ahn, J.-W. Choi, S. Kim, Y.-S. Sohn, G. Beaucage, and J. H. Nevin,
"Disposable Smart Microfluidic-Based Biochips for Clinical Diagnostics," Proceedings of 2001 International Semiconductor Device Research Symposium (ISDRS 2001), Washington, DC, December 5-7, 2001, pp. 427-429 (Invited).
40. C.-C. Hong, S.-M. Lee, C. H. Ahn, M. Nielsen, and K. McManus, "A Pressure-
Controlled Torsion-Type Check Microvalve", Proceedings of ASME IMECE 2001 Volume 1, New York, NY, November 11-16, 2001.
41. S. W. Park, K. S. Kim, H. Manohara, and J-B. Lee “Massive replication of polymeric high aspect ratio microstructures using PDMS casting,” in Proceedings of the SPIE 2001 Smart Electronics and MEMS, SPIE vol. 4334, pp. 271~279, Newport Beach, CA, March 2001.
42. J.-W. Choi, S. Kim, R.Trichur, H. J. Cho, A. Puntambekar, R. L. Cole, J. R.

83
Simkins, S. Murugesan, K. S. Kim, J. B. Lee, G. Beaucage, J. H. Nevin, and C. H. Ahn, "A Plastic Micro Injection Molding Technique Using Replaceable Mold-Disks for Disposable Microfluidic Systems and Biochips", Proceedings of the 5th International Conference on Micro Total Analysis Systems (micro-TAS 2001), Monterey, CA, Oct. 21-25, 2001, pp. 411-412.
43. T. R. Butt, H. Tran, J.-W. Choi, H. J. Cho and C. H. Ahn, "A Disposable Cell-
Based Biochip for Detection of Hormones and Drugs", Proceedings of the 5th International Conference on Micro Total Analysis Systems (micro-TAS 2001), Monterey, CA, 2001, Oct. 21-25, 2001, pp. 83-84.
44. A. Puntambekar, J.-W. Choi, C. H. Ahn, S. Kim, S. Bayyuk, and V. B. Makhijani,
"An Air-Driven Fluidic Multiplexer Integrated with Microdispensers," Proceedings of the 5th International Conference on Micro Total Analysis Systems (micro-TAS 2001), Monterey, CA, October 21-25, 2001, pp.78-80.
45. C.-C. Hong, J.-W. Choi, and C. H. Ahn, "A Novel In-Plane Passive Micromixer
Using Coanda Effect," Proceedings of the 5th International Conference on Micro Total Analysis Systems (micro-TAS 2001), Monterey, CA, October 21-25, 2001, pp. 31-33.
46. A. Puntambekar, H. J. Cho, C.-C. Hong, J.-W. Choi, C. H. Ahn, S. Kim, and V. B.
Makhijani, "A New Fixed-Volume Metering Microdispenser Module Based on sPROMs Technology," Technical Digest of the 11th International Conference on Solid-State Sensors and Actuators (Transducers '01), Munich, Germany, June 10-14, 2001, pp. 1240-1243.
47. K. S. Kim, S. W. Park, J.-B. Lee, and C. H. Ahn, "Polymeric and Metallic
Micromachining Techniques for BioMEMS," Tex MEMS III Conference, Dallas, TX, June 7, 2001.
48. A. Puntambekar, S. Lee, H. J. Cho, and C. H. Ahn, "On-Chip Microfluidic
Multiplexers for Biochemical Reactor and Mixers", IEEE World Congress on Biomedical Physics, Chicago, IL, 2000.
49. J.-W. Choi and C. H. Ahn, "An Active Microfluidic Mixer for Mixing of
Microparticles and Liquids," Proceedings of SPIE Conference on Microfluidic Devices and Systems III, Vol. 4177, Santa Clara, CA, September 2000, pp. 154-161.
50. C. H. Ahn, A. Puntambekar, S. M. Lee, H. J. Cho and C.-C. Hong, "Structurally
Programmable Microfluidic Systems", Proceedings of the 4th International Conference on Micro-Total Analysis Systems (u-TAS 2000), Enschede, The Netherlands, 2000, pp. 323-326.
84
51. J.-W. Choi, C.A.Wijayawardhana, N. Okulan, K. W. Oh, A. Han, S. Bhansali, V.
Govind, K. T. Schlueter, J. H. Nevin, A. J. Helmicki, W. R. Heineman, H. B. Halsall, H. T. Henderson, and C. H. Ahn, "Development of a Generic Microfluidic Subsystem toward Portable Biochemical Detection Systems", Proceedings of the 4th International Conference on Micro-Total Analysis Systems (u-TAS 2000), Enschede, The Netherlands, 2000, pp. 327-330.

85
Appendix B: List of Theses from the Project Chein-Chong Hong, (Committee Chair: Chong H. Ahn), “On-chip passive fluidic micromixer and pressure generator for disposable Lab-on-a-Chips,” Ph.D. Thesis, University of Cincinnati, 2004. Aniruddha Puntambekar, (Committee Chair: Chong H. Ahn), “Microfluidic dispensers based on structurally programmable microfluidic systems (sPROMs) and their applications for uTAS,” Ph.D. Thesis, University of Cincinnati, 2003. Suresh Murugesan, (Committee Chair: Gregory Beaucage), “In situ preparation and structure - property studies of filler particles in poly(dimethysiloxane) elastomers,” Ph.D. Thesis, University of Cincinnati, 2003. Kabseog Kim, (Committee Chair: Jeong-Bong Lee), “High aspect ratio microstructures and their applications to MEMS,” Ph.D., University of Texas, Dallas, 2004 Jin-Woo Choi (Committee Chair: Chong H. Ahn), “Magnetic Particle Separators and Integrated Biofilters for Magnetic Bead-Based Biochemical Detection System,” Ph.D. Thesis, University of Cincinnati, 2000. Phalgun Myneni, (Committee Chair: Chong H. Ahn), “Infrared based thermocycling system for microfluidic PCR biochips,” M.S. Thesis, University of Cincinnati, 2004. Alok Jain, (Committee Chair: Chong H. Ahn), “A bioparticle separation technique through microchannels using sequential pressure,” M.S. Thesis, University of Cincinnati, 2004. Shilpa Thati, (Committee Chair: Chong H. Ahn), “Rapid detection of prostate specific antigen (PSA) on a polymer lab-on-a-Chip”, M.S. Thesis, University of Cincinnati, 2004. Ramachandran K. Trichur, (Committee Chair: Chong H. Ahn), “Development of polymer MEMS structures for Lab-On-a-Chips using UV-LIGA and injection molding techniques,” M.S. Thesis, University of Cincinnati, 2003. Madhulika Dutta, (Committee Chair: Joseph H. Nevin), “Design of an integrated detection system for the characterization of a biosensor array,” M.S. Thesis, University of Cincinnati, 2003.

86
Chein-Chong Hong, (Committee Chair: Chong H. Ahn), “On-chip passive fluidic micromixer and pressure generator for disposable Lab-on-a-Chips,” Ph.D. Thesis, University of Cincinnati, 2004. Abstract Microfluidics and polymer MEMS are one of the most promising technologies to realize biochemical analysis systems on a chip with low cost, tiny fluid sample, fast chemical/biochemical reaction, and high detection accuracy capabilities. Sample processing, chemical/biochemical reaction, and sample detection are considered as the three major tasks required for lab-on-a-chips. Micropumps, microvalves and micromixers are also considered as key components in handling microfluidics in the lab-on-a-chips. There have been numerous efforts to develop on-chip active micropumps and microvalves. However, the realization of active microfluidic components in an on-chip disposable platform has been considered as one of the most difficult tasks in terms of fabrication, system integration, reliability, and cost. Consequently, the development of passive microfluidic components is a good alternative to the active components if they can provide the same level of functionality. The objective of this research is to develop a smart in-plane passive microfluidic mixer and on-chip pressure sources (e.g., air-bursting detonator or functional pressure generator using solid propellant), which are important components in realizing lab-on-a chips in a disposable platform. All of the developed microfluidic components in this field are fabricated on plastic substrates using polymer MEMS technologies. In this thesis, an innovative in-plane passive micromixer using the “Coanda effect” has been designed, simulated, fabricated and then fully characterized. Due to the simple in-plane structure of the novel micromixer explored in this work, the mixer can be easily realized and integrated with on-chip microfluidic devices or micro total analysis systems (microTAS). In addition, as alternative ways to the active micropump for generating pressure, on-chip disposable pressure generators using either micro pneumatic energy (disposable on-chip air-bursting detonator) or thermal-chemical energy (functional on-chip pressure generator) have been designed, simulated, fabricated and fully characterized. Due to their low cost, compact structure, and functional response, they are useful alternative power sources to drive fluid samples in disposable lab-on-a-chip devices, biochips, and point-of-care systems. Finally, the microfluidic approaches and devices developed in this work have been applied to the development of a smart disposable polymer lab-on-a-chip for clinical diagnostics, which has sampling and analysis capabilities for human whole blood. In this thesis, new on-chip passive fluidic micromixer and pressure generator for lab-on-a-chips have been successfully realized in a disposable platform and then applied to the smart disposable polymer lab-on-a-chips for clinical diagnostics.

87
Aniruddha Puntambekar, (Committee Chair: Chong H. Ahn), “Microfluidic dispensers based on structurally programmable microfluidic systems (sPROMs) and their applications for uTAS,” Ph.D. Thesis, University of Cincinnati, 2003 Abstract In this work, a smart passive microfluidic control system for microflow management has been designed and implemented using the "Structurally Programmable Microfluidic Systems" (sPROMs) technology. An innovative fixed-volume metering microdispenser based on sPROMs technology has been proposed and developed for highly accurate and precise dispensing in the nanoliter regime. The primary research task associated with microdispenser development is a detailed study of passive microfluidics. Various passive valve configurations were developed using simulation and experimental tools. Fluidic parameters such as dynamic contact angle were also investigated to optimize the microdispenser performance. In addition, relevant plastic micromachining techniques such as fusion bonding and plasma surface modification were developed to implement sPROMs on plastic substrates. The use of sPROMs technology allows for the development of versatile passive microfluidic manipulation systems. This is demonstrated by integrating the microdispenser and microfluidic multiplexer, where the dispensed liquid volume can be further sub-divided into equal or unequal volumes and these fluid fractions can be delivered to their intended destinations either sequentially or simultaneously. An off-chip dispenser array and microfluidic systems for disposable biochips have also been developed as applications for this technology. The off-chip dispenser, based on the same high-accuracy dispensing principles, is suitable for massively parallel dispensing, using very few actuation sources as compared to the number of dispensing channels. The sPROMs technology has also been applied for the development of a disposable, smart plastic Lab-on-a-Chip, which has the sampling and analysis capabilities of blood. Most of the liquid handling on the biochip is based on the principles of sPROMs. In summary, a novel sPROMs technology has been proposed and realized for smart control of liquid position in a Lab-on-a-Chip. Then, a novel microdispenser using the sPROMs technology has been designed, fabricated and successfully characterized. This technology is well-suited to dispensing of ultra-small fluid volumes with very high accuracy. The dispensed liquid volume can then be further manipulated using microfluidic multiplexers allowing for great flexibility in microfluidic design. An array of off-chip dispensers and a low-cost, disposable biochip have been successfully developed and characterized to demonstrate practical applications of sPROMs technology.
88
Suresh Murugesan, (Committee Chair: Gregory Beaucage), “In situ preparation and structure - property studies of filler particles in poly(dimethysiloxane) elastomers,” Ph.D. Thesis. University of Cincinnati, 2003. Abstract Poly(dimethylsiloxane) (PDMS) is a versatile silicone polymer studied very extensively for various applications. However, because of its mechanical weakness, it is filled with many different filler particles including SiO2, TiO2 and ZrO2. In the present research work, some specialty filler particles were generated by in-situ sol-gel method in PDMS networks. These composites were studied for their structure-property effects in relevance to their transparency, magnetic, electrical and mechanical properties. Structure-property and kinetic studies were performed on TiO2 and ZrO2 filled PDMS composites. Hydrolysis and condensation process was controlled by selecting alkoxides, with longer chain length and bulky side groups (titanium-2-ethyl hexoxide and zirconium butoxide). SAXS, SEM, Instron was used for characterizing these composites. Fe2O3 particles with different shapes and sizes were generated in-situ in PDMS networks using aqueous solutions of FeCl3 and HCl. Non-aqueous method and ferric acetylacetonate [Fe(acac)] however yielded higher amounts of filler. Magnetic and mechanical properties were studied using vibrating sampling magnetometer (VSM) and Instron respectively. Attenuated Total Reflectance (ATR), SEM and EDS. was used to determine the structure, shape and composition of the composite. Polyaniline (PANI) was generated in-situ from monomer aniline, by chemical oxidation in PDMS networks. The effects of temperature, dopant and oxidant were also studied. The structures of the PANIs were studied using ATR. Conductivity was measured using a four-point probe. Conductivity of this composite depends on the degree of oxidation and doping of the generated PANI. A novel approach along with a structure-property study for ZrO2 and TiO2 filled PDMS was performed. A small amount of a stannous compound mixed in alkoxide, dramatically reduced the time for particle generation. The composites were transparent, with ZrO2 filled having higher transparency than TiO2. SAXS data showed a correlation between the particles. Surface of an injection molded microfluidic component made from cyclic olefinic copolymers (COC) was modified in order to change the surface properties applicable to bio-fluidic devices. Plasma treatments and ASG (aerosol gel) coating were used to achieve the surface modifications. Structural changes after the plasma treatments were examined by ATR spectroscopy. Contact angle measurements with water were used as a measure of hydrophobicity.

89
Kabseog Kim, (Committee Chair: Jeong-Bong Lee), “High aspect ratio microstructures and their applications to MEMS,” Ph.D., University of Texas, Dallas, 2004.
Abstract High aspect ratio microstructures (HARMs) fabrication techniques are of interest to the MEMS and nanofabrication research community since they have a potential to provide MEMS devices with increased structural rigidity, lower driving voltage, higher actuation force, and larger displacement in electrostatic actuator systems by increasing the change of overlapped electrode area, higher sensitivity for MEMS sensors by virtue of large mass, especially in inertial sensor applications, and larger magnetic forces for magnetic MEMS due to the increase in volume. In this thesis, two of the most common HARMs fabrication techniques, the LIGA and UV-LIGA processes, have been further optimized and used to develop the novel fabrication processes and applied to develop the demonstrating MEMS devices. A novel polymeric and metallic HARMs replication and reproduction process has been developed. A hollow metallic microneedle array based on a novel fabrication process was fabricated and characterized. Various types of metallic microgrippers were also designed, fabricated, and characterized.

90
Jin-Woo Choi (Committee Chair: Chong H. Ahn), “Magnetic Particle Separators and Integrated Biofilters for Magnetic Bead-Based Biochemical Detection System,” Ph.D. Thesis, University of Cincinnati, 2000. Abstract In this work, new micromachined magnetic particle separators and integrated biofilters have been proposed, developed, and successfully characterized for integrated magnetic bead-based biochemical detection system. Physical behavior of magnetic particles has been investigated to understand dynamic monitoring of magnetic bead separation. In addition, magnetic separation force on the magnetic beads has been simulated by analytical and numerical method to maximize performances. Developed magnetic particle separators and biofilters have been fully characterized for both dynamic monitoring capability of magnetic bead separation and biofiltering performance. The developed biofilters and biosensors have been integrated with microfluidic system to realize an integrated microfluidic biochemical detection system for fast and small volume immunoassays using magnetic beads, which are used for both immobilization surfaces and bio-molecule carriers. Magnetic bead-based immunoassay, as a typical example of biochemical detection and analysis, has been performed on the integrated microfluidic biochemical detection system that includes a surface-mountable biofilter and immunosensor. From the immunoassay performed with the biochemical detection system, 50 ng/ml of sample concentration (e.g., mouse IgG) has been successfully detected and analyzed. Total analysis time required for the full immunoassay was less than 20 minutes including sample incubation time and sample volume wasted was less than 10 �l during one immunoassay. Protein sampling capability has been also demonstrated by capturing target antigens. The methodology and system, which has been developed in this work, can be also applied to generic bio-molecule detection and analysis systems by replacing antibody/antigen with appropriate bio receptors/reagents such as DNA fragments or oligonucleotides, which will be useful for DNA analysis and high throughput protein analysis.

91
Phalgun Myneni, (Committee Chair: Chong H. Ahn), “Infrared based thermocycling system for microfluidic PCR biochips,” M.S. Thesis University of Cincinnati, 2004. Abstract A portable thermocycler for polymerase chain reaction (PCR) using an infrared-based heating method has been developed and applied for the DNA amplification in polymer biochips. In the thermocycler, an infrared lamp as a heating source and a thermocouple as a temperature sensor have been adopted. This experiment has evolved a precise temperature control system without the use of an on-chip integrated temperature sensor or heater, which allows us further flexible design of lab-on-a-chips in low cost. A plastic microchip has added advantage of low cost batch fabrication techniques, but its PCR has been considered as one of the difficult tasks due to its low heat transfer coefficient. The microchip is fabricated using Cyclic-Olefin Copolymer (COC) and Polycarbonate (PC) material. To prevent protein adsorption in the channels, Bovine Serum Albumin (BSA) is used in the reaction mixture. This method for DNA amplification shows reasonably good results for PCR in PC chips.
92
Alok Jain, (Committee Chair: Chong H. Ahn), “A bioparticle separation technique through microchannels using sequential pressure,” M.S. Thesis, University of Cincinnati, 2004. Abstract In this work, an on-chip magnetic bead separator in an aqueous solution has been implemented on a plastic substrate. The technique has been successfully characterized in separating magnetic microspheres of 4.1 æm diameter from a suspension solution in DI water. uTAS (Micro Total Analysis System) frequently need to deal with bioparticle suspensions in solution. Separation of certain bioparticles is often desirable. Traditionally, methods like physical filtration have been used to separate biomolecules from suspension solutions. These methods, though well-established are not suited for integration on to mass-fabricated plastic lab-on-a-chip devices. The method developed in this work relies on the differential force exerted by application of high amplitude, short duration pressure pulses on a suspension solution, resulting in separation of suspended particles. From a dispensed volume of 500 nl of the suspension solution, up to 300 nl, or 60 % of volume has been cleared of particles.
93
Shilpa Thati, (Committee Chair: Chong H. Ahn), “Rapid detection of prostate specific antigen (PSA) on a polymer lab-on-a-Chip”, M.S. Thesis, University of Cincinnati, 2004. Abstract In this work, a disposable protein biochip on a Cyclic-Olefin Copolymer (COC), which can be used for fast and easy detection of prostate specific antigen (PSA), has been designed and fabricated, and the method of detection of PSA varying within the concentration range of 4 ng to 200 ng has been successfully characterized with the help of this biochip. Traditionally prostate cancer is diagnosed by performing Digital Rectal Examination (DRE) or testing the PSA level in blood. The PSA levels in blood can be tested by various methods. But sample volume, time taken to get the results and contaminations are various problems in these methods. Numerous efforts have been made to detect the level of PSA at a micro scale, but most devices reported take 3 to 4 hours to give results and are very difficult to fabricate. So, in this research, a new approach with lab-on-a-chip has been developed which deals with all the above problems. The method developed in this work relies on the specificity of antibody-antigen interaction on polymer lab-on-a-chip. Sandwich immunoassay technique has been used, where the antigen to be detected is sandwiched between a primary and secondary antibody. This complex is then detected with the help of chemiluminescence. So a contamination free (due to the specificity of binding between an antigen and antibody), faster and cheaper detection of PSA has been successfully achieved. Disposable polymer lab-on-a-chips and low sample volume are added advantages in this method.

94
Ramachandran K. Trichur, (Committee Chair: Chong H. Ahn), “Development of polymer MEMS structures for Lab-On-a-Chips using UV-LIGA and injection molding techniques,” M.S, Thesis, University of Cincinnati, 2003 Abstract In this work, new polymer MEMS technology has been developed and characterized for the development of disposable microfluidic devices and lab-on-a-chips on plastic substrates. The developed technology will allow numerous applications for disposable biochips and polymer microstructures at low cost. Microfluidics has been applied for drug discovery, genomics, proteomics, clinical diagnostics, etc. So far, silicon and glass have been the two major substrate materials for the fabrication of lab-on-a-chips and microfluidic devices. The disadvantages of these substrate materials are relatively high cost compared with plastic substrates, and difficulty of mass manufacturable approaches in low-cost for the fabrication of the microfluidic devices. But for the development of low cost disposable lab-on-a-chips, novel microfabrication methods for microfluidic devices on substrates other than silicon and glass are highly desirable. Commercialization of microfluidics technology also requires low-cost and high volume fabrication methods of these microfluidic devices. Polymers are one of the good alternative substrates at low cost and their mass fabrication methods have already been established for macro polymer structures. Nickel electroplating technique has been developed for the fabrication of the master mold structure for replication of the plastic microfluidic devices. Injection molding and hot embossing techniques have been explored and optimized for high fidelity replication of the microstructures. UV LIGA technology (UV based lithography, electroplating and replication) has been adopted for manufacturing the microfluidic devices. UV lithography was done using thick photoresist (SU 8 2000 series), and the process was optimized for production of thick structures with aspect ratios of up to 10. A new polymer, cyclic olefin copolymer (COC) was extensively characterized in this work for the development of plastic microstructures using injection molding and hot embossing. Polycarbonate (PC) and polymethyl methacrylate (PMMA) were also characterized using the replication techniques. Plastic micro needles and micro capillary electrophoresis chips were fabricated and characterized using the developed polymer MEMS technologies. In this work, new polymer MEMS technologies for the development of polymer microstructures have been successfully developed and characterized, which will allow the realization of disposable BioMEMS and lab-on-a-chips on polymer or plastic substrates.
95
Madhulika Dutta, (Committee Chair: Chong H. Ahn), “Design of an integrated detection system for the characterization of a biosensor array,” M.S. Thesis, University of Cincinnati, 2003 Abstract The need for immediate health monitoring, arising in situations like war or emergency call for the development of devices that do instant clinical screening to determine the levels of metabolic parameters in human blood. The University of Cincinnati-DARPA team has been working on the development of such a system, a wrist-watch type blood analyzer for clinical analysis. The key specification of such a system would be its portability apart from high precision, low power consumption and low noise. A multi-layered surface mount technology board was developed and tested with a biosensor array. However, to attain the goal of wrist6watch size analyzer Application Specific Integrated Circuits (ASIC) were developed so as to take advantage of chip-scale integrable technologies that could be used to decrease the size of the board even further. This work focuses on development of specialized detection systems for the analyzer. The systems use the principle of amperometric measurement to detect these parameters in a sample fluid. This detection system has been designed into an analog ASIC. This ASIC has been realized in an AMI-ABN 1.5æm Bi-CMOS process using MOSIS Foundry service. The ASIC has been simulated and tested for relevant environmental conditions and the design information and the results presented.


![NeoPHOX a structurally tunable ligand system for ... · PDF fileNeoPHOX – a structurally tunable ligand ... [4-12]. One of the major areas of application ... NeoPHOX a structurally](https://static.fdocuments.net/doc/165x107/5aba21307f8b9af27d8b514a/neophox-a-structurally-tunable-ligand-system-for-a-structurally-tunable.jpg)


