
Integrated information system on the labor market in the ... · based on RAIS’ data 2006 and...
66
INTEGRATED INFORMATION SYSTEM ON THE LABOR MARKET IN THE TOURISM SECTOR - SIMT Roberto Aricó Zamboni Alfonso Rodriguez Árias Collaborator Margarida H. Pinto Coelho March 2009
Transcript of Integrated information system on the labor market in the ... · based on RAIS’ data 2006 and...
INTEGRATED INFORMATION SYSTEM ON THE
LABOR MARKET IN THE TOURISM SECTOR - SIMT
Roberto Aricó Zamboni Alfonso Rodriguez Árias
Collaborator Margarida H. Pinto Coelho
March 2009

2
INDEX
1 Introduction
2 Integrated Information System on the Labor Market in the Tourism Sector -
SIMT
2.1 Goals
2.2 Diagnosis of sources
2.3 Contents
3 Research methodology to investigate tourist demand participation coefficients
(ratios) in Tourism Characteristical Activities - TCAs
3.1 Data source for the definition of the universe and selection and identification of samples
3.2 Definition of the research universe
3.3 Selection of company place sample and sampling model adopted
3.4 Data survey
3.5 Summary of results obtained through telemarketing
3.6 Review of weights corresponding to respondent units
3.7 Blank answers
3.8 Estimation of Service Coefficients
3.9 Criterion for dissemination of service coefficients
4 Comments on the direct measurement of employment through the use of tourist
demand coefficients built by direct consultation to company places
5 Preparation of monthly estimates of employment in tourism, based on RAIS’
data
5.1 Calculation of correction factors for the tourist service coefficient
5.2 Building monthly employment series
5.3 Details on the construction of state employment series, breakdown by TTA groups
5.4 Calculation of monthly estimates of employment in tourism
6 Preparation of monthly estimates of employment in tourism, based on CAGED’s
data
6.1 The CAGED
6.2 Preparation of CAGED’s data 2007
6.3 Adjustments in CAGED’s admissions and dismissals data to make them compatible with
those estimated by RAIS’ data
6.4 Special situations
6.5 Comments on the value of correction factors for RAIS/CAGED-2006
6.6 Preparation of monthly estimates of employment in tourism, after latest RAIS

3
7 Preparation of monthly estimates of informal occupation in tourism, based on
PNAD’s data
7.1 Comments on the PNAD
7.2 Specification of PNAD’s variables and categories used in the preparation of estimates of
informal occupation in tourism
7.3 Preparation of yearly estimates of informal occupation in tourism
8 Review of criteria for dissemination of informal occupation estimates
9 Some results obtained from estimates on formal and informal occupation in the
tourism sector
Bibliographic References
Appendix - Main secondary sources used in the research

4
1. INTRODUCTION
The System of Tourism Statistics in Brazil relies on two initiatives to measure the
socioeconomic relevance of tourism. One is developed by IBGE and the other by Ipea.
These are complementary initiatives, since they address the same situation from
different perspectives, but using similar parameters, especially with regard to ILO’s
recommendations on the cut-off of activities to be considered in the preparation of the
Tourism Satellite Account.
IBGE produces the Brazilian Tourism Satellite Account, in a process encompassing
macroeconomic aggregates for Tourism Characteristical Activities - TCAs, such as
value added, number of jobs, total earnings paid, and household consumption of typical
tourism products. It constitutes a set of structural information on a yearly basis.
The Integrated Information System on the Labor Market in the Tourism Sector - SIMT,
implemented by IPEA with the support of the Ministry of Tourism, offers basic
statistics and indicators on the importance and evolution of the sector to subsidize
public policies in tourism. Since it combines primary and secondary sources, especially
administrative records of the Ministry of Labor, its estimates allow the general
monitoring of the number of people working in seven Tourism Characteristical
Activities - TCAs, for the country, its regions and states. Moreover, the administrative
records allow for the knowledge of key demographic (gender, age, schooling) and
occupational attributes of the labor force in TCAs (income, size of company places,
length of service, occupation).
Firstly, this document provides an overview of SIMT, its objectives and contents. Then
presents a description of the methodologies used in the preparation of estimates, and,
finally, presents key results for sector officials, especially those responsible for the
National Plan for Tourism. The document also contains, in the shape of an appendix, a
brief description of the secondary data sources used in the preparation of occupational
estimates.

5
2 INTEGRATED INFORMATION SYSTEM ON THE LABOR MARKET IN
THE TOURISM SECTOR - SIMT
2.1 GOALS
In general, the set of surveys that make up the Integrated Information System on the
Labor Market in the Tourism Sector - SIMT, aims to provide, systematically,
government and society with information related to the scale and profile of occupations
in seven Tourism Characteristical Activities - TCAs: accommodation, food,
transportation, travel agencies, transportation rental, auxiliary transportation, and culture
and leisure.
SIMT provides inputs for the formulation and monitoring of public policies for tourism,
particularly, the National Plan for Tourism. Therefore, one sought to identify within the
Ministry of Tourism, the most relevant questions for sector1 officials in terms of
employment. A list is set out below with the main aspects of occupation in the sector
that are of interest to the Ministry:
a) scale of the supply of formal and informal working labor force in TCAs;
b) yearly and monthly evolution of supply of working labor force;
c) composition of the supply, in terms of formality of labor relations;
d) profile and changes that occur in this labor force (schooling, occupation, age, gender,
etc.);
e) profile of company places that employ this labor force (activity, size, etc.);
f) share of occupation in TCAs in the economy;
g) in the development of methodologies for the preparation of the estimates produced
under SIMT, there are other aspects considered relevant for those in charge tourism
policies, such as:
h) specification of activities that comprise each of the seven groups of TCAs;
i) spatial disaggregation of estimates;
j) timeliness of information.
1 Aspects of the labor force profile, such as schooling level, gender, race, for example, are useful to guide not only tourism policies, but also social programs related to them. Similarly, aspects related to company profile, such as activity, size and location, can subsidize regional policies or contribute to development strategies.
6
2.2 DIAGNOSIS OF SOURCES
Once the information needs had been identified, the potentialities and limitations of the
main data sources on labor force available in Brazil were analyzed. This analysis
encompassed the following sources: the Annual List of Social Information – RAIS and
General Registry of Employed and Unemployed Individuals - CAGED, both of the
Ministry of Labor and Employment, the National Household Sampling Survey – PNAD
and the Annual Services Survey - PAS, the two latter carried out by the Brazilian
Institute of Geography and Statistics – IBGE. An Appendix at the end of this article
features a summary of the main characteristics of the four sources mentioned above.
Table 1 below presents a view of the ability of these sources to respond to the main
themes of interest to sector entrepreneurs.
The comparison between the need for information detected in the Ministry of
Tourism/EMBRATUR and the characteristics of the sources researched – Table I –
indicated a gap in databases that could not be bridged by existing sources. This gap was
related to the absence of reliable data for the tourism ratios in TCAs. This absence
compromised the viability of minimally precise estimates on the volume of working
labor force in the tourism sector.

7
Table 1 Comparison of main secondary sources that can be used in estimates of the working labor force size and profile in TCAs
SOURCES RESEARCH
CHARACTERISTICS RAIS CAGED PNAD PAS2 RESEARCH NATURE Administrative registry Administrative registry Socioeconomic research Economic research
EXECUTING AGENCY MTE3 MTE IBGE IBGE
FREQUENCY
Annual Monthly Annual Annual
DELAY 1 year or more 45 days 1 year 2 years DATA ON SUPPLY Identification of activity CNAE4 reduced CNAE reduced CNAE reduced CNAE reduced Spatial/geographic breakdown Municipal Municipal State and Metropolitan
Regions State
Economic Unit Dimension YES YES NO YES DATA ON DEMAND Gender
YES YES YES NO
Age bracket YES YES YES NO Race/Color YES YES YES NO Schooling
YES YES YES
NO
Time in the job YES YES NO
NO
Contractual/Effective working hours
YES YES YES NO
Occupation YES YES
YES NO
Salary YES YES YES YES 13th Salary YES YES
YES YES
Other types of payments
YES YES YES
YES
Nationality YES YES YES NO Type of contract YES YES YES NO
Formal employment
YES YES YES YES
Informal employment NO NO YES NO
Overcoming this limitation was strategic for the advance of knowledge on the subject
"employment in tourism in Brazil", and allowed the construction of tourist ratios as the
first of a series of studies to be developed with a view to the implantation of the SIMT.
The priority attributed to this study is associated to the decision taken towards the use of
administrative registries of the Ministry of Labor and Employment–RAIS and CAGED-
as the most appropriate sources to assess the size, evolution and profile of the working
labor force in the tourism sector, since, as shown in Table I, they are the ones that best
contemplate information demands as regards formal labor force. Cross-reference of the
2 Annual Service Survey, carried out the Brazilian Institute of Geography and Statistics.. 3 Ministry of Labor and Employment. 4 National Classification of Economic Activities.

8
data from these administrative registries with the ratios would constitute the basis of the
SIMT.
This option was also based on the understanding that previous knowledge about formal
employment, based on RAIS data, will ensure a better approach of informal
employment, based on PNAD data, in the subsequent phase of the SIMT’s
implementation, since sources related to informal work are more limited, both as
regards possibilities of sector and spatial disaggregation of information, and concerning
the time lag in making data available.
2.3 CONTENTS
SIMT comprises studies of a methodological nature which are the basis for the
estimates produced; descriptive and analytical studies, based on the estimates prepared;
a database, with information required for the preparation of estimates and analysis of
results; statistical data (estimates and indicators) on the size and characteristics of the
labor force working in the tourism sector; and a website at IPEA’s webpage for the
dissemination of studies and statistics.
2.3.1 Studies of a methodological nature
As of 2004, a series of studies have been carried out which constitutes the
methodological basis for estimates prepared within SIMT. These studies address
potentials and limitations of the sources used, specify the variables used in estimates,
describe the procedures for calculating tourist demand coefficients and occupational
estimates, and present the estimates prepared. Among these studies, available in full in
at IPEA’s webpage, the following are highlighted:
a) Methodological proposal for the production of current indicators on the labor market
in the tourism sector by means of national coverage secondary sources - July 2004;
b) Methodology for calculation of tourist service coefficients and estimates on formal
employment in the tourism sector, based on RAIS’ data - April 2006;
9
c) Methodology and monthly estimates of formal employment in the tourism sector,
based on RAIS’ data 2006 and CAGED’s data until December 2007 - March 2008;
d) Monthly estimates of informal labor force in tourism, for Brazil, regions and states,
based on PNAD and RAIS, December 2002 - December 2006 - July 2007;
e) Characterization of the formal labor force in the tourism sector, based on RAIS’ data
2002 and 2006, and of the informal labor force, based on PNAD’s data 2002 and 2006 -
September 2008
f) Evolution of remuneration of formal labor force in the main Tourism Characteristical
Activities, for Brazil and states, January 2002 to December 2007 - October 2008;
g) Methodology for preparation of formal occupation estimates in the tourism sector in
20 tourism-generating municipalities, December 2002 to September 2008 - November
2008.
2.3.1 Analytical and descriptive studies
In addition to methodological studies, studies were prepared that describe or analyze the
results of the estimates produced by IPEA, as follows:
a) A reading of recent developments in the labor market of the tourism sector in Brazil,
based on PNAD’s and RAIS’ data - November 2003;
b) Integrated Information System on the Brazilian Labor Market in the Tourism Sector:
IPEA's experience - May 2006, in Enzo Pace papers, WTO;
c) Integrated Information System on the Labor Market in the Tourism Sector in Brazil:
the experience of IPEA - June 2007;
d) Characterization of the labor force in the formal labor market in the tourism sector -
estimates based on RAIS’ data, 2004 - June 2007;
e) Spatial distribution of occupation in the tourism sector, Brazil and regions - February
2008.

10
2.3.3. Statistics
• Basic statistics
SIMT disseminates monthly estimates on the scale of formal, informal and total
occupation in tourism, for Brazil, regions and states.
The following estimates are updated on a yearly basis:
a) Scale of formal occupation in 20 tourism-generating municipalities;
b) Characterization of formal and informal occupation in tourism, for Brazil, regions
and states;
c) Earnings from formal occupation in TCAs, for Brazil, regions and states.
• Indicators of occupation in tourism
Based on the mentioned estimates, SIMT disseminates the following indicators:
a) Relative importance of formal, informal and total occupation in TCAs, for Brazil,
regions and states;
b) Relative importance of formal, informal and total occupation for regions and states;
c) Formality of occupation in tourism, for Brazil, regions and states;
d) Evolution of occupation in TCAs, for Brazil, regions and states.
3. RESEARCH METHODOLOGY TO INVESTIGATE TOURIST DEMA ND
PARTICIPATION COEFFICIENTS (RATIOS) IN TOURISM
CHARACTERISTICAL ACTIVITIES - TCAs
The main challenge for the measurement of employment in tourism is the reconciliation
between sources of supply and demand of tourism products and services, required for
the construction of tourist demand coefficients. These coefficients reflect the proportion
of individuals working in TCAs involved in tourist service.
11
To calculate these coefficients, for each Brazilian state, in 2004/2005 IPEA carried out a
field research in around 8 thousand company places operating in seven groups of TCAs:
accommodation, food, transportation, auxiliary transportation, travel agencies,
transportation rental, and culture and leisure. The methodology used in the preparation
of the field research and treatment of results for the construction tourist demand
coefficients is described below.
3.1 DATA SOURCE FOR THE DEFINITION OF THE POPULATIO N AND FOR
SELECTION AND IDENTIFICATION OF SAMPLES
The population of establishments used for selection of the sample of establishments was
extracted from the Registry of Companies and Establishments (CEE), which is updated
on a monthly basis by the MTE to serve operational programs – especially those aimed
at inspection, such as the ones that subsidize the preparation of statistics disseminated
on an annual or monthly basis. It is a comprehensive and up-to-date registry with data
on identity, location, economic activity and size of legal and individual entities that
maintain employment bonds ruled by the Consolidation of Labor Laws (CLT) or by the
Statute of Civil Public Servants of the State (Public servant protected under specific
legislation).
The CEE is structured through four sources:
a) annual data of the most recent RAIS;
b) monthly declarations of admissions and employment terminations (voluntary and
involuntary dismissals) of employees under the CLT regime from the General Registry
of Employed and Unemployed Individuals (CAGED)
c) the most recent monthly version of the National Registry of Legal Entities (CNPJ) of
the Ministry of Finance;
d) data of the Specific Registry of INSS (CEI) of the Ministry of Social Welfare.
The decision to use the CEE as a source for the definition of the research population is
based on its degree of data updating, on its broad data content, and especially, on the
possibility of access to individualized data provided by this register to external users,
circumstances that facilitate the selection and individualization of the units that

12
compose the sample to be surveyed and the subsequent estimation process.
Nevertheless, as any another administrative register, the CEE has some problems, as for
example the units that do not answer the RAIS or CAGED, and the presence of units
that are already extinct. It is also possible to observe some inaccuracies derived from
self-declarations that occasionally reduce data quality, particularly those related to
economic activity, as well as voluntary and involuntary errors regarding location,
telephone number, etc. of units in the CEE.
3.2 DEFINITION OF THE RESEARCH POPULATION
In the definition of the research population, the CEE corresponding to the month of July
2004 was used, with the following options:
a) States of the Federation: All
b) Type of establishments: CNPJ and CEI
c) Size of the establishments: 1 or more employees
d) CNAE 95 classification – updated and aggregated into 7 TCA Groups:
1. Accommodation:
55123- Hotel establishments without a restaurant (DEACTIVATED);
55131- Hotel establishments;
55190-Other types of accommodation.
2. Food Catering:
55212- Restaurants and beverage establishments, with service;
55220- Snack bars and alike;
55239-Canteens (private food catering services);
55247-Supply of meals;
55298-Other food catering services.
3. Transport
60100- Intercity railway transportation;
60216- Railway passenger transportation, urban;
60224- Subway transportation;
60232- Road passenger transportation, regular, urban;
60240- Road passenger transportation, regular, non urban;
60259- Road passenger transportation, non-regular;

13
60291- Regular transportation in trams, funiculars, cable cars or trains;
61115- Maritime cabotage transportation;
61123- Maritime transportation - long distance;
61212- Passenger inland navigation transportation;
61220- Cargo inland navigation transportation;
61239- Urban water transportation;
62103- Air transportation, regular;
62200- Air transportation, non-regular;
4. Auxiliary Transportation Activities
63215- auxiliary land transportation activities;
63223- auxiliary water transportation activities;
63231- auxiliary air transportation activities.
5. Travel agencies
63304-Atividades of travel agencies and traveling organizers;
6. Transport Rental
71102-Car rental;
71218-Rental of other land means of transportation;
71226-Boat rental;
71234-Aircraft rental.
7. Culture and Leisure
92312- Theater and music activities and other artistic and literary activities;
92320-Management of venues; 92398-Other activities related to shows, not specified previously; 92525-Activities of museums and conservation of the historical heritage; 92533- Activities of botanical gardens, zoos, national parks; 92614- Sports activities; 92622-Other activities related to leisure.
The total of establishments included in the above-defined population reached N =
167.076 units whose distribution per States (h = 27 ) and TCA Groups (i = 7) is shown in
Table 2.

14
Table 2 Distribution of research population per Federate Unit (FU) and TCA groups
FU AccommodationFood
Catering Transport
Aux. Transport
Travel Agencies
Transport Rental
Culture and
Leisure Total
AC 44 109 31 11 11 5 28 239 AL 205 631 103 36 69 49 170 1,263 AM 129 432 224 82 61 36 124 1,088 AP 41 53 33 16 17 9 21 190 BA 1,351 3,682 967 186 389 223 863 7,661 CE 509 1,814 437 96 167 91 401 3,515 DF 167 2,229 455 55 215 45 409 3,575 ES 401 2,056 422 114 140 83 389 3,605 GO 644 1,890 621 134 168 52 576 4,085 MA 186 457 168 30 69 30 138 1,078 MG 2,290 10,717 2,237 628 635 258 2,893 19,658 MS 375 835 230 76 107 40 296 1,959 MT 406 909 273 54 82 33 213 1,970 PA 296 693 334 125 132 70 260 1,910 PB 162 649 125 31 75 31 220 1,293 PE 610 2,217 258 97 211 128 521 4,042 PI 130 400 183 30 40 13 99 895 PR 1,098 6,477 1,165 568 517 116 1,555 11,496 RJ 1,635 11,512 1,034 717 867 219 2,635 18,619 RN 354 833 247 41 96 60 213 1,844 RO 135 357 159 20 51 9 99 830 RR 21 82 25 6 9 7 16 166 RS 1,308 8,186 1,928 560 482 128 1,854 14,446 SC 1,054 5,656 742 263 316 92 1,100 9,223 SE 130 543 156 24 47 34 139 1,073 SP 4,038 31,196 3,215 3,680 1,958 504 6,223 50,814 TO 112 213 86 10 27 24 67 539 Total 17,831 94,828 15,858 7,690 6,958 2,389 21,522 167,076
Source: "Survey of Indicators of Formal Labor Force in the Tourism Sector", IPEA, 2005.
As regards this population one should point out:
a) the exclusion of units with 0 employees may have left uncounted some
establishments with employees recruited in the January-July 2004 period which,
because they did not answer the CAGED in this period, show no supply of workers in
the CEE since they were included through the use of CNPJ or CEI, or others that
declared RAIS 2003 with 0 supply. Some of these units may have admitted employees
at a later date without their registration in CAGED;
b) in the same CEE there may be units extinct in the January-July 2004 period whose
supply of employees had not been brought to zero due to not being informed through
the CAGED;
c) due to errors in the declaration of the main activity, including typing errors in the
CNAE -95 code (5 digits), some units contained in the CEE may have been
inappropriately classified within an activity, which may generate some excesses or
mistakes related to units in any of the activities;

15
d) the reading of company names and trade names of establishments related to some of
the associated activities, as the case of the non-road cargo transportation, was a
determining factor to their inclusion as TCAs when it was observed that there was
notorious presence of establishments that could also be serving people, residents or
visitors;
e) finally, it should be mentioned that in many cases, the addresses and telephone
numbers in the CEE correspond to accounting offices hired by the companies to fill out
documents such as RAIS and CAGED. This is an important reason to justify total or
partial omissions in answers in this Research and other similar ones.
3.3 SELECTION OF ESTABLISHMENT SAMPLES AND SAMPLING MODEL
ADOPTED
Beforehand, it is necessary to point out the two main options adopted in the sample
selection: first, since the study is on employment, the selection unit was the establishment
and not the company; second, the sampling design adopted strictly followed universally
accepted probabilistic practices, in order to guarantee that every establishment part of the
research population had a probability of being selected that was known and greater that
zero.
Within this methodological framework, and as a way to guarantee good quantitative and
qualitative reproduction of the research population, a model of multiple stratified
selection was chosen, implemented through the combination of three classification
variables, all of which contained within the population:
a) in the geographic scope, each State generated an explicit selection stratum (h=1.. 27).
These strata can be aggregated to the 5 natural regions (H = 1....5);
b) in the sector sphere, the strata corresponded to seven TCAs groups, according to the
definitions portrayed in the previous section (I = 1....7);
c) the third stratification criterion used in the sample selection corresponded to five
brackets of size of establishments: 1-4 employees; 5-9 employees; 10-19 employees;
20-49 employees and 50 and more employees (j = 1... 5). It should be pointed out that in
the CEE the size stratum 50 and more workers admits greater detailing: 50-99; 100-249;

16
250-499; 500-999 and 1000 and more. However, as described in the following section,
these brackets had the same sampling fraction (nhij/Nhij=1).
The combination of categories corresponding to these three criteria defines a maximum
of hij=945 selection cells which will be referred to as selection domains. A more
detailed examination of the population, however, demonstrated that 58 out of the 945
domains were empty, that is, contain no units to be selected.
3.3.1 The sample size
With this framework, the following stage comprised the definition of the size of the
sample to be selected for the research. In this sense, consideration was given to aspects
associated to the statistical precision of the technical tourism ratios, in order to
guarantee the dissemination of reliable results in the state level, detailed by Groups of
TCAs and to the budgetary and time restrictions for the execution of the Research,
taking into account that the survey would be carried out, basically, by means of
telemarketing.
Due to the limitations indicated, the sample initially proposed was in the order of
12,000 establishments to be executed in 4 months. However, in light of the sampling
errors associated to the expressive number of domains to be considered, to which one
should add high percentages of expected losses due to lack of contact, refusal or other
common reasons in this type of survey, the decision was to increase the sample size to a
total close to 16,000 establishments, whose final distribution per Federate Unit and
Activity Group is shown in Table 3. Due to this decision, the timeframe of the survey
was extended to 6 months.
Further details on the sample selection process are presented in the next section.

17
Table 3 Sample distribution per Federate Unit (FU) and groups of TCAs
FU Accommodation Food Catering Transport
Aux. Transport
Travel Agencies
Transport Rental
Culture and
Leisure Total
AC 42 48 28 11 11 5 25 170 AL 77 76 64 30 31 28 55 361 AM 70 84 101 64 46 29 47 441 AP 37 40 33 12 17 9 20 168 BA 124 135 217 95 76 63 102 812 CE 90 110 133 53 51 41 82 560 DF 92 117 84 42 67 39 107 548 ES 79 82 130 67 43 40 78 519 GO 95 87 130 47 48 31 83 521 MA 67 74 103 30 33 19 42 368 MG 112 175 333 132 90 86 159 1,087 MS 73 72 86 41 44 23 59 398 MT 72 72 103 35 34 27 48 391 PA 82 88 129 89 50 44 82 564 PB 69 73 82 29 27 17 54 351 PE 108 100 125 59 59 66 96 613 PI 71 69 87 25 20 13 37 322 PR 109 118 190 135 74 50 128 804 RJ 182 364 368 208 157 95 197 1,571 RN 91 80 86 35 37 36 61 426 RO 52 57 79 20 25 9 37 279 RR 21 36 25 6 9 7 16 120 RS 96 131 210 145 77 40 139 838 SC 100 96 150 105 63 42 121 677 SE 67 76 65 23 24 30 48 333 SP 194 579 533 386 197 198 336 2,423 TO 51 46 65 10 20 19 27 238
Total 2,323 3,085 3,739 1,934 1,430 1,106 2,286 15,903 Source: "Survey of Indicators of Formal Labor Force in the Tourism Sector ", IPEA, 2005.
3.3.2 Sampling Plan
With a view to reducing sampling errors in hij domains with larger numbers of
employees, it was initially decided to include automatically in the sample all
establishments belonging to domains with 50 and more employees. In these domains the
survey took on the characteristics of a census, which tends to prevent sampling errors in
such domains. The total of these domains, where the probability of selection of
establishments is equal to 1, was 27*7 = 189, that is, 20% of the total selection domains
defined for the research (945).
According to the results shown in Table 4, the total of establishments with 50 and more
employees reached 4,962, representing 31.2% of the total 15,903 units that had been
selected in the sample. It is estimated that these units with 50 or more employees cover
approximately 50% of the employment in the 38 TCAs that comprise the research
population.

18
Table 4 Distribution of sample per size and TCA groups
Size Accommodation Food Catering Transport
Aux. Transport
Travel Agencies
Transport Rental
Culture and
Leisure Total
1-4 320 324 319 330 312 313 322 2,240 5-9 438 430 440 433 431 386 430 2,988 10-19 405 414 406 405 405 222 409 2,666 20-49 568 550 566 461 222 124 556 3,047 50-99 401 1,038 702 159 39 41 350 2,730 100-249 150 242 588 95 16 13 172 1,276 250-499 37 50 388 33 4 4 38 554 500-999 4 24 229 11 1 3 8 280 1000 e + 0 13 101 7 0 0 1 122
Total 2,323 3,085 3,739 1,934 1,430 1,106 2,286 15,903 Source:" Survey of Indicators of Formal Labor Force in the Tourism Sector ", IPEA, 2005.
A second group of domains, pertaining to size brackets of less than 50 employees, also
went through the same process of census selection, that is, the units in these brackets
had a probability of selection equal to 1. They are domains in which the total of units
that integrate the Group-Size combination (N) was lower than 500 units.
This situation included Travel Agencies with 20-49 employees, Auxiliary Transport
Activities with 20-49 employees, and Transport Rentals with 10-19 employees, which
added a total of 994 establishments to the sample. These units which, it should be noted,
had also been automatically incorporated to the sample, are equivalent to 6.3% of the
total sample size, being distributed in 3 * 27 = 81 domains (hij), which represents
approximately 1.4% of the total employment estimated in the 38 TCAs.
The other 9,912 establishments selected in the sample, i.e., 62.3% of the total sample, are
distributed in the remaining hij = 675 domains, all of them related to units whose sizes vary
between 1 and 49 employees. In these domains, sample selection was accomplished in such
a way as to guarantee a minimum number of interviews of each TCA Group-size
combination.
The total of units selected in these smaller domains ranged from a minimum of 12
establishments, in five out of the seven TCA Groups with 1 to 4 employees, to a maximum
of 48 establishments in the Culture and Leisure Group with 20 to 49 employees.
In the non-self-selected hij domains where the total of units that compose the Population
was lower than the minimum value established for the respective TCA Group-size
19
combination, all units were selected to compose the sample. For example, in the domain
Roraima-Accommodation - 1 to 4 employees, in which the minimum number of interviews
established was 12 units, 8 establishments that compose the population of this domain were
selected. Thus, as in all cases where the hij population is lower than the minimum of
selections established for the respective TCA Group-size combination, all units were
selected with probability equal to 1.
In the remaining domains, where selection probability was lower than 1, that is,
nhij<Nhij, the identification of selected units was made through a systematic random
process, previous ordering of units that compose the respective population according to
the respective TCA, a procedure that allowed, within the hij domain, the sample to
maintain the same ratio of units that each TCA presents in the corresponding
population.
In short, the sampling practiced corresponds to a probabilistic modality with multiple
stratification, taking into consideration three classification variables: geographic
location, economic activity and size of the unit to be surveyed, with at least 6,000 of the
15,903 selected establishments having a nhij/Nhij probability equal to 1, covering more
than half of the total formal jobs estimated for the set of 38 TCAs.
3.4 DATA SURVEY
3.4.1 Modality of data survey
Due to the high cost that the direct execution of the research would involve in each unit
selected in the sample, and the lack of specialized staff in IPEA to carry out this type of
work, the survey took place through telephone calls made by a telemarketing company.
To this end, IPEA undertook to provide the list of establishments selected with
corresponding addresses, telephone numbers and email address, whenever the data were
available in the CEE register. The information was to be verified with local telephone
operators and complemented by the company in order to cover any omissions, outdated
information, or errors contained in the register.

20
It was also agreed that the data survey work would be preceded by a previous testing of
the questionnaire to be applied in 800 establishments, and at the end of this test a joint
evaluation of the results was planned, with a view to correcting procedures and making
any necessary adjustments to the instructions and questions of the research.
In the light of the pre-test results, it was agreed that the maximum number of calls to
each establishment with the correct telephone number would be 10, and that the final
deadline for the delivery of data to IPEA would be six months after the signature of the
contract with the company.
For complementation purposes, it should be made clear that the sample of 15,903
establishments supplied by IPEA featured 782 units without a telephone number, and
half of them was sized within the 1 to 4 employees bracket.
3.4.2 Contents of the data survey Questionnaire
As it was a telephone survey, IPEA decided to prepare a script with simple questions
that basically served the main purposes of the Research, namely, providing more current
data regarding the clientele and the seasonality of the services that each surveyed unit
provides to national or foreign residents or visitors.
All the questions were necessary for the calculation of tourism ratios, in addition to
others related to the use of permanent or temporary labor force in the establishment and
its qualification.
The contents of the questionnaire adopted in the data survey included the following
subjects and variables:
1. Identification of the establishment
• Name or company name;
• Complete address;
• Telephone nº;
• Fax nº;

21
2. Identification of the responding person
• Full name;
• Position or Function;
• Telephone;
• Email;
3. On the activity of the establishment (based on invoicing)
• Main Activity (11 reply categories, 7 of which correspond to the 7 TCA Groups previously defined);
• Secondary Activity, with same degree of detailing;
• Year the establishment was created;
4. Clientele and seasonality
• Months of operation, month by month in the last 12 months;
• Months of High, Mid and Low Season;
• Type of Clientele (national tourist, foreign tourist and non-tourists) preferentially served by the establishment;
• % of service per Type of clientele in each Season;
5. Labor force
• Total of employees under formal contract currently working in the establishment;
• Total of people working in permanent and temporary regime in the establishment with details according to Season;
• Cost of creation (in R$/month) of a job post, as per the floor of the category and social security charges of the most frequent administrative and productive occupations;
6. Main courses / modalities of training offered to workers
• Name of the two main courses;
• Total of trained employees;
• Hours of work;
• Institution that offers training;
• Place of training (in/out);

22
3.5 SUMMARY OF THE RESULTS OBTAINED THROUGH TELEMAR KETING
3.5.1 Global results
1. Total of establishments selected in the 38 TCAs: 15,903 2. Respondent sample units:
• Interviews carried out: 7,701 • Inactive units: 22 • Deactivated Units: 465 • Refusals: 605
Subtotal: 8,793
2. Non-respondent sample units: • Wrong telephone number: 2,011 • Not contacted afterwards 10 • Calls 4,929 • Other reasons: 170
Subtotal 7,110
These results reveal that 55.3% of the selected establishments provided some sort of
reply to the consultation, and 87.6% of them were effectively interviewed. Even though
this percentage of successful answers seems to be low, it is not very different from those
obtained in similar telemarketing surveys recently carried out by IPEA, which also used
the CEE, had national coverage and involved large, medium and small units.
Some clarifications on the unsuccessful calls should be provided:
a) the presence of inactive and deactivated units among respondents (5.5%) can be
largely attributed to CEE’s update process, the registry that provided the basis for the
definition of the population of the Research. In this Registry, the entry of new units is
always more up-to-date and thorough than the register of terminations. Units recently
created under CNPJ or CEI are incorporated into the CEE with minimum delay after the
registration date, conversely, extinct units take longer to be eliminated from the
Registry, and often go through a more complex bureaucratic process than that of
registration. In this scenario, one can often find in the CEE units that ceased to operate
or that are temporarily deactivated due to lack of evidence of their existence or because
they did not submit a declaration of termination;

23
b) refusals (7.9% of responding units) occur in many cases because respondents do
not want to provide information about the establishment over the telephone. Also,
because the contact often takes place with outsourced companies, generally accounting
consultants, and although they are responsible for filling out registers such as RAIS or
CAGED, they are not authorized to supply data about the contracting unit;
c) the number of omissions due to wrong telephone numbers or unanswered calls is
much more expressive. These omissions are closely connected to the automated
execution of the telemarketing calls and, especially, with changes of telephone numbers
that routinely occur in many fixed or mobile grids, or even due to change of address of
units contained in the CEE.
As regards these losses, one should ask whether they can affect survey results,
particularly regarding the calculation of percentages of services provided to residents
and visitors and, also, if, due to reduction of sample sizes, it would be necessary to
define an estimation process with a lower degree of detailing than that intended in the
previously described sampling plan.
The subsequent sections address these subjects. Beforehand, however, the procedures
used in the calculation of the weights of respondent units are described, taking into
consideration the above-mentioned interview losses.
3.6 REVIEW OF WEIGHTS CORRESPONDING TO RESPONDENT UNITS
First of all, it should be made clear that the differences between the percentages of
losses in hij domains should not quantitatively undermine the estimates of coefficients
at more aggregated levels (hi, ij or hj), since their calculation follows a weighting
process that uses revised weights of each selected unit (Nhij / n'hij), implicitly
guaranteeing corrections for the respective sample size losses (nhij-n'hij) within each hij
domain.
According to the sampling model proposed, each unit of the sample has a known
selection probability, whose value varies according to the domain to which it belongs.
The selection probability (or sampling fraction) corresponding to units selected in a

24
particular hij domain can be summarized through the expression phij = nhij/Nhij, with
its inverse whij = 1/phij=Nhij/nhij representing the weight or original weighting that
should be attributed to all the selected units that belong to this domain.
The use of these weights presumes, however, that all units selected in any domain
answered the research, which in fact did not happen. Thus, the reproduction of the
population through the weights of respondent units, leaving aside the weights attributed
to non-respondent establishments, would lead to significant underestimation and
distortion of this population.
Thus, it was necessary to make an adjustment in the original weights of respondent
units, considering them as those effectively interviewed, inactive and deactivated ones,
and refusals. The adjustment was based on the assumption that answer losses would
have a similar distribution to that shown by respondent units (n'hij). The adjustment of
weights was made inside each hij domain through the quotient among the units of the
respective population (Nhij) and the respondent units (n'hij). Thus, the new weights
correspond to the expression w'hij=Nhij/n'hij
Some specific steps were taken as regards these adjustments:
a) when the quotient was a whole number, each one of the four types of answer
received the same weight w'hij. However, when this quotient was a fraction, a whole
number was attributed, rounded up or down, for each respondent unit, ensuring that the
addition of the new weights was equal to the total of the population of the Nhij domain.
This procedure of correcting the weights within the hij domain was entirely random;
b) in the domains where Nhij > 0 and n'hij=0 the procedure was the following:
• in the hij domains where n'hij = 0 occurred in the extreme size brackets (first
and last), the respective Nhij were added to the populations of the next higher or lower
size domain, which forced the recalculation of the w'hij value of the domain receiving
these populations;
• in the hij domains where n'hij=0 was shown in some of the intermediate size
brackets, the criterion remained the same, and when there was doubt, the Nhij was

25
added to the population of the higher size domain, where it was also necessary to
recalculate weight.
3.7 ABSENCE OF REPLIES
The data contained in Table 5, on the totals and percentages of interviews effectively
carried out, demonstrate that, as regards establishment size, these percentages generally
increase as the unit size increases.
In fact, the percentages of units with interviews carried out at the global level, range
from a minimum of 31% in establishments with 1-4 employees, to an average of 58%,
in units with 50 or more employees.
The same behavior occurs in all TCA Groups, which is determined by the lower
availability of telephone numbers in smaller units and by the frequent moving generally
observed in these establishments.
The examination of the answers per TCA Groups reinforces the hypothesis that the lack
of telephones may have contributed to this result. It is important to highlight that in 3 of
these Groups (Food Catering, Accommodation, and Culture and Leisure), the rates of
answers in all size brackets are almost always lower than the corresponding national
average. These are precisely the activities with higher territorial de-concentration, which
hinders direct telephone contact with these units.
Although the distribution of no-reply percentages among TCA Groups are relatively
homogeneous, apparently due to their markedly random character, with little or no
incidence over the calculation of coefficients in hij aggregates, it is clear that, in many
of them, where the selected sample size was small to begin with, there was further
reduction because of no-reply. In these domains, the no-reply losses could undermine
the reliability of the respective coefficients, due to the sampling error associated to
them. Even more delicate is the situation of a few domains where Nhij>0 and nhij=0,
since this means that for this particular domain there is not even a value for this
coefficient.

26
In the light of these issues it was necessary to review the estimation process to be used
in the calculation of resident and tourist ratios and to evaluate the best way to present
these results. This is addressed in the two subsequent sections.
Table 5 Totals and % of interviews carried out per size brackets and activity groups Totals
Activity Groups
Size Accommodation Food Catering Transport Aux. Transport
Travel Agencies
Transport Rental
Culture and
Leisure Total
1-4 86 70 91 110 121 124 93 695 5-9 168 153 205 195 229 193 176 1,319 10-19 177 189 215 199 190 126 175 1,271 20-49 271 265 337 233 117 70 247 1,540 50-99 233 564 434 92 24 20 156 1,523 100-249 82 144 373 57 10 6 98 770 250-499 17 27 251 21 3 2 26 347 500-999 4 15 144 5 0 1 2 171 1000 e + 0 8 50 6 0 0 1 65 Total 1,038 1,435 2,100 918 694 542 974 7,701
Percentages Activity Groups
Size Accommodation Food Catering Transport Aux. Transport
Travel Agencies
Transport Rental
Culture and
Leisure Total
1-4 26.9 21.6 28.5 33.3 38.8 39.6 28.9 31.0 5-9 38.4 35.6 46.6 45.0 53.1 50.0 40.9 44.1 10-19 43.7 45.7 53.0 49.1 46.9 56.8 42.8 47.7 20-49 47.7 48.2 59.5 50.5 52.7 56.5 44.4 50.5 50-99 58.1 54.3 61.8 57.9 61.5 48.8 44.6 55.8 100-249 54.7 59.5 63.4 60.0 62.5 46.2 57.0 60.3 250-499 45.9 54.0 64.7 63.6 75.0 50.0 68.4 62.6 500-999 100.0 62.5 62.9 45.5 0.0 33.3 25.0 61.1 1000 e + 0.0 61.5 49.5 85.7 0.0 0.0 100.0 53.3 Total 44.7 46.5 56.2 47.5 48.5 49.0 42.6 48.4 Source: "Survey of Indicators of Formal Labor Force in the Tourism Sector ", IPEA, 2005.
3.8. DESCRIPTION OF THE TOURISM RATIOS ESTIMATION P ROCESS
3.8.1 Basic data for ratios calculation
In addition to the three classification variables, geographic area (h), TCA Groups (i),
and size of the establishments (j), obtained through the CEE for each of the units
selected in the sample, three other variables, raised by the research, were used for
coefficient calculation:
a) Months in which the establishment operated in the last 12 months;
b) Months of High, Mid and Low Season;
c) % of service per Type of clientele (1. National Tourists; 2. Foreign Tourists; and 3.
Residents) per each Season (High, Mid and Low).

27
By means of these variables, it was possible to know, for each unit (k) and each month
(m), the percentages of service per type of clientele (p1, p2 and p3).
In the preparation of these monthly percentages, occasional errors in answers or
codification / typing errors were corrected, in such a way that the addition of these
percentages, for the three types of clientele in each month, would always be 100.
However, total reply omissions related to these percentages in any month, which were
few, were not the object of any type of imputation, since in many cases these omissions
coincided with a month of the year when the establishment did not operate.
3.8.2 Ratios calculation formulas
The formula for the calculation of the tourism ratios corresponding to the hij domain in
month m, follows the expression:
hijmkw
hijmkphijmkphijmkwchijm
k
k
∑
∑ +=
'
)21('
where sub-index k identifies each respondent unit in the hij domain (k=1,2... n'hijm),
and w'hijmk represents the corrected weight of each the k units effectively interviewed
in the hij domain in month m equivalent to the weighted mean of the sum of percentages
corresponding to visitors (p1 and p2). It should be highlighted that one same respondent
unit may or may not answer in month m, which is why the value of n'hij with which the
respective coefficient is calculated can vary from month to month.
In its turn, the aggregate coefficient for the Geographic Area (h) – TCA Group (i)
composition corresponds to the weighted mean of chijm through the corresponding
sums of the weights of each one of the j sizes included in the hi composition, thus
resulting in the following expression:
∑
∑ ∗=
j
j
hijmW
chijmhijmW
chim'
'
28
where hijmW' = hijmk'wk∑
In this calculation, the aggregate coefficient chim refers to sample of size
∑=j
hij'nhi'n , which is why sampling errors are much smaller than those associated to
each one of the hij domains of this aggregate.
3.9 CRITERION ADOPTED FOR THE DISSEMINATION OF TOU RISM RATIOS
Significant losses in telephone interviews, although anticipated, deriving mainly from
the absence of contact or wrong number, in fact represented a considerable reduction in
the size of the sample. The loss of almost half of the selected sample forced the
reformulation of the criterion envisaged for the coefficient calculation that will be the
basis for the preparation of annual and monthly estimates on formal employment, as
explained in the last section of this document.
Although the sizes of the sample of many hij domains, that is, the cross-reference of the
three classification variables (geographic area, sector of activity and size of
establishments), were enough for the calculation of tourism ratios, conferring reliability
to the respective employment estimates, in other domains these sizes were insufficient
to guarantee the same quality of results. With the purpose of disseminating and using
these reliable coefficients supported by a standard methodology, two decisions were
taken as regards ratios:
a) the size variable of the establishments, although used in the calculation of the
aggregate coefficients hi, will not be considered in the dissemination of the of tourism
ratios. The differences between the average values of coefficients corresponding to the
size bracket of a same hi aggregate are, usually, less expressive than geographic or
TCAs ones, not adding analytical value if employment estimates are also classified
according to unit size;
b) despite the statistic reliability gains offered by this option, there are still hi
aggregates whose sample sizes are insufficient to guarantee quality results. In general,
they are combinations of TCA Groups and States where the populations of units are
29
smaller, resulting in small sample sizes that cause significant sampling errors for these
hi combinations. Considering this situation, the decision was to adopt more aggregated
hi coefficients through the combination of geographic units with similar characteristics
as regards geographic location and / or economic characteristics. In the definition of
these combinations, particular attention was dedicated to ensuring that the new
geographic context, for which monthly hi tourism ratios will be calculated, have a
minimum close to two hundred effective interviews in the research.
The results of the monthly tourism ratios allow the recognition of the geographic areas
where it was necessary to compose more aggregated coefficients by means of joining
two or more states. For example, instead of calculating valid regional coefficients for all
the states of the same region, as could have been done in the North region, the decision
was to join, on the one hand, the states of Rondônia, Roraima and Acre, all bordering
urban centers close to other countries; on the other hand, the states of Amazonas,
Amapá and Tocantins that do not feature these same characteristics and show economic
ties that are closer to the state of Pará.
The geographic restrictions in the final size of the sample led to the adoption of the
following aggregations to enable the dissemination of reliable tourism ratios for hi
aggregates.
1. North Region
1.1 Rondônia, Acre and Roraima 1.2 Pará 1.3 Amazonas, Amapá and Tocantins
2. Northeast Region
2.1 Maranhão and Piauí 2.2 Ceará 2.3 Rio Grande do Norte and Paraíba 2.4 Pernambuco 2.5 Alagoas and Sergipe 2.6 Bahia

30
3. Southeastern Region
3.1 Minas Gerais 3.2 Espírito Santo 3.3 Rio de Janeiro 3.4 São Paulo
4. South Region
4.1 Paraná 4.2 Santa Catarina 4.3 Rio Grande do Sul
5. Mid-West Region
5.1 Mato Grosso do Sul and Mato Grosso 5.2 Goiás 5.3 Federal District
For each one of these 19 new geographic groupings, monthly tourism ratios were
calculated, corresponding to the weighted sum of % of services provided to national and
foreign visitors, classified according to each one of the 7 TCA Groups. For illustration
purposes, Annex 1 shows the ratios calculated for December 2004.
4. COMMENTS ON THE DIRECT MEASUREMENT OF EMPLOYMENT
THROUGH THE USE OF TOURIST DEMAND COEFFICIENTS BUIL T BY
DIRECT CONSULTATION TO COMPANY PLACES
The measurement of employment in tourism can be direct or indirect. The indirect
measurement of employment, consistent with the methodology of the Tourism Satellite
Account, ensures correspondence of estimates with the aggregates of the System of
National Accounts.
This type of measurement depends on the reconciliation between sources of supply and
demand for tourism products, which in turn requires detailed knowledge of the demand.
The information offered by the Internal and External Demand Survey, still insufficiently
developed in the Brazilian system of tourism statistics, does not allow matching with
the information on supply, even if supplemented with data from other sources, such as
the Family Budget Survey carried out by IBGE.

31
On the supply side, there are fewer restrictions, due to the availability of the economic
surveys that feed the System of National Accounts, as well as the administrative records
of the Ministry of Labor and Employment, which provide detailed information on
occupation in TCAs.
Given this situation, Ipea sought for an alternative to adjust the participation of tourist
and resident consumption in company places operating in TCAs. The alternative was
the construction of tourist demand coefficients, calculated on a field research carried out
at around 8 thousand company places operating in seven groups of TCAs:
accommodation, food, transportation, auxiliary transportation, travel agencies,
transportation rental, and culture and leisure.
The questionnaires used identified the perception of company places’ managers on the
composition of their clientele, in percentages of tourists and residents, along the twelve
months of the year.
The methodology devised for the construction of these coefficients is based on some
assumptions:
- Managers have a sound perception of the proportion of tourist and resident clients.
- This proportion is seasonal, but is not subject to major structural changes in the short
term (less than five years), in aggregate geographical levels (states).
- The proportion of employees in tourist services is similar to the proportion of tourists
served.
Managers’ perception of the composition of their clientele is, no doubt, heterogeneous
among company places, and may vary between those that are more organized and carry
out systematic data survey on the market and those for which this information is not
considered relevant. This knowledge of the clientele is also different depending on the
company’s area of activity, size, and the accuracy of managers’ business vision.
Distortions in measurement can result from the subjectivity of interviewees’ perception
of the phenomenon and also from the fact that some company places surveyed operate
in more than one activity, and administrative records do not show the breakdown of the
labor force working in each activity.

32
Regarding the sustainability of coefficients, it is reasonable to assume that they can
change according to changes occurring in the national and local economic structure and
situation, and to national and international tourism trends. Changes in family
consumption habits, such as how often they eat out, also affect the structure of demand
for company places engaged in TCAs.
In any event, their use for periods of less than five years was considered acceptable,
since the composition of household expenditures, the main determinant of tourism
demand coefficients, is relatively stable over short periods, particularly in more
aggregate geographic spaces, such as states, for which coefficients are estimated.
It is believed that regular updating of these coefficients, through new field surveys, can
help mitigate the distortions pointed out, or at least identify the issues that involve the
use of this methodology.
5 PREPARATION OF MONTHLY ESTIMATES OF EMPLOYMENT IN
TOURISM, BASED ON RAIS’ DATA
The preparation of monthly estimates of employment in tourism grouped per federate
unit (h) and TCA groups (i), using the tourism ratios hi obtained by the research,
demands previous corrections in these ratios to reproduce the distribution of formal
employment in these contexts year by year. Also, it is necessary to build monthly series
of global employment (tourist and not tourist) for each hi aggregate, on which these
corrected tourism ratios will be applied. For both purposes, RAIS data are
indispensable.
5.1. CALCULATION OF CORRECTION FACTORS OF THE TOURI SM RATIOS
With a view to adjusting tourism ratios of the Research for the generation of monthly
employment estimates through the use of the RAIS, correction factors (CHix) were
calculated for each year x of RAIS. The correction factors are presented as quotients
between the average values that would have resulted from the use of the employment
distributions in RAIS on 31st December of each year as the weighting criterion of
average coefficients cHiJ obtained by the Research, and the averages that, alternatively,

33
could have been calculated with the use of weighting corresponding to the distribution
of establishments in the CEE in July 2004:
)CEE(HiJ'N/cHiJ*HiJ'N
)RAIS(HiJx''N/cHiJ*HiJx''NCHix
∑∑∑∑=
where N''HiJx represents the total employment of RAIS in the year x, and N'HiJ is the
total of establishments of CEE, while sub-indices H and J refer, respectively, to the
geographic groupings of the 5 regions (North, Northeast, Southeast, South and Mid-West)
and 3 size brackets (1-9 employees, 10-49, and 50 and more employees).
These re-groupings are due to the need to ensure greater time stability to the ratios that
will be actually used in the preparation of the employment series and, especially, to
prevent possible lack of correspondence between the results of the two sources (time lag,
answer omissions, errors in the self-declaration of economic activity, zeroed supplies), as
well as the already mentioned insufficiencies in the sizes of the Research sample, to
calculate average coefficients by means of greater detailing.
The examination of the values of CHix ratios reveals that, although in the national
average they are always slightly higher than 1, at the TCA’s level, the corrections of
tourism ratios of the Research in Groups such as Food Catering, Auxiliary to
Transports, and Culture and Leisure are much higher than 1. Conversely, in the Group
Transports these correction factors reach national values next to 0.93.
5.2 CONSTRUCTION OF THE MONTHLY EMPLOYMENT SERIES
Thanks to its high and stable coverage of formal employment throughout more than a
decade, the RAIS presents the necessary conditions for the elaboration of homogeneous
employment series related to hi aggregates; based on these series, the respective
estimates of tourist employment will be prepared.
The elaboration of these basic statistics must be subject to the observation of three
technical assumptions indispensable to guaranteeing consistency between annual and
monthly data surveyed by this source:

34
a) the acceptance of the data related to the supplies of formal employment on 31st
December published by the RAIS of each year. In this case, the difference of
employment supplies between two successive years, x and x-1, represents the
generation/loss of annual employment occurred in year x in each one of these
aggregates hi: Vhix = Ehi(x)-Ehi (x-1), where Ehi (x) and E hi (x-1) correspond to the
supplies of formal employment of the hi composition in the last day of the year x and
x-1, respectively;
b) the acceptance of the data related to the monthly admissions of formal employment
published by the same source for the same aggregates in the reference year x: Ahi(xm);
c) the adjustment of the data referring to the monthly employment terminations
informed by RAIS of year x: Dhi(xm) through factors of annual adjustment (fa)
calculated with the relation:
fahix = D'hix / Dhix = (Ahix- Vhix) / Dhix
The adjustment factors of employment terminations serve basically to balance the
omissions of answers related to discharges in the RAIS, notably, those relative to extinct
units and possible substitutions and mergers. The adjustment of the monthly
terminations, when carried out through this single annual factor fahix, allows the
maintenance of the proportionality of monthly terminations originally informed in RAIS
in year x.
The observation of the assumptions above allows assurance of equality:
)()}()({)1(12
1
xEhixmDhixmhiAxEhim
=−+− ∑=
the same one used to obtain the monthly employment series for each hi (Ehixm)
context.
35
5.3 DETAILS ON THE CONSTRUCTION OF STATE EMPLOYMENT SERIES,
BREAKDOWN BY TCA GROUPS.
The details of procedures used in the construction of formal occupation estimates, based
on RAIS data, by state, described below, is the transcript of IPEA’s research report
prepared in 2005 and refers to estimates for December 2002 to December 2004.
It should be noted that, since then, there have been no methodological changes that
affected the calculation of formal occupation estimates for subsequent periods, and
chapter 9 of this document contains more recent estimates, prepared through the same
procedures.
The monthly employment series corresponding to each hi aggregate, based on RAIS
data, were prepared covering the period December 2002 / December 2004. To this end,
the following instruments were used: the aggregate databases of that source; annually
published by the MTE in CD-ROM format, jointly with the SGT 7.0 software, made
available to users by the MTE to allow consultation of these bases.
5.3.1 Specifications used in the collection of data referring to the 31st December of
each year
a) Federate Units: All;
b) Types of establishments: CNPJ and CEI
c) Size of establishments: 1 or more employees;
d) Classification CLASSE CNAE 95- updated in 38 TCAs and 7 TCA Groups, as per
definitions presented in section 2.2 of this document;
e) Type of contract: 8 categories of CLT and 3 categories of public servant protected
under specific legislation contracts. The inclusion of the latter assumes that the few
formal ties that appear in the 38 TCAs selected in RAIS for these categories occurred
due to error of declaration or problems in characterizing establishments, since the
Tourism Characteristical Activities considered for the purposes of the preparation of
estimates are of a strictly private nature.
36
5.3.2 Specifications used in the collection of monthly data on Admissions and Discharges in RAIS in each year
a) Federate Units: All;
b) Types of establishments: CNPJ and CEI;
c) Size of establishments: 0 or more employees;
d) Classification CLASSE CNAE 95- updated in 38 TCAs and 7 TCA Groups, as
per definitions presented in section 2.2 of this document;
e) Type of contract: 8 of CLT and 3 categories of public servant protected under
specific legislation;
f) Admissions: All occurred month-by-month in each year considered;
g) Employment Terminations: All occurred month–by-month in each year
considered;
5.4 CALCULATION OF MONTHLY ESTIMATES OF EMPLOYMENT IN
TOURISM
The monthly estimates of formal tourism employment, corresponding to month m of
year x (EThixm), observe the following expression:
EThixm = Ehixm * chim * CHix
where Ehixm is the estimate of Employment (tourist and non-tourist) of the hi aggregate
prepared for month m in year x through the RAIS, applying the procedures described
above; chim refers to the tourism ratio specific of this same hi aggregate for month m
based on the research, and CHix is the corresponding annual correction factor of these
coefficients.
6. PREPARATION OF MONTHLY ESTIMATES OF EMPLOYMENT I N
TOURISM, BASED ON CAGED’S DATA
The main limitation of formal occupation estimates compiled with RAIS’ data is the
fact that data from this source are made available by the Ministry of Labor and
Employment with a delay of more than eleven months. This restricts their use for
37
monitoring the situation of occupation in TCAs, required especially by public policy
managers.
In order to overcome this limitation, a methodology was developed using CAGED’s
data, which is described in this item.
6.1 THE CAGED
Law 4923/65, which created the first unemployment benefit in the country, determined
that any company place that hired or dismissed employees protected under general
legislation during month x, was obliged to declare this to MTE (Ministry of Labor and
Employment), nominally, until the 15th day of the following month, x +1.
The same law specified that data should be reported in a specific form, including: name,
sex, age, occupation, date of admission or dismissal, and information on wages of each
employee hired or dismissed. This record, of a supervisory and operational nature, is the
General Registry of Employed and Unemployed Individuals – acronym in Portuguese,
CAGED.
The lack of information on job generation by geographic area and sector, made
CAGED’s aggregate data increasingly sought-after and used, although in the early years
its coverage was limited and the generation of data itself was quite slow, since results
were produced manually.
Gradually, it has earned the recognition of companies and, thus, the coverage of
monthly movements has grown steadily. In the last decade, with the complete
computerization of the system, the quality and speed of CAGED’s data improved
significantly, even though it still does not provide the quality and coverage provided by
RAIS.
In these circumstances, any exercise using both RAIS’ and CAGED’s data requires
caution. The historical series based on RAIS’ data on employees supply and
movements, up to the last year for which such data are available, can not be updated
simply by reading the A-D balance of the monthly CAGED. The underestimations of

38
aggregates corresponding to Admissions and Dismissals of each domain hi, in each
month m, declared in CAGED, should be corrected separately to maintain
correspondence with the respective RAIS’ movements.
The next item presents the way these corrections of original values of Achim and Dchim in
CAGED were carried out, so as to update the employment series in the 38 TCAs, before
the use of tourist service coefficients (chim) and their respective corrections (CHix).
6.2 PREPARATION OF CAGED’S DATA 2007
The details of procedures used in the construction of formal occupation estimates, by
state, based on CAGED’s data, described below, constitute the transcript of IPEA’s
report prepared in 2008 and refer to the estimates prepared for the period after January
2007.
It should be noted that, since then, there have been no methodological changes that
affect the calculation of formal occupation estimates for the subsequent period, and
chapter 9 of this document contains more recent estimates, prepared through the same
procedures.
The specifications used in the reading of CAGED’s monthly data were the following:
• Federate Units (states): all;
• Type of company places: CNPJ and CEI;
• Classification CLASSE CNAE 95 - updated in 38 TCAs and later aggregation into 7
groups of TCAs.
• Movements considered: Admissions (Achim) and Dismissals (Dchim), separately.
• Months: January to December 2007
It should be pointed out that, unlike the changes seen in CNAE classification used in
RAIS 2006, CAGED continued using the classification Classe CNAE 95, which can
generate inconsistencies between the movements of these sources, by means of which
the correction factors for CAGED’s Admissions (A) and Dismissals (D) are estimated.
39
6.3 ADJUSTMENTS IN CAGED’S ADMISSIONS AND DISMISSAL S DATA TO MAKE
THEM COMPATIBLE WITH THOSE ESTIMATED BY RAIS
In general, the totals Achim and Dchim disseminated by CAGED, for each domain hi, over
2006, show reasonable correlation with the estimates ARhim and DRhim for the same
year prepared by RAIS, although the former are usually lower due to CAGED’s
coverage problems already mentioned.
Based on this approximation, adjustment factors calculated separately for the original A
and D movements of CAGED in 2006 allowed the expansion of CAGED’s monthly
results, in order to maintain comparability with those obtained by RAIS.
The correction factors FAchim and FDchim were calculated by the coefficients:
FAchim 06= ARhim 06/ Achim 06 and
FDchim 06 = D Rhim 06 / Dchim 06
Thus, the values of A 'and D' estimated for the domains hi, as of January 2007, were
calculated with the multiplication of the original values of A and D in CAGED with the
respective factors:
A’ chim07( 06) = A chim07(06) x FAchim06 and
D’ chim07(06) = D chim07 (06) x FDchim 06
6.4 SPECIAL SITUATIONS
In some domains hi, particularly those less significant in terms of employment, atypical
situations may occur that require a different solution. Specific procedures adopted in
2006 to address these situations are described below:
• Existence of Ahim or D´him movements in RAIS-2006 and absence of these
movements in CAGED for the same year: in this case, the correction factor to be used
was equal to the yearly average of domain hi;
• In the opposite situation, i.e. no movement in RAIS and movement in CAGED: the
previous solution was also adopted;

40
• Extreme values of the correction factor for the field him, more than 5.0 or less than
0.2: these values were adopted, maximum or minimum, respectively.
6.5 COMMENTS ON THE VALUE OF CORRECTION FACTORS FOR RAIS/CAGED-
2006
Similarly to 2004, the yearly average values of correction factors are usually higher than
1, which reiterates the comment made at the time, that the omission of movements
recorded by CAGED are almost always higher than those recorded by RAIS. However,
among dismissals, values of less than 1 appear more frequently than in 2004, and even a
negative value.
These unexpected results can be accounted, to a large extent, to changes in the CNAE
classification made in RAIS 2006, without their incorporation into the monthly results
released by CAGED. In this sense, most of these problematic correction factors are
related to activities linked to the Transportation group, precisely those where code
changes and re-insertion of units were more expressive.
Also important is the comparison of the factors of expansion of CAGED’s movement
among FUs. CAGED’s adjustment percentages in the states of the Southeast and South
regions are at levels below those recorded in other regions, making it evident that, in
these states, CAGED’s coverage is higher than in other regions.
In some domains hi, the values of correction factors corresponding to Admissions
outweigh those for Dismissals, while in other domains, the opposite occurs. Generally,
blank responses of Dismissals in CAGED predominate over Admissions in states of the
Southeast, while in the TCAs related to Accommodation, the adjustment factors for
Admissions (A) are always superior to Dismissals (D).
In summary, the previous comments reiterate the need for Admissions and Dismissals
disseminated by CAGED to be corrected before being used to generate updated
estimates of employment in tourism compatible with those prepared by RAIS.

41
The expansion of CAGED’s data through the ratios of RAIS’ and CAGED’s
movements deserves the following additional comments:
a) The evolution of CAGED, especially the gains of spatial and sectoral coverage, affect
the time series prepared with the use of this source, affecting mainly the less expressive
domains hi.
Thus, the values of correction factors for CAGED’s movement, using the latest RAIS,
generally show a declining trend over time. Moreover, the evolution of the coverage of
Admissions and Dismissals may be occurring in an uneven manner, which would lead
to overestimating or underestimating correction factors for these movements.
For these reasons, the use of CAGED’s data in the preparation of tourism employment
estimates should be limited to the months subsequent to the last RAIS.
Nevertheless, one should have in mind that the values of correction factors calculated
for 2006 to be used with monthly CAGED’s data of 2007, tend to increase the
generation of employment in tourism, a bias which may be even more significant if the
gains of coverage of CAGED’s movements are more expressive in Admissions.
b) There is no guarantee that correction factors calculated for the last year of RAIS
(2006) will be the same in the near future. This leads to the recommendation that
Admissions and Dismissals estimates for the months subsequent to the last RAIS, have
a provisional character. In this sense, one should reiterate the recommendation that the
latest estimates, obtained through the CAGED, be in force until the data of the new
RAIS is available;
c) Finally, provisional estimates, corresponding to periods subsequent to the new RAIS,
should be reviewed with the new correction factors calculated with the new RAIS.
Thus, when RAIS data are available, new values for these factors should be calculated
and used to review provisional estimates.

42
6.6 PREPARATION OF MONTHLY ESTIMATES OF EMPLOYMENT IN TOURISM,
AFTER THE LATEST RAIS.
The preparation of updated estimates of employment in tourism, through the CAGED
on the months subsequent to the last year of RAIS, was carried out in two stages. First,
monthly figures were estimated for Admissions and Dismissals in tourism,
corresponding to each domain hi, using the same service coefficients (chim) and
correction (Chix) used in 2006. Second, the monthly employment in tourism, of domain
hi, was calculated by the sum of employment in tourism, in the last month m-1 and the
respective balance (A-D) in tourism for month m, estimated in the previous step.
The formulas used in these stages are set out below:
Stage 1: Calculation of A and D in tourism for domain hi, in month m
a) Admissions in tourism (AT):
AT him07(06) = A’ chim07( 06) x chim x CHix
b) Dismissals in tourism (DT):
DT him07(06) = D’ chim07( 06) x chim x CHix
Stage 2: Calculation of Employment in Tourism (ET) for domain hi, in month m
ET him07(06) = ET hi(m-1) + (AT him07(06) - DT him07(06) )
Thus, the estimate of employment for domain hi, in January 2007, is:
ET hi jan 07= ET hi dez 06 + ( AT hi jan 07 - DT hi jan 07 ).

43
7 PREPARATION OF MONTHLY ESTIMATES OF INFORMAL
OCCUPATION IN TOURISM, BASED ON PNAD ‘S DATA
The scale and characteristics of informal workers can only be known with the use of
data from households, notedly those from the Population Census - CD - or the National
Household Sampling Survey -PNAD.
Also, they are the only continuous sources with statistical significance at the state level
or higher, with the additional advantage of allowing access of any user to corresponding
micro-databases.
In this document, the PNAD is used, since its contents are more comprehensive and
updated to assess the diversity of the national labor scenario, but also admitting that
these data have limitations associated with the time character of the survey, in a single
week of the year, with insufficient sample sizes as regards smaller occupational-
geographic domains, and also problems with the detailing of economic activities.
7.1 - COMMENTS ON THE PNAD
7.1.1 General
The PNAD is a household sampling survey, carried out on a yearly basis by IBGE,
usually in the last week of September. Data are collected through a probabilistic sample,
which currently covers urban and rural areas of all states.
The sample is selected in three stages:
- First, municipalities, or sets of municipalities, are selected with probability
proportional to their size, thus ensuring the presence of the most important ones, and
other less significant ones;
- Second, some census units are selected, i.e., areas that usually have between 150 and
350 households, also with probability proportional to size;
- Finally, within selected census units, with prior updated listing of their households,
there is a draw on households that will be interviewed, so as to ensure equal probability
of selection for households within the same geographical context.

44
Staff specially trained in supervision and interview ensure accuracy and quality of data
collected in the field. On the other hand, the estimation process, i.e. the expansion of
sample results for the universe to be represented, is carried out with the use of an
independent projection of the population for the geographical areas of estimation,
metropolitan areas or states.
7.1.2 Evolution of geographic coverage
For over three decades, the geographic coverage of PNAD reached urban and rural areas
of the country’s states, except rural areas in six states of the North Region: Rondônia,
Acre, Amazonas, Roraima, Pará and Amapá. As of 2004, these areas were included in
the survey, and PNAD’s coverage reached 100% of the national territory.
This territorial expansion should be taken into account when comparing PNAD’s
expanded results produced up to 2003, with the same results from 2004 onwards.
In this sense, estimates of informal employment in tourism 2002 - 2008 presented in this
document were prepared including adjustments to 2002 and 2003 data. These
adjustments were based on the percentages of rural incidence in these states, shown in
PNAD 2004.
7.1.3 Evolution of PNAD’s sample size
The comparison of household samples sizes of PNAD 2002 and 2005 and, especially,
the distribution of these samples by states, provide a good picture of data quality and the
restrictions for their use.
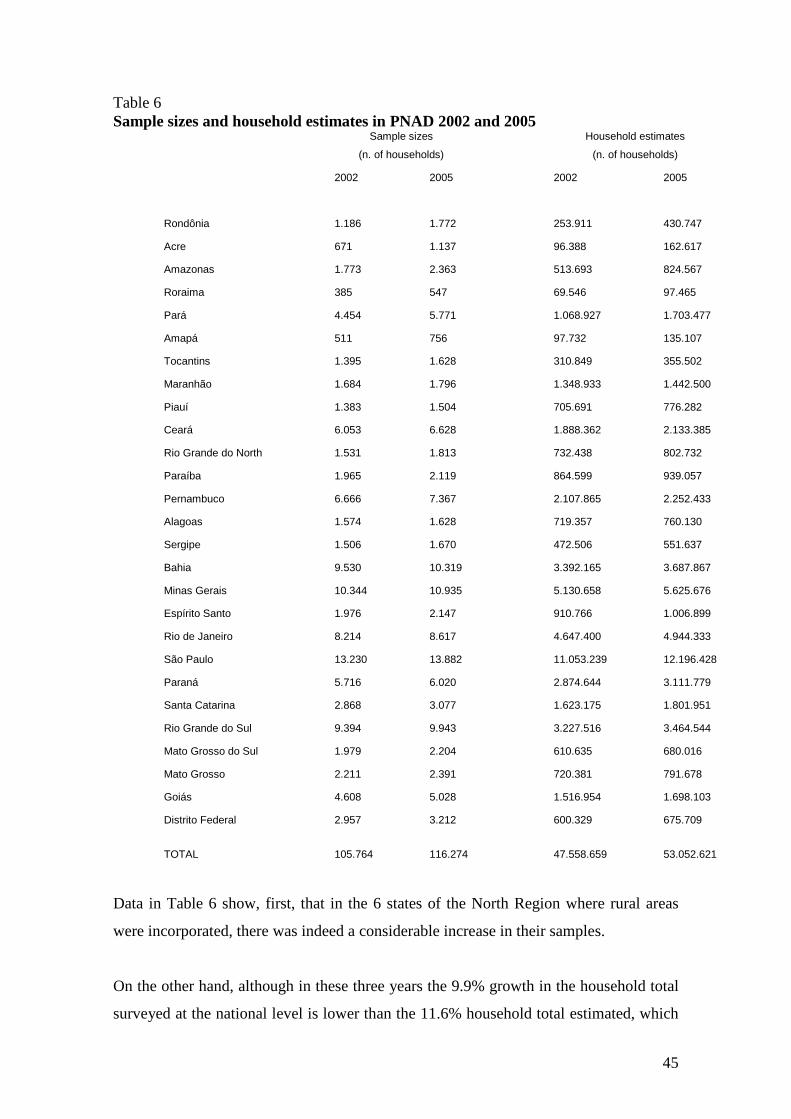
45
Table 6 Sample sizes and household estimates in PNAD 2002 and 2005
Sample sizes
(n. of households)
Household estimates
(n. of households)
2002 2005 2002 2005
Rondônia 1.186 1.772 253.911 430.747
Acre 671 1.137 96.388 162.617
Amazonas 1.773 2.363 513.693 824.567
Roraima 385 547 69.546 97.465
Pará 4.454 5.771 1.068.927 1.703.477
Amapá 511 756 97.732 135.107
Tocantins 1.395 1.628 310.849 355.502
Maranhão 1.684 1.796 1.348.933 1.442.500
Piauí 1.383 1.504 705.691 776.282
Ceará 6.053 6.628 1.888.362 2.133.385
Rio Grande do North 1.531 1.813 732.438 802.732
Paraíba 1.965 2.119 864.599 939.057
Pernambuco 6.666 7.367 2.107.865 2.252.433
Alagoas 1.574 1.628 719.357 760.130
Sergipe 1.506 1.670 472.506 551.637
Bahia 9.530 10.319 3.392.165 3.687.867
Minas Gerais 10.344 10.935 5.130.658 5.625.676
Espírito Santo 1.976 2.147 910.766 1.006.899
Rio de Janeiro 8.214 8.617 4.647.400 4.944.333
São Paulo 13.230 13.882 11.053.239 12.196.428
Paraná 5.716 6.020 2.874.644 3.111.779
Santa Catarina 2.868 3.077 1.623.175 1.801.951
Rio Grande do Sul 9.394 9.943 3.227.516 3.464.544
Mato Grosso do Sul 1.979 2.204 610.635 680.016
Mato Grosso 2.211 2.391 720.381 791.678
Goiás 4.608 5.028 1.516.954 1.698.103
Distrito Federal 2.957 3.212 600.329 675.709
TOTAL 105.764 116.274 47.558.659 53.052.621
Data in Table 6 show, first, that in the 6 states of the North Region where rural areas
were incorporated, there was indeed a considerable increase in their samples.
On the other hand, although in these three years the 9.9% growth in the household total
surveyed at the national level is lower than the 11.6% household total estimated, which

46
could suggest slight loss of sample update, it is undeniable that in general these sizes are
sufficient for the generation of major demographic and occupational aggregates, at the
level of states and metropolitan areas.
The exceptions could be the states of Acre, and, particularly, Roraima and Amapá,
where sample sizes are critical even considering the incorporation of rural areas, not
providing the same quality of results as the other states.
It is even more important to emphasize that, when working with less significant
population domains, such as informal occupation in tourism, the size of samples in these
three states, as well as in other states with a limited number of households surveyed,
may further undermine the quality of parameters used to prepare the estimates.
Given this restriction, some ratios like informal occupation/ formal employment of
PNADs from 2002 to 2005, calculated by state and by the 7 groups of TCAs, had to be
adjusted to ensure comparability of results of these domains over these years.
7.1.4 Preparation of estimates in PNAD
Following internationally accepted practice, PNAD’s results are prepared using a
projection of the total population for each estimation area or domain, calculated for the
month of September each year by the components method, which takes into account
data on fertility, mortality and migration.
The difference from other countries, where such projections are detailed by gender, age
or area of residence, is that in the PNAD they refer to a single total, which may hamper
the comparability of results over time, particularly for smaller occupational-geographic
domains.
This method of estimation, which substitutes the practice of expansions through the
opposite of final sampling fractions duly corrected as regards blank responses, requires
that the weights originally calculated by the Projection / Sample relation are reviewed
afterwards, to make them compatible with projections of more recent years so as to
ensure time comparability of results.

47
For this reason, informal occupation estimates in this document were prepared in 2002,
2003 and 2004 with the use of weights more recently reviewed by IBGE.
The details of procedures used in the construction of informal occupation estimates,
based on PNAD’s data, by state, described below, are the transcript of IPEA’s report
prepared in 2007, and refer to the estimates prepared for the period of December 2002
to December 2005.
It should be noted that, since then, there have been no methodological changes that
affect the calculation of informal occupation estimates for subsequent periods, and
chapter 9 of this document contains more recent estimates, prepared through the same
procedures.
7.1.5 Alternative definitions on informal occupation
The major demographic and occupational scope of PNAD, coupled with the wealth of
contents on the themes on each population subgroup surveyed, allows the measurement
of occupational formality / informality with the use of different definitions.
Regarding this matter, it should be noted that the International Labor Organization
(ILO), United Nations body which, among other tasks, provides standards for
occupational measurements, in the 15th International Conference for Labor Statisticians
(1993) stated that: "for statistical purposes, the informal sector is considered a set of
production units that, according to the definitions and classifications of the System of
National Accounts of the United Nations, are part of the family sector in the shape of
household unincorporated enterprises."
Later in the same Resolution, the ILO explains that there are three groups of these types
of units: a) household enterprises b) informal enterprises of own-account workers, c)
enterprises of informal employers which, for operational purposes, can be defined in
terms of unit size and / or the presence of unregistered workers.
However, the 17th ILO Conference (2004) specifies that "the concept of informal sector
refers to production units as observation units," while "informal occupation refers to

48
work as a unit of observation", a clarification that opens the path to measurement of
informality through household surveys.
In this sense, it is specified that the informal working labor force include: a) own-
account workers working in their informal enterprises, b) employers working in their
informal enterprises, c) independent household workers d) members of informal
producers cooperatives e) employees with informal work (without registration or
payment of taxes and contributions), f) own-account workers engaged in production for
family consumption.
In short, a hardly trivial concept, requiring specific criteria and limits for each of the
sub-groups, specifications which can give rise to inaccuracy and disagreement.
Alternatively, however, in many countries including Brazil, it is understood that formal
employment or occupation refers to the set of work carried out by registered employees
(employees registered under general legislation or civil servants protected under specific
legislation, paying social security contributions and income tax) in firms listed in
different registries for legal entities or natural entities.
This definition makes implicit the idea that informal occupations are all the remainder,
which in practical terms represents a reasonable approximation to ILO statistical
recommendations, with the advantage of simplicity of measurement and, particularly,
greater alignment with the implementation and evaluation of public policies in the labor
area.
In this document, the definition used to scale informal occupation in tourism is based on
the second alternative presented: that informal occupations refer to all work carried out
by unregistered employees.
For this option, one considered the advantages pointed out and the fact that the
measurement of informality in the tourism sector to be prepared should be consistent
with IPEA’s formal employment estimates, which are based on data from RAIS and
CAGED, where formal employment was considered that of private sector employees
protected under general legislation.

49
The exclusion of civil servants protected under specific legislation and the military from
the measurements took place basically because of the unavailability of tourist service
coefficients for the public sector, and also led to the recommendation of exclusion of
these segments in the corresponding measurements of formal and informal occupation
in PNAD.
Thus, the ratios Informal / Formal Occupation, calculated by PNAD, left out the civil
servants working in Tourism Characteristical Activities (TCAs).
7.1.6 Base for quantification of informal occupations
Another particularity of PNAD concerns its possibility to provide occupational data
both for main and secondary occupations, in case the employee has more than one job
in the reference week.
This feature allows PNAD to quantify the working labor force as well as jobs, which
leads to the possibility of greater alignment with the measurement of formal job posts
practiced through RAIS and CAGED.
Although secondary occupations are not that significant, they exist and were included in
the preparation of informal tourism occupation estimates contained in this document.
7.1.7 Tourism Characteristical Activities in PNAD
A major difficulty for the measurement of formal or informal occupation in tourism
emerges from the definition of Typical Activities in Tourism (TCAs), and the degree of
detail of the Economic Activity Codes of each source.
Although the PNAD, as well as RAIS and CAGED, uses the National Classification of
Economic Activities (CNAE), the reduced versions of the codes they use are different
between the former and the two latter data sources.
While the identification of Tourism Characteristical Activities in RAIS and CAGED
takes place by means of 38 items, with different 5-digit codes, in PNAD’s micro-

50
database, this approximation to the tourism universe is achieved with 16 economic
activities, also containing 5 digits, with no numerical correlation with the codes used by
RAIS and CAGED.
In some of the 7 TTA groups, such as Accommodation, Travel Agencies, and
Transportation Rental, the sector coverage may be considered identical. In the other
groups, particularly in Transportation, this does not happen, mainly because the
contents of activities of some PNAD’s items are broader than the desired, incorporating
some economic activities that have little or nothing to do with tourism.
Thus, the measurement of formal and informal occupation in tourism practiced in
PNAD is slightly overestimated. It is believed, however, that this overestimation does
not affect the calculation of Informal / Formal Occupation ratios, which are the basis for
the preparation of estimates of informal occupation in tourism in this document.
7.2 SPECIFICATION OF PNAD’S VARIABLES AND CATEGORIE S USED IN THE
PREPARATION OF ESTIMATES OF INFORMAL OCCUPATION IN TOURISM.
The micro-databases on households and people in PNAD, as of 2002, used in the
preparation of the estimates contained in this document, include three types of variables
of interest:
a) those relating to the geographical location of households, their census area of
residence (urban and rural), and weight used for sample expansion;
b) those relating to economic activities undertaken by the working labor force aged 10+
in the household;
c) other attributes related to the work carried out, such as type of occupation (primary or
secondary) and occupational position of individuals in the work they carried out
(employees under general legislation, civil servants under specific legislation, military,
domestic workers, own-account, employers, etc.)..
It should be noted that, in view of the great stability of contents surveyed by PNAD in
the last two decades, the variables and categories used in measurements after 2002 use
the same code, which facilitates the description of specifications adopted in the

51
preparation of this document, except as regards the person weight variable, as explained
above.
Specifications are detailed below:
• Major regions - variable with 5 categories, all used;
• States - FU variable with 27 categories, all used;
• Area of residence - variable 4728, where categories 1-3 correspond to Urban and the
remainder to Rural;
• Updated Person Weight: variable 4729, for 2004 and 2005, and variable 4729n, for
2002 and 2003
• TCAs - 15 categories and 7 groups, according to details below:
• Group 1 - Accommodation: CNAE-PNAD code: 55010;
• Group 2 - Food: CNAE-PNAD codes: 55020 and 55030;
• Group 3 - Transportation: CNAE-PNAD codes: 60010, 60020, 60040, 60091, 61000
and 62000;
• Group 4 - Auxiliary Transportation: CNAE-PNAD codes: 63010 and 63021;
• Group 5 - Travel Agency: CNAE-PNAD code: 63030;
• Group 6 - Transportation Rental: CNAE-PNAD code: 71010;
• Group 7 - Culture and Leisure: CNAE-PNAD codes: 92015, 92030 and 92040.
• Economic activity in Main Occupation - variable 9907;
• Occupational Position in Main Occupation - variable 4706, where category 1
corresponds to Registered Employees; 2 corresponds to the Military; 3 to Civil Servants
under Specific Legislation; and 4 onwards to Other Working Individuals;
• Economic activity in Secondary Occupation - variable 9991;
• Occupational Position in Secondary Occupation - variable 9097, where category 2
corresponds to Registered Employees, and variables 9095 and 9096 to the Military and
Civil Servants, respectively.
The next item describes the methodology used in the preparation of estimates of
informal occupation in the tourism sector, for the month of September 2002 to 2005.
The description is the sequence of stages and calculations performed to obtain the
estimates.

52
7.3. PREPARATION OF YEARLY ESTIMATES ON INFORMAL OC CUPATION IN
THE TOURISM SECTOR
7.3.1 Preliminary Discussion
IPEA's interest regarding the preparation of informal occupation estimates in the
tourism sector is associated to the need for availability of information about the recent
history of this major segment of occupation in tourism.
The reconciliation of formal employment results, prepared through RAIS and CAGED,
with those now presented for informal occupation, with PNAD’s data, constitutes a
basic premise of the proposed methodology to measure occupational informality.
Strictly speaking, occupational measurements, formal and informal, could be carried out
only with the reading of PNAD’s data. However, the results would be yearly, referred
only to the month of September of each year, in addition to dissemination with a great
delay and not having the same degree of census reliability, an important feature of
formal data derived from high-coverage administrative records, as is the case of RAIS
and CAGED.
However, the measurement of formal and informal occupation in the tourism sector
through PNAD is a crucial part of the measurement methodology adopted in this
document, as it enables the calculation of Informal Occupation/ Formal Employment
ratios with which it is possible to ensure the reconciliation of results discussed above.
Equally important in preparing informal occupation estimates in tourism is the use of
the same monthly tourist service coefficients and yearly correction factors used for
formal occupation estimates.
It should be noted that these parameters allow the transformation of the overall
occupation levels in TCAs into occupational estimates that distinguish between services
provided to tourists and residents.

53
The work carried out to generate yearly estimates on informal occupation in tourism is
detailed below.
7.3.2 Basic roadmap for the preparation of informal occupation estimates
• Total of occupation in 15 TCAs and 27 states, based on PNAD
a) Preparation of results for the expanded total of persons working in main work, for the
15 TCAs and 27 states, for the month of September each year, with grouping in i = 7
groups of TCAs and h = 27 states (Tphi). These results should be prepared using their
respective specifications, as defined in the previous section;
b) Disaggregation of yearly results according to occupational position, distinguishing
between the formal working labor force in the private sector under general legislation
(Tpfhi) and the remainder of the working labor force (Tpinfhi), excluding civil servants
under specific legislation and the military;
c) Disaggregation of the results in b by area of residence, distinguishing between urban
and rural areas. This procedure applies to the states of Rondônia, Acre, Amazonas,
Roraima, Pará and Amapá for 2004 and 2005;
d) Calculation of the ratio total working labor force / working labor force in urban areas
in each of these states, in 2004, separately, for the total working labor force and formal
working labor force under the general legislation;
e) Adjustment of the total working labor force (T’phi) and formal working labor force
(T’pfhi) in these states in 2002 and 2003, by multiplying their respective totals (Tphi and
Tpfhi) by the corresponding ratios calculated in d for 2004. The new total of informal
working labor force in the main occupation (T’pinfhi) is obtained by the difference (T’phi -
T’pfhi);
f) Obtaining new results of main occupation (T'phi) corresponding to 7 groups of TCAs
and 27 states, with a breakdown of formal (T'pfhi) and informal occupations (T'pinfhi)
for 2002 to 2005, where the omissions of rural occupation in the six states of North
Region in 2002 and 2003 have already been corrected;
g) Preparation of results for the total of persons working in secondary work in 15 TCAs
and 27 states for the month of September each year, and grouping in i = 7 groups of

54
TCAs and h = 27 states (Tshi). These results should be prepared using their respective
specifications, as defined in the previous section;
h) Disaggregation of yearly results according to occupational position, distinguishing
between the formal working labor force in the private sector under general legislation
(Tpfhi) and the remainder of the working labor force (Tpinfhi), excluding civil servants
under specific legislation and the military;
i) Obtaining new occupational results for the 7 groups of TCAs and 27 states, by the
sum of the main occupations total obtained in f (T’pfhi) and the total of secondary
occupations obtained in g (Tshi), with discrimination for formal (T’pfhi + Tsfhi) and
informal (T'pinfhi + Tsinfhi) occupations in 2002 to 2005;
• Yearly estimates on the Informal Occupation in Tourism between Sept. 2002 and
Sept.2005
a) Preparation of Estimates of Occupation in the Tourism Sector (E hi) based on PNAD,
taking into account tourist service coefficients and correction factors for each domain
hi. The calculation is performed with the multiplication of Total Occupation obtained
(T’pfhi + Tshi) by the service coefficient for the month of September, by the correction
factor of the respective year. The values of these two parameters, coefficients and
correction factors were presented in the document "Methodology of calculation of
tourist service coefficients and estimates of formal employment in the tourism sector,
based on RAIS’ data", dated April 2006;
b) Disaggregation occupation estimates in tourism, obtained in a, according to
occupational position, in order to distinguish between formal private occupation in
tourism (E hif) and the remainder of occupations in tourism (Ehiinf). To this effect, the
respective totals (T’pfhi + Tsfhi) and (T’pinfhi + Tsinfhi), obtained by the PNAD, should be
multiplied by the same tourism coefficients and correction factors;
c) Calculation of yearly ratios (qhi) of the total of informal occupations in tourism (Ehiinf)
and the total of formal (E hif) occupation corresponding to each hi = 27*7 domains of
estimation. These ratios qhi = (Ehiinf) / (E hif) define the mechanism by which it is
possible to reconcile PNAD’s occupational results with estimates of private
employment in tourism, obtained through RAIS and CAGED, published by IPEA in
2006;
55
d) Adjustment of coefficients qhi, admitting a maximum value of 10. This measure aims
to avoid that historical series of informal employment, for any domain hi, have extreme
fluctuations caused by insufficient sample sizes;
e) Obtaining multipliers of private formal employment based on RAIS for calculating
the Estimate of Total Occupation in Tourism (OT hi), compatible with formal
employment estimates published, through the expression: 1+ qhi;
f) Preparation of results for the total of private formal employment (ETf hi)
corresponding to i = 7 Groups of TCAs and h = 27 states, for the month of September
2003 to 2005, using RAIS. These estimates are the same that constitute the basis for
obtaining Estimates of Formal Employment in Tourism, in each domain hi, before
application of tourist service coefficients and correction factors;
g) Calculation of Formal Employment Estimates based on RAIS for estimation domain
hi = 7*27 for the month of September 2002. This calculation requires the reading of
RAIS’ employment data for 31-12-2001. These estimates were not included in previous
studies for being restricted to the period of Dec.2002 to Dec. 2006;
h) Obtaining Yearly Estimates of Total Occupation in Tourism based on RAIS (OThi)
for the estimation domain hi = 7 * 27 for the months of September 2002 to 2005, by
multiplying formal employment totals, obtained in 7.3.2 f and 7.3.2 g, (ETfhi), by the
respective yearly multipliers 1+ qhi;
i) Obtaining Yearly Estimates of Informal Occupation in Tourism based on RAIS (OT
hiinf) for the estimation domains hi = 7 * 27, for the months of September 2002 to 2005,
through the difference between (OThi) and (ETf hi): OT hiinf = OThi- ETf hi.
8. REVIEW OF CRITERIA FOR DISSEMINATION OF INFORMAL
OCCUPATION ESTIMATES
In 2009, two years after the preparation of the methodology to estimate informal
occupation, it was found that the series of estimates in the seven TCAs
(accommodation, food, transportation, auxiliary transportation, travel agencies,
transportation rental, and culture and leisure), disaggregated by state, showed marked
instability, particularly in estimation domains that combine small states and activities
with a small working labor force.

56
This is a phenomenon associated to insufficient sample size in the PNAD, which had
already been the subject of consideration when the methodology was defined.
To resolve this problem, three alternatives were considered, all aimed at greater stability
of the series, through reducing the level of disaggregation of informal occupation
estimates.
The first alternative sought to maintain disaggregation by activity and change the space
specification from states to regions. The second aimed to maintain the disaggregation by
state, but adding the four TCAs with a lower representation of the sample of PNAD:
auxiliary transportation, transportation rental, travel agencies and culture and leisure.
The third was the same proposal to amend the specification of activities of the second,
but it would also restrict the publication of estimates of states showing instability, in any
of four sets of activities: accommodation, food, transportation and others.
The second alternative was chosen, based on the consideration that the demand for such
information would be more relevant for states, which have an interest in monitoring the
evolution of the labor market, albeit in a more aggregated manner at the sector level. As
some cases of instability still persist, the publication of these estimates should always be
accompanied by explanatory notes on the occurrence of these deviations, derived from
PNAD’s sample size.

57
9. SOME RESULTS OBTAINED FROM FORMAL AND INFORMAL
OCCUPATION ESTIMATES IN THE TOURISM SECTOR
Examples of questions relevant for officials in the tourism sector
a) What is the scale of formal and informal occupation in TCAs?
b) What is the relevance of occupation in tourism in the economy as a whole?
Number of people working in Tourism Characteristical Activitie s Brazil: December 2007 Occupation Accommodation Food Transportation Other* TCAs
(A)
Economy
(B)
A/B
%
Formal 186.037 168.596 359.605 115.531 829.769 29.033.012 2,9%
Informal 72.742 434.617 433.202 151.263 1.091.824 48.802.137 2,2%
Total 258.779 603.213 792.807 266.794 1.921.593 77.835.149 2,5%
* Includes the following activities: auxiliary transportation, travel agencies, transportation rental, and culture and
leisure.
The total of people working in TCAs on 31st December 2007 was estimated in 1.9
million, representing 2.5% of the total working labor force in the Brazilian economy. It
is important to point out that civil servants under specific legislation and the military
were not included in the total working labor force, so that figures are coherent with the
calculation of the formal working labor force in TCAs, which does not include people
working in the public sector.
Informal occupation prevails in tourism, with a figure of 56.8%, however, it is lower in
the tourism sector than in the economy as a whole, 62.7%.
c) What is the evolution of occupation in the tourism sector and in the economy?;
Total working labor force in Tourism Characteristical Activities – Brazil: December 2002 – December 2008 Year Accommod
ation Food Transportati
on Other* Total TCAs Economy
2002 213.693 519.782 753.615 209.563 1.698.937 70.374.801
2008 269.858 650.870 816.713 300.795 2.038.236 82.001.100
∆ aver. per year % 4,0% 3,8% 1,3% 6,2% 3,1% 2,6%
* Includes the following activities: auxiliary transportation, travel agencies, transportation rental, and culture and
leisure.

58
Formal working labor force in Tourism Characteristi cal Activities Brazil: December 2003 - December 2008 (aggregate)
Year Accommodation
Food Transportation
Other* TTA total Economy
2002 148.413 111.623 342.972 80.779 683.787 23.052.476
2008 193.617 181.752 371.378 130.111 876.858 30.702.232
∆ aver. per year % 4,5% 8,5% 1,3% 6,2% 4,2% 4,9%
* Includes the following activities: auxiliary transportation, travel agencies, transportation rental, and culture and
leisure.
Formal working labor force in Tourism Characteristi cal Activities Brazil: December 2003 - December 2008
Year Accommodation
Food Transportation
Auxiliary transportation
Travel Agencies
Transportation Rental
Culture and Leisure
TCAs Economy
2002 148.413 111.623 342.972 26.203 28.949 6.761 18.866 683.787 23.052.476
2008 193.617 181.752 371.378 49.280 46.472 14.953 19.406 876.858 30.702.232
∆ aver. per year % 4,5% 8,5% 1,3% 11,1% 8,2% 14,1% 0,5% 4,2% 4,9%
Informal working labor force in Tourism Characteris tical Activities Brazil: 2003-2008 Year Accommodation Food Transportation Other* TCAs Economy
2002 64.260 406.078 408.941 128.117 1.009.680 47.117.792
2008 76.241 469.118 445.335 170.684 1.161.378 51.298.868
∆ aver. per year % 2,9% 2,4% 1,4% 4,9% 2,4% 1,4%
* Includes the following activities: auxiliary transportation, travel agencies, transportation rental, and culture and
leisure.
Total occupation in TCAs grew at an yearly average rate of 3.1% between December
2002 and December 2008; this growth was higher than that of the total occupation in the
economy, 2.6% per year. Another positive point to be highlighted is that growth in
occupation was more intense in the formal labor market, 4.2%. In the same period, the
yearly average growth rate for informal occupation in TCAs was 2.4%.
It is also important to point out that the growth in occupation in the tourism sector was
quite heterogeneous among TCAs. Accommodation and Food contributed much more
than Transportation for the increase in occupation in tourism in the period.
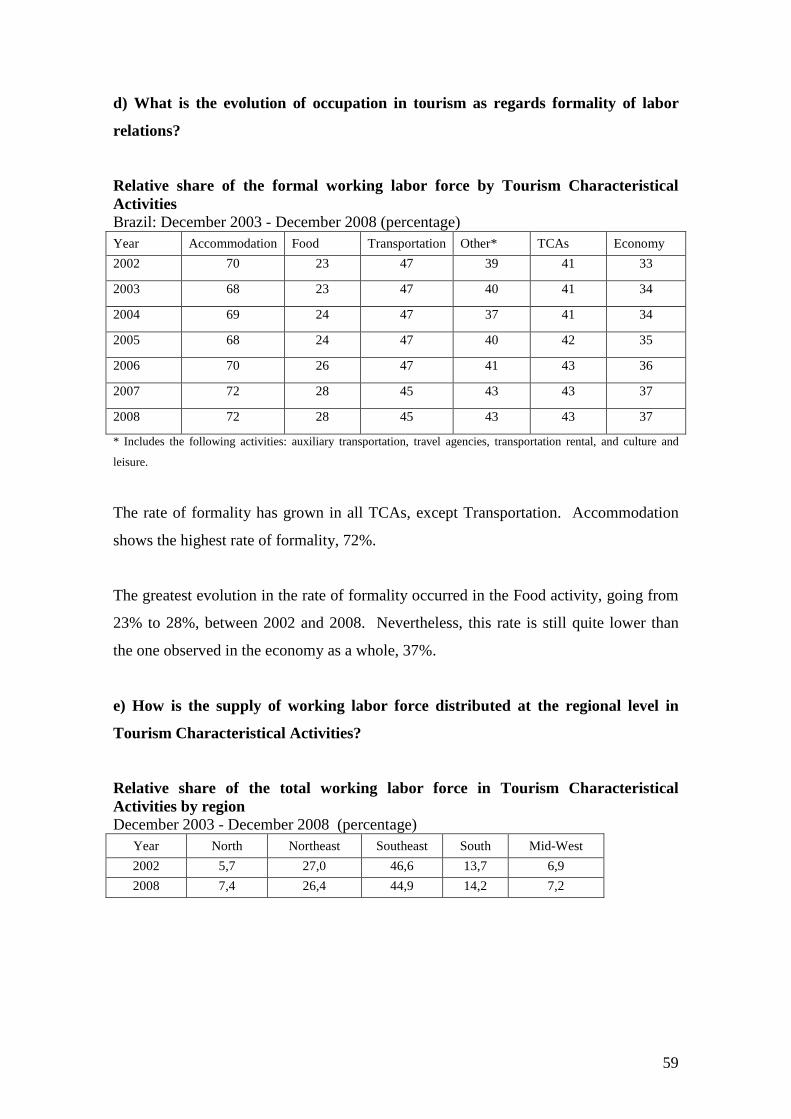
59
d) What is the evolution of occupation in tourism as regards formality of labor
relations?
Relative share of the formal working labor force by Tourism Characteristical Activities Brazil: December 2003 - December 2008 (percentage) Year Accommodation Food Transportation Other* TCAs Economy
2002 70 23 47 39 41 33
2003 68 23 47 40 41 34
2004 69 24 47 37 41 34
2005 68 24 47 40 42 35
2006 70 26 47 41 43 36
2007 72 28 45 43 43 37
2008 72 28 45 43 43 37
* Includes the following activities: auxiliary transportation, travel agencies, transportation rental, and culture and
leisure.
The rate of formality has grown in all TCAs, except Transportation. Accommodation
shows the highest rate of formality, 72%.
The greatest evolution in the rate of formality occurred in the Food activity, going from
23% to 28%, between 2002 and 2008. Nevertheless, this rate is still quite lower than
the one observed in the economy as a whole, 37%.
e) How is the supply of working labor force distributed at the regional level in
Tourism Characteristical Activities?
Relative share of the total working labor force in Tourism Characteristical Activities by region December 2003 - December 2008 (percentage)
Year North Northeast Southeast South Mid-West
2002 5,7 27,0 46,6 13,7 6,9
2008 7,4 26,4 44,9 14,2 7,2

60
Relative share of the formal working labor force in Tourism Characteristical Activities by region December 2003 - December 2008 (percentage)
Year North Northeast Southeast South Mid-West
2002 4,1 18,1 53,8 16,7 7,4
2008 4,6 18,6 52,0. 17,0 7,7
Relative share of the informal working labor force in Tourism Characteristical Activities by region December 2003 - December 2008 (percentage)
Year North Northeast Southeast South Mid-West
2002 6,6 36,3 39,6 11,1 6,3
2008 9,4 32,3 39,5 12,0 6,8
The Southeast and Northeast regions concentrate over 70% of the total working labor
force in the tourism sector. As regards the formal segment, the Southeast region alone
comprises more than 50% of the formal labor force working in tourism. The Northeast
region, which in 2002 concentrated 36% of the informal working labor force of the
tourism sector, reduced this share to 32% in 2008, while in the North Region the share
of informal occupation increased from 6.6% in 2002 to 9.4% in 2008.

61
BIBLIOGRAPHY
Arbache, J. S., (2001).O Mercado de Trabalho na Atividade Econômica do Turismo no
Brazil, Editora da Universidade de Brasília, Brasília, Brasil.
Árias, A R., (2003). Uma Leitura da Evolução Recente do Mercado de Trabalho
Turístico Nacional com Base nos Dados da PNAD e da RAIS, paper IPEA, Brasília,
Brasil.
Árias, A R., (2004). Proposta Metodológica Relativa à Produção de Indicadores
Correntes sobre o Mercado de Trabalho no Setor Turístico através de Fontes
Secundárias de Cobertura Nacional, paper IPEA, Brasília, Brasil.
Belau, D. (2005). Labor Markets in the Tourism Sector, paper in WTO Conference: The
Tourism Satellite Account: Understanding Tourism And Designing Strategies, Iguazu
Faals, Brazil.
Institute of Economic Research Foundation – FIPE, (2001). Conta Satélite do Turismo -
Brasil – 1999, paper, FIPE, São Paulo, Brasil.
Institute of Economic Research Foundation – FIPE, (1995). Condições e Perspectivas
do Mercado de Trabalho no Setor Turism, paper, FIPE, São Paulo, Brasil.
Brazilian Institute of Geography and Statistics - IBGE, (2006). National Household
Sampling Survey – PNAD - 2004, IBGE , Rio de Janeiro, Brasil.
Brazilian Institute of Geography and Statistics – IBGE. (2004). Annual Services Survey
– PAS- 2002, IBGE , Rio de Janeiro, Brasil.
Ministry of Labor and Employment – MTE, (2004). Register of Employing Establishments CEE - Jun 2004, MTE, Brasília, Brazil
Ministry of Labor and Employment – MTE, (2006). Annual List Of Social Information - RAIS 2002, 2003 and 2004, MTE, Brasília, Brazil. World Tourism Organization, (1999). Conta Satélite do Turismo – Quadro Conceitual. World Tourism Organization, Madrid, España.

62
APPENDIX
MAIN SECONDARY SOURCES USED IN THE RESEARCH
• NATIONAL HOUSEHOLD SAMPLING SURVEY - PNAD
Methodology and scope: annual survey carried out through household sampling by
IBGE in the month of September. In order to guarantee good representation in each
State, the sample, of national coverage, (excluding rural areas of the States of the North
region, except Tocantins) is probabilistic, with a total of over 100.000 households
surveyed yearly. Despite the efforts of IBGE towards guaranteeing adequate
representation of states in the results, the sampling fractions practiced provide sample
sizes that are quite different among States, which suggests production of data that is
qualitatively different among them. In this sense, estimates corresponding to urban areas
of Rondônia, Acre, Roraima and Amapá, or state estimates of Tocantins, Piauí, and
Alagoas, all with the smallest sizes of state samples, can be the most undermined from
the point of view of statistic precision.
The estimation process, that is, the expansion of the results of the sample to the
population, makes use of independent demographic projections of the population living
in each Metropolitan Region or State, which are prepared annually taking into
consideration three components: fecundity rate, mortality rate and migration.
The review of these projections takes place every five years with the results of the new
Demographic Census or of the Population Count. Due to this practice of preparation of
estimates, the comparability of PNAD’s data between years that are close to one
another, particularly those in which projections are changed, can be undermined.
Content and Concepts: the PNAD, considered a multi-purpose survey, surveys data
related to households, families and individuals. Among the characteristics of
individuals, the most significant ones are demographic issues, migration, education,
work and income. Specifically in the latter two topics, the PNAD is comprehensive and
detailed, collecting data corresponding to one reference week, and to its previous year,
concerning all occupations and remunerations received by people aged 10 years or
more. As of 1992, the PNAD, following international recommendations, extended the

63
definition of occupied population to incorporate in this situation people who, without
receiving remuneration, worked one or more hours in the reference week, as well as
those who worked in the construction of their own houses or in the production of goods
and services aimed at feeding at least one family member. The detailing of the
occupational position for each type of work allows very precise classification of the
population working in formal employment under the CLT, public servant protected
under specific legislation or military regime.
The identification of the economic activity in which people exercise an occupation,
however, is a different case. Due to the restrictions of sample sizes, the PNAD uses a
more simplified version (three digits) of the economic activities recognized by the
National Classification of Economic Activities (CNAE / IBGE) for the preparation of
its estimates.
• ANNUAL LIST OF SOCIAL INFORMATION - RAIS
Methodology and scope: it is a work-related, operative, administrative registry that,
due to its high coverage, has been the object of statistic interest. RAIS is a census-type
survey that makes it compulsory for all units (establishments and individual entities)
that use labor force under the CLT regime - Consolidation of Labor Laws – civil
servants of the direct administration and foundations and others (seasonal workers,
directors, temporary staff, apprentices, etc.) to present an annual declaration containing
the individual list of work relations valid on 31st December, as well as those terminated
along the data’s reference year.
Since its introduction in 1976, the global coverage of the survey has improved
significantly, stabilizing around 1995 at levels close to 93-95% for all economic sectors.
The quality and availability of data also evolved favorably due to the advances in
collection, which is totally automated today through the Internet and the use of other
magnetic means.
As with any administrative record, RAIS involves omissions of active employment ties
not declared due to delay, incorrect declaration or non-reply, which can cause an
underestimation of measurement on 31st December of each year. In addition, it also

64
presents omissions of terminated employment ties of the units that, having finished their
activities in year x, did not declare the RAIS in the first months of the year x+1.
However these omissions can be corrected. 5
Despite the limitations mentioned, RAIS constitutes an important survey from the
statistical point of view, since it provides annual quantitative and qualitative
information on formal employment down to the municipal level, even enabling, at this
level, five-digit disaggregation of employment per economic activities in the CNAE.
Contents and availability of data: the importance of RAIS as a survey in the area of
labor is also explained by the wealth of the content surveyed and the stability of the
collection instrument along time. For establishments, considered the reference unit for
RAIS, it is possible to know the location, size on 31st December, CNAE activity, legal
nature, termination of the activity, among the most important variables. For units, it is
possible to know, among other attributes, the age, date and type of admission or
termination, type of ties, schooling, nationality, contractual hours, monthly salaries
paid, and 13th salary.
• GENERAL REGISTRY OF EMPLOYED AND UNEMPLOYED
INDIVIDUALS - CAGED
It is an administrative registry with national coverage, managed by theMinistry of Labor
and Employment, complementing the RAIS. The CAGED surveys monthly admissions
and employment terminations under the CLT regime, with 40-45 days delay. This
source, since it operates with the same universal base of establishments and the same
concepts, geographic topics and codes of economic activity and occupations as RAIS,
constitutes an important indicator of the occupational short-run scenario of the formal
labor market. The fact that the identifications of establishments in the National Registry
of Legal Entities – CNPJ, in the Specific INSS Registry – CEI, and the work ties in the
Social Integration Program – PIS, are the same as those in RAIS, opens the possibility
of progress in the issues of employment seasonality.
5 The monthly employment estimates can be corrected by an annual adjustment of employment terminations through the quotient: Adjusted Terminations year x / Terminations year x, where Adjusted terminations year x = Admissions year x – (Supply on 31st December year x – Supply on 31st December of year x-1).

65
It is important, however, to underline that the CAGED has higher percentages of non-
reply than RAIS and, especially, that the coverage of admissions is higher than the
coverage of terminations, which leads to an overestimation of monthly employment
generation. These problems should be solved in order for CAGED to become a useful
source of consultation concerning generation and characterization of recent formal
employment.
• ANNUAL SERVICE SURVEY – PAS
It constitutes the main source of data on the rendering of non-financial services of the
National Accounts System. Its statistics enable assessment of production value,
intermediate consumption, payroll expenditures, volume of people working and
expenditures with capital formation. It is an annual survey with a census approach to
trade and service companies with 20 or more workers, and probabilistic approach to the
other companies. Companies surveyed are grouped on the basis of the CNAE activity
classification, according to location. For Brazil and the nine States with a higher
concentration of companies, it is possible to achieve a four-digit detailing of activities
according to CNAE, while for the remaining 17 states and the Federal District this
breakdown is limited to a three-digit CNAE. Its unit of investigation is the company,
and it is more appropriate for surveying data of economic nature, such as accounting
records and statements. Its data are available within a 2-year delay and its content is
well detailed concerning information on company structure, and limited as regards labor
force.
• OTHER SOURCES
Other sources should be evaluated as regards their potential to improve the SIMT.
Among them, one should mention first the two monthly surveys carried out to measure
labor market behavior in the country. The Monthly Employment Survey - PME, carried
out by IBGE, based on a probabilistic household sample, covers six metropolitan
regions, seeks to measure and characterize the economically active population and its
relations with the labor market. The Employment and Unemployment Survey - PED,
carried out by the Inter-Union Department of Statistics and Socioeconomic Studies –

66
DIEESE, also seeks to measure and characterize the economically active population and
its relations with the labor market. However, it adopts concepts that contribute to the
capturing of important aspects of this market that are not captured by the usual notions
of employment and that are important in countries whose labor market is not well
structured. In addition to these two surveys, the administrative registries of the Ministry
of Social Welfare will also be examined, with monthly data on formal employment,
including monthly remuneration.