INT-SP6-19-100122-D1-Guideline for RAMS LCC Analysis 100 ... · Definition of the targets...
115
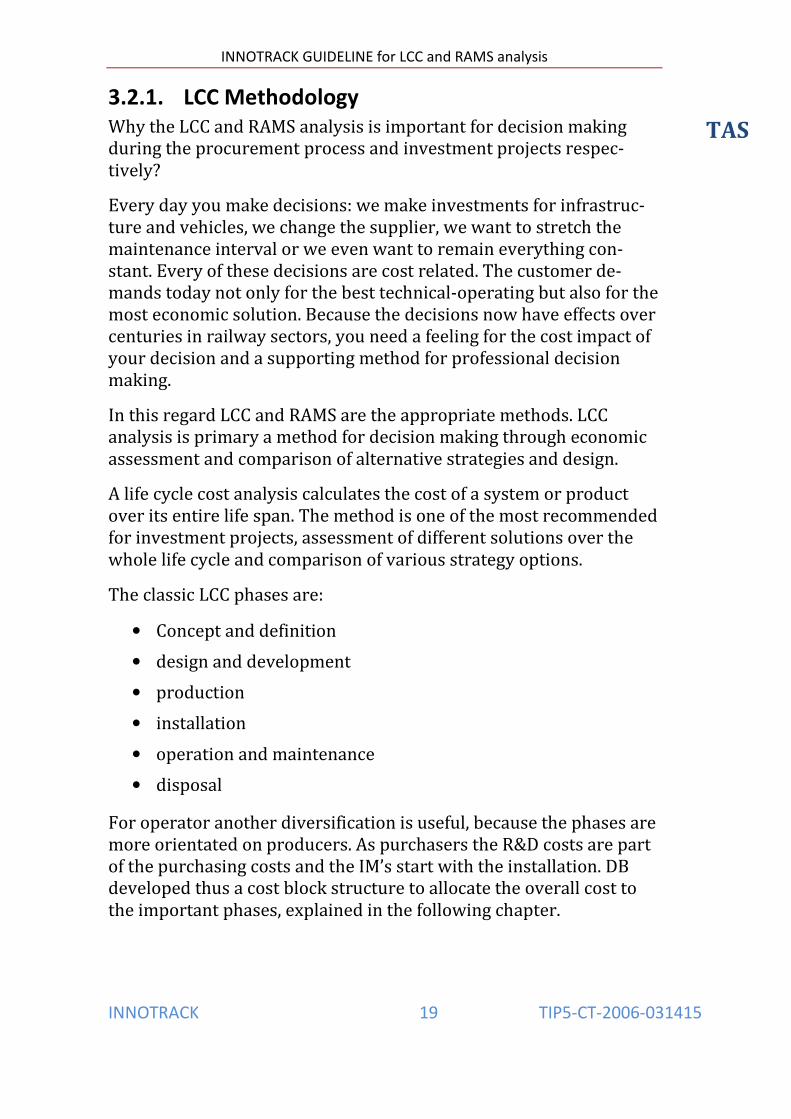
Deliverable D6.5.4 Integrated Project (IP) Thematic Priority 6: Project No. TIP5-CT-2006-031415 Sustainable Development, Global Change and Ecosystems Life Cycle Phases Technical structure Cost category: material costs Life Cycle Phase: Operation Cost element: Material cost of component A in the LCC phase operation Cost categories
Transcript of INT-SP6-19-100122-D1-Guideline for RAMS LCC Analysis 100 ... · Definition of the targets...
Deliverable D6.5.4
Integrated Project (IP) Thematic Priority 6: Project No. TIP5-CT-2006-031415 Sustainable Development, Global Change and Ecosystems
Life Cycle PhasesLife Cycle Phases
Technical structureTechnical structure
Cost category:material costsCost category:material costs
Life Cycle Phase: OperationLife Cycle Phase: Operation
Cost element:Material cost of component A inthe LCC phase operation
Cost element:Material cost of component A inthe LCC phase operation
Cost categoriesCost categories


Contributions

Glossary
Table of Figures

1. Executive Summary
• • •
•

2. Introduction and current state-of-the-art

Status Quo
Technical performance• Reliability• Availability• Maintainability• …
Environmental perform.• Noise• Ground born vibration• …
Costs (drivers)• Investment• Operation• Maintenance• Non availability
Economical effects
Change in initial investment (t=0)
Migration costs Costs for new regulations
Decreasing costs forenvironmental sustainability
Decrease maintenance cost
Decrease costs for non availability
…
Additional income?
Social economical effectsTraffic prognosis
Lif
e c
yc
le c
os
tin
g
Innovation / Optim.
Technical performance• Reliability• Availability• Maintainability• Tolerance against
conditions• …
Environmental perform.• Noise• Ground born
vibration• …
Change in Costs• ... D
ec
isio
n b
y L
ife
Cyc
le C
os
tStatus Quo
Technical performance• Reliability• Availability• Maintainability• …
Environmental perform.• Noise• Ground born vibration• …
Costs (drivers)• Investment• Operation• Maintenance• Non availability
Economical effects
Change in initial investment (t=0)
Migration costs Costs for new regulations
Decreasing costs forenvironmental sustainability
Decrease maintenance cost
Decrease costs for non availability
…
Additional income?
Social economical effectsTraffic prognosis
Lif
e c
yc
le c
os
tin
g
Innovation / Optim.
Technical performance• Reliability• Availability• Maintainability• Tolerance against
conditions• …
Environmental perform.• Noise• Ground born
vibration• …
Change in Costs• ... D
ec
isio
n b
y L
ife
Cyc
le C
os
t
Over
des
ign
ed
Un
de
r d
es
ign
ed
Fre
qu
en
cie
s o
f serv
ice
lif
e [
]
Bad
First change of components
Over
des
ign
ed
Un
de
r d
es
ign
ed
Fre
qu
en
cie
s o
f serv
ice
lif
e [
]
Bad
First change of components

Time [a]
Ava
ila
bilit
y [
]
Time [a]
Ava
ila
bilit
y [
]
Tech
. o
pti
mu
m
Economicaloptimum?
Tech
. o
pti
mu
m
Economicaloptimum?
• • • •
3. Principles of RAMS and LCC Analysis


Maintenance
Inspection / Diagnostic Service Repair
planned / predetermined Maintenance(no equipment condition monitoring)
Condition-based Maintenance(equipment condition monitoring, Activity on condition)
preventive Maintenance
ImmediateDeferred
corrective Maintenance(punctual equipment condition monitoring, unwanted condition is already happened)


Description of the LCC tasks,
specs
Boundary Conditions
Conceptual Formulation
Cost-Breakdown-Structure (CBS)
Product-Breakdown-Structure (PBS)
DefinitionOf variants
In/Out Frame
Establishing the basics
Cost MatrixCBS, PBS,
Variants
Dataassessment
Determinationof data
Analyse ofdata
Processing of data
Resilient LCC data
Determinationof LCC values
Evaluation of the LCC
Choice of the right tool, software
NPV of thevariants
Formulating Recommen-
dation
Interpretationof the results
LCC values(Break-Even,
Annuity, key value)
Formulatingof a
recommendation
Base for decision
Making decisionDeveloping of LCC contract
Tender procedure
ImplementationValidation
Monitoring, FeedbackUpdate of LCC data
Ensuring the circuit of knowledge
SensitivityAnalysis

specify the task, problem, question
to be solved
system or component?existing or new track?
definition of RAMSparameter, targets,
needs (CRS)
definition of bound. conditions,
monitoring
feedback fromoperation to
planning, construction
update andassessment
of RAMS data
determinationof data
analyse and assessement of
data(verification)
RAMS analyse
interpretation ofthe results
taking reference to the fixed specs
validation of RAMSand LCC
calculationsVariant study
Approval of RAMSspecs
RAMS targets,preferred variants
RAMS dataRAMS (LCC)
analyseRAMS (LCC)
resultsMonitoring, Feedback
To Do
Output
report(compilation of
the results)
implementation
Implementation
processing of data
modelling, review of models
definition of the specs,
requirements,key values
In/Out FrameIn/Out Frame
Chapter 4.3 - 4.5Chapter 4.3 - 4.5
Shareholders,customer, team
Customer, teamWho
Chapter,Temp-late, Tool
Shareholder, customer, team
ValidationValidation
Key valuesKey values
chapter 4.10, 7.2 chapter 4.10, 7.2
RAMS analysis necessary,feasible?
any expectingbenefit?
combined RAMS/LCC
analyse
Definitionof
RAMS/LCC task
Establishmentof the basics
Dataasssessment
RAMS (LCC)analyse
Validation,Output
Monitoring,Feedback
ReportImplementation
TeamTeam Team Asset Manager. Team, supplier
System Requirements Specs (SRS)
according to the LCC procedure of WMP from DB (dated: 05.09.2006)
DatabseDatabse
ChapterChapter
DatabaseDatabase
Chapter 3.0, 4.6 Chapter 3.0, 4.6
e. g. D-LCC,RAMSOffice
e. g. D-LCC,RAMSOffice
Chapter 4.6 – 4.9,5.2 - 5.3
Chapter 4.6 – 4.9,5.2 - 5.3
LCC/RAMS taskLCC/RAMS task
Chapter 4.1, 4.2,4.6
Chapter 4.1, 4.2,4.6
ImplementationImplementation
Chapter 6.0Chapter 6.0
Maintenancedatabase
Maintenancedatabase
Chapter 7.1, 7.3Chapter 7.1, 7.3
• • • • • •

• •
Procurement (incl. Disposal)
Operation, Maintenance, Non-availability
Disposal
Installation
Operation
Development
Construction
(Prototype)
(Test)
Production
Decommissioning
LCC
see Procurement costs
•
Life Cycle PhasesLife Cycle Phases
Technical structureTechnical structure
Cost category:material costsCost category:material costs
Life Cycle Phase: OperationLife Cycle Phase: Operation
Component: AComponent: A
Cost element:Material cost of component A inthe LCC phase operation
Cost element:Material cost of component A inthe LCC phase operation
From EN 60300-3-3 the shown cost matrix is
known. Basis: means of production.
From EN 60300-3-3 the shown cost matrix is
known. Basis: means of production.
This view separates the life cycle phases
and the categories in two dimensions
This view separates the life cycle phases
and the categories in two dimensions
Cost categoriesCost categories

II. Operation
II.1 Service II.1.2 Energy
II.10 Other costs
III. Maintenance
III.1 Inspection and service (track)
III.2 Maintenance –preventive
III.4 Maintenance - corrective
III.7 Design and systemsupport
III.10 Other costs
IV. Non Availability
IV.1 Planned IV.1.1 MalfunctionsIV.1.2 DelaysIV.1.3 Serviceability
IV.2 Unplanned IV.2.1 MalfunctionsIV.2.2 DelaysIV.2.3 Serviceability
IV.10 Other costs
I. Procurement
I.1 Preparation - one-time
I.2 Preparation recurrentproject-specific
I.3 Investment
I.4 Imputed residual value
I.5 Decommissioning / retraction / sale /removal (tasks)
I.6 Disposal / recycling
I.10 Other costs
V. Social Economics
V.1 Energy consumption V.3 Delay
V.2 Environment V.10 Other costs
Cost matrix – top level

Purchasecosts
Reference:
. . .
1. year 2. year 3. year 4. year 5. yearCurrent costs from
Delivery year
C2 ·1
(1+i)2C2 ·
1
(1+i)2C2 ·
1
(1+i)2C6 ·
1
(1+i)6
6. year
554!
312!
554!
312!

1. year 2. year 3. year 4. year 5. year
Current costs in
C2·1
(1+i)2
6. yeare.q.: i=1,08/1,02 -1
C6·1
(1+i)6
NPV

•
•
BV 4.0 %
DB 5.9 %
NR 6.5 %
ProRail 4.0 %
Public investor !!!! 4.0 %
Private investor 5.0 % ++
InnoTrack !!!! 4-5 %
For infrastructure
For comparison
Depending on risk

Public
Private
Public
Private

•
•
DB
NR
Pu
bli
c
Pri
vate

•
•
"="
=TLT
THV
TLT
THTLTVRV
AssetAsset1
RV Asset
V 51
Calculatory residual value
respectively disposal
Normalisation of period of time for analysis
Financial return (e.g. scrap return) or costs for disposal
TLT – Technical lifetime
t0 t40 tTLT
Disposal costs
t0 t40 tTLT
Calculatory residual value
A
B

In/Out-frame
to clarify
Outside of calc.
Inside of the LCC calculation
II. Operation
II.1 Service II.1.2 Energy
II.10 Other costs
III. Maintenance
III.1 Inspection and service (track)
III.2 Maintenance –preventive
III.4 Maintenance - corrective
III.7 Design and systemsupport
III.10 Other costs
IV. Non Availability
IV.1 Planned IV.1.1 MalfunctionsIV.1.2 DelaysIV.1.3 Serviceability
IV.2 Unplanned IV.2.1 MalfunctionsIV.2.2 DelaysIV.2.3 Serviceability
IV.10 Other costs
I. Procurement
I.1 Preparation - one-time
I.2 Preparation recurrentproject-specific
I.3 Investment
I.4 Imputed residual value
I.5 Decommissioning / retraction / sale /removal (tasks)
I.6 Disposal / recycling
I.10 Other costs
V. Social Economics
V.1 Energy consumption V.3 Delay
V.2 Environment V.10 Other costs

Nom. discount rate: __ %
Mean inflation rate: __ %
Effective rate: __ %
Time horizon __ years:
Remarks
Parameter Reference case
Technical Parameter 1
Innovation A
Technical Parameter 2
Technical Parameter 3
The nominal discount rate should based on asset life
The inflation rate should be estimated from the last years
Technical Parameter …
Technical Parameter n
Cost block
Investment
Operation
MaintenanceActivity A
Maintenance Activity B
MaintenanceActivity C
Reference case Innovation AData structure
EuroCycleSourceQuality
EuroCycleSourceQuality
EuroCycleSourceQuality
EuroCycleSourceQuality
EuroCycleSourceQuality

•Conceptual formulation
•Establishing the basics
•Determination of LCC-data
•Processing of data
•Formulating of recommendation
•Making a decision
•Developing a LCC-contract
•Ensuring the circuit of knowledge
•Tender procedure & placing
•Monitoring / Verification
Start
End


0
1
0
Operation Development, manufacturinginstallation
Hig
h
Lo
w
• Investment -material• Life time• Long-term behaviour
• Investment - installation• Quality• Time to market
• Maintenance
Infl
ue
nc
e o
n L
CC

• •


•
•

InnovationReference
Conceptual probability distribution Cumulative probability distribution
•
•

•
•

System Requirements
Apportionment ofsystem requirements
Manufacturing
Risk Analysis
System Definition
Concept
Apportionment ofsystem requirements
Modification &Retrofit
Decommissioning &Disposal
1
2
3
4
5
6
7
13
12
10
9
8
12PerformanceMonitoring
12
14
System Requirements
Apportionment ofsystem requirements
Risk Analysis
System Definition
Concept
Apportionment ofSystem Requirements
Operation & Maintenance
1
2
3
4
5
6
7
12
11
10
9
8
12PerformanceMonitoring
Decommissioning &Disposal
14
Design & Implementation
Installation
System Validation
System Integration &Acceptance
Project Definition Project Test and
Integration
Verification andValidation
1212
12
1212PerformanceMonitoring
Verification andValidation
Project Test andIntegration
• • •


• •
• •
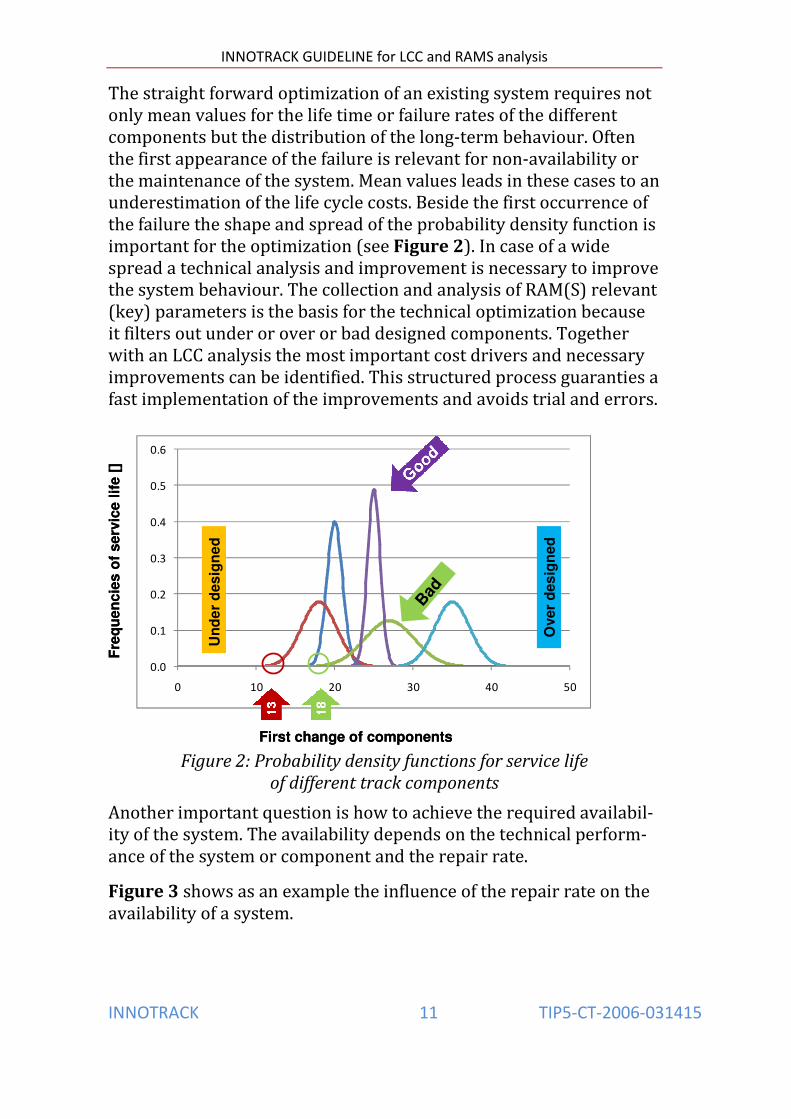
Definition of the targets
Description of object
Definition of event
Description of environment
Modelling
Allocation of data, Quality of data
AmountHomogeneityPlausibilityConsistency
Analysis, Prediction and Optimisation
Results and Verification
Impact on product & process
Documentation
History
Control loop of Reliability Management:

•
•
•
•
• • • • •
• •
• • • • • • •

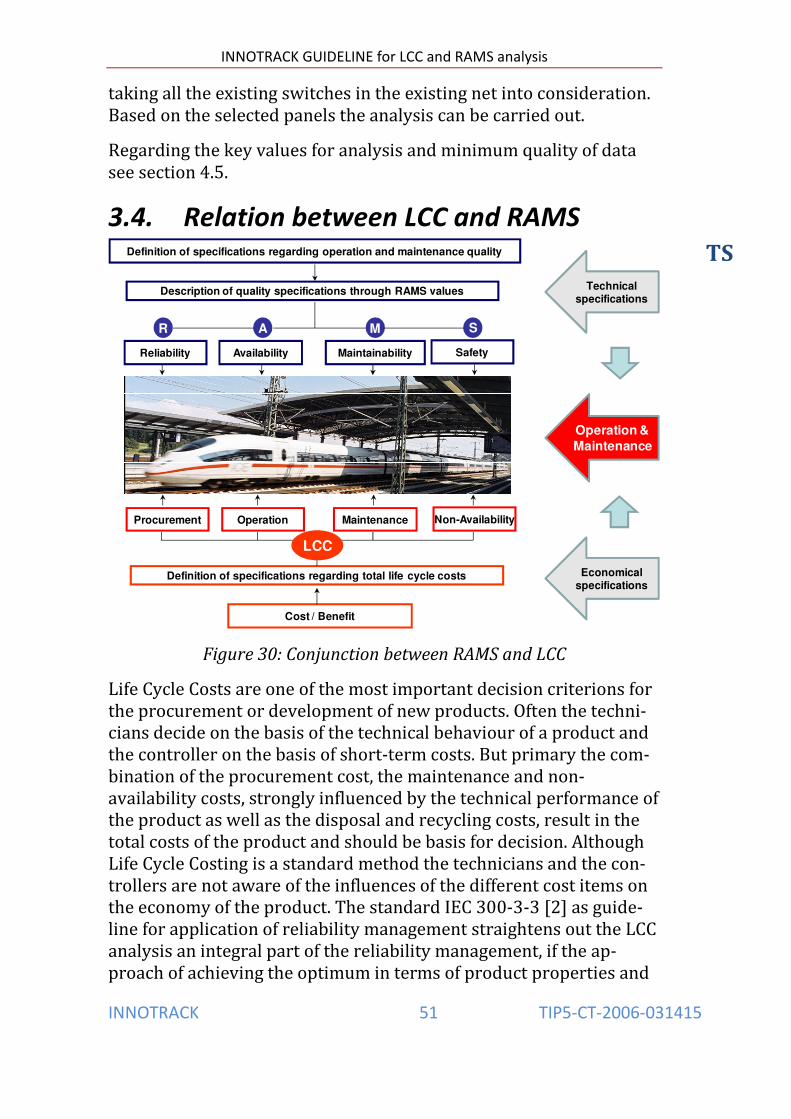
Description of quality specifications through RAMS values
Definition of specifications regarding operation and maintenance quality
Cost / Benefit
Definition of specifications regarding total life cycle costs
MaintainabilityReliability SafetyAvailability
SR A M
MaintenanceProcurement Non-AvailabilityOperation
LCC
Technical specifications
Economical specifications
Operation &Maintenance

4. RAMS and LCC Analysis


• o
o o o
• o o
• • • •

• • • • • •

1. Concept2.System
definition
4.System
Require-
ments5. Apportion-
ment
SystemRequirementsSpecification
11. Operation &
Maintenance
12. Performance monitoring
13. Modification & retrofit
14. Decommissioning &
disposal
10. SystemIntegration& Accep-tance9. System
Validation
8.Installation
7.Manufacturing
6.Design &
Implemen-tation
ClientRequirementsSpecification
Engineering phase Realisation phase
Detailleddesign
Project Y / N
Time
Specifications for contract
Conceptual phase Operational phase


Reliability Availability Maintainability Safety
MTBF, Mean Time Be-tween Failure for correc-tive maintenance MTBM, Mean Time Be-tween Maintenance for preventive maintenance MTBCF, Mean Time Be-tween Critical Failure MTBSAF, Mean Time Between Service Affect-ing Failure
Train delay hours
PPM, Passenger Performance Measure
MTTR or MART, Mean Time to Repair or Mean Active Repair Time MTTM, Mean Time to Main-tain MDT, Mean Down Time
Hazard Rate Number of de-railment due to asset Number of acci-dents

•
• • • • •

#
$T
MTBF =
$#%

•
• •
•

RA
M
S
LCC
RAMS / LCC
Social Cost and
Benefit analyses
RAMS / LCC spec
2B Preferred Variant Study 3 Realisation
2A Varianten
Study 1 InvestigationAnalyse
Faster from
A B
Tunnel or
bridge
Concrete or
steel
Galvanizing
or paint
Example of
degree of detail
RAMS
New Infra
phase 1 / 2A / 2B / 3
outputinput
question
method


•
•
•

•
• •
•

•
•
•
• •
•
• • •
•
•
•
•
• Output
• o
• o
o

o
•
o &
o o
•
• •
•
•
•
•
•

• •
•
•
•
•
•
o
o
•
•
•

•
•
• • •
• •
• o
o
o
o
o
o
• o
o
• o

•
•
•
•
•

•
•
•
• •
•
• • •

• • •
• •
• •
• •
•
•
• • • • • •

• •
• o
o
o
o
• •
• • •
• • o o o o o
1 Costs of Corrective Maintenance as part of the life cycle costs relate not only to the disrup-tions caused by timetable affecting errors, but also to the errors that do not directly affect the train service.
•
• •
•
•
•
•

•
•
• •
•
•
• •
•
• •
•
• o o
o

o
•
Social Cost and
Benefit Analysis
SCBA
others
Cost for
unavailability
LCC
A
S
M
R
Function
+
+
' (!)
Shorter journey
……..
# trains
# passengers
Value of Time
• •
•
•
• • • •
•
• •
• •
• •

• o
o o
• o o
• •
•
• •
• o o
o
o
o
•

•
o
o
o
o
• o o o
• o
•

•
•
•
• • • • • •
• • •
•
•
• o
o
o
o
• o o o o
• o o
o •

5. General analytic methods and tools


•
•
•


• • • •
2 The list of tools shows only a small extract of possible tools
Cost Breakdown Structure 1 LCC
1.1 INVESTMENT
1.1.1 Investment (Renewal)
1.1.1.1 Ballast
1.1.1.2 Sleeper incl. Fastening/ Freight
1.1.1.3 USP/ UBP
1.1.1.4 Rail incl. Freight
1.1.1.5 Substructure Measure
1.1.1.6 Installation
1.1.2 Rail Renewal
1.1.3 Disposal
1.1.3.1 Residual Value
1.1.3.2 Recycling
1.2 MAINTENANCE
1.2.1 Inspection Vehicle
1.2.2 Visual Inspection
1.2.3 Day-To-Day Track Maintenance
1.2.4 Ballast Tamping
1.2.5 Rail Grinding
1.2.6 Control of the Vegetation
1.2.7 Change ZW/ZWP
1.3 NON-AVAILABILITY
1.3.1 Planned
1.3.1.1 Day-To-Day Track Maintenance
1.3.1.2 Ballast Tamping 1.3.1.3 Rail Grinding
1.3.1.4 Rail Relying 1.3.1.5 Track Stoppage Reinvestment
1.3.2 Not-Planned
1.3.2.1 Track Stoppage
1.3.2.2 Speed Restriction
Cost Breakdown Structure
Product TreeProduct Tree
1 TRACK
1.1 Rail
1.1.1 UIC 60
1.2 Rail Pad ZW700
1.3 Sleeper
1.3.1 B 70 W
1.4 Under Sleeper Pad
1.5 Ballast 1.6 Subsoil

6. Compilation of results
7. Operational Phase and Imple-mentation

• •

• • • •

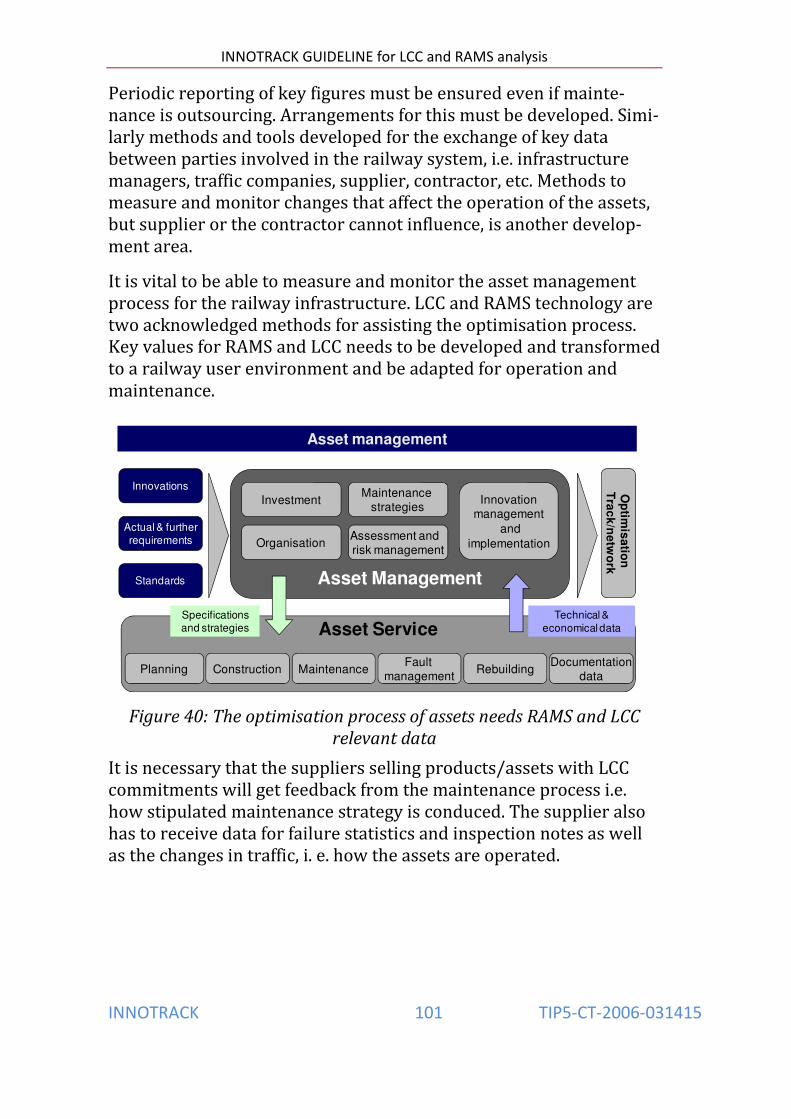
Asset Service
Asset management
Asset Management
Investment
Organisation
Maintenance strategies
Assessment and risk management
Innovationmanagement
and implementation
Actual & furtherrequirements
Standards
Innovations
Planning Construction MaintenanceFault
managementDocumentation
data
Op
timis
atio
n
Tra
ck
/ne
two
rk
Rebuilding
Technical & economical data
Specifications and strategies

Annex I Examples


Timetable affecting errors
Performance level crossing: timetable af-
fecting errors
function
repair
time
[hour]
Number
of er-
rors
Average func-
tion repair
time [hour]
Average
number of
errors
Error caused by technique 7,550 6 1,258 0,200
Error caused by third parties 30,050 20 1,503 0,667
Error caused by wheather 7,267 2 3,633 0,067
Non-timetable affecting errors
Performance level crossing: non-timetable
affecting errors
function
repair
time
[hour]
Number
of er-
rors
Average func-
tion repair
time [hour]
Average
number of
errors
Non-timetable affecting errors 731,150 125 5,849 4,167
For underpasses in comparable situations (12 found) no timetable affecting errors are regis-tered in the last 3 years. For non-timetable affecting errors no reliable data was found.
Based on every hour four passenger trains and one freight train per direction this leads to delay and cancellation of trains. Knowing it is not correct we simplified the model by assuming for this study that a timetable affecting error only leads to cancellation of trains.
Performance data
All Level
crossings
average
Netherlands
Comparable
Level cross-
ing
Comparable
Tunnel
Number of hours not available (due to errors) 0.535 1.496 0
Number of cancelled passenger trains 4.280 11.964 0
Number of delayed freight trains 0.535 1.496 0
Safety: Like performance also safety on a level crossing near a station has its own specific key fig-ures. We searched for safety figures for comparable level crossings, see next table:
Safety data Deaths /
year
Seriously
injured /
year
Slightly
injured /
year
Level crossing 0,044 0,022 0,00
Underpass 0 0 0
Cost data: For the two variants the cost data is shown in the next table:
Cost data Level crossing Tunnel Comment
Total Investment (including station and perron) 6.455.000 1.458.100
Investment (excluding station and perron) 1.854.000 9.974.000
Social costs for train free period during realization
phase
Figures can vary per
Infra Manager

Cost data Level crossing Tunnel Comment
• 1 period of 29 hours in weekend
• 1 period of 52 hours in weekend
98.000
201.000
Preventive maintenance cost per year 40.000
Periodic replacements level crossing
• Roaddeck (40 year)
• Replace track (20 year)
• Half barrier (25 year, 6 pcs)
• Barrier motor (15 year, 6 pcs)
• Maintain track (15 year)
354.300
75.000
60.000
15.000
10.000
Maintenance tunnel
• Small maintenance (1 year)
• Large inspection (10 year)
• Painting (15 year)
• Large construction repairs (40 year)
5.500
1.500
8.500
100.000
Social cost for road transport 57.000
Cost for safety:
• Deaths
• Seriously injured
• Slightly injured
1.500.000
200.000
30.000
Figures can vary per
Infra Manager
Economic value of delayed freight train per hour 1.000 1.000
Cost for repair in case of errors 1.000 1.000
Cost for cancelled train on track Eindhoven – Weert:
• Week days: based on 263 passengers per
train
• Weekend days: based on 124 passengers
per train
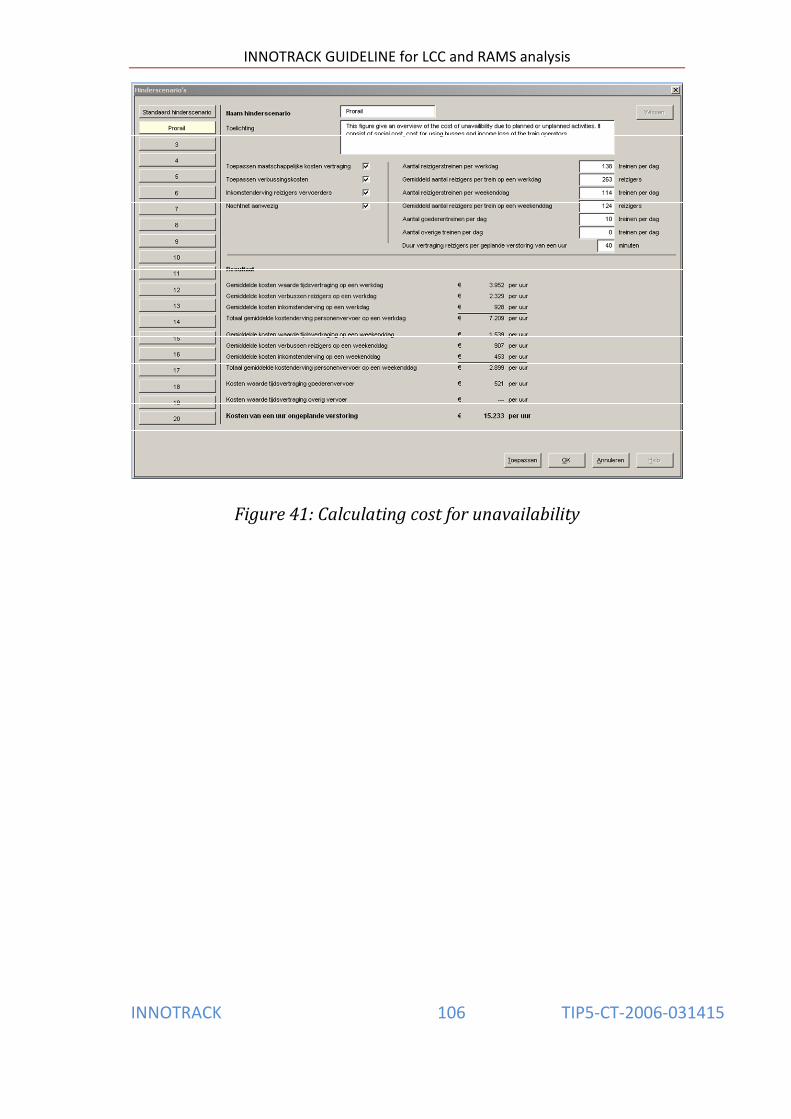
15.233
Figures can vary per
Infra Manager
Based on the performance, safety and cost data it is possible to make a complete RAMS / LCC analyses using the methodology shown in this guideline.
LCC: Next table shows the LCC costs using Net Present Value (interest + inflation = 4 %),:
LCC Level
crossing Tunnel
Net Present Value 30 year 3.853.417 9.890.259
Net Present Value 50 year 4.372.113 9.934.517
Net Present Value 100 year 4.717.799 9.956.606
Including all the social cost – benefits the total costs during the lifetime using Net Present Value (interest + inflation = 4 %) are:
LCC + social cost – benefits Level
crossing Tunnel
Net Present Value 30 year 7.812.598 9.890.259
Net Present Value 50 year 9.238.223 9.934.517
Net Present Value 100 year 10.238.176 9.956.606
So based on all these data the decision for a variant can be made. But be aware that RAMS / LCC is not the only parameter the project managers uses to choose for a variant!

Technical optimisation
Steel grades • R260• R350 HT• R370Cr HT• R400 HT
Rail type• S54• UIC60• UIC70plus
Process optimisation
Maintenance strategy• Corrective• Predictive• Grinding / milling machine• Possession time• Metal removal• Undergrinding of
head checks
Important boundary conditions
Probability density functions• Crack growth• Wear
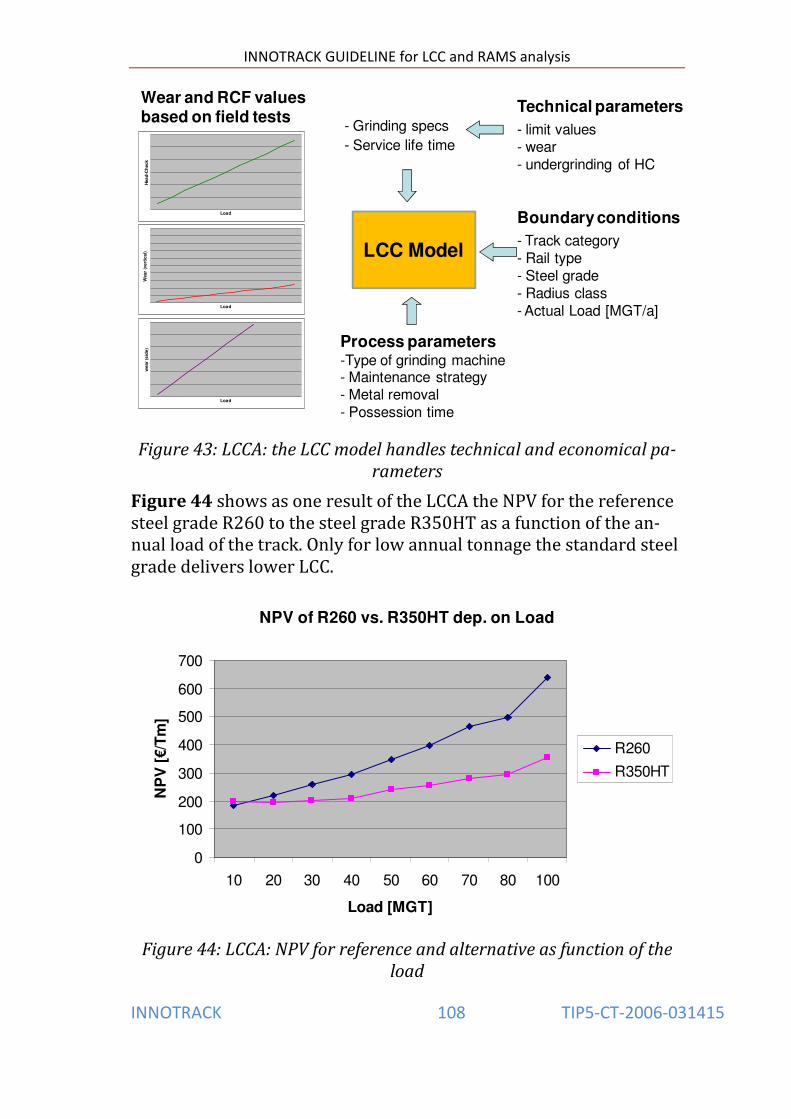
Technical parameters
- limit values- wear- undergrinding of HC
Boundary conditions
- Track category - Rail type- Steel grade- Radius class- Actual Load [MGT/a]
Wear and RCF values based on field tests
Process parameters-Type of grinding machine- Maintenance strategy- Metal removal- Possession time
- Grinding specs
- Service life time
Load
Hea
d-C
heck
Load
Wear
(vert
ical)
Load
wear
(sid
e)
LCC Model
NPV of R260 vs. R350HT dep. on Load
0
100
200
300
400
500
600
700
10 20 30 40 50 60 70 80 100
Load [MGT]
NP
V [!/T
m]
R260
R350HT

relevant for metal removal
to clarify
R 260 and
R350HT
Grinding
Cost for investment and non-availability
Wear and RCF
Same grinding performance for
HT grade
Maintenance –fault clearance
Mixed trafficRadius 700–1500 m20-30 MGT/a
Load dependent maintenance
costs
Corrective maintenance
Service life of the rails
Variable load of track
In/Out-frame – Standard rail grade vs. hard rail grade
Outside of calculation
Interactions with other SPs
Regulations of each country
Reference to test sites and experiments
Same grinding performance for HT grade?
welding quality and costs
Inside of the LCC calculation
In/Out-frame
II. Operation
II.1 Service II.1.2 Energy
II.10 Other costs
III. Maintenance
III.1 Inspection and service (track)
III.2 Maintenance –preventive
III.4 Maintenance - corrective
III.7 Design and systemsupport
III.10 Other costs
IV. Non Availability
IV.1 Planned IV.1.1 MalfunctionsIV.1.2 DelaysIV.1.3 Serviceability
IV.2 Unplanned IV.2.1 MalfunctionsIV.2.2 DelaysIV.2.3 Serviceability
IV.10 Other costs
I. Procurement
I.1 Preparation - one-time
I.2 Preparation recurrentproject-specific
I.3 Investment
I.4 Imputed residual value
I.5 Decommissioning / retraction / sale /removal (tasks)
I.6 Disposal / recycling
I.10 Other costs
V. Social Economics
V.1 Energy consumption V.3 Delay
V.2 Environment V.10 Other costs
Used cost elements

Discount rate: 8 %
Inflation rate: 2 %
Effective rate : 5.8 %
Remark: RCF measurements at DB
ParameterReference case
R260 (standard rail grade)
Service life (R 700-1500 m)40 years
for 30 MGT/a
InnovationR350 HT (hard rail grade)
20 yearsfor 30 MGT/a
Wear rates w1: 0,2 mm/100 MGT, w3: 0,4 mm(100 MGT
w1: 0,3 mm/100 MGT, w3: 0,7 mm/100 MGT
RCF rate / Head-Check 0,30 mm/100 MGT0,75 mm/100 MGT
Grinding interval for 0,8 mm metal removal
(6 [a]30 MGT/a
(2 [a]30 MGT/a
Rail renewal Load dependent Load dependent, at least 1
during 40 years
LCC - standard rail grade vs. hard rail grade
Cost block
Investment
xxx !/Tm*)
load dependent, nom. 20 yearProcurementExperts / Analysis
xxx !/Tmload dependent, nom. 40 yearProcurementExperts / Analysis
Operation N/a N/a
MaintenanceRail renewal
xxx !/Tmload dependent, nom. 20 yearIMExperts / Analysis
1xxx !/Tmload dependent, nom. 40 yearIMEstimation / Experts / Analysis
Maintenance Rail grinding
x-xx !/m per shiftload-, radius dependent , 1 yearRIMExperts / Analysis
x-xx !/m per shiftload-, radius dependent , 3 yearIMExperts / Analysis
Non-Availability
Track Category dependent load dependent IMAnalysis
Track Category dependent load dependent IMAnalysis
Reference caseR260 (standard rail grade)
InnovationR350 HT (hard rail grade)
Data structure
EuroCycleSourceQuality
EuroCycleSourceQuality
EuroCycleSourceQuality
EuroCycleSourceQuality
EuroCycleSourceQuality
LCC - standard rail grade vs. hard rail grade
*) Tm = Track meter

Annex II Questions per project phase per RAMS / LCC analysis
Questions 1 Investigation 2A Variants study
2B Preferred al-ternative
3 Implementa-tion
RA What change in reliability and avail-ability of the train routes can (as a consequence of infrastructural changes) be ex-pected if the func-tion change is implemented?
What change in RA performance is expected for the different variants, in rela-tion to the exist-ing situation?
What change in RA performance is expected for the different options of the preferred vari-ant in relation to the current situa-tion?
What change in RA performance is expected for the chosen technical solu-tion in relation to the existing situation?
M What change in maintenance work (hours, money) is expected when the change is imple-mented in relation to the current situa-tion?
What change in maintenance work (hours, money) is ex-pected from the different variants in relation to the current situa-tion?
What change in maintenance work (hours, money) is expected for the different options of the preferred vari-ant in relation to the existing situa-tion?
What change in maintenance work (hours, money) is ex-pected after im-plementation in relation to the existing situa-tion?
S What change in the safety of the railway system can be ex-pected if the in-tended function change is imple-mented?
What change in the safety of the rail system is expected from the different variants in rela-tion to the exist-ing situation?
What change in the safety of the railway system is expected for the different options of the preferred vari-ant in relation to the existing situa-tion?
What change in the safety of the railway system is expected for the selected technical solu-tion in relation to the existing situation?
LCC What change in life cycle costs is asso-ciated with the im-plementation of the function change?
What life cycle costs are asso-ciated with the different vari-ants?
What life cycle costs are associ-ated with the dif-ferent options?
What life cycle costs are ex-pected after im-plementation?
RAMS / LCC
What reliability, availability and safety can be achieved at what life cycle costs?
What level of reliability, avail-ability and safety can be achieved per variant at what life cycle costs?
What option has the highest level of reliability, availabil-ity and safety at the lowest life cy-cle costs?
What technical solution pro-vides the high-est level of reliability, avail-ability and safety at the lowest life cycle costs?

Social cost – benefit analysis
What expected costs and benefits relate to the func-tion change?
What expected costs and bene-fits relate to every variant?
What expected costs and benefits relate to every op-tion?
What costs and benefits are ex-pected after the implementation?
RAMS / LCC specifica-tion
What RAMS re-quirements can we specify, and at what maximum life costs should it be possi-ble to implement the function change?
What RAMS requirements can we specify and at what maximum life cycle costs should it be possible to im-plement the in-fra change?
What RAMS re-quirements can we specify and at what maximum life cycle costs should it be possible to achieve the infra change?
What RAMS performance is expected in the operational phase and what are the maxi-mum life cycle costs for the selected techni-cal solution?
Annex III References