Institutional Presentation 4Q09 Roadshow Presentation ... · Roadshow Presentation February, 2010...
38
Roadshow Presentation February, 2010 Institutional Presentation 4Q09 Investor Relations
Transcript of Institutional Presentation 4Q09 Roadshow Presentation ... · Roadshow Presentation February, 2010...

Roadshow PresentationFebruary, 2010
Institutional Presentation 4Q09
Investor Relations

Agenda
Overview and Strategy
4Q09 Results
Peers Comparison and Conclusion
Appendix
2
Brazilian Credit Market
Dealing with the Global Crisis
Pag. 2
Pag. 6
Pag. 19
Pag. 13
Pag. 28
Pag. 32

36.6%
32.1%28.8%
26.8% 27.9%24.9% 26.4% 24.7%
22.0%24.0% 24.5%
28.1%30.2%
34.2%
41.3%44.6%
1994 1995 1996 1997 1998 1999 2000 2001 2002 2003 2004 2005 2006 2007 2008 2009
106%
79%
57%
41% 40%32%
26% 24%
China Chile India Brazil Russia Colômbia Peru Mexico
Source: Central Bank, IPEAData, Euromonitor and International Monetary Fund.
(1) As of October, 2009
(2) 2007 data, except for Brazil, which is 2008 data(3) As of September, 2009
Overview of the Brazilian Credit Market vs. Daycoval
3
Credit Evolution in Brazil (% of GDP)1
Total Loans as % of GDP2

216 261335
465652
981
1,639
3,476
3,981 3,945
2000 2001 2002 2003 2004 2005 2006 2007 2008 2009
Daycoval’s Strong Growth Profile...
Total Loan Portfolio1 - R$ mn
Banco Santos Crisis / Beginning of Payroll Loans
4
3%
9%
31%
15%
21%
29%
39% 40%
51%
67%
112%
28%
21%22%19%
14% 15%
-1%
2001 2002 2003 2004 2005 2006 2007 2008 2009
Brazilian Credit Volume Daycoval Loan Portfolio
Financial System Total Credit Operations vs. Banco Daycoval (% p.a.)
Banco Daycoval
CAGR: 40%
Change: 1,411%
Financial System
CAGR: 20%
Change: 319%
Accumulated since 2000
Branch Expansion Program
IPO
World Crisis

5
...Supported by Consistent Funding in Good and Bad Times
Total Funding1 - R$ mn
Eurobond
U$ 65mn
Eurobond U$ 120
mn / FIDC Middle
Banco Santos Crisis/
Creation of Daycoval Asset
Management
IPO / AB Loan-IFC
U$ 115 mn
Eurobond U$ 225
mn / World Crisis
Private Placement
R$ 410 mn1 Funding = Total Deposits + Foreign Issuances +
Borowing and Onlending (does not include FIDC)
180 217318
498
754
1,226
1,868
2,977
3,273
3,509
2000 2001 2002 2003 2004 2005 2006 2007 2008 2009
CAGR 00 – 09: 39.1%

Agenda
6
Overview and Strategy
4Q09 Results
Peers Comparison and Conclusion
Appendix
Brazilian Credit Market
Dealing with the Global Crisis

Daycoval’s Corporate Structure and Presence
27 Branches
Londrina - PR
Maceió - AL
Manaus - AM
Porto Alegre - RS
Recife - PE
Rio de Janeiro - RJ
Salvador - BA
Vitória - ES
Ribeirão Preto - SP
São Bernardo - SP
São Paulo – SP - HQ
Goiânia - GO
Guarulhos - SP
Campo Grande - MS
Caxias do Sul - RS
Cuiabá - MT
Curitiba - PR
Florianópolis - SC
Fortaleza - CE
Aracaju - SE
Belém - PA
Belo Horizonte - MG
Brasília - DF
Campinas - SP
Bom Retiro
Brás
Alphaville
7
National PresenceCapital Structure – December/09
65%
25%
9%
1%
Daycoval Holding Financeira S.A.Free-floatControlling Shareholders (Family Dayan) + Daycoval ExpertTreasury
Total Shares: 216 million shares
Start of the Second Shares Buyback Program in
October/09
First middle market bank to implement a ADR
Level I Program
Coverage by research analysts from 14 local and
international brokerage firms
593 employees

Daycoval’s Strategy
8
Pursue higher returns with the lowest possible risk
Maintain Low Leverage and High Liquidity policy
Maintain the quality of collaterals
Long term funding to match the growing payroll portfolio strategy
Focus and expected share gain along next years
Participate in the market expansion
Reduction of exposure
Auto
Payroll
Middle Market

9
Direct Credit to Consumers (DCC): the product complements the Bank´s operation for individuals
Direct Credit to Consumers
Financing of goods and services through partnershipswith a number of retailers, such as home furnishings,appliances, etc
Payment guaranteed by “pre-dated” checks at rates andterms that are competitive with the market
Partnerships with many shops, seeking to increase sales,offering the end consumer greater purchasing facilities
Total Loan Portfolio - R$ Million
6
10
16
2224
4Q08 1Q09 2Q09 3Q09 4Q09

10
Strategy: New Credit Products and Services

3691
139
241 239
622
2004 2005 2006 2007 2008 2009
Asset Management
11
Created in 2004 for the Bank’s clients who wereseeking sophisticated products customized for theirown profile, the system is supported by aspecialized team of staff members with deepunderstanding of the market.
Currently with total equity of approximately R$ 620million and has been launching new funds anddifferentiated products, such as portfoliomanagement.
Daycoval Asset ManagementAssets Under Management – R$ mn
CAGR 04 – 09: 76.8%

Ratings: raised by Standard&Poors and Fitch Ratings
Global ScaleLong Term BBShort Term B
National ScaleLong Term brAA-Short Term brA-2
Stable
November 2009
Global ScaleLong Term BBShort Term B
National ScaleLong Term A + (bra)Short Term F1 (bra)
Stable
December 2009
National ScaleLong Term AA-Short Term A-1
Stable
October 2009
Low Risk – mid-termIndex 11.11
January 2010
12

Agenda
13
Overview and Strategy
4Q09 Results
Peers Comparison and Conclusion
Appendix
Brazilian Credit Market
Dealing with the Global Crisis

14
Conservative Risk Profile and Improved Efficiency
Primary focus on liquidity
Raising of R$410mn through the issuance of a 5y private convertible note (Cartesian Capital Group, LLC, International Finance Corporation - IFC and Wolfensohn Capital Partners Holdings II)
Managing portfolio to match available funding
Strict credit policies
Strategic reduction of credit portfolio from 4Q08, with a gradual and more conservative recovery in production since 2Q09
Shorter tenors and improvement of collateral package for new loans
Non-renewal of defaulted loans and execution of guarantees
Effort to maintain low costs
Personnel and administrative expenses declined by 28.8% in 2009, compared to 2008

15
Conservative Recovery in Production since 2Q09
4,626
3,981
3,548 3,533 3,656
3,945 2,439
1,070 9691,172
1,262
1,579
500
1,000
1,500
2,000
2,500
3,000
3,500
1,500
2,000
2,500
3,000
3,500
4,000
4,500
5,000
3Q08 4Q08 1Q09 2Q09 3Q09 4Q09
Loan Portfolio Production
2,811
2,231
1,860 1,860 1,994
2,256 2,073
982864
1,0051,083
1,350
500
750
1,000
1,250
1,500
1,750
2,000
2,250
2,500
500
1,000
1,500
2,000
2,500
3,000
3Q08 4Q08 1Q09 2Q09 3Q09 4Q09
Middle Market Total Loans Production
869 858 853
899
957
1,052
183
68 83
139
158
203
0
50
100
150
200
250
300
350
400
500
600
700
800
900
1,000
1,100
3Q08 4Q08 1Q09 2Q09 3Q09 4Q09
Payroll Total Loans Production
946 892
835
774
706
637
184
20
20 19 18 26
0
50
100
150
200
250
200
300
400
500
600
700
800
900
1,000
3Q08 4Q08 1Q09 2Q09 3Q09 4Q09
Vehicles Total Loans Production
Total Loans - R$ million Middle Market + Others Loans - R$ million
Payroll Total Loans - R$ million Vehicles Total Loans - R$ million

16
Establishment of Provision - R$
MM1Q08 2Q08 3Q08 4Q08 1Q09 2Q09 3Q09 4Q09 2008 2009
Middle Market + Trade Finance 12.5 17.2 28.9 44.4 38.6 40.9 36.7 (4.1) 103.0 112.2
Payroll 4.0 2.8 7.4 4.6 7.0 7.1 6.0 8.5 18.8 28.6
Auto 13.0 8.1 15.2 18.5 29.2 30.5 24.9 12.0 54.8 96.7
DCC - - 0.1 0.2 0.4 0.6 0.6 0.6 0.3 1.9
Total 29.5 28.1 51.6 67.7 75.2 79.1 68.2 17.0 176.9 239.5
Conservative Provisioning Measures Implemented
Write-offs - R$ MM 1Q08 2Q08 3Q08 4Q08 1Q09 2Q09 3Q09 4Q09 2008 2009
Middle Market + Trade Finance 6.1 8.7 6.6 21.3 20.6 26.4 29.8 37.6 42.7 114.2
Retail 2.7 4.1 6.8 11.8 19.5 21.9 29.6 34.5 25.4 105.7
Total 8.8 12.8 13.4 33.1 40.1 48.3 59.4 72.1 68.1 219.9
Write-offs / Total Loan Portfolio
(%)
0.2% 0.3% 0.3% 1.0% 1.3% 1.5% 1.8% 2.0% 2.0% 6.1%
Recovered Loans - R$ MM 1Q08 2Q08 3Q08 4Q08 1Q09 2Q09 3Q09 4Q09 2008 2009
Total 1.1 1.7 1.3 2.9 1.4 7.1 12.6 7.7 7.0 28.8

17
Overdue Loans > 60 days - R$ MM 1Q08 3
T
2Q08 3
T
3Q08 3
T
4Q08 1Q09 2Q09 3Q09 4Q09
Middle Market + Trade Finance 41.2 46.6 98.9 104.8 120.3 120.4 123.1 66.8
Payroll 3.0 3.4 3.9 4.8 5.4 6.5 6.2 6.8
Auto 4.2 8.0 12.7 17.3 21.7 25.7 25.3 21.4
DCC - - - 0.1 0.3 0.5 0.6 0.9
Total 48.4 58.0 115.5 127.0 147.7 153.1 155.2 95.9
Overdue Loans > 60 days / Total Loan 1.3% 1.3% 2.7% 3.7% 4.8% 4.9% 4.7% 2.6%
LLP Balance / Overdue Loans > 60 days (%) 196.7% 190.5% 128.7% 144.3% 147.9% 162.8% 166.2% 212.0%
Daycoval Overview
Loan D-H - R$ MM 1Q08 3
T
2Q08 3
T
3Q08 3
T
4Q08 1Q09 2Q09 3Q09 4Q09
Middle Market + Trade Finance 64.4 62.2 130.3 149.8 194.8 233.8 220.5 146.1
Payroll 18.0 17.9 21.1 23.0 26.4 28.2 25.3 30.7
Auto 39.3 46.4 66.5 86.7 112.7 126.4 119.1 97.2
DCC - - 0.1 0.5 0.9 1.5 1.7 1.9
Total 121.7 126.5 218.0 260.0 334.8 389.9 366.6 275.9
Loan D-H / Total Loan Portfolio (%) 3.3% 2.9% 5.0% 7.5% 10.8% 12.4% 11.0% 7.3%

18
Rating Loan - R$ MM % Provision - R$ MM
AA 115.0 3.1% -
A 1,577.2 42.0% 7.9
B 1,531.3 40.8% 15.3
C 127.9 3.4% 3.8
D 54.2 1.4% 5.4
E 37.4 1.0% 11.2
F 36.3 1.0% 18.2
G 23.1 0.6% 16.2
H 124.9 3.3% 124.9
Subtotal 3,627.3 96.5% 202.9
Credit Assignments 130.0 3.5% 1.0
Total 3,757.3 100.0% 203.9
Credit Portfolio QualityDecember/2009
Agenda
19
Overview and Strategy
4Q09 Results
Peers Comparison and Conclusion
Appendix
Brazilian Credit Market
Dealing with the Global Crisis

20
Liquidity: positive gap between liabilities and assets in maturities over the next 12 months
Average Term of
Loan Portfolio:
404 days
Cash Evolution - R$ Million Cash / Total Deposits – %
% Loan Portfolio - Outstanding Operations – 4Q09
Average Term of
Funding Portfolio:
516 days
% Funding - Outstanding Operations – 4Q09
1,138
1,674 1,511
1,708
1,372
4Q08 1Q09 2Q09 3Q09 4Q09
64.8
87.1
74.4 73.3
57.6
4Q08 1Q09 2Q09 3Q09 4Q09
33%
31%
29%
6% 1%
Up to 3 months From 3 to 12 monthsFrom 1 to 3 years From 3 to 5 yearsOver 5 years
19%
33%28%
15%
1% 4%
Up to 3 months From 3 to 12 monthsFrom 1 to 3 years From 3 to 5 yearsOver 5 years No maturity

56%27%
16%
1%
Middle Market / Trade FinancePayroll
Auto Loans
DCC
3,706 3,312 3,334 3,493 3,815
275 236 199 163
130
4Q08 1Q09 2Q09 3Q09 4Q09
54% 57% 62% 65% 68%
24% 23% 20% 17% 11%
22% 20% 18% 18% 21%
4Q08 1Q09 2Q09 3Q09 4Q09
Total Deposit Foreign IssuancesBorrowing and Onlending
Funding – R$ MillionBreakdown of Funding
Loan Portfolio - R$ MillionBreakdown of Loan Portfolio – 4Q09 (*)
(*) includes credit assignmentsCredit assignments
3,273 3,5673,2643,377 3,509
3,9813,548 3,533 3,656
3,945
Funding & Credit Portfolio: volume of the portfolio returns to 2008’s level
21
Funding (R$ MM) 4Q09 3Q09 Chg. %
Total Deposits 2,381.8 2,331.4 2.2%
Demand Deposits + Other Deposits 124.7 92.0 35.5%
Time Deposits 2,122.5 2,088.7 1.6%
Interbank Deposits 134.6 150.7 -10.7%
Foreign Issuances 373.4 589.5 -36.7%
Borrowing and Onlending 753.6 646.1 16.6%
Total 3,508.8 3,567.0 -1.6%

Average Ticket – Middle Market + Trade Finance – 4Q09Middle Market + Trade Finance - R$ Million
Sectors Breakdown – Middle Market – 4Q09 Geographic Distribution – Middle Market – 4Q09
Middle Market + Trade Finance: sector’s recovery continues to be consistent
22
2,028 1,689 1,705 1,787
2,043
197
171 155 185
189
4Q08 1Q09 2Q09 3Q09 4Q09
Middle Market Trade Finance
2,2251,972
1,8601,860
2,232
59%
13%
12%
10%
6%Southeast
South
Northeast
Mid-west
North
42%
33%
18%
7%Industry
Services
Commerce
Other
Final Balance R$ Per
Volume
Per
Client
< 500,000 6.8% 61.7%
500,000 to 1 million 8.1% 13.3%
1 to 3 million 22.3% 15.6%
3 to 5 million 11.8% 3.7%
5 to 10 million 22.3% 3.8%
> 10 million 28.7% 1.9%
Total 100.0%

40%
15%
22%
9%
7%6%
1%
INSS
State Government
Army
Law Courts and Legislative Bodies
Municipalities
Other
Private
23
Daycred Payroll: Government related risk dictate the pace of origination
Total Origination – R$ Million Total Origination 2009 – R$ 203 mn
Total Loan Portfolio (*) - R$ Million Total Loan Portfolio 2009 – R$ 1,052 mn
(*) Includes credit assignments in all of the quarters (R$ 71 million in 4Q09)
858 854 899 9571,052
4Q08 1Q09 2Q09 3Q09 4Q09
6583
139158
203
4Q08 1Q09 2Q09 3Q09 4Q09
27%
17%45%
5%5%
1%
INSS
State Government
Army
Law Courts and Legislative Bodies
Municipalities
Private + Others

24
Daycred Vehicles: reducing the portfolio continues to be the strategy
Total Origination - R$ Million
Total Loan Portfolio (*) – R$ Million Total Loan Portfolio 4Q09 - R$ 637 million
(*) Includes credit assignments in all of the quarters (R$ 59 million in 4Q09)
892 835774
706637
4Q08 1Q09 2Q09 3Q09 4Q09
20 20 19 18
26
4Q08 1Q09 2Q09 3Q09 4Q09
66%21%
13%
Small Vehicles
Heavy-duty Vehicles
Motorcycles
Liquidity of Auto Loans Portfolio -
Aug/06 to Set/09R$ MM %
%
Accum.
PMT´s received in advance 282.3 33.6% 33.6%
PMT´s received on date of maturity 111.2 13.2% 46.8%
PMT´s received with delay of 30 days 258.5 30.8% 77.6%
PMT´sreceived with delay of 60 to 120 days 96.6 11.5% 262.1%
PMT´s received with delay over 120 days 16.6 2.0% 91.1%
PMT´s overdue 75.1 8.9% 100.0%
Liquidity of the Auto Loans Portfolio 765.2 91.1%
Outstanding PMT´s Total Amount 840.3 100.0%

25
Efficiency Ratio: increase in costs did not force the indicator during the quarter
4Q09 3Q09 Chg. % 4Q08 Chg. % 2009 2008 Chg. %
Personnel Expenses (17.8) (15.5) 14.7% (18.9) -6.0% (63.9) (71.0) -10.0%
Other Administrative Expenses (17.5) (15.7) 11.6% (18.7) -6.5% (65.8) (68.9) -4.6%
Subtotal (35.3) (31.2) 13.1% (37.6) -6.2% (129.7) (139.9) -7.3%
Payroll (4.9) (6.1) -19.9% (10.0) -51.2% (23.6) (58.0) -59.3%
-1.5%Auto Loan (4.0) (4.5) -11.3% (7.7) -47.9% (18.7) (45.5) -58.8%
DCC (0.4) (0.4) 0.0% (0.1) n.a. (1.3) (0.2) n.a.
Comission Expenses (total)(1) (9.3) (11.0) -15.7% (17.8) -47.9% (43.6) (103.7) -58.0%
Total (44.6) (42.2) 5.6% (55.4) -19.6% (173.3) (243.6) -28.9%
Efficiency Ratio - %
30.3
21.7 22.723.2 22.6
33.0 30.328.0 25.8
22.5
4Q08 1Q09 2Q09 3Q09 4Q09
Quarterly Last 12 months

26
Profitability: increase of all indicators in the quarterly and annual variations
Return on Average Equity (ROAE) - %
Net Income - R$ Million
Net Interest Margin (NIM) - %
20.442.0
82.5
200.2 211.1
4Q08 3Q09 4Q09 2008 2009
5.1
10.7
21.4
12.6 12.9
4Q08 3Q09 4Q09 2008 2009
11.4 12.2 13.010.6
12.1
4Q08 3Q09 4Q09 2008 2009

27
Capital Structure: maintenance of a low level of leverage
Basel Index - %Shareholders’ Equity – R$ Million
Loan Portfolio / Shareholders’ Equity - times
2.21.9 1.9 2.0 2.1
4Q08 1Q09 2Q09 3Q09 4Q09
28.2 30.1 30.5 29.3 28.6
4Q08 1Q09 2Q09 3Q09 4Q09
1,607.2 1,634.1 1,631.1 1,646.3 1,692.7
4Q08 1Q09 2Q09 3Q09 4Q09
Agenda
28
Overview and Strategy
4Q09 Results
Peers Comparison and Conclusion
Appendix
Brazilian Credit Market
Dealing with the Global Crisis

Source: Banks reports
1. as of December 2009
Daycoval is Recognized by its Solid Capital Structure and Efficiency
29
Loan Portfolio (R$bn)1
BIS Ratio1Shareholders’ Equity (R$bn)1
Loan Portfolio / Shareholder´s Equity 1
1.81.7
1.6
1.2
0.80.7
0.4
Bicbanco Daycoval Panamericano ABC Pine Sofisa Indusval
28.6
22.5
17.0 17.2 16.0 15.6 14.6
BicbancoDaycoval Panamericano ABCPineSofisaIndusval
10.09.1
8.5
4.1 3.93.0
1.7
Bicbanco DaycovalPanamericano ABC Pine Sofisa Indusval
2.33
3.93 4.284.99 5.16
6.336.98
BicbancoDaycoval Panamericano ABCPineSofisaIndusval
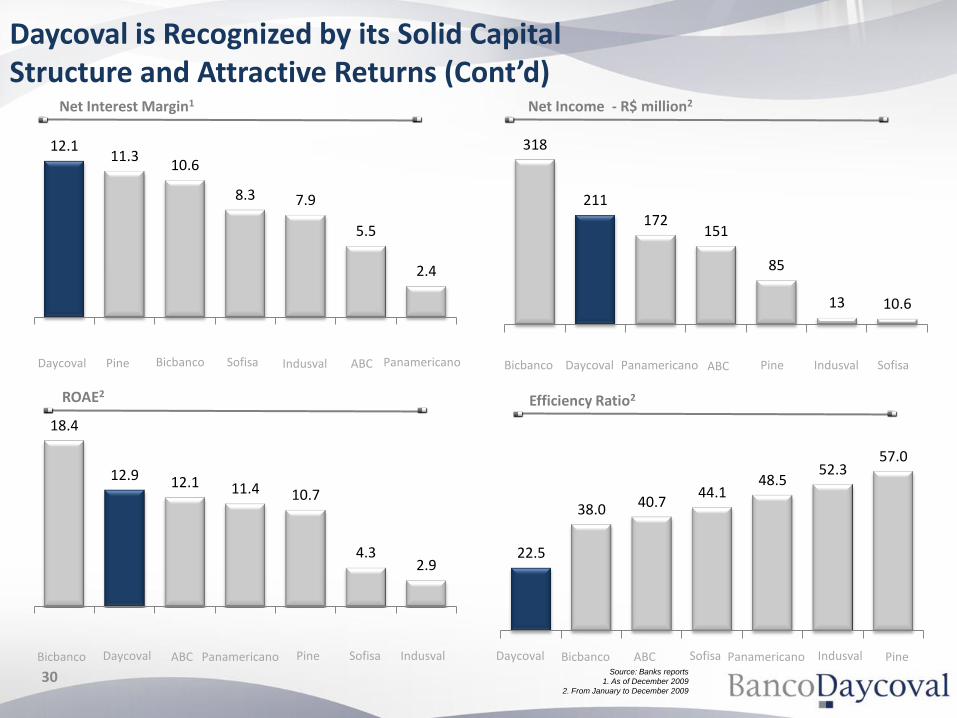
Source: Banks reports
1. As of December 2009
2. From January to December 2009
Daycoval is Recognized by its Solid Capital Structure and Attractive Returns (Cont’d)
30
ROAE2Efficiency Ratio2
Net Income - R$ million2Net Interest Margin1
12.111.3
10.6
8.3 7.9
5.5
2.4
BicbancoDaycoval PanamericanoABCPine Sofisa Indusval
18.4
12.9 12.1 11.4 10.7
4.32.9
Bicbanco Daycoval PanamericanoABC Pine Sofisa Indusval
22.5
38.0 40.744.1
48.552.3
57.0
BicbancoDaycoval PanamericanoABC PineSofisa Indusval
318
211
172151
85
13 10.6
Bicbanco Daycoval Panamericano ABC Pine SofisaIndusval

Daycoval’s Strengths
31
Growth capability with reduced costs
Low leverage levelAccess to diversified funding sources
Experienced management team compromised with corporate governance
Recognized as one of the best Brazilian
Middle Market Banks Conservative profile
and solid capital structure
Strict credit policy

Agenda
32
Overview and Strategy
4Q09 Results
Peers Comparison and Conclusion
Appendix
Brazilian Credit Market
Dealing with the Global Crisis

Daycoval’s Financial Highlights
33
41.2%
35.8%33.1%
25.6% 25.6%28.2%
30.1% 30.5% 29.3% 28.6%
3Q07 4Q07 1Q08 2Q08 3Q08 4Q08 1Q09 2Q09 3Q09 4Q09
12.1%12.7%
12.0%10.8%
9.8%
11.4%12.6% 13.0%
12.2%13.0%
3Q07 4Q07 1Q08 2Q08 3Q08 4Q08 1Q09 2Q09 3Q09 4Q09
BIS Ratio
Net Interest Margin
Total Assets (R$ MM) & ROAA
Net Income (R$mn) & ROAE
5,388
6,5577,199
7,972 8,085
6,831 6,7286,196 6,177
7,061
4.5% 4.5% 4.2%3.6%
2.5%
1.2%
2.9% 2.5%2.8%
5.3%
3Q07 4Q07 1Q08 2Q08 3Q08 4Q08 1Q09 2Q09 3Q09 4Q09
Total Assets ROAA
57.762.2
70.262.5
47.1
20.4
48.0
38.5 42.0
82.5
16.9% 17.1%19.4%
16.7%15.6%
9.4%
12.3%9.8%
10.7%
21.4%
3Q07 4Q07 1Q08 2Q08 3Q08 4Q08 1Q09 2Q09 3Q09 4Q09Net Income ROAE

Serasa – December 2009
Breakdown of the Middle Market Credit Portfolio by Sectors
COMMERCE 18.0% INDUSTRY 41.8%
Commerce of pharmacy products 1.5% Sugar and Alcohol Mill 6.7%
Trading 1.2% Ind. of smal vehicles 2.4%
Commerce of import and export of soybean 1.2% Ind. of clothes in general 1.9%
Commerce of house appliances 1.1% Ind. of flooring and tiles 1.3%
Commerce of clothes in general 1.0% Ind. of eletronic products 1.2%
Other 12.0% Ind. of plastics 1.0%
Other 27.3%
SERVICE 33.0% FINANCIAL 2.4%
Transportation 4.0%
Electricity distribution 2.8% PRIMARY 1.3%
Holding 2.7%
Mixed cooperative 2.3% INDIVIDUALS 3.0%
Real Estate and Home Builders 2.1%
Other 19.1% THIRD SECTOR 0.5%
34
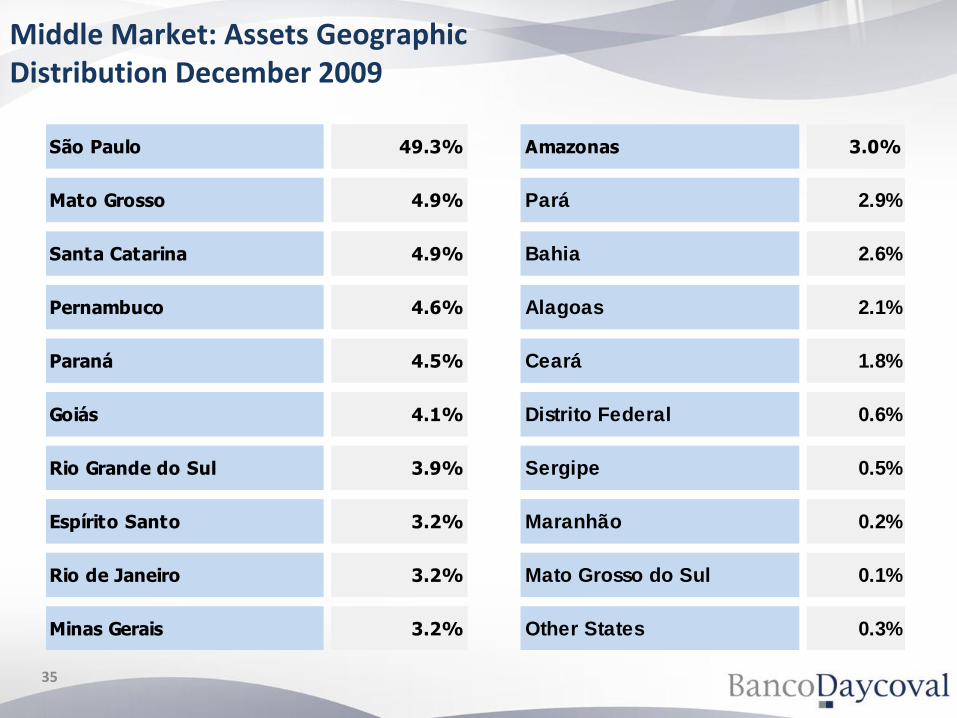
Middle Market: Assets Geographic Distribution December 2009
São Paulo 49.3% Amazonas 3.0%
Mato Grosso 4.9% Pará 2.9%
Santa Catarina 4.9% Bahia 2.6%
Pernambuco 4.6% Alagoas 2.1%
Paraná 4.5% Ceará 1.8%
Goiás 4.1% Distrito Federal 0.6%
Rio Grande do Sul 3.9% Sergipe 0.5%
Espírito Santo 3.2% Maranhão 0.2%
Rio de Janeiro 3.2% Mato Grosso do Sul 0.1%
Minas Gerais 3.2% Other States 0.3%
35

Balance Sheet
Amounts in R$’000Assets 4Q09 3Q09 4Q08 2009 2008Current Assets 5,021,043 4,573,561 5,219,130 5,021,043 5,219,130
Cash and Cash Equivalents 31,542 30,766 45,785 31,542 45,785
Interbank Investments 2,142,757 1,669,362 1,801,367 2,142,757 1,801,367
Securities and Derivatives 303,813 448,135 633,285 303,813 633,285
Interbank Accounts 16,120 9,102 12,901 16,120 12,901
Lending Operations 2,223,052 2,125,050 2,371,330 2,223,052 2,371,330
Other Receivables 246,477 234,243 293,886 246,477 293,886
Other Assets 57,282 56,903 60,576 57,282 60,576
Long-Term Assets 2,028,941 1,592,614 1,598,789 2,028,941 1,598,789
Securities and Derivatives 550,368 355,554 333,312 550,368 333,312
Lending Operations 1,242,116 1,001,935 1,027,877 1,242,116 1,027,877
Other Receivables 212,814 204,533 182,980 212,814 182,980
Other Assets 23,643 30,592 54,620 23,643 54,620
Permanent 10,844 11,208 13,064 10,844 13,064
Investments 382 382 356 382 356
Property and Equipment in Use 10,390 10,746 12,597 10,390 12,597
Intangible 72 80 111 72 111
Total Assets 7,060,828 6,177,383 6,830,983 7,060,828 6,830,983
Liabilities 4Q09 3Q09 4Q08 2009 2008Current Liabilities 3,314,096 2,539,005 3,435,684 3,314,096 3,435,684
Deposits 1,241,391 1,274,649 1,258,451 1,241,391 1,258,451
Money Market Funding 1,189,987 320,858 1,290,642 1,189,987 1,290,642
Funds from Acceptance and Issuance of Securities 206,023 417,078 285,134 206,023 285,134
Interbank Accounts 1,296 1,885 494 1,296 494
Interbranch Accounts 960 4,325 2,665 960 2,665
Borrowings and Onlendings 495,038 356,117 369,635 495,038 369,635
Derivatives 5,908 404 19,044 5,908 19,044
Provisions of Insurance 5,698 6,552 2,521 5,698 2,521
Other payables 167,795 157,137 207,098 167,795 207,098
Long-term Liabilities 2,048,455 1,985,805 1,780,005 2,048,455 1,780,005
Deposits 1,140,438 1,056,804 498,518 1,140,438 498,518
Funds from Acceptance and Issuance of Securities 167,437 172,438 500,361 167,437 500,361
Borrowings and Onlendings 380,530 400,865 511,858 380,530 511,858
Derivatives 19,316 18,334 1,085 19,316 1,085
Other Payables 340,734 337,364 268,183 340,734 268,183
Deferred Income 5,006 5,689 7,558 5,006 7,558 246 246
Minority Interest 553 544 508 553 508
Shareholders´ Equity 1,692,718 1,646,340 1,607,228 1,692,718 1,607,228
Capital of Brazilian Residents 1,359,143 1,359,143 1,359,143 1,359,143 1,359,143
( - ) Treasury Stocks (14,533) (38,992) (16,874) (14,533) (16,874)
Capital Reserves 192 192 170 192 170
Revaluation Reserves 1,569 1,595 1,991 1,569 1,991
Profit Reserves 345,887 323,332 267,717 345,887 267,717
Adjustment to Fair Value - Securities and
Derivatives Available for Sale 460 1,070 (4,919) 460 (4,919)
Total Liabilities 7,060,828 6,177,383 6,830,983 7,060,828 6,830,983
36

Income Statement
Amounts in R$’0004Q09 3Q09 Chg. % 4Q08 Chg. % 2009 2008 Chg. %
Income from Financial Intermediation 257,626 169,564 51.9% 569,552 -54.8% 801,145 1,650,443 -51.5%
Lending Operation 211,096 192,469 9.7% 311,240 -32.2% 790,866 1,073,824 -26.4%
Securities Operations 57,991 66,529 -12.8% 63,261 -8.3% 263,198 267,249 -1.5%
Derivatives (18,859) (89,434) -78.9% 152,154 n.a. (252,919) 219,074 n.a.
Foreign Exchange Operations 7,398 - n.a. 42,897 n.a. - 82,765 n.a.
Compulsory Investments - - n.a. - n.a. - 7,531 n.a.
Expenses of Financial Intermediation (103,696) (156,644) -33.8% (460,847) -77.5% (624,690) (1,181,738) -47.1%
Funding Expenses (75,077) (74,482) 0.8% (281,794) -73.4% (323,713) (762,088) -57.5%
Borrowing and Onlendings (11,650) (12,390) -6.0% (111,391) -89.5% (61,088) (242,827) -74.8%
Foreign Exchange Operations - (1,541) n.a. - n.a. (348) - n.a.
Loan Losses Provisions (16,969) (68,231) -75.1% (67,662) -74.9% (239,541) (176,823) 35.5%
Gross Profit from Financial Intermediation 153,930 12,920 n.a. 108,705 41.6% 176,455 468,705 -62.4%
Other Operating Income (Expenses) (28,258) 42,992 -165.7% (66,764) -57.7% 120,522 (191,951) n.a.
Income from Services Provided 5,457 4,831 13.0% 4,332 26.0% 18,499 26,190 -29.4%
Personnel Expenses (17,772) (15,451) 15.0% (18,929) -6.1% (63,927) (70,995) -10.0%
Other Administrative Expenses (26,794) (26,700) 0.4% (47,326) -43.4% (109,437) (172,646) -36.6%
Tax Expenses (10,203) (9,282) 9.9% (5,943) 71.7% (37,395) (32,899) 13.7%
Other Operating Income 31,822 106,934 -70.2% 9,597 n.a. 367,075 94,425 n.a.
Other Operating Expenses (10,768) (17,340) -37.9% (8,495) n.a. (54,293) (36,026) 50.7%
Income from Operation 125,672 55,912 124.8% 41,941 199.6% 296,977 276,754 7.3%
Non-operating Expenses (1,057) (2,473) -57.3% (13,521) n.a. (12,929) (14,904) -13.3%
Income before Taxes and Minority Interest 124,615 53,439 133.2% 28,420 n.a. 284,048 261,850 8.5%
Income and Social Contribution Taxes (35,842) (8,713) n.a. 2,005 n.a. (58,309) (44,115) 32.2%
Provision for Income Tax (11,324) (23,151) -51.1% 692 n.a. (70,133) (66,389) 5.6%
Provision for Social Contribution Tax (10,858) (12,661) -14.2% (1,399) n.a. (42,622) (33,140) 28.6%
Deferred Taxes (13,660) 27,099 -150.4% 2,712 n.a. 54,446 55,414 -1.7%
Profit-Sharing (6,294) (2,667) 136.0% (10,043) n.a. (14,610) (17,541) -16.7%
Minority Interest (8) (10) -20.0% (11) -27.3% (41) (44) -6.8%
Net Income 82,471 42,049 96.1% 20,371 n.a. 211,088 200,150 5.5%
Interest on Shareholders´ Equity (21,000) (25,451) -17.5% (21,472) -2.2% (94,566) (93,416) 1.2%
Earnings per Share (R$) 0.38 0.19 97.6% 0.09 n.a. 0.98 0.91 8.0%
Number of Shares 214,767,212 216,324,512 -0.7% 220,018,112 -2.4% 214,767,212 220,018,112 -2.4%
37

Institutional Presentation 4Q09
Investor Relations
“This report may include estimates and forward-looking statements. These estimates and forward-looking statements are to a large extent based on current expectations andprojections about future events and financial trends that affect or may come to affect our business. Many important factors may adversely affect the results of BancoDaycoval as described in our estimates and forward-looking statements. These factors include, but are not limited to, the following: the Brazilian and international economicconjunctures, fiscal, foreign-exchange and monetary policies, higher competition in the middle-market segment, the ability of Banco Daycoval to obtain funding for itsoperations, and amendments to Central Bank regulations.The words “believe”, “may”, “could”, “seek”, “estimate”, “continued”, “anticipate”, “plan”, “expect” and other similar words have the objective of identifying estimates andprojections. The considerations involving estimates and forward-looking statements include information related to results and projections, strategies, competitivepositioning, the environment in the industry, growth opportunities, the effects of future regulations, and the impacts from competitors. Said estimates and projections referonly to the date on which they were expressed, and we do not assume any obligation to publicly update or revise any of these estimates arising from the occurrence of newinformation, future events, or any other factors. In view of the risks and uncertainties described above, the estimates and forward-looking statements contained herein maynot materialize. Given these limitations, shareholders and investors should not make any decisions based on the estimates, projections and forward-looking statementscontained in this report”.
Phone: +55 (11) 3138.1024/[email protected]