Institutional Allocation in Initial Public Offerings: Empirical Evidencempuri/papers/ipo_jf.pdf ·...
22
Institutional Allocation in Initial Public Offerings: Empirical Evidence REENA AGGARWAL, NAGPURNANAND R. PRABHALA, and MANJU PURI* ABSTRACT We analyze institutional allocation in initial public offerings ~IPOs! using a new data set of U.S. offerings between 1997 and 1998. We document a positive rela- tionship between institutional allocation and day one IPO returns. This is partly explained by the practice of giving institutions more shares in IPOs with strong premarket demand, consistent with book-building theories. However, institutional allocation also contains private information about first-day IPO returns not re- f lected in premarket demand and other public information. Our evidence supports book-building theories of IPO underpricing, but suggests that institutional alloca- tion in underpriced issues is in excess of that explained by book-building alone. IT IS WELL KNOWN THAT initial public offerings ~IPOs! are underpriced on av- erage. Underpricing is a robust phenomenon that extends across equity mar- kets in several countries and time periods ~see, e.g., Loughran, Ritter, and Rydqvist ~1994!!. For example, in our sample of IPOs offered during 1997– 1998, the average day one return of issues is 19.25 percent. In these offer- ings, the total money “left on the table” due to underpricing is a substantial $3.5 billion. 1 While the existence of these initial gains is widely known and has been exhaustively documented, there is surprisingly little research on how these gains are divided between different investors in IPOs. IPO underwriters play a central role in determining the division of first day gains between different investors. Underwriters possess substantial in- formation about issue demand as a result of their information gathering activities during the book-building process, and in the U.S. market, they have considerable latitude on how IPO shares are allocated. In principle, underwriters can favor preferred investors by allocating them more shares in “hot” issues that are expected to trade up strongly in the aftermarket. * Aggarwal is from Georgetown University, Prabhala is from the University of Maryland, College Park, and Puri is from Stanford University and NBER. We are grateful to Rick Green ~the editor! and an anonymous referee for very helpful comments. We also thank Walid Busaba, Vojislav Maksimovic, Gordon Phillips, Bill Wilhelm, and seminar participants at Tulane Uni- versity and the 2001 Western Finance Association meetings for helpful comments. Aggarwal was partially supported by a Steers Faculty Research Fellowship awarded by the McDonough School of Business and by research assistance from the Capital Markets Research Center. 1 See Habib and Ljungqvist ~2001! and Loughran and Ritter ~2001! for detailed analyses of money left on the table. THE JOURNAL OF FINANCE • VOL. LVII, NO. 3 • JUNE 2002 1421
Transcript of Institutional Allocation in Initial Public Offerings: Empirical Evidencempuri/papers/ipo_jf.pdf ·...

Institutional Allocation in Initial PublicOfferings: Empirical Evidence
REENA AGGARWAL, NAGPURNANAND R. PRABHALA,and MANJU PURI*
ABSTRACT
We analyze institutional allocation in initial public offerings ~IPOs! using a newdata set of U.S. offerings between 1997 and 1998. We document a positive rela-tionship between institutional allocation and day one IPO returns. This is partlyexplained by the practice of giving institutions more shares in IPOs with strongpremarket demand, consistent with book-building theories. However, institutionalallocation also contains private information about first-day IPO returns not re-f lected in premarket demand and other public information. Our evidence supportsbook-building theories of IPO underpricing, but suggests that institutional alloca-tion in underpriced issues is in excess of that explained by book-building alone.
IT IS WELL KNOWN THAT initial public offerings ~IPOs! are underpriced on av-erage. Underpricing is a robust phenomenon that extends across equity mar-kets in several countries and time periods ~see, e.g., Loughran, Ritter, andRydqvist ~1994!!. For example, in our sample of IPOs offered during 1997–1998, the average day one return of issues is 19.25 percent. In these offer-ings, the total money “left on the table” due to underpricing is a substantial$3.5 billion.1 While the existence of these initial gains is widely known andhas been exhaustively documented, there is surprisingly little research onhow these gains are divided between different investors in IPOs.
IPO underwriters play a central role in determining the division of firstday gains between different investors. Underwriters possess substantial in-formation about issue demand as a result of their information gatheringactivities during the book-building process, and in the U.S. market, theyhave considerable latitude on how IPO shares are allocated. In principle,underwriters can favor preferred investors by allocating them more sharesin “hot” issues that are expected to trade up strongly in the aftermarket.
* Aggarwal is from Georgetown University, Prabhala is from the University of Maryland,College Park, and Puri is from Stanford University and NBER. We are grateful to Rick Green~the editor! and an anonymous referee for very helpful comments. We also thank Walid Busaba,Vojislav Maksimovic, Gordon Phillips, Bill Wilhelm, and seminar participants at Tulane Uni-versity and the 2001 Western Finance Association meetings for helpful comments. Aggarwalwas partially supported by a Steers Faculty Research Fellowship awarded by the McDonoughSchool of Business and by research assistance from the Capital Markets Research Center.
1 See Habib and Ljungqvist ~2001! and Loughran and Ritter ~2001! for detailed analyses ofmoney left on the table.
THE JOURNAL OF FINANCE • VOL. LVII, NO. 3 • JUNE 2002
1421

Whether underwriters do so is the subject of an active and ongoing debate inthe academic literature and the financial press, but formal empirical evi-dence on such issues remains sparse.
Articles in the recent press certainly suggest that underwriters extendfavors to their institutional clientele ~see Pulliam and Smith ~2000!, Pul-liam, Smith, and Gasparino ~2000!, and Smith and Pulliam ~2000, 2001!!.These articles also report that the U.S. Attorney’s office, the Securities andExchange Commission ~SEC!, and the regulatory arm of the National Asso-ciation of Securities Dealers ~NASDR! have initiated investigations intowhether investment banks allocate more shares in “hot” IPOs to favoredinstitutional clientele, possibly in exchange for unusually large trading com-missions in subsequent trades, which could violate NASDR rules requiringbrokers and dealers to maintain standards of fair practice. Institutional in-vestors may also be granted more shares in an issue in exchange for a com-mitment to buy additional shares in the aftermarket, although tying of IPOallocations to aftermarket purchases may violate securities laws and thusconcerns regulators. In addition to the investigations and the debate in therecent financial press, the theoretical IPO literature also suggests that un-derwriters may favor their institutional customers. However, the quid proquo for such favorable treatment is the information on IPO demand providedby such investors to underwriters, rather than short-term trading commis-sions or aftermarket purchases that are the focus of current SEC investiga-tion. It has been suggested that the complete IPO process, including allocationspractices, needs to be studied and is “an area ripe for rule-making” by theSEC ~Gasparino, Schroeder, and Kranhold ~2000!!.
While there has been much speculation about these aspects of the IPOprocess, the available empirical evidence on these issues is limited and doeslittle to inform the ongoing debate. The primary obstacle to formal empiricalresearch has been the lack of data. Regulations in the United States do notmandate public disclosure of allocations followed by underwriters, and con-sequently it remains a relatively opaque aspect of the IPO process. Our pa-per takes a step towards filling in the gap. We contribute new empiricalevidence using a new and unique data set of IPOs that includes informationon the percentage of an issue allocated to institutional and retail investors.
We find, not surprisingly, that institutions dominate IPO allocations, ac-counting for a median of about three-quarters of shares offered in an issue.We investigate the cross-sectional variation of the institutional allocation inIPOs, focusing on two themes. The first part of our analysis examines whetherinstitutions concentrate more in the better performing IPOs, while our sub-sequent analysis evaluates alternative explanations for why there is a pos-itive relationship between institutional allocation and underpricing. We findthat institutions do tend to earn greater profits on their IPO investmentscompared to retail investors. Part of the institutional–retail differential canindeed be attributed to favorable allocation patterns followed by underwrit-ers. Underwriters tend to allocate more shares to institutions in IPOs pricedat the upper end of the filing range, which are ex ante expected to appreciate
1422 The Journal of Finance

more in the aftermarket. Conversely, institutional allocation is significantlylower in lower-end issues that are less likely to appreciate in the aftermar-ket. These findings are consistent with book-building models of IPO under-pricing ~Benveniste and Spindt ~1989!, Cornelli and Goldreich ~2001!, andMaksimovic and Pichler, 2001!!, in which underwriters allocate more sharesto institutions in issues in which they obtain more favorable premarket de-mand information. This information enables underwriters to increase theoffer price to the high end of the filing range. Hence, as per the book-building models, we should see correlations between institutional allocationand issues priced in the high end of the filing range, which is borne out inour results.
However, book-building does not appear to completely explain the entireinstitutional–retail differential. Institutional allocation also contains privateinformation about day one returns not ref lected in other variables, such asthe offer price relative to filing range, that predict an IPO’s day one return.In particular, institutions appear to be adept at avoiding “lemons” in theIPO market, as suggested by the Rock ~1986! theory of IPO underpricing.Thus, our results on institutional allocation patterns support both majorparadigms underlying the theoretical literature on IPO underpricing, thatis, the book-building model of Benveniste and Spindt ~1989! and the “lem-ons” model of Rock. We also provide an economic measure of the institutional–retail differential by estimating the returns to the aggregate pool ofinstitutional and retail capital invested in our sample of IPOs.
Our evidence adds to that in Hanley and Wilhelm ~1995!, the only pub-lished empirical study on IPO allocations in the United States of which weare aware.2 Hanley and Wilhelm ~henceforth HW! present a clinical study ofinstitutional allocation patterns followed by one underwriter for 38 IPOsoffered between 1983 and 1988. We add to the HW evidence in terms of bothscope and substantive findings. Our sample is much larger, it is drawn froma more recent period of time, and we have a cross-section of nine underwrit-ers versus their one underwriter sample. Our methodology is also different:We control for the endogeneity of institutional allocation and explicitly dis-tinguish between the effect of the endogenous and excess institutional allo-cation on day one returns using two-stage estimates. Finally, we report newand different results. We find, as do HW, that institutions get a greaterpercentage of shares in IPOs with strong premarket demand. However, whileHW report that institutional allocations are similar in both strong and weak-opening IPOs, we find that institutional allocation concentrates more in stron-ger opening IPOs and less in IPOs with low day one returns. Additionally,we develop new evidence on whether the positive relationship between under-pricing and institutional allocation is beyond that predicted by premarketdemand. We find that while book-building is important, institutional alloca-
2 Ljungqvist and Wilhelm ~2001! analyze institutional allocation, focusing on issues offeredin France, Germany, and the United Kingdom. Their data set also includes a small sample of 30Goldman Sachs-managed IPOs offered between March 1993 and July 1995.
Institutional Allocation in Initial Public Offerings 1423

tion in underpriced issues is in excess of that explained by book-building alone.This suggests that institutions are privately informed about IPO value or thatunderwriters use private information to favor their institutional clientele.
The rest of the paper is organized as follows. Section I describes our uniquedata set and some cross-sectional characteristics of our sample. Section IIexamines institutional allocations and profits in IPOs. We analyze whetherinstitutions obtain preferential allocations in more underpriced issues andexplore how the first day gains in IPOs are divided between institutionaland retail investors. Section III provides two-stage least squares estimatesthat control for the endogeneity of institutional allocation. Section IV offersa summary and conclusions.
I. Data Set and Cross-sectional Characteristics
We identify IPOs offered between May 1997 and June 1998 from the Se-curities Data Company’s ~SDC! New Issues database excluding AmericanDepository Receipts, unit offerings, closed-end funds, and real estate invest-ment trusts ~REITs!. This time period is selected because our SEC-collectedallocation data come from this time period. These allocation records are notsubmitted routinely to the regulators as part of any public disclosure re-quirements but are maintained by the lead manager. For the purpose of thisstudy, the information was requested from 9 investment banks for all issuesin which they were a lead manager.3 Out of these 9 banks, 5 are among the10 largest banks based on market share during this time period, while 4 donot belong to the top-10 category.
For 164 IPOs, we know the aggregate allocation to institutional and retailinvestors for the entire issue. If allocation for the entire issue is not avail-able, we use the lead manager ’s allocation as a proxy, resulting in a totalsample of 174 issues. The correlation between total institutional allocationand the lead investment bank’s institutional allocation is 0.76. The medianand mean institutional allocation in the sample of 174 issues equals 74.26percent and 72.77 percent, respectively. Issue-specific data such as the filingrange, number of shares offered, and offer price are obtained from the NewIssues database of SDC. This information is supplemented with daily closingprices for each offering from Bloomberg and the Dow Jones. We classifyunderwriters based on their reputation ~e.g., Carter and Manaster ~1990!and Megginson and Weiss ~1991!!. Following Megginson and Weiss, the mar-ket share of underwriters is used as a basis for assigning underwriter rep-utation. The reputation dummy variable for an IPO equals one if the IPO’slead manager is ranked among the top 10 in terms of dollar proceeds amongall IPOs issued between May 1997 and June 1998, and it is zero otherwise.
Table I reports descriptive statistics for our sample as well as the popu-lation, which comprises all firm commitment IPOs listed in the SDC New
3 We are unable to disclose the names of the investment banks but our empirical analysisdoes use a reputation variable.
1424 The Journal of Finance

Issues database excluding ADRs, units, closed-end funds, and REITs offeredbetween May 1997 and June 1998. The sample of IPOs has mean ~median!proceeds of $132.2 million ~$63.9 million! versus the population mean ~me-dian! of $75.55 ~$36.00! million. The mean ~median! offer price for our sam-ple is $15.09 ~$15! versus $12.37 ~$12.00! for the population. Thus, the sampleused in this study consists of larger issues offered at higher prices comparedto the population. Over two-thirds of our sample clusters at a gross spread~statistics not reported in Table I! equal to seven percent, consistent withChen and Ritter ~2000! and Hansen ~2000!.
Each IPO is classified based on whether the final offer price is above,within, or below the initial filing range. The sample of IPOs shows somedispersion across this characteristic. About a third of our sample issues ispriced above the filing range, about a fifth is priced below the range, whilethe vast majority, about half of our sample, is priced within the filing range.The percentage difference between the midpoint of the filing range and the
Table I
Descriptive Statistics for SampleThe table reports the mean and median of several characteristics of IPOs offered between May1997 and June 1998. Columns 2 and 3 report sample characteristics of 174 IPOs managed bynine underwriters for which institutional allocation is available. Columns 4 and 5 report char-acteristics of the population of 617 IPOs offered during this time period, which includes allfirm-commitment IPOs in the SDC database except for American Depositary Receipts, unitofferings, closed-end funds, and real estate investment trusts. Proceeds represent the amountraised ~in $ million!; assets denote the value of the issuer ’s assets before the offer ~in $ million!;shares offered are in millions; the offer price is the price at which the issue is offered; UPDATEis the percentage difference between the midpoint of the filing range and the offer price; Daysin registration denotes the number of days between the prospectus filing with SEC and thefinal offer; Syndicate size denotes the number of members in the underwriting syndicate ~vari-able NUMAMGR in the SDC New Issues database!; and % reputed managers denotes the per-centage of IPOs offered by underwriters in the top 10 in the period. Initial return is the percentagereturn on the IPO from the offer price to the IPO’s closing price on the first day it is traded.Institutional allocation is the percentage of the IPO issue allocated to institutional investors.Allocation data were reported by the IPO book manager.
Sample ~N � 174! Population ~N � 617!
Characteristic Mean Median Mean Median
Proceeds ~in $ million! $132.2 $63.9 $75.55 $36.00Assets $75.95 $1,030 $31.6 $435.7Shares offered 7.47 4.50 6.07 3.13Offer price $15.09 $15.00 $12.37 $12.00UPDATE 1.10% 0.00% 0.09% 0.00%Days in registration 78.72 69.00 96.50 74.50Syndicate size 16.01 16 15.25 16% reputed managers 65% — 43% —Initial return 19.25% 12.80% 14.27% 8.98%Institutional allocation 72.77% 74.26% — —
Institutional Allocation in Initial Public Offerings 1425

offer price, UPDATE, has a median value of zero. The median IPO is pricedat the midpoint of the filing range and spends 69 days in the registrationprocess. The mean and median underpricing in our sample equals 19.25percent and 12.80 percent, respectively, which exceed the populationunderpricing.
II. Institutional Allocations and Profits in IPOs
A key question in IPO allocations is whether institutional capital concen-trates in better performing issues, while leaving weaker performing issuesto retail investors. If, as it turns out, institutions perform better than retailinvestors, why this differential? Is it because institutions receive more sharesin IPOs with strong premarket demand and predictably better day one re-turns, a central implication of book-building theories of IPO underpricing?Alternatively, do institutions concentrate in better IPOs beyond what can beexplained by premarket demand and the book-building process? We bring tolight new evidence to address these questions.
Section II.A begins by developing some a priori evidence that institutionsdo perform better than retail investors in IPOs. Sections II.B and II.C ex-amine why institutions perform better. Section II.B asks if underwriters fa-vor institutions with more shares in IPOs with strong premarket demand,which are offered at the upper end of the filing range and have predictablygreater day one returns. We find evidence of such favorable treatment, con-sistent with the Benveniste and Spindt ~1989! theory of book-building inwhich underwriters favor investors in exchange for favorable demandinformation.
Section II.C asks if institutional allocation has information about IPO un-derpricing beyond what can be attributed to premarket demand. We findthat this is the case. Thus, institutional allocation ref lects information aboutunderpricing not fully captured in other variables that are publicly knownat the offering. This suggests that institutions may be privately informedabout IPO value, as in Rock ~1986!. Alternatively, underwriters may haveprivate information and use it to favor institutions for reasons beyond book-building, since our specification controls for premarket demand. We end Sec-tion II by characterizing the economic magnitude of the return differentialbetween institutional and retail capital in the aggregate.
A. Dollar Profits to Institutional and Retail Investors:Do Institutions Perform Better?
Panel A of Table II reports the mean and median ~the number in paren-theses! dollar profit per issue accruing to institutional and retail investorsin IPOs. For each issue, we compute the total first-day dollar gain as theproduct of the day one return and the issue proceeds. We multiply the dayone gain by the percentage allocated to institutional investors to obtain theportion of the day one gain accruing to these investors. Likewise, the day
1426 The Journal of Finance

one dollar gain of an issue is multiplied by the percentage allocated to retailinvestors to obtain the dollar profits from the issue accruing to retail inves-tors. For the overall sample, the mean profit per issue accruing to institu-tional investors is $14.79 million ~median � $6.61 million!, while retailinstitutions average $5.28 million ~median � $2.29 million!, a third of the
Table II
Allocations and Profits of Institutional and Retail InvestorsThe table reports mean and median ~in parentheses! initial returns, proceeds in millions ofdollars, and percentage of an IPO allocated to institutional investors. We also report the hypo-thetical profits to institutional and retail investors from investing in the issue at the offer priceand selling it on trading day 1, trading day 10, and trading day 20 after the offer date. Wereport the data for three sets of IPOs: returns less than 0, returns between 0% and 20%, andreturns exceeding 20%, as well as aggregate data for all IPOs. We do not report the profitabilitynumbers for IPOs with zero returns ~22 on day one and 1 on day 10! because profits for theseIPOs are mechanically equal to zero by definition. Profit numbers are in millions of dollars. Thedata consist of 174 IPOs offered between May 1997 and June 1998 for which institutionalallocation is available.
VariableAll IPOs~1!
Return , 0%~2!
0 , Return � 20%~3!
Return . 20%~4!
Panel A: Profits Based on Returns from Offer to Close of Trading Day 1
Sample size 174 8 84 60Profits per issue—
Institutional$14.79 �$1.92 $11.31 $27.32~$6.61! ~�$1.30! ~$4.59! ~$18.37!
Profits per issue— $5.28 �$1.77 $4.20 $9.66Retail ~$2.29! ~�$0.82! ~$1.95! ~$6.09!
Panel B: Profits Based on Returns from Offer to Trading Day 10
Sample size 174 30 78 65Profits per issue—
Institutional$14.24 �$5.34 $11.63 $26.63~$6.84! ~�$2.33! ~$4.24! ~$18.64!
Profits per issue— $4.93 �$2.82 $3.94 $9.78Retail ~$2.52! ~�$1.03! ~$1.22! ~$6.77!
Panel C: Profits Based on Returns from Offer to Trading Day 20
Sample size 174 48 49 77Profits per issue—
Institutional$14.96 �$6.81 $8.73 $32.48~$7.04! ~�$2.99! ~$4.73! ~$19.11!
Profits per issue— $5.11 �$3.37 $3.30 $11.54Retail ~$1.89! ~�$0.94! ~$1.51! ~$6.86!
Panel D: Descriptive Statistics
Day one returns 19.25% �5.78% 9.28% $43.61~12.80%! �5.96% ~9.00%! ~$32.24!
Proceeds ~in millions! $132.20 $57.78 $162.10 $106.90~$63.90! ~$39.95! ~$71.22! ~$63.27!
Institutional allocation 72.77% 59.73% 71.65% 76.69%~74.26%! ~56.09%! ~72.87%! ~75.87%!
Institutional Allocation in Initial Public Offerings 1427

average profit per issue for institutions. While the dollar profits are quitedifferent between institutional and retail investors, the capital invested bythe two classes of investors also differs by a similar order of magnitude. Weexamine differences in the rates of return subsequently in Section II.D. Thedifferences in profit-per-issue between institutions and retail investors ac-cords well with the average institutional allocation of 72.77 percent ~firstcolumn of Panel D in Table II!, also about three times the allocation to retailinvestors. The total money left on the table in our sample can be computedby adding the average per issue profits of both categories of investors andmultiplying by the number of IPOs ~174!; doing so gives the figure of $3.5billion reported earlier.
Panel A of Table II also reports returns and profits per issue classified bythe size of the day one return of the IPO. We divide IPOs into three catego-ries: ~1! overpriced IPOs, which have a negative day one return, ~2! moder-ately underpriced IPOs, which have positive returns of less than 20 percent,and ~3! highly underpriced IPOs, which have day one returns exceeding 20percent. Zero return IPOs have zero returns and profits by definition, andthese are excluded in Table II.4 We find two interesting patterns in the dol-lar profits for IPOs.
1. Per issue profits on both moderately and highly underpriced issuesoutweigh the per issue losses on overpriced issues. For example, theaverage institutional profit on moderately underpriced IPOs ~column3! equals $11.31 mm versus the mean per issue loss on overpriced is-sues ~column 2! of �$1.92 mm. The per issue loss in overpriced IPOs islower because the negative returns on overpriced IPOs are less in ab-solute magnitude compared to positive day one returns, and also be-cause negative return IPOs tend to have lower issue proceeds.
2. More interestingly, institutional–retail profit differentials are not con-stant across the three categories of IPOs. Differentials are more pro-nounced in the most underpriced issues and are less prominent inoverpriced issues. In overpriced issues, institutions lose an average of$1.92 mm per issue, about 1.08 times the average loss per issue of$1.77 mm for retail investors. For moderately underpriced issues, in-stitutions earn an average of $11.31 mm, about 2.69 times the averageof $4.20 mm for retail investors. Finally, for the most underpriced is-sues, institutions earn an average of $27.32 mm per issue, 2.83 timeswhat retail investors take away from these issues. Thus, per issue profitdifferentials are greater in the most underpriced and moderately un-derpriced issues than in the overpriced issues.
4 The 22 IPOs with zero returns on day one, which are excluded from Table II, have meanand median institutional allocations of 71.12 percent and 73.54 percent, respectively. The dif-ference in institutional allocation between overpriced and underpriced IPOs continues to besignificant ~Wilcoxon z ~ p! � �2.09 ~0.04!! even when the zero return IPOs are included in theoverpriced group.
1428 The Journal of Finance

The results provide some initial evidence that institutional capital in IPOsearns greater profits in IPOs at the expense of retail investors because in-stitutions earn a larger proportion on the upside but share the downside inweaker issues more evenly with retail customers. The data on institutionalallocation ~last row of Panel D, Table II! are consistent with this notion. Themean ~median! institutional allocation for overpriced issues is 59.73 percent~56.09 percent! versus 71.65 percent ~72.87 percent! for moderately under-priced issues, and 76.69 percent ~75.87 percent! for highly underpriced is-sues. Thus, institutions are allocated a lower proportion of shares in overpricedissues compared to either group of underpriced issues or underpriced issuesas a whole ~Wilcoxon z � 2.78, significant at one percent!.
We extend the Panel A findings in two directions. First, we reexamine theresults for longer holding periods because the results based on day one re-turns may be biased by a combination of price support and limits on f lip-ping.5 For example, losses on overpriced issues may be greater without pricesupport, and restrictions on f lipping may limit investors’ ability to realizegains on underpriced issues. These biases suggest that the true profit dif-ferentials may be somewhat greater than suggested in Panel A, and it maybe useful to consider returns over not just one day but longer horizons aswell. The longer data also offers the advantage of incorporating allocationdata from the significant number of IPOs opening with zero return ~22 is-sues! excluded from Panel A.
On the other hand, the longer horizon results may be less powerful. Onereason is that at longer horizons, there is greater likelihood of price move-ments unrelated to the initial IPO uncertainty. Additionally, Ellis, Michaely,and O’Hara ~2000! document a sharp decline in IPO trading volume afterthe first two trading days, suggesting that investors mostly adjust their IPOholdings within this initial period. A characterization of the true profitabil-ity of institutional and retail investment in IPOs requires us to know wheneach type of investor sells in the aftermarket, and the direct and indirectcosts of selling ~including diminished allocations in the future!. While this isan interesting avenue of research beyond our scope and data, it is certainlyuseful to supplement the one-day analysis with some evidence from longerhorizons.
An empirical question is the length of time over which we should considerthe longer horizon analysis. We look to prior literature for some guidance.Ellis et al. ~2000, p. 1062! find that underwriters have built up 80 percent oftheir peak aftermarket inventory in the first five trading days, while theinventory starts to decline after 20 days. This suggests that support is con-centrated in the first week and is altogether complete a month after theIPO. Aggarwal ~2000! reports that in her sample, price support activitiesend within 10 days of the offering date. The median stabilized IPO in hersample has zero stabilization after a week; most short covering is concen-trated in the first few days of trading when volume is at a peak. These
5 See Aggarwal ~2001! for evidence on f lipping.
Institutional Allocation in Initial Public Offerings 1429

considerations suggest that we should incorporate horizons of 5 to 20 trad-ing days after the IPO offer date. Panel B reports the evidence based on10-day returns ~the return cutoffs in Panel B are based on 10-day returnsbeing below or exceeding 0 or 20 percent!. The Panel B patterns are broadlysimilar to those in Panel A. The profit of institutional investors is 1.89, 2.95,and 2.72 times that of retail investors for overpriced, moderately under-priced, and highly underpriced issues, respectively. Thus, differentials be-tween institutions and retail customers are less prominent in the overpricedissues relative to the others. Panel C reports similar evidence for 20 tradingdays after the IPO’s opening.
A second extension of the evidence in Panel A of Table II is to considerreturn cutoffs above 20 percent. One purpose of this analysis is to verifywhether the patterns in Table II are robust. In particular, popular accountsof underwriter favoritism often speculate that institutions perform betterbecause they get disproportionately more shares in the most highly under-priced issues, while retail investors are essentially frozen out of participa-tion in this segment of IPOs. Using return cutoffs well above 20 percentallows us to evaluate this question. We experimented with return cutoffs of30 percent, 40 percent, and 50 percent, which approximately correspond tothe 80th, 85th, and 90th percentile of the day one returns. We find patternsessentially similar to those in Panel A of Table II. The variation in IPOallocations within underpriced issues is modest compared to the variation inallocation between underpriced and overpriced issues. For instance, meanand median institutional allocation is 77.88 percent and 75.06 percent, re-spectively, for the 26 IPOs with initial returns greater than 40 percent ver-sus 76.69 percent and 75.87 percent, respectively, for IPOs with returns greaterthan 20 percent ~last column in Table II, Panel D!. On the other hand, over-priced IPOs have mean and median institutional allocation of 59.73 percentand 56.09 percent, respectively. Thus, favoritism on the part of underwritersseems to occur primarily via the mechanism of lower institutional allocationin overpriced issues rather than even higher allocations in the best perform-ing IPOs.
Another interesting question relates to the variation in institutional allo-cation. Are allocation schedules relatively f lat, as might be suggested by amechanical allocation rule of giving fixed percentages to institutions, or isthere some variation in allocation across or within different return catego-ries? The standard deviation of institutional allocation lies between 14 per-cent and 19 percent for all initial return categories except the highest returncategories, where it is significantly lower. For example, in the category ofissues with initial return greater than 20 percent, the standard deviation ofallocation is 7.97 percent, while it is 7.73 percent for issues with returngreater than 40 percent.
Section II.A has documented that institutions appear to perform betterthan retail investors in IPOs. The next two sections investigate why. Sec-tion II.B asks if institutions do better because they routinely receive more~less! shares in IPOs with strong ~weak! premarket demand, a central im-
1430 The Journal of Finance

plication of Benveniste and Spindt ~1989!, the book-building paradigm forexplaining IPO underpricing. Section II.C analyzes if institutional allocationref lects additional private information that is not captured by the premar-ket demand, as is suggested by the Rock ~1986! framework for explainingIPO underpricing.
B. Allocation versus Premarket Demand
IPOs priced at the upper end of the filing range tend to have strong pre-market demand. These IPOs have predictably higher day one returns com-pared to issues priced at the lower end of the filing range. This well-known“partial adjustment” phenomenon ~Hanley ~1993!! is detailed recently in Rit-ter ~1998!, who reports that virtually all IPOs priced above the filing rangehad positive day one returns, while only about half of those priced below thefiling range have positive initial returns.6 In this section, we examine whetherunderwriters allocate more shares in IPOs to institutions when the premar-ket demand for an issue ~and hence the likely day one appreciation of theissue! is high.
Our proxy for premarket interest is the variable UPDATE, the percentagedifference between the midpoint of the filing range and the offer price.7 Model 1in Table III reports results from a univariate regression of the percentageinstitutional allocation on UPDATE, whereas Model 2 reports estimates of amultivariate specification that includes other variables potentially relatedto institutional allocation. Among these controls is the size of the IPO, or thedollar proceeds of an issue excluding the Green Shoe amount. Large issuesmay have lower institutional allocation because institutions are less likely tobe able to absorb the entire supply of shares in large issues. Additionally,large issues may be less risky and retail investors may face less lemonsproblems in such issues ~Beatty and Ritter ~1986!!. Institutions may also bereluctant to take up more shares in small issues because of the disclosurerequirements triggered by additional purchases when stakes are five per-cent or above ~Section 13G of the 1934 Securities Act!. We consider threeproxies for size: ~1! issue proceeds, ~2! assets of the issuer before the offer, or~3! the number of shares offered in the IPO. While all three proxies givesimilar results, we report the estimates based on the number of shares.8Because the size variables are all skewed, we specify the regression usingthe natural logarithm of the number of shares offered ~in millions! as anindependent variable. We also include the number of days spent in the reg-
6 See also Loughran and Ritter ~2001! and Lowry and Schwert ~2001! for other evidence onpartial adjustment.
7 We check for an asymmetric component in UPDATE by adding a variable UPDATE�, equalto 1 if the offer price is above the filing range, and zero otherwise. UPDATE� itself was insig-nificant and did not change the other coefficients.
8 With regard to issue proceeds, Habib and Ljungqvist ~1998! argue that there is a mechan-ical relationship between underpricing and issue proceeds even after controlling for uncer-tainty. On the other hand, imposing the requirement that pre-IPO assets be available results inour losing about a quarter of our sample.
Institutional Allocation in Initial Public Offerings 1431
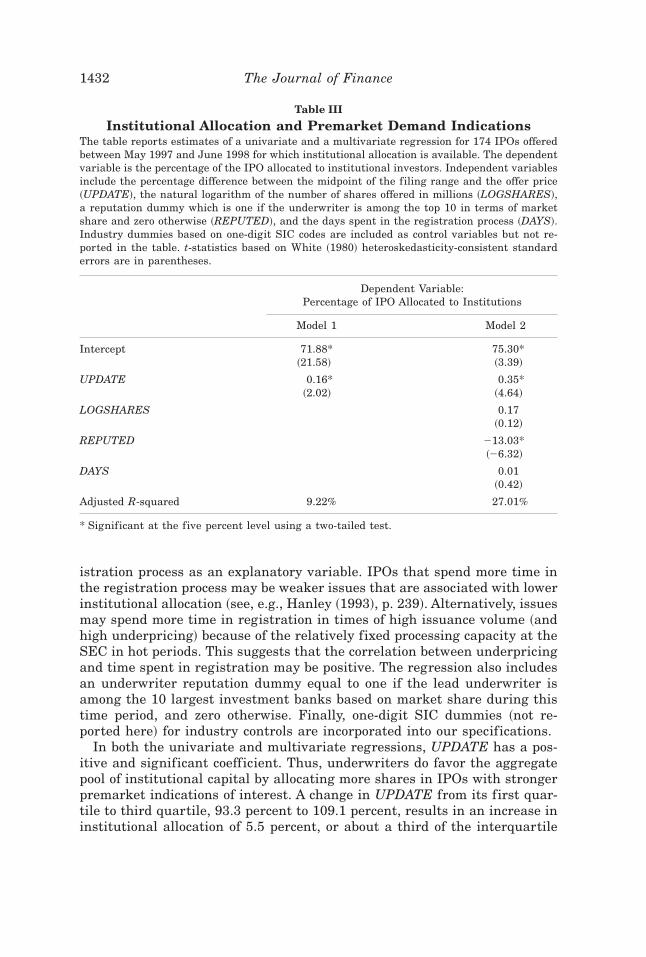
istration process as an explanatory variable. IPOs that spend more time inthe registration process may be weaker issues that are associated with lowerinstitutional allocation ~see, e.g., Hanley ~1993!, p. 239!. Alternatively, issuesmay spend more time in registration in times of high issuance volume ~andhigh underpricing! because of the relatively fixed processing capacity at theSEC in hot periods. This suggests that the correlation between underpricingand time spent in registration may be positive. The regression also includesan underwriter reputation dummy equal to one if the lead underwriter isamong the 10 largest investment banks based on market share during thistime period, and zero otherwise. Finally, one-digit SIC dummies ~not re-ported here! for industry controls are incorporated into our specifications.
In both the univariate and multivariate regressions, UPDATE has a pos-itive and significant coefficient. Thus, underwriters do favor the aggregatepool of institutional capital by allocating more shares in IPOs with strongerpremarket indications of interest. A change in UPDATE from its first quar-tile to third quartile, 93.3 percent to 109.1 percent, results in an increase ininstitutional allocation of 5.5 percent, or about a third of the interquartile
Table III
Institutional Allocation and Premarket Demand IndicationsThe table reports estimates of a univariate and a multivariate regression for 174 IPOs offeredbetween May 1997 and June 1998 for which institutional allocation is available. The dependentvariable is the percentage of the IPO allocated to institutional investors. Independent variablesinclude the percentage difference between the midpoint of the filing range and the offer price~UPDATE!, the natural logarithm of the number of shares offered in millions ~LOGSHARES!,a reputation dummy which is one if the underwriter is among the top 10 in terms of marketshare and zero otherwise ~REPUTED!, and the days spent in the registration process ~DAYS!.Industry dummies based on one-digit SIC codes are included as control variables but not re-ported in the table. t-statistics based on White ~1980! heteroskedasticity-consistent standarderrors are in parentheses.
Dependent Variable:Percentage of IPO Allocated to Institutions
Model 1 Model 2
Intercept 71.88* 75.30*~21.58! ~3.39!
UPDATE 0.16* 0.35*~2.02! ~4.64!
LOGSHARES 0.17~0.12!
REPUTED �13.03*~�6.32!
DAYS 0.01~0.42!
Adjusted R-squared 9.22% 27.01%
* Significant at the five percent level using a two-tailed test.
1432 The Journal of Finance

variation in institutional allocation ~16.49 percent!. On a stand-alone basis,the variable also explains an economically significant 9.27 percent of thevariation in institutional allocation. Underwriter reputation has a negativecoefficient, suggesting that reputed underwriters give more shares to retailcustomers. This result should be interpreted with caution because our sam-ple has nine underwriters but not the universe of all underwriters. The num-ber of days spent in registration is not significant.
The main result, a positive coefficient for UPDATE, is consistent with thebook-building explanation for IPO allocations. Benveniste and Spindt ~1989!argue that underwriters give more shares to institutions in issues with stron-ger premarket interest as an incentive for institutional investors to truth-fully reveal their favorable information. Extraction of such information allowsthe underwriter to set a higher offer price for the issue. This is what weobserve empirically.
C. Institutional Allocation and Degree of Underpricing
Section II.B documents that one source of superior profits to institutionsis greater allocations in IPOs with strong premarket demand. In this sec-tion, we examine whether this is the sole explanation for the better perfor-mance of institutions, or whether institutional allocation is related tounderpricing even after controlling for premarket demand. If so, the betterperformance of institutional investors in IPOs would ref lect not merely al-locations in “hotter” issues with better premarket demand, but would alsoref lect private information that is not captured by publicly known variablesat the time of the IPO.
Panel A of Table IV reports estimates of a regression in which the depen-dent variable is the day one return of an IPO and independent variablesinclude institutional allocation along with control variables. First among ourcontrols is the variable UPDATE, the percentage difference between the mid-point of the filing range and the offer price. This variable is an importantcontrol, as we are primarily interested in testing whether allocation is re-lated to the degree of IPO underpricing even after controlling for UPDATE.Among the other controls are variables that might potentially explain IPOunderpricing. Beatty and Ritter ~1986! document that issue proceeds arenegatively related to the degree of underpricing of an issue. As before, weuse the natural logarithm of the number of shares offered in the empiricalspecification. We include the time spent in registration and underwriter rep-utation as additional controls potentially related to IPO underpricing. Fi-nally, we include but do not report industry dummy variables based on one-digit SIC codes.
Panel A in Table IV reports the univariate and multivariate regressionestimates. On a stand-alone basis in the univariate specification, institu-tional allocation has a positive coefficient and is statistically significant.Among the controls in the multivariate specification, log number of shareshas a negative coefficient and underwriter reputation has a positive coeffi-
Institutional Allocation in Initial Public Offerings 1433

cient. The variable UPDATE has a significant and positive coefficient, in-dicating that IPOs offered at the top of the filing range are indeed morelikely to have higher day one returns. The time spent in registration is notsignificant. Institutional allocation retains a positive coefficient even afterincluding UPDATE and the coefficient magnitude remains roughly equal tothat in the univariate specification. The coefficient for allocation is also eco-nomically significant. For instance, using the Panel A estimates, a change inallocation from its first quartile to its third quartile, 64.95 percent to 81.44percent, increases expected IPO underpricing by 5.12 percent.
For robustness, Panel B also reports estimates of an ordered probit spec-ification in which the left-hand side dependent variable is an ordinal vari-able denoting whether an IPO was overpriced, moderately underpriced, or
Table IV
Institutional Allocation and UnderpricingThe table reports OLS and ordered probit estimates for a sample of 174 IPOs offered betweenMay 1997 and June 1998 for which institutional allocation is available. In OLS, the dependentvariable is R, where R is the day one return of the IPO. In the ordered probit, the dependentvariable is 0 if R � 0, 1 if 0 , R � 20%, 2 if R . 20%, where R is the day one return for theIPO. Independent variables include the percentage of the IPO allocated to institutional inves-tors ~INST!, the natural logarithm of the number of shares offered ~LOGSHARES!, the per-centage difference between the midpoint of the filing range and the offer price ~UPDATE!, areputation dummy, which is one if the underwriter is among the top 10 in terms of marketshare and zero otherwise ~REPUTED!, and the days spent in the registration process ~DAYS!.Industry dummies based on one-digit SIC codes are included in the regression but not reportedin the table. t-statistics, based on White ~1980! heteroskedasticity-consistent standard errorsfor OLS and Maddala ~1983, Chapter 2! for the ordered probit model, are in parentheses.
Panel A: Ordinary Least Squares Panel B: Ordered Probit
Dependent Variable:Day One Return
Dependent Variable: 0 if R � 0%,1 if 0 , R � 20%, 2 if R . 20%
Model 1 Model 2 Model 3 Model 4
Intercept �1.69 108.97* �0.27 2.06~�0.19! ~2.91! ~�1.72! ~0.74!
INST 0.30* 0.31* 0.02* 0.02*~3.05! ~2.62! ~2.46! ~2.46!
LOGSHARES �7.54* �0.16~�3.06! ~�0.90!
UPDATE 0.75* 0.05*~4.45! ~6.37!
REPUTED 12.09* 0.57*~3.09! ~2.08!
DAYS 0.01 0.003~0.02! ~0.10!
Pseudo R2
~ordered probit!or Adj. R2 ~OLS! 6.53% 30.13% 5.21% 20.51%
* Significant at the five percent level using a two-tailed test.
1434 The Journal of Finance

highly underpriced. The lowest category consists of overpriced issues thathave negative or zero first day returns. The next category consists of mod-erately underpriced issues that have returns between 0 and 20 percent, andthe last category of IPOs includes highly underpriced issues that have dayone returns in excess of 20 percent. Allocation remains significantly posi-tively related to initial IPO returns even after including other controls po-tentially related to IPO underpricing.
The sign and significance of institutional allocations in the multivariateregressions suggests that it is not merely a proxy for publicly available in-formation at the time of the offering. Institutional money appears to containprivate information about future IPO returns. Such private information maywell ref lect superior information held by institutional investors, which al-lows them to minimize participation in the “lemons” in the IPO market,consistent with the Rock ~1986! model of IPO underpricing and the empiri-cal literature supporting these theories ~e.g., Beatty and Ritter ~1986!, Carterand Manaster ~1990!, Jegadeesh, Weinstein, and Welch ~1993!, Michaely andShaw ~1994!!. As this literature suggests, if institutions have private infor-mation, the aggregate demand f low from institutions is greater in moreunderpriced issues, and underwriters may allocate them a greater numberof shares in these issues. In contrast, institutional demand and participationare lower in the “lemons.” Alternatively, private information may be held byunderwriters rather than by institutional investors, and underwriters mayuse this information to ensure that institutions get less of the worse per-forming shares.
D. The Economic Magnitude of Return Differences
Next, we provide an economic characterization of the institutional–retaildifferential in IPOs. To this end, we examine whether each dollar investedby an institutional investor earns the same as each dollar invested by aretail investor. We define the return on each dollar invested by each type ofinvestor, say pt , where t is the investor type, institutional ~t # 1! or retail~t # 2!, as
pt �
(i�1
n
xit * pi * ri
(i�1
n
xit * pi
, ~1!
where i indexes the issue, xit denotes the percentage of issue i allocated toinvestor of type t, pi denotes the proceeds, and ri is the first-day return forissue i.
Equation ~1! provides a simple metric for judging the performance of in-stitutional versus retail capital: the returns to each type of dollar invested inIPOs. If allocation xit � xjt ∀ i, or more generally, if IPO allocation is inde-
Institutional Allocation in Initial Public Offerings 1435

pendent of ex post issue returns ri , then p1 � p2 and both types of capitalwill experience the same returns on investment. On the other hand, if in-stitutional allocation tends to be high for more underpriced issues, that is,?x10?r1 � 0, then p1 � p2. In our sample, the total amount invested byinstitutions is $16.4 billion and the total amount earned by institutions equals$2.57 billion, so the return to one institutional dollar is 15.69 percent. Onthe other hand, retail investors earn only 13.92 percent, investing a total of$6.59 billion for a first-day profit of $918 million. Therefore, an institutionaldollar earns about 1.77 percent more than a retail dollar for the IPOs in oursample based on day one returns of IPOs.
The first-day return difference of 1.77 percent is somewhat modest. Whyis it so narrow? Differences in returns are certainly likely to be lower thanthe differences in dollar profits reported in Table II, because capital investedby retail investors is only about a third of that invested by institutionalinvestors. The allocation data from Table II provide additional pointers. Fromthe allocation statistics, the major variation in institutional allocation acrossIPOs comes from the fact that institutions have fewer shares in IPOs thatare overpriced ex post. While there is some variation in institutional allo-cation within the universe of underpriced issues, it is small in relation to thevariation between all underpriced and overpriced IPOs. Thus, the contribu-tion of returns from underpriced issues to an institutional–retail return dif-ferential is economically small, and the difference is driven by variation dueto overpriced issues. This component is small due to two reasons. First, IPOsare underpriced rather than overpriced on average. Additionally, overpricedissues tend to have lower dollar proceeds and therefore contribute less to theoverall dollars invested in IPOs.9 Hence, the cumulative impact of over-priced issues on the overall returns is also small.
As discussed earlier in Section II.A, the existence of price support biasesestimates of day one returns upwards. Losses on overpriced issues may begreater without price support. Additionally, profit and return differentialsbased on day one returns exclude the sample of 22 IPOs that have zerofirst-day returns. Therefore, we also compute return differentials based onthe longer horizons of 10 and 20 trading days, following Panels B and C ofTable II. As expected, return differentials between institutions and retailcustomers widen when considering these longer horizons. Over 10 tradingdays, institutions earn 15.10 percent while retail investors earn 13 percenton their invested capital, giving a return differential of 2.10 percent. Overthe 20 trading-day horizon, the differentials widen somewhat to 2.39 per-cent, as institutions earn a return on capital invested of 15.87 percent whileretail investors earn 13.48 percent.
9 Negative return IPOs tend to issue fewer shares and have lower offer prices compared toother IPOs. These issues have mean ~median! number of shares offered of 4.36 mm ~3.19 mm!versus 7.47 mm ~4.50 mm! for the full sample, while their mean and median offer price equal$12.50 ~$12.50! versus $15.09 ~$15! for the full sample.
1436 The Journal of Finance

We have provided evidence on whether institutional capital performs bet-ter in IPOs compared to retail investors and why. We find that institutionsdo tend to earn more than retail investors in IPOs. Part of the explanationis the positive correlation between premarket demand and allocation, con-sistent with the book-building hypothesis of Benveniste and Spindt ~1989!.However, institutional allocation also appears to ref lect private informationnot in premarket demand, suggesting that either institutions are privatelyinformed investors ~Rock ~1986!! or that underwriters use their private in-formation to favor institutions for reasons beyond book-building.
III. Two-Stage Estimates
The results in Table IV indicate that the day one return of an IPO ispositively related to institutional allocation. This positive relationship mayref lect one or both of two explanations. First, institutional allocation maycontain private information about day one returns not ref lected in the priceupdate and other explanatory variables related to day one returns. Alterna-tively, this positive relationship may be driven by the endogeneity of insti-tutional allocation. We know from Hanley ~1993! that initial returns andUPDATE are positively related, and from Table III that institutional allo-cation is positively related to UPDATE because underwriters give more sharesto institutions when premarket demand is high. Thus, the allocation–returnrelationship may ref lect the endogenous nature of institutional allocationrather than any private information about returns it contains. We considertwo-stage estimates to explicitly separate out the effect of the endogenouslydetermined portion of the institutional allocation on the initial IPO returns.
To model the endogenous nature of institutional allocation, rewrite themodels estimated in Tables III and IV as
E~RETURN ! � bXRETURN � cINST ~2!
E~INST ! � aXINST ~3!
where INST and RETURN denote institutional allocation and day one re-turns, respectively and the Xs denote the regressors associated with the twoequations. The key issue is whether the significance of institutional alloca-tion INST in equation ~2! is merely because INST is an endogenous functionof the variable XINST.
We can test if there is an endogeneity bias by entering the endogenousportion of institutional allocation INST rather than INST itself as a regres-sor to explain day one IPO returns. Equivalently, rewrite equation ~2! as
E~RETURN ! � bXRETURN � c1 @aXINST # ~4!
If the endogeneity hypothesis is correct, we would expect that c1 is positiveand significant in equation ~4!. The specification can be estimated by two-stage least squares ~2SLS! methods. In the first step, institutional allocation
Institutional Allocation in Initial Public Offerings 1437

is regressed on UPDATE and other regressors in XINST. Fitted values fromthis regression @aXINST# are then entered into the return equation instead ofinstitutional allocation INST and the specification is estimated. Standarderrors need adjustments because we use generated regressors in the secondstep of the two-step procedure ~see, e.g., Murphy and Topel ~1985! or Mad-dala ~1983!, Chapter 8!. In addition, if institutional allocation has privateinformation not ref lected in other public variables, excess allocation shoulditself explain day one returns. This suggests generalizing equation ~4! toincorporate excess allocation, that is, estimating
E~RETURN ! � bXRETURN � c1 @aXINST #� c2 @INST � aXINST#. ~5!
A positive and significant c2 would support the private information hy-pothesis while a positive and significant c1 would ref lect the existence of anendogeneity bias.10
Estimating the two equation system ~3!–~5! requires us to specify regres-sors that enter either equation. If, as in Tables III and IV, the same regres-sors enter the returns and allocation equations, that is, XRETURN � XINST,the equation-by-equation OLS coefficient c for institutional allocation INSTin equation ~4! is the same as regression coefficient c2 for excess institu-tional allocation. Thus, the significance of the coefficient for INST in theordinary least square results reported in Table IV, where XRETURN � XINST,can be interpreted as evidence that institutional allocation has private in-formation about day one returns. The same results obtain if XINST were to bea subset of XRETURN rather than being identical to XRETURN. Thus, non-OLSstructural estimates of Eqs. ~3! and ~4! are only needed when there is atleast one variable in the allocation equation ~3! that does not enter into thereturns equation ~4!.11
We can specify an extra variable in the allocation equation by arbitrarilyexcluding one or more regressors from the return equation ~5! but includingthese variables in the allocation equation ~4!. However, our strategy is tolook outside the set of variables in Tables ~3! and ~4! to avoid biases inducedby specification searches ~e.g., Lo and MacKinlay ~1990!!. We include thesize of the underwriting syndicate ~NSYNDICATE!, the field NUMAMGR inthe SDC New Issues database, as a potential determinant of the fraction ofthe issue allocated to institutions. We conjecture that there exists a negativerelationship between the institutional component of an issue and the syndi-cate size. The reasoning is that retail investors are more likely to have re-lationships and accounts with one or very few firms, while institutions are
10 Equation ~5! has more information than 2SLS, that is, equation ~4!, due to the extra term~INST � aXINST!. However, this term is orthogonal to other included variables ~it is a regres-sion error!, and does not affect other coefficient estimates.
11 When such a variable identifies the structural system, OLS is biased. The nature of sucha bias can be characterized analytically. These results are not reported here but are availableupon request.
1438 The Journal of Finance

likely to have ongoing relationships with multiple underwriters. Thus, is-sues with a more significant retail component require more extensive dis-tribution efforts in order to involve more retail customers and would probablyinvolve more underwriters being included in the syndicate, a view also borneout by informal conversations with underwriters. This suggests a negativerelationship between the syndicate size and the institutional allocation of anissue. The correlation between the two variables is �0.46.
Table V presents the two-stage estimates. As before in Table IV, we presentestimates when the day one return is specified as a continuous variable, andalso a specification in which it is an ordinal variable. Panel A reports esti-mates of the allocation equation ~3!. As expected, the syndicate size has anegative and significant coefficient, suggesting that issues with more retail~less institutional! allocation have a greater number of managers. Panels Band C of Table V report the second-stage estimates of return equation ~4!based on an ordered probit model and OLS, as before. In both specifications,fitted institutional allocation is not significant, suggesting that the endog-enous portion of institutional allocation is not significantly related to dayone returns. Thus, the positive relationship between institutional allocationand day one IPO returns does not ref lect the fact that allocation itself isrelated to other publicly available information. Allocation appears to haveprivate information about day one returns, consistent with which the coef-ficient for excess allocation is positive and significant. Unusually high in-stitutional allocation in IPOs is associated with positive day one returns.
IV. Summary and Conclusions
The fact that IPOs are underpriced is widely known and extensively doc-umented. However, there is little empirical evidence on how the day onegains in IPOs are allocated between institutional and retail investors. Thequestion of whether IPO allocation practices systematically favor institu-tions over retail investors is also a subject of much debate and ongoing reg-ulatory investigations. Using a new data set, we examine patterns ofinstitutional allocation in IPOs.
Our analysis consists of two parts. The first part of the analysis investi-gates the cross-sectional variation of institutional allocation in IPOs, andexamines whether institutions do in fact have higher allocation in the moreunderpriced issues. We find this is indeed the case, and document that thereis a positive relationship between institutional allocation and underpricing.
The next part of our analysis examines alternate explanations for whyinstitutional allocation is greater in underpriced issues. One explanation forthis result comes from the book-building theories of IPO underpricing, whichsuggest that underwriters attempt to extract favorable premarket demandinformation to help partially adjust the offer price upwards to the high endof the filing range. In such theories, underwriters allocate more shares inissues with strong premarket demand, which are also more likely to havehigher first day returns, as a quid pro quo for obtaining favorable premarket
Institutional Allocation in Initial Public Offerings 1439

demand information. A second explanation is that institutional allocation ispositively related to IPO underpricing because of private information. Suchinformation can be held by institutions, so that they participate less in lem-ons, or by underwriters who use this information to ensure that institutionsget less of the worse performing issues. We find support for both explanations.
Our results have implications for the ongoing debate regarding allocationpractices followed by U.S. underwriters. A key question in this debate iswhether institutions are favored in the IPO allocation process. Our evidence
Table V
Institutional Allocation & Underpricing: Two-Stage EstimatesThe table reports estimates of two-equation systems for a sample of 174 IPOs offered betweenMay 1997 and June 1998 for which institutional allocation is available. In each system, equa-tion ~A! consists of the regression of institutional allocation on several variables x including thenatural logarithm of the number of shares offered ~LOGSHARES!, the percentage differencebetween the midpoint of the filing range and the offer price ~UPDATE!, a reputation dummywhich is one if the underwriter is among the top 10 in terms of market share and zero otherwise~REPUTED!, the days spent in the registration process ~DAYS!, and the number of underwrit-ers in the syndicate ~NSYNDICATE!. In equation ~B!, the dependent variable is either the dayone return of the IPO ~R! for OLS estimates, or it equals 0 if R � 0, 1 if 0 , R � 20%, 2 if R .20%. The independent variables include the fitted value and residuals from equation ~A! andother firm-specific variables. Industry dummies based on one-digit SIC codes are included inthe regression but not reported in the table. t-statistics are in parentheses.
Equation A Equation B
Dependent Variable:Institutional
Allocation~%!
OrdinaryLeast Squares
Dependent Variable:Day One Return
~%!
Ordered ProbitDependent Variable:
0 if R � 0,1 if 0 , R � 20%,
2 if R . 20%
Intercept 69.95* �75.63* 2.60*~19.71! ~�2.83! ~0.69!
Fitted allocation 0.63 0.02~1.53! ~0.44!
Excess allocation 0.28* 0.02*~2.35! ~2.38!
LOGSHARES 0.93 �7.59* �0.15~0.73! ~�2.92! ~�0.84!
UPDATE 0.34* 0.64* 0.05*~4.48! ~3.28! ~3.78!
REPUTED �11.70* 16.26* 0.44~�5.40! ~2.37! ~0.83!
DAYS 0.01 �0.002 0.002~0.44! ~�0.09! ~0.09!
NSYNDICATE �0.38*~�3.52!
Pseudo-R2 ~ordered probit!or adjusted R2 ~for OLS! 32.52% 29.85% 24.51%
*Significant at the five percent level using a two-tailed test.
1440 The Journal of Finance

is certainly consistent with this view. We find that institutions do tend toconcentrate more in better performing IPOs. Part of this result is becauseinstitutions get favorable allocations in IPOs with strong premarket de-mand, which may be economically justified from a firm’s viewpoint as quidpro quo to institutions for information that allows underwriters to set higherprices for the IPO. However, we find that institutional allocation is relatedto IPO underpricing beyond what can be explained by premarket demand.This suggests that there is private information, either with institutions orwith underwriters, that benefits institutional investors in IPOs. Thus, whilebook-building is important, institutional allocation in underpriced IPOs is inexcess of that explained by book-building alone.
REFERENCES
Aggarwal, Reena, 2000, Stabilization activities by underwriters after new offerings, Journal ofFinance 55, 1075–1104.
Aggarwal, Reena, 2001, Allocation of initial public offerings and f lipping activity, Journal ofFinancial Economics, forthcoming.
Beatty, Randolph, and Jay Ritter, 1986, Investment banking, reputation, and the underpricingof initial public offerings, Journal of Financial Economics 15, 213–232.
Benveniste, Lawrence M., and Paul A. Spindt, 1989, How investment banks determine the offerprice and allocation of new issues, Journal of Financial Economics 24, 343–362.
Carter, Richard, and Steven Manaster, 1990, Initial public offerings and underwriter reputa-tion, Journal of Finance 45, 1045–1067.
Chen, Hsuan-Chi, and Jay Ritter, 2000, The seven percent solution, Journal of Finance 55,1105–1132.
Cornelli, Francesca, and David Goldreich, 2001, Book-building and strategic allocation, Journalof Finance, 56, 2337–2369.
Ellis, Katrina, Roni Michaely, and Maureen O’Hara, 2000, When the underwriter is the marketmaker: An examination of trading in the IPO aftermarket, Journal of Finance 55, 1039–1074.
Gasparino, C., Schroeder, M., and Kranhold, K., 2000, SEC targets IPO process with probes,Wall Street Journal, December 19, C1.
Habib, Michel A., and Alexander P. Ljungqvist, 1998, Underpricing and IPO proceeds: A Note,Economics Letters 61, 381–383.
Habib, Michel A., and Alexander P. Ljungqvist, 2001, Underpricing and entrepreneurial wealthlosses in IPOs: Theory and evidence, Review of Financial Studies 14, 433–458.
Hanley, Kathleen W., 1993, The underpricing of initial public offerings and the partial adjust-ment phenomenon, Journal of Financial Economics 34, 231–250.
Hanley, Kathleen W., and William J. Wilhelm, 1995, Evidence on the strategic allocation ofinitial public offerings, Journal of Financial Economics 37, 239–257.
Hansen, Robert, 2000, Do investment banks compete in IPOs? The advent of the ‘7% pluscontract,’ Journal of Financial Economics 59, 313–346.
Jegadeesh, Narasimhan, Mark Weinstein, and Ivo Welch, 1993, IPO signaling and subsequentequity offerings: An empirical investigation, Journal of Financial Economics 34, 153–176.
Ljungqvist, Alexander, and William J. Wilhelm, 2001, IPO allocations: Discriminatory or dis-cretionary? Journal of Financial Economics, forthcoming.
Lo, Andrew, and A. Craig MacKinlay, 1990, Data snooping biases in tests of asset pricing mod-els, Review of Financial Studies 3, 431–467.
Loughran, Tim, and Jay Ritter, 2002, Why don’t issuers get upset about leaving money on thetable in IPOs? Review of Financial Studies 15, 413–443.
Loughran, Tim, Jay Ritter, and Kristian Rydqvist, 1994, Initial public offerings: Internationalinsights, Pacific-Basin Finance Journal 2, 165–199.
Institutional Allocation in Initial Public Offerings 1441

Lowry, Michelle, and G. William Schwert, 2002, IPO market cycles: bubbles or sequential learn-ing? Journal of Finance 57, 1171–1200.
Maddala, G., 1983, Limited Dependent and Qualitative Variables in Econometrics ~CambridgeUniversity Press, New York, NY!.
Maksimovic, Vojislav, and Pegaret Pichler, 2001, Private versus public offerings: Optimal sell-ing mechanisms, Working paper, University of Maryland.
Megginson, William, and Kathleen A. Weiss, 1991, Venture capitalist certification in initialpublic offerings, Journal of Finance 46, 879–903.
Michaely, Roni, and Wayne H. Shaw, 1994, The pricing of initial public offerings: Tests of ad-verse selection and signaling theories, Review of Financial Studies 7, 279–319.
Murphy, K., and R. Topel, 1985, Estimation and inference in two step econometric models,Journal of Business and Economic Statistics 3, 370–379.
Pulliam, S., and R. Smith, 2000, Linux deal is focus of IPO commission probe, Wall StreetJournal, December 12, C1.
Pulliam, S., R. Smith, and C. Gasparino, 2000, SEC intensifies inquiry into commissions for hotIPOs, Wall Street Journal, December 13, C1.
Ritter, Jay, 1998, Initial public offerings, Contemporary Finance Digest 2, 5–30.Rock, Kevin, 1986, Why new issues are underpriced, Journal of Financial Economics 15, 187–212.Smith, R., and S. Pulliam, 2000, U.S. probes inf lated commissions for hot IPOs, Wall Street
Journal, December 7, C1.Smith, R., and S. Pulliam, 2001, CSFB and employees may face NASD charges over IPO sales,
Wall Street Journal, May 2, C1.White, Halbert, 1980, A heteroskedasticity-consistent covariance matrix estimator and a direct
test for heteroskedasticity, Econometrica 48, 817–838.
1442 The Journal of Finance