INNOVATIVE RESPONSES TO LEARNING CONSTRAINTS
28
Australasian Journal of Economics Education Vol. 1 No. 2, September 2004 155 INNOVATIVE RESPONSES TO LEARNING CONSTRAINTS John Lodewijks and Glenn Otto ∗ University of NSW ABSTRACT We examine instruction in large-group introductory economics courses. In an era of increased fiscal stringency, where teaching resources are limited both in quantity and quality, we explore innovative approaches that may relax some of these constraints and facilitate improved learning outcomes. Information technology is often seen is a mechanism to facilitate instruction and to substitute for other scarce teaching resources. The Peer Assisted Support Scheme is another innovative way to assist student learning. We evaluate the effectiveness of these support mechanisms available to students. Key words: economics education, Supplemental Instruction, PASS, course web-sites. JEL classification: A20, A22. 1. INTRODUCTION The modern university is undergoing rapid change in academic mission, funding sources and measures of research and teaching performance. A recent book by Philip Mirowski and Esther-Mirijam Sent (2002) titled Science Bought and Sold gives a flavour of the transformation that has taken place with respect to academic research. Marginson (1997), and Marginson and Considine (2000), specifically focus on recent changes in the Australian higher education sector. Funding issues have driven the change process. In 1987 Australian universities derived 85 per cent of their ∗ School of Economics, University of New South Wales, Sydney NSW 2052, Australia; Phone: + 61 2 9385 3386; Fax: + 61 2 9313 6337; E-mail: [email protected], [email protected]. We would like to thank Peter McGuinn, Tracy Opera and Maria Spies of the Education Development Unit of the Faculty of Commerce and Economics at UNSW for assistance with data collection and analysis. John Biggs, Denzil Fiebig, Prem Ramburuth and two anonymous referees provided useful comments. This paper was presented at the Economics Education Conference, Adelaide, 13-16 July 2004 and we appreciated the various comments made at the session there.
Transcript of INNOVATIVE RESPONSES TO LEARNING CONSTRAINTS

Australasian Journal of Economics Education Vol. 1 No. 2, September 2004 155
INNOVATIVE RESPONSES TO LEARNING CONSTRAINTS
John Lodewijks and Glenn Otto∗ University of NSW
ABSTRACT
We examine instruction in large-group introductory economics courses. In an era of increased fiscal stringency, where teaching resources are limited both in quantity and quality, we explore innovative approaches that may relax some of these constraints and facilitate improved learning outcomes. Information technology is often seen is a mechanism to facilitate instruction and to substitute for other scarce teaching resources. The Peer Assisted Support Scheme is another innovative way to assist student learning. We evaluate the effectiveness of these support mechanisms available to students.
Key words: economics education, Supplemental Instruction, PASS, course web-sites. JEL classification: A20, A22.
1. INTRODUCTION
The modern university is undergoing rapid change in academic mission, funding sources and measures of research and teaching performance. A recent book by Philip Mirowski and Esther-Mirijam Sent (2002) titled Science Bought and Sold gives a flavour of the transformation that has taken place with respect to academic research. Marginson (1997), and Marginson and Considine (2000), specifically focus on recent changes in the Australian higher education sector. Funding issues have driven the change process. In 1987 Australian universities derived 85 per cent of their ∗ School of Economics, University of New South Wales, Sydney NSW 2052,
Australia; Phone: + 61 2 9385 3386; Fax: + 61 2 9313 6337; E-mail: [email protected], [email protected]. We would like to thank Peter McGuinn, Tracy Opera and Maria Spies of the Education Development Unit of the Faculty of Commerce and Economics at UNSW for assistance with data collection and analysis. John Biggs, Denzil Fiebig, Prem Ramburuth and two anonymous referees provided useful comments. This paper was presented at the Economics Education Conference, Adelaide, 13-16 July 2004 and we appreciated the various comments made at the session there.
Australasian Journal of Economics Education Vol.1 No. 2, September 2004 156
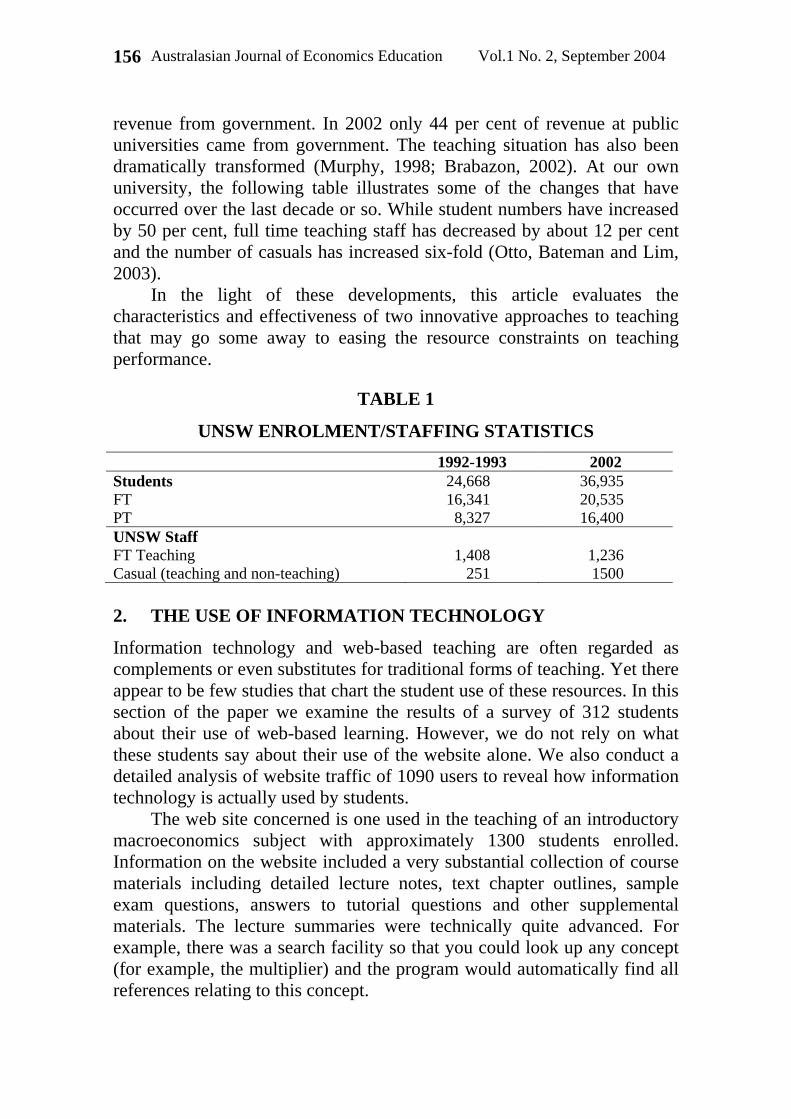
revenue from government. In 2002 only 44 per cent of revenue at public universities came from government. The teaching situation has also been dramatically transformed (Murphy, 1998; Brabazon, 2002). At our own university, the following table illustrates some of the changes that have occurred over the last decade or so. While student numbers have increased by 50 per cent, full time teaching staff has decreased by about 12 per cent and the number of casuals has increased six-fold (Otto, Bateman and Lim, 2003).
In the light of these developments, this article evaluates the characteristics and effectiveness of two innovative approaches to teaching that may go some away to easing the resource constraints on teaching performance.
TABLE 1
UNSW ENROLMENT/STAFFING STATISTICS 1992-1993 2002 Students 24,668 36,935 FT 16,341 20,535 PT 8,327 16,400 UNSW Staff FT Teaching 1,408 1,236 Casual (teaching and non-teaching) 251 1500 2. THE USE OF INFORMATION TECHNOLOGY
Information technology and web-based teaching are often regarded as complements or even substitutes for traditional forms of teaching. Yet there appear to be few studies that chart the student use of these resources. In this section of the paper we examine the results of a survey of 312 students about their use of web-based learning. However, we do not rely on what these students say about their use of the website alone. We also conduct a detailed analysis of website traffic of 1090 users to reveal how information technology is actually used by students.
The web site concerned is one used in the teaching of an introductory macroeconomics subject with approximately 1300 students enrolled. Information on the website included a very substantial collection of course materials including detailed lecture notes, text chapter outlines, sample exam questions, answers to tutorial questions and other supplemental materials. The lecture summaries were technically quite advanced. For example, there was a search facility so that you could look up any concept (for example, the multiplier) and the program would automatically find all references relating to this concept.

Australasian Journal of Economics Education Vol. 1 No. 2, September 2004 157
The sample survey of 312 students showed that the students were very satisfied with the website, both technically and with its content. Eighty four per cent of students said they used the website; 34 per cent used it once a week, 28 per cent once a month and 27 per cent just before exams. Ninety-two per cent accessed the site at home. The greatest number of students (45 per cent) used the site for exam preparation and review. Sixteen per cent used it for regular tutorial preparation, another 16 per cent used it to extend their understanding of the course generally, and 15 per cent used it for regular lecture preparation. Eighty seven per cent said the resource added value to the course and 85 per cent wanted similar web resources available in their other courses. However, 76 per cent said that in addition to the web resources they also wanted the materials in printed form. Students seem to want it all – and they want it now!
More detailed information is available from an extensive four month website traffic survey.
FIGURE 1
DAILY REPORT (PAGE VIEWS PER DAY, 2 AUGUST – 18 NOVEMBER)
0
1000
2000
3000
4000
5000
6000
7000
8000
9000
02/0
8/02
09/0
8/02
16/0
8/02
23/0
8/02
30/0
8/02
06/0
9/02
13/0
9/02
20/0
9/02
27/0
9/02
04/1
0/02
11/1
0/02
18/1
0/02
25/1
0/02
01/1
1/02
08/1
1/02
15/1
1/02
Week 2: Flyers are
handed out in lectures.
Sept 20th: Mid-session
Exam
Nov 18th: Final Exam

Australasian Journal of Economics Education Vol.1 No. 2, September 2004 158
Traffic to the site is measured in total page views. A page view occurs
when a user views any single page through his or her browser. The Macroeconomics site has approximately 385 pages of lecture materials content, along with the Structure, About, Overview and Search pages. For example, if a user viewed all of Topic 1, 14 page views would be recorded.
For the period 2 August to 18 November 2002 (the day the site went live to the day of the Final Exam), 1,090 users logged into the site (out of 1,291 enrolled in the course – about 85 per cent). The most viewed page was the PDF of the ‘Past Exams’. On campus traffic (either in labs or other UNSW facilities) accounted for less than 25 per cent of all traffic. Twenty seven per cent of the total traffic occurred in the two 24 hour periods before the mid-session and final exams.
Many students had a quick look at the site upon receiving the fliers handed out in the introductory lectures in early August. Average page views per user was about 12 during this first week, indicating brief visits, most likely to see what was on offer. Traffic then slumps considerably for the next few weeks. This indicates that students are not using the lecture summaries on a regular basis to prepare for lectures and/or tutorials.
Approximately one week before the mid-session Exam, traffic picks up remarkably with the average page views per day at around 1,500 for the week. It is also worth noting that the average page views per user nearly doubles during this week (about 25), indicating that students are reviewing multiple topic areas in preparation for the exam. Traffic then slumps again for several weeks, almost down to nothing. Again, traffic rises predictably for the Final Exam, with most students logging in at some point in the week leading up to it (650 different hosts, probably more users). Most students were looking for review material and past exam examples, primarily in the lead up to the mid-session and the final exam. The Past Exam pdf was hit over 2,000 times despite there being only 1,200 students in the course. It was viewed more than any other single page.
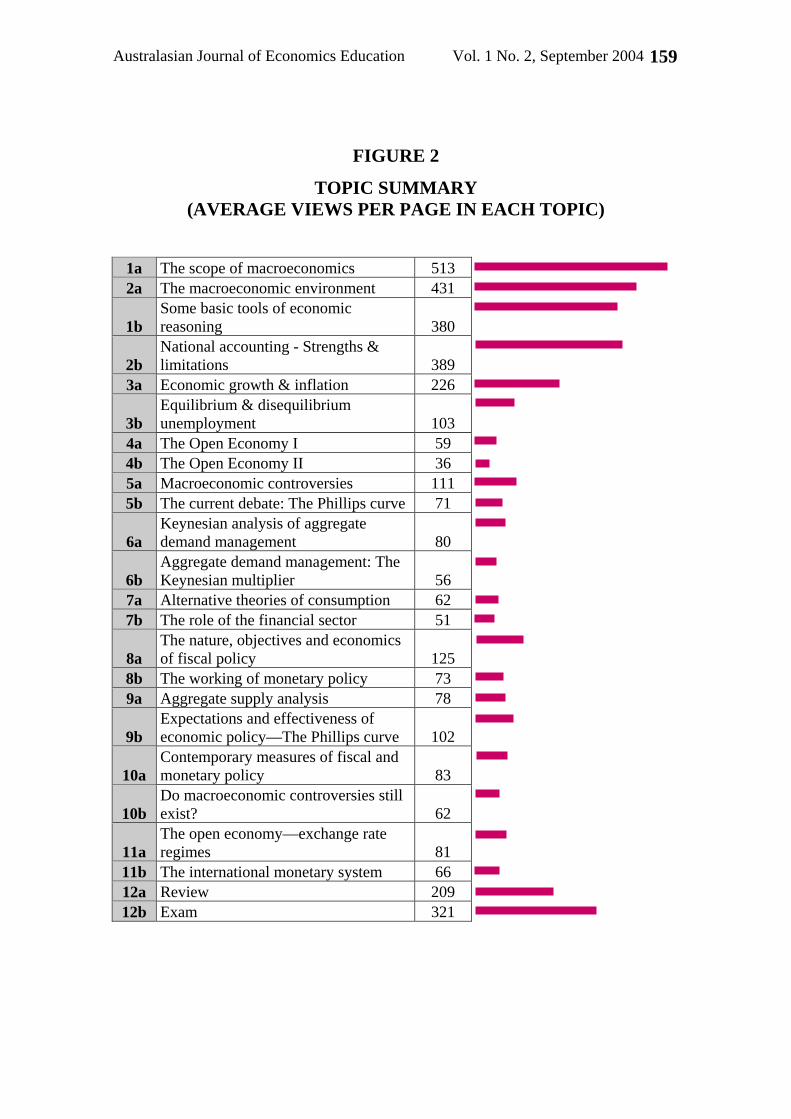
While not necessarily the most popular pages overall, certain pages showed an unusual amount of hits within their own topic. This might indicate areas that students feel are important (or that regularly appear on past exam papers), or had difficulty understanding from the lectures or tutorials. Examples included leakages and injections, the Exchange Rate, the Phillips Curve, decomposing the budget balance and forms of intervention in a flexible exchange rate regime. Such information then allows staff to review these topics in greater detail with students.
Australasian Journal of Economics Education Vol. 1 No. 2, September 2004 159
FIGURE 2
TOPIC SUMMARY (AVERAGE VIEWS PER PAGE IN EACH TOPIC)
1a The scope of macroeconomics 513 2a The macroeconomic environment 431
1b Some basic tools of economic reasoning 380
2b National accounting - Strengths & limitations 389
3a Economic growth & inflation 226
3b Equilibrium & disequilibrium unemployment 103
4a The Open Economy I 59 4b The Open Economy II 36 5a Macroeconomic controversies 111 5b The current debate: The Phillips curve 71
6a Keynesian analysis of aggregate demand management 80
6b Aggregate demand management: The Keynesian multiplier 56
7a Alternative theories of consumption 62 7b The role of the financial sector 51
8a The nature, objectives and economics of fiscal policy 125
8b The working of monetary policy 73 9a Aggregate supply analysis 78
9b Expectations and effectiveness of economic policy—The Phillips curve 102
10a Contemporary measures of fiscal and monetary policy 83
10b Do macroeconomic controversies still exist? 62
11a The open economy—exchange rate regimes 81
11b The international monetary system 66 12a Review 209 12b Exam 321

Australasian Journal of Economics Education Vol.1 No. 2, September 2004 160
FIGURE 3
DAILY SUMMARY (PERCENTAGE BY DAY OF THE WEEK)
0%
5%
10%
15%
20%
25%
Mon Tue Wed Thu Fri Sat Sun
This data on daily usage is skewed by the dates of the mid-session and
final exams, pushing Thursday and Sunday abnormally high simply on the ‘day before cramming’ factor. However, the fact that over 30 per cent of traffic occurs on weekends indicates the ability and willingness of students to access material from home.
It is interesting to note the change in usage between the start and end of session. The heavy use in the morning before noon drops dramatically as the session wears on. The percentage of on-campus use shows a corresponding drop, so it could be that students came to campus less often, and spent less time at the website before or between classes.
These statistics provide a snap-shot of the use that students made of web-based resources, in this case a very detailed and technically student-friendly site in terms of navigation, speed, reliability and layout. As educators we would prefer that students used these resources consistently and sequentially, with the amount of effort spread somewhat evenly over the session. This is obviously not what we find. The cramming urge dominates. One interpretation of these findings is that at the margin, the costs associated with the construction of these elaborate web-sites exceed the benefits. There may be a case for reducing the resources required for their construction and continual updating. A more charitable and complementary view is that if the students are tolerably satisfied with the lectures, tutorials and text (and this course does receive very favourable student reviews) then the students may not need or feel the necessity for utilizing these supplemental resources. The descriptive information

Australasian Journal of Economics Education Vol. 1 No. 2, September 2004 161
provided in this section is useful but in order to more fully evaluate the effectiveness of learning outcomes we need more rigorous estimation procedures. This we do in the next section of the paper.
FIGURE 4
HOURLY SUMMARY (PERCENTAGE OF USE BY TIME OF DAY)
FIRST HALF OF SESSION (UP TO MIDSESSION EXAM):
0%
2%
4%
6%
8%
10%
12%
14%
7am
8am
9am
10am
11am
12pm 1p
m
2pm
3pm
4pm
5pm
6pm
7pm
8pm
9pm
10pm
11pm
12am 1a
m
2am
3am
4am
5am
6am
SECOND HALF OF SESSION:
0%
2%
4%
6%
8%
10%
12%
14%
7am
8am
9am
10am
11am
12pm 1p
m
2pm
3pm
4pm
5pm
6pm
7pm
8pm
9pm
10pm
11pm
12am 1a
m
2am
3am
4am
5am
6am

Australasian Journal of Economics Education Vol.1 No. 2, September 2004 162
3. THE PEER ASSISTANCE SUPPORT SCHEME
The objective of this section is to present a formal statistical analysis of the impact of another learning support initiative on student’s academic performance. While there are many aspects to academic performance, the focus of this study is on whether the learning support programs have a significantly positive effect on the marks obtained by students who undertake the programs. Learning support programs (LSP) offered include: Peer Assistance Support Scheme (PASS); orientation programs; disciple specific workshops; individual consultations and workshops on general academic skills provided by the Education Development Unit (EDU). Due to data availability the main focus of this study is on the effect of PASS (often called Supplemental Instruction in the U.S.) on the performance of first-year undergraduates. However an attempt is made to examine the overall impact of the various LSP on academic performance by comparing grades in a year (1996) when minimal LSP were offered with those in a year (1998) when all of the aforementioned programs were operating.
The study is based on data that has been collected on undergraduate students who undertook at least one of the introductory economics or quantitative methods course in the Schools of Economics and Accounting in the years 1996 and 1998. The sample size for each of the cohorts is about 950 students. A common feature of both these years is that students were required at the beginning of Session 1 to undertake a Language Diagnostic Task (LDT). Each student’s performance on the LDT was marked using a grading scheme of A (highest) to D (lowest). The 1998 results were subsequently analysed using the SOLO taxonomy due to Biggs (1988) which is used to measure reading and writing skills. Information from both of these sources are used (when available) as explanatory variables for students’ academic performance.
Since there were minimal LSP in 1996 the data for this cohort are used to develop a linear regression model of students’ academic performance. A similar model is then estimated using data for the 1998 cohort. This provides some independent evidence on the validity of the specification of the model of academic performance. Information on participation by students in the 1998 cohort in the PASS learning support program is then included into the model and is used to estimate the impact of the program involvement on a students’ academic performance.
Results obtained from the regression models suggest that PASS has a positive effect on a student’s average grades for the year if they attend five or more groups. The estimated effect from regular PASS attendance is approximately two to four marks. However one potential difficulty with the interpretation of the results of the regression model is sample selection

Australasian Journal of Economics Education Vol. 1 No. 2, September 2004 163
bias, see Heckman (1976). When we test for the presence of significant selectivity bias in the regression estimates using a procedure due to Heckman it is not found, however some caution is required as this lack of evidence may be due to the limitations of the procedure and the nature of the data. 4. A MODEL OF ACADEMIC PERFORMANCE
The following model is used to explain the academic performance of the 1996 cohort. For this year there were no LSP offered by the Faculty of Commerce and Economics (FCE). The basic model for a student’s performance is assumed to be of the following form;
iiii Xg εβα +′+= 0 (1) where is a measure of an individual student’s academic performance, is a vector of continuous and discrete (i.e. zero or one) variables that explain a student’s academic performance and
ig iX
iε is an error term that is assumed to be independently and identically distributed1. In cross-section data of the type used the assumption of an identical variance for each error term is frequently violated. While OLS estimates of the coefficients are still consistent the estimated standard errors are invalid. Consistent standard errors can be obtained by using the approach of White (1980). Under standard assumptions about the error term the model can be estimated by ordinary least squares (OLS). The coefficient estimates indicate the marginal effect of each variable on a student’s academic performance. The estimated model can also be used to predict the performance of a student with particular characteristics.
Model (1) does not allow for the possible impact of learning support programs offered on a student’s performance. The following model is used for the 1998 cohort and it augments model (1) by including a vector of
1 One point worth noting is that the dependent variable is bounded between 0
and 100. However in our estimation procedure there is nothing that prevents the predicted values from the estimated sample regression function for (1) from lying outside of this bound. One strategy would be to apply a transformation to the right hand side of (1) that ensured it was bounded between 0 and 100. Alternatively MacKinnon and Davidson (1993) describes a double censored tobit model that could be used. In this study we have not employed either of these approaches. In practice our data are such that the fitted values from the models in Tables 4-8 always lie within the 0 to 100 bound.
ig

Australasian Journal of Economics Education Vol.1 No. 2, September 2004 164
variables that indicate whether (or not) a student participated in various PASS learning support programs;
iZ
iiiiii ZXg ωγβα +′+′+= 0 (2)
One difficulty with estimating model (2) by OLS is the possibility of sample selection bias. This bias can affect the coefficient estimates on the PASS variables. The problem arises because students choose (or self-select) whether or not to attend PASS rather than being randomly allocated to the programs (this is a standard problem in evaluation of the effectiveness of various social programs). Thus suppose that motivation is the only variable that systematically affects the grades received by an individual student and that higher motivation leads to higher grades. However motivation will also be an important influence on whether a student chooses to undertake a PASS program. What this implies is that students who attend PASS will tend to get high grades regardless of whether or not the assistance given at the PASS actually improves the students learning skills. If students were randomly selected to attend the PASS programs this bias would not arise. If the PASS were effective then we would observe an improvement in the grades of those students with low motivation.
In practice sample selection bias may be relatively small, in which case the OLS estimates of iγ will give a reliable indication of the impact of regular PASS attendance on a student’s academic performance. In this report an approach due to Heckman (1976) is used to test for the effect of significant sample selection bias on the OLS estimates, see McKinnon and Davidson (1993). 4.1 Data
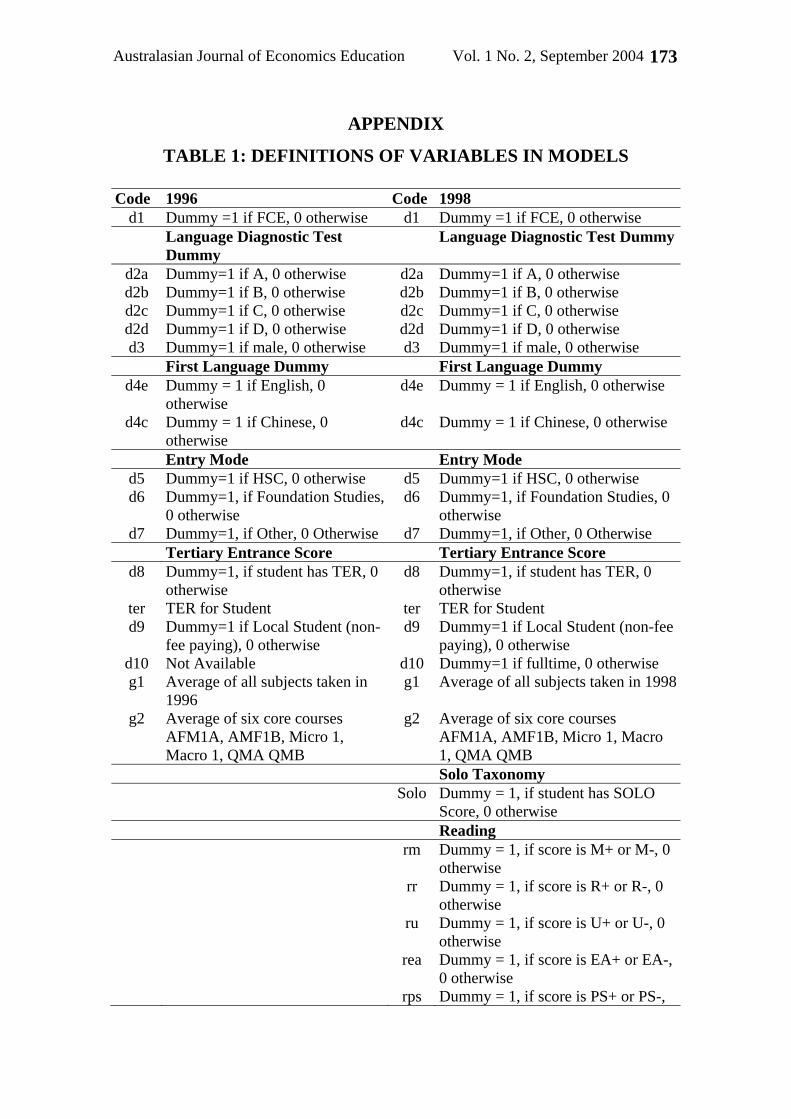
Two data sets have been collected for undergraduate students in the years 1996 and 1998. Many of the variables measure qualitative characteristics of students, for example whether they are male or female, and these are measured as zero-one discrete (or dummy) variables. Full definitions of all the variables used in the study are presented in Table 1. All Tables appear in the Statistical Appendix. Summary statistics for the discrete variables are presented in Tables 2 and for the continuous variables in Table 3.
A defining characteristic of the students in the 1996 and 1998 undergraduate cohorts is that they all undertook a Language Diagnostic Task (LDT) offered in each of these years. In 1996 987 undergraduate students took the LDT and in 1998 the figure was 962 students. Each

Australasian Journal of Economics Education Vol. 1 No. 2, September 2004 165
student’s performance on the LDT was marked using a grading scheme of A to D. Although the LDT only tests one aspect of a student’s ability, namely English ability, it has the advantage of providing a common assessment of a student’s ability upon entering an undergraduate degree. For both cohorts data are available on certain important characteristics including: whether or not the student is in the FCE; sex; local or international (i.e. fee-paying); their first-language; mode of entry (i.e. HSC – Higher School Certificate - or other) and whether or not the student has a TER (Tertiary Entrance Score).
For the 1998 cohort some additional data is available on each student. Information is available on whether a student is part-time or full-time. The 1998 LDT was analysed using Biggs (1988) SOLO taxonomy. This can be used to measure students reading and writing levels. For both reading and writing there are five basic classifications. These are from least to most advanced; pre-structural (ps), uni-structural (u), multi-structural (m), relational (r) and extended abstract (ea) (in fact there were plus and minus for four of these categories however these were not separately distinguished for the empirical analysis in this paper). Students in the 1998 cohort also completed a Study Process Questionnaire (SPQ) see Biggs (1987). This provides information on a student’s approach to study and learning, in particular whether they adopt a “deep approach” or a “surface approach”. “Surface” learning consists mainly of comprehension and reproducing knowledge (rote learning) which is often forgotten by students shortly after the course has ended. “Deep” learning requires higher order cognitive thinking skills such as analysis (i.e. compare, contrast) and synthesis. There are six basic categories with a student receiving a raw score in each2.
Finally for the 1998 cohort there is information on the PASS learning support program offered by the FCE. For 1998 a summary of PASS attendance is reported in Table 2. To get an indication of the impact of regular attendance at PASS groups, a student is only considered to have participated in PASS if they attended five or more PASS sessions in a particular course.
From Table 2 it is evident that many of the characteristics of the students are similar across the two cohorts. The two major differences are a rise in the proportion of FCE students in the 1998 cohort (from 0.76 to 0.84) and a fall in the proportion of students in 1998 who received a grade of D (the lowest) on the Language Diagnostic Task (from 0.15 to 0.06). Table 3 shows the mean Tertiary Entrance marks across the two cohorts are 2 The six categories are surface motivation (sm), surface strategy (ss), surface
approach (sa), deep motivation (dm), deep strategy (ds) and deep approach (da).

Australasian Journal of Economics Education Vol.1 No. 2, September 2004 166
similar, although the standard deviation rises from 7.1 in 1996 to 14.9 in 1998.
The dependent variable of the regression model is an individual student’s academic performance . This is measured in two ways: is the average of marks received in all courses in 1996 and is the average of marks received in the six core introductory courses. In the latter case where students do less than six courses the average is based on the core courses actually done. The means of the two measures of grades are similar for both years; approximately 64.5, see Table 3. There is somewhat more variation in the standard deviations, which range from 11.42 ( in 1996) to 13.0 ( in 1996).
ig ig1
ig2
ig1
ig2 5. EMPIRICAL RESULTS
5.1 A Baseline Model for the 1996 Cohort
Estimates of model (1) for the 1996 undergraduate cohort are presented in Table 4. Results using as the dependent variable are presented in columns (1) to (5) and those using are reported in columns (6) to (10). Column (1) includes all the explanatory variables that are available for 1996. Jointly these variables explain about 25 per cent of the variation in . The variables that have statistically significant explanatory power for a student’s grades are as follows: whether or not a student has a TER; the level of the TER; having Chinese as the first language and the grade received on the LDT. If is used as the dependent variable, see column (6), the R-squared (adjusted for degrees of freedom) is 0.32. With the more restrictive measure of grades three additional explanatory variables, whether the student is in the FCE, a student’s sex and whether or not they are local, are also statistically significant. Columns (2), (3), (7) and (8) present results obtained from omitting the least significant variables from the models. Notice there is a very modest decline in the adjusted R-squared.
ig1
ig2
ig2
ig1
Column (8) contains only those variables with a statistically significant effect on . In general the results from the model are consistent with prior expectations. For students with a TER score, the higher the TER the higher the average mark. To see this consider column (10) which includes the TER as an explanatory variable. For students without a TER their average mark in the core courses is 62.5 which is two marks less than the sample average for of 64.5. For a student with the average TER of 92.6 (see Table 3) this simple model predicts an average
ig2
ig2

Australasian Journal of Economics Education Vol. 1 No. 2, September 2004 167
mark of 65.3, slightly less than one mark above the sample average. A student with a TER of 99 would be expected to obtained an average in the core courses of 72.5. These results are qualified somewhat by using the more general model in column (8). In this case a student with a TER of 92.6 who was also in the FCE, a local student, had English as a first language, obtained a grade of A on the LDT and was male would be expected to obtain an average of 67.7 in the core courses. If the same student were female the average mark is predicted to fall by 1.7 marks. Now consider what the model in column (8) predicts about a student without a TER. These students are likely to be international students and will possibly not have English as their first language. Consider a male international student, with Chinese as the first language who obtained a grade of A on the LDT. A student with these characteristics is predicted to obtain an average mark on the core courses of 71.2. Notice that if the same student were to have received a mark of D on the LDT, their predicted average mark falls by 6.8 marks.
The results in Table 4 indicate that a model with reasonable explanatory power for the grades of a student in the 1996 cohort can be developed. The validity of this model for student grades is now tested by estimating it on data for the 1998 cohort. 5.2 A Baseline Model for the 1998 Cohort
Results from estimating the baseline model for the 1998 cohort are presented in Table 5. One difference between the models for the two years is that for 1998 we can include a variable that indicates whether or not the student is full-time or part-time. As can be seen from the results in columns (1) and (4) full-time or part-time status is not a significant determinant of a student’s marks. It is evident from Table 5 that when is the dependent variable the baseline model fits the 1998 cohort about as well as it did for the 1996 cohort. However there are some differences between the two cohorts and these can be seen by comparing column (6) in Table 5 with column (8) in Table 4. In the 1998 cohort there is no significant difference between the performance of males and females. In addition there is a change in the sign of the dummy variable for local and international students, so that in the 1998 cohort being a local student has a significant positive effect on a student’s grades. Finally for the 1998 cohort it is grades C and D on the LDT that are significant predictors of future academic performance.
i2g
We can use the estimates for to predict the performance of students with particular characteristics. As we did for 1996 consider the
ig2
Australasian Journal of Economics Education Vol.1 No. 2, September 2004 168
case of a student with the average TER for 1998 of 93.0 who was also in the FCE, a local student, had English as a first language and obtained a grade of A or B on the LDT. From the estimates in column (6) their expected average mark for the core courses is 66.0, compared with the sample average of 64.7. Now consider an international student with no TER, with Chinese as the first language who obtained a grade of A or B on the LDT. A student with these characteristics is predicted to obtain an average mark on the core courses of 62.2. Notice that if the same student were to have received a mark of C or D on the LDT, their predicted average mark falls by 2.2 and 6.5 marks respectively and by a further 3.2 marks if their first language is not Chinese.
When is used as the explanatory variable the fit of the baseline model deteriorates markedly between the 1996 and the 1998 cohorts i.e. the R-squared falls from about 0.25 to 0.18. This fall is driven by the fact that for the 1998 cohort the TER is not a significant predictor of a student’s academic performance when it is measured by . This implies that in explaining there is no significant difference between students who have and those who do not have a TER score. The reason for the difference between the 1996 and the 1998 results for is not immediately obvious, however it is worth noting from Table 3 that the standard deviation of TER scores more than doubles from 7.1 to 14.9 between the two cohorts. Thus for the 1998 model for the significant explanatory variables are being in the FCE, having Chinese as a first language, whether the student is local or international and obtaining a grade of C or D on the LDT.
ig1
ig1ig1
ig1
ig1
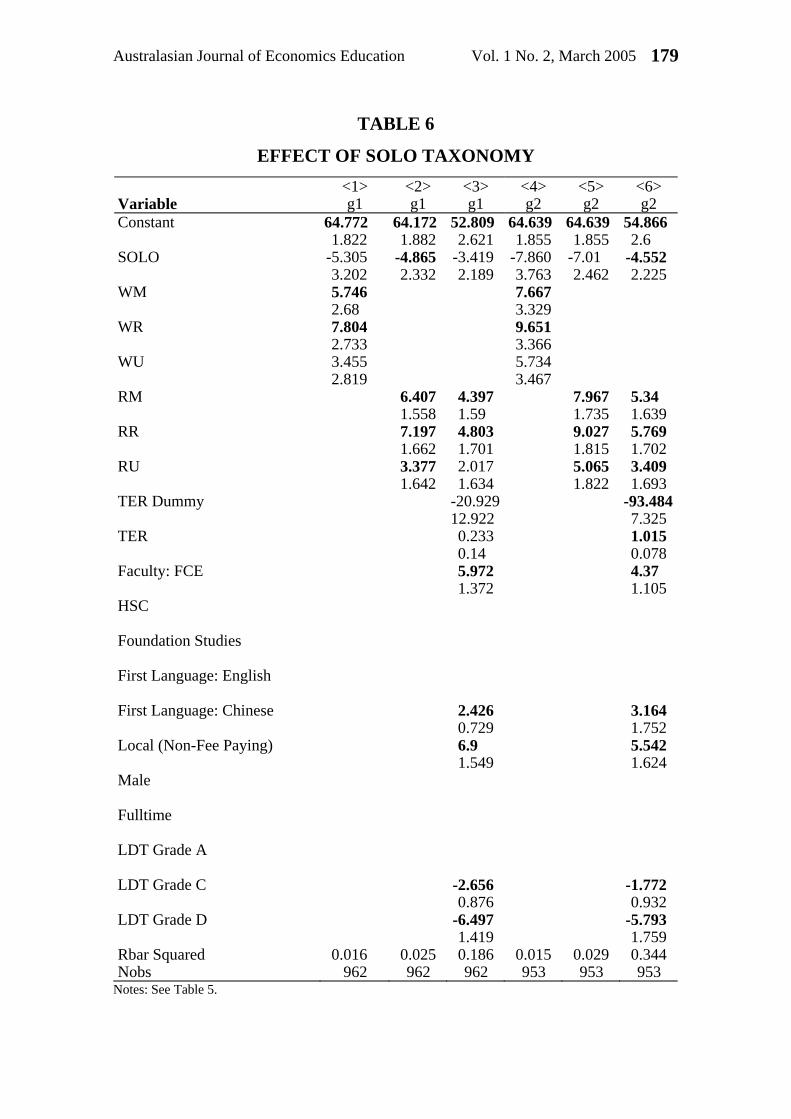
5.3 SOLO Taxonomy
The baseline model for the 1998 cohort was extended by including information data from the SPQ and from Biggs (1988) SOLO taxonomy. Using data from the results of the SPQ, which seeks to identify whether a student adopts a deep or a surface approach to leaning, did not produce any significant improvement in explanatory power for academic performance. In contrast the SOLO taxonomy does help to explain students’ performance. Results from including the SOLO taxonomy variables in the baseline models are reported in Table 6. Since a small proportion of students did not have their LDT results analysed using the SOLO taxonomy the model includes a dummy variable called SOLO which indicates whether or not a student has a SOLO classification. Although SOLO classifications are reported for both reading and writing, it is not possible to simultaneously include both categories in the model due to problems of multi-collinearity. While there are five categories we include separate
Australasian Journal of Economics Education Vol. 1 No. 2, September 2004 169
dummies for the three main ones, uni-structural, multi-structural and relational, where these reflect increasing levels of competence. The net effect on a student’s marks of each of these categories can be found by adding the coefficient on the relevant dummy and the coefficient on the SOLO dummy. One interesting finding is that the reading taxonomy has stronger predictive content for a student’s marks than does the writing taxonomy. In general students who fall into the relational category score higher marks and those in the uni-structural category lower marks (than average). 6. THE IMPACT OF PASS ON ACADEMIC PERFORMANCE
The baseline model for 1998 (extended to include the results for the SOLO reading taxonomy) is used to consider the effect of the PASS program on student’s marks. Results are presented in Table 7. Our focus is to examine the effect of regular attendance at PASS groups which is defined as attending five or more groups. For two courses this definition produces very low figures for PASS attendance. The four other courses have much larger figures for PASS attendance and in the model it is only these which are considered.
Column (1) of Table 7 presents the results of a model in which and are simply regressed on a constant and the PASS dummy variables.
The results suggest that PASS attendance has a statistically significant and positive effect on a student’s grades. Attendance at five or more PASS sessions in a course raises a student’s average mark by somewhere between 2.5 to 4 marks. Moreover since a student could attend PASS groups for all four courses the estimates point to the possibility of a much larger overall effect on academic performance. As can be seen from columns (2), (3), (7) and (8) the significant effect on academic performance from regular PASS attendance continues to hold when other explanatory variables are included in the model.
ig1
ig2
Instead of including a dummy variable for PASS attendance at each separate course two aggregate variables D7 and D8 were constructed. D7 was constructed by summing over the dummy variables for the six courses and has a range of 0 to 6. D8 is a one-zero dummy that takes the value one if the student regularly attended at least one of the six PASS groups and zero otherwise. Results using these aggregate indicators are also presented in Table 7. From column (9) we see that a student who attended one PASS group raises their average by about 2 marks while one who attends all four would raise their average by about 8 marks. Results for D8 also point to a positive effect on marks from PASS attendance.

Australasian Journal of Economics Education Vol.1 No. 2, September 2004 170
6.1 A Test for Sample Selection Bias
While the results in the previous section can be interpreted as implying the PASS program can raise the average marks of students who attend on a regular basis, which is consistent with studies undertaken by Martin (1995) and Hamilton (1994), it is possible that these findings reflect sample selection bias. A study by Lewis et al (2004) indicated that the PASS program had little impact on the academic performance of students after correcting for selection bias. Perhaps a high proportion of the students who regularly attend PASS groups are highly motivated students who would have achieved high marks whether or not they attended PASS. It is this fact that may account for the observed positive conditional correlation between PASS and average marks that is observed in the data.
McKinnon and Davidson (1993) provide a simple method for testing for the presence of sample selection bias in our OLS estimates. The test involves using all of the regressors in the model for average grades and including them as explanatory variables in a probit model for PASS attendance. The inverse Mills ratio is computed from the probit model and included as a potential regressor in model (2). The model becomes
(3) iiiiiiiiii XFXFZXg ωββπγβα +′′Φ+′+′+= − )(/))((1
0
iX
where the additional regressor is the inverse Mills ratio. This additional regressor represents a means of correcting for the sample selection bias. This model can be estimated by OLS and evidence of sample selection bias is tested by the significance of the estimated coefficient on the inverse Mills ratio. Notice that the correction term for selection bias is a function of the same set of explanatory variables (same ’s) that are included in equation (3). Thus identification of the sample selection correction coefficient is achieved by the non-linearity of its functional form. In practice this may be a relatively weak method for achieving identification. In principle it would be desirable to achieve identification by exclusion restrictions i.e. by having additional explanatory variables in the probit model for PASS attendance that are not in the model for academic performance. There are no such obvious instrumental variables in the data set.
Table 8 presents the results obtained from applying the test for selectivity bias. For simplicity the test is applied to the models that use the D8 dummy variable, see columns (2) and (4). Column (1) of Table 8 reports the results of a probit model for PASS attendance i.e. of D8. Three
Australasian Journal of Economics Education Vol. 1 No. 2, September 2004 171
variables are significant: the constant term, being in the FCE and being a local student. Columns (3) and (5) present the results obtained from including the inverse Mills ratio computed from the probit model into the models for and . It is clear from the standard errors that in neither case is the selectivity correction statistically significant. Moreover the coefficient on the PASS dummy D8 changes only marginally in both cases. However some of the other coefficient estimates do change quite markedly as do their standard errors, see the estimates for the FCE/non-FCE and local/international dummies. One explanation for this is that there may be multicollinearity between the selectivity correction variable and the other variables in the model. This will arise if the degree of non-linearity in the selectivity correction is not very high and consequently it is only weakly identified. It is not clear how to completely avoid this problem with the existing data set.
ig1 ig2
7. CONCLUSION
In this paper we examined two innovative teaching resources – web-based supplementary course materials and the peer-assisted support scheme. A detailed statistical profile was presented of the use that students made of the web-site. We noted that even resource rich and student-friendly sites were visited irregularly and only intensively at peak exam times. This raises several issues. First, given the way in which these resources are used by students, does the cost of developing these materials exceed the benefits? Second, do these web-based materials provide significant additional benefit to the student beyond a carefully selected textbook? Third, can the web-based materials be changed in any way to encourage a greater degree of use by students? Our tentative conclusions are that the net benefits of elaborate and extensive web-based materials may not be positive. Less time and resource-intensive web-based materials may yield greater returns. On the last issue about ‘encouraging’ greater use by students, a colleague from Macquarie University suggested we should follow his example and be more authoritarian (if not draconian) in forcing students to use the site. We are more comfortable with incentive carrots rather than disciplinary sticks.
We then developed a model which identifies a number of factors that explain the variation in first-year undergraduate students’ academic performance. Those factors that appear to be most important at predicting a student’s academic performance are tertiary entrance marks and whether or not a student is enrolled in the commerce and economics faculty, has Chinese as a first language, and is a local or international student. In addition scores received in two exercises undertaken by the Educational

Australasian Journal of Economics Education Vol.1 No. 2, September 2004 172
Development Unit also have some predictive power for students’ performance. The Language Diagnostic Test can then be used to identify ‘at risk’ students and remedial instruction may be able to improve their grade performance. This is indeed the process that was followed at UNSW. Students were classified into groups depending on their diagnostic test performances and the intensity of remedial instruction was related to which performance band they fell in. In some cases, this remedial instruction was so intensive that it meant students were unable to take the full course load and hence had to stay at UNSW for an additional session to complete requirements. Factors that do not appear to be important influences on a student’s grades include: sex, whether student is full-time or part-time and their mode of entry to university.
These models of academic performance are then used to examine the effect of participation in the PASS program, an important learning support initiative that is offered, on students’ academic performance. Evidence is found that the PASS program appears to have a statistically significant and qualitatively important effect on the average marks of those students who attend on a regular basis. However, the effectiveness of the program should be judged by comparing the benefits with the costs of running these sessions. We are optimistic on this score. Some caution is also required with the interpretation of these results due to an inherent sample selection problem. Students are not randomly allocated to the PASS program but self-select whether or not to attend. While a standard test for the presence of selectivity bias does not indicate it is a significant problem in the data this may be due to problems with the standard Heckman procedure.
Australasian Journal of Economics Education Vol. 1 No. 2, September 2004 173
APPENDIX
TABLE 1: DEFINITIONS OF VARIABLES IN MODELS
Code 1996 Code 1998 d1 Dummy =1 if FCE, 0 otherwise d1 Dummy =1 if FCE, 0 otherwise Language Diagnostic Test
Dummy Language Diagnostic Test Dummy
d2a Dummy=1 if A, 0 otherwise d2a Dummy=1 if A, 0 otherwise d2b Dummy=1 if B, 0 otherwise d2b Dummy=1 if B, 0 otherwise d2c Dummy=1 if C, 0 otherwise d2c Dummy=1 if C, 0 otherwise d2d Dummy=1 if D, 0 otherwise d2d Dummy=1 if D, 0 otherwise d3 Dummy=1 if male, 0 otherwise d3 Dummy=1 if male, 0 otherwise First Language Dummy First Language Dummy
d4e Dummy = 1 if English, 0 otherwise
d4e Dummy = 1 if English, 0 otherwise
d4c Dummy = 1 if Chinese, 0 otherwise
d4c Dummy = 1 if Chinese, 0 otherwise
Entry Mode Entry Mode d5 Dummy=1 if HSC, 0 otherwise d5 Dummy=1 if HSC, 0 otherwise d6 Dummy=1, if Foundation Studies,
0 otherwise d6 Dummy=1, if Foundation Studies, 0
otherwise d7 Dummy=1, if Other, 0 Otherwise d7 Dummy=1, if Other, 0 Otherwise Tertiary Entrance Score Tertiary Entrance Score
d8 Dummy=1, if student has TER, 0 otherwise
d8 Dummy=1, if student has TER, 0 otherwise
ter TER for Student ter TER for Student d9 Dummy=1 if Local Student (non-
fee paying), 0 otherwise d9 Dummy=1 if Local Student (non-fee
paying), 0 otherwise d10 Not Available d10 Dummy=1 if fulltime, 0 otherwise g1 Average of all subjects taken in
1996 g1 Average of all subjects taken in 1998
g2 Average of six core courses g2 Average of six core courses AFM1A, AMF1B, Micro 1,
Macro 1, QMA QMB AFM1A, AMF1B, Micro 1, Macro
1, QMA QMB Solo Taxonomy Solo Dummy = 1, if student has SOLO
Score, 0 otherwise Reading rm Dummy = 1, if score is M+ or M-, 0
otherwise rr Dummy = 1, if score is R+ or R-, 0
otherwise ru Dummy = 1, if score is U+ or U-, 0
otherwise rea Dummy = 1, if score is EA+ or EA-,
0 otherwise rps Dummy = 1, if score is PS+ or PS-,

Australasian Journal of Economics Education Vol.1 No. 2, September 2004 174
0 otherwise Writing wm Dummy = 1, if score is M+ or M-, 0
otherwise wr Dummy = 1, if score is R+ or R-, 0
otherwise wu Dummy = 1, if score is U+ or U-, 0
otherwise wea Dummy = 1, if score is EA+ or EA-,
0 otherwise wps Dummy = 1, if score is PS+ or PS-,
0 otherwise Study Process Questionnaire sm Raw Scores dm Raw Scores ss Raw Scores ds Raw Scores sa Raw Scores da Raw Scores Pass Attendance dp1 Dummy =1, if attended >= 5
AFM1B (S2), 0 otherwise dp2 Dummy =1, if attended >= 5
AFM1A (S2), 0 otherwise dp3 Dummy =1, if attended >= 5
AFM1A (S1), 0 otherwise dp4 Dummy =1, if attended >= 5 QMB
(S2), 0 otherwise dp5 Dummy =1, if attended >= 5 QMA
(S2), 0 otherwise dp6 Dummy =1, if attended >= 5 QMA
(S2), 0 otherwise dp7 Sums across the 6 Dummies dp8 Dummy =1, if dp7 >=1, 0 otherwise

Australasian Journal of Economics Education Vol. 1 No. 2, September 2004 175
TABLE 2
SUMMARY STATISTICS – DUMMY VARIABLES
Variable 1996 1998 Number Proportion Number ProportionFaculty FCE 753 0.763 803 0.835 Other 234 0.237 159 0.165 First language English 467 0.473 437 0.454 Chinese 304 0.308 332 0.345 Other 216 0.219 193 0.201 Entry Mode HSC 758 0.768 718 0.746 Foundation 140 0.142 192 0.200 Other 89 0.090 52 0.054 TER Yes 693 0.702 696 0.723 No 294 0.298 266 0.277 Sex Male 453 0.459 441 0.458 Female 534 0.541 521 0.542 Origin Local 774 0.784 719 0.747 International 213 0.216 243 0.253 Language Test A 406 0.411 368 0.383 B 251 0.254 334 0.347 C 171 0.173 209 0.217 D 146 0.148 56 0.058 Attendance Fulltime na na 885 0.920 Partime na na 77 0.080 Solo Taxonomy Score na na 934 0.971 No Score na na 28 0.029 Reading rm na na 405 0.434 rr na na 231 0.247 ru na na 239 0.256 rps na na 58 0.062 rea na na 1 0.001 Writing wm na na 493 0.528 wr na na 276 0.296 wu na na 141 0.151 wps na na 20 0.021 wea na na 4 0.004

Australasian Journal of Economics Education Vol.1 No. 2, September 2004
176
Pass Attendance AFM1B (>= 5) S2 na na 72 na AFM1A (>= 5) S2 na na 4 na AFM1A (>= 5) S1 na na 107 na QMB (>= 5) S2 na na 88 na QMA (>= 5) S2 na na 8 na QMA (>= 5) S1 na na 133 na
Note: The number of observations for 1996 is 987 and for 1998 is 962.
TABLE 3
SUMMARY STATISTICS FOR CONTINUOUS VARIABLES
Variable 1996 1998 Mean Standard
Deviation Mean Standard
Deviation Grades All courses 64.87 11.42 64.55 12.7 Six core courses 64.51 13.03 64.71 11.72 TER 92.59 7.1 93.04 14.87 SPQ sm Na na 23.72 4.04 dm Na na 23.86 4 ss Na na 21.9 3.76 ds Na na 24.31 3.8 sa Na na 45.62 6.77 da Na na 48.17 6.92
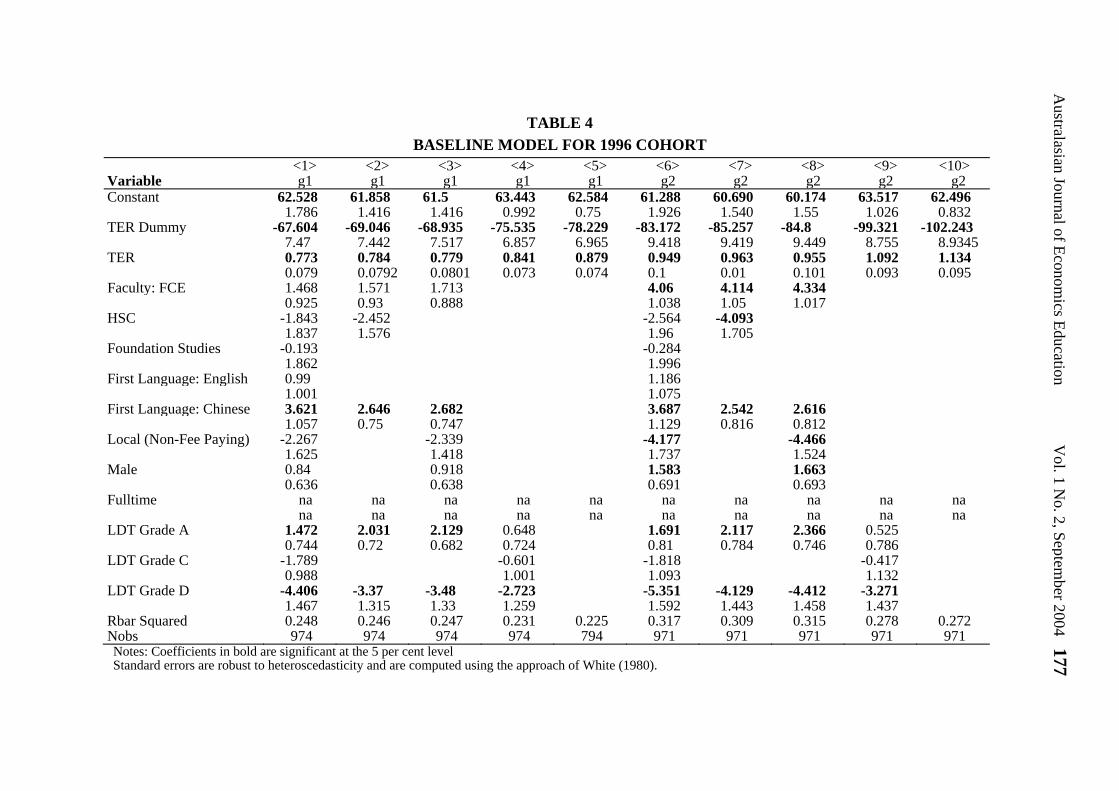
TABLE 4 BASELINE MODEL FOR 1996 COHORT
<1> <2> <3> <4> <5> <6> <7> <8> <9> <10>Variable g1 g1 g1 g1 g1 g2 g2 g2 g2 g2Constant 62.528 61.858 61.5 63.443 62.584 61.288 60.690 60.174 63.517 62.496 1.786 1.416 1.416 0.992 0.75 1.926 1.540 1.55 1.026 0.832TER Dummy -67.604 -69.046 -68.935 -75.535 -78.229 -83.172 -85.257 -84.8 -99.321 -102.243 7.47 7.442 7.517 6.857 6.965 9.418 9.419 9.449 8.755 8.9345TER 0.773 0.784 0.779 0.841 0.879 0.949 0.963 0.955 1.092 1.134 0.079 0.0792 0.0801 0.073 0.074 0.1 0.01 0.101 0.093 0.095Faculty: FCE 1.468 1.571 1.713 4.06 4.114 4.334 0.925 0.93 0.888 1.038 1.05 1.017HSC -1.843 -2.452 -2.564 -4.093 1.837 1.576 1.96 1.705Foundation Studies -0.193 -0.284 1.862 1.996First Language: English 0.99 1.186 1.001 1.075First Language: Chinese 3.621 2.646 2.682 3.687 2.542 2.616 1.057 0.75 0.747 1.129 0.816 0.812Local (Non-Fee Paying) -2.267 -2.339 -4.177 -4.466 1.625 1.418 1.737 1.524Male 0.84 0.918 1.583 1.663 0.636 0.638 0.691 0.693Fulltime na na na na na na na na na na na na na na na na na na na naLDT Grade A 1.472 2.031 2.129 0.648 1.691 2.117 2.366 0.525 0.744 0.72 0.682 0.724 0.81 0.784 0.746 0.786LDT Grade C -1.789 -0.601 -1.818 -0.417 0.988 1.001 1.093 1.132LDT Grade D -4.406 -3.37 -3.48 -2.723 -5.351 -4.129 -4.412 -3.271 1.467 1.315 1.33 1.259 1.592 1.443 1.458 1.437Rbar Squared 0.248 0.246 0.247 0.231 0.225 0.317 0.309 0.315 0.278 0.272 Nobs 974 974 974 974 794 971 971 971 971 971
Australasian Journal of Econom
ics Education V
ol. 1 No. 2, Septem
ber 2004 177Notes: Coefficients in bold are significant at the 5 per cent level Standard errors are robust to heteroscedasticity and are computed using the approach of White (1980).

Australasian Journal of Economics Education Vol.1 No. 2, September 2004 178
TABLE 5
BASELINE MODEL FOR 1998 COHORT <1> <2> <3> <4> <5> <6> Variable g1 g1 g1 g2 g2 g2 Constant 51.884 53.096 52.913 54.95 55.197 54.694 2.156 1.931 2.03 2.006 1.865 1.992 TER Dummy -17.792 -17.609 -21.253 -90.547 -90.716 -94.886 13.055 13.226 13.126 8.064 7.997 7.425 TER 0.229 0.231 0.24 1.031 1.031 1.034 0.141 0.143 0.142 0.079 0.079 0.079 Faculty: FCE 5.954 5.995 5.956 4.305 4.324 4.356 1.374 1.382 1.382 1.112 1.103 1.115 HSC -4.014 -3.27 -4.313 -4.444 2.768 2.657 3.013 2.873 Foundation Studies First Language: English 0.885 0.585 1.027 1.006 First Language: Chinese 3.071 2.398 2.414 3.501 3.115 3.155 0.963 0.742 0.74 0.986 0.771 0.769 Local (Non-Fee Paying) 7.365 7.107 7.093 5.83 5.767 5.73 1.514 1.518 1.537 1.589 1.59 1.615 Male -0.363 -0.386 -0.035 -0.08 0.675 0.674 0.679 0.676 Fulltime 1.046 -0.537 1.21 1.364 LDT Grade A 1.195 0.08 0.897 0.847 LDT Grade C -2.44 -3.186 -3.131 -2.272 -2.269 -2.168 0.945 0.895 0.901 1.003 0.947 0.956 LDT Grade D -6.496 -7.311 -7.114 -6.831 -6.83 -6.508 1.444 1.413 1.423 1.8 1.802 1.792 Rbar Squared 0.177 0.177 0.174 0.334 0.337 0.333 Nobs 962 962 962 953 953 953 Notes: Coefficients in bold are significant at the 5 per cent level. Standard errors are robust to heteroscedasticity and are computed using the approach of White (1980).
Australasian Journal of Economics Education Vol. 1 No. 2, March 2005 179
TABLE 6
EFFECT OF SOLO TAXONOMY <1> <2> <3> <4> <5> <6>Variable g1 g1 g1 g2 g2 g2Constant 64.772 64.172 52.809 64.639 64.639 54.866 1.822 1.882 2.621 1.855 1.855 2.6 SOLO -5.305 -4.865 -3.419 -7.860 -7.01 -4.552 3.202 2.332 2.189 3.763 2.462 2.225WM 5.746 7.667 2.68 3.329 WR 7.804 9.651 2.733 3.366 WU 3.455 5.734 2.819 3.467 RM 6.407 4.397 7.967 5.34 1.558 1.59 1.735 1.639RR 7.197 4.803 9.027 5.769 1.662 1.701 1.815 1.702RU 3.377 2.017 5.065 3.409 1.642 1.634 1.822 1.693TER Dummy -20.929 -93.484 12.922 7.325TER 0.233 1.015 0.14 0.078Faculty: FCE 5.972 4.37 1.372 1.105HSC Foundation Studies First Language: English First Language: Chinese 2.426 3.164 0.729 1.752Local (Non-Fee Paying) 6.9 5.542 1.549 1.624Male Fulltime LDT Grade A LDT Grade C -2.656 -1.772 0.876 0.932LDT Grade D -6.497 -5.793 1.419 1.759Rbar Squared 0.016 0.025 0.186 0.015 0.029 0.344Nobs 962 962 962 953 953 953
Notes: See Table 5.

Australasian Journal of Economics Education Vol.1 No. 2, September 2004 180
TABLE 7
EFFECT OF PASS ON ACADEMIC PERFORMANCE <1> <2> <3> <4> <5> <6> <7> <8> <9> <10> Variable g1 g1 g1 g1 g1 g2 g2 g2 g2 g2 Constant 63.489 53.31 53.083 53.544 53.372 63.2 55.791 55.642 55.749 55.55 0.43 1.944 2.536 2.514 2.537 0.467 1.857 2.496 2.49 2.513 SOLO -2.919 -3.078 -3.034 -4.038 -4.186 -4.143 2.01 2.089 2.122 2.155 2.144 2.173 RM 4.103 4.194 4.254 5.086 5.125 5.192 1.569 1.556 1.562 1.606 1.6 1.61 RR 4.617 4.723 4.701 5.619 5.69 5.671 1.683 1.658 1.663 1.67 1.659 1.667 RU 1.881 1.964 1.965 3.337 3.37 3.372 1.607 1.598 1.607 1.662 1.658 1.669 TER Dummy
-21.031 -20.745 -17.158 -17.204 -90.328 -88.89 -89.022 -88.975
13 12.823 13.001 12.97 7.915 7.815 7.804 7.801 TER Score 0.236 0.23 0.223 0.223 1.025 1.007 1.009 1.008 0.141 0.139 0.14 0.14 0.078 0.077 0.077 0.077 Faculty: FCE
5.221 5.217 5.204 5.289 3.513 3.546 3.572 3.685
1.382 1.374 1.375 1.37 1.119 1.116 1.11 1.112 HSC -3.359 -3.293 -4.434 -4.502 -4.522 -4.444 2.602 2.585 2.841 2.815 2.816 2.799 First Language: Chinese
2.353 2.346 2.349 2.266 3.073 3.078 3.082 2.997
0.734 0.72 0.719 0.721 0.759 0.742 0.742 0.745 Local (Non-Fee Paying)
6.272 6.127 6.210 6.188 4.967 4.798 4.81 4.812
1.539 1.544 1.52 1.521 1.59 1.596 1.596 1.6 LDT Grade C
-3.307 -2.86 -2.948 -2.912 -2.488 -2.099 -2.102 -2.064
0.875 0.851 0.849 0.856 0.918 0.903 0.906 0.913 LDT Grade D
-7.355 -6.757 -6.958 -6.703 -7.036 -6.347 -6.405 -6.137
1.357 1.355 1.353 1.358 1.743 1.711 1.11 1.724 Pass D1 3.727 3.421 3.17 3.899 3.182 2.904 1.066 0.966 0.953 0.467 1.039 1.022 Pass D3 2.535 1.975 2.068 2.586 1.174 1.318 0.997 0.907 0.889 1.107 0.914 0.895 Pass D4 2.299 1.732 1.927 2.715 2.085 2.305 1.014 0.942 0.949 1.112 0.992 1.001 Pass D6 3.268 2.301 2.103 3.714 2.965 2.722 0.959 0.902 0.899 1.062 0.896 0.898 Pass D7 2.099 2.161 0.286 0.282 Pass D8 4.018 4.056 0.65 0.669 Rbar Squared
0.046 0.202 0.211 0.212 0.207 0.048 0.361 0.371 0.37 0.364
Nobs 962 962 962 962 962 953 953 953 953 953 Notes: See Table 6.

Australasian Journal of Economics Education Vol. 1 No. 2, March 2005 181
TABLE 8
TEST FOR SAMPLE SELECTION BIAS <1> <2> <3> <4> <5> Variable D8 g1 g1 g2 g2 Constant -2.87 53.372 -32.033 55.55 104.77 0.395 2.537 98.239 2.513 108.807 SOLO -0.400 -3.034 -13.203 -4.143 1.695 0.317 2.122 11.983 2.173 13.108 RM 0.250 4.254 10.734 5.192 1.456 0.220 1.562 7.7 1.61 8.509 RR 0.218 4.701 10.357 5.671 2.412 0.231 1.663 6.867 1.667 7.564 RU 0.179 1.965 6.705 3.372 0.644 0.227 1.607 5.764 1.669 6.375 TER Dummy -0.031 -17.204 -18.226 -88.975 -88.701 0.586 12.97 12.6 7.801 7.808 TER Score 0.001 0.223 0.282 1.008 0.977 0.005 0.14 0.136 0.077 0.097 Faculty: FCE 0.757 5.289 25.285 3.685 -7.858 0.159 1.37 23.082 1.112 25.378 HSC -0.109 -3.293 -6.044 -4.444 -2.871 0.278 2.585 3.996 2.799 4.493 First Language: Chinese 0.098 2.266 4.705 2.997 1.595 0.1 0.721 2.853 0.745 3.134 Local (Non-Fee Paying) 1.102 6.188 33.733 4.812 -11.05 0.271 1.521 31.884 1.6 35.237 LDT Grade C 0.167 -2.912 1.268 -2.064 -4.462 0.123 0.856 4.749 0.913 5.249 LDT Grade D 0.016 -6.703 -6.241 -6.137 -6.399 0.215 1.358 1.484 1.724 1.841 Pass D8 4.018 3.981 4.056 4.075 0.65 0.647 0.669 0.669 Selectivity Correction 23.729 -8.85 37.556 41.655 Rbar Squared na 0.207 0.207 0.364 364 Nobs 967 962 962 953 953
Notes: Coefficients in bold are significant at the 5 per cent level. Model <1> is a probit model that is estimated by maximum likelihood.
Australasian Journal of Economics Education Vol.1 No. 2, September 2004
182
REFERENCES
Biggs, John (1988), ‘Approaches to Learning and to Essay Writing’, in Ronald Schmeck (ed.), Learning Strategies and Learning Styles, New York: Plenum Press.
Biggs, John (1987), Student’s Approaches to Learning and Studying, Melbourne: Australian Council for Educational Research.
Brabazon, Tara (2002), Digital Hemlock: Internet Education and the Poisoning of Teaching, Sydney: University of NSW Press.
Hamilton, Susan et al. (1994), Final Report: Supplemental Instruction at the University of Queensland, A Pilot Program, Brisbane.
Heckman James (1976), ‘The common structure of statistical models of truncation, sample selection and limited dependent variables and a simple estimator for such model’, Annals of Economic and Social Measurement, 5, pp. 475-92.
Lewis, Don, Martin O’Brien, Sally Rogan and Brett Shorten (2004), ‘Do Students Benefit from Supplemental Instruction? Evidence from a First Year Statistics Subject for Commerce Students’. Paper presented at the Economics Education Conference, Adelaide, 13-16 July.
Marginson, Simon (1997), Markets in Education, St. Leonards: Allen and Unwin.
Marginson, Simon and Mark Considine (2000), The Enterprise University, Cambridge: Cambridge University Press.
Martin, Deanna (1995), The Supplemental Instruction Program, Kansas City: University of Missouri.
McKinnon, James and Russell Davidson (1993), Estimation and Inference in Econometrics, New York: Oxford University Press.
Mirowski, Philip and Esther-Mirijam Sent (eds) (2002), Science Bought and Sold, Chicago: University of Chicago Press.
Murphy, Eamon (1998), Lecturing at University, Bentley: ParadigmBooks. Otto, Glenn, Hazel Bateman and Patrick Lim (2003), Profitable
Neighbours Revisited: The Economic Impact of the University of New South Wales on the Randwick Municipality in 2002-2003 December.
White, Halbert (1980), ‘A heteroskedasticity-consistent covariance matrix estimator and a direct test for heteroskedasticity,’ Econometrica, Vol. 48, No. 44, pp. 817-838.