Innovative and Emerging Models of Chronic Disease Prevention · Innovative and Emerging Models of...
43
Innovative and Emerging Models of Chronic Disease Prevention A Public Health Perspective Monday, April 25, 2016 Tony Kuo, MD, MSHS Acting Director Division of Chronic Disease and Injury Prevention Los Angeles County Department of Public Health
-
Upload
nguyenkhuong -
Category
Documents
-
view
223 -
download
4
Transcript of Innovative and Emerging Models of Chronic Disease Prevention · Innovative and Emerging Models of...

Innovative and Emerging Models ofChronic Disease PreventionA Public Health Perspective
Monday, April 25, 2016
Tony Kuo, MD, MSHS
Acting Director
Division of Chronic Disease and Injury Prevention
Los Angeles County Department of Public Health

Overview
• Burden of chronic disease/conditions (e.g., hypertension, prediabetes, diabetes, obesity, others)
• Approach to addressing this burden from a public health perspective
• Federal and local initiatives aligned with these emerging models and efforts
• Examples:
i. Active Transportation
ii. National Diabetes Prevention Program
iii. CTSI’s Healthy Aging Initiative

Los Angeles County
The Landscape
• 4,000 square miles
• 10 million residents• 24% obese adults• 23% obese children• varies widely by region
• 88 cities
• 80 schools districts + LACOE
• Opportunity for broad reach

Burden of Chronic Diseases

Age-adjusted rate/100,000
Cause of Death 2001 2010 % Change
Coronary heart disease 220 138 -37%
Stroke 56 36 -36%
Lung cancer 42 33 -21%
Emphysema 36 30 -17%
Alzheimer’s disease 12 25 108%
Pneumonia & influenza 32 22 -31%
Diabetes 24 21 -13%
Colorectal cancer 18 14 -22%
Chronic liver disease 12 12 0%
Breast cancer (female) 24 21 -13%
Source: Office of Health Assessment and Epidemiology, Los Angeles County Department
of Public Health
Trends in the Leading Causes of Death Los Angeles County, 2001-2010
Los Angeles County Department of Public Health, Office of Health Assessment & Epidemiology

Leading Causes of Death by Race/Ethnicity, Los Angeles County, 2010
Los Angeles County Department of Public Health, Office of Health Assessment & Epidemiology; August 2013 *Total includes persons of other or unknown race/ethnicity.
Race/ethnicity
Number of deaths
Age-adjusted death rate#1 cause #2 cause #3 cause #4 cause #5 cause
White
28,738
667 per 100,000
Coronary heart
disease
6,845
151 per 100,000
Emphysema/COPD
1,743
40 per 100,000
Lung cancer
1,655
40 per 100,000
Stroke
1,534
34 per 100,000
Alzheimer’s disease
1,509
31 per 100,000
Hispanic
13,751
529 per 100,000
Coronary heart
disease
2,555
111 per 100,000
Stroke
780
34 per 100,000
Diabetes
690
29 per 100,000
Liver disease
587
18 per 100,000
Lung cancer
441
18 per 100,000
Black
7,438
891 per 100,000
Coronary heart
disease
1,721
208 per 100,000
Stroke
446
54 per 100,000
Lung cancer
433
51 per 100,000
Diabetes
294
35 per 100,000
Emphysema/
COPD
289
35 per 100,000
Asian/Pacific Islander
6,343
429 per 100,000
Coronary heart
disease
1,451
98 per 100,000
Stroke
501
34 per 100,000
Lung cancer
400
26 per 100,000
Pneumonia/
Influenza
296
21 per 100,000
Diabetes
237
16 per 100,000
Los Angeles County Total*
56,538
615 per 100,000
Coronary heart
disease
12,635
138 per 100,000
Stroke
3,278
36 per 100,000
Lung cancer
2,941
33 per 100,000
Emphysema/COPD
2,622
30 per 100,000
Alzheimer’s disease
2,242
25 per 100,000

4.5%10.0%
22.9%
36.8%
57.7%
0%
20%
40%
60%
80%
100%
18-29 30-39 40-49 50-64 65+
Pe
rce
nta
ge
Age Group (years)
Percent of Adults Diagnosed with Hypertension by Age Group, Los Angeles County, 2011
Source: Los Angeles County Health Survey, 2011

Potential Decrease in Cases of Hypertension and Annual Savings in Hypertension Treatment Costs from Reducing Sodium Consumption in LA County
Scenario:
Percent
Reduction in
Population
Sodium Intake
Average
Systolic Blood
Pressure
Reduction
(mm Hg)
Percent
Decrease in
the Frequency
of
Hypertension
Decrease in
the Number
Cases of
Hypertension
Potential
Annual Cost
Savings [in
2014 dollars)]
($)
10% (344 mg) 0.71 1.7% 31,953 69.5 million
20% (687 mg) 1.41 2.8% 52,629 114.3 million
30% (1,031 mg) 2.11 4.2% 78,944 171.5 million
40% (1,374 mg) 2.82 5.3% 99,619 216.3 million
50% (1,718 mg) 3.52 6.8% 127,814 276.9 million
Annual cost savings numbers have been updated. Original table sourced from: Division of Chronic Disease and Injury Prevention. (2010) The Potential Health Impact
of Reducing Excess Sodium Consumption in Los Angeles County. Los Angeles, CA: Los Angeles County Department of Public Health.

0
5
10
15
20
25
0
1
2
3
4
5
6
7
8
1958 61 64 67 70 73 76 79 82 85 88 91 94 97 00 03 06 09
Num
ber
with D
iabete
s (
Mill
ions)
Perc
enta
ge w
ith D
iabete
s
Year
Percentage with Diabetes Number with Diabetes
Number and Percentage of U.S. Population with Diagnosed Diabetes,
1958-2009
Source: CDC’s Division of Diabetes Translation. National Diabetes Surveillance System 8
9
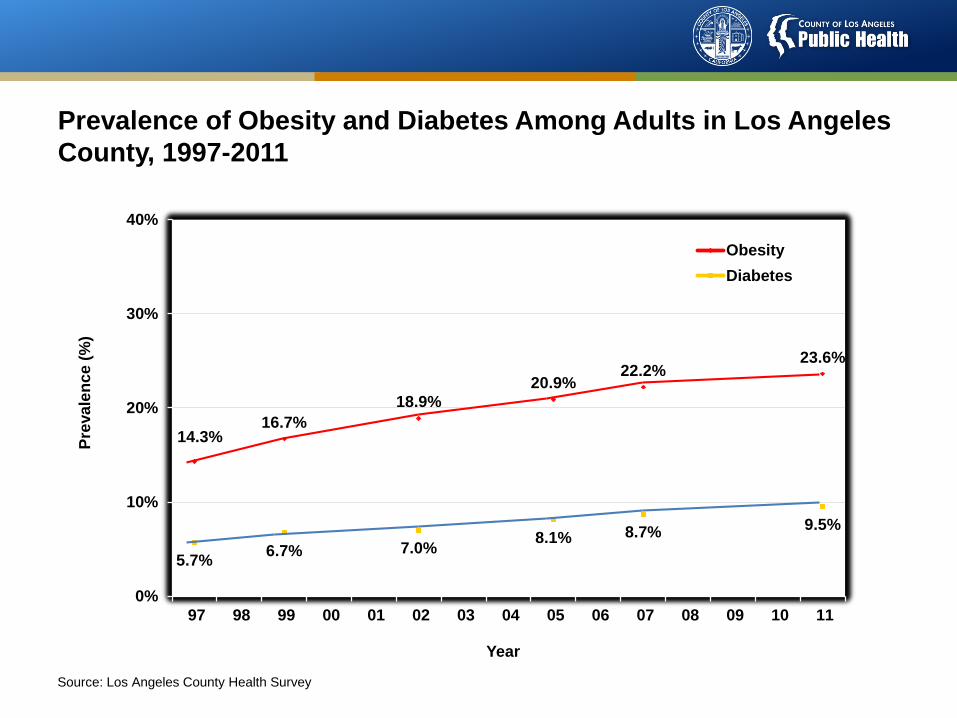
Prevalence of Obesity and Diabetes Among Adults in Los Angeles
County, 1997-2011
14.3%16.7%
18.9%
20.9%22.2%
23.6%
5.7%6.7% 7.0%
8.1% 8.7%9.5%
0%
10%
20%
30%
40%
97 98 99 00 01 02 03 04 05 06 07 08 09 10 11
Pre
va
len
ce
(%
)
Year
Obesity
Diabetes
Source: Los Angeles County Health Survey

10
Combined Treatment Expenditures and Lost Productivity (in billions), by Chronic Disease, U.S.
Chronic Disease Treatment Productivity Costs
Expenditure Losses
_______________________________________________________________
Cancers $48 $271 $319
Diabetes $27 $105 $132
Heart disease $65 $105 $170
Hypertension $33 $280 $313
Mental disorders $46 $171 $217
Pulmonary conditions $45 $94 $139
Stroke $14 $22 $36
_______________________________________________________________Source: MEPS, National Health Care Expenses in the U.S. Civilian Noninstitutionalized Population, 2003. November 2005.
Source: Milken Institue, American Diabetes Association, CDC.
11
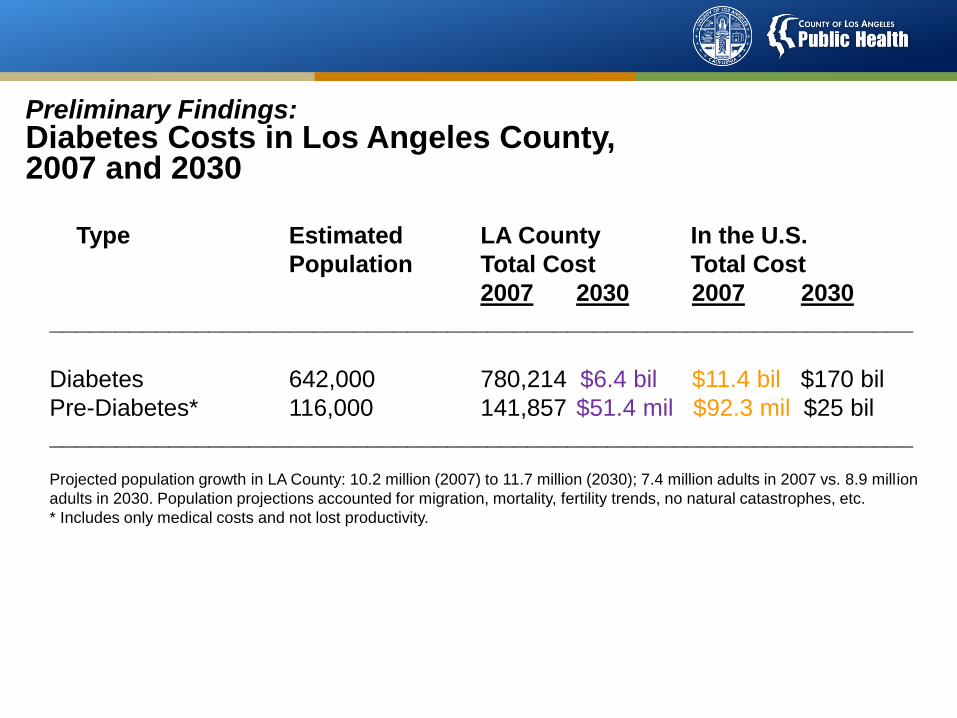
Preliminary Findings: Diabetes Costs in Los Angeles County, 2007 and 2030
Type Estimated LA County In the U.S.
Population Total Cost Total Cost
2007 2030 2007 2030
_________________________________________________________________
Diabetes 642,000 780,214 $6.4 bil $11.4 bil $170 bil
Pre-Diabetes* 116,000 141,857 $51.4 mil $92.3 mil $25 bil
_________________________________________________________________
Projected population growth in LA County: 10.2 million (2007) to 11.7 million (2030); 7.4 million adults in 2007 vs. 8.9 million
adults in 2030. Population projections accounted for migration, mortality, fertility trends, no natural catastrophes, etc.
* Includes only medical costs and not lost productivity.
Source: Los Angeles County DPH; Multiple data sources used including data from Calif.
Dept of Finance and CHIS.
12

Impact of Alzheimer’s Disease
• Healthcare costs – medical care; hospitalizations; skilled nursing; home care; long term care costs often lead to depletion of patient’s personal savings and assets
• Personal costs – disease progression with memory loss, wandering, behavioral problems, injuries, depression
• Caregiving – caregiver stress, caregiver illness, paid and unpaid costs of caregiving
• Costs to businesses – absenteeism due to caregiving, etc.

Public Health Framework forChronic Disease Prevention in Los Angeles
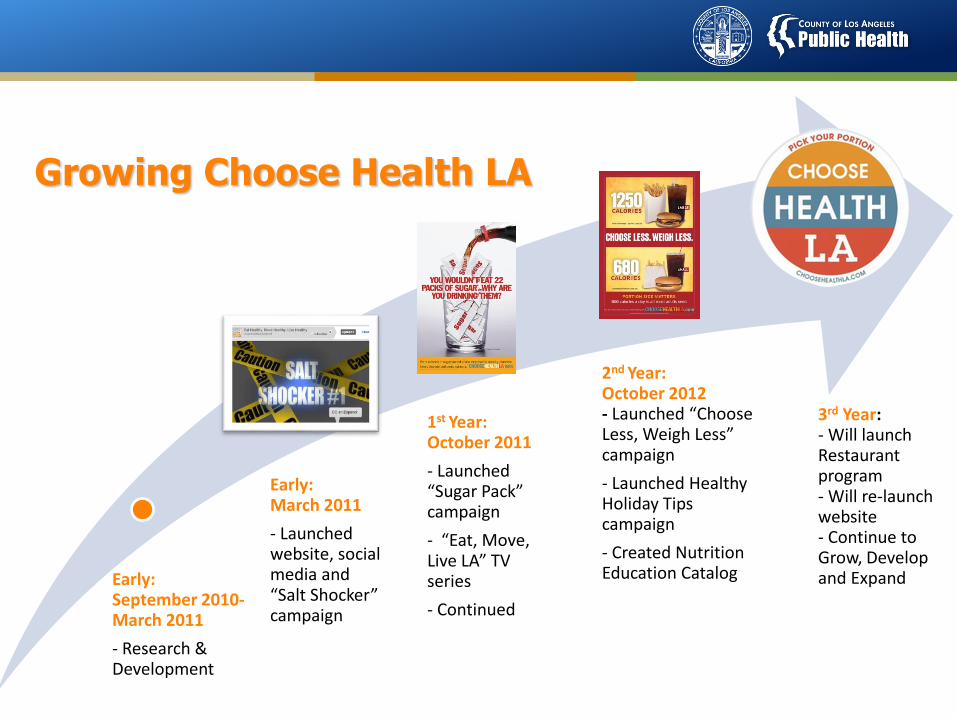
Growing Choose Health LA
Early: September 2010-March 2011
- Research & Development
Early: March 2011
- Launched website, social media and “Salt Shocker” campaign
1st Year: October 2011
- Launched “Sugar Pack” campaign
- “Eat, Move, Live LA” TV series
- Continued growing social media
2nd Year: October 2012- Launched “Choose Less, Weigh Less” campaign
- Launched Healthy Holiday Tips campaign
- Created Nutrition Education Catalog
3rd Year: - Will launch Restaurant program- Will re-launch website- Continue to Grow, Develop and Expand

Health Factors
Health
Outcomes
Programs and
Policies
Mortality (50%)
Morbidity (50%)
Physical environment
(10%)
Social & economic
factors (40%)
Health behaviors
(30%)
Clinical care
(20%)
Unsafe sex
Alcohol use
Diet & exercise
Tobacco use
Access to care
Quality of care
Community safety
Education
Family & social support
Employment
Income
Built environment
Environmental quality
County Health Rankings model © 2010 UWPHI 16
All Determinants of Health
Matters

Reducing the risk of
diabetes and metabolic syndrome
Regular physical activity
Healthy diet
Blood pressure control
Access to lifestyle change programs and community resources (e.g.,
National Diabetes Prevention Program)
Regular doctor visits and age appropriate preventive screenings
Community opportunities for physical activity
Health consumer information and protection (e.g., self-
management resources, home BP monitoring)
Community Resource Database, 211 LA
County
Social support groups and
services
Local farmer’s
Markets, purchasing cooperatives
Workplace wellness programs
Menu labeling, behavioral economicsSmoking cessation
programs
Increase green space and walkability
Depression screening and
treatment
Alcohol and drug abuse detection
and brief intervention
NDPP Providers
Community screening and MTM programs
Activetransportation
Safer and more walkable
communities
Healthiy Food Environments

Framework for Action: General Model of Health & Improvement Strategies
Fielding J, Teutsch S. An Opportunity Map for Societal Investment in Health. JAMA, 2011, Vol 305, No 20, 2110-2111.

Federal and Local Initiatives
20

21
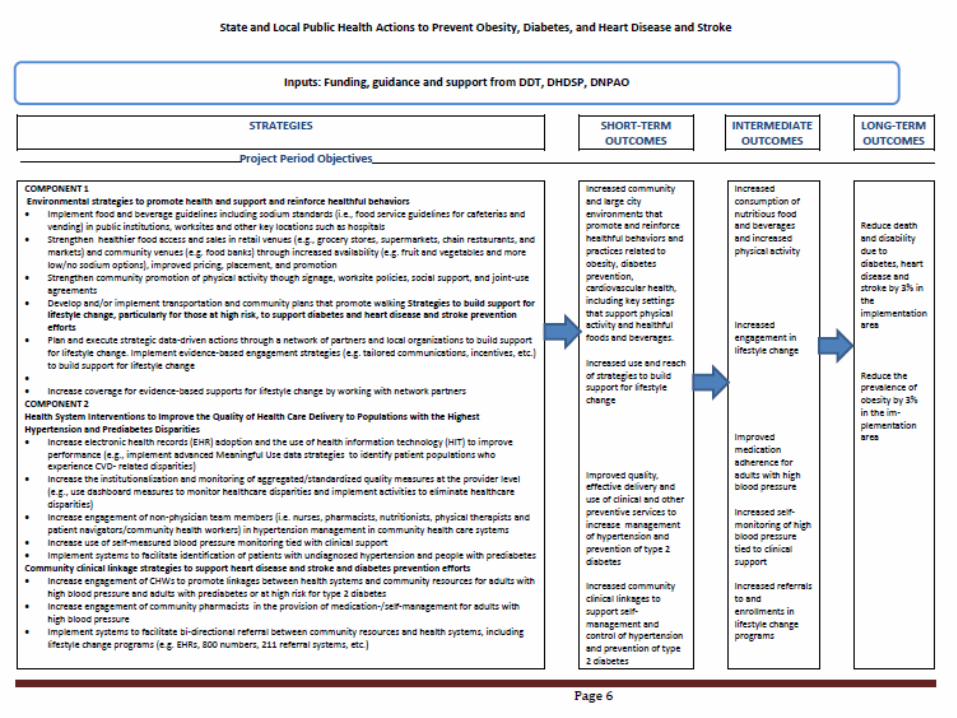
Chronic Disease Prevention Strategy in Los Angeles (1422)

Chronic Disease Prevention Strategy (1422)
• A four year initiative to implement community and health system strategies to prevent and control chronic conditions such as hypertension and diabetes.
• Programs include:• Shared use agreement between schools and communities
• Increasing health food options
• Community plans to promote active transportation
• Health system strategies – EHRs, meaningful use of electronic data, CHWs/Health Navigators, Pharmacist Strategies, community-clinical linkages, team-based care

Key Strategies and Programs – Early Stages
• Office of Women’s Health Appointment and Referral Hotline
• The Wellness Center
• National Diabetes Prevention Program
• Undiagnosed or undertreated hypertension
• Choose Health LA Restaurants
• Promoting Healthier Food & Beverages

Active Transportation – local efforts through multi-sector partnerships
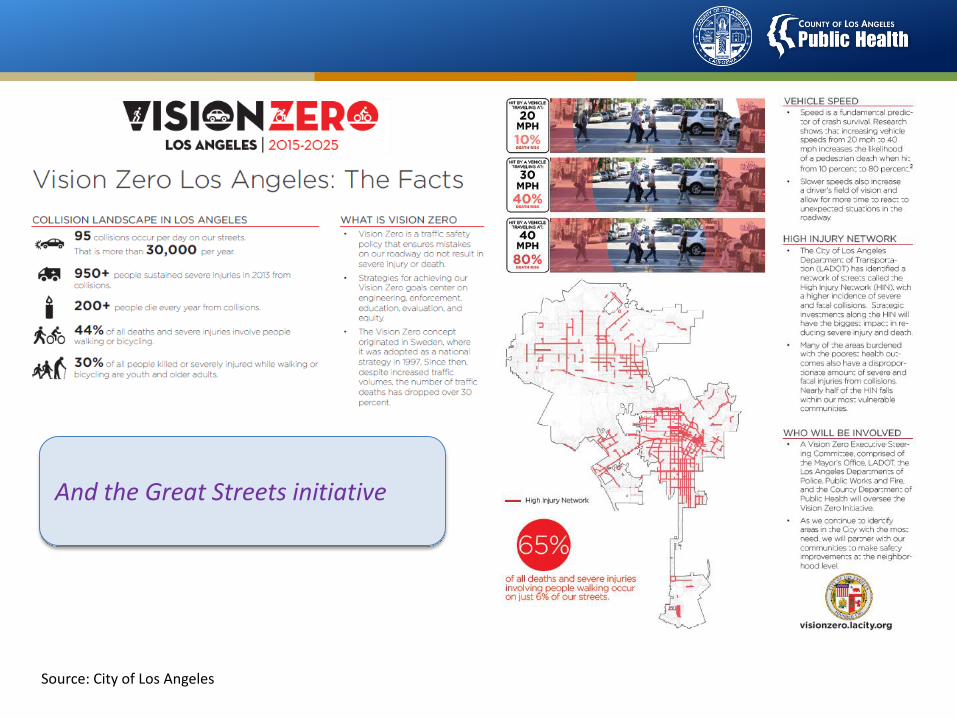
Source: City of Los Angeles
And the Great Streets initiative

County Healthy Design Workgroup
2012 – BOS mandated interdepartmental task force to increase physical activity and improve health through planning, designing and building healthier environments
Courtesy of the PLACE Program
Develop and structure cross-sector relationships
Public Health
Parks Fire Public Works
Regional Planning
Arts Commission
Internal Services

Scale and Spread of Evidence-Based Programming (e.g., the National
Diabetes Prevention Program)

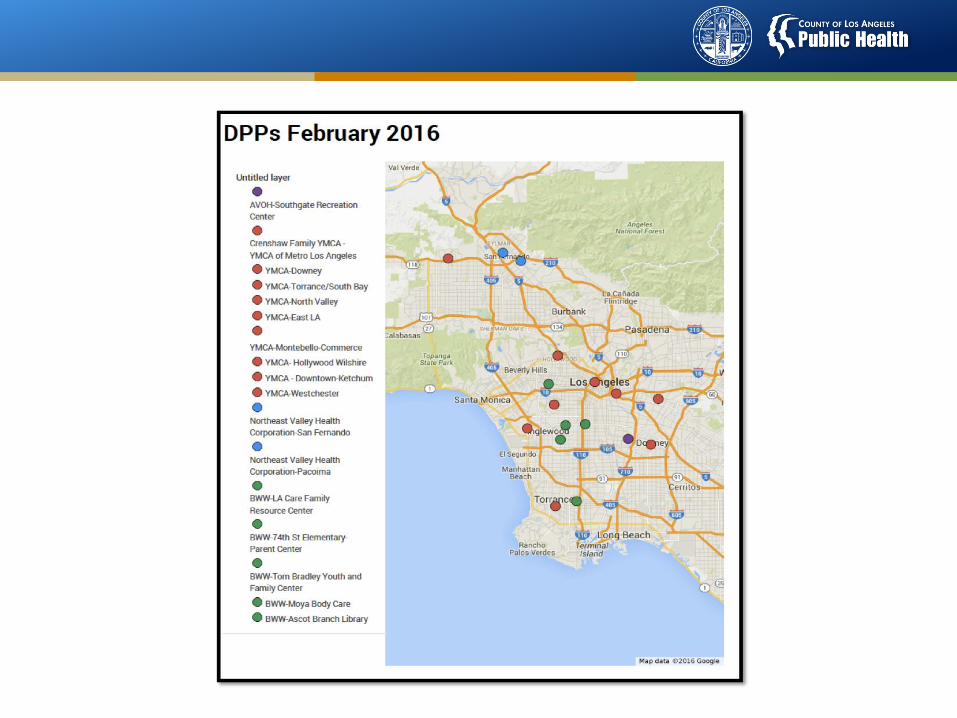
The National Diabetes Prevention Program:Landscape in Los Angeles
• Group-based medical model
• Community-based model
• Employer-based model
• Internet-based model

Los Angeles County Department of Public Health Partners working to scale the National Diabetes
Prevention Program in Los Angeles
• YMCA
• Black Women for Wellness (BWW)
• AltaMed Health Services Corporation
• Northeast Valley Health Corporation
• Los Angeles Department of Health Services (DHS)
• The LAC+USC Wellness Center at the Historic General Hospital in Boyle Heights

Community Advisory Board
• Coalition formed in 2014 to help scale the National Diabetes Prevention Program in Los Angeles
• Coalition Mission
– To scale the NDPP in Los Angeles
– To build the case for coverage of NDPP in Los Angeles and nationally
– To convene local stakeholders to educate community and providers about NDPP
• Member Groups
– Health Systems
– Community-based organizations
– Academic Partners
– Health sector practitioners (i.e. health educators, social workers)
What Health Systems and the Provider Community Can Do to Aid Diabetes Prevention Efforts
• Champion or integrate practice protocols or reminder systems in the clinical setting to help refer patients to quality NDPP in the community
• Establish peer workgroups/expert panels in the parent health system to tailor best or expected practices for managing prediabetes in particular or across the system’s hospitals, ED, clinics/health centers, etc.
• Make framework for diabetes prevention as part of the continuum in diabetes care (prevention to management, not siloed programming)
• Develop team care approaches that can be used for diabetes prevention
• QA/QI for referral or bi-directional referral processes

CTSI Healthy Aging Initiative

UCLA & SC CTSI

UCLA & SC CTSI

UCLA & SC CTSI
UCLA-USC Healthy Aging ProjectsInvestigators Project Title
Maria P. Aranda (PI),Fuentes, Mack, Kuo, Villa,Childs-Seagle
Steven P. Wallace (PI),Kietzman, Duru, Vaccaro
William Vega (PI), Lloyd,Kuo, Wu, Shapiro
Catherine Sarkisian (PI),Trejo, Simmons, Kuo
Arleen Brown (PI), Seeman, Ward, Kuo, Simmons
Bringing Evidence-based Programs to Historically Underrepresented Older Minorities
Healthy Aging Partnerships in Prevention Initiative (HAPPI)
The Los Angeles Healthy Aging Indicator Project
Measuring Feasibility of a Community-based “Wellness Pathway” Model
Evidence-based Healthy Aging Programs in High-Risk Communities in LA County

UCLA & SC CTSI
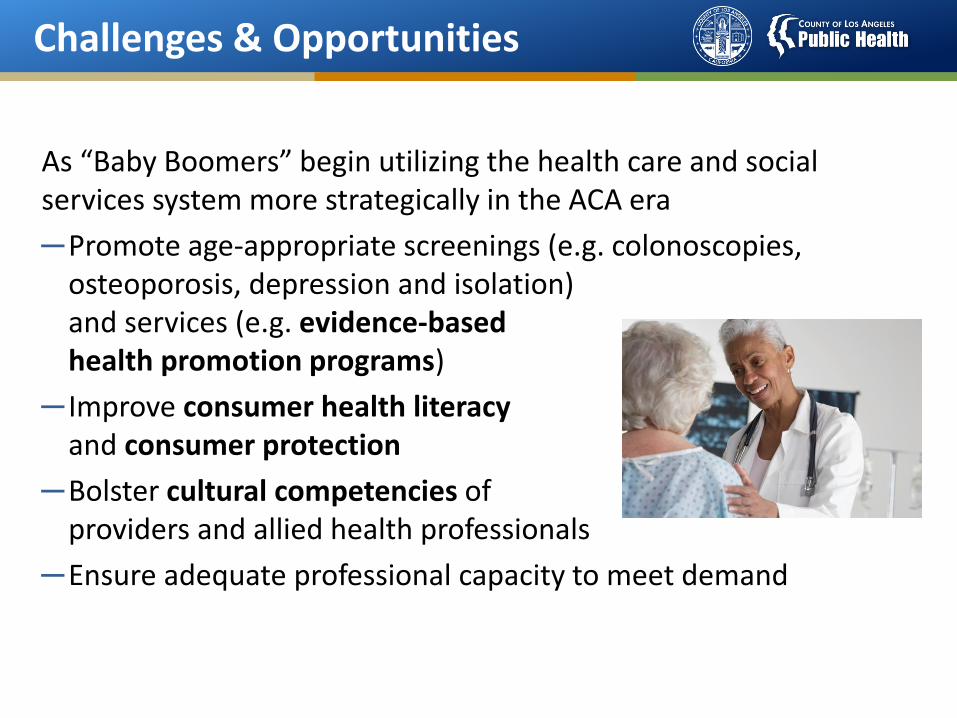
Challenges & Opportunities
As “Baby Boomers” begin utilizing the health care and social services system more strategically in the ACA era
─Promote age-appropriate screenings (e.g. colonoscopies, osteoporosis, depression and isolation) and services (e.g. evidence-based health promotion programs)
─ Improve consumer health literacy and consumer protection
─Bolster cultural competencies of providers and allied health professionals
─Ensure adequate professional capacity to meet demand
Challenges and Opportunities

Public Health’s Challenges & Opportunities
To impact health outcomes in the right direction…
─Strengthen programs, services and policies that prevent chronic disease, to go beyond just co-location but community investments and development (by design);
─Prioritize vulnerable populations – contribute to the evidence base;
─Strive for safe and healthy communities;
─Encourage social cohesion and engagement;
─Advocate for improvements to public education, public housing, job training and job creation – social services needs are relevant across all groups (economic insecurity, food insecurity, housing, etc.)

Boyle Heights Workgroup

Los Angeles Geo Hub, including Vision Zero and other
initiatives
http://geohub.lacity.gov
Public education resources
www.choosehealthla.com
Division of Chronic Disease and Injury Prevention
http://publichealth.lacounty.gov/chronic/
Q&A and Resources