
Assessment of emerging innovative energy efficiency technologies
198
02/06/2005 Assessment of Emerging Innovative Energy Efficient Technologies as part of the Energy Efficiency Innovation Review APPENDIX Prepared for Defra by Future Energy Solutions
Transcript of Assessment of emerging innovative energy efficiency technologies

02/06/2005
Assessment of Emerging Innovative Energy Efficient Technologies as part of the
Energy Efficiency Innovation Review
APPENDIX
Prepared for Defra by Future Energy Solutions

2
Title Assessment of Emerging Innovative Energy Efficient
Technologies as part of the Energy Efficiency Innovation Review - Appendix
Customer Defra Customer reference
Completion of an Energy Efficiency Technology Assessment as Part of the Energy Efficiency Innovation Review
Confidentiality, copyright and reproduction
Copyright AEA Technology plc 2005 Distributed only on the basis of strict confidentiality. Confidentiality to be maintained. Enquiries about copyright and reproduction should be addressed to the Commercial Manager, AEA Technology plc.
File reference ED05085 Report number AEAT/ENV/R/2001 Report status FINAL VERSION Future Energy Solutions
AEA Technology Harwell Didcot Oxfordshire OX11 0QJ Telephone 0870 190 6114 Facsimile 0870 190 6329
AEA Technology is the trading name of AEA Technology plc AEA Technology is certificated to BS EN ISO9001:(1994)
Name Signature Date Author Christine St John Cox
2 June 05
Reviewed by John Huddleston 2 June 05 Approved by John Huddleston 2 June 05

3
Assessment of Emerging Innovative Energy Efficient
Technologies as part of the Energy Efficiency Innovation Review
Appendices
Appendix A Initial Screening Methodology and Results 4
Initial Screening Methodology 4 Initial Screening of Technologies Score Table 6
Appendix B Technology Assessments 18
Radical boiler re-design to exploit advanced burner designs 22 Home appliance networking 30 Organic light emitting diode screens 41 Low-cost, adaptive and robust model-based boiler monitoring and control systems 50 Micro CHP 56 Insulation application techniques for raised timber floors 64 Integrated window design 71 Novel approach to steam boiler system design 77 Low-cost, intelligent monitoring of steam systems 84 Solar thermal air-conditioning 93 Alternative light technologies - solid-state lighting – LEDs 98 Advanced process plant design 105 Intelligent agent-based optimisers for industrial production management and scheduling systems, and advanced process monitoring and control systems 112 Decarbonisation/dematerialisation 119 Demand controlled ventilation systems 126 Innovative insulation materials - vacuum insulated panels 131 Controls – advanced Building Management Systems 139 Holistic optimum design 145 More energy efficient separation processes 155 Second-stage waste heat recovery from high-temperature processes 162 Light-weighting and materials substitution 171 Innovative approaches to enhance recovery and use of waste heat from steam condensate and hot flue gases from boilers 179 Innovative Glazing 187
Appendix C Description of spreadsheet files and analysis 195

4
Appendix A Initial Screening Methodology and Results This appendix contains a copy of the initial scoring methodology template used and the full list of technologies assessed. Note the scores used in this first assessment were subsequently reviewed and may not match those for the technologies in Appendix B Initial Screening Methodology Technology UK Benefit Questions 1) Economic Benefit What is the scope for the development of this technology in the UK to contribute to the UK low carbon technology industry / knowledge base? In answering this question please try and indicate: • Status of existing players in the UK and their context in wider global markets • Status of development of the technology • Key development needs and likely paths to market • Match of development needs / paths with skills and resources in the UK • Magnitude / significance of potential outcomes (try and quantify the size of
business in jobs, turnover or other equivalent measure) Score Indicator
7 All factors suggest potential for >20,000 jobs or £2bn turnover in UK readily achievable
6 Most factors suggest potential for >10,000 jobs or £1bn turnover in UKachievable
5 Many factors suggest potential for >5,000 jobs or £0.5bn turnover in UK achievable
4 Some factors suggest potential for >2,500 jobs or £0.25bn turnover inUK achievable
3 Some factors suggest potential for >1,000 jobs or £0.1bn turnover in UK achievable
2 Some scope for UK businesses (maybe as niche players) 1 Little potential for UK businesses
2) Scope for Government action Could Government funding make a difference to progress of the technology • What are the key development needs? • What research/development is being done already and by whom? • Taking into account the current players and the scale of the financial
investments required, can the level of funding make a difference to the progress of the technology?

5
Score Indicator 6 The critical gaps in the innovation chain are all addressable, and
there are no other significant players, so funding expected to be highly material
5 The critical gaps in the innovation chain are mainly addressable, but there are some other players that will reduce materiality
4 Most of the critical gaps in the innovation chain are addressable, but there are other big players that will significantly reduce the level of materiality
3 Some of the critical gaps in the innovation chain are addressable, and there are other big players that will significantly reduce the level of materiality
2 Few of the critical gaps in the innovation chain are addressable, and there are other big players that will significantly reduce the level of materiality
1 The critical gaps are not addressable and there are significant other players that will reduce the level of materiality
3) Market Entry Are there barriers in the path to market and if so what is the potential for Government to help address these barriers? (This is complementary to q1 and is looking more at the non-technical barriers to deployment.) • What are the key barriers in the path to market? • Which of these could funding address? • If these barriers were addressed would this be sufficient to accelerate or scale
up deployment of the technology? • Could an influence over the market conditions e.g. institutional or infrastructure
for the technology enable it to make progress? Score Indicator
6 Strong influence on market conditions, significant potential impact on reducing barriers
5 Significant influence on market conditions, or potential impact on reducing barriers
4 Moderate influence on market conditions, or potential impact on reducing barriers
3 Some influence on market conditions, some potential impact on reducing barriers
2 Little influence on market conditions, little potential impact on reducing barriers
1 No influence on market conditions, no potential impact on reducing barriers
4) Risks What are the risks which might arise when investing in this technology? In answering this question please indicate: • Whether there are any environmental benefits associated with the technology • What technical, institutional, commercial risks or barriers are associated with the
technology?

6
• What are the main competing technologies?
Score Indicator 6 Low risks 5 Some minor levels of environmental risks 4 Some commercial/institutional/environmental risks 3 Mixture of environmental and commercial/institutional risks 2 Mixture of significant risks 1 High risks
Carbon dioxide Reduction questions 1) Carbon dioxide Reduction What is the scope for this technology to reduce UK carbon dioxide emissions competitively? (i.e. ‘How much carbon dioxide can be saved and at what cost?’) In answering this question consider and note: The likely amount of carbon dioxide which could be saved (in tonnes CO2/year) on the timescales 2010, 2015, 2020, 2050, assuming reasonable / realistic market uptake if the technology was • Successful against any competing technologies (we only expect data to indicate trends for 2050). These numbers need to strike a balance between the technical potential for a technology and the real world factors which would impact on its actual uptake. In calculating displaced emissions please use the current emissions for electricity generation in the UK as 430g CO2/kWh (117 gC/kWh) as used for both the Climate Change Agreements and the Emissions Trading Scheme (fixed over the time scale 2000 to 2010). • The likely cost (in £/tonne of CO2), which this would imply. The cost assessment should use assumptions about future costs of the technology (e.g. taking into account future reductions due to economies of scale etc). Costs include: the annualised cost of capital (at 8% discount rate); operating costs; energy benefits (evaluated at today’s energy prices); non-energy benefits. For electricity generating technologies use a figure of 2 p/kWh for the value of the electricity produced to derive the net cost of carbon dioxide saving (based on current prices for bulk traded electricity). The scoring system should be based on the following, taking the ‘best’ score independent of when the saving is predicted to be made: Score: Carbon dioxide emissions:
Score: cost of Carbon Dioxide:
8 >40mt p.a. CO2 6 < -£200 per t CO2 7 25-40mt p.a. CO2 5 -£200-0 per t CO2 6 10–25mt p.a. CO2 4 £0-25 per t CO2 5 5-10mt p.a. CO2 3 £25-50 per t CO2 4 2-5mt p.a. CO2 2 £50-100 per t CO2 3 1 - 2mt p.a. CO2 1 >£100 per t CO2 2 0.25 - 1mt p.a. CO2 1 <0.25 mt p.a. CO2

7
2) Market Penetration What is the likely market penetration of this technology in the UK? In answering this question please try and indicate: • Penetration into market sector • Status of market sector • Key development of market sector • Matching of technology development to market sector development needs and
paths within the UK • Magnitude / significance of potential
Score Indicator 6 High market penetration with scope for expanding market sector
High market share 5 High market penetration with scope with receding market
sector. Medium market share 4 Some market penetration with scope for expanding market
sector. Medium market share 3 Some market penetration with scope for expanding market
sector. Small market share 2 Some market penetration with scope for receding market sector.
Small market share 1 Little potential for market sector penetration, receding sector,
little market share 3) Additional Benefits What additional benefits might arise from supporting this technology? In answering this question please indicate: • Any other environmental benefits which may arise (e.g. other avoided
emissions, contributions to resource saving and waste minimisation) • Contribution to wider goals of sustainability (e.g. integration with other
technologies, or systems so the whole is greater than the sum of the parts)
• Additional comfort for occupant
Score Indicator 6 Many factors with significant impact 5 Some factors with significant impact 4 Some factors with moderate impact 3 Some factors with modest impact 2 Few factors with low impact 1 Few factors with insignificant impacts

6
Initial Screening of Technologies Score Table
x Technology assessment summary table
Initial ranking
Final ranking
Total score
Energy sector
Technology title
1a Am
ount of carbon saved
1b Cost of carbon saved
2 Market penetration
3 Additional benefits
Weighted total
1 Economic benefit
2 Scope for governm
ent action
3 Market entry barriers
4 Risks
Weighted total
Technology area Post screening notes
1 1 33 I Radical boiler re-design to exploit advanced burner designs 4 4 5 3 16 3 5 4 5 17 Boiler plant
2 2 33 A Home networking 5 2 5 6 18 5 3 4 3 15 3 3 33 A Computer/TV screen- OLED/FED 8 1 6 4 19 4 2 3 5 14
4 4 32 B Deployable PV 3 5 4 4 16 4 5 4 3 16Integrated building
design PV excluded from project by Defra
5 5 31 I Low-cost, adaptive and robust model-based boiler monitoring and control systems 3 5 4 3 15 4 4 3 5 16
6 6 31 B Micro CHP 4 6 3 3 16 5 3 4 3 15
7 31 B
Further development of whole building and loft space free heating for new and existing domestic market 3 5 4 5 17 4 4 3 3 14 Ventilation
Further research showed that not a specific technology and therefore not assessed
8 7 31 B Insulation application Techniques for raised timber floors 4 3 4 4 15 4 5 4 3 16 Building fabric
9 30 B Further improvements in airtightness standard design details and workmanship 3 5 4 4 16 3 4 3 4 14 Ventilation
Further research showed that not a specific technology and therefore not assessed
10 8 30 B Integrated Window Design 3 2 4 4 13 5 5 4 3 17 Building fabric

7
11 30 B
Further development of modular design and flatpack design for both domestic and commercial markets 2 5 4 5 16 4 4 2 4 14
Integrated building design
Further research showed that not a specific technology and therefore not assessed
12 9 29 I Novel approach to steam boiler system design 3 4 3 2 12 3 5 4 5 17 Steam boilers
Steam boiler industry is off-shoring production
13 10 29 I Low-cost, intelligent monitoring of steam systems 3 4 3 3 13 4 3 3 6 16
Steam distribution systems
Uk suppliers have 30% of world market
14 11 29 B Solar thermal air conditioning 3 3 3 4 13 4 5 4 3 16 Cooling
15 12 29 Alternative light technologies – Solid -state lighting - LEDs 3 3 4 4 14 3 4 4 4 15 Lighting
16 13 28 I Advanced plant design 5 4 2 2 13 4 4 4 3 15Advanced plant
design
17 14 28 I
Intelligent agent-based optimisers for industrial production management and scheduling systems, and advanced process monitoring and control systems 5 4 2 2 13 5 4 3 3 15
Automatic control/optimisation
18 15 28 I Decarbonisation/ dematerialisation 4 5 3 5 17 3 3 2 3 11 Decarbonisation
19 16 28 B Demand controlled ventilation systems 3 5 3 3 14 3 4 3 4 14 Ventilation
20 17 28 B Innovative insulation materials - Vacuum Insulated Panels 3 3 3 5 14 4 4 3 3 14 Building fabric
21 18 28 B Controls – Advanced BMS 3 5 3 4 15 2 3 3 5 13 Controls
22 28 B
Development of fuzzy logic systems and neural networks for more flexible user friendly BMS systems 3 5 4 4 16 4 3 3 2 12 Controls
Topic merged with controls - Advanced BMS
23 19 28 B Holistic Optimum design 1 6 3 4 14 3 5 2 4 14Integrated building
design
24 27 I Materials substitution package - looking for alternatives to high carbon content materials 5 3 3 2 13 4 3 4 3 14 Materials
Topic merged with Lightweighting

8
25 20 27 I More energy efficient separation processes 4 4 3 2 13 3 4 4 3 14Drying &
evaporation
26 21 27 I Second-stage waste heat recovery from high-temperature processes 4 4 3 3 14 3 4 3 3 13
Condensate & heat recovery
27 22 27 I Lightweighting & materials substitution 3 5 3 3 14 4 3 3 3 13 Lightweighting Includes materials substitution
28 23 27
Innovative approaches to enhance recovery and use of waste heat from steam condensate and hot boiler flue gases 3 4 4 3 14 3 4 2 4 13 Heating
29 27 Increased use of natural ventilation through better design 2 5 3 4 14 3 4 3 3 13 Ventilation
Further research showed that not a specific technology and therefore not assessed
30 24 26 Innovative Glazing 3 2 4 3 12 5 4 3 2 14 Building fabric
31 25 26 Advanced high temperature heat generation and recovery technologies package 4 3 3 2 12 4 3 4 3 14
High temp heat recovery
32 26 26
Developing and emerging thermal energy storage including phase change materials, dynamic insulation 3 4 3 3 13 4 4 3 2 13 Building fabric
33 27 26 Further development of structural insulation and construction methods 2 3 4 5 14 3 3 2 4 12 Building fabric
34 27 26 Further development of lighting controls 2 3 4 4 13 3 3 3 4 13 Lighting
35 28 26 Development of User friendly BMS interfaces 3 5 3 4 15 2 3 3 3 11 Controls 36 25 A Auto upgrade desktop computers 5 3 3 3 14 3 3 3 2 11
37 25
Next generation furnace/kiln design with integrated advanced control & monitoring package & smart thermal materials. 4 3 3 1 11 4 3 4 3 14
Reduced structural heat losses
Innovative design combination
38 25 Advanced controls 3 4 3 2 12 3 2 3 5 13 Controls Near market R&D

9
39 25 Lower power IT/electronic/control units - reduce standby consumption and automate switch on. 4 4 3 1 12 3 4 2 4 13
40 25 Integrated carbon/energy management systems - into utility systems and process control systems 3 4 2 3 12 3 4 2 4 13
41 25
Next generation paper processing systems, including higher efficiency production, integrated control 3 4 3 2 12 3 3 3 4 13 Paper processing
Innovative design combination
42 25 Further heat recovery developments 3 3 4 3 13 3 3 2 4 12 Heating 43 25 A Intelligent EPSU's 6 4 2 3 15 2 2 3 3 10 44 24 Burners: Oxygen enriched combustion 3 3 4 3 13 3 2 2 4 11 Burners with controls Near market R&D
45 24
Advanced controls for power & heat generation units - including CHP and renewable energy sources. 3 4 2 2 11 3 4 2 4 13
46 24
Remote machine condition monitoring - diagnosing inefficient operation (eg. refrigeration, space heating) 2 4 2 3 11 3 4 2 4 13
47 24
Low cost regulatory compliance monitoring systems - extend regulation to small sites/buildings 2 4 2 3 11 3 4 2 4 13
Management info. systems
48 24 Advanced recipe/batch/scheduling management systems with carbon/heat content tracking 2 4 2 3 11 3 4 2 4 13
Batch management / scheduling
49 24 Better-designed actuators with integrate VSDs, self monitoring, reduce compressed air use. 2 4 2 3 11 3 4 2 4 13
Actuators & control valves
50 24
Advanced separation technologies package - combining unit operations, thermal integration and novel heat/waste recovery 5 2 3 2 12 3 4 3 2 12
Separation technologies
Innovative design combination

10
51 24
Replacement by membrane and crystallisation processes- Freeze crystallisation has the potential application in the chemical industry for the manufacture of organics e.g. benzene, styrene. Phenol (Uses 5-15% of the energy used for distillation in food+dairy ind) 3 3 3 2 11 3 3 4 3 13 Distillation
52 24
Newer separation technologies-micro/ultra/nano-filtration, reverse osmosis, gas separation/facilitated transport, vapour permeation, pervaporation and electrodialysis. Reverse osmosis and pervaporation 3 3 3 2 11 3 3 4 3 13 Membranes
53 24 Improved condenser performance benefits 2 4 2 2 10 2 3 3 6 14
54 24
Integrated heat recovery systems, where more thought is put into integrating an energy recovery system within a plant. Process integration methodologies will be a part of this, prior to installing hardware. Design package. 5 3 2 1 11 3 4 3 3 13
Contra to industry trends
55 24 Developing and emerging desiccant cooling technologies 3 3 2 3 11 3 4 3 3 13 Cooling
56 24 Emerging technology of night sky radiative cooling 2 3 2 4 11 3 4 3 3 13 Cooling 57 24 A Electric powered heat pumped tumble dryer 5 2 3 3 13 4 2 2 3 11 58 24 A Gas Fired Tumble Dryers 5 2 2 2 11 4 4 3 2 13
59 23
Process design, simulation and optimisation tools -with integrated control and energy efficiency modules 3 4 2 2 11 2 4 2 4 12

11
60 23
Combining unit operations – such as reactors and separations; reactors and heat exchangers. An area of process intensification which may need R&D as well as demonstration. Sectors – chemical, pharma, food and related sectors. The gas turbine reactor, where a gas turbine can produce electricity, heat and chemicals (useful ones) is an extreme, as yet untried, example. 3 4 2 2 11 2 4 2 4 12
61 23
Hybrid drying systems, with conventional thermal sections preceded by electrical (e.g. microwave) or mechanical (e.g. presses). 2 4 4 1 11 2 4 2 4 12 Paper specific
62 23
Higher efficiency transformers particularly for power distribution but also industrial electronic products. 4 4 4 1 13 3 2 2 3 10 Electrical Appliances
Mostly manufactured overseas. Diffuse applications
63 23 Integration of other units (e.g. compressors) into CHEs 2 4 3 1 10 3 3 3 4 13 diffuse applications
64 23 Improved heat recovery unit selection 2 4 2 2 10 2 3 2 6 13 Experts systems
65 23
Development of integrated heat recovery/water heating systems using warm grey water for pre heating DHW feed water 2 3 2 4 11 3 4 3 2 12 Heating
66 23 Emerging evaporative cooling technologies 2 2 2 3 9 3 4 3 4 14 Cooling
67 22 Low NOx regenerative & recuperative burners 2 3 3 2 10 2 2 3 5 12 Near market R&D 68 22 Waste heat recovery - stock preheating 2 3 3 2 10 2 2 3 5 12 Near market R&D
69 22 Waste heat recovery - exhaust gas filtration 2 3 3 2 10 2 2 3 5 12 Near market R&D
70 22 Waste heat recovery - compact recuperators 2 3 3 2 10 2 2 3 5 12 Near market R&D

12
71 22 Measurement of load temperature 2 4 3 1 10 2 2 3 5 12 Near market R&D 72 22 Burner condition monitoring 2 4 3 1 10 2 2 3 5 12 Near market R&D 73 22 New furnace designs 3 2 3 2 10 2 3 2 5 12 Plant Design
74 22
Minimising the heat load for space heating in factories by removing the workforce to local heated environments. 2 4 3 2 11 2 2 4 3 11
75 22 Porous ceramic furnace linings 3 2 3 2 10 2 3 2 5 12Enhanced furnace
heat transfer
76 22 Improved sensors for harsh environments, e.g. temperature, moisture, inventory tracking 2 4 2 2 10 2 4 2 4 12
Sensors & instrumentation
77 22
Newer separation technologies-freeze/melt crystallisation and freeze concentration (esp. in heat-sensitive liquid foods). Melt crystallisation uses only 1/3 of the energy needed for evaporation (only tested in feasibility) 3 2 3 2 10 3 3 4 2 12 Crystallisation
78 22
Heat recovery and process control. Evaporation replacement by membrane and crystallisation processes (esp. on heat-sensitive products 2 4 3 1 10 2 3 4 3 12
79 22 Textiles: Radio-frequency drying of fibres 2 4 3 1 10 2 4 2 4 12Microwave & RF assisted drying
Textile market is small in UK, new technology likely to be manufactured overseas.
80 22
Redesign energy supply side, looking at integrated renewables, heat storage, lower carbon process heating and cooling techniques. 5 2 3 3 13 1 3 2 3 9
Alternative energy sources
Innovative design combination

13
81 22
Improved use of electrical enhancement methods, such as microwaves, rf heating, induction heating. (Highly effective point-of-use energy efficiency). Cross-sectoral 3 3 3 2 11 3 2 3 3 11 Process heating
Technical barriers to widespread application
82 22
Revisit heat storage methods – the intermittent nature of processes and the fact that not all those producing heat operate at the same time, suggests that effective heat storage (and the technology has moved on in the last 30 years) could be of benefit. 3 2 3 1 9 2 4 4 3 13 Heat storage
Technical barriers to widespread application
83 22
Study of how industry might integrate on-site renewable energy for process use – problems of storage etc., but may have to come eventually 5 2 3 3 13 1 3 2 3 9
Integrated renewables Diverse applications
84 22
Moisture profile correction equipment such as cross machine zoned steam boxes and infra red dryers (typically 1% improvement) 2 4 3 1 10 2 3 2 5 12 Near market
85 22
Ongoing development of increased efficiency in boilers, motors, compressors, heat exchangers, DHWS and also reduced emissions ie Nox 2 3 3 3 11 3 2 2 4 11 Heating
86 22 Improved Efficacy 1 2 3 4 10 2 3 3 4 12 Lighting 87 22 Further development of fibre optics 1 2 3 3 9 2 4 3 4 13 Lighting
88 21 Waste heat recovery and on-site oxygen production 2 2 3 2 9 2 2 3 5 12 Near market R&D
89 21 Low thermal mass materials 2 3 3 1 9 2 2 3 5 12 Near market R&D 90 21 Improved stock support systems 2 3 3 1 9 2 2 3 5 12 Near market R&D 91 21 Improved refractory & insulation) 2 3 3 1 9 2 3 3 4 12 Near market R&D
92 21 Advanced knowledge based process optimisers - particularly for larger chemical/steel sites 2 4 2 1 9 2 4 2 4 12

14
93 21 Low resistance air/dust filters - higher efficiency filtration systems 2 4 3 1 10 2 3 3 3 11 Filtration
94 21 Chemical heating 2 2 2 4 10 3 2 3 3 11 Heat storage
Technical barriers to widespread application
95 21
Intensified methods for treating effluent and changing it into useful products such as pharmaceuticals. Technology under development, but take-up very limited 2 2 2 4 10 3 2 3 3 11 Waste treatment
Technical barriers to widespread application
96 21
Industrial heat pumps. Progress has been made in some sectors, where effluent concentration is needed, or in distilleries. The take-up elsewhere has been very poor due to perceived high equipment cost. The support in the UK for domestic/commercial systems has not extended to the process industries. Scope – all sectors. 3 2 3 1 9 3 3 3 3 12
Highly capital intensive
97 21 In line cleaning systems 1 3 3 2 9 2 3 3 4 12 Fouling mitigation
98 21 Sophisticated condition monitoring systems (typically 0.5% drying improvement) 1 4 3 1 9 2 3 2 5 12 Near market
99 21 Hydra Nip additional pressing (1% to 2% drying improvement) 2 3 3 1 9 2 3 2 5 12 Near market
100 21 Improved vacuum assistance and application to pressure rolls (2% to 4% improvement) 2 3 3 1 9 2 3 2 5 12 Near market
101 21 High efficiency Pulpers. 3 3 3 1 10 2 3 2 4 11 Pulpers Near market
102 21 Further improvements in bulb energy - halogen 1 2 3 3 9 2 3 3 4 12 Lighting
103 21 Developing and emerging energy efficient ballasts 1 2 3 3 9 2 5 2 3 12 Lighting
104 21 Developing radio frequency induced fluorescence 1 2 3 3 9 2 4 2 4 12 Lighting

15
105 21 A PVRs 1 4 4 2 11 2 2 3 3 10
106 20 Use of polymers as support structures for low temperature reactions 2 3 2 2 9 3 3 2 3 11
107 20 Integrated heat exchanger reactors 2 3 2 2 9 3 3 2 3 11
108 20 Integration of heat exchanger reactors with gas turbines 2 3 2 2 9 3 3 2 3 11
109 20 Pulsed baffle reactors 2 3 2 2 9 3 3 2 3 11 110 20 Laser induced reactions 2 3 2 2 9 3 3 2 3 11
111 20 Electronic descaling or surface coatings 2 3 2 2 9 3 3 2 3 11
Scaling mitigation/enhanced
heat transfer
112 20
HIGEE Distillation- an intensified method for improving distillation plant (chemical and related sectors) 4 2 3 2 11 2 2 3 2 9
113 20
Novel low temperature heat pumps used in a power cycle with a low-boiling liquid as the working fluid 4 2 2 1 9 2 3 3 3 11 Heat pumps
Highly capital intensive
114 20 Advanced designs 2 4 2 1 9 2 3 3 3 11Compact heat exchangers
115 20 Low cost multi stream CHEs 2 3 1 1 7 2 4 3 4 13
116 20 Lower temperature treatment tanks 2 3 3 2 10 2 2 2 4 10Electro plating &
coatings
117 20 Biological surface treatment 2 4 1 1 8 2 3 4 3 12Degreasing /
stripping
118 20
Cross machine steam showers and infra red heaters to change sheet water surface tension characteristics (typically 2% to 3% improvement in conjunction with improved vacuum assistance) 2 3 3 1 9 2 3 2 4 11 Near market
119 20 Replacement of vacuum rolls with vacuum boxes and Extended Nip systems 1 3 3 1 8 2 3 2 5 12 Near market

16
120 20
Felt developments such as multi-layer construction, semi-permeable barriers, felt pre - treatments and high performance filaments (2% to 5% drying improvement) 3 2 3 1 9 2 3 2 4 11 Near market
121 20 Felt cleaning and conditioning developments such as multi-slot Uhle boxes, low 1 3 3 1 8 2 3 2 5 12 Near market
122 20 Friction hydrofoils and programmable needle jet felt cleaning systems 1 3 3 1 8 2 3 2 5 12 Near market
123 20
Modern felt tensioning and monitoring systems to avoid premature stretching, abnormal tensioning and machine direction differential stretching 1 3 3 1 8 2 3 2 5 12 Near market
124 20 Low energy Rotors. 2 4 3 1 10 2 3 2 3 10 Rotors Near market
125 20
Development of design for daylighting including emerging technologies and materials i.e. chromogenic glasses, electrochromic and directionally transmitting glazing, fibre optics 1 2 2 3 8 2 5 2 3 12 Lighting
126 19 Micro reactors 3 2 3 2 10 2 3 2 2 9 Micro production 127 19 Advanced processes 4 2 3 2 11 2 3 2 1 8 Alternative processes
128 19 Advanced reactor design 3 2 3 2 10 2 3 2 2 9Reactor
design/geometry
129 19 Alternatives to steam use, e.g. extending the application range of thermal oil boilers 2 3 3 1 9 2 2 3 3 10
Thermal oil heat distribution systems
Technical barriers to widespread application
130 19
Heat-driven refrigeration systems (absorption or adsorption cycles). Expensive at present but the energy saving potential is considerable 2 2 3 1 8 3 2 3 3 11
Refrigeration & Industrial gases
Technical barriers to widespread application
131 19 Advanced materials - polymer heat exchangers 2 3 2 1 8 2 3 2 4 11

17
132 19
Low temperature conversion of heat to electricity. So-called bottoming cycles have not broken in to the process industries, but the technology is largely developed. An alternative way of using waste heat 3 2 2 1 8 2 5 2 2 11
133 18
Improved combustion efficiency/control for large coal fired/biomass boilers (coal may make a come back) 1 3 1 2 7 2 3 3 3 11
Boiler control systems
Depends on your view of the future - if coal returns then scope for higher savings. Figures base on current usage.
134 0
Compact heat exchangers are developed, but take-up is in need of an additional spur. ECAs will help, but so would appropriate demonstrations. Possibly could be done in conjunction bottoming cycles. 0 0 NOT R&D

18
Appendix B Technology Assessments Appendix B includes the detailed technology assessments carried out. They follow the order as shown in the summary table below. The technologies follow the order of the initial ranking.
Technology Title Summary 1. Radical boiler re-
design to exploit advanced burner designs
This technology change involves the development of boiler-design techniques to enable the potential benefits from distributed flame/matrix burners to be realised. This includes enabling shell-boiler heat-exchanger areas and, hence, unit sizes to be reduced. In turn, this should improve the scope for incorporating flue-gas condensing economisers.
2. Home networking Home networking is type of control system that monitors all energy consuming equipment in a dwelling. It is able to identify when equipment is not being used and switch off the power supply, therefore removing the possibility of standby and wasted energy.
3. Computer/TV screen- OLED
Organic Light Emitting Diode (OLED) Screens. OLED technology uses a screen where the active picture elements (pixels) are comprised of organic materials. These pixels emit light once energised to form an image.
4. Low-cost, adaptive and robust model-based boiler monitoring and control systems
Model-based predictive control (MBPC) is an advanced control technique that has been used by multinationals in a range of process optimisation roles. The technology has also been used to improve the control of very large boiler and power generation systems and to remotely monitor and identify turbine faults in large power stations.
5. Micro CHP Combined heat and power (CHP) systems have been available for many years to provide heat and power in the form of distributed generation or district heating with power. A CHP system is generally a combustion engine to produce power in the form of electricity and the heat generated by the process, which would normally be exhausted to atmosphere, is captured and used in heating systems. This technology looks at Micro CHP up to 5kW.
6. Insulation application Techniques for raised timber floors
The technology topic is the development of a more effective method of installation for insulation under raised timber floors. Raised timber floors make up a large proportion of the existing dwelling floors. Though this topic recognises more the challenge rather than a specific technology it also identifies the reasons why such a technology has not been developed; namely that there are no drivers to push forward the development.
7. Integrated Window Design
Integrated window design refers to the combination of various services within window structures. The particular services considered here are integration of ventilation and/or heat recovery into the window

19
unit. There are a number of options depending on the type of window structure utilised. The integrated system could be a prefabricated window unit or, in the case of commercial buildings, generally a double layer glazing façade.
8. Novel approach to steam boiler system design
This technology develops modular for larger steam boiler installations. However, in this case, the individual boiler units would not be built into a single structure. Designing boilers specifically to be installed in this way will produce steam systems with improved control characteristics that are more responsive to load changes. It will also reduce the number of individual boiler models that manufacturers need to develop by scaling from base designs.
9. Low-cost, intelligent monitoring of steam systems
This technology involves applying advanced sensors and communications equipment together with appropriate system design to address these issues. Measuring steam and condensate mass flows enables steam balances to be produced, making it possible to identify losses due to leakage.
10. Solar Thermal Air Conditioning
The technologies currently available are predominantly vapour compression systems and utilise refrigerants that are harmful to the atmosphere. The technologies looked at here are free of harmful refrigerants, use solar energy as the energy source and produce air conditioning indirectly through integrating with other systems, i.e. desiccant or evaporative cooling.
11. Alternative light technologies – Solid -state lighting - LEDs
This technology topic is LED lighting systems.
12. Advanced Plant Design The technology is the next-step plant design package which designs plants that are optimised for energy and environmental benefits as well as cost. The new design package looks to combine unit operations, and takes an integrated approach to thermal integration/waste heat recovery. Process control is considered an integral part of the design process rather than an add-on to the design once completed.
13. Intelligent agent-based optimisers for industrial production management and scheduling systems, and advanced process monitoring and control systems
Intelligent agents are a new computing technique that could substantially increase the productivity and flexibility of any country’s manufacturing industry, while optimising its energy consumption. They have a wide range of potential applications, but the primary applications from an energy efficiency perspective lie in production scheduling and the optimisation of process control systems, particularly in batch manufacturing sites.
14. Decarbonisation/ Decarbonisation/ dematerialisation is the preferential elimination of the carbon intensive components in

20
dematerialisation the manufacturing supply or value chain, from raw materials processing through to the finished product.
The technology takes into account the true carbon footprint of the product-service offering, over its life-cycle, and seeks through re-design to achieve a maintained or improved product/or commercial service with reduced use of materials and energy, in part through recycling.
15. Demand controlled ventilation systems
Demand controlled ventilation systems (DCVSs) improve indoor air quality (IAQ). Improved energy efficiency is a secondary benefit which is achieved as a result of either removing the need for occupants to ventilate the building themselves, causing heat loss through open windows, or by removing the need for light-switch-controlled extract fans.
16. Innovative insulation materials - Vacuum Insulated Panels
Vacuum Insulation Panels are emerging as an effective method of insulating both existing and new buildings in both the commercial and domestic sectors. They would enable greater levels of insulation to be installed without increasing the thickness of the building fabric and also enable the insulation of previously un-insulated building elements, such as doors.
17. Controls – Advanced BMS
Controls in general and BMS specifically have been available for many years and are currently based on Programmable Logic Controllers (PLC) and mathematical modelling. The following considers the developments and the use of alternative management strategies for BMS, i.e. fuzzy logic and neural networks to promote more flexible user-friendly controls.
18. Holistic Optimum design
This technology topic is a simple software package that architects or others can use. It needs to be simple, highlight daylighting, natural ventilation and other ventilation options, thermal properties and heat loss.
19. More Energy Efficient Separation Processes
Separations are widely used in Industry. The required separation operations are diverse in nature and scale, and there is an equally diverse set of separations techniques including distillation and drying. As a result there are many diverse and novel ways to make these separation operations more efficient, and there is a potential to save 684,000 Tonnes of CO2 each year from 2050.
20. Second-stage waste heat recovery from high-temperature processes
This technology is concerned with extraction of the remaining heat, principally from ‘dirty’ but still reasonably high-temperature waste gas streams. They have been described as second-stage waste-heat recovery in order to differentiate from existing, primary waste heat recovery technologies.
21. Light-weighting & Materials Substitution
Light-weighting and materials substitution represents a radical departure in product design and re-design and includes both the product and its physically related attributes such as reduced packaging. The objective is to ensure lower material intensities of the finished product compared to existing products.

21
22. Innovative approaches to enhance recovery and use of waste heat from steam condensate and hot boiler flue gases
This technology change involves the adaptation and integration of known techniques and technologies to increase the efficiency of steam systems. This includes improvements to heat exchanger technology, adaptation of heat storage and transport technologies and application of heat conversion technologies.
23. Innovative Glazing This technology for glazing includes switchable (chromogenic) glazing and transparent insulating materials. Switchable (chromogenic) glazing varies the transparency of the glazing to automatically control the light and heat transfer and transparent insulating materials are insulating materials that allow the passage of light.

22
Industrial Energy Efficiency Technology Radical boiler re-design to exploit advanced burner designs Overview
The heat release patterns with conventional burners give large variations in the heat delivered along a boiler. A significant proportion (about 20%) of the combustion chamber heat exchanger surfaces adjacent to the burner inlet are ineffective with conventional burners. They receive a relatively low proportion of the heat released by the flame.
Boilers are designed with this consideration. This has two main consequences: 1. They are larger (and contain significantly more metal) than should be
required for a given heat input rate. This adds considerably to construction costs and limits the space available for other energy efficiency measures, such as flue-gas heat exchangers (used for water and air pre-heating). This factor also leads to higher temperature gradients in the boilers and thus greater stresses and an increased risk of early failure.
2. They contain a larger mass of water during operation than should be required, which reduces their responsiveness and flexibility. This significantly increases energy losses during load matching.
These factors contribute to about 19% of the energy input being lost through the stack and to the potentially very large losses owing to the effects of poor control, which can lead to “cycling”. In extreme cases, about 50% of fuel input can be lost owing to the latter problem. The use of burners that provide much more uniform heat release will enable boiler designs to be developed which significantly reduce losses by using more effective heat transfer surfaces and enabling more heat recovery technologies to be incorporated. Overall, it is estimated that 10% of fuel use might be saved. In addition to energy and construction benefits, the use of the advanced burners gives dramatic reductions in the levels of thermal NOX formation through lower local flame temperatures. Technology Radical redesign of shell boiler heat exchange surfaces is required to take advantage of new designs of modulating burners. Currently, new designs of burner are entering the UK market. These have distributed flames with more uniform heat release patterns than conventional burners and have been developed for gas firing only. However, in principle, they could also be developed for liquid fuels.

23
Designing boilers specifically to take advantage of the characteristics of these new burner designs will produce units with:
• improved control features that are more responsive to load changes; • lower construction costs, owing to significant size reductions; • improved reliability, owing to lower thermal stresses; • greater heat recovery potential through incorporation of additional
downstream heat-exchange surfaces (economisers). Compared with conventional designs, this will enable fuel savings of about 10% to be realised. Although manufacturers are developing new burners, UK shell-boiler manufacturers are generally not developing boilers to take advantage of the new designs. However, changes in legislation on NOX emissions from industrial boilers and imposition of energy efficiency requirements would have a significant impact on boiler design. Markets New, distributed-flame burners are being developed in the UK1, though this appears to be largely in response to the requirements for lower NOX formation characteristics for equipment sold into other European markets. In conventional oil and gas burners, NOX formation has to be controlled by modifying the combustion conditions. This leads to lower combustion efficiency because of the need to generate reducing environments in the flame. The more uniform heat-release patterns in this new generation of burner are coupled with lower peak-flame temperatures. This means that, inherently, they form less thermal NOX during the combustion process. They have the advantage that, while NOX formation is controlled, efficiency is not reduced. Current boiler heat-transfer surface design in shell boilers is not adapted to take full advantage of this type of burner. These burners release heat nearer to the burner entry to the boiler than conventional burners. Boiler designs could be adapted to take advantage of this. This would probably lead to a reduction in the overall dimensions of the main boiler, which potentially would release space for additional economiser heat-transfer surfaces. Boilers are used worldwide to generate steam and hot water for process and space heating across a diverse range of industrial and commercial sectors, and in many public-sector activities. This technology is potentially applicable to all boiler types, but with particular relevance to shell, smoke/fire tube boilers. The technology would have the greatest impact where new build units are optimised for their use. However, they may be used in the current installed base if NOX control requirements are imposed upon them. The impacts on boiler efficiency would need to be investigated to determine if this is the optimum solution. Current boiler design parameters and practices have been established for many years and considerable effort may be required before new approaches are developed, accepted and adopted. However, this technology is likely to be more readily scaled than current burner designs. They will enable more compact boiler
1 The Carbon Trust RD&D programme project, Burnertech Combustion Engineers Limited, http://www.thecarbontrust.co.uk/carbontrust/low_carbon_tech/projects/2003-2-25.pdf

24
units to be developed. This will enable them to be used in a wide range of applications. Issues/challenges There are several barriers to the adoption of innovations in boiler design. The most important of these is the absence in the UK of regulation for the performance of industrial boilers. Old, inefficient boilers are kept running well past their technical replacement point because maintenance costs are low compared with replacement costs. This could be addressed by introducing mandatory performance/efficiency assessments such as are present in some countries in continental Europe. In particular, new burner designs need to be driven into the market by imposing limits on NOX emissions. However, this will impose additional costs on industry and may lead to more production being sent overseas. Such legislation would be more effective if it was linked to a capital loan fund to support users in meeting mandatory improvement notices. Supplementary to this key issue, are the following factors:
• New designs are perceived to be more complex, less reliable and have higher installation costs. This technology should, in the longer term, give rise to reductions in manufacturing costs arising from the simplicity of the burner head and, more importantly, from enabling more compact boilers to be developed. However, more sophisticated controls will be required to take full advantage of the technology.
• Lifetime operating costs are not given sufficient weight in boiler/steam system specification and design. Even good design is often weakened as it passes through the chain from specification to installation.
• The installed base of equipment is large and the rate of change is relatively low (typically boilers are designed to last for 20 to 30 years and some are still operational at 80+ years). Boilers, while subject to maintenance and modification (which includes renewal of burners), are unlikely to be completely replaced in less than their expected lifetime unless some factor causes a premature failure. Hence, the timescale for the widespread introduction of technologies in this area is likely to be long.
Key Characteristics

25
Unit Value Comments Margin investment cost/unit *
£ 5,000 10% - once established there should be a significant reduction in manufacturing costs compared with current designs.
Annual energy consumption
MWh 26,000
O&M costs/year % 20 Higher costs owing to increased maintenance of more complex controls and sensors.
Percentage savings % 10 Other and additional cost savings
£/year 0
Utilisation or seasonal efficiency
% 60
Availability Date 2010 Plant lifetime Years 20 Trend in industry towards lower lifetimes as a
result of value engineering to reduce capital costs.
Payback Years 0.4 Fuel split % 1 electricity
99 fossil Fossil split 90% gas, 10% oil
* This measure takes into account the saving compared to the existing technology Key Players In general, universities do not appear to be involved in specific burner and boiler design. However, the following work in fundamental aspects of combustion:
• Leeds University, Department of Fuel and Energy; • Imperial College; • University of Nottingham.
The following companies develop advanced burners: • Burnertech Combustion Engineers Ltd; • Dunphy Combustion, UK2; • International Flame Research Foundation, Netherlands; • E.O. Lawrence Berkeley National Laboratory – Ultra Clean Low Swirl
Combustion3,4; • Clean Energy, Vancouver, Canada - Oscillating Combustion Technology5.
2 Premix burners http://www.dunphy.co.uk/premix%20burners.htm 3 Ultra Clean Low Swirl Combustion ,US Patent # 5,735,681 and 5,879,148 4 http://www.mindfully.org/Technology/2003/UCLSB-Combustion3sep03.htm 5 http://www.clean-energy.com/technologies/pulseflame.html

26
Technology Development There is a lack of suitable R&D facilities in the UK. Sending the manufacture of products overseas works against the introduction of new designs. Therefore, extensive demonstration will be required to encourage the adoption of the new technology.
Blue skies research
Industrial R&D
Full-scale prototype
A-model prototype
Series production
Mk II design
Long-run series production
2010 2015 2020
The time taken to move from being able to build a full-scale prototype to full production of a boiler using the new technology tends to be short. Boiler manufacturers tend not to have the resources to support protracted development work. However, should a change require updating of standards and codes, the delays could be extensive.
Carbon Summary Date/data Penetration
(%) CO2
(kt/year)CO2 (£/t)
Comments
2010 0 0 -40 Technology not developed 2015 3 34 -42 Long replacement cycles 2020 10 113 -44 2050 50 541 -43 Technology Impact Assessment 1. Estimated UK Economic Benefits Score 4 Most manufacturers/suppliers of boilers and burners in the UK are also involved in European and worldwide markets. There are about 50,000 industrial and commercial scale boilers in the UK. The added value of designing the new technology in the UK is likely to be >£1 billion and 1,000 jobs. It is probable that no more than half the units would be built in the UK. Currently, manufacturing of boilers in the UK is in decline and several key manufacturers are based in mainland Europe. Several UK companies have sent the production of boiler shells to India, China and other locations with low production costs. Suppliers who previously manufactured in the UK are now importing products for resale from European countries such as Italy and from further afield, including the USA. UK burner manufacturers have already developed distributed flame burners. Some are already on the market in the UK, although work continues on scaling for different applications. However, shell boiler designs have not yet been developed which take full advantage of the benefits that these burners offer and this is how the most significant energy savings will be realised. Development work is required to support this radical change in boiler design. Changes to design techniques and boiler standards are likely to be required for new designs to be successfully developed. Collaborative development, involving manufacturers of boilers and burners is likely to
6 Private Communication between M Dunphy (Dunphy Combustion) and A McCullough (FES), 2004.

27
be needed. At least one UK burner manufacturer has recognised that carrying out boiler and burner design together is the way forward and that this might be best achieved by having both aspects under the control of a single organisation6.
2. Scope for Government Action Score Burner manufacturers are developing distributed flame burners. However, boiler manufacturers do not yet appear to have considered these as more than simply an alternative burner design, which can be used to replace directly conventional burners in their boiler burner combinations. To date, the burners have generally been at the smaller end of the range. There is a driver for sales into Europe to offer burners with low NOX production characteristics. Some manufacturers of small-scale (<400kW) hot water boilers are introducing burners operating with distributed flames (also referred to as Matrix burners7). However, these boilers do not operate at comparable conditions to larger boilers and, particularly, steam boilers. Funding the development of design techniques is needed to enable a new generation of boiler to be developed. The highly competitive nature of the boiler market, and the tendency for boilers to be bought on the basis of basic functionality and installed cost rather than overall performance and lifetime cost, means that UK boiler manufacturers are unlikely to have the resources to carry the necessary developments forward alone. To drive this innovation into the market, regulation of the industrial sections of the boiler market will be needed. In particular, imposition of limits on NOX emissions would encourage the introduction of the burner designs that underpin this technology. Energy efficiency best practice requirements, backed with a testing regime, would force the most efficient solutions to be installed.
3. Market Entry Score 3 The new burner technology promises benefits in its own right and, in particular, the possibility of reducing NOX production without compromising burner efficiency. The main barriers to the entry of this technology to the UK market are:
• traditionally, boiler manufacturing is a conservative, risk-averse industry, which is likely to be reluctant to adopt the radical changes required to take full advantage of these new burner designs;
• buyers tend to opt for established technology (perceived as more reliable and with which staff are familiar).
It is important that an overall, rather than a component-based, approach be taken to boiler design. The US DoE is currently funding a programme to radically improve industrial steam boiler design8. Funding would be most effective in developing design techniques and carrying out demonstration work to build confidence in the technology. However, this alone would not be sufficient to ensure that this technology entered the market. There is an underlying tendency to purchase on installed cost alone without consideration of lifetime costs and efficiency, which needs to be addressed. While some manufacturers have a positive attitude to development of 7 Viessman product brochure for VITOCROSSAL 300,Gas-fired condensing boiler, Rated output range: 9 to 142 kW 8 US Department of Energy, Office of Energy Efficiency and Renewable Energy, Industrial Technologies Program: Superboiler. www.oit.doe.gov

28
higher efficiency products in this area, they are hampered by this attitude in the market. In this situation, it is difficult for these manufacturers to justify large expenditure on development even of enhancements of current products. This area not only needs technical developments, but a change in design philosophy - from designing a boiler and then fitting a standard burner, to designing the boiler on the basis of specific burner characteristics. It is likely to be difficult to introduce this in an industry with a cautious attitude to change. More stringent requirements for emissions, in particular of NOX, are likely to be introduced in the UK for gas and oil-fired boilers. This would provide a significant boost for the burner designs that lie at the heart of the potential changes to boiler design that are discussed here.
4. Risks Score 4 The main risk is that the approach outlined runs against current industry trends. Industry may decide to move production offshore rather than meet tighter regulation. However, a significant proportion of boilers is used in areas other than industrial production (eg space heating), and may not be able to adopt this solution and will have to move to compliant designs. There is a risk that the introduction of tighter controls on emissions will move slowly and will thus be a less effective driver to the early adoption of new burner designs. These controls also need to be backed up with a drive to ensure that new systems must be designed to maximise efficiency. Condensing economisers should become a more realistic option at least in applications where their use is prevented by space restrictions. The technology itself should not be difficult to develop if the immediate economic barriers involved in bringing a new technology to market can be overcome. Carbon Dioxide Reduction Questions 1. Carbon Dioxide Reduction Score 2 and 4 Savings potential is estimated on the basis that the technology will reduce losses during start-up and shutdown, which will be quicker (lower water volumes from more compact designs) and the benefits of more effective use of a more uniform heat release pattern. Market uptake is likely to be strongly dependent on drivers such as cost of energy and legislative/regulatory requirements. If these are not significant, then uptake will be low. If a requirement for the installation of steam boilers/systems were to be introduced, which demanded that efficiency was to be optimised over the system, then this technology approach would be more extensively adopted. The estimated potential annual CO2 saving by 2050 is 541 ktCO2. Estimated costs of this technology in £/tCO2 are given in the table above. 2. Market Penetration Score 4 The limits to market penetration of this technology will be dependent on the extent to which the underpinning burner technology can be scaled. It is unlikely to give such significant benefits in very large boilers where water tube designs are used. The initial area where adoption should be promoted is the lower end of the scale (400 kW to 1 MW) covering a large proportion of boilers and is the most likely range for which burners will be developed initially. As burner-scaling issues are addressed, it would then be possible for larger boilers to be designed to incorporate the technology. Experience at smaller scales should give more confidence in adopting

29
them where boiler investment costs are higher. It is considered that the actual uptake will be strongly dependent on legislative/regulatory and fuel-cost drivers. It is unlikely that the need for steam generation and use will disappear, though decline in the UK manufacturing sector would be likely to reduce them significantly. The need for hot water will not disappear, though its use for space heating may decline if alternative technologies emerge. Also, the use of fossil fuel for production of hot water may decline if alternative technologies such as solar thermal become more widely adopted and process technology changes will reduce the use of steam and hot water (eg new baking technologies could replace steam ovens). Reducing energy costs through greater efficiency will be important to businesses if they are to remain competitive and survive in the global marketplace.
3. Additional Benefits Score 4 Other benefits from adopting this technology change are expected to be a reduction in the use of raw materials (principally steel) for boiler construction owing to more compact designs. Lighter units could lead to lower requirements for concrete in boiler house foundations. Both materials are energy intensive in production. Smaller unit designs should also be beneficial. Summary This technology change involves the development of boiler-design techniques to enable the potential benefits from distributed flame/matrix burners to be realised. This includes enabling shell-boiler heat-exchanger areas and, hence, unit sizes to be reduced. In turn, this should improve the scope for incorporating flue-gas condensing economisers. This technology is potentially applicable to most of the steam boiler applications in the UK. It could also be applied to hot water boilers though they have not been considered in this assessment. The EU market for boilers is about 10 to 15 times that of the UK’s. There is a large installed base number of boilers in the UK and, although this may decline as alternative technologies become available for some processes and applications, they are likely to continue to be a major consumer of fossil fuels. Replacement cycle times suggest that most of these units may be replaced by 2050. Levels of saving that are available from heat recovery from flue gases and from other efficiency gains are thought to be around 10% saving in fuel use per boiler. Based on the assumptions defined in the assessment, it is estimated that annual savings of up to about 0.5 million tCO2 might be realised by 2050.

30
Appliance Technology Home appliance networking Overview The concept of smart home networking systems is not new. Smart homes currently proposed or built for sale in Europe and the USA tend to concentrate on:
• advanced home networking for entertainments and personal computer (PC) uses;
• environmental remote control (temperature and lighting); • enhanced remote control of security-related functions (door locking, curtain
closure, surveillance and security lighting). A small amount of photovoltaic (PV) generation may be included, usually to provide a basic standby power source. However, little or no commercial consideration has gone into energy management and energy efficiency in system components. The home networking concept, evaluated in this review, aims to reduce household energy consumption through the effective management of appliances and product using a network communications protocol. Technology The ‘smart’ or ‘intelligent home’ uses readily available devices, many of which are currently used in home security systems. These include passive infra-red sensors, pressure pads and magnetic reed switches. Such homes also use other familiar devices such as infra-red transmitters like those used for TV remote controls, smoke, heat and gas detectors, door entry systems, powered doors, etc. In an intelligent house, all these devices and all household appliances and products are connected together on a communication network. The communication network or ‘home appliance network’ concept aims to connect together all consumer products that consume water, electricity or gas into a single system using a household communications network. The system could connect all types of products including:
• consumer electronics – televisions, DVD players, music systems, home PCs, video game consoles, home media centres, etc;
• household appliances – washing machines, dishwashers, refrigerators, freezers, tumbles dryers, etc;
• water and spatial heating systems – boilers and central heating systems; • security systems; • lighting.
The system would also require specific technology including:
• User interface – to allow the user to interact and manage the system, eg using a home computer, web browser or phone for remote access.
• Software – required to run the system and to improve the energy efficiency of the connected appliances using input from the user, the

31
manufacturer and utility systems, the products themselves and the sensors installed around the house.
• Network communications medium – using either mains or wireless connection such as Ethernet™ or Bluetooth™. The use of wireless technology and ordinary home electric wiring eliminates the need for special rewiring and allows the network to be used in existing homes as well as new housing.
• Network communications protocol – all appliances would have to “speak the same language” to enable products to communicate with each other on the network. Networked products will need to contain compatible components such as semiconductors to ensure home networking products are compatible.
• Sensors, detectors and digital meters. All this technology enables the homeowner to program, control or monitor household consumption by computer or by telephone. The system should also be able to optimise and control itself automatically using sensors. Connecting all appliances in the home together into a single system would effectively create a local area network (LAN). This should provide significant benefits in terms of resource efficiency including:
• Intelligent power management – enabling the power modes of products to be switched automatically, (eg between on/off/standby/hibernation), thus reducing the overall energy consumption of products. This would apply to products that are frequently left on standby such as televisions and DVD players and to electric power supply units (EPSUs) such as those used to power telephone handsets. The latter are usually placed in sockets and consume power continuously, despite the device’s battery being fully charged (small savings per household, but worthwhile Carbon savings on a national basis).
• Digital power metering – the actual power consumption of each domestic appliance can be measured using a digital power meter. This would allow the user to monitor exactly how much energy or water is being consumed and at what cost. They could then take appropriate action to reduce demand.
• Monitoring and feedback – the system could report useful information relating to energy consumption, eg lights or heating appliances left on during the day.
• Self-activating – domestic appliances capable of self-activating when energy cost is low. The power meter is able to access up-to-date information about tariff zones and tariff costs directly from the utility for all connected appliances.
• Sharing of resources – to exploit the relationship between appliances using hot water (eg washing machines and dishwashers) and appliances providing hot water (eg hot water heaters) powered by either gas or electricity.

32
There are three types of home automation controls:
• Individual control of only one appliance – examples include programmable setback thermostats, motion detectors, occupancy sensors, photocell lighting controls, and timers.
• Distributed control – using standard power line wiring, telephone wire (4-pair), video wire (dual coaxial), radio frequency (RF) signals, and infra-red (IR) signals. This allows individual appliances to communicate with each other over existing electrical wiring without a central controller.
• Centrally controlled – using a central computer or control unit to manage the connected appliances and utilising sensors to gain feedback.
A typical home appliance network is shown below.
An example of the technology communication standard required is ECHONET (Energy Conservation and Homecare Network), which is currently being developed in Japan. This aims to control home appliances directly and to connect to home electronic devices through a gateway. This design will enable product manufacturers to develop a variety of systems with different communication speeds and levels of technological sophistication, while maintaining optimum cost performance. ECHONET plans to use electric wires and wireless technology as transmission media and to implement a multi-vendor environment to ensure equipment built by different manufacturers can be interconnected and controlled. The ECHONET consortium also intends to incorporate plug and play functionality, thus enabling new devices to be added easily to the network. The communications platform will be open source to encourage the development of highly reliable application software and network-compatible devices. The network will provide advanced services by connecting to external systems via communications lines and by working in co-operation with outside organisations. Based upon the potential benefits that could be achieved through optimising and centralising the energy management of appliances, home networks are believed to be capable of reducing overall domestic energy use by 20–40% based upon the types of devices connected. For the purposes of this evaluation, we selected the

33
least optimistic reduction of 20%. This could potentially attain significant reductions in carbon dioxide emissions in the UK, as the domestic demand sector makes up approximately 30% of total energy demand. Markets The potential market for this technology is worldwide. Home appliance networks could be installed in any country where compatible appliances are available. Based upon current progress, it is expected that a communication standard will be established and the compatible appliances made commercially available by 2010. Cost will be dictated by the additional technology required by each homeowner. On the basis of the initial standards mentioned above, most of the technology necessary for successful operation will be ‘built-in’ to the appliances themselves. Depending on the type of control system, software may be needed to set up and operate the network using a home PC, laptop, mobile phone or other handheld device. Initial estimates put the cost of this software at £500. This technology could penetrate worldwide commercial and industrial markets as well as domestic ones. However, market share may be constrained due to poor public communications infrastructure, for example, in developing countries. There may be increased potential benefits with a growing ageing population the UK, where home networking may become more significant as an area for networking than appliances. Issues/Challenges The National Association of Home Builders (NAHB) conceived the idea of ‘smart-homes’ in 1984. An offshoot of the initial project, the Smart House Limited Partnership, continued research and development in this area. However, no system has yet become commercially available on a wide scale. There are two main reasons for this.
• Although the Smart House Limited Partnership developed and marketed a number of complete intelligent systems with a variety of options, complete systems can be very expensive. Except for low-end security systems with some lighting and climate control added, they are targeted at the new luxury home market. The take-up of specific standards among appliance manufacturers has been poor, making integration with products difficult.
• Establishing a communications standard between all or most major product
manufactures to ensure wide market penetration and low consumer costs is very difficult. There are a number of home network architecture standards currently being assessed including; ECHONET, OpenPLANET Jini and HAVi (Home Audio/Video interoperability). Of these, ECHONET is the most mature standard and includes the most detailed information-device control procedures. The ECHONET Consortium currently controls the establishment of the ECHONET standard. All internationally competitive electronics makers are participating in this consortium.
The main energy efficiency issue is the balance between the amount of savings and the additional energy requirement to power to network system. For example, with

34
ECHONET, the communications interface overheads in each of the connected appliances could be between 3–6 watts permanently on. It is highly likely that this technology will suffer a delay in coming to market (expected between 2010 and 2015). This is because:
• the likelihood of problems during the establishment of the communications standard is high (a large number of important stakeholders is involved in the negotiation of the cross-product standard) (eg if one company suspects the communications platform may favour another manufacturer);
• the impact of any disagreement is high – without one of the major appliance manufacturers, the potential improvements that could be made may diminish considerably.
Key Characteristics Unit Value Comments Margin investment cost/unit*
£ 500 Network management software and installation (network communication hardware is built-in to appliances e.g. wires/wireless/radio)
Annual energy consumption
MWh 0.4
Assuming 10 appliances are networked, each containing network interface hardware that consumers 4.5 Watts each, constantly on.
Operating and maintenance (O&M) costs/year
% 10
Percentage savings % 20 Savings from overall consumption of appliances connected to network
Other and additional cost savings
£/year N/A
Utilisation or seasonal efficiency
% N/A
Availability Date 2020 Plant lifetime Years 10 Payback Years 2 Fuel split % Electricity Network technology is powered by
electricity, similar to existing computer networks.
* This measure takes into account the saving compared to the existing technology Key Players
• UK – Smart Homes Research Group, Robert Gordon University, University of Sussex and Queens University, Belfast
• Universities overseas – University of Tokyo • Organisations – ECHONET, OpenPLANET, Jini and HAVi • Manufacturers – Sony, Nokia, Hitachi, Sanyo, Toshiba, Panasonic, Philips,
IBM, Delonghi, Dell, HP, Apple, Pioneer, Smeg, Indesit, Technics etc

35
Technology Development The development of home network technology primarily focuses on the advancement of a communications protocol that enables appliances to communicate with each other across a network using the agreed standard. Research into a number of communication architectures and negotiations with product manufacturers is ongoing. Implementation of the necessary foundation technologies and components required to make the appliances comply with the standard will begin once the standard is set. The networked products will then be developed. Blue skies research
Industrial R&D
Full-scale prototype
A-model prototype
Series production
Mk II design
Long-run series production
2005 2005 2010 2015 2020 Carbon Summary Date/data CO2
(kt/year) CO2 (£/t)
Comments
2010 0 0 Assuming a 20% energy saving in 0% of UK households and a demand of 575.69 TWh
2015 0 0 Assuming a 20% energy saving in 0% of UK households and a demand of 594.91 TWh
2020 1,457 -25 Assuming a 20% energy saving in 5% of UK households and a demand of 594.91 TWh
2050 13,870 -47 Assuming a 20% energy saving in 45% of UK households and a demand of 594.91TWh.
Technology Impact Assessment 1 Estimated UK Economic Benefits Score 5 The scope for development of the consumer products and appliances within a home network is low, as they are mostly developed in the Far East though there are a few exceptions of multinationals that assemble products in the UK (eg Indesit assembles ‘white’ goods and the Lyne Group assembles consumer electronics). However, some small scope does exist for the development and licensing of the software required to run and operate those home appliance networks that are controlled centrally by a household computer. This could potentially sustain between 100 to 250 jobs in the UK, with an annual revenue of around £150 million (assuming that the UK supplies software to 500,000 households/year).

36
2 Scope for Government Action Score The major players are Japan and the USA, together with some European counties. This means that the UK Government’s influence over the establishment of an appliance standard is low. However, if and when a standard is agreed and compatible models become commercially available, the Government could play an important role in ensuring high network penetration within the UK market, eg using legislation such as the Energy Efficient Commitment (EEC) to work with utility suppliers and others to promote those appliances, which include the networking technology. A public communication strategy, similar to the UK Government’s ‘broadband’ television campaigns would help to ensure that the public is aware of the cost savings and environmental benefits of home appliance networking. Public advice on how to set up the networks and the software required could potentially be subsidised by climate change/energy efficiency programmes. Current Defra programmes such as the Market Transformation Programme (MTP) could help to promote and project the benefits of introducing policies that promote this technology. 3 Market Entry Score 4 Market penetration of smart home network technology is expected to be insignificant in the short to medium term (up to 2020). The main barriers to growth are affordability, the lack of an established product communications protocol and the shortage of skilled staff. In the longer-term (2020–2050), higher penetration of home appliance networks combined with local or on-site fuel-cell base micro-CHP electricity generation will contribute to the reduction of the domestic sector’s carbon load. Wireless network technologies will act as a significant catalyst for full integration of smart home appliance networks at an earlier date. The main barrier to market entry is the absence of a universal communications protocol that will enable all products connected to the home network to communicate and be controlled by a central system. Although major advances are being made, a standard is unlikely to ratified fully by at least 2010. On this basis, compatible technology should be available from between 2015 and 2020. Market take-up within the domestic sector will depend on other factors such as support from Government and the availability of skilled labour to install the systems. The following market penetration levels are estimated:
• 2010 – 0% of UK of households; • 2015 – 0% of UK of households; • 2020 – 5% of UK of households; • 2025 – 20% of UK of households; • 2050 – 45% of UK of households.
Commercially, the principal driver for this technology will be the proportion of the UK population who will want the convenience and security of a ‘smart’ home and energy efficient environment. The elderly and disabled are two groups that could find particular benefit to their quality of life.

37
4 Risks Score 3 Home appliance networking is associated with a high level of risk due to the potential problems identified above which could prevent commercial progress by the projected 2010–2015 time frame. This is evident from how long the idea has been discussed with only related, smaller innovations becoming commercially available. These have focused on individual product groups including:
• intelligent power extension plugs that turn-off automatically those devices such as televisions, music centres and video recorders that are ‘plugged-in’;
• infra-red motion sensors controlling lights; • digital meters that show exactly how much electricity, gas or water is being
consumed in real-time; • intelligent heating control systems using advanced temperature sensors to
control spatial heating based upon internal and external ambient temperature;
• smart washing machines, which use about 50% less energy and water, using intelligent sensors to detect water levels and temperature, and thus helping to keep the weight load of the laundry within the machine balanced.
The increase in market share of such innovations and improvements to existing appliances could reduce the reason for consumers to invest in a home appliance network. The timescale over which a consumer might purchase these products could be more than ten years; this would increase the payback for additional investments by manufacturers. The only potential environmental risk is if consumers replace an existing appliance with the new, networked version before the end of its life, thus potentially increasing the amount of hazardous waste and the need for the recycling/disposal of the old appliance. In practice, the proliferation of additional smart devices including automatic sensors, digital meters and remote control working through an ‘always on’ control centre could lead to a smart home background or standby energy requirement that could potentially outweigh the savings made through the more efficient power management of appliances connected to the network. For example, with ECHONET, the communications interface overheads in each of the connected appliances could be between 3-6 Watts permanently on. Network security is a potential issue if using a general packet radio service (GPRS) or a 3G-enabled personal data assistant (PDA) or a mobile phone to control the household system remotely. Internet access is also not secure enough to connect the system. This means that a secure connection would require a master interface with its own dedicated phone card. It has suggested solving this problem by using the completely secure digital TV set-top-box (STB) as the master interface; such boxes are already installed in 50% of UK homes. In addition, the operating and maintenance needs for central control and appliance monitoring could be substantial. Again, the solution of ‘piggy backing’ the central control and network set-up already installed by Sky could overcome these problems. The potential impact that home networking may have could be lessened by general

38
energy awareness rising to a level which will see some of the networking savings eliminated before the networking has an impact. Carbon Dioxide Reduction Questions 1 Carbon Dioxide Reduction Score 8 The scope for networked appliances making energy and CO2 emission savings in the domestic sector in the UK is huge. Domestic demand accounts for around 30% of UK demand – a total of 557 TWh in 2005. Assuming that an appliance network could save some 20% of the energy consumed by its components, the likely amount of carbon dioxide which could be saved is as follows:
• 2010 and 2015: 0 tCO2/year; • 2020: over 1,450 ktCO2/year (assuming a market penetration of 5% of UK
households and a demand of 594.91 TWh); • 2050: nearly 14,000 ktCO2/year (assuming a market penetration of 45% of
UK households and a demand of 594.91 TWh). 2 Market Penetration Score 5 Market penetration of home appliance networks between 2010 and 2015 could be quite high due to the already high number of PCs, and laptops in UK homes (around 70% of the total housing stock) and the wide uptake in home networking of computer devices. Current legislation (eg Energy Star and ecolabels) could help to promote network-compatible products and increase the rate of installation of appliance networks in homes. The clear cost benefits from setting up such systems in their homes will motivate consumers if publicised properly. However, the rate at which the market will grow could be limited due to the long lifetime of some devices. 3 Additional Benefits Score 5 A number of additional benefits might arise from supporting this technology, including:
• Increased safety within the home – the systems could detect, fire, gas leaks and faulty electrical connections using appropriate, heat, gas and electric detectors. The alarm could be given to occupants and the local emergency services alerted, thus reducing the risk of serious harm, injury or death within the home.
• Appliance maintenance – by connecting each appliance to the manufacturer through an external link with the system, a repairman can be sent automatically if a defect is detected. This would eliminate the need for most service calls and involve fewer trips to households to diagnose problems, thus avoiding further CO2 emissions.
• Contribution to wider goals of sustainability – in particular increasing awareness and those participating in sustainable consumption and production (SCP).
• Smart homes have the potential to enable elderly and disabled people to lead independent lives in their own homes. However, the devices and their interactions need to be chosen and designed in such a way that the system as a whole meets the householder’s specific needs. It is the task of the process facilitator, in consultation with the client, to define the precise functionality

39
required. • Added comfort within the household, increased leisure time and
improved quality of life at no expense to the environment. Summary Home appliance networking aims to connect together all consumer products that use water, electricity or gas into a single system using a household communications network. The system could connect all types of household products, including consumer electronics, household appliances, water and spatial heating systems, security systems and lighting. The scope for networked appliances making energy and emission savings in the domestic sector in the UK is huge. This technology could save between 20 and 40% of domestic energy use, depending on the number of appliances connected to the network. The UK Government’s influence over the establishment of an appliance standard is low. However, the Government could play an important role in ensuring high network penetration within the UK market through legislation such as the EEC. Home appliance networking is considered to carry a high level of risk. Market penetration of home appliance networks between 2010 and 2015 could be quite high due to the already high number of PCs and laptops in UK households. A number of additional benefits may arise from supporting this technology including:
• increased safety within the home; • automated call-out for appliance maintenance; • increased awareness and practice of sustainable consumption and
production. References ECHONET Consortium, www.echonet.gr.jp/english/ OpenPLANET, www.openplanet.co.jp Jini, network technology, www.sun.com/software/jini/ HAVi (Home Audio/Video interoperability), www.havi.org/ Energy Efficient Commitment, www.defra.gov.uk/environment/energy/eec/ Market Transformation Programme, www.mtprog.com BNXS07 Demand side energy management in households for a low carbon load. Market Transformation Programme Briefing Note. Home networking, October 2004. Renesas Edge, www.renesas.com Smart appliances spur demand. January 2004. www.aseemblymag.com

40
Consumer durables, GHS 2003, National Statistics, www.statistics.gov.uk

41
Appliance Technology Organic light emitting diode screens Overview In 1989, research into the optical properties of polymers at Cambridge University led to the discovery of polymer light emitting diodes (PLEDs). This discovery led to the realisation that PLEDs could be developed for commercial applications such as display screens. The ability to use materials that could be compacted into a thin screen soon became evident and organic light emitting diode (OLED) development began. A key advantage of OLED technology is that it offers the potential for lower energy during manufacture and operation. The potential for OLED has led to the foundation of spin-out companies from both Oxford and Cambridge Universities. Subsequent investment and partnerships with global manufacturing companies have successfully led to the establishment of a technology that can offer significant carbon dioxide savings and other environmental benefits. Technology OLED technology uses a screen where the active picture elements (pixels) consist of organic materials. These pixels emit light once energised to form an image in the same manner as liquid crystal displays (LCDs). Unlike LCDs, a back light source is not required. The technology also has the advantage of cheaper manufacturing costs as it uses ink jet printing technology to imprint the light-reactive materials onto a film substrate. If this method can be developed successfully, it has the potential to reduce production costs dramatically for screens that will have comparable picture quality to rival technologies such as light emitting diodes (LEDs), plasma and field effect diodes (FEDs). The technology is still under development, although information from the Market Transformation Programme reveals that 48-inch prototypes have already been tested. An important advantage of this technology is the significant reduction in energy demand compared with LED technology, which requires back lighting. The potential flexibility of the display screen could increase the versatility of OLED-based systems and enable use in several systems e.g. computer monitors, giant displays and other projection purposes (although this will be subject to an environmental versus commercial argument, where energy requirements will have to be compared between the advertisement tools on a holistic basis. With the OLED being designed to reduce energy use initially, this will be an interesting argument). This technology assessment looks at the application of OLEDs in the domestic sector as screens are being developed for this purpose at present however possible future applications of OLEDs could include computer monitors and giant displays. Markets

42
The main market for OLED screen displays will be for primary domestic televisions (ie large screen systems), which most households have in the main living room or communal room. Additional secondary small units, which are watched in other rooms, are likely to use different technologies. The number of primary televisions today in the UK is approximately 24 million; current market projections indicate that this will gradually rise to 25 million by 2020. The Market Transformation Programme (MTP) indicates that commercial OLED televisions will be available by 2010 and firmly established within three to four years. By 2020, over 50% of the domestic television market is expected to be OLED televisions. The size of the market beyond this date is more conjectural, but with economies of scale, lower production costs and further incremental improvements may reach 85% by 2050. The European market could reach 180 million units assuming the same level of ownership as in the UK and 600 million units worldwide (assuming 10% of the world’s population owned one set). Issues/Challenges The key challenge facing this technology is to improve picture quality, particularly colour bleed. This problem is believed to have been resolved, with picture quality able to rival LCD displays. Organic materials may deteriorate and thus have a comparatively limited technical life, although the lower production costs (which may be further reduced if manufacture uses more mechanisation on the production line) will give a lower product cost and may make more frequent replacement more acceptable. OLED will also face competition from FED televisions. The advantage of an FED system is that it has the potential to combine the contrast of a high quality cathode ray tube (CRT) system with the control of a digital signal. FED systems also have a slim 2–3 cm profile, but use marginally more energy than an OLED. It is not known whether FED systems are more advanced or further from commercial availability compared with OLED systems. However, FED systems do have the potential to compete actively with OLED systems.

43
Key Characteristics
Unit Value Comments Margin investment cost/unit*
£ 2–16 The (annual) value depends on the technology displaced. High values are for plasma/LCD televisions and low values for CRT televisions. In both cases, the comparison is based on OLED when it reaches maximum power saving potential.
Annual energy consumption
MWh 0.2–0.75 Range reflects the anticipated consumption when the technology is first launched and when it becomes fully established.
Operating & maintenance (O&M) costs/year
% No costs are assumed. System or screen replacement may be ~7 years.
Percentage savings % 25–75 The lower end of the range compares OLEC technologies with its closest rivals when launched (ie plasma/LCD). The higher end of the range is the potential saving when the technology becomes commercially established.
Other and additional cost savings
£/year Difficult to quantify, but may come from lower production costs and the use of degradable or recyclable materials leading to lower disposal costs.
Utilisation or seasonal Efficiency
% 27 Assumes 6.5 hours of use per day (MTP estimate)
Availability Date 2010 MTP estimate Plant lifetime Years 7 MTP estimate Payback Years 31 Assumes maximum power potential saving
compared with plasma/LCD valued at 2 pence/kWh.
Fuel split % 100 Electricity
* This measure takes into account the saving compared to the existing technology Key Players Cambridge Display Technology (CDT) is the lead company in this field in the world. Following venture capital investment in 1997, CDT formed a joint venture in 1998 with Seiko-Epson to combine PLEDs with ink jet printing. Further venture capital investment and acquisition has allowed the company to develop a dedicated R&D centre in the UK. In 2002, CDT acquired the Oxford-based Opsys Limited to add its dendrimer OLED technology to its portfolio. In the same year, small consumer products begin to incorporate PLED display screens. The company has continued to expand and has begun limited manufacturing using ink-jet technology. It also has a partnership with the Japanese company, Sumitomo Chemical, to develop high efficiency materials for low power applications.

44
Technology Development OLED technology is proven, however it is not yet commercially available. Since the discovery of the light-emitting properties of polymers in 1989, there have been considerable technical advances. However, research is still required to improve the performance of the polymers and other materials used in OLED screens. Further work is also required to ensure consistent quality during manufacturing using ink jet printing technology. Blue skies research
Industrial R&D
Full-scale prototype
A-model prototype
Series production
Mk II design
Long-run series production
2005 2010 2015 2020 Carbon Summary Date/data CO2
(kt/year) CO2 (£/t)
Comments
2010 0 0 CO2 estimate based on percentage market split for different TV display technologies and their estimated annual power consumption in 2010 with and without OLED. The estimated number of primary TVs in UK is 24 million. The scenario without OLEDs assumes their market share is taken by FEDs. The marginal cost of TVs has been set to zero because new TVs will be purchased irrespective of their energy- saving properties. CO2 conversion factor = 435 tonnes/MWh.
2015 751 0 Figures for 2015 have been interpolated as a mid point between 2010 and 2020.
2020 1,503 0 CO2 estimate based on percentage market split for different TV display technologies and their estimated annual power consumption in 2020 with and without OLED. The estimated number of primary TVs in the UK is 25 million. The scenario without OLEDs assumes their market share is taken by FEDs. The marginal cost of TVs has been set to zero because new TVs will be purchased irrespective of their energy-saving properties. CO2 conversion factor = 371 tonnes/MWh.
2050 2,460 0 CO2 estimate based on percentage market split for different TV display technologies and their estimated annual power consumption in 2050 with and without OLED. The estimated number of primary TVs in the UK is 26 million. The scenario without OLEDs assumes their market share is taken by FEDs. The marginal cost of TVs has been set to zero because new TVs will be purchased irrespective of their energy-saving properties. CO2 conversion factor = 371 tonnes/MWh.
Technology Impact Assessment 1 Estimated UK Economic Benefits Score 4 The discovery of PLEDs and the subsequent development of OLEDs for

45
commercial applications is a significant UK success story. The formation of a dedicated research and development spin-out company has enabled a discovery from academic research to be converted into a new display screen technology which can be operated at much lower energy levels compared with similar technologies. This transition has also demonstrated that a combination of investment and partnership has ensured a lead position for the UK in display technologies. The original PLED concept has the potential to be developed further in areas such as interactive displays on consumer packaging or lighted wall displays. CDT uses the expertise it has developed from PLED technology to form partnerships. It has licensed its technology to companies that manufacture devices with small displays. CDT offers support to companies setting up their own production facilities. This is potentially a large market, which can be exploited while retaining intellectual property (IP). CDT now works with global multinational like Dow Chemicals, Phillips and Epson. Epson has used its inkjet technology to produce OLED display screens and claims that a large screen display suitable for home entertainment could be available by 2007. The challenge for the UK will be to transfer R&D into large-scale manufacturing. The UK is more likely to benefit from more specialist manufacturing, training and supply of OLED materials. The estimated benefit to the UK economy is hard to quantify accurately because OLED can be used for a number of different applications. If all related activities (including the supply chain) are included, we estimate this benefit to be around 2,500 jobs with a £500 million turnover, at least by 2010. 2 Scope for Government Action Score A brief review of research in the UK indicates that further optimisation of OLED by improving the interface between the polymer substrates and the semiconductors could yield greater performance dividends. Other areas of research include the improvement of manufacturing such that nanoscale precision of materials can be achieved during manufacture. This research is currently underway at the Cavendish Laboratory (part of Cambridge University) where PLEDs were first discovered. Interdisciplinary research in related fields is also taking place at University College London and Bristol University. The key challenge for this technology is to improve resolution and quality so that OLEDs can match rival technologies. It is clear that the UK has a very good research base in this technology and has been able to exploit its commercial potential by retaining IP and licensing the application. The magnitude of OLED technology potential is huge. However, it is clear from CDT’s experience that exploitation depends on partnership with large multinationals that either make the materials (eg Dow Chemicals) or use manufacturing techniques such as ink jet printing (eg Epson). There are some UK-based companies, eg Avicia, that have diversified into high-value materials production and which could form suitable partnerships. Given the success of CDT and the establishment of a sound UK research base, the Government’s role is likely to be most effective by continuing to support

46
university-based research. CDT has grown through a mixture of venture capital and stock funding. Public sector support does not seem appropriate or might not be allowed under state aid rules. However, the UK Government could help to develop OLED technology by its active procurement for Government offices or other public buildings. This would demonstrate that quality images could be produced with less energy, thus helping to stimulate the home market. 3 Market Entry Score 3 The main barrier to market for large OLED display screens is the need to improve quality. However, there is also the potential competition from other technologies and particularly FEDs. The application of OLEDs and the related manufacture is now global, therefore the benefits to the UK economy are likely to come from retaining IP, developing or improving materials, and ensuring that as much of the supply chain can be sourced from the UK. Manufacturers are likely to use low-cost producing countries in Asia to produce OLED TVs. The lead company in this field, CDT, has already expanded into specialist collaborative development and training to add value to its IP. The most effective role for the UK Government would be to encourage further collaboration in a brokerage capacity. Fundamental research that underpins this technology should continue to be supported, partly to maintain a technology base within the UK. The production of consumer durables, particularly large display screen TVs is more likely to be driven by consumer demand, especially if there are novel features at a reasonable cost. The most effective role for Government will be to promote the energy-saving benefits of this technology and other environmental benefits such as the ability to recycle all or part of the TV. A rating system, similar to an EU-wide system adapted for ‘white’ goods could be developed by Government to offer guidance to consumers. These initiatives will help to encourage a switch to low energy devices. There is also a significant market opportunity as the move to total digital broadcasting becomes closer. 4Risks Score 5 Current MTP projections indicate that there are considerable environmental benefits from using OLED technology, primarily from the reduced energy demand and consequent reduction in carbon dioxide emissions. Current MTP research suggests a fall in operating energy demand of over two and half times for the initial commercial models compared with today’s models. This may, however, be too optimistic. Manufacturers will need to consider the need for recycling without compromising the functionality of the materials used in the assembly of the display screen or other components. It is possible, although not known, that the polymers might be degradable. The biggest technical risk is that the scale-up for large format screens may not be as good compared with other technologies. As OLED is still in development for TVs, this risk may not be significant, but this cannot be known for certain.

47
The biggest commercial risk comes from rival technologies, particularly FED. OLED must also compete with established LED and plasma technologies, and may take longer than anticipated to break into and displace established products. Experience with other electronic goods for the domestic market has shown that, provided quality and price competitiveness are evident, new technologies will displace conventional systems. Television and personal computer replacement both operate within comparatively short time frames, which encourages high turnover. Moreover, OLED has potentially very wide commercial applications in both recreational and industrial markets. The key institutional risk is the retention of existing IP and the probable necessity to retain new patents on materials or systems under development. Rival LED technologies are already under development, eg by Eastman Kodak. This could act as a spur to match competitive products, but could threaten the UK intellectual base in OLED technology. Carbon Dioxide Reduction Questions 1 Carbon Dioxide Reduction Score 8 The amount of carbon dioxide saved by the introduction of OLED display technology for home televisions has been estimated by calculating the total carbon dioxide emissions for primary television use in the UK in 2010, 2020 and 2050. Two scenarios have been used: one with a market split including OLED and the other assuming OLED technology is displaced completely by FED display screens. The value for 2015 has been interpolated as a mid-point between 2010 and 2020. The estimates also assume a market split between different display screen options and their estimated annual energy demand. The number of domestic units is assumed to be 24 million in 2010 rising to 25 million by 2020. All base data for 2010 and 2020 have been taken from MTP Briefing Note BNTV1 Changes and Issues in Television Technology. Projections to 2050 are conjectural. Our calculations show that, for OLED, the energy consumption per unit is likely to fall from the anticipated 750 kWh/year to below 200 kWh/year once the technology becomes commercially established. It has been assumed that, when the technology is introduced in 2010, the energy consumption would be 750 kWh/year, but would fall to 250 kWh/year by 2020 and to 200 kWh/year by 2050. In 2010, when OLED technology reaches the market for primary domestic televisions sets, there will no be difference in the levels of carbon dioxide emitted. By 2020, however, over 1.5 million tonnes/year of carbon dioxide would be saved and nearly 2.5 million tonnes/year would be saved by 2050. The cost of carbon dioxide assumes that new televisions would be purchased as a matter of course as old display technology becomes redundant. The marginal cost for carbon dioxide abatement has therefore been assumed to be zero. 2 Market Penetration Score 6 The market penetration for OLED technology has been estimated by the MTP. In 2010, OLED televisions would comprise only 2.5% of the total number of

48
televisions in the UK but, by 2020, the market share would rise to 54%. Projections to 2050 are conjectural, but have been assumed to be 85% with the remainder coming from FED technology. The high market penetration is attributed to the ability to mass-produce OLED screens using printing technology. Product lifetime may fall as the technology evolves, leading to replacement within seven years. However, these projections assume that OLED will be able to compete on quality as well as price. Market projections are based on MTP intelligence for primary domestic televisions and do not cover smaller portable TVs. The number of televisions remains relatively constant with approximately 24 million in 2010 rising to 25 million by 2020. By 2050, it has been assumed the rise would continue to 26 million to account for the general increase in the UK population and an increase in life expectancy. The success and likely penetration of OLED televisions will depend on their ability to compete with rival technologies especially FED systems. The estimated energy consumption for OLED is also projected to fall as the technology improves and with growing market share. Analogies with other electronic consumer durables suggest that, provided the quality of OLED can be maintained and that screens can be produced cheaply, market share should expand and displace established technologies such as CRT which are more energy- and resource-intensive to produce. The market for OLEDs will also be driven by applications in other fields such as active display screens, wall lighting and control panels. In common with other electronic consumer products, the potential market is global and likely to grow given the widespread applicability of OLED technology. 3 Additional Benefits Score 4 In addition to reduced carbon dioxide emissions, the production of OLED display screen will offer some other environmental benefits. The ability to use printing techniques and organic-based polymers should increase the proportion of materials that can eventually be recycled. Some caution needs to be applied, however, because new materials with better functional properties may not necessarily be suitable for recycling. Energy costs for production should be considerably lower compared with conventional CRT devices. OLED displays have widespread applications and could be used in less energy-intense interactive displays for advertising, safety notices, control or information screens, etc. For example, the ability to reduce screen thickness means that display screens to do not need to occupy much space and could easily be wall-mounted. For domestic applications, this functionality could be used to convey information about energy use or water demand without excessive intrusiveness. The ability to provide useful information could help individual householders or businesses to gain a better understanding of energy use and thus reduce their energy use. Summary OLED is a technology that exploits the light emitting properties of polymers and can be used in display screens. One of its main advantages is the ability to reduce energy consumption in both manufacture and operation. The technology is not yet

49
commercially available, but current projections suggest that OLED televisions could be commercially available by 2010. If projected estimates of the properties of OLED televisions systems are accurate, carbon dioxide emissions directly related to the use of primary domestic televisions could be reduced 56% by 2050. The light emitting properties of polymers were first discovered in the UK in 1989 and have been subsequently successfully commercialised through dedicated spin-out companies from academia. Much of the development funding has come from venture capital and, more recently, flotation. At least one UK company has formed collaborative partnerships with multinational companies. Given the demand for electronic display screens in the UK and global markets, there would appear to be a strong market pull without governmental initiatives. Further support from the UK Government for continued fundamental research may help with improvements to the existing technology. The promotion of energy efficiency benefits would help to stimulate the environmental benefits and therefore market uptake. The benefits for manufacturing are likely to be more limited; however, licensing, training and bespoke assistance to manufacturers will help to retain employment and IP in the UK. References BNTV1: Changes and Issues in Television Technology. Market Transformation Programme Briefing Note. www.mtprog.com/approvedbriefingnotes/BriefingNoteTemplate.aspx?intBriefingNoteID=342 Simulation of electrical transport in organic electroluminescent devices, University of Bath, www.bath.ac.uk/~pysabw/research/organics/organic.htm Cavendish Laboratory, University of Cambridge, www-oe.phy.cam.ac.uk/fet/research.htm Organic semiconductors and nanostructures at UCL, www.cmmp.ucl.ac.uk/~fc/Organic_semiconductors.htm Explanation of basis for light emitting polymers (LEPs) www.chemsoc.org/exemplarchem/entries/2002/howell/LEPs/future.html Cambridge Display Technology, www.cdtltd.co.uk

50
Industrial Energy Efficiency Technology Low-cost, adaptive and robust model-based boiler monitoring and control systems Overview Over 20% of the total energy consumed by UK industry is used to produce steam for process heating, and space and water heating. Industrial steam boilers are often fitted with simple on-off control systems, or they may have basic sequence controllers that attempt to match steam production to steam demand. These controllers are generally adequate where steam demand is fairly predictable, but for the majority of industrial sites, substantial energy and carbon savings could be realised by fitting a more advanced form of boiler monitoring and control system. Adaptive, model-based predictive controllers are a new type of model-based predictive control that adapt to changes in sensor characteristics and operating patterns. This feature reduces the level of customisation and maintenance needed to implement feedforward-based boiler-control systems rather than the traditional feedback-based ones. Existing (non-adaptive) model-based predictive controllers have been used to improve the control of very large boiler and power generation systems at petrochemicals sites. In these cases, energy savings of between 6% and 8% have been realised by predicting likely steam demand and more closely matching steam generation to it. However, due to the amount of customisation required to implement this technology, it is fairly expensive. If a low-cost, adaptive and robust model-based predictive boiler control system was developed, it could deliver savings of around 270 ktCO2/year at medium to large sites in the chemicals, food and drink, and paper and board sectors. Some R&D has been carried out on this at UK universities, but the work has stalled due to lack of industrial funding. Technology Model-based predictive control (MBPC) is an advanced control technique that has been widely used to optimise petrochemical refining processes. To a lesser extent, it has also been used to improve the control of organic chemical processes, cement kilns, paper machines and sugar refining. MBPC systems are sold in the UK by Aspentech, Honeywell, Emerson Process Management and Invensys. MBPC technology has also been used by Honeywell to improve the control of very large boiler and power generation systems at petrochemicals sites in Germany, the USA and SE Asia, where energy savings of between 6% and 8% have been realised by predicting likely steam demand and more closely matching steam generation to it. From its UK service centre, Alstom has also used similar model-based systems to remotely monitor 20 power stations around the world and to identify turbine faults. At present this technology is fairly expensive (@ £100,000 to 200,000/plant), but potentially it could deliver substantial carbon savings if a low-cost version could be developed for medium to large sites across several industrial sectors. A low-cost, adaptive and robust model-based control system that could be used easily by boiler manufacturers and service engineers could help achieve this.

51
Adaptive model-based predictive controllers are a new type of model-based predictive control that adapt to changes in sensor characteristics and operating patterns. This feature reduces the level of customisation and maintenance needed to implement feedforward-based boiler control system rather than the traditional feedback based ones. The development of adaptive-based predictive controllers has been the subject of extensive research in UK universities. The main applications so far have been in the field of military robots and weapon systems, apart from one R&D project where an adaptive controller was used to overcome a sensor problem on an industrial dryer, and feasibility studies on a coal-fired boiler and a district-heating scheme. These projects were of limited scope, but demonstrated that the technology can be used to improve the sequencing of steam boilers to satisfy variable load conditions. (Note: Confusingly, some US companies also use the term ‘adaptive model-based control’ to describe control systems based on neural networks which use ‘black-box models’. Unfortunately, these systems are not robust enough for this application, which requires a mathematical model of the boiler to maximise energy savings). Markets The main application for low-cost, adaptive model-based predictive boiler-control systems would be on industrial steam boilers. These account for at least 20% of industrial energy use and are used across a wide range of sectors, including chemicals, food and drink, paper and board, rubber and plastics, textiles and laundries, and iron and steel. Initially, the technology is likely to be retrofitted to existing boilers sized over 10MW. However, in the longer term, it could equally be applicable to smaller boilers, provided they are installed during initial boiler manufacturing (along with modulating burners). The estimated size of the UK market is around 10,000 units (@ 80% penetration). The technology would also be widely applicable in other industrialised countries and the total market for the technology could be 15-20 times as large as the UK market. Initially, the most significant EU markets are likely to be Germany, France and Italy. Issues/Challenges The main issues that need to be addressed are:
• the boiler industry is very conservative and resistant to the introduction of new control technology - control technology is often the weakest point of the boiler system specification, as the result of capital cost-reduction measures;
• there is very little market pull for the technology – as the specification and operational efficiency of steam boilers are not regulated as tightly as space heating boilers (EU ETS and IPPC apply only to largest units over 50 MW);
• to reduce capital costs, boiler and burner manufacturers are currently manufacturing products in Eastern Europe. This means they are not investing in R&D projects to develop the next generation of the technology.
These barriers are primarily economic ones, although most have a behavioural aspect linked to the attitudes of industrial end-users, who now increasingly consider

52
steam to be just another non-core service that should be available and purchased ‘on demand’. Thus, lowest capital cost dominates most purchasing decisions for boiler control systems. Key Characteristics
Unit Value Comments Margin investment cost/unit*
£ 50,000 Assumes adaptive MBP controller can be developed to minimise customisation costs.
Annual energy consumption
MWh 78,840
O&M costs/year % 10% Percentage savings % 2-6% Average 3% improvement Other and additional cost savings
£/year 4,000 Operation depends on sensors being cleaned regularly and on controller tuning.
Utilisation or seasonal efficiency
% 90%
Availability Date 2015 Plant lifetime Years 10-15 Linked to burner replacement cycle. Payback Years 2 1 to 3 years depending on boiler size. Fuel split % 0% electricity
100% fossil Mostly gas, possibly oil, maybe even coal if robust enough sensors can be developed.
* This measure takes into account the saving compared to the existing technology
Key Players Universities:
• Manchester University – developed MBPC algorithms used by Invensys; • Strathclyde University – large R&D team with MBPC application expertise; • Leeds, Sheffield, Cardiff – undertake R&D on boilers and steam systems; • University of Glamorgan – has done one feasibility study on a coal fired
boiler; • Queen’s University Belfast – has done pilot on district heating scheme.
Manufacturers:
• Honeywell, Invensys, Emerson Process Management – MBPC vendors; • Dunphy, Hamworthy Combustion – leading UK burner manufacturers; • Babcock, Futton, Byworth – steam boiler manufacturers.
Most of these boiler and burner manufacturers have substantial export businesses, particularly to the EU, but also to commonwealth countries. The MBPC vendors are mostly US-based multinationals, although most have some R&D facilities in the UK. Technology Development There are still potential gaps in the innovation chain. In recent years, the funding available to universities for the development of new control algorithms for industrial applications has been cut, and the UK’s leading research centre at Strathclyde University has struggled to find industrial and military co-funding for work on moving new algorithms from theory into commercial application. This is a very expensive process (<£5-10 million), so much of the earlier R&D work remains unused. Status in 2005: Development stalled between blue skies and industrial R&D. Blue skies research
Industrial R&D
Full-scale prototype
A-model prototype
Series production
Mk II design
Long-run series production

53
Done 2010 2012 2015 N/A 2018 2020
Carbon Summary Date Penetration
(%) CO2
(kt/year) CO2 (£/t)
Comments
2010 0 0 -19 Technology not commercially available until 2010
2015 3 17 -21 Large steam boilers 50MW+ 2020 10 56 -23 Medium steam boilers 20MW+ 2050 50 267 -19 Smaller steam boilers 3MW+ Technology Impact Assessment 1. Estimated UK Economic Benefits Score 4 The UK is well placed to develop the technology as its universities have substantial expertise on the development and application of MBPC. There are also a number of vendors who could develop and apply the technology (including some SMEs), but uptake would be substantially faster if one of the major process control companies were to commercialise it. Its development might also create between 500 and 1,000 jobs in the UK boiler manufacturing and servicing industry, and in process control companies. Market take up of the technology is likely to be primarily driven by EU and UK regulations, particularly of NOx and carbon emissions (or energy efficiency).
2 Scope for Government Action Score The UK is still home to some of the World’s leading steam boiler design teams and UK universities have a good track record in developing/applying new control techniques. Unfortunately, there has been relatively little funding for R&D in the boilers area over the last ten years so research teams have broken up and test facilities fallen into disuse. However, these facilities could be reinstated if the UK Government injected core funding to support R&D in a new generation of control systems for industrial boilers. There may be a possibility that this could be promoted as an EU project, although the possibility of joining it with new boiler design (item 1) would be an unlikely option as the two projects would be incompatible in size terms. Better regulation of steam system design and operational efficiency would also ensure that industrial sites invested in higher specification boiler monitoring and control systems. Unless regulatory action is taken to improve the operational efficiency of steam systems, it is unlikely that there will be sufficient market pull to bring the technology to the marketplace in the near future in a manner that would ensure widespread application outside large sites.
3 Market Entry Score 3 The main barriers to entry are the relative complexity of the technology compared with traditional boiler control systems, and the structure of the boilers market, which is very fragmented and dependent on a diverse network of installers and design consultants. This network has, in the past, proved very resistant to the introduction of

54
new technology. However, over the last few years, a few leading UK boiler and burner manufacturers have bypassed their installer network and now sell directly to larger customers. Another barrier is the lack of market pull for new technology in the boilers area. All too often, end-users do not appreciate the potential benefits of investing in new control technology or the impact of poor boiler efficiency on their operating cost base. Here again, improved regulation of steam boiler operation would generate market pull for new boiler control technology. It would stimulate the development of specialist maintenance services such as an Alstom-style remote monitoring system for industrial steam boilers. Here, there is scope for the Government to stimulate market pull through support for industrial R&D and through demonstration projects that illustrate the costs and benefits of the technology over the life cycle of the boiler. Additional investment in training in control technology for installers and specifiers would also increase market penetration.
4 Risks Score 3 The main risk faced by this technology is the relative complexity of MBPC verses existing control systems. Currently, MBPC systems need to be designed, commissioned and maintained by highly skilled control specialists who are currently in short supply. Hence, an easy-to-deploy version of the technology needs to be developed, and additional training given to boiler service engineers to enable them to maintain the new technology and the sensor systems upon which they rely. However, these problems can be overcome if sufficient investment is made in the research phase, and provided new regulations are introduced to require operational efficiency to be remotely monitored. Carbon Dioxide Reduction Questions 1 Carbon Dioxide Reduction Score 3 and 5 As the technology is not expected to reach the market much before 2010-15, it is difficult to provide a detailed estimate of its energy and carbon saving potential. Based on the work being conducted at Honeywell and Alstom, it is clear that the technology could realise substantial energy and carbon savings across industry. An initial estimate of the potential carbon savings that the technology could deliver by improving the control of steam boilers is 267 ktCO2/year. This estimate is based on a marginal additional energy saving of 3% over existing best practice. Beyond this, there is also the potential to apply the technology to larger space heating boilers and the control of utility systems, including refrigeration, CHP and power generation. However, the potential carbon savings in these additional applications are difficult to quantify.
2 Market Penetration Score 2 It is difficult to quantify the likely market penetration, because the technology is only likely to be adopted by medium-sized companies if driven by regulatory requirements. Assuming suitable drivers are introduced, then the technology should be able to achieve a 50% penetration of the energy used in steam production by industry by 2050.
3 Additional Benefits Score 2

55
Model-based condition monitoring is likely to deliver additional benefits including the early identification of potential safety faults such as boiler tube failures and steam leaks. They should also enable tighter regulation of atmospheric pollution, allow manning levels to be reduced and the time interval between safety inspections to be increased. Summary Model-based predictive control (MBPC) is an advanced control technique that has been used by multinationals in a range of process optimisation roles. The technology has also been used to improve the control of very large boiler and power generation systems and to remotely monitor and identify turbine faults in large power stations. At present the technology is expensive but, potentially, it could deliver substantial carbon savings if a low-cost version could be developed to improve the control of steam boilers at medium to large industrial sites. While the basic technology exists, some R&D would be needed to develop a low-cost, adaptive boiler monitoring and control system that could be easily deployed by manufacturers and service engineers. Regulatory measures would also be needed to drive the technology into the market. Estimates of the potential carbon savings that such a technology could realise range between 6-8% depending on the degree of flexibility in the steam generation system. An initial estimate of the potential carbon savings that the technology could deliver by improving the control of steam boilers is 267 ktCO2/year. This estimate is based on a marginal additional energy saving of 3% over existing best practice in boiler control in a wide range of sectors (particularly chemicals and food and drink). The technology could be used in most industrialised countries. References Energy savings using model based predictive control at British Sugar, GPG343. Benefits of advanced controls for industrial drying processes, NPCS 104. Presentations by Alstom Power Conversion at a TCCL Meeting, 16 March 2005. TCCL Ltd is an industrial technology transfer club specialising in intelligent control, which spun out of an Alvey funded R&D project about 20 years ago. Private discussions between Dr. Alan McCullough and Professor Mike Grimble, Industrial Control Centre, University of Strathclyde regarding commercialisation of the next generation of robust, model based predictive control algorithms. Details of previous feasibility studies on the control of coal-fired boilers mentioned in a recent LCIP grant application (reviewed by Dr. Alan McCullough).

56
Buildings Energy Efficiency Technology Micro CHP Overview Combined heat and power (CHP) systems have been available for many years to provide heat and power in the form of distributed generation or district heating with power. A CHP system is generally a combustion engine that produces power in the form of electricity; the heat generated by the process, which would normally be exhausted to atmosphere, is captured and used in heating systems. Depending on the size and type of CHP, the heat can be used for a number of different applications including:
• wet heating systems; • low, medium and high temperature hot water systems; • process steam applications; • absorption cooling.
More recently, there have been developments in the engine used within the CHP system. Although reciprocating combustion engines are still common, there are alternatives that can provide greater efficiencies including Stirling engines, combined cycle gas turbines (CCGT), steam turbines and, most recently for this application, fuel cells. The main applications for CHP have historically been the provision of heating and power and/or back-up power to large offices, hospitals, sports centres, community schemes and industrial facilities, with unit sizes ranging from about 200 kWe to several MWe. Technology The technology considered is micro CHP and its application in the domestic sector. Micro CHP is here defined as being up to 5 kWe. There are several competing technologies based on the type of engine or turbine used as the prime mover. Types of micro CHP include; external combustion engines (Stirling and Rankine), internal combustion engines, and fuel cells. Markets The market sector for the technology is domestic. Both new build and existing buildings are available markets. However, in existing buildings, the incorporation of micro CHP will effectively only happen when the occupant requires a new boiler as it will directly replace the existing approach of having a boiler to provide central heating to the dwelling. Micro CHP utilising reciprocating engine technology has a limited market at present in the USA, Japan and Germany, with commercialisation of the technology due in the UK in 2005. There are currently fuel cell demonstration projects in Japan, the USA and central Europe. Japan has progressed furthest with a significant demonstration programme planned for 2005. Stirling engine technology micro CHP has had limited

57
demonstrations around the world and the technology needs to progress before large-scale commercialisation is possible. Issues/Challenges There are a number of challenges to be overcome if CHP in the domestic sector is to be a commercial success. In general, the cost of CHP is a limiting factor at present, as it requires gas prices to be as low as possible compared with electricity prices for economic viability. This is not currently the case. The CHP has to be sized for electricity consumption and heat consumption within a dwelling. These demands are, at best, intermittent. Because the output characteristics of a CHP unit do not match the load requirements of a dwelling, there have to be compromises when designing and sizing the installation, such that efficiency may suffer. There are also technical issues to overcome with CHP units operating at these low outputs. An adequate lifetime is another issue – particularly with fuel cells, as the fuel cell stack does not have proven durability and lifetime at present. There are also issues of distributed versus grid energy supply and the competition with renewable energy sources (eg building integrated photovoltaics, solar water, building-mounted wind turbines, etc), which are being promoted. There is, however, the potential for using renewables such as wind turbines to generate the power to produce hydrogen to power the fuel cells for micro CHP.

58
Key Characteristics
Unit Value Comments Margin investment cost/unit*
£ High efficiency condensing boiler ~£50/kW Fuel cell ~£2,500/kW Stirling engine ~£2,500/kW Internal combustion CHP ~£900/kW.
Annual energy consumption
MWh
Operation & maintenance (O&M) costs/year
% 5 The nominal O&M costs per year are 5%, but this will represent more than the marginal investment cost.
Percentage savings % Other and additional cost savings
£/year 0
Utilisation or seasonal efficiency
% 30 The value is fairly low as initially this technology would be most appropriate to new build and will take longer to break into the refurbishment market.
Availability Date 2020 Forecast date as to when the market will probably develop. There is scope for significant uptake from this point on.
Plant lifetime Years 15 There are current technical issues with lifetime that need to be resolved.
Payback Years Fuel split % 35 Electricity
65 Fossil Displaces heating and electricity.
* This measure takes into account the savings compared with the existing technology. Key Players Within the UK, the Baxi Group is promoting its SeneTec micro CHP units for the domestic market and BG Group has a micro CHP unit for the domestic market. Neither has had much uptake and both are based on existing spark ignition internal combustion engine technology. Other UK players are;
• Powergen, who launched the Whispergen micro-CHP unit from WhisperTech (NZ) in early 2004 with a mass launch of 80,000 planned for the summer of 2006.
• Microgen who are still in the developmental stages with their unit but are looking to launch in the UK in 2007
In addition, research is being undertaken by a number of groups and networks within the UK, including:
• Nottingham, Birmingham and Cardiff universities (looking at proton exchange membrane (PEM) fuel cells);
• Intelligent Energy (fuel cell based micro CHP systems); • Fuel Cell Network; • London Climate Change Agency; • London Hydrogen Partnership; • the DTI’s advanced fuel cell programme, which makes available grants for
fuel cell projects; • BG Microgen (part of BG Group) is looking at Stirling engine technology
micro CHP along with universities such as Southampton, Durham and Leeds
• The CHPA are also active in the UK.

59
Outside the UK, there are a number of companies conducting research into fuel cell based micro CHP including:
• Vaillant in Germany; • Sulzer Hexis in Switzerland; • Siemens Westinghouse in the Netherlands and USA; • Plug Power in the USA; • Tokyo Gas Co. Ltd, Ebara Ballard Corporation and Matsushita Electric
Industrial Co. Ltd in Japan. This research is looking at either PEM or solid oxide (SO) fuel cell technologies for micro CHP. Although other fuel cell technologies are available, they are not being developed for micro CHP. Collaborative European, Japanese and US demonstration projects have recently begun for domestic micro CHP. In addition, a number of institutions and networks provide information, additional research and collaboration opportunities including:
• the National Fuel Cell Research Centre (NFCRC) at the University of California, Irving;
• the International Energy Agency (IEA) Annex 42 looking at models for integrating fuel cells and buildings;
• the IEA Greenhouse Gas R&D Programme. A number of companies are conducting research into Stirling engine micro CHP around the world, most notably WhisperTech in New Zealand, Enatec in the Netherlands and TM Power Inc. in the USA. Universities involved in this type of research include:
• Lund Institute of Technology, Sweden; • University of Rome, La Sapienza, Italy; • Universität Karlsruhe, Germany.
Technology Development Potential gaps in the innovation chain: The gap, if any, is at the R&D stage where there are presently limited players. Blue skies research
Industrial R&D
Full-scale prototype
A-model prototype
Series production
Mk II design
Long-run series production
2005 2005 2010 2015 2020 2050 Carbon Summary Date/data Penetration
(%) CO2
(kt/year) CO2
(£/year) Comments
2010 2 309 599 R&D and test installations 2015 4 815 711 R&D and test installations 2020 10 2,015 355 Start of market penetration 2050 60 11,260 168 Consolidated market

60
Technology Impact Assessment 1 Estimated UK Economic Benefits Score 5 With regard to fuel cells, the UK is in a strong position with regard to the development of the balance of plant and peripherals (ie those parts of the unit apart from the fuel cell stack). There are fuel cell developers in the UK, but these are presently small in comparison with those in the USA, Japan or Germany. The technology is still at developmental stage, but there are a growing number of demonstration programmes that either started recently or planned for the near future. There is still a need to prove reliability and fuel cell stack lifetime, and there is the potential for the UK to play a large part in this technology. Stirling engine technologies are at the development stage, with some limited demonstration project exposure. There is UK involvement and potential for the future market with both Baxi and BG Group. Micro CHP has been applied successfully in Germany. The UK is currently an emerging market, but it is likely that many of the initial installations will be based on internal combustion engine technology, as fuel cells and Stirling engines are still being developed and tested. 2 Scope for Government Action Score There is a requirement for funding basic R&D to progress the technical issues of fuel cells and to enable UK participants to be competitive with those in other countries where significant funding is being applied (notably the USA and Japan). Funding is also required to commercialise the technology. The cost is currently prohibitive and the only fuel cells that are operating in the UK are either demonstration projects or niche applications. However, there are currently no niche applications in the micro CHP market. Stirling engine technologies require funding at the R&D stage and also to promote demonstrations to achieve a commercial product and to maintain the UK’s potential market share. There are industry players around the world and in the UK, notably Baxi and BG Group. Although, the technology will probably advance without government funding, it is likely to be at a reduced rate. 3 Market Entry Score 4 The key non-technical barrier is the cost of the systems. This is partially dependant on the utilities markets. For this particular application (ie replacing central heating boilers within houses), a possibly greater barrier to commercialisation is that consumers need to be persuaded that this is the right alternative when seeking to replace their boiler. There is the perception that this is a more technical system and will require markedly higher maintenance; hence, it will not only have a high capital cost, but also high maintenance costs and potential for failure. Within the new build market, this may be less of an issue. Implementation can

61
be achieved through builders and developers, with the occupiers only entering the process when they buy a house. This may have an effect on sales, but it is not possible to determine what this might be at this stage. 4 Risks Score 3 These technologies would directly replace central heating boilers in dwellings, where the highest currently obtained efficiencies are condensing boilers that achieve up to about 85% efficiency. Micro CHP could increase efficiency as it utilises both heat and electricity. There is also less requirement to obtain electricity from the grid, which in turn saves on inefficient power plant electricity production. Due to other energy efficiency measures, it is possible that there will be no requirement for heating in new dwellings by 2050. However, the CHP could be utilised for absorption cooling, though the cooling loads would generally be smaller and for shorter periods of the year. Carbon Dioxide Reduction Questions 1 Carbon Dioxide Reduction Score 6 and 1 CO2 savings would result from the greater inherent efficiency of micro CHP compared with existing central heating boilers and from the displaced power plant energy production. When considering fuel cell technology, there is the added bonus that, if the hydrogen fuel is supplied by renewables such as wind turbines, then there would be no CO2 emissions at all. Thus, the savings would potentially be from all heating and electricity provision to the domestic sector. Likewise the Stirling engine technology requires only a heat source and can potentially operate without a fuel source, thus providing a system of zero emissions. The carbon savings and the cost of that carbon are shown in the table above. The carbon savings are fairly significant, but compared with other technologies the cost of these savings is quite high. 2 Market Penetration Score 4 The technologies for micro CHP are likely to be slow to develop in the UK, as there are significant cost issues to be overcome. There is also the choices to be made between a centralised grid system of electrical supply or a distributed system, and between small micro CHP units or larger area CHP district heating systems. In addition, there is also the potential competition between micro CHP and renewables for the future provision of electricity (though some form of partnership between them is possible). With the continued legislation relating to energy efficiency and climate change, these technologies will become increasingly popular. However, there needs to be a clear strategy for combining their potential with that of renewables. 3 Additional Benefits Score 5 The environmental benefits of these technologies include greater energy efficiency (hence reduced CO2 emissions) and the potential for no emissions

62
(depending on the fuel used and the source of that fuel). The other main benefits are displaced power generation and, potentially, the loss of reliance on fossil fuels (fuel cells operate on hydrogen and Stirling engines potentially only require a heat source). Summary Combined heat and power (CHP) systems have been available for many years to provide heat and power in the form of distributed generation or district heating with power. A CHP system generally involves a combustion engine producing power in the form of electricity, while the heat generated by the process, which would normally be exhausted to atmosphere, is captured and used in heating systems. The main applications for CHP have historically been the provision of heating and power and/or back-up power to large office and industrial facilities, with unit sizes from about 200 kWe to several MWe. The application considered here is that of micro CHP, which is considered as being up to 5 kWe, and its application in the domestic sector. CHP in the domestic sector has a number of challenges to overcome if it is to be a commercial success.
• The cost of CHP is generally a limiting factor at present. • The load profile of a dwelling is not ideally matched to the output of micro
CHP. • There are technical issues with CHP units operating at these low outputs
and having an adequate lifetime. • There are also issues with competition, that of distributed versus grid
energy supply and also competition from renewable energy sources. However, there is the potential for using renewables such as wind turbines to produce hydrogen, which can then power the fuel cells for micro CHP.
Micro CHP technologies have the potential to eliminate CO2 emissions from heating and electricity generation for the domestic sector, if the hydrogen for fuel cells is sourced from renewable technologies and the heat for Stirling engines is solar. The technologies need funding for basic R&D, to enable UK companies to be competitive and to aid their commercialisation. References Leeds University, www.leeds.ac.uk/cfd/NATOSfP.htm Durham University, www.dur.ac.uk/khamid.mahkamov/Research.htm Southampton University, www.energy.soton.ac.uk/research/microgen.html Nottingham University, www.nottingham.ac.uk/sbe/research/archive.html Department of Energy, USA, www.eere.energy.gov Lund Institute of Technology, Sweden, www.vok.lth.se/~ce/Research/stirling/stirling_en.htm University of Rome, La Sapienza, Italy, http://dma.ing.uniroma1.it/isec2003/Pagina%20Web%20personale.htm Universität Karlsruhe, Germany, www.eifer.uni-karlsruhe.de/seite_291.php IEA Greenhouse Gas R&D Programme, www.ieagreen.org.uk/sept74.html

63
Fuel Cell Network, http://fuelcellnetwork.bham.ac.uk/

64
Buildings Energy Efficiency Technology Insulation application techniques for raised timber floors Overview Insulation in buildings is concerned with the conservation of energy and the need to limit the rate at which heat leaves the building. This is achieved by limiting heat transfer through the building fabric. The increased level of insulation for both loft spaces and cavity walls over the past few years has proved to be one of the most cost-effective measures to reduce heat loss. However, once lofts and cavities have been insulated, there is a need to look at other elements of the buildings structure to identify other areas for savings. Older dwellings tend to have raised timber floors with an air gap below. Originally designed as a moisture barrier, it can be a source of air leakage and cold draughts. Insulation can be installed between the boards and the air gap. However, existing techniques mean that the floor must be taken up to install this insulation, which leads to high costs and disruption. It is therefore only be carried out when the building is refurbished. There is therefore a need to develop a technique which enables the quick and cost-effective installation of insulation for raised timber floors (ie rigid board or quilt under or between joists). Technology This technology area involves the development of new innovative application methods and techniques for insulating under raised timber floors. As explained above, suitable materials are available on the market, but a cost-effective method of installation is lacking. This technology is about the development of a technique and not the development of insulation material. That is a separate subject and one likely to be developed by different bodies. Markets The buildings market can be split into four segments:
• Domestic existing • Domestic new • Non-domestic existing • Non-domestic new
Although regulatory improvements will continue to increase the amount of insulation fitted to new construction, the aim of this technology is to help reduce heat losses from existing buildings. At present, the market for retrospective fitting of insulation under raised timber floors is small and occurs only during a substantial refurbishment. The development of new techniques would expand this market at the same time as the markets for cavity wall and loft insulation decline (many dwellings already have these installed).

65
Issues/Challenges The main challenge is to develop equipment or machinery to provide a simple and cost-effective method of installing insulation for raised timber floors. A secondary challenge is to overcome the public’s perception of the disturbances caused by installing the technology. Key Characteristics Domestic
Unit Value Comments Margin investment cost/unit*
£ 500 Cost includes installation of insulation.
Annual energy consumption
MWh 13 Based on a typical house with half being ground floor. Improvement in U-value from 0.67 to 0.22 W/m2K, 30 weeks heating season (8 hours a day, 7 days a week)
Operating & maintenance (O&M) costs/year
% 0 Assumed that no servicing will be done in the life of the equipment in the domestic market.
Percentage savings % 25 Percentage saving on heat losses through floor.
Other and additional cost savings
£/year Benefits also from improved airtightness, which will again reduce the heat load.
Utilisation or seasonal efficiency
% 19
Availability Date 2020 Plant lifetime Years 25 The lifetime of the product. Payback Years 8.6
100 Fossil Fuel split %
* This measure takes into account the saving compared to the existing technology. Key Players The development of new materials and specific application techniques for products such as retrospectively installed cavity wall insulation tend to be carried out by manufacturers. In the case of raised timber floor insulation, however, the same product as used for loft insulation is suitable and a basic installation method can be used.

66
Manufacturers that are already offering a product for the application but with no retrospective method of installation include:
• Knauf Insulation; • Rockwool.
Research on materials and techniques is being carried out in Canada (eg Institute for Research in Construction), while alternative installation techniques have been developed in Australia and used there on raised timber floors. In the UK, the School of the Built Environment at Napier University in Edinburgh is researching retrospective thermal design solutions for buildings. Technology Development Potential gaps in the innovation chain: the poor cost effectiveness of installing insulation under existing raised timber floors has meant that no real research and develop has been done. Therefore this gap should be addressed. Blue skies research
Industrial R&D
Full-scale prototype
A-model prototype
Series production
Mk II design
Long-run series production
2005 2010 2015 2015 2020 2020 Carbon Summary Date/data Penetration
(%) CO2
(kt/year) CO2
(£/year) Comments
2010 1 68 422 Assumed that, even without the technique, insulation will be installed under raised timber floors.
2015 2 130 443 As above 2020 5 311 459 2050 60 2,871 611 The data above are indicative based on a consolidated view of trends and forecasts. The development path with time is uncertain, and cost reductions and performance improvements assume successful continuation of development trends. Technology Impact Assessment 1 Estimated UK Economic benefits Score 4 The existing thermal market for insulation in the UK is seeing continued annual growth, which can be linked to action on climate change and the legislative requirements. The market showed strong nominal growth of 15% in 2003 following the revision of the building regulations. A further 11% increase is believed to have occurred in 2004, amounting to over £1,140 million at contractor’s prices. It is expected that this trend will continue. In the longer-term, however, thermal insulation is expected to show a more moderate development in line with the overall construction output forecast. Between 2005 and 2009, the UK market for thermal insulation is anticipated to increase by 22% in real terms. The existing market for raised timber floor insulation is a small element of the thermal insulation industry due to a lack of cost-effective installation techniques

67
for the product. The development and application of these techniques would expand a small sector in the insulation industry similar to the market that has developed for the retrospective fitting of cavity wall insulation or loft insulation. In 2002, the introduction of the Energy Efficiency Commitment encouraged energy suppliers to promote the filling of cavity walls and the insulation of lofts. This subsequently created the need for installers. This market has grown rapidly, but as the percentage of filled cavity walls increases, there will be a decline in the need for installers. The creation of a cost-effective technique for new alternative insulation installations could offer an alternative application of insulation for the industry. Similarly the monitoring, standards and guarantee agency systems used for cavity wall insulation could be extended to encompass these technologies. 2 Scope for Government Action Score Research is required to develop innovative techniques. By funding R&D feasibility studies, it would be possible to accelerate the development of new techniques for the installation of insulation for raised timber floors. Government funding is necessary to support the development of these techniques, which would enable them to enter the market place. Once the techniques were ready for the market place, similar incentives and fiscal measures could be introduced to encourage uptake, followed by regulatory measures over a period of time. Methods such as those used currently for the uptake of cavity and loft insulation would be effective. For example, under the Energy Efficiency Commitment, electricity and gas suppliers are required to achieve targets for the promotion of improvement in energy efficiency in the household sector. It is our opinion that if there is no action from the Government, then this technology is unlikely to develop. 3 Market Entry Score 4 The UK thermal insulation market as a whole has shown year-on-year growth and is expected to continue growing (mainly reflecting legislative changes such as the building regulations). However, it is estimated that 10 million of the estimated 16 million cavity walls in the UK remain unfilled. Once these are filled, there will be a decline in part of the industry. The under floor insulation market is small as current methods of installation mean that the insulation is not considered cost-effective. This restriction on the market potential may discourage manufacturers from investing. Furthermore, the lack of cost-effectiveness means that industry has been slow to research, develop or market such products. Government funding/incentives would increase the uptake of raised floor insulation and would help many homeowners who cannot afford it to have it installed. The development and introduction of these innovative techniques would provide a method to raise the thermal insulation levels of existing housing stock above

68
the existing targets, which are based on cavity wall and loft insulation. In addition, it may be possible to market the installation technique worldwide. 4 Risks Score 3 There are risks associated with the development of techniques for raised timber floor insulation. For example, the output from the development phase could be anything from a methodology to a product or toolkit. In addition, the technique developed would need to be cost-effective to encourage uptake by homeowners. Therefore, there would need to be a commitment from Government to introduce measures to encourage homeowners. One of the reasons why additional insulation methods have not been widely taken up is due to the disruption that the process can cause to homeowners. Therefore, it is essential that the innovative techniques are not disruptive and that homeowners’ fears that it might be need to be dispelled. Carbon Dioxide Reduction Questions 1 Carbon Dioxide Reduction Score 3 and 1 A large proportion of the UK housing stock is old, with 39% dating to pre-1945 and a further 21% pre-1919. The insulation of raised timber floors is therefore possible in a large proportion of the existing domestic building stock within the UK. Adding insulation could improve the thermal properties of building stock from the current estimated U-value of 0.67 W/m2K to around 0.22 W/m2K. This is similar to the current building regulation requirements for floors and the savings have been calculated on this basis. Additional benefits include reduced drafts and improved airtightness. On this basis, the cost saving per dwelling would be around £20/year. (NB This does not take into account further savings related to increased airtightness). 2 Market Penetration Score 4 The current market for the insulation of raised timber floors is small due to the high cost of installation compared with the estimated saving in energy consumption. If the installation cost could be reduced, then the potential market penetration would increase. Furthermore, as explained above, the existing cavity wall insulation industry will reach saturation and start to decline. Insulating floors would provide an alternative developing market. 3 Additional Benefits Score 4 The insulation of raised timber floors would increase the airtightness of the building, thus reducing the heat loss by infiltration as well as increasing thermal comfort and U-values. Any new systems would be designed for minimum disruption. Increasing the insulation would lead to additional comfort for the occupants of the building.

69
Summary The technology topic considered here is the development of a more effective method of installation for insulation under raised timber floors. Raised timber floors make up a large proportion of the existing dwelling floors. Although this review deals more with the challenge rather than a specific technology, it identifies the reasons why such a technology has not been developed, ie there are no drivers to push forward the development. By addressing the gaps in the development chain (ie through R&D), the Government may be able to accelerate the cost-effective installation of insulation for raised timber floors in the UK. It is suggested that a feasibility study seems a good idea, and suggest other countries with similar climates be invited to join. Once available on the market, the use of fiscal measures similar to those used for cavity wall insulation could encourage uptake. In addition, the UK and international insulation market industry could benefit from the expansion of this small part of the market and the redeployment of the existing work force that will become redundant as the loft and cavity wall market becomes saturated. As well as the carbon benefits, there are economic reasons to push forward this technology. References Institute for Research and Construction, National Research Council Canada, High Performance Thermal Insulation System Special Interest Group, Annex 39 Study http://irc.nrc-cnrc.gc.ca/bes/hiptis/annex39.html Faculty of Civil Engineering, Brno University of Technology, Czech Republic, www.fce.vutbr.cz/en/science VLEEM – Very Long Term Energy Environment Modelling. Monograph: House of the Future, www.vleem.org/PDF/annex7-monograph-house.pdf Australian Greenhouse Office, Department of the Environment and Heritage. Technical Manual: Design for Lifestyle and the Future. Insulation overview. www.greenhouse.gov.au/yourhome/technical/fs16a_7.htm School of the Built Environment, Napier University, Edinburgh http://sbe.napier.ac.uk/research Insulation for Sustainability - a guide (output from an EU environment forum on climate change; can be downloaded as a pdf; best to use internet search engine using the title to obtain) Willrath, H, Energy Efficient Building Design Resource Book, Renewable Energy Centre, Brisbane Institute of TAFE, 2000 PATHE, Insulation Management Guide for Residential Building Manufacturers that provide material and installation details for new build (not retrospective):

70
Knauf Insulation, www.knaufinsulation.co.uk/output/solutions/page_238.html Rockwool, www.rockwool.co.uk/sw52739.asp

71
Buildings Energy Efficiency Technology Integrated window design Overview Windows are used on most buildings to provide daylight, to give natural ventilation (possibly) and to afford an outside view. In many cases, industrial buildings only require the daylighting aspect. Windows also form part of the outer skin of the building and, as such, are integral to preventing heat loss and providing both protection against the weather and security. There have been many developments within glazing, primarily for use in commercial and domestic buildings, particularly as a consequence of increasingly stringent legislation pertaining to energy efficiency and climate change. The predominant glazing at present is unsealed double-glazing, but it has been assumed for this review that double, or possibly even triple, glazing will predominate in the future and that the glazing will usually be filled with an inert gas or vacuum and have a low emissivity film applied to reduce solar heat gains within a building. The following looks at technologies for integrating other services (ie ventilation and heat recovery) into the window element. Technology Integrated window design refers to the combination of various services within window structures. The particular services considered here are integration of ventilation and/or heat recovery into the window unit. There are a number of options depending on the type of window structure utilised. The integrated system could be a prefabricated window unit or, in the case of commercial buildings, generally a double layer glazing façade. This would possibly also utilise the solar gain in the cavity, though there is also research into similar technology for domestic application into utilizing an extra pane of glass outside the normal glazing. Markets Potential markets are both domestic and commercial, but particularly in offices. The products displaced would be standard windows and, depending on the level of integration, various ventilation systems and heat recovery devices. The primary market for these technologies is new build; they can easily be incorporated and greater savings would be made, at the same time, through the displacement of other services. The technologies could also be used in major refurbishments but, where only the windows are being changed, the expected higher cost and possible redundancy of the other integrated services are likely to make this an unattractive option.

72
Issues/Challenges The barriers are mainly technical. However, there are also economic considerations and the obstacle of perception of these new systems, particularly in the domestic sector. There is a need to develop an integrated prefabricated window unit that competes with current and, ultimately, future standards for windows, glazing, ventilation systems and heat recovery systems. Double-layer glazed façades are already available for large commercial office buildings. In addition, there is ongoing research relating to the use of solar gain within the double layer to provide cross-ventilation through a building by opening the windows on either side. It will be necessary to develop a system that operates year round and which can compete in terms of performance with standard systems. Key Characteristics Commercial
Unit Value Comments Margin investment cost/unit *
£ 25,000 Based on average office building
Annual energy consumption
MWh 1,314
Operation & maintenance (O&M) costs/year
% 5 Associated with ventilation and heat recovery O&M and general cleaning.
Percentage savings % 20 Other and additional cost savings
£/year 0
Utilisation or seasonal efficiency
% 30 Most would be available all the time. Only the solar aspect would be less than 100%, but there would be a limit to the buildings applicable.
Availability Date 2020 Plant lifetime Years 20 Payback Years 10.6 Long payback will affect penetration. Fuel split % 20 Electricity
80 Fossil Displace heating, ventilation and cooling.
* This measure takes into account the saving compared to the existing technology

73
Domestic
Unit Value Comments Margin investment cost/unit*
£ 500 Based on average house
Annual energy consumption
MWh 13
O&M costs/year % 2 Percentage savings % 20 Other and additional cost savings
£/year 0
Utilisation or seasonal efficiency
% 19 Most would be available all the time. Only the solar aspect would be less than 100%, but there would be a limit to buildings applicable and less usage within domestic sector.
Availability Date 2020 Plant lifetime Years 20 Payback Years 10.8 Long payback will affect penetration. Fuel split % 20 Electricity
80 Fossil Displace heating, ventilation and cooling where applicable.
* This measure takes into account the saving compared to the existing technology Key Players There are currently players from industry, universities and governments, predominantly in North America where the US Department of Energy has a 20-year technology roadmap and work is ongoing at Lawrence Berkeley National Laboratory in California and the Institute for Research in Construction in Canada. There is also some interest in Europe, notably in Germany. There is a research collaboration between Cambridge University, Energy Research Group University College Dublin, Cenergia Energy Consultants, FLOPsystem and Titon Hardware Ltd looking at a whole-house low energy ventilation system, including integrated window design. Technology Development Potential gaps in the innovation chain: Within the UK the gap is the current lack of R&D in this technology area, which needs to be filled if the UK is to play a part in future developments. Blue skies research
Industrial R&D
Full-scale prototype
A-model prototype
Series production
Mk II design
Long-run series production
2005 2010 2015 2020 2050

74
Carbon Summary - Commercial Date/data Penetration
(%) CO2
(kt/year) CO2
(£/year) Comments
2010 0 0 105 R&D 2015 0 0 103 R&D 2020 1 45 117 R&D and testing installations 2050 25 869 202 Consolidated market, likely to be
competing with other technologies. Carbon Summary - Domestic Date/data Penetration
(%) CO2
(kt/year) CO2
(£/year) Comments
2010 0 0 215 R&D 2015 0 0 226 R&D 2020 1 113 245 R&D and testing installations 2050 15 1,327 421 Consolidated market, likely to be
competing with other technologies. Technology Impact Assessment 1 Estimated UK Economic Benefits Score 5 UK involvement is limited at present, with the majority of research being conducted in the USA, Canada and Germany. The technology is at a research stage. It is likely to remain there in the near future and will also need to combine with other technologies under evaluation in window design. Legislation is an important driver; in particular, building regulations requiring more stringent control of airtightness mean that adequate ventilation has to be provided; this should not compromise the heat loss benefits of airtightness, hence integrating heat recovery. 2 Scope for Government Action Score There is a requirement for government funding for basic R&D if the UK is to have any significant involvement in these technologies. The technology is still at the research stage, so there is time for those involved in parallel research in window technologies to consider this area. 3 Market Entry Score 4 Any number of designs are being researched for windows. These look to reduce solar gain, improve insulation and hence the energy efficiency of the building, incorporate photovoltaics (PV) and utilise passive solar designs. All these technologies will be barriers to this technology area of integrated building design. Significant research will be required in order to ensure that this technology can compete with the systems it has the potential to displace, ie new designs for windows, ventilation, heat recovery, etc. Integrated window design could form part of the modular building technologies of the future, with off-site prefabrication. The potential markets are worldwide. 4 Risks Score 3 There should be less waste with an integrated system and prefabrication off-site. Because the technologies are untested, there are risks associated with the

75
technical aspects. There will also be barriers created through competition with other technologies and the cost of the integrated system will have to be similar or less than the component parts it replaces (windows, ventilation), which are limited in domestic situations. Heat recovery would be an addition to domestic dwellings, albeit it an energy efficient one. Carbon Dioxide Reduction Questions 1 Carbon Dioxide Reduction Score 3 and 1 As the building regulations continue to increase the level of airtightness required, then there is an increasing need, both in domestic and commercial buildings, to ensure adequate ventilation on the grounds of health. If the heat loss benefits from the increased airtightness are not to be compromised, then there is a case for including heat recovery. This all leads to an integrated system of window, ventilation and heat recovery. The carbon savings and the cost of these savings are shown in the tables above. There are fairly significant savings in the longer term, but the cost is fairly high. 2 Market Penetration Score 3 If the technology can be made competitive, then there should be good market penetration. However, as there are several competing technologies, this will partially depend on market perception and advertising, as well as the technical performance and energy saving benefits. Current research is predominantly outside the UK but, as the technology is at an early stage, there is no reason why the UK cannot play a larger part. 3 Additional Benefits Score 4 The main additional benefit to improved energy efficiency and reduction of greenhouse gas emissions would be the reduction of waste, and hence embodied energy, as a result of the prefabrication and integration of various systems. Improved occupant comfort would depend on the effectiveness of the end product, but integration of the different systems should make it easier for the occupant to control their comfort. Summary Present day best practice glazing is generally double-glazed (or possibly triple-glazed) and usually filled with an inert gas (eg argon) and has a low emissivity film applied to reduce solar heat gain within the building. This technology review looks at technologies for integrating other services (ie ventilation and heat recovery) into the window element. The primary markets for these technologies will be new build in both the domestic and commercial sector (predominantly offices), as they could be easily incorporated and greater savings can be made through the simultaneous displacement of other services.

76
There are potential CO2 savings through integrated window design because airtightness can be improved without any detrimental health effects. Hence, losses can be reduced and energy efficiency increased. There is a requirement for government funding for basic R&D if there is to be any significant involvement of the UK in these technologies. The technology is still at the research stage, so there is time for those involved in parallel research in window technologies to consider this technology area. References US Department of Energy Window Industry Technology Roadmap, www.eere.energy.gov/buildings Lawrence Berkeley National Laboratory, USA, www.lbl.gov Institute for Research in Construction, Canada, http://irc.nrc-cnrc.gc.ca/irccontents.html rdpclevs research & demonstration project: ‘low-energy whole-house’ ventilation system, Fifth EC Framework Programme, http://erg.ucd.ie/rdpclevs/

77
Industrial Energy Efficiency Technology Novel approach to steam boiler system design Overview Typically, steam boiler systems are designed to have 50% spare capacity. This allows for future expansion of a site during the typical life expectancy of a steam boiler (about 20-30 years) without requiring the installation of new or additional boilers. However, because steam is generally distributed from groups of two or three boilers, individual units have large capacities relative to demand. Their large size makes it difficult for them to respond to load changes. Therefore, they are often run at full load and use steam accumulators to balance supply and demand. These factors lead to considerable heat loss and, consequently, inefficient use of energy. This technology involves changing from the current approach to steam boiler system design to one where a larger number of smaller boilers are grouped to provide the load as required. This provides greater flexibility in matching steam supply to demand. The possibility of bringing compact heat exchanger technology and new burners to form compact and effective units is very unlikely. Firstly, there is no overlap between boilers and condensate heat recovery, and secondly, experience shows that steam product technicians would not work with heat recovery as they do not understand each others technologies.
Technology Currently, manufacturers of medium-sized, hot-water boilers are marketing modular boilers. To provide a given total output, several smaller, identical boiler modules are built into a single unit. These have common water supply, return lines and flue. Each boiler has its own burner and control system. This approach offers a flexibility of operation without having to run a single boiler at high turndown. The technology discussed here develops this concept for larger steam boiler installations. However, in this case, the individual boiler units would not be built into a single structure. Designing boilers specifically to be installed in this way will produce steam systems with improved control characteristics that are more responsive to load changes. It will also reduce the number of individual boiler models that manufacturers need to develop by scaling from base designs. However, it will require more intelligent and complex control systems to be developed. It is unlikely that simply using multiples of smaller boilers to current designs will be satisfactory, though this offers an initial option. Designs need to be optimised for this type of system to deliver its full potential. Investigations need to be carried out to determine the most effective basic boiler type on which to base these. The two main types currently used are:
• shell or fire tube (modular construction), where combustion gases pass down a furnace tube and subsequent tube bundles are immersed below water level within the shell;
• water tube, where water is contained in tubes and hot combustion gases pass around them.
Each has its own operational characteristics and advantages/disadvantages. Modern design tools and improved control technology would help to improve overall steam system design, gain better efficiencies and operate at the optimum conditions.

78
This would require a radical look at the way in which boilers are designed and controlled to meet industrial steam loads, and losses that are normally acceptable from today’s systems could be reduced as a result. Quoted boiler efficiencies are often based on full-load demand conditions but, on site, boilers are rarely fully loaded. Major savings would come from ensuring steam generation matches demand.
Markets Boilers are widely used to generate steam and hot water for process and space heating across a diverse range of industrial and commercial sectors and in many public sector activities. This technology is potentially applicable to around 60% of steam boiler systems in the UK. The EU market for boilers is about 10 to 15 times that of the UK. It is most relevant to sites where the steam load is high but variable, where boilers are often run at full load regardless of demand and steam accumulators (which can produce large heat losses) are used to even out demand on the boiler. Current boiler design parameters and practices have been established for many years and considerable input may be required before new approaches are developed, accepted and adopted. However, this technology is likely to be more readily scaled than current burner designs. They will enable more compact boiler units to be developed and this will enable them to be used across a wide range of applications. Efficiency gains through improved design, better control systems and better matching of steam supply to load, could provide improvements of between 5 and 10%, and it is estimated that 5% could come from improved boiler control technology.
Issues/Challenges There are several barriers to adopting innovations in boiler design. The most important of these is the absence in the UK of regulation of performance of industrial steam boilers. Old, inefficient boilers are kept running well past their technical replacement point because maintenance costs are low relative to replacement costs. These economic and behavioural barriers could be addressed by introducing mandatory performance/efficiency assessments such as are present in some countries in continental Europe. However, this will impose additional costs on industry and may lead to more production being sent overseas. Such regulation would be more effective if linked to a capital loan fund to support users in meeting mandatory improvement notices. Supplementary to this key issue, are the following factors:
• New designs are perceived to be more complex and less reliable with higher installation, operating and maintenance costs. This technology should, in the longer term, give rise to reductions in manufacturing costs by reducing the number of boiler unit models and by reducing the maximum size of individual units, which will considerably simplify handling and manipulation during manufacture. However, more sophisticated controls will be required to take full advantage of the technology and there will be increased inspection requirements because of the large number of individual units (eg pressure vessel safety).
• Lifetime operating costs are not given sufficient weight in steam boiler system specification and design. Even good specification is often compromised as it passes through the supply chain to reduce capital costs at the expense of lower energy efficiency and running costs.

79
• The installed base of equipment is large and rate of change is relatively low. Typically, boilers are designed to last for 20 to 30 years and some are still operational at over 80 years. Boilers, while subject to maintenance and modification (which includes renewal of burners), are unlikely to be completely replaced in less than their expected lifetime unless some factor causes a premature failure. Hence, the timescale for the widespread introduction of technologies in this area is likely to be long.
Key Characteristics
Unit Value Comments Margin investment cost/unit *
£ 10,000 Typical boiler system size 10 MW
Annual energy consumption
MWh 26,000
O&M costs/year % 10 Increased boiler inspection and cleaning costs and emission control maintenance costs
Percentage savings % 5 Other and additional cost savings
£/year 0
Utilisation or seasonal efficiency
% 60
Availability Date 2010 Plant lifetime Years 20 Payback Years 1 Fuel split % 1 electricity
99 fossil Fossil split 90% gas, 10% oil
* This measure takes into account the saving compared to the existing technology
Key Players It is notable that most university research is directed either at fundamentals such as heat transfer, or at boilers in relation to power generation and solid fuel utilisation (coal and biomass). There appears to be little work on industrial gas- or oil-fired boilers, with the possible exception of domestic-scale condensing boilers. Key universities:
• University of Glamorgan, School of Technology, Mechanical and Manufacturing Engineering Research Unit 9;
• Energy and Resources Research Institute, University of Leeds10; • Thermofluid Science and Energy Research Center (TSERC), Department
of Mechanical and Industrial Engineering, College of Engineering, Marquette University, Milwaukee, Wisconsin USA11.
Technology Development
9 http://www.glam.ac.uk/sot/research/MechMan/index.php 10 http://www.leeds.ac.uk/speme/erri/ 11 http://www.eng.mu.edu/pages/Home/Departments/Mechanical_Industrial/Centers_Laboratories/Thermofluid_Science_Energy_Reserach_Center

80
Potential gaps in the innovation chain There is currently very little market pull for industrial R&D. There are high costs associated with prototyping, testing and manufacturing development. Test facilities at UK universities have largely been closed over the past 20 years. Generally, new boiler ranges are not being developed within the UK, but some limited innovations are being introduced from other EU countries (mainly Germany, France and Italy). Blue skies research
Industrial R&D
Full-scale prototype
A-model prototype
Series production
Mk II design
Long-run series production
2005 2010 2015 2020
Carbon Summary
Date/data Penetration
(%) CO2
(kt/year)CO2 (£/t)
Comments
2010 0 0 -32 Technology not developed 2015 3 28 -34 Long replacement cycles 2020 10 94 -36 2050 50 449 -34
Technology Impact Assessment 1. Estimated UK Economic Benefits Score 4 Most of the boilers bought in the UK are now manufactured abroad, including those supplied by most UK manufacturers. While this is unlikely to change in the near future, the design skills are still based in the UK, and it is here where the process of improvement needs to start. Only well-established technologies are readily transferred to overseas production. Therefore, new designs will probably need to be manufactured in the UK at least during the development and establishment stages. Primary boiler design has not changed in over 20 years, although there have been some improvements in steam system control. A fundamental change in approach to design of multiple steam boiler systems is needed. New designs of steam boiler ‘modules’ need to be developed to maximise the benefits that are available. In parallel, it is essential that suitable control systems be developed. The estimated increase in jobs as a result of the development is 500, and company turnover is estimated to increase by £500 million. Market uptake is likely to be strongly dependent on drivers such as cost of energy and legislative/regulatory requirements. If these are not significant then uptake will be low. If installation of steam boilers systems were to be regulated such that energy efficiency had to be optimised then this technology would be more likely to be adopted. However, there are alternative solutions in boiler design with which it may have to compete. 2. Scope for Government Action Score Funding the development of design techniques is needed to enable a new generation of boiler to be developed. The highly competitive nature of the boiler market, and the tendency for boilers to be bought on the basis of basic functionality and installed cost rather than overall performance and lifetime cost, means that UK boiler manufacturers are unlikely to have the resources to carry forward the necessary developments alone. Government support for research, development and,

81
importantly, demonstration will be needed to ensure that the technology is available to enable operators to meet future energy efficiency regulation. It is expected that such regulation will be required to ensure that companies deal with this aspect of their operations (which many consider to be incidental to their core activities). Boilers take a long time to design. Research needs to be started very soon in order to have a significant level of penetration by 2050 and to ensure that this technology is adopted during boiler replacement programmes.
3. Market Entry Score 4 Most existing boilers are of modular construction, which minimises initial capital investment – the main consideration when purchase decisions are made. Significant Government support will be required to encourage the introduction of new boiler designs that are likely to have higher purchase and installation costs. Although funding of research, development and demonstration is key to the technology becoming available, it will not be sufficient to drive this technology into the market. Purchasing boilers on installed cost alone without considering lifetime costs and efficiency is a tendency that needs to be addressed. The main barriers to the entry of this technology to the UK market are:
• Boiler manufacturing is traditionally a conservative, risk-averse industry. It is likely to be reluctant to adopt the radical changes in approach to design of equipment for supplying large steam loads. However, the industry should find savings through limiting the number of boiler unit sizes and designs that are to be developed to meet the range of system sizes that need to be supplied.
• To meet a given steam demand a single large boiler will take up less space than several smaller boilers. However, current steam systems are typically oversized in terms of capacity by 50%. This technology will allow the steam system capacity to be matched more closely to the demand. The large excess capacity required to provide supply redundancy for process protection associated with the use of systems will not be required where multiple smaller boilers are used. This will mean that fewer smaller boilers will actually be required than current steam boiler system sizes would indicate. This should reduce the impact of space constraints on the introduction of this technology.
• Buyers tend to opt for established technology because it is perceived as being more reliable and operators are familiar with it. This is a significant problem because the new technology will require more complex control systems, which is likely to give rise to reliability concerns.
Without Government backing, it is likely that development in the UK will be too slow and too late to make an impact. In a global marketplace, there is a good chance that the technology will be developed overseas and, as a consequence, damage the competitiveness of the UK boiler industry.
4. Risks Score 4 This novel approach to boiler system design is potentially a high-risk measure. However, the ability to base the initial developments around existing small to medium sized boiler technology should mitigate the risk. There may be reluctance from UK manufacturers to adopt the technology because of the greater sophistication required for the control systems. However, in the future, manufacturers are likely to have to incorporate more sophisticated controls on

82
boilers to optimise performance, and it is anticipated that this will help the new technology to be accepted more readily. As the initial capital cost is what most companies in industry base their purchase decisions on, there is a significant risk for manufacturers who move to selling more efficient, but higher cost, equipment. There is some risk that the size of the UK market alone will be insufficient to encourage manufacturers to be involved in development of the technology. However, if they recognise the global potential for the technology then this may encourage them to become involved.
Carbon Dioxide Reduction Questions
1. Carbon Dioxide Reduction Score 2 and 4 Savings potential for this technology is based largely on its ability to operate more flexibly in matching steam supply to demand and to reduce the standing losses that occur in large boilers when cycling occurs. By 2050, the estimated potential annual CO2 savings that could be achieved by adopting this technology are 449 kt based on the large industrial companies expected to retain steam distribution systems that could employ the technology. Estimated costs of this technology in £/tCO2 is given in the earlier table.
2. Market Penetration Score 4 The limits to market penetration of this technology will be dependent on the scale at which it proves to be an economical and effective replacement for current boiler system designs. There will also be limitations imposed by the space available for boiler plant on sites. Initially, it is expected that this technology will probably be adopted for sites with larger steam demands (probably above 10 MW though possibly down to 5 MW).
3. Additional Benefits Score 3 Other benefits to manufacturers include the opportunity to rationalise the range of models that they have, while maintaining their ability to supply a wide range of demands. In addition, if manufacturers can cease production of their largest models, they may be able to reduce the size of their manufacturing facilities. They may also be able to build units in a more streamlined manner and respond more flexibly to their customers’ requirements.
Summary Over 20% (74,991 GWh/year) of all the energy consumed by UK industry is used to raise steam. This could be reduced significantly through simple measures currently known to industry. However, in the future, increased savings could result through radical changes in the technology linked to improved system control. This will inevitably result in higher initial capital cost, be difficult for industry to take on board and require the help of Government funding to initiate. Increased energy costs, lower equipment costs (due to R&D) and, perhaps, legislative measures would ensure the technology was taken up. It is estimated that savings of 449 ktCO2 could be possible by 2050 from this technology.
References

83
General Sources:
• The Carbon Trust publication, ECG066 Steam generation costs; • The Carbon Trust Publication, GPG369 Energy efficient operation of
boilers. Specific References

84
Industrial Energy Efficiency Technology Low-cost, intelligent monitoring of steam systems Overview Often large and complex, steam systems are widely used in industry and account for around 20% of its total energy use. About 20% of this energy is “lost”, as described below, yet it is believed that about half of this loss is avoidable. The following are some of the mechanisms that adversely affect the efficiency of steam systems and create this loss:
• Equipment having a relatively high surface temperature, which leads to direct heat loss;
• Steam traps, which are used to separate condensate from steam, have significant failure rates and this usually causes steam to escape into the condensate system;
• Steam is an extremely aggressive medium and tends to attack physical weaknesses in systems, resulting in steam leaks. Its characteristics are even more damaging when it contains water droplets carried over from the boiler.
The “low-cost, intelligent monitoring of steam technology” involves applying advanced sensors and communications equipment, together with appropriate system design, to address these issues. Measuring steam and condensate mass flows enables steam balances to be produced, making it possible to identify losses due to leakage. Together with heat-balance information, direct heat losses could also be identified. Automated, remote steam-trap monitoring can quickly identify failed traps, which enables operators to take speedy remedial action. Technology The technology is to develop intelligent monitoring systems that enable heat and steam losses to be identified and minimised. It involves applying advanced sensors and communications equipment, together with appropriate system design. Bringing this technology to market will involve adapting and value engineering12, available intelligent monitoring software, plus sensor and communications technology to enable low-cost systems to be developed for energy saving applications. Steam is used in the majority of industry sectors because it is very versatile yet easy to produce. Generally, large industrial sites generate steam in centralised boiler houses and deliver it to the point(s) of use through a distribution system. Typically, about 20% of the energy used to generate the steam is lost during distribution. Where this is the case, improved monitoring of the distribution system and fast rectification of faults will increase efficiency. Central monitoring systems and the use of solar-powered wireless transducers13 could ensure that an overall energy balance is undertaken continuously. This could provide a warning when problems occur, enabling operators to take remedial action
12 Value engineering is an approach to productivity improvement that attempts to increase the value obtained by a customer of a product by offering the same level of functionality at a lower cost. 13 http://www.manufacturing.net/ple/article/CA108870.html

85
and restore the system efficiency. Many of the technologies to provide this level of monitoring exist. However, they are expensive; sales into the steam monitoring market are very small. Low-cost integrated solutions need to be developed to increase the application of these technologies into this market. Value engineering needs to be undertaken to provide:
• modular designs; • easy, low-cost wireless interconnection; • highly configurable adaptive software.
Markets In 2004, the UK industry consumed 74,991 GWh of fossil fuel for steam generation (emitting 15,467 ktCO2)14. Over 80% of this was used in the chemicals, food and drink, iron and steel, engineering and textiles industries. Steam systems are used for similar purposes around the world. Typically, steam distribution systems lose 20% of the input energy. In some cases the loss can be much higher. This loss is not effectively addressed through the current approaches of ad-hoc reporting by staff and regular (though often infrequent) surveys and inspections. The losses could be significantly reduced, probably to less than 5%, through advanced monitoring and optimisation, backed up with responsive rectification systems. For key areas, automated bypassing or rerouting might be possible. In the longer term, only the largest companies in the chemicals, food and drink, and iron and steel sectors are expected to retain steam distribution systems. Therefore, they are key areas for the application of this technology. Although the individual components for this technology are available, their cost is high. Systems using them have to be developed and installed on a bespoke basis. The development time for a system for a large site is about five years with a total cost of around £5 million. The only sites that have used this type of technology have done so for critical safety and process reasons where the costs are easier to justify. Currently, the technology is not cost-effective for energy efficiency applications.
14 2004 ECA Impact Assessment

86
Issues/Challenges Energy use to most industries is only a very small part of its operational cost (typically less than 5% for the process industries such as chemicals). As a result, industries continue to look elsewhere to reduce costs and little effort is undertaken to optimise the energy efficiency of plant. This will change as companies look for improvements in their steam distribution systems to offset rising fuel costs and to comply with new environmental legislation. For this technology to be adopted, the following economic and behavioural barriers need to be addressed:
• the cost of monitoring systems needs to be reduced through improved technology and volume production of components;
• higher ratio of energy/production costs needs to stimulate the market for the product;
• environmental legislation should be aimed at reducing energy loss.
Key Characteristics
Unit Value Comments Margin investment cost/unit *
£ 100,000 Applying value engineering to develop a more mass-market oriented product should reduce this cost significantly.
Annual energy consumption
MWh 70,000 Typical system size on which this technology could be applied is about 10MWt
O&M costs/year % 15 Higher costs are due to use of complex controls and sensors
Percentage savings % 5 Other and additional cost savings
£/year 15,000
Utilisation or seasonal efficiency
% 80
Availability Date 2015 Plant lifetime Years 10 Payback Years 3.2 Fuel split % 1 electricity
99 fossil Fossil split 90% gas, 10% oil
* This measure takes into account the saving compared to the existing technology

87
Key Players Key UK companies:
• Spirax Sarco; • Gestra Steam Solutions; • TLV Euro Engineering.
Overseas companies: • Armstrong International, USA; • Purgadores de Condensado S.L, Spain; • Keystone International Holding Corp, USA.
Universities tend to focus on the study of fundamental aspects rather than development of systems in this area. Universities working on sensors and communications could contribute to developments. Technology Development Potential gaps in the innovation chain. Currently, there is no industrial ‘pull’. Change to regulations are likely to be required to produce a “pull”.
Blue skies research
Industrial R&D
Full-scale prototype
A-model prototype
Series production
Mk II design
Long-run series production
1995 2010 2015 2020 Carbon Summary Date/data Penetration
(%) CO2
(kt/year) CO2 (£/t)
Comments
2010 0 0 -3 Technology not available 2015 5 48 -5 There is a slow rate of replacement of
steam systems 2020 20 189 -6 2050 80 729 -1
=

88
Technology Impact Assessment 1. Estimated UK Economic Benefits Score 4 There are currently two or three major manufacturers of steam distribution packaged equipment. UK–based, steam-product suppliers have 30% of the world market and 60% of the UK market. There are about 20,000 steam boilers in the UK. Of these, between 4,000 and 5,000 supply steam systems where the described technology would be particularly beneficial. The scope for value added is >£0.5 billion and 500 jobs if new technology is designed here. This includes work for UK installers and maintenance engineers. It is unlikely that all hardware would be built in the UK as low-cost, volume production of electronic components takes place largely in the Far East. However, UK steam-system design teams are World leaders. In the past, work has been carried out with industrial companies and steam equipment suppliers to develop bespoke systems for specialised applications. This was limited, and the high costs involved have stifled development. Subsequently, developments in the areas of sensors, communications and intelligent software have advanced dramatically and there is now an opportunity for low-cost, modular systems to be developed, which would be more economically attractive for installation as an energy saving measure. Steam equipment companies offer some component parts of steam distribution monitoring systems, but these are relatively low technology. Significant improvement and development is required so that they can contribute to a modular, systems-based approach. This will need to be supported by developments to enable wireless communication with the sensors and integration with intelligent software. Currently there are no drivers operating. The market needs to be stimulated by change to regulations.
2. Scope for Government Action Score The key development needs are: to apply advances in sensor, communications and software technologies used in a variety of other applications for use on steam distribution systems; make them robust enough for the harsh conditions to which they are likely to be exposed, value engineer the identified technologies for mass application and low maintenance and to develop techniques for integration into steam system designs. The current industry attitude is that steam losses are considered “acceptable”, unless they constitute a hazard. If this attitude continues, then the level of industry-supported research and development is likely to remain low. External funding is likely to be needed if the development of technologies and changes in design procedures to incorporate them are to be realised. Alongside this, there would also need to be a change in attitude to the operation of steam systems. This change will need to be driven by regulation of overall steam system performance.
3. Market Entry Score 4 The following are the three main barriers on the path to market for this technology:
• there is no economic value assigned to waste heat; • the low cost of fuel compared with raw materials supports corporate
views that energy losses are acceptable • investment in this area is concentrated on ensuring continued reliable
operation to the exclusion of energy efficiency considerations.

89
Funding would be most effective in enabling low-cost, modularised products to be developed and demonstrated. Demonstration is key to developing buyer confidence in a new technology. In addition, while some manufacturers have a positive attitude to development of higher efficiency products in this area, they are hampered by the attitude of the market. In this situation, it is difficult for these manufacturers to justify large expenditure on development. Some work will be undertaken by industry without Government backing. However this is likely to be too slow and too late to make an impact. Because it is a global market, there is a good chance that the technologies will be developed overseas and UK industry will not benefit. Development of the technology could benefit UK industry in a worldwide market as steam distribution is a global technology, and technologies to optimise systems will be of overall benefit to the UK industrial economy.
4. Risks Score 4 The level of investment needs to reflect the marketplace, which will change in the future only if the drivers change. Only large steam-distribution systems will benefit from this technology, and the number of these will reduce in time. There are no major competing technologies. However, there are different types of monitoring device, systems, communication and computing methods that could be used; the risk lies in identifying the most appropriate. Making the wrong decision could be costly to industry and it is for this reason that good background R&D is required before major technological development is undertaken. The main risk in investing in this technology is that the approaches outlined run against current trends. Industrial steam users might respond by moving operations offshore rather than meet tighter regulations. To succeed, the long payback periods need to be overcome and this would require a high level of support. The technology itself will not be difficult to develop. However, it will be necessary for a wider range of skills to be applied to it than are needed for conventional steam equipment and this may prove to be a barrier for industry-led development. Unless appropriate drivers are put in place, even the expected cost reductions in the technology are unlikely to be sufficient to ensure a good level of adoption. There will need to be a coherent approach to ensure contributing technologies can be appropriately integrated to provide reliable systems.
This technology would complement the best existing technologies for steam and condensate heat recovery and re-use. It would enhance their effectiveness by ensuring that their availability was maximised. Carbon Dioxide Reduction Questions 1. Carbon Dioxide Reduction Score 2 and 4 The number of major steam distribution systems remains high at this time, but will reduce in coming years. The technology will be relevant to large, heat-using companies with manufacturing over a large area. Carbon reduction will be driven by the cost of energy, and this forms the basis of the estimates below. Legislation to drive up efficiency of steam distribution systems would increase energy savings and carbon dioxide reductions more quickly. The potential CO2 saving estimated from this technology is 729 ktCO2/year. This is based on the large industrial companies expected to retain steam distribution systems that could employ the technology and the estimated rates of penetration.

90
2. Market Penetration Score 4 The limits to market penetration of this technology will be related to the minimum size of steam system upon which it can be cost-effectively applied. Initially, the technology is most likely to be effective on very large sites (typically with 500+ steam traps). Here, the size of the sites means that manual inspection is extremely time consuming and, therefore, costly. It can also be ineffective, as some areas cannot be accessed routinely (but could be monitored remotely). For very small systems (<5MW) it is unlikely to be economic. However, there are other contributing factors such as process protection, health and safety and de-manning issues, which might encourage application even below this level. Penetration is expected to be strongly dependent on legislative /regulatory and fuel-cost drivers. It is unlikely that the need for steam generation and use will disappear, though decline in the UK’s manufacturing sector and process technology changes could reduce it significantly. There is also scope for UK steam equipment manufacturers to market this technology into some European markets where energy efficiency legislation is in advance of that in the UK. Worldwide, steam will remain the main source of heat for process and manufacturing, and although the UK market is expected to decline, it will still be a major consumer of steam.

91
3. Additional Benefits Score 3 Additional benefits from adopting the technology cover a range of areas. It will:
• reduce the impact on local ecology by reducing the amount of ‘hot water’ discharged;
• reduce atmospheric heat pollution; • reduce water consumption and, hence, water charges and treatment costs; • protect process operations by enhancing steam system reliability; • help protect operators from the hazards associated with steam leaks,
through early identification; • provide opportunities for development of improved monitoring systems in
other areas such as process control and building energy management systems
Summary Steam systems are used in the chemicals, food and drink, iron and steel, engineering and textiles industries in the UK and around the World. Over 20% of all energy used by UK industry is used to raise steam, which is used as a heating medium. The majority of this steam is distributed through pipework systems that have a high potential for energy loss - typically 20%. There is significant scope for savings, through improvement and adoption of better monitoring and maintenance action. Older technologies exist which could, theoretically, be used to access these savings. However, significant development is required to incorporate the latest technical innovations in sensors, communications and intelligent software, and to engineer them to provide low-cost modular solutions. Demonstration is required to build industry confidence in this technology and raise awareness of the need for this technology; legislation for steam system efficiency would be required to force the issue. The main barriers to adopting the technology are the low cost ratio of energy to raw material used by key sectors. Increased energy costs and regulatory measures will drive the adoption of this technology providing its cost is reduced through R&D. It is thought that a 10% saving in fuel use per system could be achieved if the heat energy in condensate is recovered in a form that is usable. CCAs would not work for this technology as there is inadequate drive (no market role for the technology at the moment) as they are too expensive to deploy, therefore it needs to be redesigned. If energy efficiency regulation is applied in this area, matched with suitable support for implementation, it is estimated that annual savings of up to about 730 ktCO2 might be realised by 2050.

92
References General sources:
• The Carbon Trust publication - ECG092 Steam Distribution Costs; • The Carbon Trust - A Cross-Sector Initiative Paper for Boilers and Heat
Distribution Systems, February 2003; • Personal communications between Dr A M McCullough and
representatives of Spirax Sarco and Gestra Steam Solutions.

93
Buildings Energy Efficiency Technology Solar thermal air-conditioning Overview Air-conditioning is a major industry in the developed world and increasingly so because of warmer climates and also building occupant comfort expectations. The technologies currently available use refrigerants predominantly that are harmful to the atmosphere and there are considerable leakages from these systems. The predominant system used is the vapour compression system, which is capable of relatively good energy efficiency when used correctly, depending on the system and the application. In simple terms, the vapour compression system works through the input of electrical energy and the varying of the pressure of the refrigerant around the circuit. The technologies examined here are free of harmful refrigerants, use solar energy as the energy source and produce air-conditioning indirectly through integration with other systems (ie desiccant or evaporative cooling). Technology The technology is air-conditioning/cooling using solar energy. The primary systems for consideration would be desiccant air-conditioning systems that use solar energy to regenerate the desiccant. Secondary systems would include the use of thermoelectric cooling cells powered by photovoltaics, which can be combined with heat pipes and phase change materials for greater efficiency and storage, allowing operation to continue overnight. This technology is environmentally friendly in that there is no use of harmful refrigerants, and is energy efficient as there is not the energy requirement of the compression systems. Markets The primary markets would be commercial offices and domestic, with domestic being the initial market owing to the higher performance and capacity requirements of offices. There is scope for application in both new build and refurbishments, though new build would be the expected initial market. The technology would displace existing air-conditioning systems, principally vapour compression systems. The market would probably be, initially at least, in locations around the world that presently do not have air-conditioning owing to cost and electricity supply issues, with expansion into existing markets, the UK, the USA, Australia etc. later. Issues/Challenges The primary issues with the technology are technical and entail producing solar thermal air-conditioning systems that match the capacity and performance of vapour compression systems and also developing systems that can deliver cooling when the energy source is not available (ie at night). This may require integration with other technologies for thermal storage.

94
Key Characteristics
Unit Value Comments Marginal investment cost/ unit *
£ 100 The cost of the technology is expected to be similar or possibly less than the existing vapour compression systems.
Annual energy consumption
MWh 26
O&M costs/year % 5 Assuming that the nominal O&M costs per year are 5%, but this will represent more than the marginal investment cost.
Percentage savings % 80 Other and additional cost savings
£/year 0
Utilisation or seasonal efficiency
% 30 The value is fairly low as initially this technology would be most appropriate to new build and will take longer to break into the refurbishment market.
Availability Date 2020 This is when the market will probably develop, as there is recent industrial interest. There is scope for significant uptake from this point on.
Plant lifetime Years 20 Should be similar or longer than current vapour compression systems.
Payback Years 0.3 Fuel split % 100 Electricity
0 Fossil The displaced cooling is electrically driven.
* This measure takes into account the saving compared with the existing technology Key Players Currently, Queensland University of Technology in Australia and Nottingham University in the UK are actively researching solar thermal technologies, using various forms of desiccant cooling. There is also some active research in industry, presently through the DTI Technology Grants Programme. Technology Development Potential gaps in the innovation chain: The gap, if any, is at the R&D stage with a limited number of players at present. Blue skies research
Industrial R&D
Full-scale prototype
A-model prototype
Series production
Mk II design
Long-run series production
2005-2010
2015 2020 2050
Carbon Summary Date/data Penetration
(%) CO2
(kt/year) CO2 (£/t)
Comments
2010 0 0 -31 R&D 2015 1 10 -48 R&D and test installations 2020 15 197 -52 Start of market penetration 2050 85 3,249 -52 Consolidated market

95
Technology Impact Assessment 1. Estimated UK economic benefits Score 4 The number of players is limited in this field in the UK and in other countries, but the UK does have a strong position and the necessary skills to develop the technologies. The prominent players are currently universities and spin-off companies formed from associates formerly of universities. Developments have only just emerged and so are at a very early stage of design and research. The key developments required are to produce systems that can compete with the current vapour compression air-conditioning systems. The main drivers to bring these technologies to market are the legislation regarding energy efficiency and climate change and the requirement for cheap unsophisticated air-conditioning for poorer areas of the world. 2. Scope for Government action Score There are some early designs for these systems, but there is much research, development and testing to be done to bring products to market. The main contributors so far are several universities around the world, mainly in the UK, Australia and Russia with some limited industry involvement. Without funding, the technologies are unlikely to be developed for some time as significant research, development and demonstration are required before consideration can be given to displacing existing technologies (ie vapour compression). The level of funding should be such as to generate interest and stimulate industry participation. 3. Market entry Score 4 The key non-technical barriers are that these technologies will be in competition with current vapour compression air-conditioning systems. The manufacturers will either welcome the new technologies as cheaper, more environmentally friendly products and play a large part in their manufacture and development, or they will seek to ensure that they do not lose their market share to these new technologies. Potentially, this issue is greater than in other areas as the new technology should be cheaper and have less profit margin than existing technologies. Funding should therefore be aimed at both developing the technologies and also encouraging the air-conditioning manufacturers to participate, which could help reduce the future funding levels. The existing air-conditioning industry infrastructure would be suitable for market introduction. These technologies are applicable to any location that currently uses air-conditioning in buildings, but initially the market developments will be to bring cheap, affordable air-conditioning to areas of the world that don’t have them.

96
4. Risks Score 3 These technologies would directly replace current vapour compression air-conditioning systems which are fairly energy-intensive, thus producing lower greenhouse gas emissions, and using no harmful refrigerants in the new technologies. There are several risks for this technology. Initially, there is the risk that the technology will not develop systems that operate effectively, though the research is showing good signs for success. The main risks that need to be overcome concern development of these systems to compete with vapour compression systems with regard to capacity and performance. After the initial research has been completed there will be the issue of manufacture. The manufacturers involved in the final production of the technologies will determine the benefit to the UK economy of these technologies. Carbon Dioxide Reduction Questions 1. Carbon dioxide reduction Score 2 Air-conditioning/cooling uses a significant amount of energy within buildings, though somewhat less than heating. The demand for air-conditioning/cooling is also increasing, both in use in existing markets and in new markets around the world. The carbon savings and the cost of that carbon are shown in the Carbon Summary above. The carbon savings are fairly small in comparison with some other technologies, though this is partially due to the small energy expenditure on cooling in comparison with heating for example. The cost of the carbon saved on the other hand is extremely favourable in comparison with other technologies. 2. Market penetration Score 4 The technologies are likely to be slow to develop in the UK, as there is already a significant level of vapour compression systems in use. Markets for the technologies are likely to develop beyond the UK in the first instance and slowly take over the market in countries such as the UK, the USA and Australia. To enhance the take-up, fiscal incentives could be offered or regulatory requirements amended in favour of less energy- intensive technologies. With global warming and the continuing focus of occupants on comfort, there is a general need and desire for air-conditioning and although there are other advances being made to limit the use of air-conditioning, it is still expected to rise. With continuing legislation relating to energy efficiency and climate change, these technologies will become increasingly popular and future legislation may well phase out vapour compression systems and refrigerants, at least in their present form, thus leaving the way clear for new technologies. 3 Additional benefits Score 5 The environmental benefits of these technologies include greater energy efficiency, hence less greenhouse gas emissions, and removal of refrigerant leak issues, as there are no harmful refrigerants used in the technologies. Solar thermal technologies are, in general, under research and it would be expected that research into solar thermal air-conditioning would have benefits for other fields of solar research (ie solar heating and hot water) and ultimately lead to an integrated solar

97
thermal, air-conditioning, space heating and hot water system, with possible PV and heat pipe integration for greater efficiency. Summary The technologies currently available are predominantly vapour compression systems using refrigerants that are harmful to the atmosphere. The technologies looked at here are free of harmful refrigerants, use solar energy as the energy source and produce air-conditioning indirectly by integrating with other systems (ie desiccant or evaporative cooling). The primary markets would be commercial offices and domestic, with domestic being the initial market owing to the higher performance and capacity requirements of offices. There is scope for application in both new build and refurbishments. Issues to be addressed include demonstrated performance and capacity, and operation of the system when the energy source is unavailable. Air-conditioning is an energy-intensive operation with significant CO2 emissions. Replacing the current technologies with solar thermal systems would drastically cut the levels of CO2 emitted and reduce any additional loading associated with climate change. These technologies require R&D funding in order to progress the technology to a stage that would make it viable for industry to promote and develop further. References European Solar Thermal Industry Federation (ESTIF), www.estif.org International Energy Agency – Solar Heating and Cooling Programme (IEA-SHC), www.iea-shc.org Solar Energy Industries Association, USA (SEIA), www.seia.org Queensland University of Technology, www.bee.qut.edu.au Nottingham University, www.nottingham.ac.uk

98
Buildings Energy Efficiency Technology Alternative light technologies - solid-state lighting – LEDs Overview Lighting-related electricity production accounts for approximately 13% of all energy used in the domestic sector and 20% of all energy used in the non-domestic sector. The lighting sector can be broken down into several areas such as light sources, luminaries, controls and daylighting. Integration of artificial lighting with daylighting is crucial though daylighting can be considered a building fabric element. Within these areas the potential to reduce energy consumption of lighting is estimated at about 60%. More efficient use of lighting and control would limit the rate of increase of electrical power consumption. At present fluorescent lamps dominate office lighting and in domestic lighting the dominant light source is still the incandescent lamp. Lighting applications that use light-emitting diodes (LEDs), organic light-emitting diodes (OLEDs), or light-emitting polymers are commonly referred to as solid-state lighting. Solid-state lighting is the first truly new lighting technology to emerge for nearly 100 years. Unlike incandescent or fluorescent lighting, solid-state lighting creates light with virtually no heat. A semiconducting material converts electricity into light. Light-emitting diodes, or LEDs, have been around for more than 30 years, but until recently were used only in small electronic devices as indicator lamps. Recent developments have allowed LEDs to be used in signal devices and in limited illumination applications. Research is demonstrating a bright future for solid-state lighting as the next generation of light sources for general illumination, from homes to commercial applications. Technology The technology topic is light emitting diodes systems for the application as architectural lighting. Markets The development of LEDs has been accelerating in recent years. Currently, LED products are not readily available for white architectural lighting, despite being available for the following applications: exit signs, coloured lighting and some traffic signals. In architectural lighting the most commonly used lamps are fluorescent because of their efficiency and versatility. They have a long life and a good range of colour, shape and form for different applications. Incandescent lamps are also used for display and task lighting in the commercial world and in the domestic environment. The lighting market can be separated into a domestic and non-domestic market though there is some overlap. The UK domestic market was recently valued at £520 million and the non-domestic at over £800 million. There are key players in the UK marketplace, though they are not necessarily indigenous to the UK, such as GE Lighting, Philips, Osram, Siemens and Zumtobel. Industry is mainly responsible for driving and funding advances in lighting technology;

99
however there has been great interest in the development of solid-state lighting for Architectural purposes from both industry and Governments. Issues/Challenges The development of visible white LED light has generated interest in the possibilities of using LEDs for architectural applications. However, the technology available at present does not supply enough lumen to output to make them competitive with existing light sources. Development of LEDs is still ongoing and improvements in their efficiency are still being made. Therefore it is hard to predict their potential precisely. Secondly, the projected cost of LEDs does not compare with existing market products, therefore on introduction into the market there could be a reluctance to use the products. While the efficacies of individual LEDs have been shown to be high, it is unclear what the efficacy of a whole system could be, therefore the precise potential for energy reduction is not easy to establish. It will be important to establish a standardised method of assessment to compare the efficacy of LED systems with other products. Key Characteristics Commercial
Unit Value Comments Margin investment cost/unit*
£ 55,000 Per Building
Annual energy consumption
MWh 289
O&M costs/year % Cleaning costs are equivalent to existing ones Percentage savings % 80 Other and additional cost savings
£/year 0
Utilisation or seasonal efficiency
% 33 Same as standard lighting assuming that lighting controls are covered by another technology
Availability Date 2020 Plant lifetime Years 25 They can last up to 50,000 hours or six times longer
than fluorescent bulbs. Assuming 1,000 hours/year
Payback Years 6.1 100 Fuel split % electricity
Domestic
Unit Value Comments Margin investment cost/unit *
£ 200 Costs vary dependant upon fitting and dwelling size though costs are average for lighting whole dwelling
Annual energy consumption
MWh 1 Assuming 1,000 hours/year usage

100
O&M costs/year % Percentage savings % 80 Assuming improvements already shown by research
Other and additional cost savings
£/yr 0
Utilisation or seasonal efficiency
% 13% Assuming 1,000 hours/year usage
Availability Date 2020 Plant lifetime Years 20 They can last up to 50,000 hours or six times longer
than fluorescent bulbs. Assuming 1,000 hours/year
Payback Years 2.4 100 Fuel split % electricity
*This measure takes into account the saving compared to the existing technology Key Players Much research is being done on solid-state lighting for architectural applications throughout the world, with a focus on the USA, Japan and Europe. In the USA, much research is being done funded by both Government and industry. For example, the Lighting Research Centre is conducting research on the application of lighting and the education that will be needed to ensure acceptance, and Philips Lighting and Hewlett-Packard recently launched LumiLEDs with an investment of $150 million with a goal of rapidly developing LED technology. In Europe, the Energy Conservation in Buildings and Community Systems (ECBCS) has been running ongoing research on Energy Efficient Future Electric Lighting for Buildings since 2004. The function of ECBCS, which was established by the International Energy Agency, is to undertake research and provide an international focus for building energy efficiency. The aim of this project is to identify and to accelerate the widespread use of appropriate energy efficient high quality lighting technologies and their integration with other building systems, making them the preferred choice of lighting designers, owners and users. This Annex is being led by Helsinki University, Finland and is being supported by a mixture of research bodies from Universities, Government and Industry. UK representatives are Nottingham University and Helvar Merca Limited. Other UK research centres include:
• University of Wales, Bangor – has been working with Cambridge University. • Bath University – has developed a method of making LEDs more cheaply and
efficiently. • Cambridge University in association with Forge Europa – is focusing on
improving their efficacy. The latter two research centres have received funding from the DTI. On the subject of standards, the Commission Internationale d’Eclairage (CIE) is involved in tackling the issues of establishing a method to measure energy efficiency of LEDs. The UK representative is the National Physical Laboratory.

101
Technology Development Potential gaps in the innovation chain As discussed already industry have invested in R&D of this product and the race is onto develop the products for the international market. However it is conceivable that the knowledge sharing base could breakdown due to this competition to meet the market first. Blue skies research
Industrial R&D
Full-scale prototype
A-model prototype
Series production
Mk II design
Long-run series production
2005 2005 2010 2010 2015 2020 Carbon Summary Commercial
Date/data Penetration
(%) CO2
(kt/year) CO2 (£/t)
Comments
2010 2 301 74 This is assuming that the prototypes will have reached the market place for specialist lighting though the penetration will be small.
2015 5 659 75 Increased penetration as the existing building stock market are refurbished with LED systems
2020 12 1,625 71 Further market penetration as more existing stock is refurbished
2050 60 9,448 71 Further market penetration as more existing stock is refurbished
Domestic Date/data
Penetration (%)
CO2 (kt/year)
CO2 (£/t)
Comments
2010 1 114 -48 This is assuming that there prototypes will have reached the market place for specialist lighting though the penetration will be small
2015 3 289 -78 Increased penetration as dwellings are refurbished with LED systems
2020 10 951 -75 Further market penetration as more existing stock is refurbished
2050 60 5,314 -30 Further market penetration as more existing stock is refurbished
Technology Impact Assessment 1. Estimated UK Economic Benefits Score 3 Much research is being carried out internationally to which the UK research base is contributing. It is important that this research continues and that the UK is seen as a centre of excellence and focus for developing LEDs further. This may encourage the lighting industry to invest. Whilst the lighting lndustry operating in the UK are not necessarily indigenous to the UK, they are already involved in the R&D of LEDs and their application. The US is seen as the leader in this development race, however, the research done in the UK, such as that at Bath University, is ground breaking and could assist in a global reduction in LEDs costs. It is therefore important that this UK research continues.

102
Research is being done in both the US and Europe on what perceived problems there may be when products evolve and enter the marketplace. Lessons can be learnt from this work for the UK market. 2 Scope for Government Action Score R&D in the lighting industry tends to be driven by commercial reasons rather than the need to reduce carbon emissions. That said research is already being part funded by industry on an international basis. As already explained, the lighting industry in the UK is not necessarily indigenous to the UK, and there is research being carried out in the UK for international benefit. Therefore there is scope for the UK Government to continue funding R&D in the UK, both on improving the cost effectiveness and the efficiency of LEDs, which are two of the key technically challenging areas. Product development from that point is likely to be carried out by manufacturers. If no funding were provided for these centres it is unlikely that the research would continue. On market entry, LEDs may face a different set of barriers. As already explained there is currently no standard method of assessment and comparison to existing products on the market. This work is already in hand but when complete will enable the Government to determine to what extent LEDs should be promoted as an energy efficient alternative to other lamps. Possible routes for Government action could be through fiscal incentives or the Building Regulations. The public’s perception that lighting is not a high-energy user and so the need for low energy light fittings has been spreading slowly. However, increasing awareness would increase the uptake. 3 Market Entry Score 3 There are several areas where market entry could be problematic:
• In the new domestic and non-domestic sector there should be no technical barriers to prevent installation, however, existing buildings are only likely to be suitable when refurbished, and fittings as well as bulbs/lamps replaced.
• Despite developments LEDs potentially have a higher cost per unit that those already on the market and therefore the market take up may be slow. This rate could be increased if the Government were to offer fiscal incentives, similar to those offered previously.
4 Risks Score 3 It is agreed throughout the lighting industry that it is difficult to estimate the precise savings that can be achieved. The lighting industry is researching the area but until a standard method of assessment is agreed it is difficult to predict the precise energy reduction potential. Carbon Dioxide Reduction Questions 1 Carbon Dioxide Reduction Score 3 and 4 It is unknown to what extent the final efficacy or lumens per watt (LPW) will be achieved by LEDs. 100 LPW have already been achieved, but experts are predicting that it could be improved to 150-200 LPW in the coming decades. Therefore, it is hard to predict

103
what the precise carbon reduction potential will be or the savings of those reductions in £/tCO2. 2 Market Penetration Score 6 The lighting industry is mature with annual sales in the region of £520 million. The construction industry can be split into four sectors, existing and new construction, of domestic and non-domestic buildings. Lighting encompasses all four of these sectors. Existing lighting systems can be replaced from anything from 3-year cycle in some service sectors to the 20 years lifetime of a lighting or lighting control components in the domestic sector. Lifetime can rely on a single component or that of the whole system. The integration of LEDs into the existing building stock could be restricted to replacing just the fluorescent tube rather than the whole system or circuit. 3 Additional Benefits Score 4 The introduction of LED lighting systems will have an effect on the amount of internal heat gained, therefore reducing the cooling load. Secondly by improving the controls of lighting systems and integrating them with the overall building management system efficiency and security of supply would be improved. Summary This technology topic is LED lighting systems for architectural lighting. There is a large amount of research being done on an international level both funded by Governments and industry, both recognizing that the energy saving potential is huge. There are several key areas amongst this for further research: manufacturing cost reduction, extending lumens and efficiency and development of integrated products for the market place, the latter being developed by manufacturers. The remaining two areas are being researched in this country and it is important for the Government to continue supporting them. The potential energy reduction of LED lighting as an alternative is hard to determine, as there is no standard method for comparison. However, studies are addressing this and, when complete, will enable precise conclusions to be made. References European Research References: http://www.ecbcs.org/annexes/annex45.htm http://lightinglab.fi/IEAAnnex45/ US Research References: http://www.lrc.rpi.edu/index.asp http://lightingdesignlab.com/index.html http://www.netl.doe.gov/ssl/highlights_ge.html http://search.nrel.gov/query.html?col=eren&qc=eren&qm=1&si=0&ht=2128387210&ct=1923033762 US Market Research: http://www.abiresearch.com/products/market_research/LEDs_and_Laser_Diodes

104
UK Research References: http://www.bath.ac.uk/pr/releases/nat-sunlight.htm http://www.forge-europa.co.uk/press21.htm http://www.whiteleds.co.uk/ http://www.phy.cam.ac.uk/research/research/ http://www.carmtechnology.com/cent_opt.asp EU Standard References: http://www.cie.co.at/cie/

105
Industrial Energy Efficiency Technology Advanced process plant design Overview Process plant is defined here as a combination of process steps or unit operations including feed preparation, reaction and separation, which, when combined, result in the conversion of feed material into finished product. The definition of process plant is applicable to all industrial operations from high temperature metal processing, to chemical manufacture and includes textiles, paper and glass manufacture. . Because of the range of the definition, over 34,000 sites can be included in the assessment. Process plant design can be greatly improved in terms of overall efficiency by the merging of some unit operations and the integration of process control at the design stage. The software tools to enable this step change in design practice are at the embryonic stage and need to be fully developed into practical tools that can tackle a wide range of different processes. Technology The technology is the next-step plant design package which designs plants that are optimised for energy and environmental benefits as well as cost. The new design package looks to combine unit operations, and takes an integrated approach to thermal integration/waste heat recovery. Process control is considered an integral part of the design process rather than an add-on to the design once completed. Imperial College is the leading player in the development of the advanced plant design and simulation tools, and has developed some prototype tools with R&D funding under the Energy Efficiency Best Practice Programme (now the Carbon Trust). Their simulation tools (Speedup and gproms) are used by a wide range of universities engaged in process integration and intensification via the CAPE network e.g. UCL Computer Aided Process Engineering. The idea for the technology has been around for some time but has been slow to evolve. Although it has potential for significant energy savings, funding for the work is declining because results are not immediately beneficial instead requiring radical changes in plant design. Hence, companies are cautious about investing in the work. Support now would ensure that new design packages were produced and, where the opportunities arose, these would be applied to new plant design resulting in large energy savings.

106
Markets It is a technique with possibilities in most industrial sectors within the UK and throughout the rest of the world, although it will have most market potential in sectors in which the products tend to change relatively frequently such as food and drink and some chemicals. Assuming a 2% penetration, it is envisaged that this technique would be applied to around 700 significant sites within the UK. The technique will be mainly applicable to the design of new process plant, although it is possible that some benefit could be achieved from analysing existing plant to determine whether retrofit was possible. Greater flexibility in plant operation and product is a further benefit. This will assist the UK’s change from the processing of bulk products to higher added value materials. The market for the technique is highly dependant on the right market conditions existing to encourage the development of new process routes and the building of new plant. Issues/Challenges There will be a reluctance of design and industrial plant contractors to use design packages that will produce radically new designs, and there will be a reluctance of industry to change existing process routes that are reliable in delivering the required product. The main challenges are to:
• inform company design engineers about benefits of the new design packages;
• persuade design contractors to take up the new software packages; • inform senior and plant managers of the benefits of the resulting new plant
designs. Only a limited amount of new plant is likely to be built within the UK, hence a low market penetration of around 2% has been forecast. A further challenge would be to adopt the techniques to upgrading existing plant. This would increase the energy savings potential considerably. The technical challenge is to design a package that can produce a highly integrated process plant with more accurate process control. The package would have to produce designs that would deliver the same, if not improved, yield and reliability whilst improving energy efficiency and flexibility. Key Characteristics
Unit Value Comments Margin investment cost/ unit *
£ 2,000,000 An estimate based on the assumption that software simulation plus some pilot work will be required.
Annual energy Consumption
MWh 70,080 Estimated, based on total energy consumption and number of units. Assumed unit size will vary considerably.
O&M costs/year % 0 But will vary either side of zero. Percentage savings % 25 Other and additional cost savings
£/year 600,000 Estimated savings from improved overall efficiency, improved yield and throughput.

107
Utilisation or seasonal efficiency
% 80
Availability Date 2015 - 2020 Plant lifetime Years 25 Payback Years 2.6 Depending on scope of work Fuel split % 10 Electricity
90 Fossil
* This measure takes into account the saving compared to the existing technology Key Players There are a number of Universities working in this area including:
• Imperial College; • UCL; • University of Newcastle; • UMIST; • University of Leeds.
Of these, Imperial College is at the forefront in development of the technology, and has produced some prototype tools with R&D funding from the former Energy Efficiency Best Practice Programme. This led to the formation of two spin–off companies. Aspentech (US) took a licence on the original Imperial College software, but Imperial College has since produced a more refined version. The main industrial companies/organisations involved in this work with Imperial College are:
• Shell; • BP; • GSK; • Astra Zeneca; • BASF; • ABF.

108
Technology Development Potential gaps in the innovation chain: There is a lack of funding for long term R&D on software tools for simulation. Some EU funding is available but this is diminished by the need for multiple EU partners. The UK would benefit greatly from a centre of excellence in this area. Blue skies research
Industrial R&D
Full-scale prototype
A-model prototype
Series production
Mk II design
Long-run series production
2005 2015 2020 2020 2020 2050 2050 Carbon Summary Date/data Penetration
(%) CO2
(kt/year) CO2 (£/t)
Comments
2010 2 58 -50 2015 10 284 -52 2020 20 554 -54 2050 80 1,860 -54
Penetration will be slow, initially, due to the evolution of the design tools, and the fact that process plant has a long lifetime.
Technology Impact Assessment 1. Estimated UK Economic Benefits Score 4 UK Universities are active in developing these design tools, and have the skills to continue this work. The end-user take-up is likely to be driven by overall cost benefits (of which energy savings will be around 20%), but may require additional legislation to help overcome the major barriers. The economic benefits to industry would be:
• improved process control resulting in improved yield, less waste material, and improved quality of product;
• less use of raw materials and water; • lower energy costs; • lower operating and maintenance costs because of improved control and
smaller more integrated process plant; • greater flexibility in plant operation.
The overall economic benefits to the UK are:
• improving the performance of process plant designers/contractors leading to work outside the UK;
• improving the performance of UK process plant and helping to safeguard UK jobs;
• development of a further spin-off company (or companies) for selling the design tools and carrying out support consultancy
• support for UK universities in maintaining their lead in research. 2 Scope for Government Action Government funding could make the most difference to progress of the technology by providing funding to universities to reduce timescales for, and increase the scope of, the existing research and development of the design tools. The existing UK and EU funding for this work is in decline causing Imperial College to drastically reduce the 50 or so people working in this area. Government support could also:

109
• help to find additional industrial partners for these R&D activities and potential demonstration projects;
• provide support and assurance to process plant design companies and contractors;
• provide backing for demonstration projects; • show industry that government is supporting the research and thus
providing industry with more confidence in the potential results of the work.
3 Market Entry Score 4 Barriers to these techniques and equipment being taken up include:
• research organisations need economic support to continue the development of these process design tools: government funding would help address this issue;
• research organisations need help in finding more, industrially-oriented, collaborative partners (economic/behavioural). Additional funding would give researchers time to forge commercial partnerships, and give industry the assurance that government supported the work.
• lack of investment from industry in terms of funding for research (economic/behavioural): government support would help the credibility of the research making industrial support more likely, and would lessen the investment burden on industry;
• lack of industrial manpower to support these process design tools (economic/behavioural): government support would give industry confidence to commit staff time to these techniques;
• reluctance of design engineers/contractors to use these new process tools (behavioural/technical): government support would help to inform, and also provide confidence in the new software. A policy tool could also be introduced to formalise the use of these design tools and could be supported by design audits;
• reluctance of industry to change equipment/techniques that deliver product reliably (economic/behavioural/technical): government support would provide confidence in the new design techniques and subsequent new plant designs, and possibly financially support initial use.
Without government funding the design software may not be produced within the UK, or if it is, development time will be longer, research will be less focused, and the chances of support from industry far less. 4 Risk Score 3 The main risk to the product is that the software will not be developed within the UK because of lack of funds and industrial support. The major risks to the uptake of the product are the lack of industrial support, the reluctance of contractors to use the software tools and produce radically new plant designs, and the lack of opportunities to demonstrate the process design software due to the lack of new industrial plant being built within the UK. Technically, the perceived advantages of the techniques may not turn out to be as large as expected.

110
It is also difficult to estimate the benefits, before a study, so many companies stay with the tried and tested methods except when regulation forces the issue. A large demonstration project could cost several million pounds. Carbon Dioxide Reduction Questions 1 Carbon Dioxide Reduction Score 4 and 4 There is the potential to save 1,860 Kt/year of carbon dioxide when the market is fully active. This potential is based on the market penetration discussed below. 2 Market Penetration Score 2 This is difficult to quantify due to the lack of information on the likelihood of the building of new process plant. This will depend on economic conditions within the UK, how these compare to the rest of the world, and as a result the economics of building new plant within the UK compared to the rest of the world. However taking the industrial sector as a whole, the number of suitable processes where new plant is to be built will be small. However there will also be some opportunities for retrofit. It is estimated that around 2% of UK industrial sites will use these new design tools. 3 Additional Benefits Score 3 Additional benefits include:
• improvements to product throughputs and yields; • greater flexibility in operation of plant and in type of product; • general improvement in the overall efficiency of UK industry; • improved environmental performance through less waste; • Safeguarding of UK jobs.
Typically energy/carbon savings form around 20% of the overall potential cost savings from this technique. Summary Advanced plant design will lead to large energy savings. There is the potential to save 1,860 kt/year of carbon dioxide when the market is fully active. The techniques used for advanced plant design are being developed and with government support will reach the market place. UK Universities are the leading developers of these techniques and hence this is a prime opportunity for R&D funding. There are a number of barriers including the need to increase research and industrial collaboration, the need to persuade senior managers in industry of the benefits advanced design can bring, and the need to persuade design contactors and engineering companies to adopt the new design software, thereby producing radical new plant designs. These barriers can be overcome through increased government funding of the research, a drive to inform design contractors and senior managers, by the support for one or more demonstration projects, and possibly by legislation to encourage the use of the new design methods developed.

111
The overall scope for advance plant design is large due to the potentially high percentage savings but is limited by the number and type of new plants where additional savings can be made by advance plant design. There are many benefits for the UK as a whole including large energy savings, the potential to give UK companies an edge in terms of improved yield and product quality, and the possibility of winning process plant design and consultancy work overseas. As well as through energy savings, UK industrial environmental performance will be improved through less water use and less waste. References EEPC (99)RD006: The Development of a Process Design Toolbox for Energy Efficiency - Imperial College.

112
Industrial Energy Efficiency Technology Intelligent agent-based optimisers for industrial production management and scheduling systems, and advanced process monitoring and control systems Overview Intelligent agents are computer programs that carry out a task unsupervised and apply some degree of intelligence to the task. They are a development of expert systems that leading academics claim could substantially increase the productivity and flexibility of UK manufacturing industry, while optimising its energy consumption. The potential applications for intelligent agents are very widespread, but the primary applications from an energy efficiency perspective lie in production scheduling and the optimisation of process control systems, particularly at batch manufacturing sites. The potential carbon savings that this radical approach technology could realise varies with sector, the size of the organisation and its position in the supply chain. Estimates range between 2 and 6% for large coherent production sites and 20% at speciality manufacturing sites. As the technology is not expected to reach the market before 2010-15, it is difficult to provide a detailed estimate of its energy and carbon saving potential. However, an initial estimate of the potential carbon savings that the technology could deliver is 300 ktCO2/year through better scheduling in the steel, chemicals, and food and drink sectors. If the technology is extended to other areas (eg intelligent plant monitoring and transport logistics) then it might deliver potential carbon savings of between 1 and 2 MtCO2/year.
Technology Intelligent agents are built around a knowledge base containing data that enables them to recognise and respond to particular events, such as sensor failure, a gap in a schedule or a change in market demand. More complex intelligent agents include the ability to negotiate for resources with other agents, and can act as intermediaries (or brokers) in volatile financial markets. Research suggests that intelligent agents could substantially increase the productivity and flexibility of manufacturing industry by:
• optimising production schedules; • controlling set points, maintenance routines and tolerance bands
(cf product quality); • monitoring process operations for equipment faults and impending plant
failures. They could also be used to minimise energy and material use, and waste production, particularly in batch manufacturing operations and ‘just in time’ supply chains. Intelligent agents are at an early stage of technology development, but have been used successfully by Internet search engine companies, and by BT for network fault recognition and optimisation of call routing in congested networks. Corus has taken part in an EU-funded R&D project that explored the potential use of intelligent agents in production and maintenance scheduling of steel rolling at its Teesside works. This research work progressed as far as some modelling and prototyping work on one

113
section of the rolling mill, before the project was closed down due to company reorganisation.
Markets The potential applications for intelligent agents are very widespread in the UK and the rest of the world, but the primary applications from an energy efficiency perspective lie in production scheduling and the optimisation of process control systems, particularly in batch manufacturing sites. The UK has a strong skills base in these fields and is home to several of the leading international software houses (see reference 6 for list). The key application sectors are electricity supply, iron and steel, non-ferrous metals, chemicals, food and drink, paper and board, and water. However, the technology also has potential applications in engineering, textiles, and supply chain logistics. The potential carbon savings that the technology could realise vary with sector, the size of the organisation and its position in the supply chain. At Corus, potential energy savings of between 2% and 6% were identified for the use of intelligent agents, but other research projects (eg at Bromford Iron and Steel) suggest that there is scope to increase energy productivity of batch manufacturing by up to 20%.
Issues/Challenges Intelligent agent technology is still at a relatively early stage of development (mainly blue skies, but some industrial R&D) and its true potential has yet to be established beyond a few niche market applications. The technology is evolving rapidly but has yet to reach the point were application toolkits have been developed to enable its widespread deployment within production management and process control systems. This will probably require a further ten years of research and development, although proprietary toolkits may emerge from the big multinational process control companies like Honeywell within five years or so. However, these are unlikely to tackle the issue of optimising energy and carbon use, unless Government support is provided for this. One of the challenges to address is the lack of long-term funding for UK-based research work aimed at using intelligent agents to optimise energy and carbon use through better production scheduling. So far, funding for R&D in this area has been limited to small one-off projects, apart from one large EU project and one large DTI-funded project. It is difficult identify why more research projects have not been funded, but it is probably linked to the fact that these application require the development of advanced, robust, numerical algorithms capable of multi-parameter optimisation. This is a complex research topic and the algorithms could take at least ten years to reach maturity. This is too long a time for industrial sponsorship and hence it is difficult for universities to attract grants. Without industrial involvement, it is also difficult to develop the technology in a way that industry can easily adopt and apply it.
Key Characteristics
Unit Value Comments Marginal investment cost/unit*
£ 150,000 Assumes advanced management information systems will be in place by 2015
Annual energy MWh 50 Large organisations with complex supply
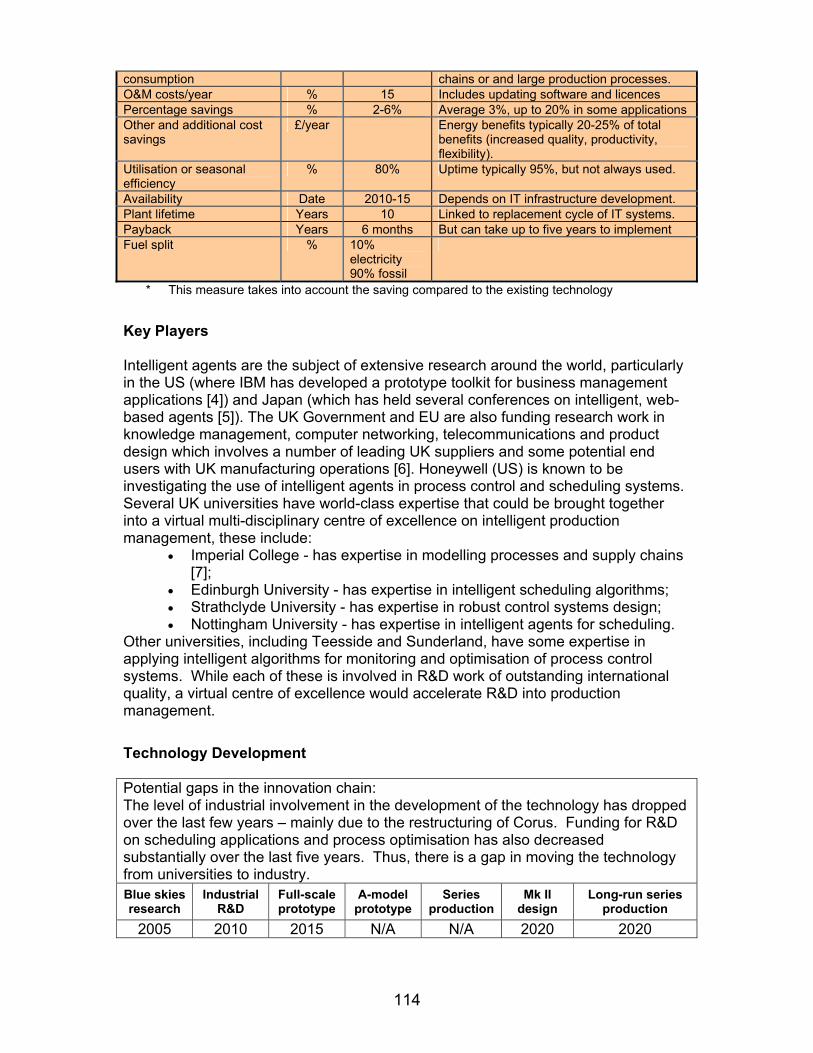
114
consumption chains or and large production processes. O&M costs/year % 15 Includes updating software and licences Percentage savings % 2-6% Average 3%, up to 20% in some applications Other and additional cost savings
£/year Energy benefits typically 20-25% of total benefits (increased quality, productivity, flexibility).
Utilisation or seasonal efficiency
% 80% Uptime typically 95%, but not always used.
Availability Date 2010-15 Depends on IT infrastructure development. Plant lifetime Years 10 Linked to replacement cycle of IT systems. Payback Years 6 months But can take up to five years to implement Fuel split % 10%
electricity 90% fossil
* This measure takes into account the saving compared to the existing technology
Key Players Intelligent agents are the subject of extensive research around the world, particularly in the US (where IBM has developed a prototype toolkit for business management applications [4]) and Japan (which has held several conferences on intelligent, web-based agents [5]). The UK Government and EU are also funding research work in knowledge management, computer networking, telecommunications and product design which involves a number of leading UK suppliers and some potential end users with UK manufacturing operations [6]. Honeywell (US) is known to be investigating the use of intelligent agents in process control and scheduling systems. Several UK universities have world-class expertise that could be brought together into a virtual multi-disciplinary centre of excellence on intelligent production management, these include:
• Imperial College - has expertise in modelling processes and supply chains [7];
• Edinburgh University - has expertise in intelligent scheduling algorithms; • Strathclyde University - has expertise in robust control systems design; • Nottingham University - has expertise in intelligent agents for scheduling.
Other universities, including Teesside and Sunderland, have some expertise in applying intelligent algorithms for monitoring and optimisation of process control systems. While each of these is involved in R&D work of outstanding international quality, a virtual centre of excellence would accelerate R&D into production management.
Technology Development Potential gaps in the innovation chain: The level of industrial involvement in the development of the technology has dropped over the last few years – mainly due to the restructuring of Corus. Funding for R&D on scheduling applications and process optimisation has also decreased substantially over the last five years. Thus, there is a gap in moving the technology from universities to industry. Blue skies research
Industrial R&D
Full-scale prototype
A-model prototype
Series production
Mk II design
Long-run series production
2005 2010 2015 N/A N/A 2020 2020
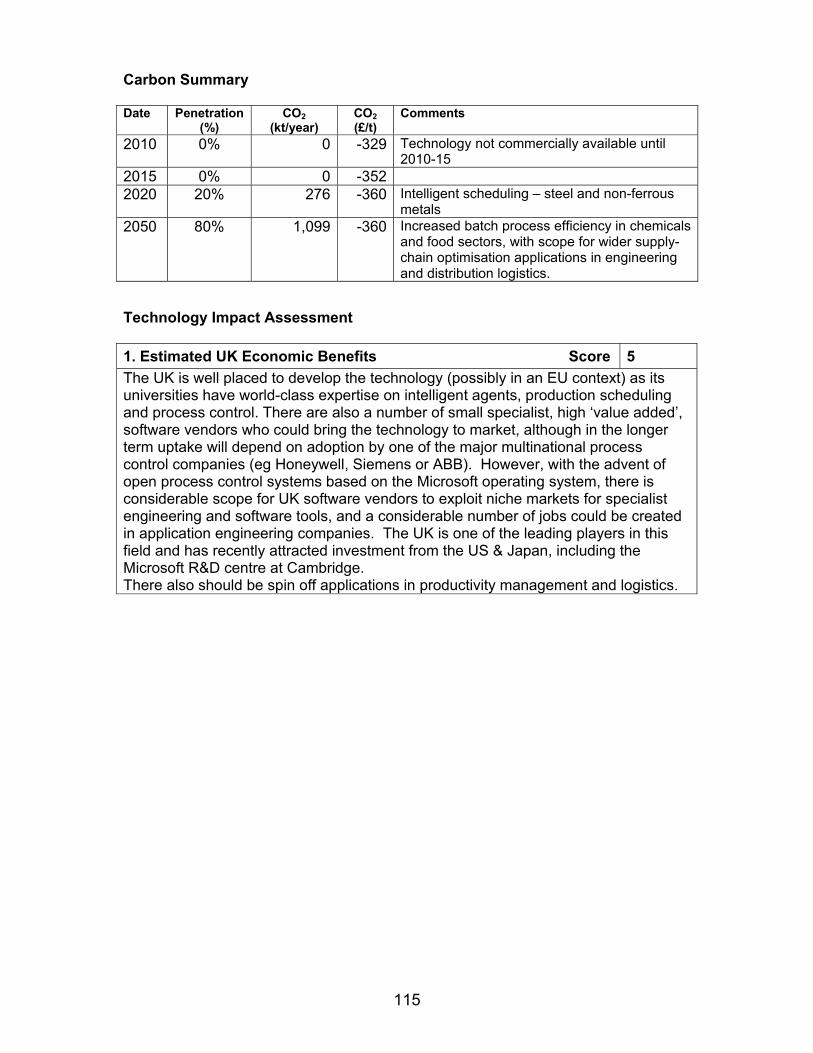
115
Carbon Summary Date Penetration
(%) CO2
(kt/year) CO2 (£/t)
Comments
2010 0% 0 -329 Technology not commercially available until 2010-15
2015 0% 0 -352 2020 20% 276 -360 Intelligent scheduling – steel and non-ferrous
metals 2050 80% 1,099 -360 Increased batch process efficiency in chemicals
and food sectors, with scope for wider supply-chain optimisation applications in engineering and distribution logistics.
Technology Impact Assessment 1. Estimated UK Economic Benefits Score 5 The UK is well placed to develop the technology (possibly in an EU context) as its universities have world-class expertise on intelligent agents, production scheduling and process control. There are also a number of small specialist, high ‘value added’, software vendors who could bring the technology to market, although in the longer term uptake will depend on adoption by one of the major multinational process control companies (eg Honeywell, Siemens or ABB). However, with the advent of open process control systems based on the Microsoft operating system, there is considerable scope for UK software vendors to exploit niche markets for specialist engineering and software tools, and a considerable number of jobs could be created in application engineering companies. The UK is one of the leading players in this field and has recently attracted investment from the US & Japan, including the Microsoft R&D centre at Cambridge. There also should be spin off applications in productivity management and logistics.

116
2. Scope for Government Action Score At present, the UK has some of the leading experts in the field as a result of the recent pilot project at Corus. The UK could establish a clear competitive edge if the Government invested in an academic centre of excellence (based particularly around the expertise in scheduling algorithms at Edinburgh University) and funded an R&D programme to accelerate the development of intelligent agents for production scheduling, process optimisation applications, supply chain optimisation and logistics. Key R&D areas include algorithms for handling complex competing constraints including energy use and carbon emissions (these could also have applications in carbon trading schemes). The R&D areas have received relatively little support from the UK Government over the last ten years because R&D funding on carbon saving measures has been very tightly focused on ‘improving the hardware’ rather than on improving the business tools that dictate when and where production should be scheduled within the global supply chain. However, by investing in the development of new business tools that are able to factor in energy and carbon use into such decisions (via intelligent agents), the Government could open up several new areas for potential carbon savings that are not otherwise accessible.
3. Market Entry Score 4 The main barriers to entry are:
• the complexity of the technology; • the short-term focus of current industrial R&D; • a shortage of long-term research funding needed to drive the technology
into the marketplace. Another problem is the constantly shifting nature of the underlying computing platform which means that a large programming team is needed to develop, deploy and maintain the technology. This last problem could be tackled by supporting the development of a critical mass of research workers at a UK centre of excellence.
4. Risks Score 3 Because the underlying intelligent agent technology is not yet mature, and the underlying computing platform is constantly shifting, application software could have a short shelf life unless there is a long-term Government commitment to continue R&D work in the area. If a continuing stream of R&D funding is not provided, there is also a risk that the development team will be diverted away from energy optimisation toward potentially more lucrative fields such as distribution logistics and financial market management. This is what happened to the team working at Corus – resulting in a loss of impetus.

117
Carbon Dioxide Reduction Questions 1. Carbon Dioxide Reduction Score 3 and 5 As the technology is not expected to reach the market much before 2010-15, it is difficult to provide a detailed estimate of its energy and carbon saving potential. However, there are some early indications that the technology could realise substantial energy and carbon savings in multinational organisations with complex supply chains. An initial estimate of the potential carbon savings that the technology could deliver is 300 ktCO2/year by better scheduling in the steel, chemicals, and food and drink sectors. If the technology is extended to other areas (eg intelligent plant monitoring and transport logistics) then it might deliver annual carbon savings of between 1 and 2 MtCO2.
2. Market Penetration Score 3 The technology is likely to be taken up by most multinational companies. A market penetration of 20% could be achieved by 2020 and possibly 80% by 2050. The high penetration figures are attributable to the other business benefits that could be delivered in addition to potential carbon savings, including increased product quality, throughput and production flexibility. However, market penetration is dependent on the availability of a high-quality IT infrastructure within multinational companies, which is based around open systems standards and on the integration of key carbon saving features into business toolkits. This is unlikely to happen without Government support as the focus of current research is on using intelligent agents to minimise production cost, to maximise throughput and meet just in time constraints regardless of energy/carbon use.
3. Additional Benefits Score 5 In general, the energy and carbon savings represent only 20 to 25% of the business benefits of control improvement projects. Other benefits typically include, improved product quality, increased throughput, more flexible production, reduced materials use, higher yields and lower manning levels. (See Good Practice Guide 215 for details). It should be noted that control improvement projects do not automatically result in energy and carbon savings – unless the energy and carbon savings are a specific project objective.
Summary Intelligent agents are a new computing technique that could substantially increase the productivity and flexibility of any country’s manufacturing industry, while optimising its energy efficiency. They have a wide range of potential applications, but the primary applications from an energy efficiency perspective lie in production scheduling and the optimisation of process control systems, particularly in batch manufacturing sites. The potential carbon savings that the technology could realise varies with sector, the size of the organisation and its position in the supply chain. Estimates range between 2 and 6% for large coherent production sites and 20% at speciality manufacturing sites. An initial estimate of the potential annual carbon savings that

118
the technology could deliver is between 1 and 2 MtCO2, which assumes an 80% market penetration by 2050. The technology is at a fairly early stage of development and there is scope for the UK Government to steer the technology towards industrial energy and carbon management applications. There is some industrial support for the development of the technology, but additional R&D funding is needed to accelerate its development and application, and to expand the range of applications being investigated by UK universities.
References [1] P. Cowling, D. Ouelhadj, and S. Petrovic (2004) Dynamic scheduling of steel casting and milling using multi-agents. Production Planning and Control, Special Issue on the Application of Multi Agent Systems to Production Planning and Control, 15, 1-11. [2] P. Cowling, D. Ouelhadj, and S. Petrovic (2003) A Multi-Agent architecture for dynamic scheduling of steel hot rolling. Journal of Intelligent Manufacturing, Special Issue on Agent-Based Manufacturing Process Planning and Scheduling, 14 (5), 457-470. [3] The Carbon Trust, Reducing energy consumption through modern control technologies, Good Practice Guide 215. [4] Intelligent Agents Project at IBM T.J. Watson Research: see http://www.research.ibm.com/iagents/ [5] The Second Asia-Pacific Conference on Intelligent Agent Technology (IAT-2001) see http://www.comp.hkbu.edu.hk/IAT/iat01/ [6] The Agentlink portal, see: http://www.agentlink.org/ [7] The Co-Ax, Enterprise, I-X Projects at AIAI, Edinburgh University http://www.aiai.ed.ac.uk/project/ For more details visit: www.nesc.ac.uk/talks/309/DjamilaOuelhadj.ppt www.nesc.ac.uk/technical_papers/UKeS-2004-03.pdf http://www.cs.nott.ac.uk/~dxs/dxsPublications.htm

119
Industrial Energy Efficiency Technology Decarbonisation/dematerialisation Overview Environmental policies in the UK and elsewhere seek to achieve a reduction in emissions of CO2 and other greenhouse gases (GHGs) by reducing worldwide dependence on fossil fuels and petrochemicals.
Significant GHG emissions arise during manufacturing processes and handling of the resulting waste materials. The process of ‘decarbonisation’ could radically reduce energy use and the amount of material required for industrial production, hence reducing GHG emissions through complete changes within an industry. This will be done through radical changes to industrial production equipment where the whole industries production will change, not just single changes within product manufacture.
Decarbonisation is the elimination of carbon intensive components in the manufacturing supply chain, from raw material processing through to the finished product. Decarbonisation is driven by dematerialisation, which is using less raw materials and energy (in part through recycling) whilst maintaining or improving the product or commercial service. Decarbonisation normally involves some product redesign and light-weighting (see separate assessment) but its focus is on eliminating carbon use from the supply chain and manufacturing process, as well as minimising the lifecycle impact of the product.
Decarbonisation and dematerialisation are closely linked and are used interchangeably. Their shared focus is the material and energy flows within the manufacturing supply chain; their size and duration; the short, medium and long-term trends; and the overall shifts in indicators such as kWh or kg/functional unit. By understanding and accounting for these flows, the true carbon footprint of products can be understood.
As an example, the Echopanel, produced by Woven Image (http://www.wovenimage.com), is designed to replace textile-covered tiles in workstation systems and is a lighter, more flexible recyclable partitioning system. The product enables dematerialisation through the elimination of combined fabric and wood panel screens, partitions and tiles.
Technology In the short term, decarbonisation involves a re-assessment of a selection of industrial process routes important to the UK economy, with a view to radically improving energy efficiency. This assumes that product and process performance will be constant over the next five to ten years. A reassessment could also include the impact of imports and consider how their energy and other environmental costs can be recognised.
In the medium to longer term (10 to 50 years hence) material and energy flows are likely to develop along the life cycle of current, new or yet-to-be-developed product systems (eg television can be considered as a developed product system which includes video and DVD players, satellite dishes, etc). The performance of domestic

120
and non-domestic products is the focus of Defra’s Market Transformation Programme (MTP). The MTP includes all major domestic energy-consuming appliances (lighting, heating, refrigeration, humidifying, cooking and consumer electronics) and traded goods in the commercial sector (see: http://www.mtprog.com).
Markets Based on the Dutch Emissions Register, VROM (2000) identified a number of industry sectors as having a high environmental load per added value. Sectors with a high environmental load are basic chemicals, oil refining, electricity generation, basic metals (dominated by aluminium), agriculture, and horticulture. These sectors have the greatest potential for reducing material intensity through decarbonisation strategies. Such strategies are based on incentivising the elimination of carbon intensive components by:
• providing information, • improving labelling, • providing tax incentives, and • supporting research & development (R&D) aimed at developing intelligent
support systems to accelerate decarbonisation across all sectors. Other industrial sectors with a medium to high environmental load are paper and board, building materials, stoneware, glass and food processing. Issues/Challenges Economic growth over the next 50 years will be accompanied by the continuous introduction of new products and production technologies. Decarbonisation will have to constantly evolve to meet these innovations. Future regulatory regimes - EC driven, through national legislation - will influence product design and the development of new production technologies and may drive decarbonisation. There are likely to be trade-offs depending on where new products or product systems are in their product life cycle. Strategies for decarbonisation/ dematerialisation are likely to be most effective in stable markets where production is standardised, economies of scale are achieved and recycling is economic. Changes in the product/service mix and demand will affect GHG emissions. The value of a service is based on knowledge, capital and labour rather than on materials. Nonetheless, increased demand for services could push up overall emissions. Further issues which need to be considered are listed below.
• How to reflect and account for the material intensities of imported components and products as part of a decarbonisation strategy for the UK.
• How to facilitate the substitution of higher embodied-energy products or components for lower embodied-energy versions, without detriment to quality or availability.
• How to encourage acceptance by consumers and industrial producers of decarbonisation as a desirable attribute for products and services. This is particularly important because product redesign will require a co-operative approach between designers, packaging and product manufacturers,

121
transport and logistics companies, retailers, waste management companies and recyclers.
Key Characteristics
Unit Value Comments Percentage savings % 30% Potential savings attributed by studies
to decarbonisation Availability Date 2007
onwards Short-term strategies to 2007 Medium- to long-term strategies from 2010
Plant lifetime Years 5 to 15 years Depending on technology Payback Years 3 to 5 years Additional design work and product/
process modification is expensive Fuel split % 60%
Electricity 40% Fossil
Standard industrial mix
Key Players Overseas:
• Energy Technology Systems Analysis Programme (ETSAP): http://www.etsap.org • Centre for Design, Royal Melbourne Institute of Technology (RMIT):
http://www.cfd.rmit.edu.au • Wuppertal Institute for Climate, Environment and Energy:
http://www.wupperinst.org/Sites/home1.html • Tinbergen Institute: Institute of economic research of the Erasmus
Universiteit Rotterdam (EUR), the Universiteit van Amsterdam (UvA), and the Vrije Universiteit Amsterdam (VU): http://www.tinbergen.nl/home.html.
UK
• Tyndall Centre: http://www.tyndall.ac.uk • Centre for Sustainable Consumption, Sheffield Hallam University:
http://www.shu.ac.uk/schools/slm/csc.html • International Ecotechnology Research Centre, Cranfield University:
http://www.cranfield.ac.uk/sims/ecotech/ • The Centre for Sustainable Design, The Surrey Institute of Art & Design,
University College: http://www.cfsd.org.uk • Centre for Urban and Regional Ecology, University of Manchester:
http://www.art.man.ac.uk/planning/cure • Centre for Process Systems Engineering, Imperial College of Science,
Technology & Medicine, University of London: http://www.ic.ac.uk Technology Development The key barrier to wider application of decarbonisation technologies and strategies is the short-term focus of R&D in most UK industries. Blue skies research
Industrial R&D
Full-scale prototype
A-model prototype
Series production
Mk II design
Long-run series production
2005 2005 2010 2015 2020 2025 2050

122
Carbon Summary
Date/ data
Penetration (%)
CO2 (kt/year)
CO2 (£/t) Comments
2010 2.5 92 - 50 to 0 Assumes technology is currently commercially available in specific sectors
2015 5 183 -50 to 0 Assumes technology is more widely utilised in other sectors, as a result of legislation
2020 15 550 -50 to 0 Assumes new product development and new product systems
2050 50 3,667 -50 to 0 Assumes wider applications throughout industry
Technology Impact Assessment 1. Estimated UK Economic Benefits Score 4 The UK is well placed to develop, apply and integrate decarbonisation technologies and strategies into its manufacturing industries, having leading academic research centres for sustainable design and materials, as well as specialist engineering and transportation industries. To achieve the required scale, the technologies and approach will need to be applied across industry in areas of mass production rather than simply in niche areas. This is most likely to be achieved in the short term by legislative pressure, moving towards consumer pressure in the medium- to long-term. 2 Scope for Government Action Score Government action could include both new and extended policies to create a regulatory and incentive-based framework to drive decarbonisation/ dematerialisation. Types of policy options are required which avoid technological and institutional ‘lock-in’ (as described by ICCEPT, 2002) to the existing material and carbon-intensive manufacturing process. These might include the provision of:
• public support for R&D into technologies in the early stages of development; • enhanced funding for academia to participate in industry schemes (eg
extending the Department of Trade and Industry grant-based ‘Knowledge Transfer Partnership’ scheme (see http://www.ktponline.org.uk) to support initiatives for decarbonisation in fields such as product design).
3 Market Entry Score 4 The key barrier to wider decarbonisation is the short-term focus of R&D in most UK industries. Other barriers are:
• behavioural (eg consumer/customer acceptance); • institutional (eg institutional lock-in); • technical (eg maintaining product specifications with fewer resources); • economic (eg lack of co-operation in industrial supply chains).

123
4. Risks Score 3 Risks of decarbonisation include:
• knock-on effects to the economy of an overall reduction in materials being processed;
• transfer of UK manufacturing to overseas, where material-intensive production may be less regulated, resulting in a loss of jobs in the UK;
• barriers caused by the complexity of accounting for the materials intensity of imported components used in manufacturing and other products/services (including transport emissions);
• health risks to end-users and the environment from chemicals and products that persist (so that they can be recycled) and also bio-accumulate (FFTF, 2002);
• lack of public acceptance of new technologies and their science, eg genetically modified crops engineered to produce chemicals or hormones for the pharmaceutical industry.
Carbon Dioxide Reduction Questions 1 Carbon Dioxide Reduction Score 3 and 4 Currently, decarbonisation is largely based on theoretical studies. This means that an assessment of wider savings across industry is difficult to produce. However, savings in industrial sectors with a high environmental load are likely to be significant. Savings may be around 3,667 tonnes CO2/year. =2 Market Penetration Score 4 There is high potential for market penetration across a range of energy- and materials-intensive industries, cascaded through their supply/value chains. However, existing analytical tools such as life cycle analysis and material intensity analysis do not capture the complexity of existing chains.
Regulation is important in mandating action on decarbonisation/dematerialisation. For example, product recycling and material re-use has been driven by EU legislation to make producers responsible for products and materials from source to disposal (including providing a take-back service).
Industries that are likely to be receptive to dematerialisation initiatives include:
• building and construction industries (production and use of energy-intensive building materials including cement, bricks, blocks and plasterboard);
• quarrying and other materials processing (CURE, 2001); • automotive and logistics industries in manufacturing and waste recycling
chains (for materials such as steel, aluminium, plastics, glass and fabrics as well as electronic devices);
• automotive and logistics industries in ‘use’ chains (such as supply of fuel, road infrastructure and repair services);
• information, consumer electronics and telecommunications industries (through new requirements for producers to consider take-back, disposal and recycling waste products, etc);

124
• packaging industries including, indirectly, the food & drink industry (in the short to medium term, driven by compliance with the Producer Responsibility (Packaging Waste) Regulations (amended) that implement the EC Directive on Packaging and Packaging Waste 94/62/EC in force 1994; in the long-term, driven by a move towards zero waste recycling);
• chemicals and process industries (in designing for recycling and re-use of materials; in the development of new products or radically redesigned products; in new production systems using significantly less petroleum-based raw materials; and in bioengineering crops to produce chemical feedstocks).
3. Additional Benefits Score 5 Additional benefits would include:
• better, more efficient product design; • conservation of natural resources; • increased recycling and re-use of components; • extended and planned product lifecycles; • reduction in energy use in primary conversion of products; • use of alternatives to petrochemicals; • development of new technologies in recycling etc; • reduction in material imports and avoided transportation emissions and
costs. Summary Decarbonisation/dematerialisation is the elimination of the carbon intensive components in the manufacturing supply or value chain, from raw materials processing through to the finished product.
The approach takes into account the true carbon footprint of the product or service over its lifecycle and seeks, through re-design, to achieve a maintained or improved product or service whilst reducing the use of materials and energy, in part through recycling. It has considerable potential to achieve substantial savings (30 percent) in both business-to-business (B2B) and business-to-consumer (B2C) markets, through organisations’ supply or value chains. Industrial sectors with particular potential include building and construction, automotive and logistics, packaging industry, food and drink, and chemicals.
The most important barrier to wider application of decarbonisation technologies and strategies in both B2B and B2C markets is the short-term focus of R&D in most UK industries. Other barriers include:
• behavioural barriers in the B2C market (eg consumer and customer acceptance);
• institutional barriers to new manufacturing paradigms and product systems; • technical barriers (eg maintaining product specifications whilst using in less
material in components); • economic barriers (eg a lack of supply chain co-operation or inability to
raise finance for R&D).

125
Government action can help to overcome these barriers through a range of policy options, including:
• support for basic R&D; • enhanced funding of academia to participate in industry schemes; • schemes designed to educate consumers and to promote more efficient
products (eg through labelling); • market development policies for near-market technologies; • financial incentives through tax credits or hypothecated revenues.
Action should also be taken in conjunction with other governments to promote decarbonisation in the global economy. In the short-term, some steps could be taken in this respect such as encouraging the ECGD to adopt portfolio-wide carbon intensity standard for its projects.
References
1. VROM (2001): Dematerialisation – Less clear than it seems. VROM – DGM, 2001.
2. VROM (2000): Reducing Environmental Pressure by Dematerialisation: An analysis of the environmental load caused by Dutch production and consumption in relation to the use of materials. Final Report, 2000. VROM-DGM.
3. Tinbergen Institute (2000): The role of Material/Energy Resources and Dematerialisation In Economic Growth Theories. Tinbergen Institute Discussion Paper. TI 2000-068/3.
4. Wuppertal Institute (2000): Sustainable Development by dematerialisation in production and consumption – strategy for the new Environmental Policy in Poland. Wuppertal Papers, No.103. June 2000. ISSN 0949-5266.
5. ICCEPT (2002): Technological and institutional ‘lock-in’ as a barrier to sustainable innovation. ICCEPT Working Paper, November 2002.
6. IPPR (2005): Catalysing commitment on climate change. A paper for the International Climate Change Taskforce. Institute for Public Policy Research.
7. Allwood, D.M (2003): The Determination of appropriate sustainable development performance indicators for Export Credits Guarantee Department. University of Hertfordshire, MSc thesis (see http://www.ecgd.gov.uk/sdpis_thesis.doc)
8. CURE (2001): Resource flow audit for sustainability: A framework strategy for the North West. Report prepared by the Centre for Urban and Regional Ecology, University of Manchester in collaboration with the National Centre for Business and Sustainability and Sustainability North West.
9. FFTF (2002): The Sustainability of the Chemicals Industry: A report for the Chemicals Innovation and Growth Team – Regulation and Reputation Strategy Development Group. Appendix A1 – Biodegradability versus Durability, p.54. Forum for the Future: London. August, 2002.

126
Buildings Energy Efficiency Technology Demand controlled ventilation systems Overview
Indoor air quality in the domestic environment is becoming increasingly important. The supply of fresh air to occupants in a building is crucial. Traditionally, fresh air supply has not been included in the design of dwellings, as infiltration has supplied much of the fresh air. However, airtightness is closely associated with heat loss and has, therefore, become a key requirement for new buildings to ensure a reduction in heat loss. This has implications associated with the reduction of airflow in buildings, such as the build-up of carbon dioxide, contaminants and moisture. There is therefore a need to ensure that fresh air is supplied in a controlled manner. One way is to provide additional ventilation controlled by triggers such as humidity or pressure.
Technology Demand controlled ventilation systems (DCVSs) improve indoor air quality (IAQ). Improved energy efficiency is a secondary benefit which is achieved as a result of either removing the need for occupants to ventilate the building themselves, causing heat loss through open windows, or by removing the need for light-switch-controlled extract fans.
Markets Existing domestic sector ventilation is generally achieved by natural means, although manufacturers are already undertaking R&D into potential products for use in new dwellings. The international ventilation market as a whole is mature. National sales of central heating plant and local mechanical units are currently worth £12.5 million/year and involve sales both within the UK and internationally.
As with the building industry, ventilation systems can generally be split into two groups: new build and refurbishment. The existing domestic sector market for DCVSs is limited. Therefore, future demand is in new, airtight buildings, where control of indoor air quality is required. However, the development of a technique to improve the airtightness of existing buildings (covered under a different technology) would expand the market.
Issues/Challenges Whilst DCVSs have the potential to provide substantial energy savings, the product needs to be installed and used correctly to run at its optimum performance. The challenge would be to ensure that awareness is at a level that would guarantee the correct installation and use of the product.

127
Key Characteristics
Unit Value Comments Marginal investment cost/ unit*
£ 200 Assumes that the product can be sourced and installed locally and that installation takes 2 days
Annual energy consumption
MWh 13 Based on 1,000 hour/year running and maximum motive power of 2 kW
O&M costs/year % 0 Assumes that no servicing will be done in the lifetime of the equipment
Percentage savings % 30 Assumes that no servicing will be done in the lifetime of the equipment
Other and additional cost savings
£/year 0 While cooling is not a major requirement for the domestic sector, additional benefits might accrue from the supply of fresh air at night during summer periods. No cost is shown, as DCVSs would be an alternative to additional products, not yet seen in the housing stock.
Utilisation or seasonal efficiency
% 19
Availability Date 2015 Plant lifetime Years 10 The lifetime of the product Payback Years 2.9
Fuel split 100 fossil * This measure takes into account the saving compared to the existing technology
Key Players From 1987-1992, the Energy Conservation in Buildings and Community Systems (ECBCS) ran a research annex to develop an efficient DCVS, based on analysis of ventilation effectiveness and ventilation rates for different applications in domestic, office and school buildings. The project also involved field studies and work on sensor location and ventilation strategies. Since then, a separate research project has been ongoing to look at the control strategies for hybrid ventilation in new and retrofitted office buildings. The ECBCS report makes recommendations as to the types of control systems that should be looked at. Since its publication, both UK and European manufacturers have started further product development.
Last year BSRIA and University College London (funded by the Office of the Deputy Prime Minister) carried out field trials of pressure- and humidity-controlled slot ventilators in a domestic dwelling. These ventilators were provided by industry, some from R&D, and some from further down the development chain. The trials looked at the performance of the ventilators when installed in a house and furthered the research into their effectiveness.

128
Technology Development R&D has already taken place through industry and research centres (such as universities) working in partnership. Manufacturers are developing prototypes while more R&D continues on products. There is a potential gap in the development chain before the next step of R&D, as attention is turned to energy efficiency issues. Blue skies research
Industrial R&D
Full-scale prototype
A-model prototype
Series production
Mk II design
Long-run series production
2005 2005 2005 2005 2010 2015
Carbon Summary Date/data Penetration
(%) CO2
(kt/year) CO2 (£/t)
Comments
2010 2 16 -97 Assumes little penetration in existing building stock but some penetration in new-build, as airtightness requirements are improved.
2015 4 54 -101 This trend is continuous, as the market penetration of existing stock expands.
2020 8 144 -106 In line with the continuous trend 2050 25 700 -106 In line with the continuous trend
Technology Impact Assessment 1. Estimated UK Economic benefits Score 3 Manufacturers of domestic ventilation systems are well-established in the UK and international market, as explained above. Development of products is being undertaken by manufacturers in conjunction with universities. Some of the technological products are close to production and are due for introduction to the market soon.
DCVSs will be an addition to manufacturers’ current ranges of ventilation technologies and are likely to become appropriate because of future airtightness requirements.
The main driver for the development of this product is the close association that energy efficiency has with airtightness: if airtightness is improved, indoor air quality and moisture levels become an issue. Regulations such as the UK Building Regulations are becoming increasingly stringent with regard to airtightness, hence a new market need is emerging. 2. Scope for Government Action Score R&D is already being carried out by manufacturers. Further research is needed to investigate alternative methods for controlling ventilators and for determining what combinations and orientation of products give the most effective results. Research and field trials were carried out last year under the Building Regulations Research Programme. Further research could be funded through the same route. Airtightness is regulated by the Building Regulations. As the requirements become more stringent, it is likely that the construction industry as a whole will need to look for

129
alternative methods of providing fresh air to dwellings. This could be achieved by DCVSs. It is important that the Government steers industry towards these systems, rather than the continued use of less efficient methods such as PIR, light-switch-controlled methods, or even occupants opening windows, etc. 3. Market Entry Score 2 Industry is already carrying out R&D on DCVSs, although research tends to be commercially driven. There is a need to ensure that all aspects of energy efficiency are considered and alternatives assessed. Funding could be supplied to ensure that this research is carried out. The results of this independent research could then be fed back to industry to ensure that the focus is on developing systems with the highest levels of energy efficiency. 4. Risks Score 3 While the product has the potential to provide substantial energy savings, optimum performance depends on the product being installed and operated correctly. The challenge is to ensure that sufficient awareness-raising is undertaken to guarantee the correct installation and use of the product.
Carbon Dioxide Reduction Questions 1 Carbon Dioxide Reduction Score 2 and 4 Carbon estimates have been made on the secondary benefits that can be achieved by installing a demand controlled ventilator in a domestic situation, as it would be hard to estimate the proportion of non-domestic buildings to which it would be applicable. 2 Market Penetration Score 4 There are some 24 million existing dwellings in the UK and it is estimated that approximately 180,000 new dwellings are to be constructed each year. This is not only a product for dwellings, however, as there is also an opportunity to install it into schools and smaller office spaces. This means that the potential market is sizeable. Neither is the market is restricted to the UK, as airtightness is not a UK-specific problem. 3 Additional Benefits Score 3 This system offers some energy savings as a stand-alone system but its key benefit is that it can provide fresh air in dwellings that are highly airtight. It is this relationship with airtightness that offers additional energy savings. The unit will also offer increased comfort to the homeowner by maintaining the indoor air quality.
Summary Demand controlled ventilation systems’ primary purpose is to ensure good indoor air quality. However, installing a DCVS can lead to carbon savings as a result of removing the need for alternative ventilation techniques that use more energy.
The development of some control products by industry is close to market penetration. Some research by industry and universities in Europe and the UK has been done to compare the different benefits of these ventilation systems but more work is required

130
to establish the demand control method that offers the highest energy efficiency potential.
References http://www.aivc.org/ http://www.ecbcs.org/annexes/annex18.htm http://www.ecbcs.org/docs/Annex%2018%20TSR%20web.pdf http://www.bsria.co.uk/resext/info/projects-2001.htm http://www.bartlett.ucl.ac.uk/research/focus.htm

131
Buildings Energy Efficiency Technology Innovative insulation materials - vacuum insulated panels Overview Insulation in buildings conserves energy by limiting the rate at which heat escapes through the building fabric. There is no scope for using existing insulation products to further increase the U-value of buildings unless the wall thickness is increased beyond the current regulatory maximum of 300 mm (this restricts the cavity to a maximum width of 100mm). Increasing the thickness is not an acceptable option as it would contravene current legislation and would also be unpopular with developers, who would need to increase plot sizes in order to compensate. Furthermore, it would render worthless the recent research on acoustics, which is based on walls having a maximum cavity of 100 mm (as specified in the Building Regulations Part E). Therefore, there is a need to develop an effective slimline insulation method. Most insulation materials are developed through a process of evolution by commercial R&D departments. Developments are therefore closely guarded commercial processes. New materials may be developed from completely new sources and processes and these could emerge from other non-insulation industries and academia through the realisation that a new product or process could have alternative uses. New possibilities include organic products – these are undergoing a resurgence in popularity and are being used more readily by the construction industry. Their key advantage is that they are natural and have lower embodied energy. It is known that their U-values can vary greatly depending on quality, moisture content and other factors, although there is currently no monitoring or regulation of the products. There is therefore a need for research into the materials involved and their application in order to establish recognised standards and application-specific products. Technology Another emerging product is the vacuum insulation panel (VIP), which has already been used for many different applications such as refrigerators, freezers, and hot water storage tanks. It offers excellent performance and long life (15+ years) but has not yet been used as a construction product, although much research is currently underway. Markets The thermal insulation market is an established industry that has seen growth year on year, mainly due to the increasing demand for higher insulation standards because of climate change. It is expected that this market will continue to expand, concentrating on traditional products such as mineral wool and fibres, unless an alternative techniques is developed. VIPs have been around since the mid 1950s but few companies have been able to develop more than small niche markets as a result of the expensive and time-consuming production process. However, in the past four years, worldwide research

132
has accelerated dramatically to develop new materials and processes that will significantly reduce VIP production time and cost. If successful, the payoff for the winners in this technological race could be tremendous, as VIPs are projected to take over major portions of the world insulation market in the near future. Issues/Challenges In an effort to improve insulation technology beyond that of common foams and fibreglass batt (which rely on ‘trapped air’), engineers have spent years and many millions of dollars trying to construct a flat panel that would take advantage of the superior insulation value afforded by a vacuum. The task has proved much more difficult than would at first seem apparent. The following major technical challenges remain. Support of the flat walls Atmospheric pressure exerts approximately 15 psi (pound per square inch) of pressure on the evacuated panel. This means that a vacuum panel which is 20 inches square has 3 tons (6,000 lbs) of force compressing it. Since it is not practical to make the walls thick enough to support such pressure (remember, the walls themselves will conduct heat where they join together), a suitable internal support material is needed. This material (often called a ‘core’ material) has to be strong enough to take the tremendous pressure without collapsing and yet not transfer too much heat itself. Gas impermeable membrane Since the thermal performance of the panel is proportional to the internal pressure, a membrane (ie ‘wall’) material is needed to minimize the influx of gases into the evacuated space. Additionally, this material has to be low in cost, easy to work with and easy to join together in an air-tight seal. Lastly, the material has to be thin enough so as not to conduct a significant amount of heat around the edges, thus providing a ‘short circuit’ for heat flow. Getters and desiccants Getters and desiccants are used to absorb gases and moisture within the evacuated envelope and prevent (or at least delay) an elevation of the internal pressure and its resulting degradation in ‘R’ value. The gas and moisture may enter the vacuum panel in a number of ways including permeation through the membrane material or the sealing seams and out-gassing of the core material and membrane itself.

133
Key Characteristics Commercial
Unit Value Comments
Margin investment cost/unit *
£ 25,000 Approximate cost for average size building in commercial sector
Annual energy consumption
MWh 1,314 Hard to estimate unless the thickness of the insulation or U-value required is set as a target
O&M costs/year % 0 Based on the assumption that no servicing would be required for the lifetime of the product
Percentage savings % 40 Savings are estimated at between 30-50%. The average has been used in this calculation
Other and additional cost savings
£/year 0 Increased air tightness of the building
Utilisation or seasonal efficiency
% 30
Availability Date 2050 Plant lifetime Years 25 The lifetime of the product, assuming
improvements are made on current lifetime of 15 years
Payback Years 10.6 Fuel split % 5 electricity 95 fossil

134
Domestic
Unit Value Comments
Margin investment cost/unit *
£ 2,000 Approximate cost generated from typical house size
Annual energy consumption
MWh 13 Hard to estimate unless the thickness of the insulation or U-value required set as a target.
O&M costs/year % 0 Based on the assumption that no servicing would be required for the lifetime of the product
Percentage savings % 40 Savings are estimated at between 30-50%. The average has been used in this calculation
Other and additional cost savings
£/year Increased air tightness of the building
Utilisation or seasonal efficiency
% 19
Availability Date 2050 Plant lifetime Years 25 The lifetime of the product Payback Years 21.5 Fuel split % 5 electricity 95 fossil
* This measure takes into account the saving compared to the existing technology
Key Players Energy Conservation in Buildings and Community Systems (ECBCS) The function of ECBCS, which was established by the International Energy Agency, is to undertake research and provide an international focus for energy efficiency in buildings. Tasks are undertaken through a series of annexes related to energy saving technologies and activities that support their application. Since 2001, this has included research on high performance thermal insulation systems, concentrating mainly on vacuum insulation panels, at the Swiss Federal Laboratories for Materials Testing and Research. US Research In the US, research is being carried out by the Lawrence Livermore, Lawrence Berkeley and Glacier Bay Laboratories in association with GM, Boeing, Bentler, Maytag, and the Michigan State Technology Centre in an attempt to develop a product to overcome the technical challenges for a number of applications.

135
UK Research UK specialists include:
• the University of Bristol, which is carrying out a research project funded by the European Community under the Competitive and Sustainable Growth Programme in association with Fraunhofer-Institutes and IVV, SAES Getters, Fundacion Gaiker, Hantia Coatings, SOFRIGAM, CSTB and Arcelik;
• the Building Regulation Research Programme, funded by the Office of the Deputy Prime Minister, which, although not undertaking any specific projects, is watching to see how R&D evolves.
Technology Development Technological research into VIPs is being carried out worldwide but has stalled at the development stage as a result of technical difficulties. Once these have been resolved there may be a gap between the research-base and industry. Blue skies research
Industrial R&D
Full-scale prototype
A-model prototype
Series production
Mk II design
Long-run series
production 2005 2010 2015 2015 2020 2050
Carbon Summary Commercial
Date/data Penetration (%)
CO2 (kt/year)
CO2 (£/t)
Comments
2010 0 0 105 Assumes that the product is not ready for the market
2015 0 0 104 Assumes that the product is not ready for the market
2020 3 128 125 Assumes that VIPs have just reached the market and are incorporated into some new buildings
2050 20 539 276 Assumes that VIPs have been incorporated into a percentage of the existing building stock during refurbishment

136
Domestic
Date/data Penetration (%)
CO2 (kt/year)
CO2 (£/t)
Comments
2010 0 0 526 Assumes that the product is not ready for the market
2015 0 0 553 Assumes that the product is not ready for the market
2020 1 225 595 Assumes that VIPs have just reached the market and been incorporated into some new buildings
2050 10 1,788 938 Assumes that VIPs have been incorporated into a percentage of the existing building stock during refurbishment
The data above are indicative and based on a consolidated view of trends and forecasts. The development path over time is uncertain and cost reductions and performance improvement assumes successful continuation of development trends. Technology Impact Assessment 1. Estimated UK Economic Benefits Score 3 The existing international insulation market is well established and manufacturers are watching developments. Though the concept of VIP technology is well established, some work is still required to identify the best materials to provide a product with suitable lifespan for the construction sector. The product would displace existing traditional insulation products (such as mineral fibre/wool and phenolic foam) in some though not all applications. In the recent report: Accelerating the Adoption of Vacuum Insulation Technology in Home Construction, Renovation and Remodelling15, the key target application areas were identified as:
• manufactured housing floor panels; • exterior doors; • garage doors; • manufactured housing ceiling panels; • attic access panels/stairway insulation.
This causes little crossover between existing insulation applications in construction, although there would be some economic benefit for the construction industry, as it would overcome the need for increased footprint for dwellings in order to achieve higher U-values. Although this may contribute towards driving the uptake of the product into the new housing stock market, it is doubtful that market penetration would be great without some form of regulatory
15 The U.S. Department of Housing and Urban Development commissioned a report on ‘Accelerating the Adoption of Vacuum Insulation Technology in Home Construction, Renovation and Remodelling’ in 2002. This report gives an in-depth overview of alternative products, market potential and design development and describes the obstacles encountered during the development process for the U.S. http://www.toolbase.org/Docs/ToolBaseTop/TechnologyInventory/3760_VIPFinalProjectReport1.pdf

137
requirement such as an increase in U-values to make developers look for an alternative to existing products. 2. Scope for Government Action Score International research is currently underway through the ECBCS, which has been funding research on VIPs since 2001. Countries that have registered interest include Australia, Canada, Belgium, Denmark, France, Germany, Italy, Netherlands and Sweden, but not the UK. It is suggested that the UK become involved through funding of research and discussions with existing insulation manufacturers in the UK so that they can compete on the worldwide market through sufficient knowledge of and involvement with any new developments. 3. Market Entry Score 4 The end cost of the product is likely to be higher than that of existing products on the market, therefore market uptake may be slow. As discussed in point 1 (Estimated UK Economic Benefit), a recent report identified key application areas to have little crossover to the existing insulation market. It is thought that the installation of such products would initially be considered as best practise but that after a period of time it may be made mandatory through amendments to existing regulations such as the Building Regulations. Prior to that, some incentives may be required to increase uptake. Both technological and application-based research into this product is on an international scale, with funding already being provided by the International Energy Agency. 4. Risks Score 3 There are risks associated with the development of VIPs. As explained above, VIPs are already used in other applications but to date the life of the product has not been extended sufficiently for use as part of the building fabric. There is some doubt as to whether this is technically possible. Also, new insulation products need to be certified for waterproofness and fire-resistance characteristics before being acceptable to insurers. This is a time-consuming and costly process. Carbon Dioxide Reduction Questions 1. Carbon Dioxide Reduction Score 3 and 1 It is hard to estimate the carbon savings potential of VIPs. As with other insulation that is already available on the market, varying the thickness varies the U-value or thermal performance. However, when comparing an equivalent thickness of VIP to an existing product, the increased thermal performance could provide substantial savings. These are reflected in the carbon summary table.

138
2. Market Penetration Score 4 Existing insulation products have a large variety of applications. This product would provide an alternative method for some of these applications and so might displace them if a fiscal incentive is offered which would compensate for their price premium. In the areas where VIPs could insulate a specific element of a building, such as loft and external doors, market penetration could be high, with the help of Government action such as regulatory legislation. 3. Additional Benefits Score 4 As explained in the overview, as the U-value requirements have increased, so has the thickness of walls using existing insulation products. This has several effects, including changes to the acoustics and an increase in the size of plot required to site a dwelling. The maximum allowable wall thickness is currently 300 mm. Installing an alternative to conventional products, such as VIPs, enables higher U-values to be met whilst maintaining a thickness within 300 mm, hence removing these additional problems. There is also potential for VIPs to make buildings more airtight and hence to improve the comfort of the occupants. Summary Vacuum Insulation Panels are emerging as an effective method of insulating both existing and new buildings in both the commercial and domestic sectors. They would enable greater levels of insulation to be installed without increasing the thickness of the building fabric and also enable the insulation of previously uninsulated building elements, such as doors. A substantial amount of research has been carried out and is continuing to take place throughout the world. There are technical problems associated with the life of VIPs and this is where most existing research is being focused. If and when a major technological breakthrough occurs, it is crucial that the UK insulation industry is involved. The potential gaps are between R&D and UK industry. There is therefore scope for Government to encourage more UK-based research and knowledge-sharing by UK industry. References http://www.ecbcs.org/annexes/annex39.htm http://irc.nrc-cnrc.gc.ca/bes/hiptis/annex39.html http://www.empa.ch/ http://www.vip-bau.ch/ http://www.glacierbay.com/ http://www.frperc.bris.ac.uk/home/projcts/vip/vippr.htm

139
Buildings Energy Efficiency Technology Controls – advanced Building Management Systems
Overview Controls are one of the key aspects of a building to promote energy efficiency. Controls can be used to manage a variety of building systems, including heating, ventilation and air conditioning (HVAC), lighting, and other systems including: security/access, lifts and escalator operation, water usage, and major power loads (such as computers). Controls can be simple (eg passive infrared sensors (PIRs) or photocells for automatic switching of lighting upon detection of motion or low light levels). Other examples of simple controls include timers to switch heating and ventilation on and off at specified times. Controls can also be more complex and can take the form of Building Management Systems (BMS), which integrate the control of all, or at least some, of the systems within a building into a control strategy, using a variety of sensors around the building for detection of, for example, temperature, humidity and levels of carbon dioxide.
The principal control strategy for these systems is to optimise the performance (both economic and environmental impact) of the building systems, whilst being responsive to occupants’ requirements. BMS enables integrated control to maximise energy efficiency and ensure that different systems are not acting against each other (ie heating and cooling operating in the same area at the same time).
Controls in general and BMS specifically have been available for many years and are currently based on Programmable Logic Controllers (PLC) and mathematical modelling. The following considers the developments and the use of alternative management strategies for BMS, for example, the deployment of fuzzy logic and neural networks to promote more flexible user-friendly controls.
Technology The technologies considered are fuzzy logic controllers to provide flexible user-friendly control of systems, and neural networks to provide the management of the controls in the most effective manner. The result is a control system that can be used to achieve good performance by someone who is not an expert in BMS.
Fuzzy logic is based on a mathematical discipline of performing calculations where an input may be vague rather than precise (eg ‘cold’) where ‘cold’ might be between 0 and 4oC. Thus fuzzy logic provides a problem solving control system that offers a simple way to arrive at a conclusion based on vague, ambiguous or imprecise information. Fuzzy logic control systems rely more on the operator’s building facilities knowledge and experience rather than a technical understanding of the control system, which enables systems to be operated without the need for a controls specialist.
Neural networks are information processing systems that rely on a large number of interconnected elements, or neurones, working together to solve specific problems. Neural networks learn by example. Essentially, they are taught by to recognise patterns of inputs and deliver the most appropriate outputs for the corresponding input pattern. They are configured for one or more specific building system to analyse and feedback information, predicting the resulting state and then changing

140
the control settings to produce the targeted requirements for the building’s climate etc.
Markets Fuzzy logic and neural networks are being investigated for use within several areas. The areas and markets considered here are controls for building services, including building management systems (BMS).
Ultimately, there is scope to use these controls in domestic situations, but initially the primary markets are likely to be in commercial and some industrial applications. New build will take the majority of the market simply because these systems are easier to design as an integral part of the building, but also there will be applications in the refurbishment market. Initial markets are likely to be the developed nations including the UK, where controls are already predominant. Issues/Challenges With research into fuzzy logic and neural networks being completed in other fields there is the possibility for learning from, or collaborating with, other sectors. Also, there are different strands to the research, from developing new learning algorithms (software) to techniques for implementing through improved computer technologies such as fuzzy logic controllers built-in to the microprocessors (hardware). This suggests that a range of competing technologies is emerging in the developing market, which could pose problems if aiming to produce a standard product for buildings and their services.
Another issue influencing market growth is the compatibility of fuzzy logic and neural network control systems with existing building control technologies. A potential barrier is that the technologies are not made compatible and they develop independently, such that fuzzy logic and neural network systems for BMS are eventually discarded.
Currently, the availability of skilled personnel to operate BMS systems is another factor influencing market take-up. Poorly trained staff may result in systems that are inadequately commissioned and operated, resulting in deficient system performance and in the worst cases systems falling into disuse. These innovative technologies need to enable less skilled personnel to operate the controls and hence give greater utilisation and energy, and emissions, savings.

141
Key characteristics for BMS with fuzzy logic/neural networks
Unit Value Comments Margin Investment Cost/ Unit * £ 50,000 Based on total control systems for
average office building. Annual Energy Consumption MWh 1,314
Operational & maintenance (O&M) costs/year
% 5 Includes basic O&M costs and personnel costs to operate.
Percentage savings % 60 Other and additional cost savings £/year 0
Utilisation or seasonal efficiency % 30
Not all buildings can incorporate controls and this is reflected in the value. Controls are also not required to operate all the time.
Availability Date 2020
Plant lifetime Years 15 Lifetime is expected to be similar to current technologies.
Payback Years 8.5
Fuel split % 30 Electricity 70 Fossil
Represents the displaced heating, ventilation, cooling etc. of systems controlled.
* This measure takes into account the saving compared to the existing technology Key Players Key players in the UK include Stirling and Edinburgh Universities, Kings College and the Natural Computing Applications Forum, all of whom are specialise in research and development of fuzzy logic and neural networks, though work on BMS applications is not a prime focus.
Further a field research is being carried out at the NY STAR Centre for Environmental Quality Systems with their Intelligent Control for Built Environmental Systems (I-BES) programme and at Colorado State University, along with the IEEE’s Neural Networks Council.
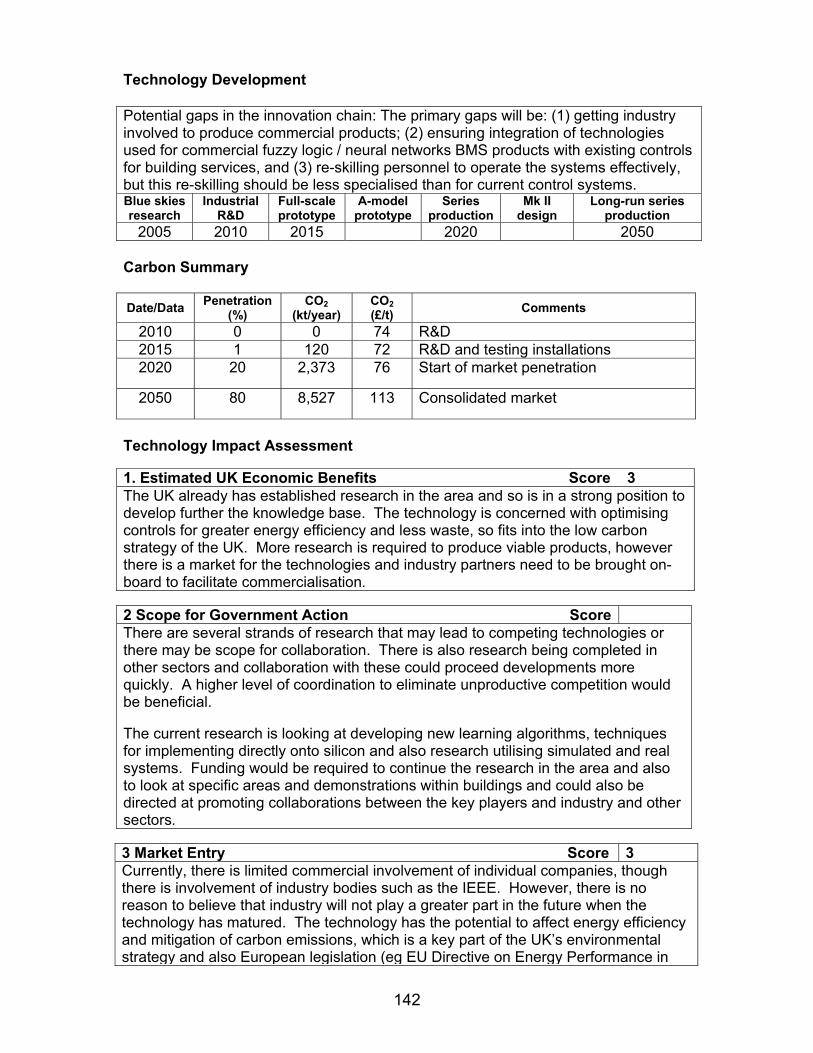
142
Technology Development Potential gaps in the innovation chain: The primary gaps will be: (1) getting industry involved to produce commercial products; (2) ensuring integration of technologies used for commercial fuzzy logic / neural networks BMS products with existing controls for building services, and (3) re-skilling personnel to operate the systems effectively, but this re-skilling should be less specialised than for current control systems. Blue skies research
Industrial R&D
Full-scale prototype
A-model prototype
Series production
Mk II design
Long-run series production
2005 2010 2015 2020 2050 Carbon Summary Date/Data Penetration
(%) CO2
(kt/year) CO2 (£/t) Comments
2010 0 0 74 R&D 2015 1 120 72 R&D and testing installations 2020 20 2,373 76 Start of market penetration
2050 80 8,527 113 Consolidated market
Technology Impact Assessment 1. Estimated UK Economic Benefits Score 3 The UK already has established research in the area and so is in a strong position to develop further the knowledge base. The technology is concerned with optimising controls for greater energy efficiency and less waste, so fits into the low carbon strategy of the UK. More research is required to produce viable products, however there is a market for the technologies and industry partners need to be brought on-board to facilitate commercialisation. 2 Scope for Government Action Score There are several strands of research that may lead to competing technologies or there may be scope for collaboration. There is also research being completed in other sectors and collaboration with these could proceed developments more quickly. A higher level of coordination to eliminate unproductive competition would be beneficial. The current research is looking at developing new learning algorithms, techniques for implementing directly onto silicon and also research utilising simulated and real systems. Funding would be required to continue the research in the area and also to look at specific areas and demonstrations within buildings and could also be directed at promoting collaborations between the key players and industry and other sectors. 3 Market Entry Score 3 Currently, there is limited commercial involvement of individual companies, though there is involvement of industry bodies such as the IEEE. However, there is no reason to believe that industry will not play a greater part in the future when the technology has matured. The technology has the potential to affect energy efficiency and mitigation of carbon emissions, which is a key part of the UK’s environmental strategy and also European legislation (eg EU Directive on Energy Performance in

143
Buildings). The technology is developing globally with worldwide potential for application and the UK, with its strong knowledge base, is in a good position to exploit the technology. 4 Risks Score 5 Current control technology is based predominantly on Programmable Logic Controllers (PLC) and controls using this technology are constantly improving utilising new techniques. Fuzzy logic and neural networks will have to compete with these improvements, but have the advantage of being amenable / designed for operation by non-specialists. Carbon Dioxide Reduction Questions 1 Carbon Dioxide Reduction Score 5 and 2 Controls in and of themselves do not reduce emissions and save energy, but they do activate the devices that consume the resources. Improved control targets optimises the performance of buildings systems. The potential for savings is dependent on the inherent efficiency of the buildings systems being controlled.
As can be seen from the table above significant reductions in CO2 can be achieved by improving controls, though there is an associated cost for the savings.
2 Market Penetration Score 4 Controls are a key aspect of energy efficiency and as such there is continuous pressure to improve them for all buildings systems - heating, ventilation, air conditioning, lighting, etc. Combined with general skills shortages within the buildings facilities management industry, fuzzy logic and neural networks have good prospects for market penetration within the UK and abroad.
3 Additional Benefits Score 4 The primary benefit, other than reduced energy consumption and fewer greenhouse gas emissions, is the ability to operate control systems with less-skilled staff, at least to some extent. This would be beneficial as there is a shortage of skilled operatives within the buildings facilities management profession (particularly with regard to the level of engineering education necessary to operate current control systems).
The newly emerging fuzzy logic and neural network BMS technologies will be intrinsically integrated with other buildings technologies and systems. This will be achieved through a range of options, spanning decentralised systems for simple control of HEVAC and lighting, to comprehensive centralised systems monitoring and controlling multiple (and remote) buildings. For more complex BMS, other building functions can be incorporated including: security/access, lift and escalator operation, water usage, and major power loads (such as computers).
Improved BMS techniques can provide important information on energy demand, equipment usage, and costs. In addition, BMS can enable businesses to receive and respond to energy price signals from their utility suppliers, helping businesses more effectively manage energy costs and participate in demand-responsive and
peak-load reduction programmes. So, additional benefits include:
• reduced energy costs; • water saving;

144
• reduced operational and maintenance costs; • increased occupancy/customer comfort; • long-term benefits to company & improved corporate Image (with
respect to environmental CSR); • societal benefits from reduced pollution or energy costs.
However, it should be noted that there is sometimes a trade-off or compromise between energy efficiency and occupant comfort, so the level of benefit to occupant comfort must be weighed against the level of energy efficiency required. Summary Controls in general and BMS specifically have been available for many years and are currently based on Programmable Logic Controllers (PLC) and mathematical models. Development and application of alternative management strategies for BMS, in particular fuzzy logic and neural networks, offer significant potential to grow the market by introducing more flexible, user-friendly controls. Forecasts for the subsequent increases in UK energy efficiency and carbon emissions reduction, suggest a long-term potential of 8,527 ktCO2/year by 2050.
The market is forecast to grow, initially through new-build and refurbishment of commercial and industrial buildings, and longer-term within the domestic market.
Control of systems has great potential for CO2 savings, from the simplest timers to the full building management systems. One current problem of implementation is the lack of skilled personnel to operate BMS systems, so when they are installed they are often not utilised to their full potential and in some cases not at all. These technologies should enable less skilled personnel to operate the controls and hence give greater utilisation and energy, and emissions, savings. References Stirling University, www.external.stir.ac.uk/research Edinburgh University, www.edinburgh.ac.uk Kings College, Centre for Neural Networks, www.mth.kcl.ac.uk/cnn Natural Computing Applications Forum, www.ncaf.co.uk NY STAR Centre for Environmental Quality Systems - Intelligent Control for Built Environmental Systems (I-BES) programme, http://eqs.syr.edu Colorado State University, Department of Computer Science, www.cs.colostate.edu IEEE - Neural Networks Council, www.ieeecss.org/TAB/Liaison/neuralnet.html

145
Buildings Energy Efficiency Technology Holistic optimum design Overview Zero-energy developments are being constructed throughout the UK demonstrating that it is possible to design and construct buildings to achieve such energy reductions. These projects demonstrate optimum design and good workmanship. Yet, the majority of new dwellings and non-domestic buildings are not designed for optimum performance (ie for minimum energy consumption). By considering key factors such as orientation, daylighting, heating and ventilation strategy for each building or generic model, substantial savings can be achieved. For example, a building that uses extensive daylighting techniques will reduce the amount of heat given off by lighting fixtures, thus allowing for a smaller air conditioning system. This whole-building philosophy considers site, energy, materials, indoor air quality, acoustics, natural resources, as well as their interrelation. With each design there is a need to find the optimum combination that will meet the needs of the occupant whilst minimising energy use. Computer simulations have proved that they are essential to ensure that the optimum combination is designed and built each time, as there are a variety of time consuming complexities and calculations required to ensure a successful design. Over the last decade universities and industry throughout the world have spent time researching and developing such packages for use by professionals. The packages currently available such as Thermal Analysis Software (TAS) and Integrated Environmental Solutions (IES) enable designers to model a building and simulate performance. However, the uptake of these packages is restricted due to:
• the cost of the package, training and upgrades; • the complexity of the input information required prior to simulation; • the time required inputting the information.
This generally means simulations are only carried out on large projects where there is both budget and time available. Therefore, there is a need to develop a design methodology that includes both basic, easy to use guidance for holistic optimum design, and a software tool that enables architects and engineers to develop an optimum design solution quickly and cost effectively. This software-modelling package should not be confused with the assessment methods to appraise the performance of a building, such as Eco-homes, BREEAM for best practice, SAP and the National Calculation Methodology to ensure regulatory compliance after the forthcoming revision of the Building Regulations. Technology This technology topic is a holistic design methodology for optimising the energy performance of a building. The methodology will include various tools including a simple guidance on the principles and practicalities of holistic optimum design, and a simple software package. The software needs to be simple and to highlight

146
daylighting, natural ventilation and other ventilation options, thermal properties and heat loss. Markets There is currently limited design advice or guidance available for holistic optimum design and the majority, which is available, is incorporated within the software packages that are currently available both nationally and internationally. These packages are expensive to run and maintain, therefore the uptake is low among the smaller architects and engineering practices. The construction market in the UK is diverse from one architect working alone to firms with thousands of employees. The larger firms tend to be able to afford the existing software packages and training associated with its use. They also tend to have a higher awareness of energy efficiency issues. It is the smaller architects who are the target market for this product in both the UK and internationally, but it is feasible that larger firms will also be interested in the end product. Issues/Challenges There are challenges to ensure that there is a good uptake of all the tools within the design methodology. The guidance to ensure that architects understand the principles and the software to ensure that the methodology is used to its full ability, to design buildings which perform at the optimum. This would involve raising awareness of the need for energy efficient design and training in the use of the methodology and in particular the software tool. The principle barriers therefore, involve achieving acceptance by architects and in technically producing such a design methodology.

147
Key Characteristics Commercial
Unit Value Comments Margin investment cost/unit*
£ 10,000 Hard to estimate as it is an overall package that could be applied to more than one property therefore reducing the overall cost. Cost based on the need for training of package against multiple dwellings.
Annual energy consumption
MWh 1,314 Based on typical dwelling size of 80m2. Hard to estimate energy savings as system is passive and many interactions in building.
O&M costs/year % 0 The aim is to optimise the existing construction therefore there is no additional O&M cost.
Percentage savings % 20 Hard to estimate as this system will interact with other elements of the building construction, this percentage is of the heating, lighting and ventilation requirement.
Other and additional cost savings
£/year 0
Utilisation or seasonal efficiency
% 30
Availability Date 2015 Plant lifetime Years 60 As the product is a passive system it will have
the same lifetime as the dwelling. Payback Years 4.2
Fuel split %
Split equivalent to energy usage between lighting, heating and ventilation.

148
Domestic
Unit Value Comments Margin investment cost/ unit *
£ 100 Hard to estimate as it is an overall package that could be applied to more than one property therefore reducing the overall cost. Cost based on the need for training of package against multiple dwellings.
Annual energy consumption
MWh 13 Based on typical dwelling size of 80m2. Hard to estimate energy savings as system is passive and many interactions in building.
O&M costs/year % 0 The aim is to optimise the existing construction therefore there is no additional O&M cost.
Percentage savings % 50 Hard to estimate as this system will interact with other elements of the building construction, this percentage is of the heating, lighting and ventilation requirement.
Other and additional cost savings
£/year 0
Utilisation or seasonal efficiency
% 19
Availability Date 2015 Plant lifetime Years 60 As the product is a passive system it will have
the same lifetime as the dwelling. Payback Years 0.9
Fuel split %
Split equivalent to energy usage between lighting, heating and ventilation.
* This measure takes into account the saving compared to the existing technology Key Players The International Energy Agency Solar Heating and Cooling Programme has looked at a design methodology and software tool, but was restricted to solar applications. It is currently looking at guidelines for design for daylighting. Much work has been done on computer simulation packages on both an international and UK basis. In particular, the US DOE has funded R&D projects, one of which has led to the development of a package called Energy 10. Energy 10 is the software component of Designing Low-Energy Buildings, which was a collaborative project of the National Renewable Energy Laboratory’s Center for Buildings and Thermal Systems, the Sustainable Buildings Industry Council, Lawrence Berkeley National Laboratory, and the Berkeley Solar Group, US. It achieves similar goals to those needed in the UK, though the construction methods and regulatory requirements are very different and is only available for the US. Energy 10 integrates daylighting, passive solar heating, and low-energy cooling strategies with energy-efficient shell design and mechanical equipment. It enables designers to make good decisions about energy efficiency early in the design process. Energy 10 was developed with a building industry task force that included architects, engineers, builders, and utility representatives. The program is geared toward buildings of 10,000 square feet or less. The package is already available commercially in the US, however, would not be suitable for UK market without adaptation, testing and validation.
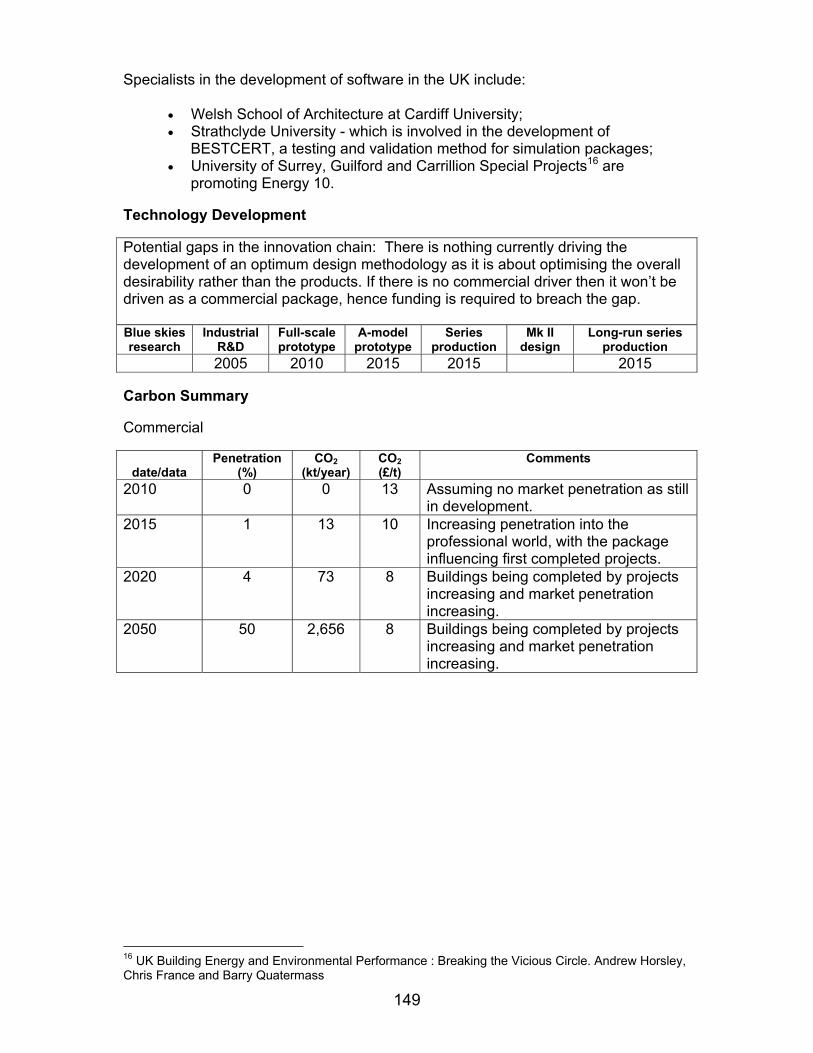
149
Specialists in the development of software in the UK include:
• Welsh School of Architecture at Cardiff University; • Strathclyde University - which is involved in the development of
BESTCERT, a testing and validation method for simulation packages; • University of Surrey, Guilford and Carrillion Special Projects16 are
promoting Energy 10. Technology Development Potential gaps in the innovation chain: There is nothing currently driving the development of an optimum design methodology as it is about optimising the overall desirability rather than the products. If there is no commercial driver then it won’t be driven as a commercial package, hence funding is required to breach the gap. Blue skies research
Industrial R&D
Full-scale prototype
A-model prototype
Series production
Mk II design
Long-run series production
2005 2010 2015 2015 2015 Carbon Summary Commercial
date/data
Penetration (%)
CO2 (kt/year)
CO2 (£/t)
Comments
2010 0 0 13 Assuming no market penetration as still in development.
2015 1 13 10 Increasing penetration into the professional world, with the package influencing first completed projects.
2020 4 73 8 Buildings being completed by projects increasing and market penetration increasing.
2050 50 2,656 8 Buildings being completed by projects increasing and market penetration increasing.
16 UK Building Energy and Environmental Performance : Breaking the Vicious Circle. Andrew Horsley, Chris France and Barry Quatermass

150
Domestic
date/data Penetration %
CO2 (kt/year)
CO2 (£/t)
Comments
2010 0 0 -72 Assuming no market penetration as still in development.
2015 2 45 -75 Increasing penetration into the professional world, with the package influencing first completed projects.
2020 10 309 -78 Buildings being completed by projects increasing and market penetration increasing.
2050 70 4,647 -69 Buildings being completed by projects increasing and market penetration increasing.
Technology Impact Assessment 1. Estimated UK Economic Benefits Score 3 The main economic benefits are likely to be through the software tool, and the software developers would also be able to provide user guidance. The existing US software product is a tried and tested tool, which has been validated in the US. In the UK there are several universities, which have been involved in the development of the more complex simulation tools, therefore the specialist knowledge base is available for the further development and adaptation of this technology. Their knowledge of the UK construction methods and regulatory requirements would be crucial to the development of such a product. While there is a university base in the UK who are specialised in the development of computer simulation software, the existing software available on the UK market tends to have been developed on an international basis (ie manufacturers tend to adapt software to the UK market, therefore the UK benefit associated with the development of such a product could be small). As explained previously the existing market for such tools is established so far only within larger firms that do high profile work. Therefore the development of such a tool would create a new area in the existing software market. Once the product is available to the market, it is likely to be supplied through the existing sales market. This tends to be through local agents, supplying software to architectural and engineering practices, or directly from the manufacturers. The carbon impact of this tool has the potential to be large, though there are barriers, which could slow uptake, such as the perception of architects. Lastly, there will be little economic benefit as the building that any simulation is carried out on is already going to be built and the same elements are likely to be used, though they will be rearranged to provide an optimum design. 2 Scope for Government Action Score Government initiative and funding could instigate the speedy development, testing

151
and validation of such a methodology, guidance and software tool, for the UK market. As explained earlier there are already some software packages available on the market, though little guidance. These are complex and expensive for the end user and not suited to the market gap. A similar tool has already been developed for use in the US and is being supplied by the Sustainable Buildings Industry Council. In the UK R&D is already being done by the Welsh School of Architecture at Cardiff University and Strathclyde University on similar software tools. Similarly much research has already been done in establishing the optimum criteria for specific construction elements such as school classrooms, however, no formal design aid is available to assist architects. To deliver a simple package that focuses on optimising daylighting, natural ventilation and heating, Government funding would be required as there is strong industrial support in favour of artificial lighting from manufacturers. To encourage the uptake of such packages in the market the Government could offer some fiscal incentives to professionals who use such a package. In our opinion there is no doubt that packages like this will be developed and introduced into the UK market, however, it is hard to predict how long this could take and what the industry uptake would be. Government involvement could accelerate the speed with which a package such as this could enter the market. Government action could also encourage the uptake and use of software packages by professionals. 3 Market Entry Score 4 Key barriers to the market will be:
• simplifying the guidance to be effective without a software package and still be effective when considering optimum design;
• any copyright issues that there may be in developing software similar to the US tool for the UK (technical barrier);
• encouraging the software distribution sector to sell the product which will be low cost and high sales effort per unit compared with existing products (procedural);
• to ensure that the cost of the tool is kept low to ensure uptake (economic) • to ensure that it has a user friendly interface for those with minimal
computer literacy (technical); • to change architects’ perception that a software package like this removes
their artistic flair from the design process (behavioural). Funding could address:
• the speed at which the product is adapted and developed for the UK market and enable any copyright issues to be sorted out;
• it could also be used to encourage the distribution sector; • increasing architects’ awareness by seminars, publicity and training to
increase uptake. If funding were supplied for these areas many of the barriers could be overcome.

152
The adaptation of this tool to address a UK need could evolve into the development of tools for other northern European countries with similar climate and construction methods. 4 Risks Score 3 There are risks associated with the development of software, the key points being:
• There is potential of not providing enough guidance for optimum design to be effectively implemented.
• Development risks, however, these are minimal as a tried and tested package is already in existence.
• Market uptake, there are challenges associated with the market penetration of such a product. As already explained the range of architects is diverse and therefore a concerted effort will need to be made to ensure a good uptake, understanding and use of the product are achieved.
Carbon Dioxide Reduction Questions 1 Carbon Dioxide Reduction Score 1 and 4 It is difficult to estimate the potential carbon savings that could be attributed to such a package. The aim is to design a building that ensures that all the elements interact to achieve optimum energy efficiency, however, there are other key areas that could affect the completed design, such as workmanship and occupant understanding. Demonstration projects have shown that it is possible to hugely reduce overall energy consumption and savings could be estimated in the region of 50% for a building that has been designed to perform to its optimum. From the Carbon Summary table above it can be seen that the carbon savings are better for the domestic sector, but there are still considerable savings to be made in the commercial sector. The cost of the carbon saved is also better for the domestic sector, and compared to other technologies, it also provides better savings in the commercial sector. 2 Market Penetration Score 4 As previously explained, the professional industry is diverse and ranges from one-man bands to international consultancy firms. As does the range of IT skills, with some architects still using the drawing board for design. It is unlikely that the whole of the industry would take up the use of such a methodology, in particular the software tool. Possible routes to encourage the uptake would be to offer fiscal incentives for the purchase of such a system or through the Planning and Building Regulations Application process. The package would not necessarily replace existing more complex methods but instead complement them. Once developed a package such as this could be applied to Northern Europe, though care would need to be taken to ensure that regional differences in climate and construction material and techniques are accounted for. Currently architects use a range of methods to design buildings, from the traditional drawing board to CAD packages in both 2D and 3D. Therefore, it would be beneficial if any software were compatible with the leading CAD packages.

153
While it is hard to estimate the precise savings that could be achieved by optimising the design (eg of daylight, solar gains, ventilation) estimates have been made on the potential within one building. 3 Additional Benefits Score 4 There are additional benefits associated with such a methodology. The occupants are likely to benefit from improved internal conditions (ie increased comfort factor). By coordinating all elements of the building there should be an overall improvement in design and construction, which may lead to a reduction in construction waste. The coordination of design may also have an influence on other factors, which are not considered as part of the exercise, offering additional energy savings previously uncalculated. Summary The technology topic is the development of a holistic design methodology for optimising the energy performance of a building, including design guidance and a user-friendly software package that enables optimum designs of buildings to be achieved. A software package achieving this has already been developed for the US market but without adaptation would not be suitable for the UK market. The product is for application on small commercial and domestic buildings, and would be used the small architectural and engineering firms. Government scope for action includes the funding of the adaptation of such a methodology for the UK market and introducing it into the market. While the UK economic benefits are limited, the carbon reduction potential is higher; therefore further investigations should be made into the feasibility of converting this product for the UK market. Additional benefits include better coordination of design, which could lead to a reduction in construction waste and improved internal comfort for occupants. References Examples of energy saved when this approach is used:
• http://www.nrel.gov/docs/fy02osti/32157.pdf • http://www.eere.energy.gov/state_energy/technology_cases.cfm?techid=11 • Directory of existing software tools available • http://www.eere.energy.gov/buildings/tools_directory • Existing research: • http://www.nrel.gov/docs/fy99osti/26256.pdf • http://www.nrel.gov/buildings/energy10/whatis.html • Balcomb, J. Douglas (1999). ‘Using ENERGY-10, to Design Low Energy
Buildings’. A summary report that describes ENERGY-10, and presents a detailed worked example carrying a particular building from pre-design through preliminary design.
• Judkoff, Ron; Neymark, Joel (1995). ‘International Energy Agency Building Energy Simulation Test (BESTEST) and Diagnostic Method.’ National Renewable Energy Laboratory. BESTEST is designed to help

154
programmers develop reliable software to predict energy performance in buildings, and to assure building designers that a particular software package is accurate and appropriate for their usage.
• Square One and Welsh School of Architecture at Cardiff University http://www.squ1.com/site.html
• Strathclyde University http://www.esru.strath.ac.uk/ • IEA solar heating and cooling programme, www.iea-shc.org

155
Industrial Energy Efficiency Technology More energy efficient separation processes Overview
This is a collection of innovative technologies and techniques that if developed will improve the energy efficiency of separation processes within the industrial sector. Separation techniques are widely used in industry particularly the chemicals and food & drink sectors, and consume about 15% of the total energy used in the process industries. Separations are used to condition feedstock, meet product specifications, and remove waste from effluent streams. Separations are mainly liquid-liquid, liquid–gas, and solid-liquid although other combinations are possible. The biggest separations in terms of throughput are distillation, drying and evaporation. Other significant separation techniques include liquid-liquid and gas-liquid extraction, crystallisation, adsorption and leaching. Most industrial processes in the UK and internationally use separation techniques in one form or another and most use a significant part of their energy in carrying out the separation. For example there are estimated to be around 40,000 distillation columns worldwide. Hence, energy efficiency in this area is important. Technology There are many types of separation and many separation techniques including distillation and evaporation. The energy efficiency improvement techniques are:
• Intensified separation: this involves the use of techniques to increase the rate of separation, and hence reduce the size of the required equipment. One of the main methods involves the use of centripetal force to increase separation rates, while other methods utilise electrical fields. Increased separation rates and smaller equipment sizes leads to less energy being used in the processes.
• Combined reaction/separation: this involves combining reaction and separation steps in a single piece of equipment. It can lead to increased yields and more efficient use of the reaction heat . It will become more feasible with the development of compact heat exchanger/reactor technology.
• Improved heat recovery: advances in compact heat exchangers, process integration, plant design and scheduling will lead to greater recovery of waste heat from separation processes.
• Membrane separation techniques: these require lower energy than conventional distillation. They will initially replace the distillation and evaporation of alcohol/water mixtures, but there is potential with advanced membrane design to expand the technique to other separations.
• Optimised distillation sequences: with multi-component separations the number of sequences that are possible increase with the square of the number of components. Different sequences require different overall amounts of energy. Hence computer models are required to determine the optimum (in energy terms) sequence. These exist already but there is much scope for further refinement.

156
Markets Markets are large and diverse. The chemicals and food & drink sectors are the main users of separation processes, although most industrial sectors will use separation processes to some extent. In the chemicals sector the main separation techniques are distillation, evaporation, drying, liquid-liquid extraction and crystallisation. For example, distillation accounts for more than 60% of the total process energy used for the manufacture of commodity chemicals according to a DOE review. Similar separation techniques are used in the food & drink industry, but with more emphasis on evaporation and less on distillation. A review carried out around ten years ago calculated that there are around 6,000 sites where there are significant separation operations carried out. From this review it is estimated that separations use around 12,700 GWh/year. This market share is reflected worldwide. As an example of this, in the USA, separations were estimated in a DOE review to account for around 15% to 20% of total process energy use. Issues/Challenges The main challenge is to co-ordinate the strands of research and development currently being carried out, so that progress is focused and the most promising of the many possible improvements are the ones that are supported. The barriers to these techniques or equipment being taken up include:
• Research organisations need support to kick-start promising lines of research (economic): funding is required to carry out initial research to help put together a case for further funding and industrial collaboration.
• Research organisations need help in finding industrial collaboration (behavioural/economic): it is becoming increasingly difficult for Universities and similar establishments to find industrial collaboration. Companies either work in-house, or more likely, multi-company R&D activities are centred outside the UK.
• Research organisations and collaborating companies need to be steered towards the energy efficiency aspects of these techniques (technical and behavioural): understandably research will be focused on areas perceived to be of most importance to companies, hence research will centre on ways to increase throughput or improve product quality rather than simply on energy savings. Whilst these areas will also yield energy saving, better focus on energy will result in equipment and techniques that produce higher savings.
• Lack of investment from industry (economic and behavioural): UK industry is reluctant to invest in research and development where results are not guaranteed.
• Reluctance to change equipment or techniques that deliver product reliably (behavioural and economic): there is an understandable reluctance to change a process that is reliable and delivers the required product, to one which is possibly more complex and which has an unknown reliability.
• Lack of industrial manpower to support innovative techniques (behavioural/economic): within the UK, professional manpower has been cut to the minimum, hence on most sites staff have very little time to

157
consider a new piece of equipment or technique which may enhance the efficiency of the plant.
Key Characteristics
Unit Value Comments Margin investment cost/unit*
£ 10,000-100,000
This is estimated. In practice this will vary considerably as this area covers a range of separations and a range of energy efficiency improvements.
Annual energy consumption
MWh 7000 This is estimated. As above, there will be a considerable range of annual consumption.
O&M costs £/year 2,000 This is estimated. Again, there will be a large diversity. Waste heat recovery, for example would require little extra O&M cost, whereas for membrane techniques it would be a significant issue.
Percentage savings % 20 This is estimated but based on a number of reviews. Again in practice there will be a range of possible savings.
Other and additional cost savings
£/year £10,000 This is estimated. This would be the advantage from improved yield, improved throughputs, or improved product quality.
Utilisation or seasonal efficiency
% 80 Based on plant availability.
Availability Date 2015 - 2020 Again – depends on particular measure.
Plant lifetime Years 20 Payback Years 2.4 Fuel split % 5% Electricity
95% Fossil Most separations use process heat/steam.
* This measure takes into account the saving compared to the existing technology Key Players There are many universities in the UK engaged in research into energy efficient separations. These include:
• University of Bradford (liquid-liquid extraction); • University of Bristol (improvements to trays and packing, membrane
reactors and column design); • University of Bath (membrane technology); • UMIST (distillation sequencing, alternative distillation configurations); • University of Newcastle (membrane separation, intensified separation,
reactor-separators); • University of Oxford (improved distillation, membrane separation).
There is also research being conducted within the USA, notably the University of Texas. The US DOE has, and is, funding a number of research projects on separations including some on membranes for the dehydration of organics, for the recovery of VOCs, and for the separation of olefin/paraffin mixtures. In these cases, separation is currently carried out by distillation and the use of membranes offers a

158
low energy alternative. In addition, the EU has funded work on energy efficiency in separations. Technology Development Potential gaps in the innovation chain: The main gaps are likely to be in first demonstration and initial uptake. Blue skies research
Industrial R&D
Full-scale prototype
A-model prototype
Series production
Mk II design
Long-run series production
2005 to 2010
2010 2015 2015 2020 2020 2020
These are average dates, there will be a distribution of technology development profiles depending on current position, complexity and market situation. Carbon Summary Date/data Penetration
(%) CO2
(kt/year) CO2 (£/t)
Comments
2010 5 30 -22 2015 15 91 -24 2020 30 185 -26 2050 100 684 -26
Because a number of new technologies are involved. Carbon savings will start to improve within five years, but overall there will be a gradual build up of savings.
Technology Impact Assessment 1. Estimated UK Economic benefits Score 3 The data above are indicative based on a consolidated view of trends and forecasts. The development path with time is uncertain and cost reductions and performance improvement assume successful continuation of development trends. There is a great deal of potential for the UK to take the lead in developing these separation energy efficiency initiatives. UK Universities are currently operating at the leading edge of the development of separation technologies. The main industrial driver will be the potential improvement in process efficiency and flexibility. Process efficiency will include energy efficiency, yield and product quality. The status of the development of the technology varies with the particular technology. Furthest along the development line are membrane separation and distillation tray and packing improvement. The newest areas to date are intensified separations and reactor/separators. Success could see the start-up of a number of small manufacturing companies (10-50 personnel) initially providing equipment to the UK, but then exporting equipment to the rest of the world. Key areas would be in membrane separation and reaction manufacture, intensified separation equipment, and distillation column internals. Providing advice on distillation sequencing and related topics would provide a boost to existing UK consultancies. 2 Scope for Government Action Score Government funding could make a difference to progress of the technology by:
• providing additional funding to speed up existing research;

159
• focusing existing research and providing a lead on what areas should be developed;
• helping to find industrial partners for the research; • setting up an organisation to exchange information on current and
potential research; • showing industry that Government is backing the research and thus
providing industry with more confidence in the potential results of the work.
Much work is currently being undertaken in this area (see list of Universities above). However, additional Government support beyond the EPSRC R&D funding area would increase the chances of success, speed up development, and provide more focus towards energy efficiency. 3 Market Entry Score 4 The barriers to these techniques and equipment being taken up include:
• research organisations need support to kick-start promising lines of research: Government funding could help initial research which is specific to energy efficiency technologies and may not be prioritised by EPSRC;
• research organisations need help in finding industrial collaboration: additional funding would give researchers time to find industrial collaboration, and give industry the assurance that Government supported the work;
• research organisations need to be steered towards the energy efficiency aspects of these techniques: Government support would require that the research organisations steered their research towards energy efficiency aspects;
• lack of investment from industry: Government support would help the credibility of the research making industry support more likely, and would lessen the investment burden on industry;
• reluctance to change equipment and techniques that deliver product reliably: Government support would provide confidence in new equipment and techniques and possibly financially support the first use to encourage take-up;
• lack of industrial manpower to support innovative techniques: Government support would give industry confidence to commit staff time to these techniques and equipment.
Funding could address most of the issues on the above list to varying degrees. But will have a greater influence on the barriers at the top half of the list. Without Government funding, development times will be longer, research will be less focused and the chances of support from industry much less. 4 Risks Score 3 At the R&D stage the risks are associated with getting adequate funding and with the likely outcome of the work. For example it may not be possible to increase the range of membrane separations, or there may be associated problems of fouling or strengthening that may not be overcome. At the demonstration stage, the risks are in getting the collaboration from industry,

160
especially to demonstrate the first use of a particular piece of equipment. There is also the risk that the equipment will not perform as reliably as that which it replaced or that the yield or product quality will not be as good. Separations technologies to some extent compete with themselves. For example membrane separation can be used instead of some types of distillation. And because we are dealing with a range of measures there will also be competition between them. Carbon Dioxide Reduction Questions 1 Carbon Dioxide Reduction Score 4 and 4 There is the potential to save 684 Kt/year of carbon dioxide when the market is fully active. 2 Market Penetration Score 3 It is difficult to be precise, but it is assumed that there will be at least a 60% market penetration within the UK. This will be in terms of the number of separation units (distillation columns/dryers evaporators etc) where some form of energy efficiency improvement equipment or technique, developed in this area, will be used. The industrial sectors vary in terms of market potential. The two main sectors for separations are chemicals (including rubber and plastics) and food & drink. In Chemicals, the main source of change will be in improvements to existing equipment. It is unlikely that many new plants will be built in the UK. In food & drink, the situation is more optimistic, with most of the improvements coming from improvements to existing equipment, but there will also be new plant being built.

161
3 Additional Benefits Score 3 Additional benefits include:
• Improving the overall efficiency of UK industry; • Reducing waste through improved yield; • Improving the flexibility of operation (intensified reactor separators); • Improving throughput by removing bottlenecks.
Summary Separations are widely used in industry. The required separation operations are diverse in nature and scale, and there is an equally diverse set of separations techniques including distillation and drying. As a result, there are many diverse and novel ways to make these separation operations more efficient, and there is a potential to save 684,000 tonnes of CO2 each year from 2050. Funding is needed to continue this research, focus the work and encourage industrial collaboration. The main barriers are in kick-starting research, in encouraging industrial support, in focusing research, and in achieving the first demonstration. Government funding and support can help overcome these barriers. References One main source of information is given below for each of the relevant topics:
• Improved heat recovery: HEXAG (heat exchanger action group)
www.hexag.hw.ac.uk • Membrane separation: Department of Chemical Engineering, University of
Bath, [email protected] • Intensified separation: Prof [email protected] • Combined reaction/separation: Department of Chemical Engineering,
University of Bath, [email protected] • Optimised distillation sequences: Centre for Process Integration, School of
Chemical Engineering, University of Manchester, [email protected]
• Improvements to trays and packing: Prof Joe Quarini, Mechanical Engineering Department, University of Bristol, [email protected]
• DoE Review: Chemical Industry Vision2020 Technology Partnership http://www.eere.energy.gov/industry/chemicals/pdfs/vision2020_annual_report.pdf Membrane and Separation Industry Review http://bcc.ecnext.com/coms2/summary_0279-33810_ITM Study: DMS99, Publication Date: 01-JUL-00

162
Industrial Energy Efficiency Technology Second-stage waste heat recovery from high-temperature processes Overview High-temperature industries consume large quantities of fossil fuel for firing, melting and refining products. These industries include primary and secondary metals (steel, aluminium, copper and other non-ferrous) plus mineral processing (ceramics, glass, cement, lime, etc). Although the UK market for these high-temperature products has been shrinking, it is still substantial. Most if not all the high-temperature industries already implement some form of primary heat-recovery, ranging from fairly rudimentary recuperative burners in some of the less sophisticated sectors (eg forges) to extremely efficient waste heat recovery operations (eg the ‘Maerz’ kiln in the lime-processing industry). Until recently, the remaining heat has been generally considered too little, too cool or too ’dirty‘ to be of any further, cost-effective use.
However, there is still a lot of heat energy potential left within the exhaust gases generated by many high temperature industries. The novel technologies described below are concerned with extraction of the remaining heat, principally from ‘dirty’ but still reasonably high-temperature waste gas streams They have been described as second-stage waste-heat recovery in order to differentiate from existing, primary waste heat recovery technologies.
Technology High-temperature operators already make widespread use of primary heat recovery systems, in particular regenerative firing systems, where heat from the process is passed alternatively through two high heat-capacity ceramic boxes. The incoming air is pre-heated by one box, mixed with fresh gas (or oil) then fired over the product. Heat from the firing process is extracted and passes through the second ceramic box, pre-heating its content. The direction of the fire is switched every 20 minutes, so that the boxes are alternately heating and cooling down. Exhaust gas exits from the bottom of the regenerator at approx 450°C. ‘Typical’ energy losses from a furnace without and with waste-heat recovery are shown in the table below.
Without heat recovery With heat recovery
Sensible heat in product
20% 30%
Superstructure losses 20% 30% Waste gases 60% 40%
Thus, there is still considerable potential heat to recapture. The concept of second stage heat recovery is not new, and in fact is already performed at varying levels of sophistication across different sectors. For example, Pilkington Glass (St Helens) already use waste gas heat from their regenerative system to generate steam and, from this, electricity. Others make use of the waste gas to heat water or supplement space heating. However, such practices are not widespread.

163
As already mentioned, one of the biggest barriers to second stage heat recovery has been that the remaining heat is generally considered too little, too cool or too ’dirty‘ to make any further, cost-effective use. This was certainly true when energy costs were low (ie mid 1990s) and operators were not obliged to clean up their exhaust as much as they are now (or will be in the future). However, the situation is changing, with increasing fuel prices combined with more stringent emissions and environmental controls, and so the opportunities for additional heat recovery are becoming more attractive. Much of the primary focus of attention will need to be on enabling technologies to make the heat recovery viable. Several competing technologies have been considered:
• High-temperature waste gas filtration - where dust and SOx are extracted from the hot exhaust, without losing its thermal characteristics. Enabling technologies that have been considered, and/or are under investigation, include ceramic or metal mesh filters. These clean the gas, permitting its use for raising steam, generating electricity, or heating other parts of the process directly. Although some research has been carried out in these areas, their use is far from widespread.
• Phase-change materials. Waste heat is captured by directing the waste gas onto a material, causing it to undergo a phase-change. The heat can be stored and used elsewhere, either by the same operator or shipped elsewhere for release (although the potentially high transport costs need to be considered).
• High temperature heat exchangers in hot, aggressive environments. The idea of heat exchangers is not novel but the challenge would be to design a material with sufficient rigidity and robustness at elevated temperatures, that is corrosion resistance, has heat capacity and longevity, etc.
• Making use of the waste heat for ‘localised‘ opportunities. Such as passing the waste heat (eg dust and SOx) back through the incoming raw material in order to recapture heat, plus re-incorporate the dust/SOx into the batch. As this is already being actively considered by the glass sector, it lies outside the scope of this assessment. In addition, harmonising a process that requires low-grade heat with a high temperature process that creates unwanted waste heat should be considered. Again, this is not a new technology but more of a cultural and behavioural change that requires co-ordination between the location of new-build high-temperature process industries and domestic or commercial operations that can make use of low-grade waste heat.
Government support in developing one or more enabling technologies, that allow heat to be recaptured in a cost-effective manner, will accelerate take-up and ultimately market penetration.
Markets For the UK, the energy consumption and fuel split across high-temperature industries in 2002 was:

164
Sector Solid Oil Gas Electricity Other Total TWh TWh TWh TWh TWh TWh
Aluminium 0.02 0.56 2.29 10.00 0.50 13.37Ceramic 0.17 0.13 6.44 1.25 0.00 7.99
Foundry 2.20 0.20 2.20 3.00 0.00 7.60
Glass 0.25 0.15 4.50 2.00 0.00 6.90Minerals 3.50 2.83 4.00 4.00 0.00 14.33NFM 0.45 0.30 1.73 0.84 0.00 3.32
Primary steel 41.3 3.18 18.34 5.92 0.00 68.74Secondary steel
0.05 0.50 3.50 3.00 0.00 7.05
Steel forges 0.05 0.50 3.50 1.50 0.00 5.55
Total 134.85
To assess the potential market for secondary waste heat, firstly remove from the equation:
• non-high temperature sub-sectors from the high-temperature industries (eg mineral quarrying);
• non-high temperature processes; • non-fossil-fuel operations (eg electric melting); • sectors that already lend themselves well to heat recovery thus offering
minimal additional opportunity, (eg cement, lime burning and much of primary metal refining).
Secondly, it must be estimated how much of the remaining waste heat can be recaptured. For this, 50% recapture of the remaining heat within the waste gas has been estimated.
Sector UK Energy
Secondary heat
applicable?
Comments Secondary heat
recovery
Useful recapture
TWh % TWh % TWh
Aluminium 13.37 10 Mostly primary
1.34 15% 0.20
Ceramic 7.99 70 5.59 15% 0.84 Foundry 7.60 40 Significant
electricity 3.04 15% 0.46
Glass 6.90 70 4.83 15% 0.72 Minerals 14.33 10 Either not
applicable or already very energy efficient
1.43 15% 0.21

165
NFM 3.32 50 1.66 15% 0.25
Primary steel
68.74 5 Mostly primary
3.44 15% 0.52
Secondary steel
7.05 50 3.53 15% 0.53
Steel forges 5.55 60 3.33 15% 0.50
Total 134.85 28.19 4.23
• thus the maximum realistic second-stage recapture from UK high-temperature sectors would be 4.23 TWh.
• a market penetration of 70% has been assumed. This allows for the fact that the overall economics will be less attractive to small and medium size operators.
• The estimated UK savings at 70% penetration are 2.96 TWh, valued at an £37 million/year. This would be predominantly gas, with some oil and a little coal (ie with a weighted carbon factor of 0.058 kgC/kWh).
• overall carbon savings at 70% market penetration would be 630 ktCO2.
As a very rough approximation, the worldwide market for second-stage waste heat recovery is likely to be 10-100 times greater than the UK. Developed nations such as USA, Japan, Germany, etc are likely to have similar, if not better, heat-recovery systems, from high-temperature industries, already in place. However, high-temperature operations in developing nations, in particular those undergoing industrial growth, often have poor (if any) waste heat recovery systems in place. Emerging nations such as China, India, and those within East-Europe and the former CIS are often heavily industrialised, but have a legacy of different drivers and energy economics to industries in the ‘West’. Historically, energy efficiency and heat-recovery have not been prime motivators and so opportunities exist for both primary and secondary waste-heat recovery.
More recently, in the UK and EU, with emissions limits (particularly VOC) from several industrial processes getting tighter (eg the chemicals, food and drink and engineering sectors) many new industrial sites have been obliged to retrofit VOC abatement technologies. This typically involves raising the temperature of the waste gas stream to a point where the organic waste is burnt off by use of afterburners. Abatement retrofits offer the opportunity for waste heat recovery from a relatively new source of waste-heat that has hitherto not been explored in much detail. Much of the heat recovery is likely to be primary in as much as the exhaust gas will be reasonably clean, thus it can be used either directly within the process or to generate steam or electricity, etc. Applying the same logic as before and (as way of illustration) assuming only 1% overall applicability and uptake across all these sectors shows that it would still offer substantial additional saving opportunities to the UK:

166
Sector UK Energy(2002)
Applicable/uptake Secondary as TWh
TWh % TWh Chemicals 74.9 1% 0.37 Engineering 79.4 1% 0.40 Food & drink
44.5 1% 0.22
Total 0.99
On a similar basis as earlier, this equates to 210 ktCO2/year.
Issues/Challenges The biggest barriers to second-stage heat recovery are predominantly technical and economic:
• High-temperature industries tend to operate as stand-alone operations. Generally, they have more low-grade heat than they need and often their problem is getting heat away from the product in a fast but controlled manner, rather than trying to make use of the heat.
• The heat is considered ‘dirty’. • The additional technology required is likely to be high-cost in sectors with
tight margins • It is an unproven technology. The high-temperature sector is conservative
by nature and will often avoid newer technologies because the ‘cost’ of a failure or a shut-down could be crippling.
• Payback may be perceived as poor. For example, the glass industry considered using waste gas from the bottom of the regenerator to pre-heat batches, but payback was cited as five(+) years.
Increasing fuel costs will naturally make second-stage waste heat recovery more attractive. More stringent environmental legislation may also act as an incentive, although historically high-temperature industries have tended to opt for the cheapest option, rather than consider higher cost technologies that have a potentially better return.

167
Key Characteristics
Unit Value Comments
Margin investment cost/unit * £k
500-1,000 plus £500k if to generate electricity
Best estimate. Would need to be fairly low-tech technology and fail-safe. Mostly going on the engineering for handling waste-heat.
Annual energy consumption MWh/year 5,000 Best estimate. Mostly electricity. Will
need various fans, compressors, etc.
O&M costs £k/year 100 Best estimate. Much will be manpower and consumable items, plus electricity to power the unit.
Percentage savings % 15% Equivalent of primary fossil fuel heat going into the furnace.
Other and additional cost savings £/year None None envisaged.
Utilisation or seasonal efficiency % 90%
Availability Date 2020 Plant lifetime Years 10-20
Payback Years 3(+) years Assuming £300-350k/year saving from a moderately large unit, minus O&M costs.
Fuel split % 70% gas 25% oil 5% coal
Only considered the energy for which second-stage waste heat recovery is applicable.
* This measure takes into account the saving compared to the existing technology
Key Players Metal and ceramic filters There are relatively few academic or industrial bodies in the UK active in this field. The key players are:
• Air Filters for Industry (AFI) - UK. The EEBPP supported an R&D study on metal filters during the 1990’s, with publications FPP064 and FPP090
• Porvair (Norfolk) make metal filters that can be used for boilers, cleaner coal technology, etc (www.porvair.com)
• Caldo (USA) supply ceramic waste gas filters (www.caldo.com/ceramic.htm)
• Cerafil (USA) make ceramic filters (www.madisonfilter.com/cerafil) • CADDET Newsletter #4 (1999) features a waste-heat recovery unit at a
synthetic rutile plant in West Australia • There are several other Canadian, Scandinavian and German bodies that
feature in CADDET and Greentie.
Phase change materials (PCM)
• There is very little on PCM from UK. Universities that have done some research are: - Oxford University (www.materials.ox.ac.uk);

168
• - Ulster University (buildings) - Nottingham University.
• The USA features prominently in Internet searches for ’high-temperature heat exchange‘, although much of their commercial and academic research has been for the domestic and buildings sectors, and ’high temperature‘ has been classified as 50-1000C. Key players include: - US Government Department of EE and RE (www.eere.energy.gov) - climator.com - teappcm.com - chomerics.com - thremaflo.com - colorado.edu.
Heat exchangers There are several key players, for example:
• Deschamps.com (Nevada USA); • Universities include Nevada (www.nevada.edu) and North Dakota (in
www.netl.doe.gov/publications/proceedings/02/materials/hurley.pdf) • UK activities include UMIST
(www.hw.ac.uk/mecWWW/hexag/WebPage/MINUTES16.htm) • Norway features in Caddet Report R243.
Bespoke technologies • BOC has developed a heat-recovery system for passing waste heat
through the batch prior to melting, which they are marketing in the UK.
Technology Development There are potential gaps in the innovation chain, and much of the primary focus of attention will need to be on enabling technologies that make the heat recovery viable. Blue skies research
Industrial R&D
Full-scale prototype
A-model prototype
Series production
Mk II design
Long-run series production
Ongoing 2010 2020 N/A N/A N/A 2020 =Carbon Summary
Date Penetration (%)
CO2 (kt/year)
CO2 (£/t)
Comments
2010 0 0 -3 2015 0 0 -5 Unlikely to be commercially
available until 2020 2020 10 77 -8 2050 50 425 -8 Further penetration including the
less cost-effective operations

169
Technology Impact Assessment
1. Estimated UK Economic Benefits Score: 4 • In theory, quite high. • The UK has several substantial high-temperature sectors that would
benefit from second-stage heat-recovery. Offering savings of 10-20% of fuel bills (which are typically 10-20% or more of their production costs) would be very attractive to many large, high-temperature operations.
• Clearly, there are opportunities for licensing the technology should the UK develop the new technology.
2. Scope for Government Action Score
The UK could establish a competitive edge if Government were to encourage or invested in either a commercial or an academic centre of excellence and/or fund an R&D programme to accelerate the development of second-stage heat-recovery. However, a higher energy price is needed to provide the incentive for industry involvement.
3 Market Entry Score 4 The main barriers to entry are:
• Not a proven technology. • The perceived risks from bolt-on technologies that may impair
production. Although the risk may be low, the consequences of something going wrong could be catastrophic to the manufacturer.
• Currently uneconomical; likely payback is greater than two years. This will inhibit any retrofit and operators would wait until rebuild before considering.
• No legislative driver. • Not seen as business critical.
4 Risks Score 3 • For many high-temperature sectors, margins are tight. • Any problems with the newer technology that led to (say) several days
downtime could financially cripple an operator. • Would need to have an internal use or saleable use for the recaptured
energy.
Carbon Dioxide Reduction Questions 1 Carbon Dioxide Reduction Score 4 and 4
• 2.96 TWh long-term savings, made up from 70% gas, 25% oil and 5% coal, which gives a weighted factor of 0.058 kgC/kWh.
Overall, UK carbon savings would be 630 ktCO2/year

170
2 Market Penetration Score 3 • Once this becomes a ‘proven’ and ‘cost-effective’ technology, the market
penetration should be very high. • The technology is likely to be taken up by most sites (excluding the
small and medium-size operations where the overall economics will be less attractive) as and when they carry out their next furnace/ high-temperature process rebuild. It is unlikely that the economics of retrofitting onto existing high-temperature processes will be attractive.
• Furnaces, kilns and glass tanks lifespan typically vary from 5-30 years, depending on the industry and sub-sector. If the technology is proven by say 2020 and legislation and/or economics become compelling, one may expect a market penetration of around 80-100% by 2050.
3 Additional Benefits Score 1 The energy and carbon savings will represent the vast majority of the business benefits from second-stage waste heat recovery. Other benefits are likely to be directly related, for example meeting with more stringent Environmental Legislation and/or CCA requirement or EU ETS limits – assuming they remain in existence.
Summary The biggest barriers appear to be that there are no proven suitable enabling technologies that allow the high-temperature operators to recapture the heat from what is ‘dirty’, low-temperature exhaust. Suitable high-temperature filtration technologies need to be developed or the ability to make use of the heat in a way that the cleanliness of the exhaust is not a problem The UK would not appear to be a market leader in this field. To become market leaders, the UK would need to invest in a steep learning curve, otherwise any developments would have to be imported. Higher energy prices will stimulate industry involvement.

171
Industrial Energy Efficiency Technology Light-weighting and materials substitution Overview In business-to-consumer markets, branding is usually used to differentiate between products with similar core functions. Most consumers are cautious in trialling new or improved products (the exception being innovator and early adopter classes). Recognising the consumer’s unease, product specification and design tends to be largely evolutionary, rather than revolutionary. Light-weighting is a tool and is an area that can be driven as a research topic i.e. by light-weighting in engineering one reduces the carbon content of the raw materials used i.e. the amount of steel in a product, thus reducing the demand for the steel as a “raw material” in the production line. If the UK invested more heavily in light-weighting, it would encourage industry to light-weight their products more, increasing the overall pull. It is a philosophy that can be researched and improved on as a technology as it goes over and above what manufacturers would generally be doing. Light-weighting and materials substitution represents a radical departure in product design and re-design from the norm. The objective is to ensure a lower weight/material intensity of the finished product compared to existing, trusted, products in the marketplace. This can include both the core product and its physically related attributes such as reduced packaging (see Example 1). Collectively, they involve a reduction in weight of the end product by value engineering the different stages in the supply chain. Light-weighting and materials substitution has a narrower focus than decarbonisation and dematerialisation (see separate assessment). Light-weighting looks only to reduce the lifecycle impact of the product, whereas decarbonisation and dematerialisation can also involve product redesign to remove or reduce carbon use from the supply chain and manufacturing process. Light-weighting and materials substitution should not necessarily affect product function (unless the design seeks to avoid over-specification) but can affect product attributes such as the appearance, weight and size etc of a product. These are often attributes that affect buyer decisions and consequently can affect the perception of a brand. Therefore, this is a source of potential business-risk. However, there are strong commercial arguments for supporting light-weighting and material substitution. The reduction in energy and material costs, plus industrial waste would result in a typical payback period of six to eighteen months. Business’ supply chains would become more efficient, and more co-operative. Example 2 demonstrates how the use of light-weighting and materials substitution provided one company with a significant competitive advantage by enabling the differentiation of its end-product from that of its competitors.

172
Example 1: Light-weighting & Materials substitution – Kodak film product packaging Kodak’s knowledge of the physical properties and requirements of photographic product packaging has allowed it to design protective packaging with the minimum amount of needed material, taking into account sensitivity to heat, light and moisture. In conjunction with their suppliers, Kodak has developed a new bulk film pack, which is more compact, secure, needs less glue and is faster to manufacture. The film canister caps and cans have also been made thinner and, as a result, the plastic content of 35 mm canisters has been reduced by 25%. All cardboard products used in the distribution of Kodak’s products have been light weighted, including shipper boxes, corner-guards and cardboard crates (which use 85-100% recycled fibre content and replaces use of virgin pulp/plastic packaging). Example 2: Light-weighting & Materials substitution – the Aeron chair Since 1994, over two million Herman Miller Aeron chairs have been sold. The chair is ergonomically designed and uses a Pellicle mesh to provide support, replacing traditional materials such as foam and fabric as used in other chairs. Overall the chair is lighter and is less material-intensive than other similar chairs on the market. The chair is made of 67% recycled parts, mostly through the use of 100% recycled aluminium. All parts are labelled with international standard recycling symbols and the most valuable part, the aluminium leg base, is easily disassembled. Its expected life span of 12 years also makes it more cost-effective and resource efficient than other chairs. Technology Further research and development needs to be carried out into light-weighting and materials substitution technologies to demonstrate the benefits over the lifecycle of the products. Technology for light-weighting and materials substitution exists and is being developed, but has yet to be integrated fully into manufacturers’ decision-making, new product development and product design stages. Additionally, a number of specific short- to medium-term technological research & development needs are likely to arise as new materials are developed and utilised and/or existing materials are adapted and applied to new areas. These technological needs may include:
• Joining technology to deliver multi-material capability. This would cover a range of new materials and technologies required to deliver lower weights (eg greater use of advanced composite materials and new aluminium and titanium alloys).
• Development of specific new materials: (eg metal foams (for weight reduction)) and new or modified advanced composite materials for specific applications. Also, biopolymers based on starch and natural fibre for biodegradable block foams used in cushion packaging applications.
• Metal forming & casting: (eg thin-walled, high strength, steel castings (for weight reduction)); improved dimensional control of castings & warm and cold forming meeting net shape or near net shape requirement; electro-magnetic forming of sheet aluminium enabling high speed production and the capacity to overcome difficult shapes, plus increased energy efficiency;

173
multi-layer sandwich moulding, enabling the optimisation of surface and core properties of materials.
• Lighter, safer assemblies: (eg polymer/metal combination moulding), which would support the design, manufacture and service performance of multi-material components.
• Surface engineering: (eg plastic moulding using in-mould colour films/painting and mirrored plastic surfaces, etc).
• Design for product disassembly, re-use and recycling (especially new recycling technologies for composites). For example, TR Fastenings’ new aluminium self-clinch fastener, which attaches aluminium bumpers to vehicles and is actually stronger than the steel nut it replaces, as well as making the bumper recyclable as a single unit.
• Computer Aided Design (CAD) software - this will require additional development to take into account material inputs during manufacture and user phases.
Markets Light-weighting and materials substitution is applicable to any industry that involves component or product packaging. Light-weighting will also be of particular use in engineering industries in the UK and beyond, including the EU, US and Japan. In foundries, a reduction in a casting’s weight reduces energy inputs and demand for raw materials and, if that lighter casting is used in a transport application, it reduces the associated fuel consumption and CO2 output (Backhouse et al, 2004). Light-weighting and materials substitution is also important in Information and Communication Technology (ICT) industries. Here development, has accompanied the miniaturisation of digital electronics by a factor of 4 every 3 years. The impact on energy consumption of light-weighting in ICT can be seen in laptop computers. In use laptops are much more energy efficient than desktop computers. This can be attributed not only to the use of LCD screens, rather than CRT monitors, but also to the optimisation of other components and better power management (Hilty et al, 2000). However, growth in demand for computing and communication power has meant that there has not been a corresponding reduction in total energy and material flows into ICT industries. Hence, there is EU-driven legislation to reduce the amount of waste from electrical and electronic goods and to improve their recyclability. Issues/Challenges There are a number of issues/ challenges facing the further use of light-weighting and material substitution:
• There are technological issues surrounding the application of materials to new areas. This is combined with the challenge of managing consumer expectation and informing consumer choice (eg over product packaging). The overall objective is to maintain or improve product/or commercial service quality, while reducing the use of input materials and energy in a products’ life cycle.
• There is an increasing use of sensors and computers. Sensors and automatic controls will ensure that the performance of key components are

174
monitored more closely and so can be designed accordingly (rather than been over-engineered). Coupled with new uses for lighter materials/alloys this should lead to lighter designs.
• Consumers have an important role in reversing the trend toward increased appliance waste but currently face economic disincentives and lack adequate product information. In this context, appropriate product labelling and information to overcome perceptual barriers will become increasingly important.
• Legislation that places greater responsibility on the producer (eg packaging legislation, the End-of-Life Vehicles directive and the WEEE directive) is likely to encourage light-weighting as producers strive to reduce the weight and volume of waste product materials disposed of by manufacturers and consumers. Such legislation will also encourage design simplification by increasing recycling and the re-use /recovery of some components.
• The emergence of the Corporate Social Responsibility (CSR) agenda has already broadened perceptions of the role and responsibilities of companies. Issues of sustainable consumption and production have not yet featured prominently in CSR discussions, but are likely to in the next 10 to 50 years.
Key Characteristics
Unit Value Comments Percentage savings % 10% On energy consumption during life time
of product Availability Date 2005 - 2010 Niche markets at present Plant lifetime Years 5 to 15 years Depending on technology Payback Years 0.5 to 1.5
years Within industry payback criteria.
Fuel split % 60% Electricity 40% Fossil
Standard industrial split.
Key Players Overseas
• Division for Material flows and Structural Change, The Wuppertal Institute for Climate, Environment and Energy (http://www.wupperinst.org).
UK
• Department of Mechanical Engineering & Wolfson Centre for Materials Processing – Research in Biodegradable Materials, Brunel University (http://www.brunel.ac.uk/about/acad/wolfson)
• Institute of Materials (http://www.iom3.org) • Centre for Sustainable Consumption, Sheffield Hallam University
(http://www.shu.ac.uk/schools/slm/csc.html); • International Ecotechnology Research Centre, Cranfield University
(http://www.cranfield.ac.uk/sims/ecotech); • The Centre for Sustainable Design, The Surrey Institute of Art & Design
(http://www.cfsd.org.uk); • Centre for Composite Materials Engineering, University of Newcastle-
Upon-Tyne (http://www.ncl.ac.uk/ccme);

175
• Advanced Composites Manufacturing Centre, University of Plymouth (http://www.plymouth.ac.uk/pages/view.asp?page=8928).
Technology Development There are potential gaps in the innovation chain. The current key barriers are a short-term focus of R&D in most UK industries and a lack of consumer demand. Blue skies research
Industrial R&D
Full-scale prototype
A-model prototype
Series production
Mk II design
Long-run series production
2005 2005 2010 2015 2020 2020 2030 Carbon Summary Date Penetration CO2
(kt/year) CO2 (£/t)
Comments
2010 2.5% 92 -100 to -50 Technology commercially available in specific sectors
2015 5% 183 -100 to -50 Technology widely utilised in other sectors due to legislation
2020 15% 550 -100 to -50 New product development and new product systems
2050 50% 3,667 -100 to -50 Wider applications throughout industry Technology Impact Assessment 1. Estimated UK Economic Benefits Score 5 The UK has leading academic research centres for sustainable design and materials, as well as specialist engineering industries. The UK is well placed to develop, apply and integrate light-weighting technologies into its manufacturing industries.
• Technologies and materials need to be applied in the context of mass production and mass customisation.
• The skills and resources exist to apply light-weighting and new materials. This could be a new source of competitive advantage for the UK if encouraged.
• Light-weighting and materials substitution has the potential to significantly cut UK transport related emissions by 2020.
• Main driver: Legislative pressure in the short-term, moving towards consumer pressure in medium- to long-term. In the short-term, the WEEE Directive (Directive 2003/108/EC of the European Parliament and of the Council of 8 December 2003) and the proposed directive on Eco-design requirements for energy-using products could both have an effect in consumer goods by encouraging lighter designs using materials that can be easily recycled and by reducing the amount of leftover waste going to landfill.
2 Scope for Government Action Score Government action could include new policies to create a regulatory framework and an incentive-based framework to drive light-weighting and materials substitution. This could take place through:
• Public support for R& D for industry and in academia. For example through additional Research Council grants for institutions running industrial design

176
courses focusing on sustainable design. Industry Forums could also be used as an educational facility for industry and to promote industry/academia co-operation in these fields.
• Enhanced funding of academia into industry schemes. For example, by extending the DTI grant based ‘Knowledge Transfer Partnership’ (see: http://www.ktponline.org.uk) scheme to support initiatives for light-weighting and the application of new materials in fields such as product design.
• Funding could have a useful role in educating consumers and in stimulating consumer demand for more ‘eco-designed’ products incorporating light-weighting (eg through labelling schemes).
3 Market Entry Score 3 In most UK industries, the key barrier to the wider application of light-weighting and material substitution is the short-term focus of R & D. Other barriers include:
• Behavioural - The lack of consumer demand for simplified products using less materials and less energy. Current industry trends are towards over-specification and there is a distrust of lightweight products based on the perception that weight equals quality/value for money.
• Technical - There is a concern over the lead time of getting products to market as optimising takes time. There is also an internal resistance to change within industry.
• Economic -There is a lack of awareness in industry of the economic potential for light-weighting and material substitution outside of niche areas. It is currently seen as a differentiation strategy rather than a new manufacturing paradigm, and as such it could be viewed as expensive to implement and be constrained to high value products.
4 Risks Score 4 Risks of light-weighting and materials substitution include:
• Consumer acceptance – consumers may not accept new lightweight materials and technologies in products; or lightweight branded products over the existing, trusted and familiar products.
• Manufacturing lighter ‘thinner’ products may require new methods and may be seen as a risk to quality
• It is currently seen as a differentiation strategy rather than a new manufacturing paradigm, and as such could in the short- to medium-term be regarded as an expensive manufacturing option and be confined to high value products.
• Consumers may not want to repair, reuse and recycle products without stronger incentives, after being used to having disposable commodities for the past 50 years.
• There may be knock-on effects on the UK economy of reducing the amount of materials being processed by industry.
• Careful Life Cycle Analyses will need to be carried out on the wider use of new materials such as carbon composites and new aluminium alloys to ensure that the benefits and associated energy used during their manufacture and over their useful lifetime outweigh those of the

177
products they are replacing. • Overall environmental costs of substitute materials needs to be take into
account including toxicity and recyclability and ease of destruction or disposal.
Carbon Dioxide Reduction Questions 1 Carbon Dioxide Reduction Score 3 and 5 Light weighting been applied predominantly in niche markets as a differentiation strategy to date. Hence, at present, an assessment of wider savings across industry is difficult to produce. Savings may be in the order of 1 MtC/year. 2 Market Penetration Score 3 The main areas for industrial light-weighting and materials substitution are in packaging and in the engineering industries including the engineering of metal structures and metals selection. It is likely to be adopted by consumer facing companies with CSR policies to meet, as a part of an overall product strategy (eg for Kodak in Example 1 above). This is likely to affect most multinational companies operating in the UK with overseas operations in less developed countries. FTSE 100 and 250 companies are also likely to take product and resource strategies into account in the future. Savings down the supply chain could be achieved via these companies exerting pressure on suppliers to comply with their own first tier company strategies (similarly to Ford’s requirement for all its suppliers to be ISO14001 accredited). 3 Additional Benefits Score 5 Additional benefits would include:
• reduced energy use in primary conversion of products; • better and more efficient product design; • new source of competitive advantage for UK in engineering and design skills; • more efficient and competitive supply chains; • conservation of natural resources; • greater recycling and re-use of products components.
Summary Light-weighting and materials substitution represents a radical departure in product design and re-design and includes both the product and its physically related attributes such as reduced packaging. The objective is to ensure lower material intensities of the finished product compared to existing products. There are strong commercial arguments for light-weighting and materials substitution. Typical paybacks would be in the order of 6 to 18 months, with a reduction in energy and material costs. Light-weighting and materials substitution is applicable to almost all product markets in some form i.e. any industry that involves component or product packaging. Light-weighting will also be of particular use in

178
engineering industries including metal structures and fabrications, and metals selection. The UK has leading academic research centres for sustainable design and materials, as well as specialist engineering industries and is well placed to develop, apply and integrate these advanced technologies into its manufacturing industries. If fully exploited, this could become an important source of competitive advantage for UK industry. Key players in the UK include; Institute of Materials, The Centre for Sustainable Design and The Advanced Composites Manufacturing Centre at University of Plymouth. Further research and development needs to be carried out into light-weighting and materials substitution technologies to demonstrate the benefits over the lifecycle of the products. Specific short- to medium-term technological research & development needs may include: Joining technology; Development of specific new materials; Metal forming & casting; Lighter safer assemblies; Surface engineering; Design for product disassembly; Computer Aided Design (CAD) software. Government action could include new policies to create a regulatory and incentive-based framework to drive light-weighting and materials substitution. This could include support for R&D in industry and academia and stimulation of demand for more ‘eco-designed’ products using light-weighting e.g. through labelling schemes. References
1. Material Intensity of Advanced Composite Materials. Results of a study for the Verbundwerkstofflabor Bremen e.V. Wuppertal Papers Nr.90. February 1999. ISSN 0949-5266.
2. Blackhouse, C.J, A.J. Clegg & T. Staikos (2004): Reducing the environmental
impacts of metal castings through life-cycle management. In: Progress in Industrial Ecology, Vol. 1, No’s 1/2/3, p.271.
3. Hilty, L.M., T. Ruddy & D. Schulthess (2000): Resource intensity and
Dematerialisation potential of Information Scoiety Technologies. Series A: Discussion Paper 2000-01. Solothurn University of Applied Sciences Northwestern Switzerland: January 2000.

179
Industrial Energy Efficiency Technology Innovative approaches to enhance recovery and use of waste heat from steam condensate and hot flue gases from boilers Overview Steam systems are widely used in industrialised countries for process heating, and in the UK account for around 20% of industrial energy consumption. Typically, about 19% of the heat input to a steam boiler is lost up the chimney stack and 20% ends up in the condensate drained from the steam system. Some technologies to recover and reuse this energy are already available. These include:
• condensate recycling, which returns hot condensate to the boiler; • flue-gas economisers (non-condensing and condensing), which use flue
gases to preheat boiler make-up water. Both of these reduce the heat required to generate fresh steam, but have limited applicability. Even in an ideal situation, less than half of the available energy can be recovered(condensing boilers are not appropriate in the majority of these applications because they are not able to use the waste heat). Alternatives with the potential to overcome these limitations are in the process of development or have been developed for other applications. Those identified are:
• sorption-based heat pumps; • heat storing and conversion technologies, including phase change
materials and thermoelectric generators; • localised condensate boosters – producing steam directly from
condensate; • combustion air preheat as well as feedwater heating.
Research development and demonstration of packaged solutions is required. This will provide the basis for manufacturers to develop low-cost products that can be installed quickly and cheaply. This would enable substantial carbon savings to be realised (estimated as about 900 ktCO2/year by 2050).
Technology The key features of the next generation of steam distribution systems are likely to be improved heat recovery and reuse systems, particularly economisers, combustion pre-heat and condensate. However, their development depends on developing:
• Uses for the heat recovered from condensate and from flue gases, which is not reliant on its immediate use by the industrial process. For example, if the heat can be stored in zeolites or phase-change materials, it could be transported elsewhere or retained until required by the industrial process.
• More efficient methods for using the low-grade heat available from the condensate. For example, condensate could be ‘boosted’ to provide steam heating for local processes rather than being returned to the boiler. It could also be converted into electrical energy using thermoelectric generators.
• More effective methods of heat recovery from condensate and flue gas, including improved heat exchangers, heat pumping, heat sorption.
A key area for boiler losses is flue gas energy content (typically about 19% of energy input to the boiler). At the same time, up to 20% of the energy was used in steam production ends up in the condensate drained from the system.

180
Providing an option of recovering energy by methods other than returning condensate to the boiler will help to increase the number of boilers where condensing economiser technology would be applicable. Alternatively some of the techniques could be applied to recovering energy from the boiler flue gases more effectively than current heat exchanger technologies allow. These could provide a significant improvement in the proportion of the energy that can be recovered. Technologies need to be developed to overcome the problem of making use of recovered heat. The range of technologies this covers enables heat recovery not only as heat for immediate use but also provides the option of converting it to other energy forms (eg electrical, motive power) or of taking advantage of advanced heat storage technologies currently entering the market place. Research and development work has been done on some of the alternative technologies. However, these have not progressed to market due to the lack of economic drivers towards innovation.
Markets Boilers are used to generate steam and hot water for process and space heating across a diverse range of industrial and commercial sectors and in many public sector activities. Similar systems are used throughout the industrialised world. Within the EU, apart from the UK, Germany, Italy and France are major users. Unfortunately, steam system operators usually view the loss of condensate and ‘waste’ heat as unavoidable and they are accepted as such. Also, the relatively long payback periods for introducing these technologies (currently around 8-10 years if a custom system is developed and installed) are not attractive to industry. Some of this heat can be recovered through the application of condensing economisers (a currently available technology, although it is not widely applied). Because condensing economisers make use of boiler make-up water to cool flue gases there is a limit to how much condensate can be introduced. No more than 50% of the condensate can be used in preheating boiler make-up water if a condensing economiser is used. If this level is exceeded the make-up water becomes too hot to condense water vapour from the flue gases. Where condensate cannot be returned to the boiler, heat can be recovered using current heat exchanger technology at some other point to provide low-grade heat for other uses. For various reasons, even the currently available technologies are often not employed, so even the level of savings they offer is not being realised. A key barrier to more effective heat recovery is that on many sites where ‘waste’ heat is available, it has no immediate use. Efforts are not made to use this heat, as it is not regarded as a core business activity. To store or transport the heat is not economic and there are no other drivers to draw new technology into the market. Technologies to recover and use ‘waste heat’ are potentially applicable to all steam systems whose operation leads to collectable condensate. These technologies are likely to be more readily scaled than current approaches and may be cost effective over a wider range of installations particularly if they are designed into systems rather than introduced as add-ons after installation.
Issues/Challenges There are several barriers to the adoption of innovations in steam systems. The most important of these is the absence in the UK of regulation of the performance of steam boilers and their associated systems. Old, inefficient boilers are kept running well past their technical replacement point because maintenance costs are low

181
relative to replacement costs. This could be addressed by introducing mandatory performance/efficiency assessments such as are present in some countries in continental Europe. However, this will impose additional costs on industry and may lead to more production being ‘off-shored’. Such regulation would be more effective if linked to a capital loan fund to support users in complying with mandatory improvement notices. The following supplementary factors also need to be addressed:
• Increased complexity is perceived by industry to lead to higher installation and maintenance costs.
• Lifetime operating costs are not given sufficient weight in boiler/steam system specification and design, and even good initial design is often weakened as it passes through the chain from specification to installation.
• The installed base of equipment is large and rate of change is relatively low. Typically, boilers are designed to last for 20 to 30 years and some are still operational at 80+ years. Steam systems, while subject to maintenance and modification, may not be completely replaced during the lifetime of the process they supply. Hence, the timescale for widespread introduction of technologies in this area is likely to be long.
Key Characteristics
Unit Value Comments Margin investment cost/unit*
£ 100,000
Annual energy consumption
MWh 53,000 Per unit. Typical system size on which this technology could be applied is about 10MWt
O&M costs/year % 20 Percentage savings % 10 This is in addition to those accessible from
currently available technologies Other and additional cost savings
£/year 5,000 Water charges/water treatment costs
Utilisation or seasonal efficiency
% 60
Availability Date 2015 Plant lifetime Years 20 Payback Years 3.1 Fuel split % 1 electricity
99 fossil Fossil split 90% gas, 10% oil
* This measure takes into account the saving compared to the existing technology
Key Players Universities and Research Institutes:
• University of Nottingham, School of the Built Environment – Heat energy capture and storage17;
• Netherlands Energy Centre – Upgrading waste heat18, Cooling from waste heat19, Heat energy storage and transport20;
17 Prince S Doherty (University of Nottingham, School of the Built Environment), Heat recovery system using sorption dehumidification of natural gas exhaust, the Carbon Trust Low Carbon Innovation Programme Project No. 2002-7-83 18 ECN - http://www.ecn.nl/eei/research/waste_heat/proceswarmte/index.en.html 19 ECN - http://www.ecn.nl/eei/research/waste_heat/cold.en.html 20 ECN - http://www.ecn.nl/eei/research/waste_heat/storage.en.html

182
• Komatsu Research Centre, Japan – Thermoelectric generators21; • Kobe City College of Technology and Osaka University, Japan – Heat
accumulation/thermoelectric generation22; • Cardiff University, School of Engineering – Thermoelectric generation23; • European Commission DG for Energy and Transport - Thermal
Accumulation and Storage24; • University of Ulster – Heat recovery pumps;
The following also have activities in relevant areas including heat exchanger design and general combustion-related research:
• University of Glamorgan, School of Technology, Mechanical and Manufacturing Engineering Research Unit 25;
• Energy and Resources Research Institute, University of Leeds26; • University of Sheffield.
Key companies in the UK:
• Spirax Sarco; • Gestra Steam Solutions; • TLV Euro Engineering; • TC Fluid Control
Technology Development Potential gaps in the innovation chain There is currently no industrial pull. Value engineering has not been carried out to provide mass-market products. This needs to be overcome to move to prototyping. Blue skies research
Industrial R&D
Full-scale prototype
A-model prototype
Series production
Mk II design
Long-run series production
1995 2005 2010 2010 2015 2015 2020
21 Toshinobu Tanimura (KOMATSU), Thermoelectric Generation using Waste Heat, Published by: Symposium of the Technical Division Committee, the Japan Institute of Metals (JIM), The Present and Future of Practical Application Technologies for Thermoelectric Materials (2000) http://www.komatsu.com/research/netuden.htm 22 Akira Tsuyoshi (Kobe City College of Technology) and Kenji Matsuura (Osaka University) Effect of Introduction of a Heat Accumulator on Performance of Thermoelectric Generation http://www.iee.or.jp/honbu/back_number/journal/index_back_number/2000/2000_12b21.pdf 23 Gao Min and Mike Rowe, Recent Advances in Thermoelectric Generation, The 21st International Conference on Thermoelectrics, August 25-29, 2002 - Hyatt Regency Hotel, Long Beach, California USA. 24 European Commission DG for Energy and Transport, Contract no. NNE5/2000/24, Efficient and Better Managed Industrial Processes, New and Efficient Energy Technologies, Thermal Accumulation and Storage. http://www.mmsunshine4.freeserve.co.uk/ebmip/n36.htm 25 http://www.glam.ac.uk/sot/research/MechMan/index.php 26 http://www.leeds.ac.uk/speme/erri/

183
Carbon Summary Date Penetration
(%) CO2
(kt/year) CO2 (£/t)
Comments
2010 0 0 -2 Technology not available 2015 0 0 -4 There is a slow rate of replacement of
steam systems 2020 10 189 -6 2050 50 921 -2 Technology Impact Assessment 1. Estimated UK Economic Benefits Score 5 UK-based steam product suppliers have 30% of world market and 60% of UK market. There are about 20,000 steam boilers in the UK. There is scope to value add >£1 billion and 1,000 jobs if new technology is designed here. This includes work for UK installers and maintenance engineers. However, it is unlikely that hardware would be built in the UK as industry has largely off-shored production over the last few years. UK steam system design teams are leaders in the field. In the past quite a lot of research has been done in universities but this has not been taken up as the economics have not been favourable.
2. Scope for Government Action Score Underpinning technologies are in general available although they are at different stages and have not been developed for this application. The principles of some technologies have been known for many years, for example heat pumping, whilst others have been identified more recently such as the use of zeolites for heat storage (a technology available in the US27,28). Work on the various technologies that will need to be combined to provide an improvement in the recovery of heat from steam boilers/systems has been carried out in the US, Germany and The Netherlands. However, no research was identified during the preparation of this assessment covering the integration of various technologies to maximise the recovery of heat from steam condensate. The key development needs are to engineer the identified technologies for mass application and low maintenance and to develop techniques for integration into steam system designs. In particular packaging of technologies to provide low cost solutions that can be easily installed is required. If the current decline in UK steam boiler manufacturing and least-cost equipment purchasing approach continues, then the level of industry-supported research and development is likely to remain low in this area. External funding is likely to be needed to realise the development in technologies, such as integrated heat recovery and heat capture, and changes in design procedures to incorporate them into systems. Alongside this there would also need to be a change in equipment purchasing strategies, which would need to be driven by the regulation of steam boiler performance. 3. Market Entry Score 3
27 GSA Resources http://www.gsaresources.com/heat.htm 28 Steelhead Specialty Minerals http://www.s-s-m.com/204.htm

184
There are three main barriers on the path to market for this technology: • Waste heat currently has little or no economic value (and it is not taxed) • The installation of heat recovery equipment has long payback periods due
to lack of potential uses for waste heat on individual sites; • There are no economies of scale for an individual site. Corporate
structures and ‘not our core product’ thinking works against multi-site schemes and even on large industrial sites where schemes should be most economic.
Funding would be most effective in enabling the recovered heat to be used effectively, either by storage (so that it could be buffered for use when required or transported to where it can be used) or conversion into a form that can be used (mechanical or electrical). However, this alone would not be sufficient to ensure that these technologies entered this market. There is an underlying tendency to purchase on installed cost alone without consideration of lifetime costs and efficiency, which needs to be addressed. Whilst some manufacturers have a positive attitude to development of higher efficiency products in this area, they are hampered by the attitude of the market. In this situation it is difficult for these manufacturers to justify large expenditure on development even of enhancements of current products. This area not only needs technical developments but a change in design philosophy. It is likely to be hard to introduce this in an industry with a cautious attitude to change. 4. Risks Score 3 The main risk in investing in this technology is that the approaches outlined run against current trends. Industrial steam users might respond by moving operations offshore rather than meeting tight regulations. To succeed, the long payback periods need to be overcome and this would require a high level of support. The technology itself will not be difficult to develop but the economic aspects will need to be addressed. There will need to be a coherent approach with sub-technologies developed in parallel so that they can contribute to overall systems in order to develop optimum solutions. This technology would complement the best existing technologies for steam and condensate heat recovery and re-use. Enabling heat from condensate to be used in other ways would allow condensing economisers to be applied more widely to steam boilers so that the energy losses from both could be significantly reduced.
Carbon Dioxide Reduction Questions
1. Carbon Dioxide Reduction Score 2 and 4 Market uptake is likely to be strongly dependent on drivers such as cost of energy and legislative/regulatory requirements. If these are not significant, then uptake will be low. If a requirement for installation of steam boilers/systems were to be introduced demanding that efficiency be optimised over the system then this technology approach would be more extensively adopted. There are about 20,000 steam boilers in the UK and the replacement cycle of 20 to 30 years suggests that a large proportion should be replaced by 2050, although some systems will instead be decommissioned. The estimated potential annual CO2 savings are 0.92 Mt by 2050. Estimated costs of this technology in £/tCO2 is given in the table above.

185
2. Market Penetration Score 3 The limits to market penetration of these technologies will be related to the minimum size of boiler/steam system upon which they can be cost effectively applied. For very small systems especially in isolated locations it is unlikely that heat collection and transportation will be practical, though using it as a buffer to even out system loads may be an option. Initially the technology is most likely to be effective on very large sites (where long distances prevent the economic recovery of condensate) or where industrial sites are clustered together so there is potential for trading stored heat over relatively short distances. As the technology matures and higher energy densities are achieved in storage it will become economic to transport over larger distances and it may also be possible for aggregation services to develop (following similar principles to those that operate in distributed electrical generation). It is considered that the actual penetration will be strongly dependent on legislative/regulatory and fuel cost drivers. It is unlikely that the need for steam generation and use will disappear but decline in the UK manufacturing sector would be likely to reduce them significantly. Process technology changes are also likely to reduce steam usage (e.g. alternative sterilisation technologies in hospitals). Reducing energy costs through greater efficiency will be important to businesses if they are to remain competitive and survive in the global marketplace. 3. Additional Benefits Score 3 The key feature of these technologies is their integration with the steam boilers/systems technologies as a whole. Additional benefits from adoption are both environmental and in the potential for introducing new aspects to the UK energy market. Adopting these technologies will:
• reduce impact on local ecology by reducing the amount of ‘hot water’ discharged;
• reduce atmospheric heat pollution; • introduce a new service business, generating financial benefits and jobs if
waste heat is captured and transferred to other sites. Summary This technology change involves the adaptation and integration of known techniques and technologies to increase the efficiency of steam systems. This includes improvements to heat exchanger technology, adaptation of heat storage and transport technologies and application of heat conversion technologies. The benefits would be achieved by changing the approach to the use of heat contained in steam condensate. Currently, it is commonly regarded as a waste, when it should be regarded as a resource to be used. This technology would be most effective if applied at the design phase of new equipment. It is important to note that condensing boilers are not appropriate in most of these applications as they are not able to use the waste heat and neither are condensing economisers applicable. There is a large installed base of steam systems and although this may decline as alternative technologies become available for some processes, it is likely to continue to be a major consumer of fossil fuels. Replacement cycle times suggest that most of these systems may be replaced by 2050. Significant levels of saving are available, if the heat energy in condensate can be recovered in a form that is useable, with around 10% saving in fuel use thought to be available per system.

186
This subject has been around for several years but has not made it into the market place yet. If energy efficiency regulation is applied in this area matched with suitable support for implementation it is estimated that annual savings of up to about 0.92 MtCO2 might be realised by 2050. References Prince S Doherty (University of Nottingham, School of the Built Environment), Heat recovery system using sorption dehumidification of natural gas exhaust, the Carbon Trust Low Carbon Innovation Programme Project No. 2002-7-83 1 ECN - http://www.ecn.nl/eei/research/waste_heat/proceswarmte/index.en.html 1 ECN - http://www.ecn.nl/eei/research/waste_heat/cold.en.html 1 ECN - http://www.ecn.nl/eei/research/waste_heat/storage.en.html 1 Toshinobu Tanimura (KOMATSU), Thermoelectric Generation using Waste Heat, Published by: Symposium of the Technical Division Committee, the Japan Institute of Metals (JIM), The Present and Future of Practical Application Technologies for Thermoelectric Materials (2000) http://www.komatsu.com/research/netuden.htm 1 Akira Tsuyoshi (Kobe City College of Technology) and Kenji Matsuura (Osaka University) Effect of Introduction of a Heat Accumulator on Performance of Thermoelectric Generation http://www.iee.or.jp/honbu/back_number/journal/index_back_number/2000/2000_12b21.pdf 1 Gao Min and Mike Rowe, Recent Advances in Thermoelectric Generation, The 21st International Conference on Thermoelectrics, August 25-29, 2002 - Hyatt Regency Hotel, Long Beach, California USA. 1 European Commission DG for Energy and Transport, Contract no. NNE5/2000/24, Efficient and Better Managed Industrial Processes, New and Efficient Energy Technologies, Thermal Accumulation and Storage. http://www.mmsunshine4.freeserve.co.uk/ebmip/n36.htm 1 http://www.glam.ac.uk/sot/research/MechMan/index.php 1 http://www.leeds.ac.uk/speme/erri/ 1 GSA Resources http://www.gsaresources.com/heat.htm 1 Steelhead Specialty Minerals http://www.s-s-m.com/204.htm

187
Buildings Energy Efficiency Technology Innovative Glazing Overview Glazing is used on buildings for a number of purposes, two of those being: to allow views out of the building and to provide daylighting, thus reducing the need for artificial lighting. In the case of many industrial buildings, there is little real requirement for the first of these aims. Glazing (as part of windows) is also used for natural ventilation. It also forms part of the outer skin of the building and, as such, is integral to preventing heat loss and providing both protection against the weather and security. There have been many developments within glazing, primarily for use in commercial and domestic buildings. This is primarily a consequence of the increasingly stringent requirements of legislation pertaining to energy efficiency and climate change. The predominant glazing at present is unsealed double-glazing, but it has been assumed for this review that double, or possibly even triple, glazing will predominate in the future and that the glazing will usually be filled with an inert gas or vacuum and have a low emissivity film applied to reduce solar heat gains within a building. The following report examines technologies for innovative technologies for glazing that allow for daylighting and/or provide views, but that also reduce solar heat gains and/or losses to and from the building, thus contributing to energy efficiency. Technology This technology topic covers innovative glazing developments in:
• variable transparency to reduce excessive brightness and heat gain in the form of switchable (chromogenic) glazing;
• better insulation to reduce heat loss/gain in the form of transparent insulating materials.
Switchable (chromogenic) glazing is essentially standard insulating glass of two or more layers with a chromogenic coating on the inside of the outer pane. Under normal conditions the glazing, which contains electrochromic materials, acts much the same as a standard window. The transparency diminishes, however, when an electric current is passed across it. There are also variations of the technology that use photochromic materials, which change transparency depending on the light levels. The result is glazing capable of allowing automatic control of the amount of light and heat that passes through the window. Transparent insulation materials, which are usually in the form of honeycomb structures, are designed to let light pass through without the heat transmittance, hence providing daylighting and reducing the need for artificial lighting. Another application of transparent insulating materials is to increase the efficiency of passive solar heating, although this use lies outside the scope of this report.

188
Markets Principal markets for innovative glazing initially would be domestic dwellings and some commercial premises (most likely offices), as homes and offices are where people require the most comfort and thus require the most control of internal heat gains and glare. The markets would ultimately be buildings of all types that require insulation of some kind. The chromogenic glazing could also be utilised in transport, particularly sunroofs of cars and mirrors. The products that would be displaced by these newer glazing solutions are the standard glazing that is presently available, and it is likely that the current glazing manufacturers (eg Pilkington and Saint Gobain, which both have manufacturing facilities in the UK) would be producing the majority of the new products. The transparent insulating materials may not only replace standard glazing, but, depending on attitudes to design, could replace some of the standard insulation materials that are currently utilised. Transparent materials would allow more flexibility with regard to daylighting and hence produce lower lighting costs when incorporated into designs. Issues/Challenges The issues/challenges that these technologies present are primarily technical and economic. As with any new technology, there is also the challenge of gaining acceptance by the profession and the end users. For chromogenic glazing the concerns include developing suitable materials and composites and ensuring that these have both the required performance and durability whilst being sustainable. As there are a (limited) number of prototypes being developed through the IEA Task 27 and the research on the topic is continuing, the outlook for these developments is positive. The risks for transparent insulating materials are similar but higher, due simply to the lower availability of reliable data (although there are certain types that are currently being used). Although no issues are expected with self-cleaning coatings based on present developments, there could potentially be concerns to be addressed with future designs.

189
Key Characteristics Commercial
Unit Value Comments Margin investment cost/ unit* £ 25,000 The technology will be the current
standard with the addition of the chromogenic aspect or insulation, so marginal cost will be higher. Unit cost is that of an average office building.
Annual energy consumption MWh 1,314 O&M costs/year % 2 Nominal costs for cleaning, etc. Percentage savings % 80 Other and additional cost savings
£/year 0
Utilisation or seasonal efficiency
% 30 Chromogenic glazing is seasonal and less useful in winter. Transparent insulating materials are useful year round. The figure represents innovative glazing in general.
Availability Date 2015 Plant lifetime Years 25 Payback Years 7.1 Fuel split % 30 Electricity
70 Fossil This represents the displaced heating and some cooling during summer.
Domestic
Unit Value Comments Margin investment cost/unit* £ 500 The technology will be the current
standard with the addition of the chromogenic aspect or insulation, so marginal cost will be higher. Unit cost is that of an average house.
Annual energy consumption MWh 13 O&M costs/year % 0 Percentage savings % 30 Other and additional cost savings
£/year 0
Utilisation or seasonal efficiency
% 30 Chromogenic glazing is seasonal and less useful in winter. Transparent insulating materials are useful year round. The figure represents innovative glazing in general.
Availability Date 2015 Plant lifetime Years 25 Payback Years 10.8 Payback longer than commercial, as
more significant expenditure on smaller scale.
Fuel split % 20 Electricity 80 Fossil
This represents the displaced heating and some cooling during summer, where fitted.
* This measure takes into account the saving compared to the existing technology
Key Players The technology is as advanced in the UK as elsewhere in the world, and there is potential for industry to take the technology forward through Pilkington and Saint

190
Gobain. The potential for involvement with transparent insulating materials in the UK is, however, more limited, at least at the moment, as the main players are based in Europe and the USA rather than in the UK. There is also some collaboration through the Faraday Partnerships INREB project between the University of Ulster, Toughglass Ltd (UK), Uniglass (Greece) and Patsis Glass (Greece). The key players in the UK include:
• Universities: Cardiff University (the Centre for Research in the Built Environment); Oxford Brookes (the Oxford Institute for Sustainable Development); Southampton; Ulster; and Strathclyde;
• Industry: Pilkington and Saint Gobain both have manufacturing facilities in the UK, and Pilkington also has R&D facilities for automotive glazing market applications. Neither Pilkington nor Saint Gobain is currently looking at chromogenic glazing for buildings.
Key players abroad include the International Energy Agency Task 27, which includes international participants (from a range of countries):
• The Institute for Research in Construction, Canada; • Velux A/S, Denmark; • VTT Building Technology, Finland; • CSTB, EDF and ENTPE, France; • Fraunhofer ISE, FLABEG GmbH, FH Aachen, ift. Rosenheim, Germany; • ENEA, Italy; • TNO Building and Construction Research, Netherlands; • Erichsen & Horgen A/S, Norway; • INETI, Portugal; • SP Swedish National Testing and Research Institute, Vattenfall Utveckling
AB, Sweden; • Hochschule Rapperswil HSR & EMPA, Switzerland; • Lawrence Berkeley National Laboratory & NREL, USA; • and universities including Université Catholique de Louvain, Belgium;
Università di Palermo, Italy; Uppsala University and Lund University, Sweden; and the University of Massachusetts, USA.
Other players include the Technical University of Budapest, Hungary and NTERA, Ireland. Advanced Glazings Limited, Canada; Saint-Gobain Recherche, France; and WACOTECH GmbH & Co. KG and ZAE Bayern, Germany are further industrial players.

191
Technology Development Potential gaps in the innovation chain: The gap with regard to chromogenic glazing will be in taking it from prototype to production and engaging industry. Transparent insulation gaps will be in identifying the potential materials and systems at the R&D stage.
Blue skies
research
Industrial R&D
Full-scale prototype
A-model prototype
Series production
Mk II design
Long-run series production
2005 2005 2010 2015 2020 2050 Carbon Summary - Commercial Date/data Penetration
(%) CO2
(kt/year) CO2 (£/t)
Comments
2010 0 0 54 R&D stage 2015 2 145 52 Start of market 2020 15 1,009 60 Acceptance of technology 2050 75 3,909 117 Consolidated market Carbon Summary – Domestic Date/data Penetration
(%) CO2
(kt/year) CO2 (£/t)
Comments
2010 0 0 111 R&D stage 2015 2 353 117 Start of market 2020 10 1,736 122 Acceptance of technology 2050 50 7,574 202 Consolidated market Technology Impact Assessment 1. Estimated UK Economic Benefits Score 5 The universities and industrial players in the UK are all in strong positions with regard to knowledge base, development of the technologies and market coverage. There is also a good combination of university and industry involvement to enable the resources to be effectively utilised within the UK. Greater collaboration between the universities and industry should be considered to further this potential. The principle driver to get the technologies to market is currently legislation, particularly the energy efficiency and climate change legislation from the UK and Europe. There will also be financial drivers once the cost benefits of the technologies have been proven. With both Pilkington and Saint Gobain manufacturing within the UK, there is also the potential of UK employment. 2 Scope for Government Action Score Research into chromogenic glazing and transparent insulating materials is being conducted in various countries, by universities, government research establishments and industry. Within the UK, Cardiff, Oxford Brookes, Strathclyde and Southampton Universities and Pilkington are active (among others). The bulk of the research for chromogenic glazing is being completed through IEA task 27, a collaboration between the USA, Europe and Asia, but the UK is not part of that collaboration. The National Renewable Energy Laboratory (NREL) in the USA has produced a

192
prototype for chromogenic glazing, which is presently in their visitor centre in Golden, Colorado. Developments are ongoing into the different types of chromogenic glazing (ie electrochromic, photochromic, etc) and the material choices. There are certain types of transparent insulating materials just coming onto the market. Presently, however, the term ‘transparent is a misnomer, as, although they allow daylighting, they are not actually transparent, with transmittances of up to about 75%. Transmittances of up to 95% have been suggested, but not yet proved in practice. This all suggests that further investment in the technologies is required, both to develop the technology and also to promote UK players and ensure that the UK has a part to play in the future technologies through R&D and manufacture. The level of funding provided by central sources would have an impact, particularly in stimulating further investment by industry, and thus would likely have influence the progress of these technologies. 3 Market Entry Score 3 The key barriers to market for chromogenic glazing are the prohibitive prices (due to their prototype nature). Although considerable effort is being put into testing the performance and durability of the prototype products, there is still some way to go to get good results and industry acceptance with regard to reliability and credibility across the board. Nonetheless, some of the technologies already have limited exposure, with use in car mirrors and possible future use in airplane windows. The issues for transparent insulating materials are similar. The transmittances are presently up to 75% (possibly 95%), which allows for good daylighting and diffusion, but development of the materials and composites are still required. Funding could be beneficial for both developing the technologies and testing the technologies as they emerge to prototype stage. This should then have some impact on industry acceptance and the take up of the technology. The industry is also completing research into the area. As the energy efficiency and climate change legislation continues to increase, new technologies should become more economically viable. Industry should thus be able to find an economic reason for completing research in such areas, but a certain amount of commitment and funding from the government is generally seen favourably by industry and could increase their commitment. In the UK, the technology could provide benefits for industry and for certain universities (that complete research in the field) and would also help reduce energy consumption in buildings.

193
4 Risk Score 3 As long as the energy efficiency and climate change legislation continues to increase, the risks to investing in these technologies are minimal; the competing current technologies will not meet future standards, thus necessitating innovative technologies. The principal risk is probably that much of the research and development is being conducted in other countries, meaning that those countries (rather than the UK) are most likely to benefit. By not investing in these technologies, the UK could lose the potential commercial benefits of these technologies in the future. Carbon Dioxide Reduction Questions 1 Carbon Dioxide Reduction Score 5 and 2 By reducing solar gain in buildings through the use of chromogenic glazing and transparent insulating materials there will be a reduction in the required cooling in buildings. There will also be less heat loss from buildings, thus reducing the requirements for heating in the winter, as well as increased scope for the use of daylighting, thus reducing the load associated with artificial lighting. The amount and cost of carbon savings are shown in the tables above for commercial and domestic sectors. As these tables demonstrate, the domestic sector has scope for greater savings than does the commercial sector, due to the high heating energy used in the domestic sector; the cost of the savings is, however, also higher in the domestic sector. 2 Market Penetration Score 4 Glazing is continually improving, a process that is stimulated by the increasing energy efficiency and climate change legislation in the UK, particularly in the buildings sector. There will always be a need and desire for windows, and natural daylighting helps reduce energy use through the displacing of artificial lighting. If the insulation requirements for buildings continue to increase, then there will be a requirement for glazing to have higher insulation performance. Based on this scenario, chromogenic glazing and transparent insulating materials together could be expected to take a large part of the market, both within the UK and abroad. There is potential is for using new these technologies in buildings across the world, with greater markets in sunnier climes. 3 Additional Benefits Score 4 By improving the insulation of buildings through the use of products such as transparent insulating materials and reducing solar gain through chromogenic glazing, the requirements for heating in the winter and cooling in the summer will be reduced. For domestic dwellings in particular, heating may eventually no longer be necessary. In this case there would be reductions in greenhouse gas emissions and also all the savings along the supply chain coming from reduced levels of service equipment, resulting in a reduction in whole life costs and embodied energy.

194
Summary The predominant glazing at present is unsealed double-glazing, but it has been assumed for this review that the predominant glazing will be double, or possibly even triple, glazing and that the glazing will usually be filled with an inert gas or vacuum and will have a low emissivity film applied to reduce solar heat gains within a building. The innovative technologies for glazing covered in this review include switchable (chromogenic) glazing and transparent insulating materials. Switchable (chromogenic) glazing varies the transparency of the glazing to automatically control the light and heat transfer. Transparent insulating materials allow the passage of light. The principle markets initially would be domestic dwellings and some commercial buildings, most likely offices. The markets would ultimately be buildings of all types that require insulation of some kind. The risks for these technologies generally concern developing suitable materials and composites and these having the required performance and durability whilst being sustainable. There are potentially large savings of CO2 to be made using these technologies, as they would displace heating, cooling and lighting, all of which are significant producers of CO2, being based primarily on fossil fuel combustion. Funding is required to advance R&D and to maintain UK interest in the technologies due to the significant presence in the market of other countries, most notably the USA. References USA DOE, www.doe.gov NREL – National Renewable Energy Laboratory, USA, www.nrel.gov/buildings/windows IEA task 27, www.iea-shc-task27.org

195
Appendix C Description of spreadsheet files and analysis The following figures show the nature and layout of the spreadsheet analysis described in Part V. There are two main worksheets: 1) an input data sheet and 2) a cost and contribution analysis sheet. The figures show the four main areas of input data and output calculations as follows:
Key inputs in the analysis; Measure costs and benefits estimates; Net cost calculations; Technology penetration and abatement cost results.
1. Key inputs in the analysis 2. Measure costs and benefits estimates
1 Example input sheet 2010 consumptions Elec £/kWhGas £/kWh0.031 0.009 4 5 6 7 8
CodeFuel saved Total GW Util GWh
Prod units MW % saved
X X-Steam generationBoilers 1 Radical redesign 1X1 Gas 16.44 70% 100,837 20 4%
9 Design tools 1X9 Gas 16.44 70% 100,837 20 2%10 Monitoring systems 1X10 Gas 16.44 70% 100,837 20 3%22 Distribution systems 1X22 Gas 11.51 100% 100,837 100 10%
3 Control systems 1X3 Gas 11.51 100% 100,837 1.0 5%A A-Commercial PV
Comm existing +new 2 PV devices 1A2 Elect 17.45 70% 107,018 0.5 30%
AL AL-Commercial lightingComm existing +new 12 New technologies 1AL12 Elect 7.04 70% 43,194 0.5 25%
AA AA-VentilationComm existing 6 Air tightness standards 1AA6 Gas 15.21 70% 93,237 0.5 20%
life yrscap cost £
other cost £p.a.
other saving £p.a.
Value energy saved £p.a.
20 250,000 2,000 44,11620 50,000 1,000 22,05820 150,000 1,500 33,08715 4,400,000 10,000 8,000 787,79220 90,000 100 3,939
10 300,000 1,000 0 28,823
10 75,000 0 0 24,019
10 50,000 1,000 0 5,515

196
3. Net cost calculations 4. Technology penetration and abatement cost results
Discount Rate NPV E.S NPV O.C NPV O.S
Net Present Cost
An. Capital Cost
An. Oper'tg Saving
Gross cost Net cost
15% £k/unit £k/unit £k/unit £k/unit £k/unit £k/unit £/MWh £/MWh
15% 16.4 0.3 0.0 12,484 3.73 -1.1 15.61 -4.3915% 8.2 0.2 0.0 2,492 0.75 -1.7 6.49 -13.5115% 12.3 0.3 0.0 7,488 2.24 -1.4 12.57 -7.4315% 58.7 0.3 0.3 43,941 13.13 -4.4 15.01 -4.9915% 29.4 0.3 0.0 89,971 26.85 18.2 61.53 41.53
15% 246.7 6.7 0.0 599,760 178.99 107.4 98.39 58.39
15% 205.6 0.0 0.0 149,794 44.75 -16.6 29.19 -10.81
15% 82.2 6.7 0.0 99,924 29.83 7.3 25.96 5.96
15% 82.2 0.0 0.0 399,918 119.33 94.8 97.30 77.3015% 123.3 0.0 0.0 199,877 59.66 22.9 32.43 12.4315% 246.7 0.0 0.0 499,753 149.16 75.6 40.54 20.54
15% 246.7 0.0 0.0 299,753 89.49 15.9 24.32 4.3215% 164.4 0.0 0.0 99,836 29.83 -19.2 12.16 -7.84
POTENTIAL Penetration
CO2 EMISSIONS ANALYSIS
CO2 SAVED
CO2 ABATEMENT COST
GWh pa % ktCO2 pa £/t.CO2
4,033 766 -232,017 383 -713,025 575 -39
10,084 1,916 -265,042 958 219
32,105 14,126 133
10,799 4,751 -25
18,647 3,543 31
23,309 4,429 40734,964 6,643 6569,928 13,286 108
13,986 2,657 239,324 1,772 -41


