ING Investor Day 2019: Risk Management
16
Risk Management Steven van Rijswijk, CRO Investor Day 2019 Frankfurt • 25 March 2019
Transcript of ING Investor Day 2019: Risk Management

Risk Management
Steven van Rijswijk, CRO
Investor Day 2019
Frankfurt • 25 March 2019

Reputation and trust are paramount
2
NFR GovernanceNon-Financial Risk areas
Compliance Risk
UnauthorisedActivity Risk
Control & ProcessingRisk
Employment Practice Risk
Personal & Physical Security Risk
Information (Technology)
Risk
Continuity Risk
Internal Fraud Risk
External Fraud Risk
Non-Financial Risk Framework
Business Continuity
Management Framework
IT within risk appetite
Global E-Discovery tool
developed to combat fraud
Dedicated centres of expertise and shared
service centres
Data Analytics & Robotics
NFR related reporting
Enterprise Risk Management Programme
Non-Financial Risk highlights

Management of IT Risk
3
Data & privacy protectionCybercrime resilience
ING regularly withstands cyber attacks
• DDoS* prevention measures in place
• Periodical hackathon
• Data and systems security is paramount
• Data leakage protection tools
• Monitoring capabilities strengthened
* DDoS – Distributed Denial of Service
Business continuity &operational resilience
• Away from a pure recovery strategy to a operational resilience strategy
• We prepare for and quarterly conduct scenario based testing of disruptive events
CrisisManagementOrganisation
(CMO)BCM
Framework
BusinessContinuity Plan
(BCP)
DisasterRecovery Plan
(DRP)

A lending-focused model with prudent credit risk management
4
87%
11%2%
Credit RWA
Operational RWA
Market RWA
51%
48%
1%
Retail Banking
Wholesale Banking
Corporate Line
€272 bln
63%
37%
Retail BankingWholesale Banking
€675 bln €314 bln
* Lending credit outstanding is lending and money market credit outstandings, including guarantees and letters of credit, but excluding undrawn committed exposures (off-balance sheet positions). Going forward we would refer to Lending credit outstandings as “Lending”, unless stated otherwise
Total lending credit outstandings*
as per end-2018
Total RWA
as per end-2018
Credit RWA split
as per end-2018

Residential mortgages remain significant part of our book
2014 2018
Retail lending overview
5
Netherlands Belgium Germany Australia Poland Spain Other
2018
2014
Retail lending across geographies
* Includes €17 bln Bank Treasury and €15 bln of Other Retail lending as per end-2018
€392 bln €428 bln
€428 bln
€392 bln
71%
4%
18%
7%
69%
6%
18%
7%
Residential mortgages
SME/Midcorp lending
Consumer lending
Other lending*
43%
35%
18%
22%
19%
21%
7%
8%
2%
4%
3%
4% 6%
7%

Credit Risk Management –Wholesale Banking
6

Credit risk concentration
Strong risk management framework
1. Front Office
2. Risk
3. InternalAudit
Credit risk appetite
Senior staff has direct responsibility for the
client, sector, product or transaction
Three lines of defence Personal responsibility on top of risk frameworks
Continuously strengthening management of credit risk
7
Concentration risk measured, managed and monitored on various levels
• Client (single name)
• Product
• Sector
• Country
• Internal capital consumption
• LGD
• Collateral/secondary risk
Book caps introduced
• REF*
• Leveraged finance
Activities no longer fitting business profile and/or risk appetite
• RED* & REIM* businesses exited
• Leasing exited or in run-off
* REF - Real Estate Finance, RED – Real Estate Development, REIM – Real Estate Investment Management

Well-diversified lending across our global franchise…
8
Trade & Commodity Finance (TCF)* Transaction Services
Project and Asset-based Finance excl. TCF* Real Estate Finance*
General Lending Other
EMEA9%
15%
25%18%
27%
6%Asia
24%
22%33%
4%
14%3%
€44 bln
Americas9%
12%
64%
6%8%
€157 bln€47 bln
Total Wholesale Bank12%
15%
34%14%
21%
4%
€248 bln
<= 1 year**
> 1 year**Figures on slide as per end-2018* Products jointly representing Industry Lending segment** Based on residual maturity. Average maturity of the book > 1 year is ~4 years
Average maturities >1 year:4.0 years

Lending cover percentages including guarantees received
Nearly all lending is senior**
AAA AA A BBB BB B CCC < CCC
WB average internal counterparty rating distribution improved*
31%
35%
34%
4% 2%3% 1%
9%7%
33%35%
36% 40%
11% 12%
4% 3%0% 1%
2014 2018
> 55% of lending credit outstandings
are investment grade
…with a clear focus on senior and secured deal structures
9
99.98%
0.02%
Senior
Subordinated
€248 bln***
34…
36…6%15…9% Sales
Fully covered
Partially covered
No cover
Figures as per end-2018 * Excluding Bank Treasury** Lending is ING Group total loans and advances to customers*** Cover pool value (€214 bln) exceeds total underlying loan amount (€163 bln or 66% of WB lending book) due to overcollateralisation

Risk costs Wholesale Banking
-50
0
50
100
150
200
-500
0
500
1,000
1,500
2,000
2007 2009 2011 2013 2015 2017
Risk costs (in € mln, lhs) Risk costs (in bps of RWA, rhs)
144
12890
160
489
261
6433 27 14 -1
2007 2009 2011 2013 2015 2017
-36
38
6445 45 42 38
5849
8 5 9
2007 2009 2011 2013 2015 2017
Wholesale Banking through-the-cycle risk costs
10
Risk costs Project & Asset-based Finance (in bps of average RWA)
Risk costs General Lending (in bps of average RWA)Risk costs Real Estate Finance (in bps of average RWA)
-12
72
169
3624
84 66 57
52
40
22 21
62
5927 36
-315 13 12
63
-15
30 22
2007 2009 2011 2013 2015 2017
Project and Asset-based Finance of which TCF

Proactive restructuring preserves value
11
WB through-the-cycle risk costs vs write-offs
Cumulative over 2008-2018
€6.4 bln
€5.5 bln
75%
Proactive restructuring Prudent provisioning
Global Credit Restructuring files with no losses
Risk costs Write-offs
Over ~€210 bln average WB lending book over 2008-2018

Leveraged finance book* highly diversified by industry (as per end-2018)
20%
20%
17%10%
9%
6%
4%4%
3% 7% Services
Chemicals, Health & Pharmaceuticals
General Industries
Non-Bank Financial Institutions
Food, Beverages & Personal Care
Retail
Transportation & Logistics
Automotive
Builders & Contractors
Other
Business overview
• Focus on larger sponsors with an established track record and a good history of seeking to resolve issues in event of underperformance by the acquired business
• Mainly active in large developed markets
• Granular book of €8.4 bln as per end-2018 (average commitment of ~€25 mln) with a strong industry diversification
• Sell-down targets constantly monitored and met (on average ~40 days from mandate to allocation)
• Since 2007, significant reduction (45%) of the underwriting limit for leveraged finance transactions
Leveraged finance book managed within a solid framework
12
57%
1%
42%
AmericasAsiaEMEA
€8.4 bln
Leveraged finance book* focused on developed markets (as per end-2018)
€8.4 bln
Main actions taken
• Global cap of €9.6 bln
• Maximum final take for single transaction ~€25 mlnrecently introduced
• Maximum leverage 6.5x
• No single underwrites
* Leveraged finance is defined as Private Equity driven leveraged finance with higher than 4x leverage. Leveraged finance book is total commitments (i.e. including undrawn)
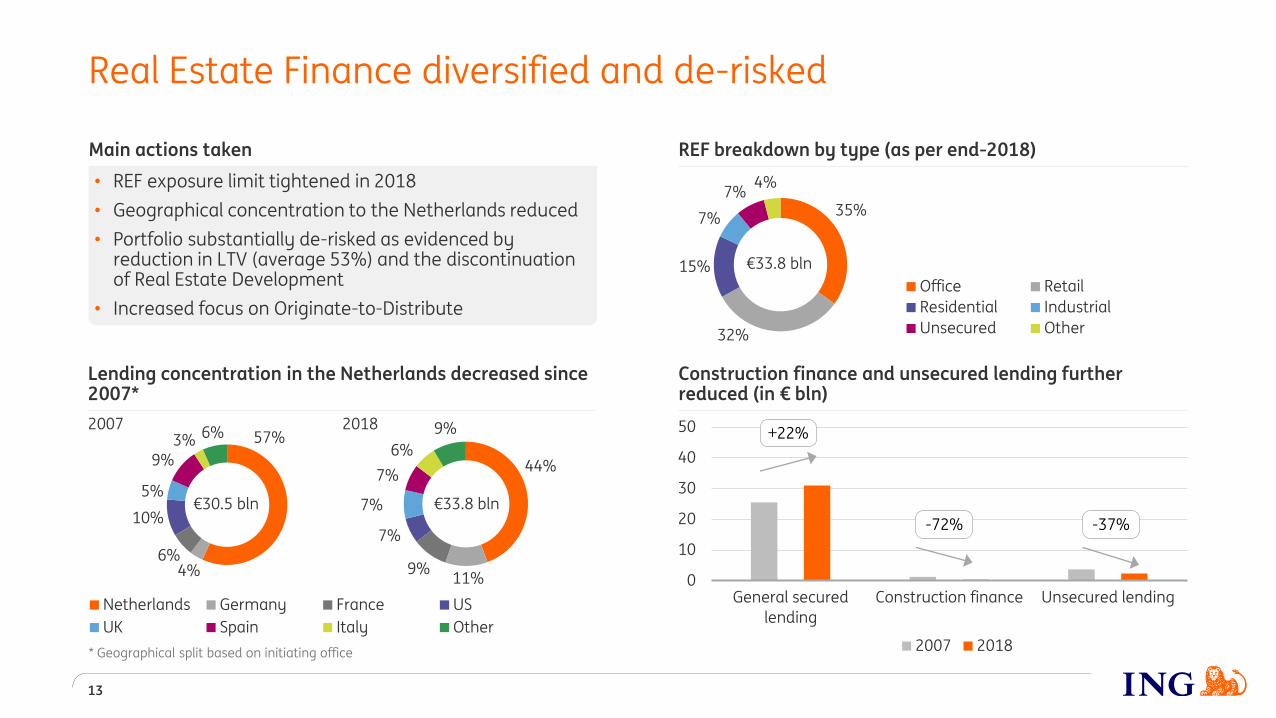
44%
11%9%
7%
7%
7%
6%
9%
Netherlands Germany France US
UK Spain Italy Other
57%
4%6%
10%
5%
9%3% 6%
Lending concentration in the Netherlands decreased since 2007*
2007 2018
35%
32%
15%
7%
7%4%
Office Retail
Residential Industrial
Unsecured Other
Construction finance and unsecured lending further reduced (in € bln)
REF breakdown by type (as per end-2018)
0
10
20
30
40
50
General secured
lending
Construction finance Unsecured lending
2007 2018
Real Estate Finance diversified and de-risked
13
€33.8 bln
€33.8 bln€30.5 bln
+22%
Main actions taken
• REF exposure limit tightened in 2018
• Geographical concentration to the Netherlands reduced
• Portfolio substantially de-risked as evidenced by reduction in LTV (average 53%) and the discontinuation of Real Estate Development
• Increased focus on Originate-to-Distribute
* Geographical split based on initiating office
-72% -37%

Lending credit outstandings by asset type
50%
6%
17%
16%2%
1%8%
€33.7 bln€4.3 bln
• Predominantly loans to investment grade large integrated oil & gas companies
• Directly impacted by oil & gas markets
• Directly impacted by oil & gas markets
• Smaller independent oil & gas producers directly exposed to oil & gas price risk
• Focus on first cost quartile producers
• These assets typically generate revenues from long-term tariff based contracts, not affected by oil & gas price movements
• ECA-covered loans in oil & gas sector: typically 95% -100% credit insured
• Short term self-liquidating trade finance, generally for major trading companies, either pre-sold or price-hedged
Oil & Gas book structured to withstand adverse market conditions
Total €38.0 bln
Directly exposed to
commodities price risk
Not directly exposed to
commodities price risk
Industry Lending: Other Offshore
Services Companies
Industry Lending:
Offshore Drilling Companies
Industry Lending: Reserve Based
Lending
Industry Lending: Midstream
Corporate Lending
Export FinanceTrade Finance
14
Business overview
• We lend to operating companies, keeping a senior position versus other creditors
• €4.3 bln directly exposed to commodity price risk
Main actions taken
Caps introduced for:
• Offshore drilling (exposure halved since 2015)
• Reserve Based Lending at regional level

Business overview
• Not a traditional ship finance mortgage lender
• Secured corporate lender
• Recourse to a corporate balance sheet
• Long-term client relationships with companies with clear strategies, appropriate capital structures and access to liquidity
• Focus on modern tonnage in commoditised asset classes with active secondary markets
• Legacy short sea portfolio reducing in a balanced way via vessel sales as opportunities arise
• Geopolitical factors (trade war), economic transition in China, the commodity cycle and shipping supply will continue to be key drivers
Shipping lending by asset type (as per end-2018)
Stage 3 ratio*
Transportation deep sea & other 3.6%
Shipping services 0.4%
Transportation near-coastal & inland water freight 20.3%
30%
7%
63%
Deep sea shipping through-the-cycle (in € mln)
Cumulative over 2008-2018
A secured lender in shipping focused on selected clients
15
€14.6bln
Book progressively reducing
Main actions taken
Near-costal & inland water freight book:
• Stop new transactions
• Progressively reduce exposure ~€90 mln
~€50 mln
Risk costs Write-offs
* As per end-2018
Important legal information
16
ING Group’s annual accounts are prepared in accordance with International Financial Reporting Standards as adopted by the European Union (‘IFRS-EU’). In preparing the financial information in this document, except as described otherwise, the same accounting principles are applied as in the 2018 ING Group consolidated annual accounts. All figures in this document are unaudited. Small differences are possible in the tables due to rounding.Certain of the statements contained herein are not historical facts, including, without limitation, certain statements made of future expectations and other forward-looking statements that are based on management’s current views and assumptions and involve known and unknown risks and uncertainties that could cause actual results, performance or events to differ materially from those expressed or implied in such statements. Actual results, performance or events may differ materially from those in such statements due to a number of factors, including, without limitation: (1) changes in general economic conditions, in particular economic conditions in ING’s core markets, (2) changes in performance of financial markets, including developing markets, (3) potential consequences of the United Kingdom leaving the European Union or a break-up of the euro, (4) changes in the fiscal position and the future economic performance of the US including potential consequences of a downgrade of the sovereign credit rating of the US government, (5) potential consequences of a European sovereign debt crisis, (6) changes in the availability of, and costs associated with, sources of liquidity such as interbank funding, (7) changes in conditions in the credit and capital markets generally, including changes in borrower and counterparty creditworthiness, (8) changes affecting interest rate levels, (9) inflation and deflation in our principal markets, (10) changes affecting currency exchange rates, (11) changes in investor and customer behaviour, (12) changes in general competitive factors, (13) changes in or discontinuation of ‘benchmark’ indices, (14) changes in laws and regulations and the interpretation and application thereof, (15) changes in compliance obligations including, but not limited to, those posed by the implementation of DAC6, (16) geopolitical risks, political instabilities and policies and actions of governmental and regulatory authorities, (17) changes in standards and interpretations under International Financial Reporting Standards (IFRS) and the application thereof, (18) conclusions with regard to purchase accounting assumptions and methodologies, and other changes in accounting assumptions and methodologies including changes in valuation of issued securities and credit market exposure, (19) changes in ownership that could affect the future availability to us of net operating loss, net capital and built-in loss carry forwards, (20) changes in credit ratings, (21) the outcome of current and future legal and regulatory proceedings, (22) operational risks, such as system disruptions or failures, breaches of security, cyber-attacks, human error, changes in operational practices or inadequate controls including in respect of third parties with which we do business, (23) risks and challenges related to cybercrime including the effects of cyber-attacks and changes in legislation and regulation related to cybersecurity and data privacy, (24) the inability to protect our intellectual property and infringement claims by third parties, (25) the inability to retain key personnel, (26) business, operational, regulatory, reputation and other risks in connection with climate change, (27) ING’s ability to achieve its strategy, including projected operational synergies and cost-saving programmes and (28) the other risks and uncertainties detailed in this annual report of ING Groep N.V. (including the Risk Factors contained therein) and ING’s more recent disclosures, including press releases, which are available on www.ING.com. (29) This document may contain inactive textual addresses to internet websites operated by us and third parties. Reference to such websites is made for information purposes only, and information found at such websites is not incorporated by reference into this document. ING does not make any representation or warranty with respect to the accuracy or completeness of, or take any responsibility for, any information found at any websites operated by third parties. ING specifically disclaims any liability with respect to any information found at websites operated by third parties. ING cannot guarantee that websites operated by third parties remain available following the publication of this document, or that any information found at such websites will not change following the filing of this document. Many of those factors are beyond ING’s controlAny forward looking statements made by or on behalf of ING speak only as of the date they are made, and ING assumes no obligation to publicly update or revise any forward-looking statements, whether as a result of new information or for any other reason.This document does not constitute an offer to sell, or a solicitation of an offer to purchase, any securities in the United States or any other jurisdiction.