Infrared Spectroscopy Department of Natural Sciences UM-Dearborn Written by Bette Kreuz Produced by...
41
Infrared Infrared Spectroscopy Spectroscopy Department of Natural Department of Natural Sciences Sciences UM-Dearborn UM-Dearborn Written by Bette Kreuz Written by Bette Kreuz Produced by Ruth Dusenbery Produced by Ruth Dusenbery 2000 2000
-
Upload
brandon-golden -
Category
Documents
-
view
214 -
download
0
Transcript of Infrared Spectroscopy Department of Natural Sciences UM-Dearborn Written by Bette Kreuz Produced by...

Infrared Infrared SpectroscopySpectroscopy
Department of Natural Department of Natural SciencesSciences
UM-DearbornUM-DearbornWritten by Bette KreuzWritten by Bette Kreuz
Produced by Ruth DusenberyProduced by Ruth Dusenbery20002000

Info Slide 1Info Slide 1
Infrared spectroscopy is an Infrared spectroscopy is an instrumental method of instrumental method of analysis that can be used to analysis that can be used to identify and quantify identify and quantify samples ranging from samples ranging from pharmaceuticals to diesel pharmaceuticals to diesel emissions.emissions.

Slide 1 Slide 1 IntroductionIntroduction
Info Slide 2Info Slide 2 All modern instruments All modern instruments
are Fourier Transform are Fourier Transform instruments. instruments.
In all transmission In all transmission experiments radiation experiments radiation from a source is directed from a source is directed through the sample to a through the sample to a detector. detector.

Slide 2Slide 2Sample Sample
CompartmentCompartmentIR SourceIR Source DetectorDetector

Info Slide 3Info Slide 3
The measurement of the The measurement of the type and amount of light type and amount of light transmitted by the sample transmitted by the sample gives information about gives information about the structure of the the structure of the molecules comprising the molecules comprising the sample.sample.

Slide 3Slide 3
Infrared Infrared SourceSource
DetectorDetector
Sample Sample CompartmentCompartment
Info Slide 4Info Slide 4
In the IR region of the In the IR region of the electromagnetic spectrum, electromagnetic spectrum, the absorption of radiation the absorption of radiation by a sample is due to by a sample is due to changes in the vibrational changes in the vibrational energy states of a energy states of a molecule. molecule.

Slide 4Slide 4

Info Slide 5Info Slide 5
The pattern of absorption The pattern of absorption as a function of as a function of wavelength is called an IR wavelength is called an IR spectrum.spectrum.

Slide 5Slide 5

Info Slide 6Info Slide 6 To obtain an IR To obtain an IR
spectrum, the sample spectrum, the sample must be placed in a must be placed in a “container” or cell that “container” or cell that is transparent in the IR is transparent in the IR region of the spectrum. region of the spectrum.
Sodium chloride or salt Sodium chloride or salt plates are a common plates are a common means of placing the means of placing the sample in the light sample in the light beam of the instrument.beam of the instrument.

Slide 6Slide 6
IR transparent Salt PlatesIR transparent Salt Plates

Info Slide 7Info Slide 7
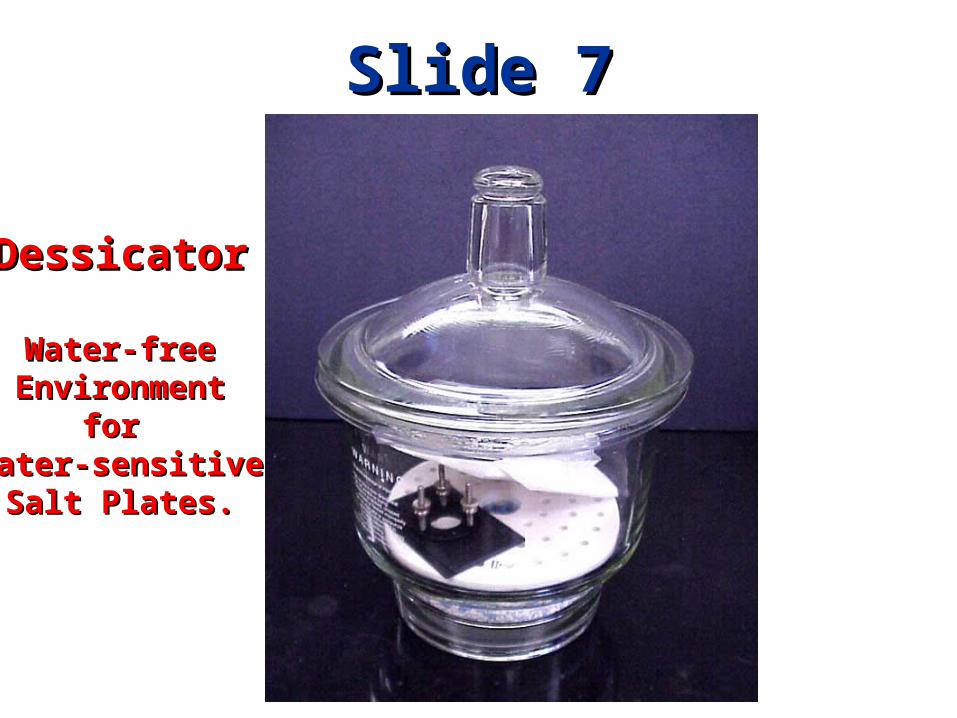
These plates are made of These plates are made of salt and must be stored in salt and must be stored in a a water freewater free environment environment such as the dessicator such as the dessicator shown here. shown here.
Slide 7Slide 7
DessicatorDessicator
Water-freeWater-freeEnvironmentEnvironment
for for Water-sensitiveWater-sensitive
Salt Plates.Salt Plates.

Info Slide 8Info Slide 8
The plates must also be The plates must also be handled with gloves to handled with gloves to avoid contact of the plate avoid contact of the plate with moisture from one’s with moisture from one’s hands.hands.

Slide 8Slide 8

Info Slide 9Info Slide 9
To run an IR spectrum of a To run an IR spectrum of a liquid sample, a drop or liquid sample, a drop or two of the liquid sample is two of the liquid sample is applied to a salt plate.applied to a salt plate.

Slide 9Slide 9

Info Slide 10Info Slide 10
A second salt plate is A second salt plate is placed on top of the first placed on top of the first one such that the liquid one such that the liquid forms a thin film forms a thin film “sandwiched” between the “sandwiched” between the two plates.two plates.

Slide 10Slide 10

Info Slide 11Info Slide 11
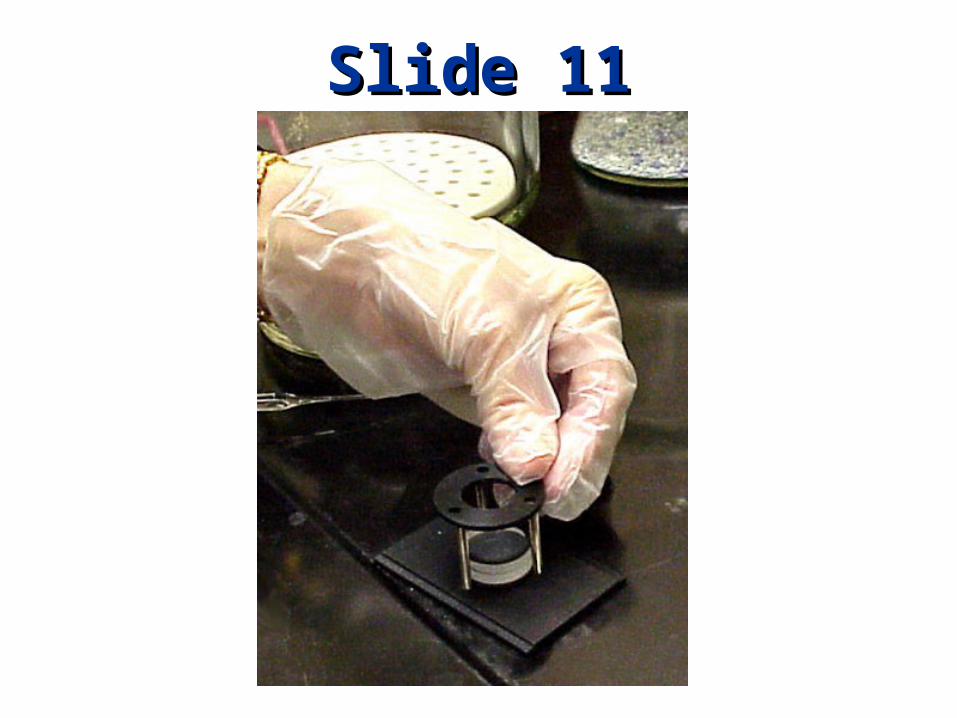
The two plates are then The two plates are then secured in a sample holder secured in a sample holder that is compatible with the that is compatible with the particular instrument particular instrument being used.being used.
Slide 11Slide 11
The cell holder is then The cell holder is then placed in the beam of the placed in the beam of the instrument.instrument.
Info Slide 12Info Slide 12

Slide 12Slide 12

The light beam traverses The light beam traverses the sample compartment, the sample compartment, as illustrated by the red as illustrated by the red line.line.
Info Slide 13Info Slide 13

Slide 13Slide 13
Light PathLight Path(shown by red line)(shown by red line)

Info Side 14Info Side 14
The sample is then The sample is then scanned by the instrument scanned by the instrument utilizing predesignated utilizing predesignated parameters.parameters.
A relevant background A relevant background
scan should already have scan should already have been taken.been taken.

Slide 14Slide 14
Click Here to Start ScanClick Here to Start Scan

Info Slide 15Info Slide 15 A satisfactory spectrum has A satisfactory spectrum has
well defined peaks-but not well defined peaks-but not so intense as to cause so intense as to cause flattening on the bottom of flattening on the bottom of the peaks.the peaks.
Major peaks can be labeled Major peaks can be labeled using the peak function of using the peak function of
the softwarethe software

Slide 15Slide 15
Well-definedWell-definedpeaks are peaks are labeled with the labeled with the Wavenumbers Wavenumbers of the of the Absorption Absorption Maxima.Maxima.
Info Slide 16Info Slide 16
The spectrum can then be The spectrum can then be printed using the print printed using the print function of the software.function of the software.

Slide 16Slide 16
Info Slide 17Info Slide 17
A sample of a printout of A sample of a printout of an IR spectrum.an IR spectrum.

Slide 17Slide 17
Sample of a Sample of a printout of printout of an IR an IR spectrum.spectrum.

Info Slide 18Info Slide 18
The salt plates are cleaned The salt plates are cleaned by rinsing into a waste by rinsing into a waste container with a suitable container with a suitable organic solvent-commonly organic solvent-commonly cyclohexane.cyclohexane.
NEVER WATER!NEVER WATER!

Slide 18Slide 18
CYCLOHEXANECYCLOHEXANESolventSolvent
Info Slide 19Info Slide 19
Cloudy plates must be Cloudy plates must be polished to return them to polished to return them to a transparent condition.a transparent condition.
To polish cloudy windows, To polish cloudy windows,
rotate salt plate on rotate salt plate on polishing cloth.polishing cloth.

Slide 19Slide 19
Info Slide 20Info Slide 20
The clean plates and cell The clean plates and cell holder are stored in the holder are stored in the moisture free atmosphere moisture free atmosphere of a dessicator.of a dessicator.

Slide 20Slide 20