Influenza Weekly Surveillance Bulletin Bulletin Week 5... · 4 Figure 3. Northern Ireland GP...
18
1 Summary In week 5, the surveillance data continues to indicate moderate seasonal flu activity, with most indicators showing a continued decrease in flu activity from week 4. GP consultation rates continued to decrease however, there was an increase in OOH consultations in week 5 (week commencing 29 th January 2018). Total detections of influenza virus fell in week 5. Northern Ireland Primary Care Consultation Rates GP consultation rates for combined flu and flu-like illness (flu/FLI) decreased from 44.2 per 100,000 population in week 4, 2018 to 29.0 per 100,000 population in week 5. Rates are continuing to decrease but remain above the Moving Epidemic Method (MEM) threshold for moderate level flu activity 1 . OOH GP consultation rates for flu/FLI increased from 9.7 per 100,000 population in week 4, 2018 to 17.0 per 100,000 population in week 5. Microbiological Surveillance (Flu and RSV) The proportion of all positive influenza specimens fell slightly from 39% in week 4, 2018 to 37% in week 5. RSV remained the same in week 5 at 2%. Secondary Care (Hospital both non-ICU and ICU) The number of detections of influenza from hospital wards reported to PHA decreased from a total of 187 detections in week 4, 2018 to 162 in week 5. There were four cases reported in ICU with laboratory confirmed influenza in week 5 giving a total of 75 cases this season to date. No deaths were reported in week 5 among ICU patients. The total deaths in ICU with confirmed influenza to date is 12. Influenza Outbreaks across Northern Ireland There was one confirmed influenza outbreak reported to the PHA in week 5 bringing the total confirmed Influenza outbreaks to date to 33. Mortality The proportion of deaths related to respiratory keywords (bronchiolitis, bronchitis, influenza and pneumonia) increased slightly from 39% in week 4, 2018 to 40% in week 5. 1 The baseline MEM threshold for Northern Ireland is 22.58 per 100,000 population this year (2017/18). Low activity is 22.6 to <26.6, moderate activity 26.6 to <85.1, high activity 85.1 to <142.4 and very high activity is >142.4. Influenza Weekly Surveillance Bulletin Northern Ireland, Week 5 (29 th January – 04 th February 2018)
Transcript of Influenza Weekly Surveillance Bulletin Bulletin Week 5... · 4 Figure 3. Northern Ireland GP...
1
Summary
In week 5, the surveillance data continues to indicate moderate seasonal flu activity, with most indicators
showing a continued decrease in flu activity from week 4. GP consultation rates continued to decrease
however, there was an increase in OOH consultations in week 5 (week commencing 29th January 2018).
Total detections of influenza virus fell in week 5.
Northern Ireland Primary Care Consultation Rates
GP consultation rates for combined flu and flu-like illness (flu/FLI) decreased from 44.2 per 100,000
population in week 4, 2018 to 29.0 per 100,000 population in week 5. Rates are continuing to decrease
but remain above the Moving Epidemic Method (MEM) threshold for moderate level flu activity1.
OOH GP consultation rates for flu/FLI increased from 9.7 per 100,000 population in week 4, 2018 to
17.0 per 100,000 population in week 5.
Microbiological Surveillance (Flu and RSV)
The proportion of all positive influenza specimens fell slightly from 39% in week 4, 2018 to 37% in
week 5.
RSV remained the same in week 5 at 2%.
Secondary Care (Hospital both non-ICU and ICU)
The number of detections of influenza from hospital wards reported to PHA decreased from a total of
187 detections in week 4, 2018 to 162 in week 5.
There were four cases reported in ICU with laboratory confirmed influenza in week 5 giving a total of
75 cases this season to date.
No deaths were reported in week 5 among ICU patients. The total deaths in ICU with confirmed
influenza to date is 12.
Influenza Outbreaks across Northern Ireland
There was one confirmed influenza outbreak reported to the PHA in week 5 bringing the total
confirmed Influenza outbreaks to date to 33.
Mortality
The proportion of deaths related to respiratory keywords (bronchiolitis, bronchitis, influenza and
pneumonia) increased slightly from 39% in week 4, 2018 to 40% in week 5.
1 The baseline MEM threshold for Northern Ireland is 22.58 per 100,000 population this year (2017/18). Low activity
is 22.6 to <26.6, moderate activity 26.6 to <85.1, high activity 85.1 to <142.4 and very high activity is >142.4.
Influenza Weekly Surveillance Bulletin
Northern Ireland, Week 5 (29th January – 04th February 2018)
2
Introduction
Influenza is an acute viral infection of the respiratory tract (nose, mouth, throat, bronchial tubes
and lungs). There are three types of flu virus: A, B and C, with A and B responsible for most
clinical illness. Influenza activity in Northern Ireland is monitored throughout the year to inform
public health action and to prevent spread of the infection. The influenza season typically runs
from week 40 to week 20. Week 40 for the 2017/18 season commenced on 2nd October 2017.
Surveillance systems used to monitor influenza activity include:
Northern Ireland GP surveillance representing 98% of Northern Ireland population;
Sentinel flu-swabber GP practices representing 11.2% of the NI population, contributing to the
measurement of circulating influenza in the community
GP Out-of-Hours surveillance system representing the entire population;
Virological reports from the Regional Virus Laboratory (RVL);
Influenza outbreak report notification to PHA Duty Room;
Critical Care Network for Northern Ireland reports on patients in ICU/HDU with confirmed
influenza;
Mortality data from Northern Ireland Statistics and Research Agency (NISRA);
Excess mortality estimations are calculated using the EuroMOMO (Mortality Monitoring in
Europe) model based on raw death data supplied by NISRA
NB: Please note the change in the collection of Flu/FLI consultation data in 2017-18. Data
will now be collected from 325 GP practices, representing 98% of the Northern Ireland (NI)
population. This represents a change from previous seasons when data was collected
from 37 sentinel GP practices (representing 11.7% of the NI population).
As a result, Flu/FLI consultation rates and the MEM threshold in 2017-18 will be generally
lower than in previous years. Please take this into account when interpreting the figures
in this season’s bulletin.
3
Northern Ireland GP Consultation Data
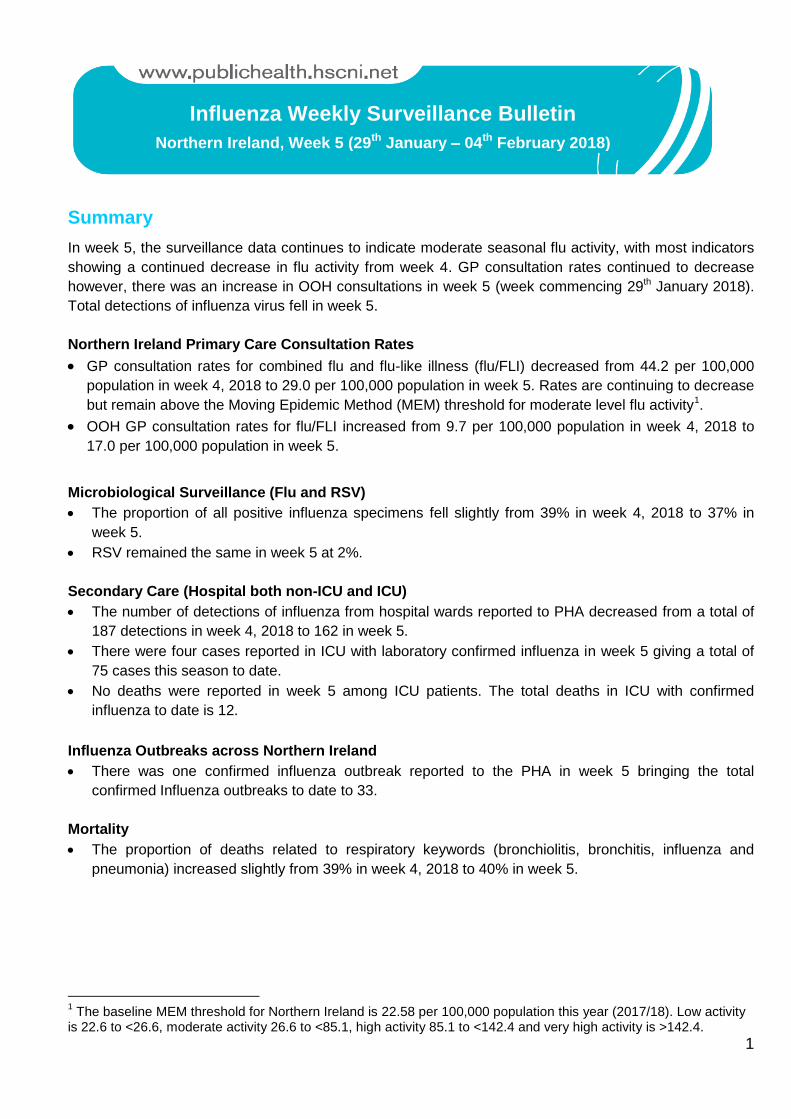
Figure 1. Northern Ireland GP consultation rates for flu/FLI 2015/16 - 2017/18
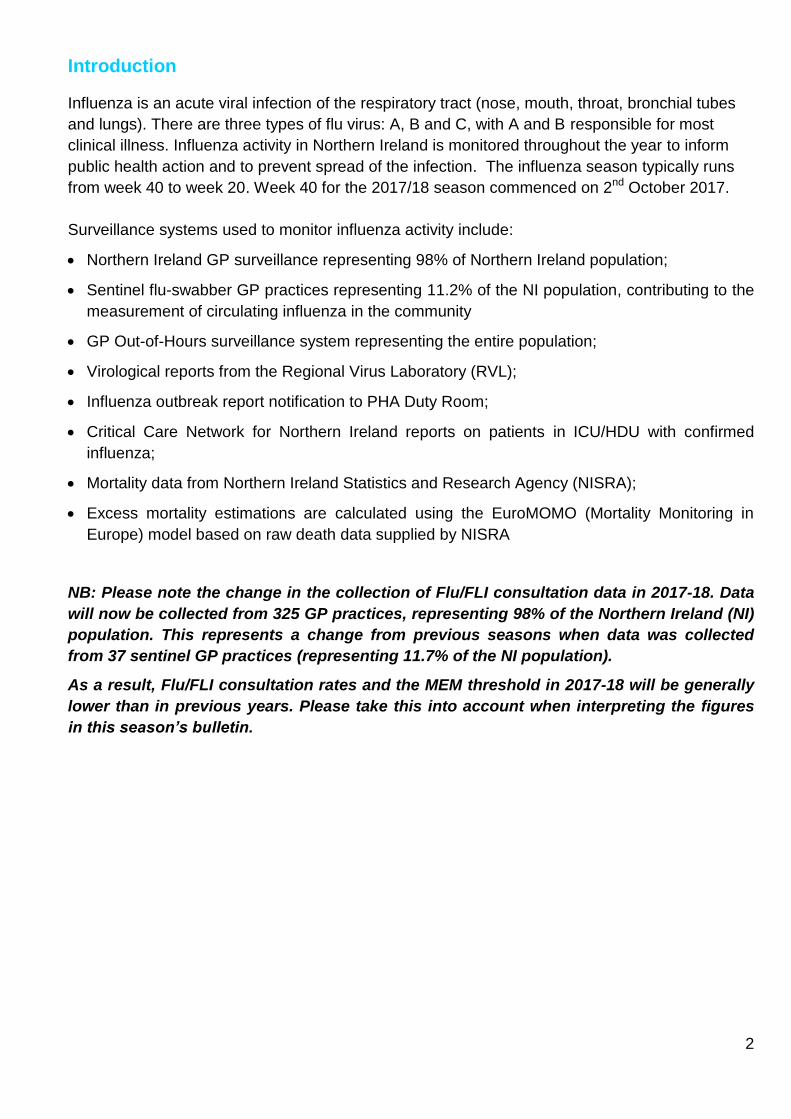
Figure 2. Northern Ireland GP consultation rates for flu/FLI and number of influenza
positive detections 2012/13 – 2017/18

4
Figure 3. Northern Ireland GP consultation rates for flu/FLI and number of virology 'flu’
detections from week 40, 2016
Comment
NI GP consultation rates decreased from 44.2 per 100,000 population in week 4, 2018 to 29.0
per 100,000 population in week 5, and activity remains just above moderate intensity (between
26.6 to <85.1 per 100,000 population) levels. The NI GP consultation rate in week 5 remains
higher than rates for similar periods in the last number of years (Figure 1).
The number of positive influenza laboratory detections decreased from 264 in week 4, 2018 to
194 in week 5. At this point in the season there have been a total of 965 detections of influenza
A(H3), 681 of influenza B, 362 of influenza A (typing awaited), and 19 detections of influenza
A(H1N1) 2009 (Figures 1, 2 and 3).
Further information about laboratory detections of influenza is detailed on page 8.
5
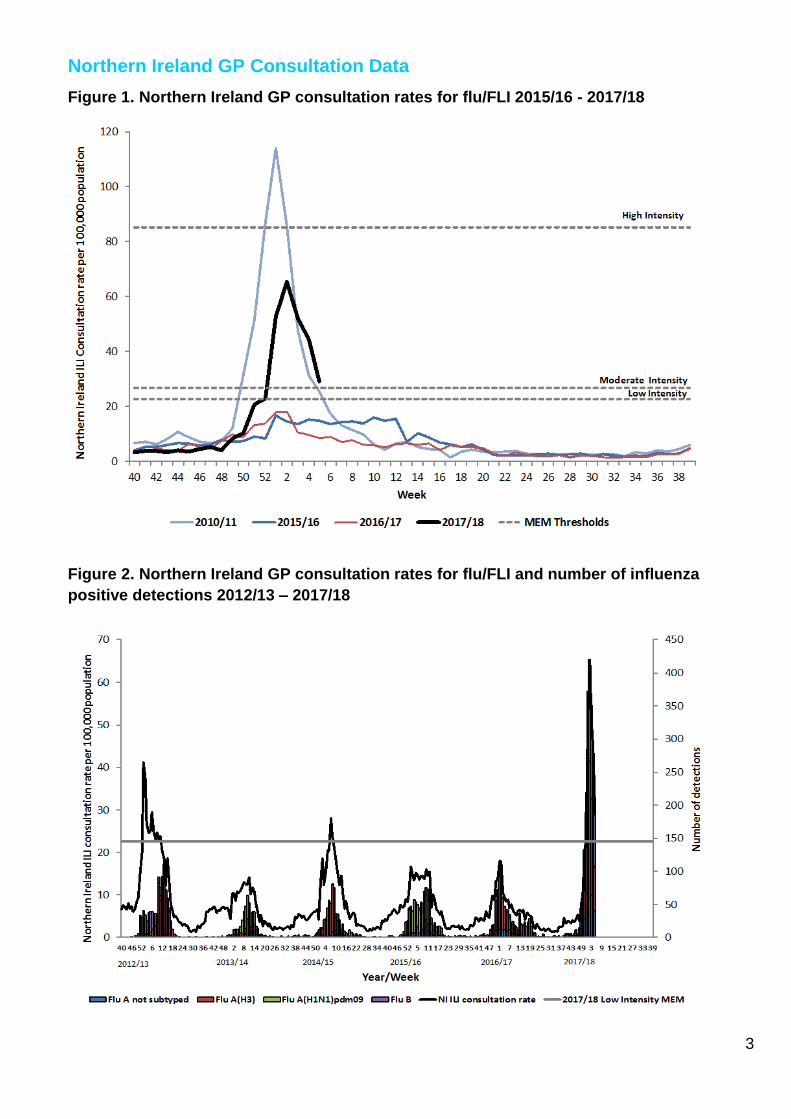
Figure 4. Northern Ireland GP age-specific consultation rates for flu/FLI from week 40,
2016
Comment
NI GP age-specific consultation rates have decreased in all age-groups in week 5, 2018.
Consultation rates were highest in those aged 45-64 years at 39.6 per 100,000 population and
lowest in those aged 0-4 years at 2.9 per 100,000 population. Consultation rates in those aged
5-14 years that were showing an increase in previous weeks have also decreased from 30.6 in
week 4 to 14.9 per 100,000 population in week 5, 2018 (Figure 4).
6
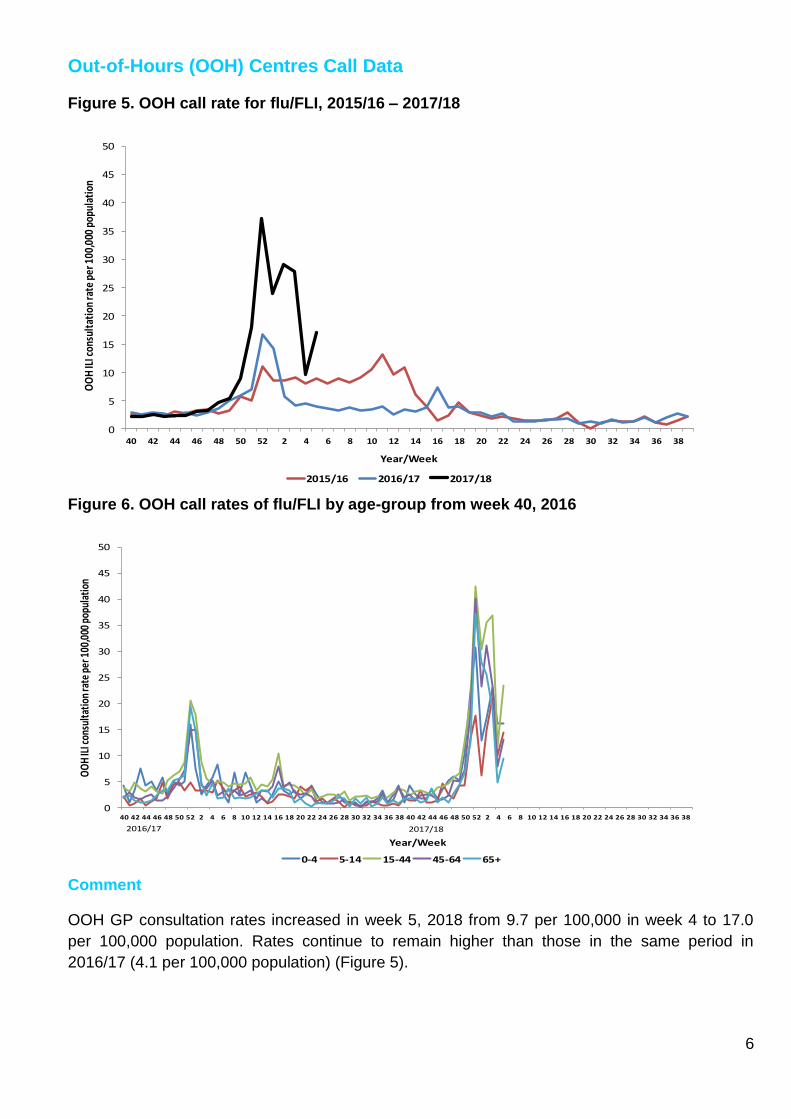
Out-of-Hours (OOH) Centres Call Data
Figure 5. OOH call rate for flu/FLI, 2015/16 – 2017/18
0
5
10
15
20
25
30
35
40
45
50
40 42 44 46 48 50 52 2 4 6 8 10 12 14 16 18 20 22 24 26 28 30 32 34 36 38
OO
H IL
I con
sult
atio
n ra
te p
er 1
00,0
00 p
opul
atio
n
Year/Week
2015/16 2016/17 2017/18
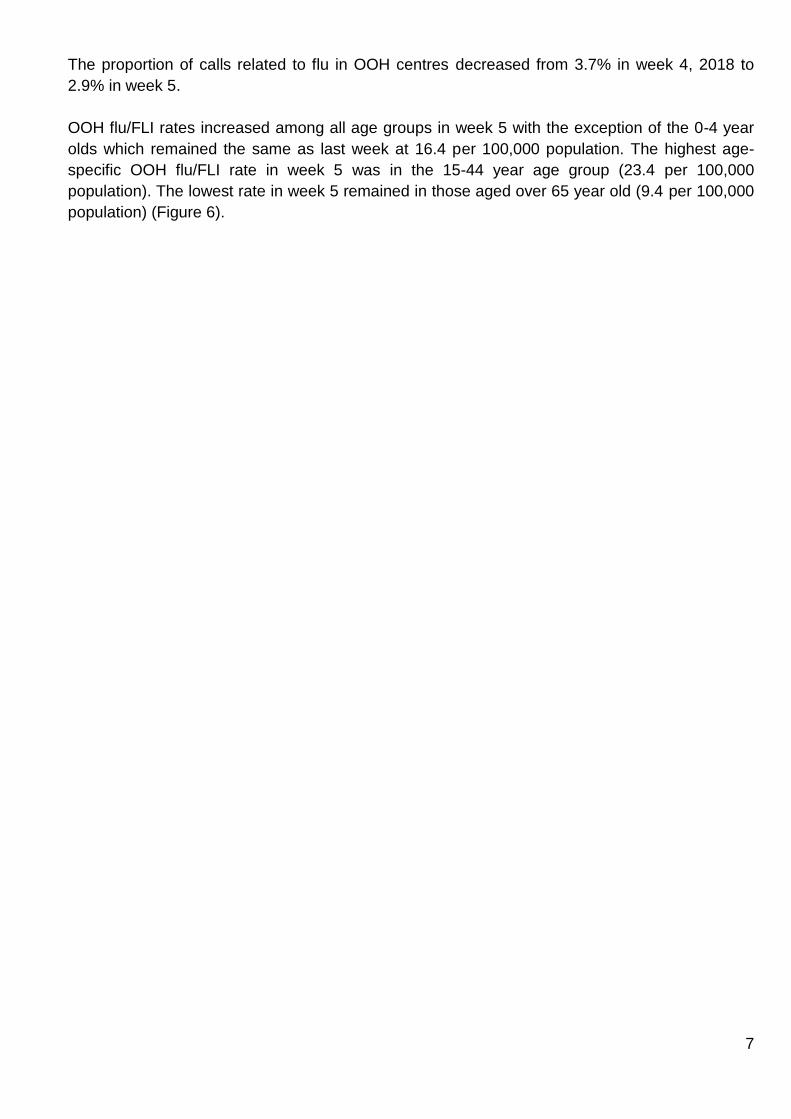
Figure 6. OOH call rates of flu/FLI by age-group from week 40, 2016
0
5
10
15
20
25
30
35
40
45
50
40 42 44 46 48 50 52 2 4 6 8 10 12 14 16 18 20 22 24 26 28 30 32 34 36 38 40 42 44 46 48 50 52 2 4 6 8 10 12 14 16 18 20 22 24 26 28 30 32 34 36 38
OO
H IL
I con
sult
atio
n ra
te p
er 1
00,0
00 p
opul
atio
n
Year/Week
0-4 5-14 15-44 45-64 65+
2016/17 2017/18
Comment
OOH GP consultation rates increased in week 5, 2018 from 9.7 per 100,000 in week 4 to 17.0
per 100,000 population. Rates continue to remain higher than those in the same period in
2016/17 (4.1 per 100,000 population) (Figure 5).
7
The proportion of calls related to flu in OOH centres decreased from 3.7% in week 4, 2018 to
2.9% in week 5.
OOH flu/FLI rates increased among all age groups in week 5 with the exception of the 0-4 year
olds which remained the same as last week at 16.4 per 100,000 population. The highest age-
specific OOH flu/FLI rate in week 5 was in the 15-44 year age group (23.4 per 100,000
population). The lowest rate in week 5 remained in those aged over 65 year old (9.4 per 100,000
population) (Figure 6).
8
Virology Data
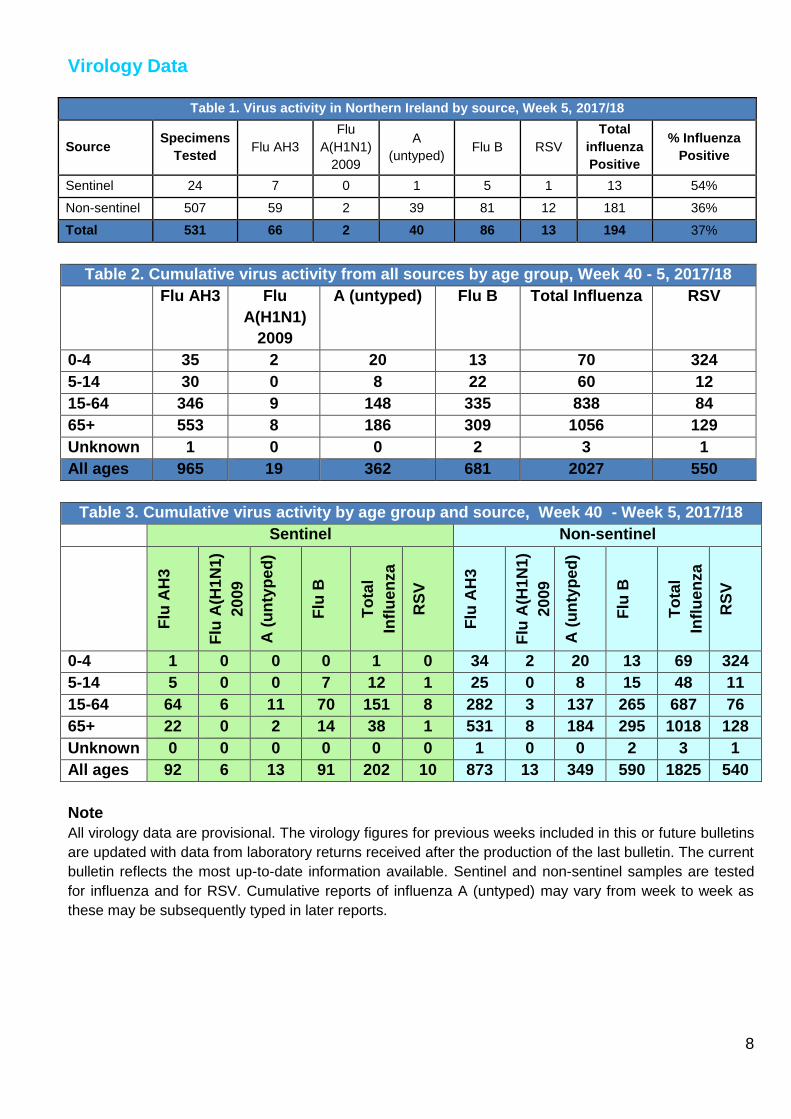
Table 1. Virus activity in Northern Ireland by source, Week 5, 2017/18
Source Specimens
Tested Flu AH3
Flu
A(H1N1)
2009
A
(untyped) Flu B RSV
Total
influenza
Positive
% Influenza
Positive
Sentinel 24 7 0 1 5 1 13 54%
Non-sentinel 507 59 2 39 81 12 181 36%
Total 531 66 2 40 86 13 194 37%
Table 2. Cumulative virus activity from all sources by age group, Week 40 - 5, 2017/18
Flu AH3 Flu
A(H1N1)
2009
A (untyped) Flu B Total Influenza RSV
0-4 35 2 20 13 70 324
5-14 30 0 8 22 60 12
15-64 346 9 148 335 838 84
65+ 553 8 186 309 1056 129
Unknown 1 0 0 2 3 1
All ages 965 19 362 681 2027 550
Table 3. Cumulative virus activity by age group and source, Week 40 - Week 5, 2017/18
Sentinel Non-sentinel
Flu
AH
3
Flu
A(H
1N
1)
20
09
A (
un
typ
ed
)
Flu
B
To
tal
Infl
ue
nza
RS
V
Flu
AH
3
Flu
A(H
1N
1)
20
09
A (
un
typ
ed
)
Flu
B
To
tal
Infl
ue
nza
RS
V
0-4 1 0 0 0 1 0 34 2 20 13 69 324
5-14 5 0 0 7 12 1 25 0 8 15 48 11
15-64 64 6 11 70 151 8 282 3 137 265 687 76
65+ 22 0 2 14 38 1 531 8 184 295 1018 128
Unknown 0 0 0 0 0 0 1 0 0 2 3 1
All ages 92 6 13 91 202 10 873 13 349 590 1825 540
Note
All virology data are provisional. The virology figures for previous weeks included in this or future bulletins
are updated with data from laboratory returns received after the production of the last bulletin. The current
bulletin reflects the most up-to-date information available. Sentinel and non-sentinel samples are tested
for influenza and for RSV. Cumulative reports of influenza A (untyped) may vary from week to week as
these may be subsequently typed in later reports.
9
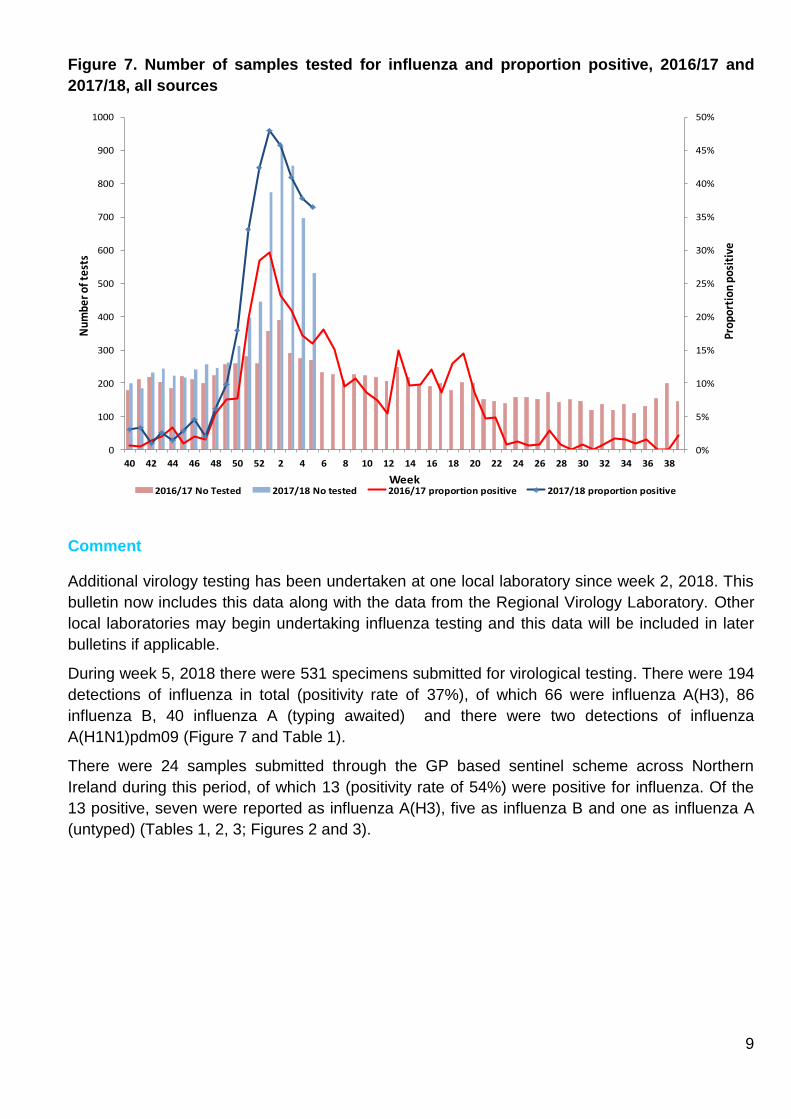
Figure 7. Number of samples tested for influenza and proportion positive, 2016/17 and
2017/18, all sources
0%
5%
10%
15%
20%
25%
30%
35%
40%
45%
50%
0
100
200
300
400
500
600
700
800
900
1000
40 42 44 46 48 50 52 2 4 6 8 10 12 14 16 18 20 22 24 26 28 30 32 34 36 38
Prop
orti
on p
osit
ive
Num
ber o
f tes
ts
Week2016/17 No Tested 2017/18 No tested 2016/17 proportion positive 2017/18 proportion positive
Comment
Additional virology testing has been undertaken at one local laboratory since week 2, 2018. This
bulletin now includes this data along with the data from the Regional Virology Laboratory. Other
local laboratories may begin undertaking influenza testing and this data will be included in later
bulletins if applicable.
During week 5, 2018 there were 531 specimens submitted for virological testing. There were 194
detections of influenza in total (positivity rate of 37%), of which 66 were influenza A(H3), 86
influenza B, 40 influenza A (typing awaited) and there were two detections of influenza
A(H1N1)pdm09 (Figure 7 and Table 1).
There were 24 samples submitted through the GP based sentinel scheme across Northern
Ireland during this period, of which 13 (positivity rate of 54%) were positive for influenza. Of the
13 positive, seven were reported as influenza A(H3), five as influenza B and one as influenza A
(untyped) (Tables 1, 2, 3; Figures 2 and 3).
10
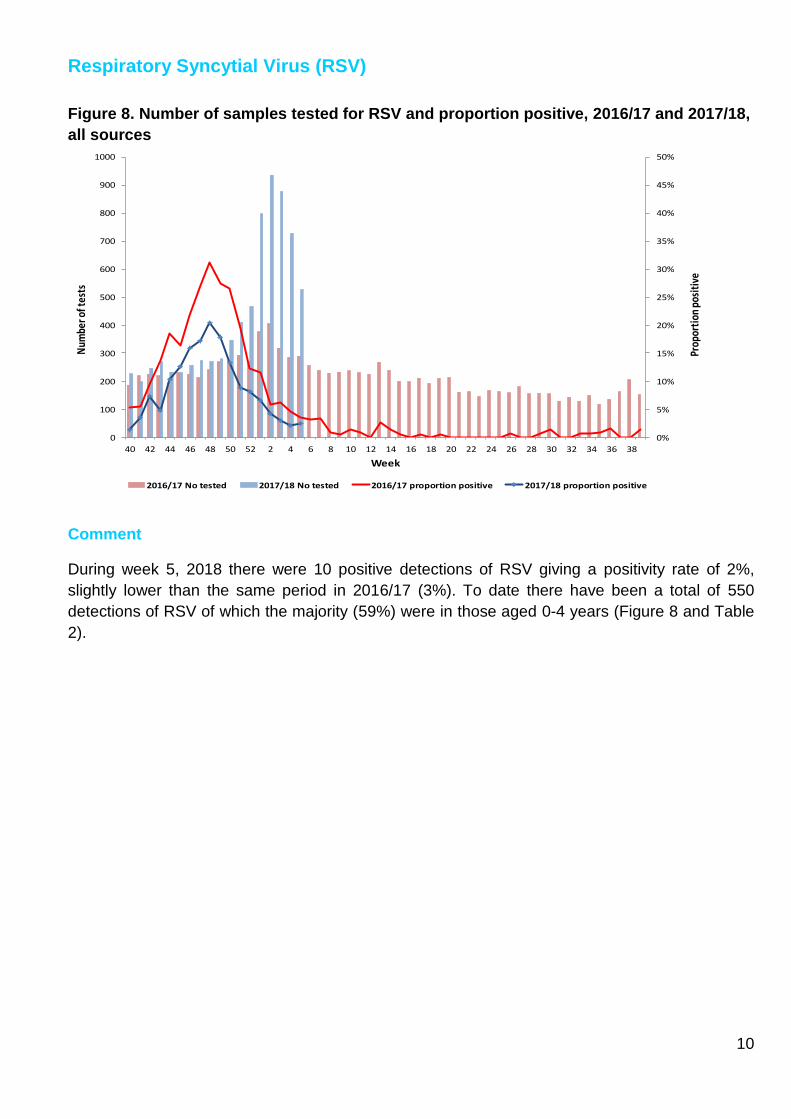
Respiratory Syncytial Virus (RSV)
Figure 8. Number of samples tested for RSV and proportion positive, 2016/17 and 2017/18,
all sources
0%
5%
10%
15%
20%
25%
30%
35%
40%
45%
50%
0
100
200
300
400
500
600
700
800
900
1000
40 42 44 46 48 50 52 2 4 6 8 10 12 14 16 18 20 22 24 26 28 30 32 34 36 38
Prop
orti
on p
osit
ive
Num
ber o
f tes
ts
Week
2016/17 No tested 2017/18 No tested 2016/17 proportion positive 2017/18 proportion positive
Comment
During week 5, 2018 there were 10 positive detections of RSV giving a positivity rate of 2%,
slightly lower than the same period in 2016/17 (3%). To date there have been a total of 550
detections of RSV of which the majority (59%) were in those aged 0-4 years (Figure 8 and Table
2).
11
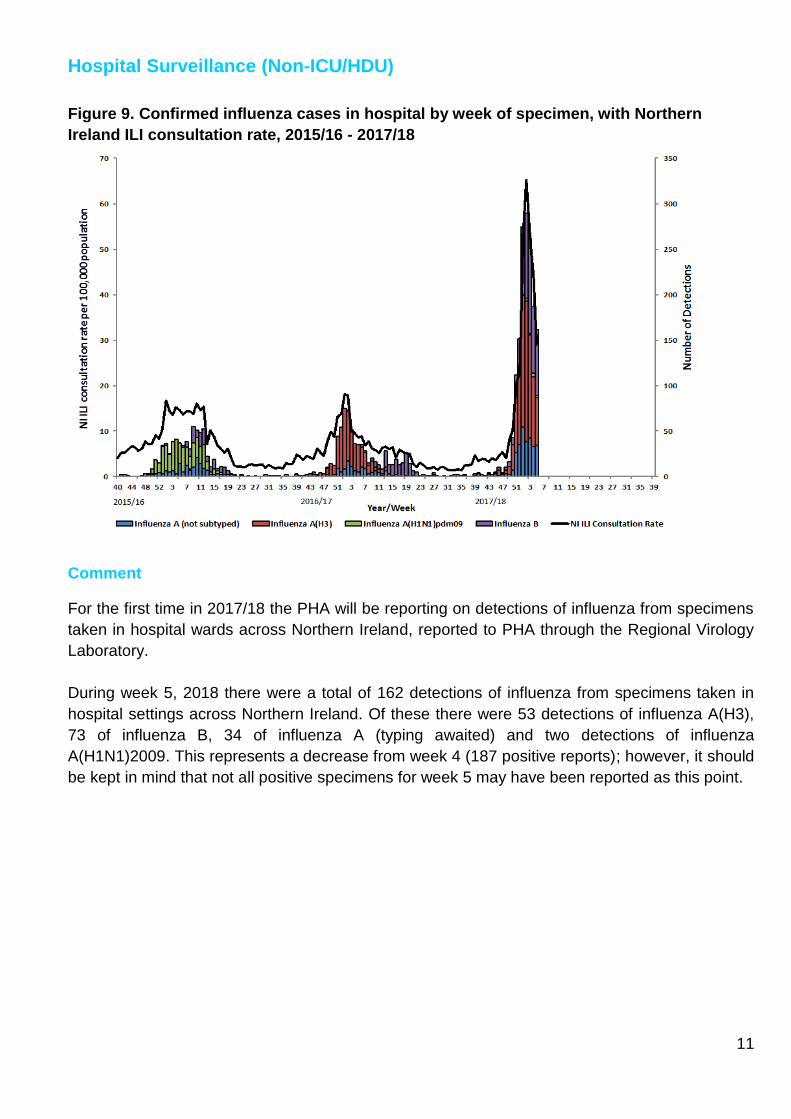
Hospital Surveillance (Non-ICU/HDU)
Figure 9. Confirmed influenza cases in hospital by week of specimen, with Northern
Ireland ILI consultation rate, 2015/16 - 2017/18
Comment
For the first time in 2017/18 the PHA will be reporting on detections of influenza from specimens
taken in hospital wards across Northern Ireland, reported to PHA through the Regional Virology
Laboratory.
During week 5, 2018 there were a total of 162 detections of influenza from specimens taken in
hospital settings across Northern Ireland. Of these there were 53 detections of influenza A(H3),
73 of influenza B, 34 of influenza A (typing awaited) and two detections of influenza
A(H1N1)2009. This represents a decrease from week 4 (187 positive reports); however, it should
be kept in mind that not all positive specimens for week 5 may have been reported as this point.
12
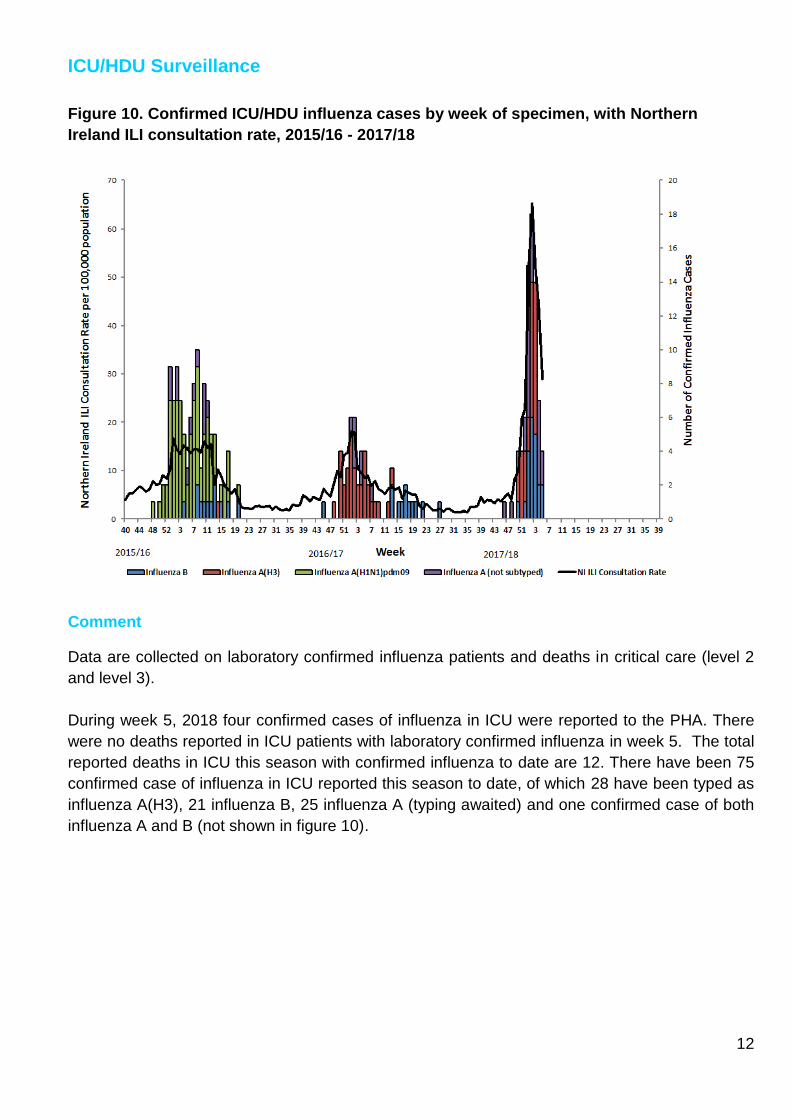
ICU/HDU Surveillance
Figure 10. Confirmed ICU/HDU influenza cases by week of specimen, with Northern
Ireland ILI consultation rate, 2015/16 - 2017/18
Comment
Data are collected on laboratory confirmed influenza patients and deaths in critical care (level 2
and level 3).
During week 5, 2018 four confirmed cases of influenza in ICU were reported to the PHA. There
were no deaths reported in ICU patients with laboratory confirmed influenza in week 5. The total
reported deaths in ICU this season with confirmed influenza to date are 12. There have been 75
confirmed case of influenza in ICU reported this season to date, of which 28 have been typed as
influenza A(H3), 21 influenza B, 25 influenza A (typing awaited) and one confirmed case of both
influenza A and B (not shown in figure 10).

13
Outbreak Surveillance
During week 5, 2018 there was one confirmed influenza outbreak in a care home reported to the
PHA. The total confirmed Influenza outbreaks to date are 33.
Mortality Data
Weekly mortality data is provided from Northern Ireland Statistics and Research Agency
(NISRA). The data relates to the number of deaths from selected respiratory infections (some of
which may be attributable to influenza, and other respiratory infections or complications thereof)
registered each week in Northern Ireland. This is not necessarily the same as the number of
deaths occurring in that period. Searches of the medical certificates of the cause of death are
performed using a number of keywords that could be associated with influenza (bronchiolitis,
bronchitis, influenza and pneumonia). Death registrations containing these keywords are
presented as a proportion of all registered deaths.
Figure 11. Weekly registered deaths
Comment
During week 5, 2018 the proportion of deaths related to respiratory keywords increased slightly
from 39% in week 4 to 40%. In week 5 there were 433 registered deaths, of which 173 related to
specific respiratory infections (Figure 11). The proportion of deaths attributed to specific
respiratory infections is higher at this point in the season (40%) to the same period in 2016/17
(34%) and in 2015/16 (28%).

14
EuroMOMO
Information on mortality from all causes is provided for management purpose from Public Health
England. Excess mortality is defined as a statistically significant increase in the number of deaths
reported over the expected number for a given point in time. This calculation allows for a weekly
variation in the number of deaths registered and takes account of deaths registered
retrospectively. Information is used to provide an early warning to the health service of any
seasonal increases in mortality to allow further investigation of excess detections.
There is no single cause of ‘additional’ deaths in the winter months but they are often attributed
in part to cold weather (e.g. directly from falls, fractures, road traffic accidents), through
worsening of chronic medical conditions e.g. heart and respiratory complaints and through
respiratory infections including influenza.
For more information on EuroMOMO and interactive maps of reporting across the season please
see http://www.euromomo.eu/index.html.
There was an excess all-cause mortality reported in Northern Ireland in week 5, 2018. Including
this week, there has been a total of eight weeks in the season to date where there has been
excess all-cause mortality (weeks 49-4, with the exception of week 50). This excess mortality
was seen in the elderly (>65 years of age).
Please note this data is provisional due to the time delay in registration; numbers may vary from
week to week.
Influenza Vaccine Uptake
2017/18 (to Jan 30th) 2016/17 (to Jan 30th)
>65 years 68.5% 69.0% <65 years at risk 50.4% 51.6% Pregnant women 45.6% 45.9% 2 to 4 year olds 46.8% 49.4%
Primary School 75.8% 77.7%
Trust Frontline 31.6% 28.4% *vaccine uptake data is provisional
International Summary
Europe
Week 4/2018 (22–28 January 2018)
Influenza activity was widespread in the majority of reporting countries and while activity
was increasing, intensity in most countries was reported as low to medium.

15
Both influenza virus types A and B were co-circulating with a higher proportion of type B
viruses. Different proportions of circulating influenza virus types and A subtypes were
observed between countries in the Region.
Of the individuals sampled, on presenting with ILI or ARI to sentinel primary healthcare
sites, 51.9% tested positive for influenza viruses, within the range observed in the
previous 3 weeks (42–52%).
2017/18 season overview
For the Region overall, a higher proportion of type B compared to type A viruses has been
detected in sentinel sources, whereas in non-sentinel sources the proportions are roughly
similar. Of the type A detections from sentinel sources, A(H1N1)pdm09 viruses have
outnumbered A(H3N2) viruses, while in non-sentinel sources more A(H3N2) viruses were
reported than A(H1N1)pdm09 viruses.
For type B viruses from both sentinel and non-sentinel sources, B/Yamagata lineage
viruses have greatly outnumbered those of the B/Victoria lineage. No B/Yamagata lineage
virus is included in the current trivalent seasonal influenza vaccine.
Different patterns of dominant type and A subtype were observed across the countries in
the Region, which may be due to the relative weights of information being derived from
sentinel, non-sentinel and severe influenza case sources of information.
The majority of severe cases are in adults infected by influenza A(H1N1)pdm09 or type B
virus.
While low in number, 58% of the genetically characterized A(H3N2) viruses belonged to
clade 3C.2a, the clade of the vaccine virus described in the WHO recommendations for
vaccine composition for the northern hemisphere 2017–18, and 37% to subclade 3C.2a1,
with mammalian cell-cultured viruses in both clades being antigenically similar.
A situation analysis that describes the early season evolving epidemiological pattern was
published by WHO Regional Office for Europe in January. A high level of influenza B virus
circulation is observed during the first half of the season, compared to previous seasons.
An early risk assessment based on data from EU/EEA countries was published by ECDC
on 20 December 2017.
Interim or real-time vaccine effectiveness estimates from Canada, Stockholm County and
Finland suggest overall vaccine effectiveness of 17-31%, depending on proportion of
circulating (sub)types. Effectiveness against influenza B is in the range of 37-55%, despite
the circulating lineage not being included in the more commonly used trivalent vaccine.
Based on data submitted to the EuroMOMO project there has been over the past weeks
increased all-cause mortality among the elderly, notably in Southern Europe and the
United Kingdom (England and Scotland).
Additional information on global influenza activity is available from WHO’s biweekly global
updates.
Worldwide (WHO)
As at 05 February 2018, (based on update to 21 January 2018)
Influenza activity remained high in the temperate zone of the northern hemisphere while in the
temperate zone of the southern hemisphere activity was at inter-seasonal levels. Worldwide,
16
influenza A accounted still for the majority of influenza detections but influenza B (mostly from
the Yamagata lineage) increased in recent weeks.
Up to now, the majority of countries which are in the influenza season, reported influenza like
illness reaching moderate levels in comparison with previous years, with few reaching levels
exceeding those of previous years. Some countries however have reported levels of
hospitalization and ICU admissions reaching or exceeding peak levels of previous influenza
seasons. WHO recommends countries with current influenza activity or entering their season to
adopt necessary measures for ensuring appropriate case management, compliance with
infection control measures and seasonal influenza vaccination for high risk groups(see also the
fact sheet given below).
In North America, overall influenza activity remained high, with detections of
predominantly influenza A(H3N2) viruses.
In Europe, influenza activity remained high in Northern and Southwestern Europe, and
peaked in few countries but started to increase in Eastern Europe. Influenza B remained
the virus most frequently detected and the subtype of the influenza A viruses detected
varied depending on the country and the surveillance system.
In Western Asia, increasing influenza activity was reported in some countries, with
influenza A(H1N1)pdm09 and B viruses present in the region.
In Central Asia, influenza activity increased slightly, although it remained low across the
region.
In East Asia, high levels of illness indicators and influenza activity were reported in most of
the countries. Influenza A(H1N1)pdm09 and influenza B-Yamagata lineage viruses were
predominantly detected.
In South East Asia, low levels of influenza activity were reported.
In Southern Asia, influenza activity continued to be high in Iran and Pakistan, with
detection of all seasonal influenza subtypes.
In Northern Africa, influenza detections remained high in Algeria, Egypt and Morocco,
while decreased in Tunisia. Influenza A(H1N1)pdm09 virus and influenza B were
predominantly detected in the region.
In Western Africa, little to no influenza activity was reported across the region. In Middle
Africa, there were no updates available for this reporting period. In Eastern Africa,
increased influenza activity was reported in Madagascar.
In the Caribbean and Central American countries, respiratory illness indicators and
influenza activity remained low in general.
In the tropical countries of South America, influenza activity and respiratory illness
indicators were generally low, with exception of Ecuador.
In the temperate zone of the Southern Hemisphere, influenza activity remained overall at
inter-seasonal levels.
National Influenza Centres (NICs) and other national influenza laboratories from 101
countries, areas or territories reported data to FluNet for the time period from 08 January
2018 to 21 January 2018 (data as of 2018-02-01 18:02:14 UTC).The WHO GISRS
laboratories tested more than 277231 specimens during that time period. 88612 were
positive for influenza viruses, of which 53213 (60.1%) were typed as influenza A and
35399 (39.9%) as influenza B. Of the sub-typed influenza A viruses, 9745 (50.3%) were

17
influenza A(H1N1)pdm09 and 9642 (49.7%) were influenza A(H3N2). Of the characterized
B viruses, 7778 (90.8%) belonged to the B-Yamagata lineage and 786 (9.2%) to the B-
Victoria lineage.
http://www.who.int/influenza/surveillance_monitoring/updates/latest_update_GIP_surveillance/en
/index.html
http://www.cdc.gov/flu/weekly/
Acknowledgments
We would like to extend our thanks to all those who assist us in the surveillance of influenza in
particular the sentinel GPs, Out-of-Hours Centres, Apollo Medical, Regional Virus Laboratory,
Critical Care Network for Northern Ireland and Public Health England. Their work is greatly
appreciated and their support vital in the production of this bulletin.
The author also acknowledges the Northern Ireland Statistics and Research Agency (NISRA)
and the General Register Office Northern Ireland (GRONI) for the supply of data used in this
publication. NISRA and GRONI do not accept responsibility for any alteration or manipulation of
data once it has been provided.
Further information
Further information on influenza is available at the following websites:
http://www.fluawareni.info
https://www.gov.uk/government/organisations/public-health-england
http://www.publichealth.hscni.net
http://www.who.int
http://ecdc.europa.eu
http://www.flunewseurope.org/
Internet-based surveillance of influenza in the general population is undertaken through the
FluSurvey. A project run jointly by PHE and the London School of Hygiene and Tropical
Medicine. If you would like to become a participant of the FluSurvey project please do so by
visiting the Flusurvey website for more information.
Detailed influenza weekly reports can be found at the following websites:
Republic of Ireland:
http://www.hpsc.ie/hpsc/A-
Z/Respiratory/Influenza/SeasonalInfluenza/Surveillance/InfluenzaSurveillanceReports/

18
England:
https://www.gov.uk/government/statistics/weekly-national-flu-reports
Scotland
http://www.hps.scot.nhs.uk/resp/seasonalInfluenza.aspx
Wales
http://www.wales.nhs.uk/sites3/page.cfm?orgid=457&pid=34338
For further information on the Enhanced Surveillance of Influenza in Northern Ireland scheme or
to be added to the circulation list for this bulletin please contact:
Dr Cathriona Kearns Dr Muhammad Sartaj
Epidemiological Scientist Public Health Consultant
Public Health Agency Public Health Agency
Email: [email protected]
This report was compiled by Dr Cathriona Kearns, Mr Paul Cabrey, Dr Mark O’Doherty and
Dr Muhammad Sartaj.